Census 2000 showed that the United States population on April 1, 2000 was 281.4 mil- lion. Of the total, 36.4 million, or 12.9 percent, reported 1 Black or African American. This number includes 34.7 million people, or 12.3 percent, who reported only Black in addition to 1.8 mil- lion people, or 0.6 per- cent, who reported Black as well as one or more other races. The term Black is used in the text of this report to refer to the Black or African American popu- lation, while Black or African American is used in the text tables and graphs. Census 2000 asked separate questions on race and Hispanic or Latino origin. Hispanics who reported their race as Black, either alone or in combination with one or more other races, are includ- ed in the numbers for Blacks. This report, part of a series that analyzes population and housing data collected from Census 2000, provides a portrait of the Black population in the United States and discusses its distribution at both the national and subnational levels. It is based on the Census 2000 Redistricting Data (Public Law 94-171) Summary File, which was among the first Census 2000 data products to be released and is used by each state to draw boundaries for legisla- tive districts. 2 The term “Black or African American” refers to people having origins in any of the Black race groups of Africa. It includes people who reported “Black, African Am., or Negro” or wrote in entries such as African American, Afro American, Nigerian, or Haitian. Data on race has been collected since the first U.S. decennial census in 1790. U S C E N S U S B U R E A U Helping You Make Informed Decisions U.S. Department of Commerce Economics and Statistics Administration U.S. CENSUS BUREAU Issued August 2001 C2KBR/01-5 The Black Population: 2000 Census 2000 Brief By Jesse McKinnon Figure 1. Reproduction of the Question on Race From Census 2000 Source: U.S. Census Bureau, Census 2000 questionnaire. What is this person's race? Mark one or more races to indicate what this person considers himself/herself to be. 6. White Black, African Am., or Negro American Indian or Alaska Native — Print name of enrolled or principal tribe. Some other race — Print race. Japanese Korean Vietnamese Native Hawaiian Guamanian or Chamorro Samoan Other Pacific Islander — Print race. Asian Indian Chinese Filipino Other Asian — Print race. ✗ 1 In this report, the term “reported” is used to refer to the answers provided by respondents, as well as responses assigned during the editing and imputation processes. 2 This report discusses data for 50 states and the District of Columbia, but not Puerto Rico. The Census 2000 Redistricting Data (Public Law 94-171) Summary File was released on a state-by-state basis in March 2001.
Transcript
Census 2000 showedthat the United Statespopulation on April 1,2000 was 281.4 mil-lion. Of the total, 36.4 million, or 12.9 percent, reported1
Black or AfricanAmerican. This numberincludes 34.7 millionpeople, or 12.3 percent,who reported only Blackin addition to 1.8 mil-lion people, or 0.6 per-cent, who reportedBlack as well as one ormore other races. Theterm Black is used inthe text of this report torefer to the Black orAfrican American popu-lation, while Black orAfrican American is used in the text tablesand graphs. Census 2000 asked separatequestions on race and Hispanic or Latinoorigin. Hispanics who reported their raceas Black, either alone or in combinationwith one or more other races, are includ-ed in the numbers for Blacks.
This report, part of a series that analyzespopulation and housing data collectedfrom Census 2000, provides a portrait ofthe Black population in the United Statesand discusses its distribution at both thenational and subnational levels. It is basedon the Census 2000 Redistricting Data
(Public Law 94-171) Summary File, whichwas among the first Census 2000 dataproducts to be released and is used byeach state to draw boundaries for legisla-tive districts.2
The term “Black or African American”refers to people having origins in any ofthe Black race groups of Africa. It includespeople who reported “Black, African Am.,or Negro” or wrote in entries such asAfrican American, Afro American,Nigerian, or Haitian.
Data on race has been collected since thefirst U.S. decennial census in 1790.
U S C E N S U S B U R E A UHelping You Make Informed Decisions
U.S.Department of CommerceEconomics and Statistics Administration
U.S. CENSUS BUREAU
Issued August 2001
C2KBR/01-5
The Black Population: 2000Census 2000 Brief
By Jesse McKinnonFigure 1.
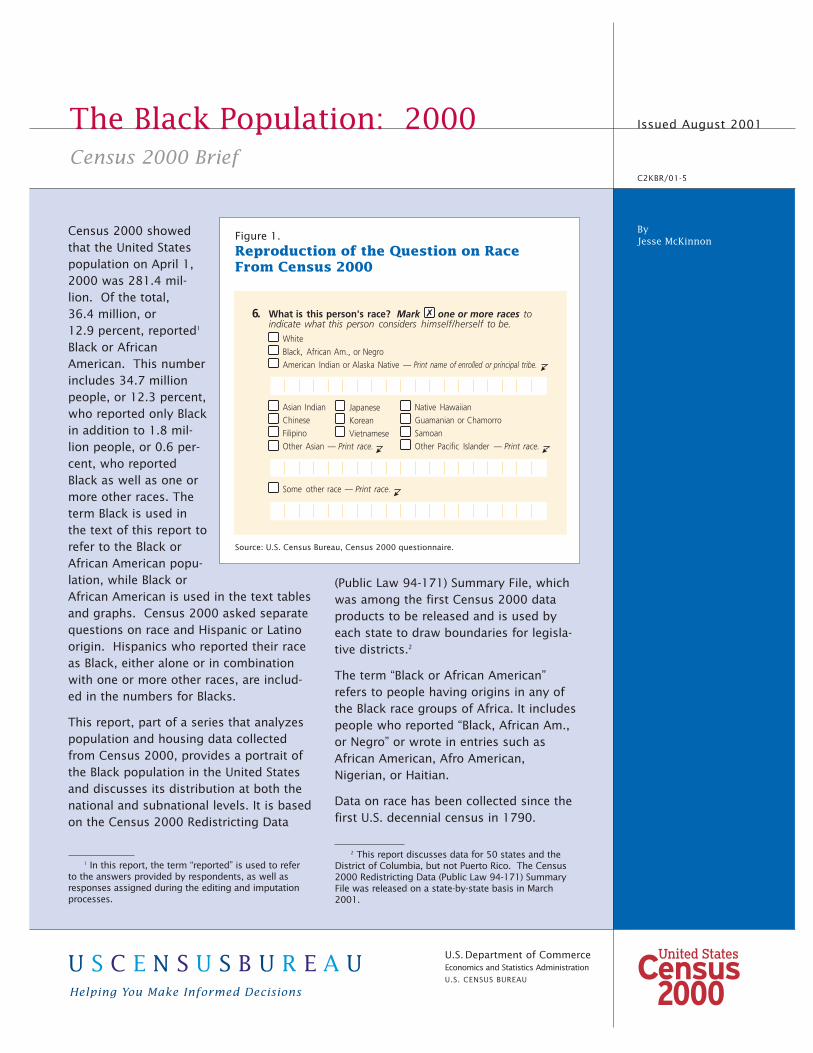
Reproduction of the Question on Race From Census 2000
Source: U.S. Census Bureau, Census 2000 questionnaire.
What is this person's race? Mark one or more races toindicate what this person considers himself/herself to be.
6.
WhiteBlack, African Am., or NegroAmerican Indian or Alaska Native — Print name of enrolled or principal tribe.
Some other race — Print race.
JapaneseKoreanVietnamese
Native HawaiianGuamanian or ChamorroSamoanOther Pacific Islander — Print race.
Asian IndianChineseFilipinoOther Asian — Print race.
✗
1 In this report, the term “reported” is used to referto the answers provided by respondents, as well asresponses assigned during the editing and imputationprocesses.
2 This report discusses data for 50 states and theDistrict of Columbia, but not Puerto Rico. The Census2000 Redistricting Data (Public Law 94-171) SummaryFile was released on a state-by-state basis in March2001.
2 U.S. Census Bureau
Blacks have been enumerated inevery census.
The question on race waschanged for Census 2000.
For Census 2000, the question onrace was asked of every individualliving in the United States andresponses reflect self-identification.Respondents were asked to reportthe race or races they consideredthemselves and other members oftheir households to be.
The question on race for Census2000 was different from the one forthe 1990 census in several ways.Most significantly, respondentswere given the option of selectingone or more race categories to indi-cate their racial identities.3
Because of these changes, theCensus 2000 data on race are notdirectly comparable with data fromthe 1990 census or earlier census-es. Caution must be used wheninterpreting changes in the racialcomposition of the United Statespopulation over time.
The Census 2000 question on raceincluded 15 separate response cate-gories and 3 areas where respon-dents could write in a more specificrace (see Figure 1). The responsecategories and write-in answerswere combined to create the fivestandard Office of Management andBudget race categories plus theCensus Bureau category of “Some
other race.” The six race categoriesinclude:
• White;
• Black or African American;
• American Indian and AlaskaNative;
• Asian;
• Native Hawaiian and OtherPacific Islander; and
• Some other race.
For a complete explanation of therace categories used in Census 2000,see the Census 2000 Brief, Overviewof Race and Hispanic Origin.4
The data collected by Census2000 on race can be dividedinto two broad categories: therace alone population and therace in combination population.
People who responded to the ques-tion on race by indicating only onerace are referred to as the racealone population, or the groupwho reported only one race. Forexample, respondents who markedonly the Black, African American,or Negro category on the censusquestionnaire would be included inthe Black alone population.
Individuals who chose more thanone of the six race categories arereferred to as the race in combina-tion population, or as the groupwho reported more than one race.For example, respondents whoreported they were “Black or AfricanAmerican and White” or “Black orAfrican American and Asian andAmerican Indian and Alaska Native”5
would be included in the Black incombination population.
The maximum number ofpeople reporting Black isreflected in the Black alone orin combination category.
One way to define the Black popula-tion is to combine those respon-dents who reported only Black withthose who reported Black as well asone or more other races. This cre-ates the Black alone or in combina-tion population. Another way tothink of the Black alone or in combi-nation population is the total num-ber of people who identified entire-ly or partially as Black. This groupis also described as people whoreported Black, whether or not theyreported any other races.
The Black population: a snapshot.
Table 1 shows the number and per-centage of respondents to Census2000 who reported Black alone aswell as those who reported Blackand at least one other race.
In the total population, 34.7 millionpeople, or 12.3 percent, reportedonly Black. An additional 1.8 millionpeople reported Black and at leastone other race. Within this group,the most common combinationswere “Black and White” (45 per-cent), followed by “Black and Someother race” (24 percent), “Black andAmerican Indian and Alaska Native”(10 percent), and “Black and Whiteand American Indian and AlaskaNative” (6 percent). These four com-bination categories accounted for85 percent of all Blacks who report-ed two or more races. Thus, 36.4 million, or 12.9 percent of thetotal population, reported Blackalone or in combination with one ormore other races.
3 Other changes included terminology andformatting changes, such as spelling out“American” instead of “Amer.” for the AmericanIndian and Alaska Native category and adding“Native” to the Hawaiian response category. Inthe layout of the Census 2000 questionnaire,the seven Asian response categories werealphabetized and grouped together, as were thefour Pacific Islander categories after the NativeHawaiian category. The three separate AmericanIndian and Alaska Native identifiers in the 1990census (i.e., Indian (Amer.), Eskimo, and Aleut)were combined into a single identifier inCensus 2000. Also, American Indians andAlaska Natives could report more than onetribe.
4 Overview of Race and Hispanic Origin:2000, U.S. Census Bureau, Census 2000 Brief,C2KBR/01-1, March 2001, is available on theU.S. Census Bureau’s Internet site at www.census.gov/population/www/cen2000/briefs.html.
5 The race in combination categories aredenoted by quotations around the combina-tions with the conjunction and in bold and itali-cized print to indicate the separate races thatcomprise the combination.
The Black populationincreased faster than the total population between 1990and 2000.
Because of the changes made to thequestion on race for Census 2000,there are at least two ways to pres-ent the change in the total numberof Blacks in the United States. Thedifference in the Black populationbetween 1990 and 2000 using the
race alone concept for 2000 andthe difference in the Black popula-tion between 1990 and 2000 usingthe race alone or in combinationconcept for 2000 provides a“minimum-maximum” range for thechange in the Black populationbetween 1990 and 2000.
The 1990 census showed there were30.0 million Blacks. Using the Black
alone population in 2000 shows anincrease of 4.7 million, or 15.6 per-cent, in the total Black populationbetween 1990 and 2000. If the Blackalone or in combination population isused, an increase of 6.4 million, or21.5 percent, results. Thus, from1990 to 2000, the minimum-maximum range for the increase inthe Black population was 15.6 per-cent to 21.5 percent. In comparison,the total population grew by 13.2 percent, from 248.7 million in1990 to 281.4 million in 2000.
THE GEOGRAPHICDISTRIBUTION OF THEBLACK POPULATION
The following discussion of thegeographic distribution of the Blackpopulation focuses on the Blackalone or in combination population.As the upper bound of the Blackpopulation, this group includes allrespondents who reported Black,whether or not they reported anyother race.6 Hereafter in the text ofthis section, the term “Black” will beused to refer to those who reportedBlack, whether or not they reportedany other race. However, in thetables and graphs, data for both theBlack alone and the Black alone orin combination populations areshown.
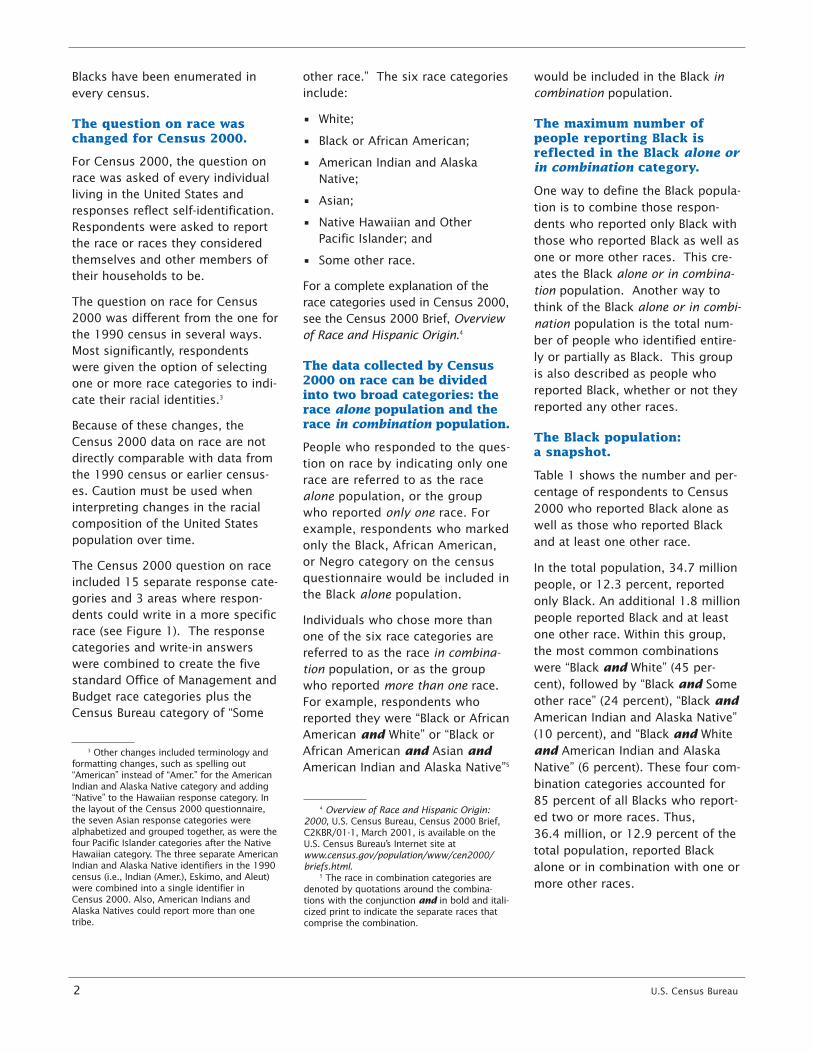
The majority of the Blackpopulation lived in the South.
According to Census 2000, of allrespondents who reported Black,54 percent lived in the South (seeFigure 2), 19 percent lived in theMidwest, 18 percent lived in the
U.S. Census Bureau 3
Table 1.Black or African American Population: 2000(For information on confidentiality protection, nonsampling error, and definitions, seewww.census.gov/prod/cen2000/doc/pl94-171.pdf)
Race NumberPercent of total
population
Total population . . . . . . . . . . . . . . . . . . . . . . . . . . . . . . . . 281,421,906 100.0Black or African American alone or in combination withone or more other races. . . . . . . . . . . . . . . . . . . . . . . . . . . 36,419,434 12.9Black or African American alone . . . . . . . . . . . . . . . . . . . 34,658,190 12.3Black or African American in combination with oneor more other races . . . . . . . . . . . . . . . . . . . . . . . . . . . . 1,761,244 0.6Black or African American; White . . . . . . . . . . . . . . . . 784,764 0.3Black or African American; Some other race . . . . . . 417,249 0.1Black or African American; American Indian andAlaska Native . . . . . . . . . . . . . . . . . . . . . . . . . . . . . . . . 182,494 0.1
All other combinations including Black or AfricanAmerican . . . . . . . . . . . . . . . . . . . . . . . . . . . . . . . . . . . . 264,530 0.1
Not Black or African American alone or in combinationwith one or more other races . . . . . . . . . . . . . . . . . . . . . . 245,002,472 87.1
- Percentage rounds to 0.0.
Source: U.S. Census Bureau, Census 2000 Redistricting Data (Public Law 94-171)Summary File, Table PL1.
Figure 2.
Percent Distribution of the Black or African American Population by Region: 2000
Source: U.S. Census Bureau, Census 2000 Redistricting Data (Public Law 94-171) Summary File, Table PL1.
(For information on confidentiality protection, nonsampling error, and definitions, see www.census.gov/prod/cen2000/doc/pl94-171.pdf)
Black or AfricanAmerican alone
or in combination
Black or AfricanAmerican alone
Northeast WestSouthMidwest
18.0 18.8 53.6 9.6
17.6 18.8 54.8 8.9
6 As a matter of policy, the Census Bureaudoes not advocate the use of the alone or incombination population over the alone popula-tion. The use of the alone or in combinationpopulation in this section does not imply that itis a preferred method of presenting or analyz-ing data. It is only one of many ways that thedata on race from Census 2000 can be present-ed and discussed.
4 U.S. Census Bureau
Table 2.Black or African American Population for the United States, Regions, and States, and forPuerto Rico: 1990 and 2000(For information on confidentiality protection, nonsampling error, and definitions, see www.census.gov/prod/cen2000/doc/pl94-171.pdf)
Area
1990 2000
Totalpopulation
Black or AfricanAmerican population
Totalpopulation
Black or African Americanalone population
Black or African Americanalone or in combination
population
Black or AfricanAmerican incombination
population onlyas a percent ofBlack or AfricanAmerican alone
or in combinationpopulationNumber
Percent oftotal
population Number
Percent oftotal
population Number
Percent oftotal
population
United States . . . . 248,709,873 29,980,996 12.1 281,421,906 34,658,190 12.3 36,419,434 12.9 4.8
Source: U.S. Census Bureau, Census 2000 Redistricting Data (Public Law 94-171) Summary File, Table PL1; 1990 Census of Population, GeneralPopulation Characteristics (1990 CP-1).
Northeast, and 10 percent lived inthe West.7
The South had the largest Blackpopulation, as well as the highestproportion of Blacks in its total pop-ulation: 20 percent of all respon-dents in the South reported Blackcompared with 12 percent in theNortheast, 11 percent in theMidwest, and 6 percent in the West.
About three-fifths of allpeople who reported Blacklived in ten states.
The ten states with the largest Blackpopulations in 2000 were NewYork, California, Texas, Florida,Georgia, Illinois, North Carolina,Maryland, Michigan, and Louisiana(see Table 2). Combined, thesestates represented 58 percent of thetotal Black population, but only 49 percent of the total population.Five of these ten states had Blackpopulations greater than 2 million:New York (3.2 million); California,Texas, and Florida (about 2.5 mil-lion each); and Georgia (2.4 million).
In the South, ten states (Texas,Florida, Georgia, North Carolina,Maryland, Louisiana, Virginia, SouthCarolina, Alabama, and Mississippi)had Black populations over one mil-lion and, when combined, they rep-resented 47 percent of the Blackpopulation in the country.
In six states, Blacks representedover 25 percent of the total popula-tion, and all of them were located inthe South — Mississippi (37 per-cent); Louisiana (33 percent); SouthCarolina (30 percent); Georgia andMaryland (29 percent) each; andAlabama (26 percent). The Districtof Columbia, a state equivalent, hadthe highest proportion of Blackswith 61 percent.
In 13 states, Blacks represented lessthan 3 percent of the total popula-tion. Seven of those states werelocated in the West — Hawaii, NewMexico, Oregon, Utah, Wyoming,Idaho, and Montana; three in theMidwest — Iowa, South Dakota, andNorth Dakota; and three in theNortheast — New Hampshire, Maineand Vermont.
The Black population wasconcentrated in counties inthe South.
The Black population is still highlyconcentrated — 64 percent of allcounties (3,141 counties) in theUnited States had fewer than 6 per-cent Black, but in 96 counties,Blacks comprised 50 percent ormore of the total county population(see Figure 3). Ninety-five of thosecounties were located in the Southand were distributed across theCoastal and Lowland South in aloose arc. With the notable excep-tions of Baltimore city (a countyequivalent) and Prince George’sCounty, in Maryland, generallythese counties were nonmetropoli-tan. St. Louis City, Missouri in theMidwest was the only county equiv-alent outside the South whereBlacks exceeded 50 percent of thetotal population.
Concentrations of Blacks in theMidwest and West tended to beeither in counties located withinmetropolitan areas or in countiescontaining universities or militarybases or both. Metropolitan
concentrations tended to be in cen-tral counties containing older cen-tral cities.
Although Blacks were not as con-centrated in Midwestern counties,in some metropolitan counties, suchas around Chicago, Illinois; Gary,Indiana; and Detroit, Michigan,Blacks comprised a sizeable propor-tion of the population. In theNortheast, Blacks were concentratedin a band of counties extendingfrom Philadelphia, Pennsylvania toProvidence, Rhode Island and alongthe Hudson Valley northward fromNew York. Western counties withlarge concentrations of Blacks werelocated in Southern California, theSan Francisco and Sacramentoareas, around Denver and ColoradoSprings, and in the Seattle andTacoma area in Washington. ClarkCounty, Nevada (Las Vegas area)also stood out distinctly from sur-rounding counties in Nevada, Utah,and Arizona.
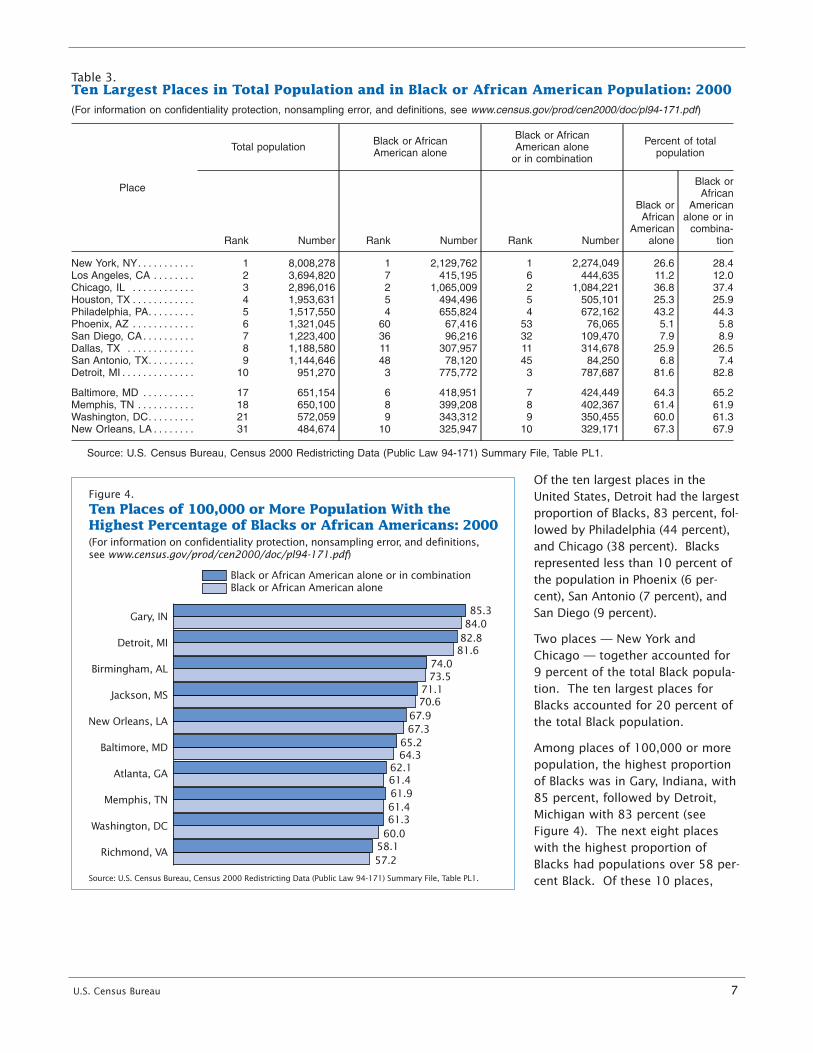
The places with the largestBlack populations were NewYork and Chicago.
Census 2000 showed that, of allplaces8 in the United States withpopulations of 100,000 or more,New York had the largest Blackpopulation with 2.3 million,followed by Chicago (1.1 million)as shown in Table 3. Three otherplaces — Detroit, Philadelphia, andHouston — had Black populationsbetween 500,000 and 1 million.Five of the ten places with thelargest Black population —Baltimore, Houston, Memphis,Washington, DC, and New Orleans— were in the South.
U.S. Census Bureau 5
8 Census 2000 showed 245 places in theUnited States with 100,000 or more popula-tion. They included 238 incorporated places(including four city-county consolidations)and seven census designated places thatwere not legally incorporated. For a list ofthese places by state, see www.census.gov/population/www/cen2000/phc-t6.html.
7 The South region includes the states ofAlabama, Arkansas, Delaware, Florida, Georgia,Kentucky, Louisiana, Maryland, Mississippi,North Carolina, Oklahoma, South Carolina,Tennessee, Texas, Virginia, and West Virginia,and the District of Columbia. The Midwestregion includes the states of Illinois, Indiana,Iowa, Kansas, Michigan, Minnesota, Missouri,Nebraska, North Dakota, Ohio, South Dakota,and Wisconsin. The Northeast region includesthe states of Connecticut, Maine,Massachusetts, New Hampshire, New Jersey,New York, Pennsylvania, Rhode Island, andVermont. The West region includes the states ofAlaska, Arizona, California, Colorado, Hawaii,Idaho, Montana, Nevada, New Mexico, Oregon,Utah, Washington, and Wyoming.
25.0 to 61.3
12.9 to 24.9
5.0 to 12.8
0.5 to 4.9
U.S. percent 12.9
Percent Black or African American Alone or In Combination: 2000
Source: U.S. Census Bureau, Census 2000 Redistricting Data (P.L. 94-171) Summary File. American FactFinder at factfinder.census.gov provides census data and mapping tools.
People indicatingone or more races including Black or African Americanas a percent of total population by state
People indicatingone or more races including Black or African American as a percent of total populationby county
50.0 to 86.7
25.0 to 49.9
12.9 to 24.9
5.0 to 12.8
0.0 to 4.9
U.S. percent 12.9
(For information on confidentiality protection, nonsampling error, and definitions, see www.census.gov/prod/cen2000/doc/pl94-171.pdf)
Figure 3.
0 100 Miles0 100 Miles0 100 Miles
0 100 Miles
6U
.S. Cen
sus Bu
reau
U.S. Census Bureau 7
Of the ten largest places in theUnited States, Detroit had the largestproportion of Blacks, 83 percent, fol-lowed by Philadelphia (44 percent),and Chicago (38 percent). Blacksrepresented less than 10 percent ofthe population in Phoenix (6 per-cent), San Antonio (7 percent), andSan Diego (9 percent).
Two places — New York andChicago — together accounted for 9 percent of the total Black popula-tion. The ten largest places forBlacks accounted for 20 percent ofthe total Black population.
Among places of 100,000 or morepopulation, the highest proportionof Blacks was in Gary, Indiana, with85 percent, followed by Detroit,Michigan with 83 percent (seeFigure 4). The next eight placeswith the highest proportion ofBlacks had populations over 58 per-cent Black. Of these 10 places,
Table 3.Ten Largest Places in Total Population and in Black or African American Population: 2000(For information on confidentiality protection, nonsampling error, and definitions, see www.census.gov/prod/cen2000/doc/pl94-171.pdf)
Source: U.S. Census Bureau, Census 2000 Redistricting Data (Public Law 94-171) Summary File, Table PL1.
Figure 4.
Ten Places of 100,000 or More Population With the Highest Percentage of Blacks or African Americans: 2000
Source: U.S. Census Bureau, Census 2000 Redistricting Data (Public Law 94-171) Summary File, Table PL1.
(For information on confidentiality protection, nonsampling error, and definitions, see www.census.gov/prod/cen2000/doc/pl94-171.pdf)
Black or African American alone or in combinationBlack or African American alone
Richmond, VA
Washington, DC
Memphis, TN
Atlanta, GA
Baltimore, MD
New Orleans, LA
Jackson, MS
Birmingham, AL
Detroit, MI
Gary, IN 85.3
82.8
74.0
71.1
67.9
65.2
62.1
61.9
61.3
58.1
84.0
81.6
73.5
70.6
67.3
64.3
61.4
61.4
60.0
57.2
eight were in the South, and twowere in the Midwest.
ADDITIONAL FINDINGS ONTHE BLACK POPULATION
What proportion ofrespondents reporting Blackalso reported a Hispanicorigin?
The Office of Management andBudget defines Hispanic or Latinoas “a person of Cuban, Mexican,Puerto Rican, South or CentralAmerican, or other Spanish cultureor origin, regardless of race.” In
data collection and presentation,federal agencies use two ethnicities:“Hispanic or Latino” and “NotHispanic or Latino.” Race and eth-nicity are considered two separateand distinct concepts by the federalsystem. Hispanics may be of anyrace, and Blacks can be Hispanic ornot Hispanic.
According to Census 2000, theoverwhelming majority of the Blackpopulation was non-Hispanic: 98 percent of those who reportedonly Black and 97 percent of thosewho reported Black and at least one
other race (see Table 4). However,only 82 percent of all respondentswho reported Black in combinationwith one or more other races werenon-Hispanic.
The Black non-Hispanic populationrepresented 12.4 percent of peoplewho reported exactly one race andabout 12.6 percent of the total pop-ulation. Of the 6.8 million peoplewho reported two or more races, 21 percent were non-Hispanics whoincluded Black as one of the racesreported.
8 U.S. Census Bureau
Table 4.Black or African American Population by Hispanic or Latino Origin: 2000(For information on confidentiality protection, nonsampling error, and definitions, see www.census.gov/prod/cen2000/doc/pl94-171.pdf)
Race and Hispanicor Latino origin
Alone In combination with one ormore other races
Alone or in combinationwith one or more other races
NumberPercentof total
Percent ofBlack orAfrican
Americanpopulation Number
Percentof total
Percent ofBlack orAfrican
Americanpopulation Number
Percentof total
Percent ofBlack orAfrican
Americanpopulation
Total population . . 274,595,678 100.0 (X) 6,826,228 100.0 (X) 281,421,906 100.0 (X)
Source: U.S. Census Bureau, Census 2000 Redistricting Data (Public Law 94-171) Summary File, Tables PL1 and PL2.
Table 5.Most Frequent Combinations of Black or African American With One or More Other Racesby Hispanic or Latino Origin: 2000(For information on confidentiality protection, nonsampling error, and definitions, see www.census.gov/prod/cen2000/doc/pl94-171.pdf)
Black or African American in combinationTotal Hispanic or Latino Not Hispanic or Latino
Number Percent Number Percent Number Percent
Total number reporting Black or AfricanAmerican and one or more other races . . . . . . 1,761,244 100.0 325,330 100.0 1,435,914 100.0
Black or African American; White . . . . . . . . . . . . . . . . 784,764 44.6 87,687 27.0 697,077 48.5Black or African American; Some other race . . . . . . 417,249 23.7 161,283 49.6 255,966 17.8Black or African American; American Indian andAlaska Native . . . . . . . . . . . . . . . . . . . . . . . . . . . . . . . . 182,494 10.4 14,472 4.4 168,022 11.7
Black or African American; Asian . . . . . . . . . . . . . . . . . 106,782 6.1 7,269 2.2 99,513 6.9Black or African American; White; Some other race . 43,172 2.5 15,481 4.8 27,691 1.9All other combinations including Black or AfricanAmerican . . . . . . . . . . . . . . . . . . . . . . . . . . . . . . . . . . . . 114,576 6.5 21,092 6.5 93,484 6.5
Source: U.S. Census Bureau, Census 2000 Redistricting Data (Public Law 94-171) Summary File, Tables PL1 and PL2.
Which other races were Black non-Hispanics mostlikely to report?
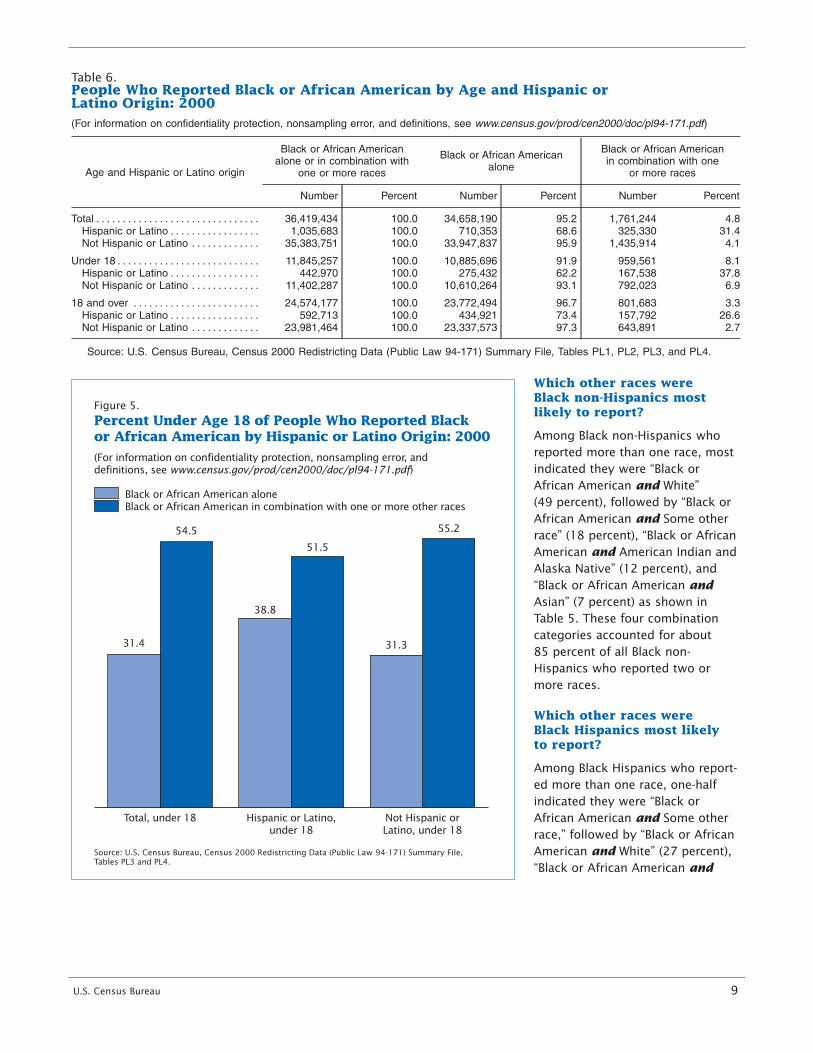
Among Black non-Hispanics whoreported more than one race, mostindicated they were “Black orAfrican American and White” (49 percent), followed by “Black orAfrican American and Some otherrace” (18 percent), “Black or AfricanAmerican and American Indian andAlaska Native” (12 percent), and“Black or African American andAsian” (7 percent) as shown in Table 5. These four combinationcategories accounted for about 85 percent of all Black non-Hispanics who reported two ormore races.
Which other races were Black Hispanics most likely to report?
Among Black Hispanics who report-ed more than one race, one-halfindicated they were “Black orAfrican American and Some otherrace,” followed by “Black or AfricanAmerican and White” (27 percent),“Black or African American and
U.S. Census Bureau 9
Figure 5.
Percent Under Age 18 of People Who Reported Black or African American by Hispanic or Latino Origin: 2000
Source: U.S. Census Bureau, Census 2000 Redistricting Data (Public Law 94-171) Summary File,Tables PL3 and PL4.
(For information on confidentiality protection, nonsampling error, and definitions, see www.census.gov/prod/cen2000/doc/pl94-171.pdf)
54.5
51.5
55.2
31.4
38.8
31.3
Not Hispanic orLatino, under 18
Hispanic or Latino,under 18
Total, under 18
Black or African American aloneBlack or African American in combination with one or more other races
Table 6.People Who Reported Black or African American by Age and Hispanic orLatino Origin: 2000(For information on confidentiality protection, nonsampling error, and definitions, see www.census.gov/prod/cen2000/doc/pl94-171.pdf)
Age and Hispanic or Latino origin
Black or African Americanalone or in combination with
Source: U.S. Census Bureau, Census 2000 Redistricting Data (Public Law 94-171) Summary File, Tables PL1, PL2, PL3, and PL4.
White and American Indian andAlaska Native” (6 percent), and“Black or African American andWhite and Some other race” (5 per-cent) as shown in Table 5.
Which group was more likely to report more than onerace, Black non-Hispanics orBlack Hispanics?
Black Hispanics were more likelythan Black non-Hispanics to reporttwo or more races. According toCensus 2000, 1.0 million peoplereported Black and Hispanic. Ofthose, 31 percent reported Blackwith one or more other races (seeTable 6). In contrast, of the 35.4 million Blacks who reportedas not Hispanic, only 4.1 percentreported at least one other race.
Were there differences in the age distribution betweenpeople who reported onlyBlack or African American andpeople who reported Black orAfrican American and one ormore other races?
People who reported Black as wellas one or more other races weremore likely to be under 18 thanthose reporting only Black (seeFigure 5). Of the 1.8 million peoplewho reported Black with at leastone other race, 54 percent wereunder 18. This proportion is higherthan the Black alone population. Ofthe 34.7 million people who report-ed only Black, 31 percent wereunder 18.
When the Black population is cross-tabulated by Hispanic origin, thispattern persists. For both Blacknon-Hispanics and Black Hispanics,a higher proportion of those report-ing more than one race was under18 when compared with thosereporting Black alone. Among the1.4 million Black non-Hispanics whoreported more than one race, 55 percent were under 18. Of the33.9 million people who reported
Black alone and not Hispanic, 31 percent were under 18.Similarly, among the 325,000 BlackHispanics who reported two ormore races, 51 percent were under18. Of the 710,000 Black Hispanicswho reported one race, 39 percentwere under 18.
ABOUT CENSUS 2000
Why did Census 2000 ask thequestion on race?
The Census Bureau collects data onrace to fulfill a variety of legislativeand program requirements. Dataon race are used in the legislativeredistricting process carried out bythe States and in monitoring localjurisdictions’ compliance with theVoting Rights Act. These data arealso essential for evaluatingFederal programs that promoteequal access to employment, edu-cation, and housing and for assess-ing racial disparities in health andexposure to environmental risks.More broadly, data on race are crit-ical for research that underliesmany policy decisions at all levelsof government.
How do data from thequestion on race benefit me,my family, and mycommunity?
All levels of government need infor-mation on race to implement andevaluate programs, or enforce laws.Examples include: the NativeAmerican Programs Act, the EqualEmployment Opportunity Act, theCivil Rights Act, the Voting RightsAct, the Public Health Act, theHealthcare Improvement Act, theJob Partnership Training Act, theEqual Credit Opportunity Act, theFair Housing Act, and the CensusRedistricting Data Program.
Both public and private organiza-tions use race information to findareas where groups may need spe-cial services and to plan and
implement education, housing,health, and other programs thataddress these needs. For example,a school system might use thisinformation to design culturalactivities that reflect the diversityin their community. Or a businesscould use it to select the mix ofmerchandise it will sell in a newstore. Census information alsohelps identify areas where resi-dents might need services of par-ticular importance to certain racialor ethnic groups, such as screen-ing for hypertension or diabetes.
FOR MORE INFORMATION
For more information on race in theUnited States, visit the U.S. CensusBureau’s Internet site at www.census.gov/population/www.socdemo/race.html.
Race data from the Census 2000Redistricting Data (Public Law 94-171) Summary File werereleased on a state-by-state basisduring March 2001. The Census2000 Redistricting data are avail-able on the Internet viafactfinder.census.gov and for pur-chase on CD-ROM and later on DVD.
For information on confidentialityprotection, nonsampling error, anddefinitions, also seewww.census.gov/prod/cen2000/doc/pl94-171.pdf or contact ourCustomer Services Center at 301-763-INFO (4636).
For more information on specificraces in the United States, go towww.census.gov and click on“Minority Links.” This Web pageincludes information about Census2000 and provides links to reportsbased on past censuses and sur-veys focusing on the social and eco-nomic characteristics of the Black orAfrican American, American Indianand Alaska Native, Asian, andNative Hawaiian and Other PacificIslander populations.
10 U.S. Census Bureau
Information on other populationand housing topics is presented inthe Census 2000 Brief series,located on the U.S. Census Bureau’s
Web site at www.census.gov/population/www/cen2000/briefs.html.This series presents informationabout race, Hispanic origin, age,sex, household type, housingtenure, and other social, economic,and housing characteristics.
For more information about Census2000, including data products, callour Customer Services Center at301-763-INFO (4636), or e-mail [email protected].
U.S. Census Bureau 11
U.S. Department of CommerceEconomics and Statistics AdministrationU.S. CENSUS BUREAU
Washington, DC 20233
OFFICIAL BUSINESS
Penalty for Private Use $300
FIRST-CLASS MAILPOSTAGE & FEES PAIDU.S. Census Bureau