1 The Boom and Bust of Emerging Economies: How to think about the future by understanding the past Gonzalo Garland The 15th World Knowledge Forum Seoul, October 16 2014 The Economic History of the last 2,000 years Source: ‘The Atlantic’
Transcript
1
The Boom and Bust of Emerging Economies: How to think about the future by understanding the past
Gonzalo Garland
The 15th World Knowledge Forum
Seoul, October 16 2014
The Economic History of the last 2,000 years
Source: ‘The Atlantic’
2
The Economic History of the last 2,000 years
Source: ‘The Atlantic’
The Economic History of the last
2000 years
The Economic History of the last 2,000 years
Source: ‘The Atlantic’
3
The Economic History of the last 2,000 years
Source: ‘The Atlantic’
Thomas Malthus
4
The Industrial Revolution and the
End of the “Malthusian Trap”
• Hans Rosling and “200 countries, 200 years, 4 minutes”
• http://www.youtube.com/watch?v=jbkSRLYSojo
200 Years of Growth with Different
Models
• From Pax Britannica and Primary-Export-Led-Growth
• A Free Trade World
• Questioning of the Model after WW1 and the Great Depression
• The Rise of Import Substitution Strategy
• Some countries move into Outward-Looking-Industrialization
• The Rise of Japan and other Asian Tigers
• Opening of Latin America and Eastern Europe in the late 1980s and early 1990s
The size of each territory shows the relative proportion of the world's population living there.
World Population Map 2050
This map shows the predicted distribution for the estimated world population in 2050.
10
World GDP Map
Territory size shows the proportion of worldwide wealth, that is Gross Domestic Product based on exchange rates with the US$, that is found there.
World GDP Map
11
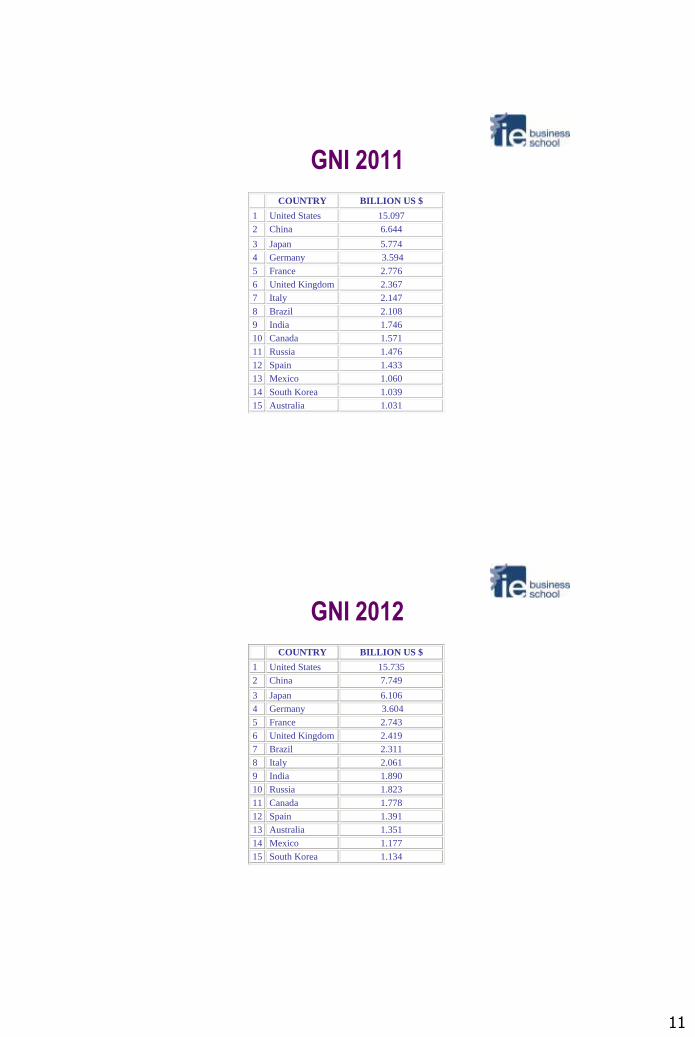
GNI 2011
COUNTRY BILLION US $
1 United States 15.097
2 China 6.644
3 Japan 5.774
4 Germany 3.594
5 France 2.776
6 United Kingdom 2.367
7 Italy 2.147
8 Brazil 2.108
9 India 1.746
10 Canada 1.571
11 Russia 1.476
12 Spain 1.433
13 Mexico 1.060
14 South Korea 1.039
15 Australia 1.031
GNI 2012
COUNTRY BILLION US $
1 United States 15.735
2 China 7.749
3 Japan 6.106
4 Germany 3.604
5 France 2.743
6 United Kingdom 2.419
7 Brazil 2.311
8 Italy 2.061
9 India 1.890
10 Russia 1.823
11 Canada 1.778
12 Spain 1.391
13 Australia 1.351
14 Mexico 1.177
15 South Korea 1.134
12
GNI 2012 - PPP
COUNTRY BILLION US $
1 United States 15.888
2 China 12.435
3 India 4.749
4 Japan 4.630
5 Germany 3.430
6 Russia 3.261
7 France 2.413
8 United Kingdom 2.332
9 Brazil 2.329
10 Mexico 2.016
11 Italy 2.002
12 South Korea 1.549
13 Spain 1.494
14 Canada 1.484
15 Turkey 1.346
POPULATION
COUNTRY MILLIONS
1 China 1,351
2 India 1,237
3 United States 314
4 Indonesia 247
5 Brazil 199
6 Pakistan 179
7 Nigeria 169
8 Bangladesh 155
9 Russia 144
10 Japan 128
11 Mexico 121
12 Philippines 97
13 Ethiopia 92
14 Vietnam 89
15 Germany 82
13
Overview of the World Economic Outlook Projections
2013 GDP Growth Rates
14
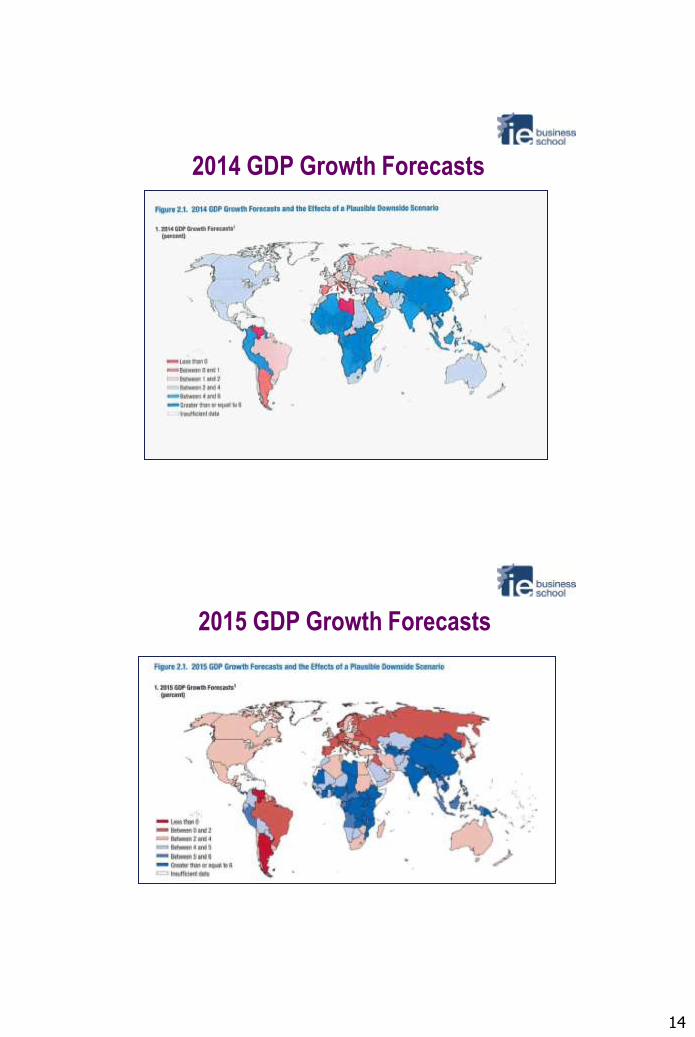
2014 GDP Growth Forecasts
2015 GDP Growth Forecasts
15
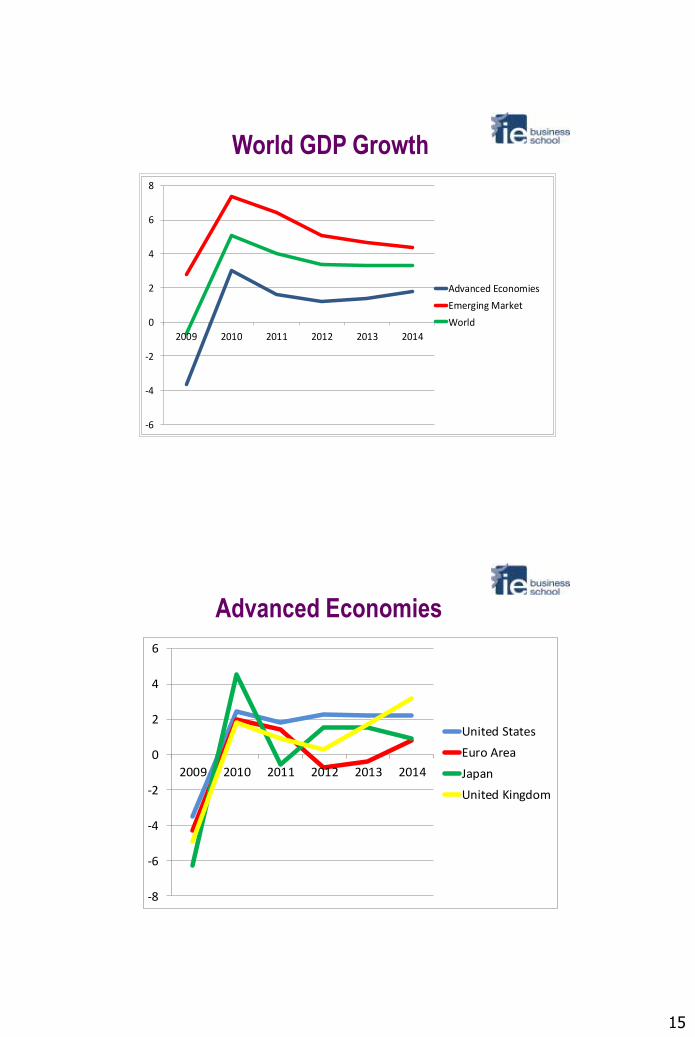
World GDP Growth
-6
-4
-2
0
2
4
6
8
2009 2010 2011 2012 2013 2014
Advanced Economies
Emerging Market
World
-8
-6
-4
-2
0
2
4
6
2009 2010 2011 2012 2013 2014
United States
Euro Area
Japan
United Kingdom
Advanced Economies
16
Europe
The United States and the Recovery • Crisis in 2000 after the “internet bubble”. At that time important
crisis
• Tax reductions and high expenditures on Defense and Homeland Security reflect use of expansionary fiscal policies under different administrations
• Recovery starts but housing bubble appears
• Interest rates too low for too long?
• New crisis with serious impact on the financial system
• Expansionary monetary and fiscal policy
• Public deficit above 10% of GDP
• Need for fiscal consolidation, but at what speed?
• Now performs better than Europe. Significant hopes on its recovery
• Differences between the US and Europe in degrees of freedom of fiscal and monetary policy
17
Europe and the Great Recession • Crisis hits in 2008-2009
• Second Great Depression or Great Recession?
• Emerging countries and the hope of ”decoupling”
• Globalization and its effects
• Unequal effect in Europe
• Crisis in Iceland, Ireland, Greece, Portugal, Spain, Cyprus, …
• Errors in the architecture of the Euro zone?
• Asymmetric shocks with limited labor mobility
• Common Fiscal Policy
• Which letter better describes the crisis? L, V, J, U, W?
• Need to keep the pace of reform
• Some progress, but then uncertainty again
• Risk of a third recession in the eurozone
-8
-6
-4
-2
0
2
4
6
8
10
12
2009 2010 2011 2012 2013 2014
C.& East.Europe
CIS
Dvp.Asia
L.America &Caribe
M.East & N.Afr.
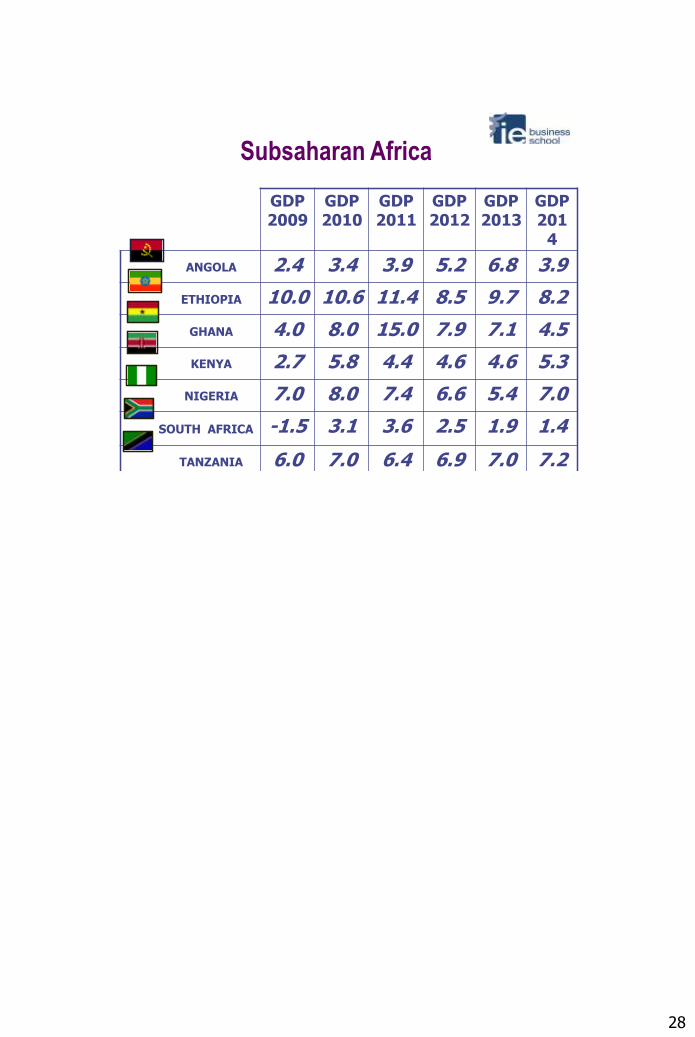
Sub-Sh Afr.
Emerging Markets
18
-10
-5
0
5
10
15
2009 2010 2011 2012 2013 2014
China
India
Russia
Brazil
Mexico
South Africa
Selected Emerging Economies
Emerging Economies in a New World
• Significant changes over recent decades
• First successes among Asian Tigers, in 70s and 80s
• Reform in China
• The 90s were a crucial decade with changes in Latin America, Eastern Europe, India, the Middle East
• Africa left behind, until recently
• Very little decoupling during the downturn, more in the upturn
• Recent slowdown increasing uncertainty
• Exchange rate instability due to capital flows
• Fastest growing regions in the world
• Presence of emerging countries’ companies in high income economies increases
• “Back to normal” scenario
19
A World in Transition • Times characterized by rise of emerging countries
• “From the West to the East” or “from the West to the rest”
• From the G-7 and the G-8 to the G-20, the G-2 or a G-3. And implications on international organizations, such as the UN, the IMF or the World Bank
• Weight of the world in terms of population also changing
• High income countries and aging populations and pension systems: Pay as you go or fully funded private funds?
• Lessons on medium-term sustainability of public debts
• More emphasis on structural reform
• Role of Europe in the new world
• Towards a new Malthusian crisis? Club of Rome
• Effects of technological changes still uncertain. Time of change
• Growth of middle classes worldwide: positive and negative effects. Great market opportunities but potential pressure on energy prices and prices of other commodities