32
Third Annual Report Card November 2013 The Boston Opportunity Agenda

Third Annual Report CardNovember 2013
The Boston Opportunity
Agenda

Founding Partners and Investors
Barr Foundation
The Beal Companies, LLP
The Boston Foundation
Boston Public Schools
Catholic Charities Archdiocese
of Boston
City of Boston
Combined Jewish
Philanthropies of Boston
Robert & Myra Kraft Family
Foundation
Nellie Mae Education
Foundation
New Profit Inc.
United Way of Massachusetts
Bay and Merrimack Valley
A Historic Partnership
Introduction | 2
About Us | 4
Boston Opportunity Agenda Goals and Measures Update | 6
A Strong Educational Foundation | 14
On Track for High School Graduation | 18
High School Completion & Postsecondary Attainment | 20
Opportunity Youth | 23
Adult Learners & Postsecondary Attainment | 25
Additional Funders | 27
Honoring Mayor Menino | 28
Table of Contents

2
What have we learned so far?
We have made extraordinary progress in getting more of our
youth to complete high school and earn college degrees.
But our successes in these later stages of the “pipeline”
should not obscure the fact that we’ve made so little
progress at the beginning of the pipeline: Less than one third
of our 3rd-graders are reading at grade level, and for the
past 10 years that number has never climbed above 37%.
We must make strengthening kindergarten through grade 3
a priority in this city.
The business, philanthropic, higher-education and nonprofit
communities are eager to continue partnering with the public
sector to achieve the Boston Opportunity Agenda’s goals.
Our next mayor must continue to create new ways for partners
to engage with the city, our schools and other governmental
institutions. Likewise, he and his administration will need
to remove barriers that limit information sharing, prevent
stakeholders from becoming engaged and ensure that there is
transparency as well as accountability in education reform.
Introduction
Dear Friends,
As this report goes to press, our city is changing. We’re engaged
in selecting a new mayor for the first time in 20 years, the Boston
Public Schools are searching for a new superintendent and two of
our local community colleges have new presidents.
What better time for all of us to reflect? In this report, we look
at improvements that we have seen in the cradle-to-career
educational pipeline, the areas where we have made modest
progress but still have a great deal of work to do, and the places
where we have failed to see the gains that are needed to ensure
that Boston is a city of opportunity for all. This report card is
designed to aid in that process of reflection.
We hope that by continuing to focus on key indicators—
readiness for kindergarten, reading proficiency in 3rd grade,
graduation from high school and college—this report card will
prompt community leaders and program providers alike to take a
step back and evaluate our programs in terms of their collective
impact.

3
Focusing on quality programs that deliver services is
important, but that strategy alone is not enough to ensure
success. We must continue to build cross-sector collaborations
and educational pathways that leverage the assets, knowledge
and thought partnership required to produce rapid change on
a grand scale. Our kids can’t wait.
During this time of change when multiple stakeholders
will jockey for position with our new leadership and
administration, the new mayor and other civic leaders must
keep the focus on achieving the educational goals that we have
laid out for our city and its learners of all ages.
Boston is unique. Our schools are urban leaders in a number of
key measures: high-school graduation and college-completion
rates and the National Assessment of Educational Progress
(NAEP) in English and Math. Still, at best we are performing at a
C-level. This isn’t good enough for our kids. We can show the rest
of the country—and perhaps the world—how a great city can pull
together to make great things happen for all of its residents.
Let’s get started.
Reverend Ray Hammond Kristin McSwain
Chair Executive Director

4
About Us
The Boston Opportunity Agenda (BOA) is a public/private
partnership among the City of Boston, the Boston Public Schools,
the city’s leading public charities and many local foundations to
ensure that all Boston residents have access to the education
necessary for upward economic mobility, civic engagement, and
lifelong learning for themselves and their families. We fervently
believe that by combining our resources, expertise and influ-
ence around a single agenda, we will have a greater impact on
Boston’s cradle-to-career educational pipeline.
While Boston has many exciting programs and organizations
that focus on providing opportunities for individuals, the Boston
Opportunity Agenda is a long-term partnership focused on
achieving system change that will ultimately affect all Boston
residents.
Over the past several years, the Boston Opportunity Agenda
member organizations have used three organizing principles to
guide our collective work and network structure. The partnership
is governed by the CEOs of each member organization who
identify strategic issues facing our educational pipeline in whole
or in part, formulate the Boston Opportunity Agenda priorities
and strategies, and provide a call to action for community
stakeholders.

5
The Three Principles
Keeping key performance measures in public view is critical to driving change.Accurate and timely data is a call to action and an accountability
mechanism. Through our annual report card, forums, evaluations
and community dialogues, we aim to educate ourselves and
the greater Boston community on our challenges, progress and
collective impact.
Our investments must produce immediate gains and long-term systems change.BOA investments are designed to expedite the positive
educational outcomes for underserved individuals currently in
the education pipeline while surfacing the long-term changes
that must be made in our systems to ensure success for all. Our
investments also focus on building networks and delivery systems
rather than increasing the capacity of a single organization or
program.
Collective impact is required to achieve our goals.
Only by mobilizing the nonprofit, philanthropic, business and
governmental communities to align resources and increase effi-
ciency and effectiveness will we ensure the overall success of
Boston’s educational pipeline. We have created multiple ways for
others to join us:
Investing Partners contribute financial and human resources
to BOA priority initiatives.
Philanthropic Partners align their education investments to
support BOA priority initiatives or advance BOA goals. They
share common data collection, tools and analysis.
Community Partners join one of the priority investment
networks and align one or more of their education programs
in support of BOA goals. They share common data collection,
tools and analysis as well as participate in continuous improve-
ment work.
Our current partners are identified in the programmatic updates
section of the report card. To learn more about becoming a
Boston Opportunity Agenda partner at any level please contact
Kristin McSwain at [email protected].
Our mission is to
ensure that all
Boston residents
have access to
the education
necessary for
upward economic
mobility, civic
engagement and
lifelong learning
for themselves
and their families.

6
Base 2008 / 2009
Current2012 / 2013
Annual ChangeGoal
2013 / 2014
54% 59%(66% at end of year) 75%
A Strong Educational FoundationEarly Literacy: Percent of Entering Kindergarteners Achieving the DIBELS* Benchmark
*The Dynamic Indicators of Basic Early Literacy Skills (DIBELS) are a set of procedures and measures for assessing the acquisition of early literacy skills from kindergarten through sixth grade.
“Why does it Matter” source: Strategies for Children, “A Report on the Cost of Universal, High Quality Early Education in Massachusetts.”
0
20%
40%
60%
80%
100%
End of Year SY2012-13Beginning of Year SY2012-13
WhiteFemales
WhiteMales
HispanicFemales
HispanicMales
BlackFemales
BlackMales
AsianFemales
AsianMales
AllStudents
(% at Benchmark)
What’s Under the Hood: DIBELS NEXT* in Kindergarten How are we doing?The DIBELS assessment is given when children enter kinder-
garten and when they leave. This year we see another increase of
two percentage points for kids entering kindergarten. Kindergarten
achievement is also strong, with 66% of students finishing the
year at benchmark. In order to maximize the time students spend
in kindergarten and improve on these gains, the Boston Public
Schools is implementing a new K-2 curriculum that aligns with the
Common Core State Standards and 21st-century skills.
Why does it matter?Children who participate in high-quality early education
programs are 40% less likely to repeat a grade, 30% more likely
to graduate from high school and more than twice as likely to go
to college. They develop better language skills, score higher on
school readiness tests and have fewer behavioral problems once
they enter school. Finally as adults, they have higher annual
earnings and are more likely to be homeowners.

7
Base 2008 / 2009
Current2012 / 2013
Annual ChangeGoal
2013 / 2014
31% 32% 75%
A Strong Educational Foundation3rd-Grade Reading Proficiency
“Why does it Matter” source: Annie E. Casey Foundation, “Double Jeopardy: How Third-Grade Reading Skills and Poverty Influence High School Graduation”
0
20%
40%
60%
80%
100%
WhiteFemales
WhiteMales
HispanicFemales
HispanicMales
BlackFemales
BlackMales
AsianFemales
AsianMales
AllStudents
(% at Benchmark)
What’s Under the Hood: Proficiency for 3rd Grade MCAS ELA by Race and Gender
SY2012-13
How are we doing?Reading proficiency as measured by the MCAS continues to
fall in Boston and across the Commonwealth of Massachusetts.
As detailed later in this report, the Boston Public Schools
has created and vetted with a panel of local experts a plan to
improve the quality of literacy instruction, align the curriculum
with the Common Core Standards, and increase the rigor of
classroom texts.
Why does it matter?From 1st to 3rd grade, students are learning to read and from 4th
grade on they must be able to read to learn. “One in six children
not reading proficiently in 3rd grade fail to graduate from high
school on time, a rate four times greater than that for proficient
readers,” says the Annie E. Casey Foundation. “Black and
Hispanic children who are not reading proficiently in 3rd grade
are about twice as likely as similar white children not to graduate
from high school.”

8
How are we doing?Boston has made great strides in expanding access to 8th-grade
Algebra for all students. In partnership with EdVestors, BPS has
expanded the Algebra enrollment while providing wraparound
supports for teachers and students in the form of professional
development, summer programming and coaching. As a result,
62% of non-exam school students enrolled in 8th-grade Algebra
achieve a C or better on the final exam, allowing them to pursue
Geometry or Algebra ll in 9th grade. This is up from the 2010-
2011 baseline of 22%.
Why does it matter?Frequently referred to as a “gateway” or “gatekeeper” course,
Algebra is the first in a series of higher level math courses
required for success in work and life. Offering Algebra in the 8th
grade increases academic rigor and allows students to pursue
higher levels of mathematics coursework throughout their high-
school career. Research has shown that with each additional
level of math completed in high school, students increase the
likelihood that they will complete a Bachelor’s degree.
Base 2008 / 2009
Current2012 / 2013
Annual ChangeGoal
2013 / 2014
4% 38% 40%
On Track for High School GraduationPercent of Non-Exam 8th Graders Who Are Enrolled in Algebra 1
“Why does it Matter” source: U.S. Department of Education, “Answers in the Tool Box: Academic Intensity, Attendance Patterns and Bachelors Degree Attainment.”
(% at Benchmark)
What’s Under the Hood: Percent of Non-Exam School 8th Graders Who Took Algebra I
SY2012-13
0
10%
20%
30%
40%
50%
WhiteHispanicBlackAsianAll

9
Base 2008 / 2009
Current2012 / 2013
Annual ChangeGoal
2013 / 2014
44% 55% 75%
High School CompletionPercent of 10th Graders Who Pass All MCAS Tests*
*It is important to note that with the graduating class of 2013, the standards for graduation increased from “needs improvement” on ELA and Math to “proficient” on ELA and Math and “needs improvement” in Science.
“Why does it Matter” source: Center for Labor Market Studies, “The College Enrollment and Graduation Experiences of BPS Graduates.”
0
20%
40%
60%
80%
100%
MaleFemale
(% at Benchmark)
What’s Under the Hood: Percentage of Grade 10 Students Passing ELA, Math, and Science
By Race and Gender
WhiteAfrican AmericanAsian Hispanic
How are we doing?There is much good news to celebrate in Boston’s 10th-grade
MCAS scores. Student gains in English Language Arts (ELA) and
Math continue to outpace those of the state. While the achieve-
ment gap persists, the disparity between African-American and
white students decreased by 8 percentage points in ELA and 7
percentage points in Math. The gap for Hispanic students also
narrowed in Math by 4 percentage points. Finally, more than half
(55%) of the Class of 2014 has met the graduation standard, a
14-point increase over the Class of 2010, when the new standard
was first implemented.
Why does it matter?While many in the general population understand that profi-
ciency on the MCAS is necessary in order to graduate from high
school, MCAS proficiency also serves as an indicator of whether
a student will enroll in and complete postsecondary educa-
tion. “Not only are students with stronger reading and math
scores more likely to attend college, but they are also much more
likely to enroll in 4-year colleges and graduate with a Bachelor’s
degree.”

10
Base 2008 / 2009
Current2011 / 2012
Annual ChangeGoal
2013 / 2014
7.3% 6.4% <3%
High School CompletionAnnual Dropout Rate
How are we doing?The dropout rate for the 9th-grade cohort (first-time 9th graders
in 2007) decreased for the fourth year in a row to 19.6%, while
the annual dropout rate in Boston increased less than 1% over
the past three years. This is a tremendous achievement for an
urban school system—particularly one experiencing more strin-
gent MCAS graduation requirements over the same time period.
Regardless, the city’s dropout prevention stakeholders are
increasing their efforts to keep teens from leaving school. The
Boston Opportunity Youth Collaborative, described later in this
report, will spend the next several years focused on re-engaging
and retaining disconnected young people.
Why does it matter?Lost lifetime earnings in Massachusetts for the class of 2010
dropouts alone will total nearly $3.7 billion, according to the
Alliance for Excellent Education. If the state’s male graduation
rate grew by just 5%, the Massachusetts economy would see
crime-related savings and additional revenue of about $115
million each year.
0
2%
4%
6%
8%
MaleFemale
(% at Benchmark)
What’s Under the Hood: Annual Dropout Rates by Race and Gender
WhiteAfrican AmericanAsian Hispanic
“Why does it matter?” source: U.S. Chamber of Commerce, “The Ugly Truth: A State-by-State Snapshot of Education in America”

11
How are we doing?Boston continues to have one of the highest urban 4-year grad-
uation rates in the nation. This year we see increases across
a number of student subgroups—male, female, low income,
English Language Learners (ELL) and students with disabili-
ties—in addition to the overall increase of 1.5 percentage points.
Modest gains were made by Asian, Black and Hispanic students
while the number of white students completing in four years
declined. While a decrease in the 4-year graduation rate for white
students is not ideal, the rate for that group still remains high at
73.2%. Finally, the 5-year graduation rate continues to increase
and is now at an aggregate of 70%.
Base 2008 / 2009
Current2011 / 2012
Annual ChangeGoal
2013 / 2014
61.4% 65.9% 80%
High School Completion4-Year Graduation Rate
0
20%
40%
60%
80%
100%(% at Benchmark)
What’s Under the Hood: 4-Year Completion Rates by Race, Gender, ELL and SPED Status
SY2011-12
WhiteHispanicAfrican American
AsianSPEDELLFemaleMaleAll Students

12
Base 2008 / 2009
Current2011 / 2012
Annual ChangeGoal
2013 / 2014
35%(class of 2000)
49.3%(class of 2006)
70%(class of 2011)
Postsecondary AttainmentCollege Completion
0
20%
40%
60%
80%(% at Benchmark)
What’s Under the Hood: 6-year College Graduation Rates, BPS class of 2006*
Asian females
Asian males
White females
White males
Hispanic females
Hispanic males
Black females
Black males
How are we doing?More than 49% of the BPS Class of 2006 who enrolled in college
obtained an Associate’s or Bachelor’s degree within six years.
Boston leads the nation in tracking and improving urban college
completion. While much more work remains to achieve the
college-completion goal of 70% for the BPS class of 2011, Boston
has made significant progress to date and stands poised to prove
that a high level of college completion is possible for a large urban
district in the United States.
Why does it matter?A postsecondary degree is essential for success in Greater
Boston’s knowledge economy, where more than half of all job
vacancies require at least an Associate’s degree—a percentage
that is expected only to grow. In addition, a typical Bachelor’s
degree holder will earn $1.9 million more than a high-school
dropout over the course of a lifetime.
“Why does it Matter” source: Center on Education and the Workforce, George-town University, “The College Payoff.”
*Students who enrolled in postsecondary institutions the first year after high-school graduation.

13
Our new goal, that 60% of the adults in Boston between the
ages of 25 and 64 have a postsecondary credential by 2025
(only 47 percent now do), aligns with the national goal put
forward by the Lumina Foundation. By joining a growing cadre
of communities aligned with Lumina, we will be able to share our
challenges, learn from other cities and celebrate our successes.
There is much to do for the 33% of our working-age adults who
hold a high-school diploma or equivalency or have some college.
At a minimum, we must:
Continue to improve our college-going and completion rates
for high school students;
Work with ABE providers and colleges to ensure that adult
learners earn credentials that lead to careers;
Encourage employers to design in-house education programs
that create career pipelines for incumbent workers; and
Identify new and emerging career opportunities specific to our
region and train Boston residents to fill them.
Base 2011
CurrentAnnual Change
Goal2025
47%N/A N/A 60%
Adult LearnersPercentage of 25- to 64-Year-Olds with Postsecondary Credentials
In Boston, more than 200,000 adults do not have the education
and training that they need to secure jobs that will support them-
selves or their families. In a regional economy where more than
half of the job vacancies require at least a 2-year degree, 41%
of adults over age 25 lack such credentials or do not have the
educational background to attain them.
The Boston Opportunity Agenda has spent the past year working
with a diverse group of stakeholders (including nonprofits, univer-
sities and businesses) to examine our Adult Learner goal. While
it’s important to build pathways for adults from the Adult Basic
Education (ABE) system to postsecondary opportunities, it is only
one small element of what is necessary. The Boston economy
needs more high-quality postsecondary education and training
pathways and workers who are well-prepared to succeed in them.
In addition to Bachelor’s and Associate’s degrees, these path-
ways must include training for certificates that are portable, have
economic value, and meet the needs of employers.

14
South WIC Program, Dudley Street Neighborhood Initiative, East
Boston Head Start, East Boston Social Centers, East Boston WIC
Program, East Boston YMCA, EDC, Ellis Memorial Early Education
Center, Escuelita Boriken/Inquilinos Boricuas en Acción, Family
Nurturing Center, Family Service of Greater Boston, Grove Hall
Child Development Center, Horizons for Homeless Children—
Edgerley, It’s a Child’s World, Joseph M. Smith Community Health
Center, Laboure Center, Little Folks Community Day Care, MA
Department of Early Education and Care, MA Executive Office
of Health and Human Services, Morgan Stanley Smith Barney,
Mujeres Unidas Avanzando, N.I.C.E. Inc., Paige Academy,
Partners Health Care, Rosa Parks Child Care Center, S.M.I.L.E.
Preschool, Smart from the Start, South Boston Neighborhood
House, The Food Project, Tufts University, University of
Massachusetts Boston, United South End Settlements, Vital
Village, Wellesley Centers for Women, Wesley Child Care Center,
and Wheelock College.
ResultsThrive in 5 and its cross-sector partners have made progress
toward this goal through three citywide strategies:
Boston Children Thrive
Boston Children Thrive (BCT) is a place-based initiative that
engages the whole community in supporting children’s healthy
development and readiness for school. Currently, BCT operates
Boston’s future prosperity depends on the health and well-being
of our youngest children. From neuroscience, we know that a
child’s brain develops more rapidly in the first few years of life
than at any other time. That growth depends on good health,
positive experiences, and nurturing relationships to create a
strong foundation for lifelong learning, a foundation currently
demonstrated by school readiness.
Thrive in 5, launched in 2008 by Mayor Thomas M. Menino and
United Way of Massachusetts Bay and Merrimack Valley, aims
to ensure universal school readiness for all of Boston’s children.
By partnering with families, early education and care providers,
health providers and others, Thrive in 5 builds community
capacity to support school readiness, strengthen the quality of
existing services, expand and create programs to address unmet
needs and measure progress to ensure accountability so that each
child enters kindergarten ready to succeed in school and in life.
Community Partners: ABCD-Head Start, ASPIRE Institute,
Associated Early Care and Education, Avid Technologies,
Boston Association for the Education of Young Children, Boston
Children’s Hospital, Boston Children’s Museum, Boston Family
Engagement Network, Boston Medical Center, Boston Public
Health Commission, Boston Public Library, Boston Public
Schools, Catholic Charities, City of Boston, College Bound
Dorchester, COMPASS, Countdown to Kindergarten, Crittenton
Women’s Union, Deloitte Consulting, Dorchester Boys and
Girls Club, Dorchester House Multi-Service Center, Dorchester
A Strong Educational Foundation Thrive in 5

15
care and education programs to the highest quality, using child-
outcome data to drive program improvement and innovation.
For example, Boston K1DS, a pilot project of the Boston Public
Schools and Thrive in 5, improves the quality of community-based
preschool classrooms by implementing key aspects of the BPS
pre-kindergarten (K1) program. This model provides children in
the 14 Boston K1DS pilot classrooms with the same high-quality
early learning offered by BPS, but on a full-day, full-year basis
that meets the needs of working families. Alongside Boston K1DS,
Thrive in 5 is also piloting a new approach to quality improvement
in 10 early education programs and five family child-care homes.
This approach involves creating program improvement plans that
focus on what matters most: good child outcomes.
The School Readiness Pipeline
Information on the developmental progress of young children
is critical to ensuring that, as a city, Boston is prioritizing the
early education needs of its youngest residents and helping to
prepare them for kindergarten. The School Readiness Pipeline
is a groundbreaking effort to build a universal screening system
to measure children’s development across the early years and
into kindergarten. Data collected from the Pipeline will provide
a snapshot of how Boston’s children are doing collectively
and individually. With Pipeline data, families, teachers, health
providers and city leaders will be able to take a data-driven
approach to investing in early childhood, making informed,
strategic decisions to tailor support and valuable resources to
the children, families and communities most in need.
in five neighborhoods where 13,000 children 5 and under—
one-third of the city’s young children—live: Allston/Brighton, East
Boston, the South End/Lower Roxbury, Dudley and Fields Corner.
Using a model that facilitates parent engagement and community
building, BCT hub agencies in each neighborhood coordinate
with parents and dozens of community-based organizational
partners, including health centers, family support programs, WIC,
libraries, and early education and care providers to deliver a full
calendar of opportunities for families to support their children’s
early learning. Parents are actively involved as leaders in the
BCT communities, serving as parent partners who reach out to
neighborhood families as well as plan and lead activities and
events to connect more families to the BCT network.
BCT’s focus on partnering with parents as leaders has been an
effective strategy for engaging families with children most at risk
for the achievement gap, with more than 2,500 families enrolled
in the neighborhood BCT campaign. Of enrolled adults, 82% are
people of color; 57% speak a language other than English; 58%
were born outside of the United States; 51% have a high school
diploma or less—all higher proportions than the neighborhood
averages. In addition, 55% of families had not participated in
early childhood/enrichment activities in the six months prior
to enrolling and 58% receive one or more forms of public
assistance, including WIC and food stamps.
Ready Educators
High-quality early care and education programs produce great
results for kids, particularly those most at risk. Thrive in 5’s
Ready Educators strategy is designed to move Boston’s early

16
Despite our rich array of programs devoted to improving literacy
from birth to age 8, only 32% of Boston’s 3rd graders are reading
at grade level. For the past decade, that number has never been
higher than 37%. In order to begin to address this challenge, the
Boston Opportunity Agenda is working in two different arenas—
with the Boston Public Schools to improve teaching and learning
and with the literacy community to address student supports and
family engagement.
Teaching and LearningAt last year’s annual report-card presentation, former BPS
Superintendent Carol Johnson announced on behalf of Mayor
Menino the formation of an external Literacy Expert Panel. This
body was convened by the Mayor and the school district to
assist BPS in ensuring that all third graders have mastered the
prerequisite language and literacy skills necessary for success in
later grades. Co-chaired by the Superintendent and Dr. Catherine
Snow, Professor of Education at the Harvard Graduate School
of Education, the panel engaged educators from four other area
institutions:
Dr. Maria Brisk, Lynch School of Education, Boston College
Dr. Devin Kearns, School of Education, Boston University
Dr. Theresa Perry, Africana Studies and Education, Simmons College
Dr. Eleonora Villegas-Reimers, Education, Wheelock College
A Strong Educational Foundation3rd-Grade Reading Proficiency

17
In July 2013, the panel made five recommendations based
on their review and discussion of BPS data, an analysis of the
literacy challenges facing BPS, strategies and implementation
efforts to date, and the remaining challenges and opportunities
to strengthen planning for the future. A summary of the
recommendations is as follows:
Redefine professional education so that it increases adults’
capacity to support and assess children’s language and
reading development. This includes organizing it, focusing it
on good instruction, incorporating sufficient information about
assessment, and getting teachers to participate;
Develop models of curriculum that build students’ skill in
using the English language while also enriching their world
knowledge;
Use data productively to inform instruction so that formative
assessment is thought of as a process embedded in instruc-
tion;
Provide prevention and intervention to students who fail to
progress as expected in order to reduce student discourage-
ment and referrals to special education; and
Expand and strengthen partnerships with families to focus on
improving children’s language and reading.
These recommendations and strategies for their implementa-
tion are fully discussed in the Literacy Expert Panel report. They
provide a guide for BPS, the Boston Opportunity Agenda and
other stakeholders as we moved forward in implementing plans
over the next several years to improve language and literacy
instruction district wide.
Student Supports and Family EngagementThere is currently no network of organizations that has articulated
a plan to work together to address Boston’s reading proficiency
challenges. The Boston Opportunity Agenda has initiated a
facilitated conversation, led by Community Matters, with early
education providers, libraries, Boston Public Schools, tutoring
and literacy providers, as well as those engaged in professional
development and research on literacy acquisition best practices
to explore the creation of a literacy network. The group has
identified two priority issue areas in which they will engage over
the next six months: high-quality instruction and awareness/
family engagement. They will also be working with Strategies for
Children and Dr. Nonie Lesaux of the Harvard Graduate School
of Education to complete a landscape analysis of language and
literacy supports across the city.
Community Partners: Associated Early Care and Education,
BELL, Boston Plan for Excellence, Boston Partners in Education,
Boston Public Library, Boston Public Schools, City Year,
Dudley Street Neighborhood Initiative, Education Development
Corporation, EdVestors, Family Nurturing Center, Foundation
for Children’s Books, Friends of the Library, Generations
Incorporated, Greater Boston Jewish Coalition for Literacy,
Hill for Literacy, Inquilinos Boricuas en Acción, JumpStart
for Young Children, Raising a Reader, Reach out and Reach,
ReadBoston, Wheelock College and YMCA of Greater Boston.
The Boston
Opportunity
Agenda is working
with the Boston
Public Schools
and the literacy
community to
help more 3rd
graders read at
grade level.

18
The Boston Summer Learning Project (SLP) is a citywide effort
aimed at advancing a year-round expanded learning system
that connects school, out-of-school time and summer learning.
Launched by the Boston Opportunity Agenda in 2010, the project
aims to reverse summer learning loss; improve skills associated
with school, college and career success; and deepen school-
community partnerships.
Co-managed by the Boston Public Schools (BPS) and Boston
After School & Beyond (BASB), SLP serves high-needs students,
identified largely by principals, who are not likely to find their
way to summer programming on their own. During the summer
of 2013, the SLP involved 51 BPS schools and 18 community
partners who collectively provided more than 1,700 students
with structured and engaging summer learning opportunities.
Teachers and community partner staff co-manage the programs,
jointly developing and delivering academic and skill-building
content and experiences for students that build on the unique
characteristics of the partner organization. During the summer
of 2013, 11 additional summer providers also used the same
measurement tools as SLP to measure their program quality. The
sites are sharing the results as well as demographic and atten-
dance information to inform continuous improvement across
Boston’s summer providers.
Community Partners: Building Educated Leaders for Life (BELL);
Boston Family Boat Builders; Boston Private Industry Council;
Boys & Girls Clubs of Boston; Center for the Arts; Crossroads 4
On Track for High School Graduation Summer Learning Project
Kids; Community Music Center of Boston; Courageous Sailing;
Dorchester House; Freedom House; Hale Reservation; Horizons
at Dedham Country Day School; Hyde Square Task Force; Inqui-
linos Boricuas en Acción (IBA); The Laboure Center; The Learning
Project; MathPower; Sociedad Latina; MIT Office of Engineering;
Phillips Brooks House Association; Stepping Stone Foundation;
Sportsmen’s Tennis and Enrichment Center; Tenacity; Thompson
Island Outward Bound Education Center; USS Constitution
Museum; YMCA of Greater Boston; and Zoo New England.
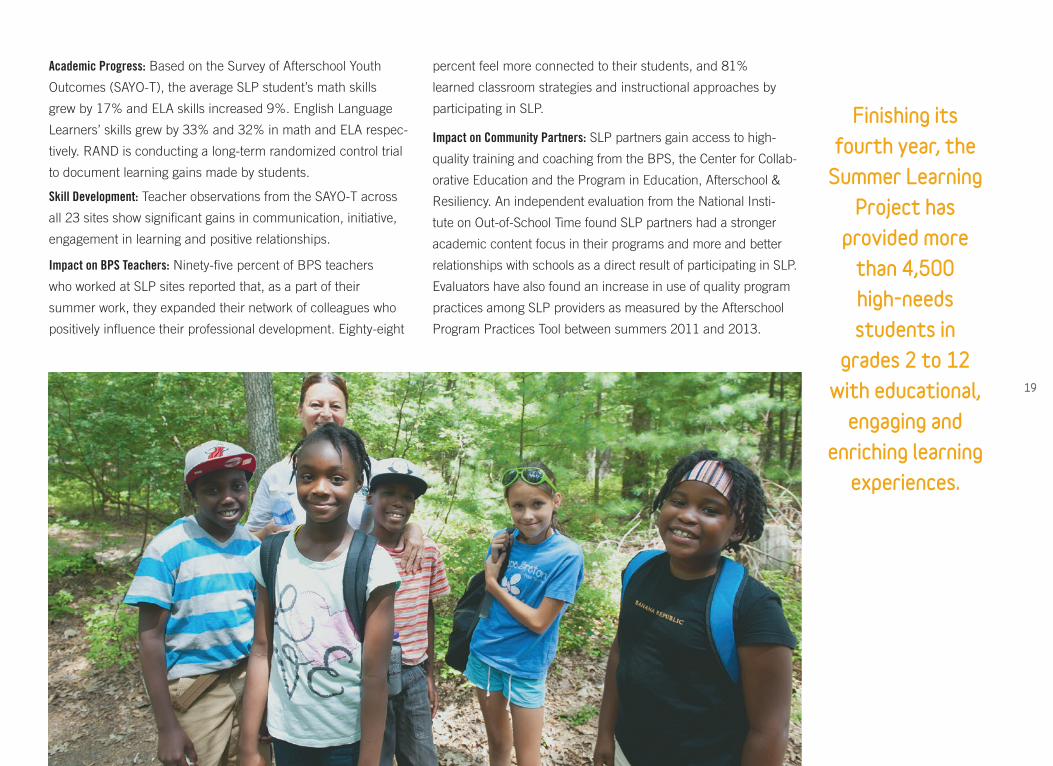
ResultsFinishing its fourth year, the Summer Learning Project has
provided more than 4,500 high-needs students in grades 2 to 12
with educational, engaging and enriching learning experiences
designed by schools and their community partners. By
participating in the national demonstration on summer learning
conducted by RAND, we are building the evidence base that
summer learning loss is real and can be stemmed by high-quality
programming. The Summer Learning Project was recognized
in 2013 by the National Summer Learning Association, which
awarded it the New York Life Excellence in Summer Learning prize.
Equally important, the Summer Learning Project has built a
strong framework for integrated school-community partnerships
with a suite of measurement tools that report on student
academic and skills outcomes, impact on teachers, and
programmatic quality.
19
Academic Progress: Based on the Survey of Afterschool Youth
Outcomes (SAYO-T), the average SLP student’s math skills
grew by 17% and ELA skills increased 9%. English Language
Learners’ skills grew by 33% and 32% in math and ELA respec-
tively. RAND is conducting a long-term randomized control trial
to document learning gains made by students.
Skill Development: Teacher observations from the SAYO-T across
all 23 sites show significant gains in communication, initiative,
engagement in learning and positive relationships.
Impact on BPS Teachers: Ninety-five percent of BPS teachers
who worked at SLP sites reported that, as a part of their
summer work, they expanded their network of colleagues who
positively influence their professional development. Eighty-eight
percent feel more connected to their students, and 81%
learned classroom strategies and instructional approaches by
participating in SLP.
Impact on Community Partners: SLP partners gain access to high-
quality training and coaching from the BPS, the Center for Collab-
orative Education and the Program in Education, Afterschool &
Resiliency. An independent evaluation from the National Insti-
tute on Out-of-School Time found SLP partners had a stronger
academic content focus in their programs and more and better
relationships with schools as a direct result of participating in SLP.
Evaluators have also found an increase in use of quality program
practices among SLP providers as measured by the Afterschool
Program Practices Tool between summers 2011 and 2013.
Finishing its fourth year, the
Summer Learning Project has
provided more than 4,500 high-needs students in
grades 2 to 12 with educational,
engaging and enriching learning
experiences.

Getting InBeginning with the class of 2009, the Boston Foundation and a
number of nonprofit partners began providing transition coaching
and summer supports for up to 300 students per graduating
class. The Boston Private Industry Council, uAspire, Amer-
ican Student Assistance, Bottom Line, Freedom House, and
Hyde Square Task Force provide one-on-one and group advising
around both academic and non-academic barriers—as well as
transition support for the first two years of college. They work in
partnership with colleges’ student support services; together they
are establishing a common standard of practice and an inte-
grated system of transition supports for all students.
Getting ThroughCoordinated by University of Massachusetts Boston, 37 area
colleges and universities are offering BPS graduates supports
they will need to earn a degree. In addition, they have committed
to track Boston student progress and encourage students to use
on-campus support services. A committee of financial aid liaisons
is working with uAspire to promote FAFSA completion, stream-
line financial award letters, and establish financial aid liaisons on
campuses. Together the colleges are also exploring strategies to
broker on- and off-campus employment opportunities and intern-
ships that promote persistence and career exploration.
Designed to dramatically increase the
college-completion rate of Boston graduates,
Success Boston focuses on three key strat-
egies to ensure that Boston Public Schools
students are “Getting Ready, Getting In and
Getting Through.”
Getting ReadyThe Boston Public Schools is committed
to improving student readiness for college
and career. “Getting ready” focuses on
increasing the academic rigor of students’
high school courses, expanding 8th-grade
Algebra and Advanced Placement courses,
offering new academic credit recovery courses in Boston’s
high schools, increasing college advising at all high schools
and ensuring that 100% of eligible students complete the Free
Application for Federal Student Aid (FAFSA). BPS also will
adopt Common Core State Standards and assessments that are
designed to increase student readiness. By supporting academic
programming in this way and strengthening advising activities,
students and their families will be better prepared and well posi-
tioned to make informed choices about postsecondary pathways.
High School Completion & Postsecondary AttainmentSuccess Boston: A College Completion Initiative
20

21
Getting In
Through a rigorous case-management approach, transition
coaches from nonprofit organizations provide students with
help in a variety of ways. The coaches assist with financial-aid
documents; help students navigate the transition between high
school and college; foster the development of time-management
and other life skills; and aid in exploring majors and careers.
Intermediate benchmarks track student performance (GPA),
persistence (re-enrollment) and progress (accumulation of
credits toward a degree). Results from the 2011 cohort of
Success Boston show continued student progress:
84 % of students maintain a cumulative GPA of 2.0 or higher;
83% re-enrolled in college in their sophomore year, compared
to 76% of non-exam school students in 2008, our baseline
year;
67% of students moved from remedial to credit-bearing
courses by the end of their freshmen year.
Another 300 students from the Class of 2012 have received
support from the transition coaches and nearly 285 gradu-
ates from the Class of 2013 will receive support for two years
of their college careers. In addition, a close partnership with
the University of Massachusetts Boston, Roxbury Community
College and Bunker Hill Community College has increased the
coaching capacity (by working with the office of student supports
at each campus). These partnerships have resulted in almost
2000 students receiving coaching support since 2009. This
“embedded model” is described in greater detail on page 22.
Community Partners: American Student Assistance, Boston
PIC, Bottom Line, Bunker Hill Community College, College
Bound Dorchester, Freedom House, Hyde Square Task Force,
Roxbury Community College, Sociedad Latina, UMass Boston
and uAspire.
ResultsGetting Ready
While there is still a great deal of work to do, the school district
has made progress in expanding access to 8th-grade Algebra
and AP courses during the past three years. Through its part-
nership with EdVestors, BPS has been able to increase the
percentage of students with access to Algebra instruction. At
the same time, BPS partnered with the MASS Math + Science
Initiative to expand enrollments in AP classes while maintaining
passing rates needed for college credit. Investments in increased
academic rigor are beginning to increase student preparation for
postsecondary programs.
College enrollment rates have grown steadily in Boston. The
Class of 2007 had achieved a cumulative enrollment rate of
76.7% just five years after high school, while in comparison the
Class of 2000 had achieved a 73% enrollment rate 12 years
after high school graduation and the Class of 2003 approached
a 75% enrollment rate after nine years. For the Class of 2009,
the cumulative enrollment rates were 75.9% just three years
after high school. It is important to note that these are cumulative
enrollment rates, and there are sizable enrollment gains made
after the first year after high school.

22
Seventy-eight percent of BPS graduates from the class of
2011 returned for their third year at UMass Boston compared
to 64% for the BPS class of 2008,
BPS graduates on track to complete degrees (2.5 GPA/24
credits/6-year graduation) increased annually from 26% in
2008 to 53% for the class of 2012.
The presence of the community-based coaches has expanded
the capacity of the UMass advising and student-support staff and
built a strong bridge between the university and organizations
serving BPS graduates in the communities in which they live
and work. This model provides a unique opportunity for college
success to be owned simultaneously by community organizations
and higher education institutions. It supports Success Boston’s
ambitious goal of increasing degree-completion rates while also
expanding responsibility for students’ college success, building
a culture in high schools, neighborhoods and higher education
institutions that provides all Boston’s students with the supports
they need to earn a postsecondary credential.
Although it is too soon to know definitively, Success Boston’s
theory is that this enhanced support will mean that more students
graduate from college. The six-year college graduation rate has
increased to 49.3% for the high-school Class of 2006 (up from
our baseline of 35% for the Class of 2000), which is widely
believed to be attributable to improved academic readiness.
While we move close to the interim goal of a 52% completion rate
for the Class of 2009, the supports provided by the embedded
model should accelerate degree completion.
Updated enrollment, persistence and completion data is
expected to be available in early 2014.
Getting Through
Success Boston partners established finan-
cial aid liaisons on twenty campuses that
serve as the “go-to” resources for BPS grad-
uates and the transition coaches. Equally
important, seven local universities, including
the entire UMass system, established
common financial-aid terminology and devel-
oped a standardized insert letter that goes
into all award notices for BPS student-aid
packages. The letter helps students and
parents to decode the types of funding being
offered by each institution and enables them
to compare easily across institutions.
Equally successful is a pilot project started at UMass Boston
which has expanded to Bunker Hill and Roxbury community
colleges. Dubbed the “embedded model” by participants, UMass
Boston brought transition coaches to campus and placed them
in the Advising Center. Coaches regularly attended staff meetings
and trainings and developed joint programming with UMass staff.
This model enabled the coaches to serve more students, serve
those students more effectively, and connect them more easily to
academic and other support as well as co- and extra-curricular
activities.
The increased capacity provided by the embedded model
allowed all BPS graduates who enrolled in fall 2010 to have either
a nonprofit coach or a UMass advisor. Early evidence of this
collaboration has been promising:
23
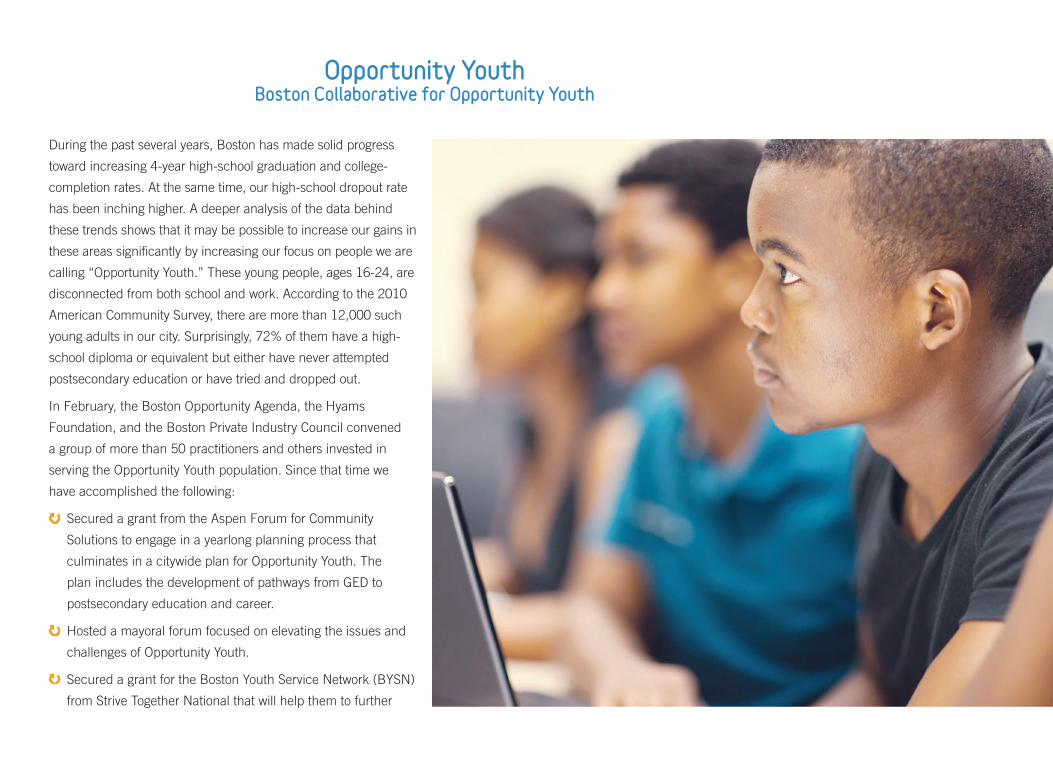
During the past several years, Boston has made solid progress
toward increasing 4-year high-school graduation and college-
completion rates. At the same time, our high-school dropout rate
has been inching higher. A deeper analysis of the data behind
these trends shows that it may be possible to increase our gains in
these areas significantly by increasing our focus on people we are
calling “Opportunity Youth.” These young people, ages 16-24, are
disconnected from both school and work. According to the 2010
American Community Survey, there are more than 12,000 such
young adults in our city. Surprisingly, 72% of them have a high-
school diploma or equivalent but either have never attempted
postsecondary education or have tried and dropped out.
In February, the Boston Opportunity Agenda, the Hyams
Foundation, and the Boston Private Industry Council convened
a group of more than 50 practitioners and others invested in
serving the Opportunity Youth population. Since that time we
have accomplished the following:
Secured a grant from the Aspen Forum for Community
Solutions to engage in a yearlong planning process that
culminates in a citywide plan for Opportunity Youth. The
plan includes the development of pathways from GED to
postsecondary education and career.
Hosted a mayoral forum focused on elevating the issues and
challenges of Opportunity Youth.
Secured a grant for the Boston Youth Service Network (BYSN)
from Strive Together National that will help them to further
Opportunity YouthBoston Collaborative for Opportunity Youth

24
Community Partners: ABCD Ostiguy High School, Ben Franklin
Institute of Technology, Bird Street Community Center, Black
Ministerial Alliance, Boston Asian Youth Essential Services,
Boston Day and Evening Academy, Boston Public Schools,
Boston Youth Service Network, B-PEACE for Jorge, Bridge Over
Troubled Waters, Brigham and Women’s Hospital, Bunker Hill
Community College, City of Boston, College Bound Dorchester,
Committee for Public Counsel Services, Commonwealth
Corporation, Department of Elementary and Secondary
Education, Diamond Educators, Dudley Street Neighborhood
Initiative, Executive Office of Health and Human Services,
ESAC, Executive Office of Public Safety, Freedom House, Health
Resources in Action, High Risk Youth Network, Higher Ground,
Hull Lifesaving Museum, Hyams Foundation, Hyde Square
Task Force, Inquillinos Boricuas en Acción, Jewish Vocational
Service, Local Initiative Support Collaborative, Mass Communities
Action Network, Massachusetts Department of Youth Services,
Mayor’s Office of Jobs and Community Services, Multicultural
Dropout Outreach Collaborative, New Profit, Partnership
Advancing Community Together, Rennie Center, Robert F.
Kennedy Children’s Action Corps, Roca, Road to Opportunity
Root Cause, Roxbury Community College, Roxbury Youthworks,
StreetSafe Boston, Sociedad Latina, State Street Corp., Teen
Empowerment, Teen Futures, Trinity Church Foundation, Urban
College of Boston, X-Cel Inc. Adult Education Services, Year Up,
Youth Build Boston, Youth Jobs Coalition, Youth on Board, Youth
Opportunity Unlimited, Youth Transitions Task Force and Youth
Violence Prevention Funder Learning Collaborative.
develop their network goals and outcomes as well as to estab-
lish mechanisms for tracking them. BYSN is a group of
community-based organizations working collaboratively to
provide alternative education and employment pathways for
youth at risk.
Invested in ways to include youth voices by funding BYSN
and DSNI to hire youth leaders who will participate in planning
meetings and conduct focus groups with Opportunity Youth.
This is to ensure that the final plan includes pathways that
resonate with young people.
Begun to collect the baseline data necessary to set future
goals across the Opportunity Youth pathways.
As we move forward, the
Collaborative intends to
bring together the current
programs in Boston that
serve Opportunity Youth
while at the same time
identifying gaps in current
services that must be filled
to create strong pathways
for young people. As a
part of the Aspen learning
community, we hope to
leverage not only the knowl-
edge and assets of Boston
but also the lessons being
learned across the country.

25
The Adult Basic Education (ABE) system that serves adult
learners has been focused for many years on preparing students
for a high school credential or English competence for everyday
life rather than for success in postsecondary education and
today’s workforce. Changing this focus requires the ABE system
to strengthen partnerships with the workforce development
and community college systems, leverage additional resources
and build its instructional and counseling capacities to improve
student transitions from ABE coursework to college and technical
certificate programs.
The Boston Opportunity Agenda created the Adult Opportunity
Network in collaboration with the Massachusetts Department of
Elementary and Secondary Education, the Mayor’s Office of Jobs
and Community Service and World Education, Inc. It aims to
dramatically increase the number of Boston adults who are ready
for college and career by creating a networked system of adult-
education providers offering a clear pathway from ABE course-
work to postsecondary education that results in a certificate or
degree with labor-market value. Launched in June of 2011, the
initial two networks are each comprised of three Boston-based
providers.
The Adult Opportunity Agenda defines college and career
readiness as a set of overlapping career, college, academic
and personal readiness skills and knowledge needed by adults
to enter and succeed in postsecondary education and career
pathways.
Adult Learners & Postsecondary AttainmentThe Adult Opportunity Network

26
The four areas of readiness are:
Academic Readiness—content knowledge, study skills and
strategies for college level reading, writing and algebra;
College Knowledge Readiness—the ability to navigate college
culture and admissions and financial aid processes;
Career Readiness—the ability to articulate a realistic goal that
is aligned with labor-market data and identify the steps along
one’s education and career pathway;
Personal Readiness—the capacity to anticipate challenges,
proactively secure supports and juggle multiple commitments
while managing stress and time.
Together, each funded Adult Opportunity Network has identi-
fied educational service gaps to be filled through a coordinated
continuum of shared services.
Community Partners: Jewish Vocational Service, United South
End Settlements, International Institute of Boston, El Centro del
Cardenal, Notre Dame Education Center and the YMCA Interna-
tional Education Center.
ResultsThe Adult Opportunity Network agencies worked with the
National College Transitions Network/World Education, Inc. to
create a uniform set of standards, competencies and curriculum
for use by ABE educators. Together they:
Developed and disseminated the Adult Opportunity Portfolio
Guide—a set of uniform lessons designed to promote student
awareness, aspirations and skill development in all four areas
of college and career readiness;
Provided training and coaching to ABE educators on
curriculum delivery;
Built multisite networks that include transition and
pre-transition to college courses;
Strengthened the college going culture of all six ABE
organizations as demonstrated by students increased college
going knowledge.

27
These generous investors have made the Boston Opportunity Agenda’s accomplishments possible
This report would not be possible without our data partners: the Boston Indicators Project and the
Boston Public Schools Department of Research, Assessment and Evaluation. We thank them for their
assistance in analyzing and reporting on the enclosed metrics. Any errors are of course our own.
Annie E. Casey Foundation
Paul & Edith Babson Foundation
The Beal Companies, LLP
Boston Children’s Hospital
Boston Public Health Commission
Boston Rising
Margaret A. Bush
Deloitte LLP
Eastern Charitable Foundation
Jessie B. Cox Charitable Trust
Ford Foundation
Frieze Family Foundation
Hamilton Company Charitable Foundation
The Hayden Foundation
Hildreth Stewart Fund
Nancy R. Karp
Klarman Family Foundation
W. K. Kellogg Foundation
Robert & Myra Kraft Family Foundation
Marjorie L. and James M. Lober Fund
Massachusetts Department of Early Education and Care
Herman & Frieda L. Miller Foundation
The National Summer Learning Association
Partners HealthCare
Harold Whitworth Pierce Charitable Trust
Charles S. and Zena A. Scimeca Charitable Fund
W. Clement and Jessie V. Stone Foundation
Matthew J. & Gilda F. Strazzula Foundation
Sunrise Fund
Sally Suttenfield Webb Fund
The Wallace Foundation
Charles A. Walsh, III

28
Honoring Mayor Thomas M. Menino
This report card is dedicated to Mayor Thomas M. Menino.
He ran for mayor 20 years ago pledging to reform the Boston
education system. At the time, the Boston Public Schools
was a failing system by every measure. As demonstrated by
this report card, tremendous change has happened during
that time for students and their families. Boston has full-
day kindergarten and pre-K, the majority of BPS students
have access to physical-education and arts programming,
community partners are engaged at every level to assist in
educating the whole child, and our citywide conversation about
college is not focused on whether Boston’s young people are
going to college, but rather on whether they are graduating.
This is a solid foundation on which to build. We thank him for
his tireless efforts on behalf of all of Boston’s learners.
The Mayor receives a signed jersey from students at Success Boston’s Fall 2013 Kickoff. The “70” reflects the Mayor’s goal of a 70 percent college-completion rate for BPS graduates.


www.bostonopportunityagenda.org


