Page 1
THE BRAHMANI BASIN
11
BIVARIATE ANALYSIS OF MORPHOMETRIC VARIABLES
• AVERAGE RELIEF AND OTHERS .
• ~ RELATIVE RELIEF AND OTHERS
• DISSECTION INDEX AND .· OTHERS
• AVERAGE SLOPE AND OTHERS
• ROUGHNESS INDEX AND OTHERS
• DRAINAGE DENSITY AND OTHERS
• STREAM FREQUENCY 8 OTHERS
• SUPERIMPOSED REGRESSION LINES
Page 2
THE BRAHMAN/ BASIN
1 1 BIVARIATE ANALYSIS OF
MORPHOMETRIC VARIABLES
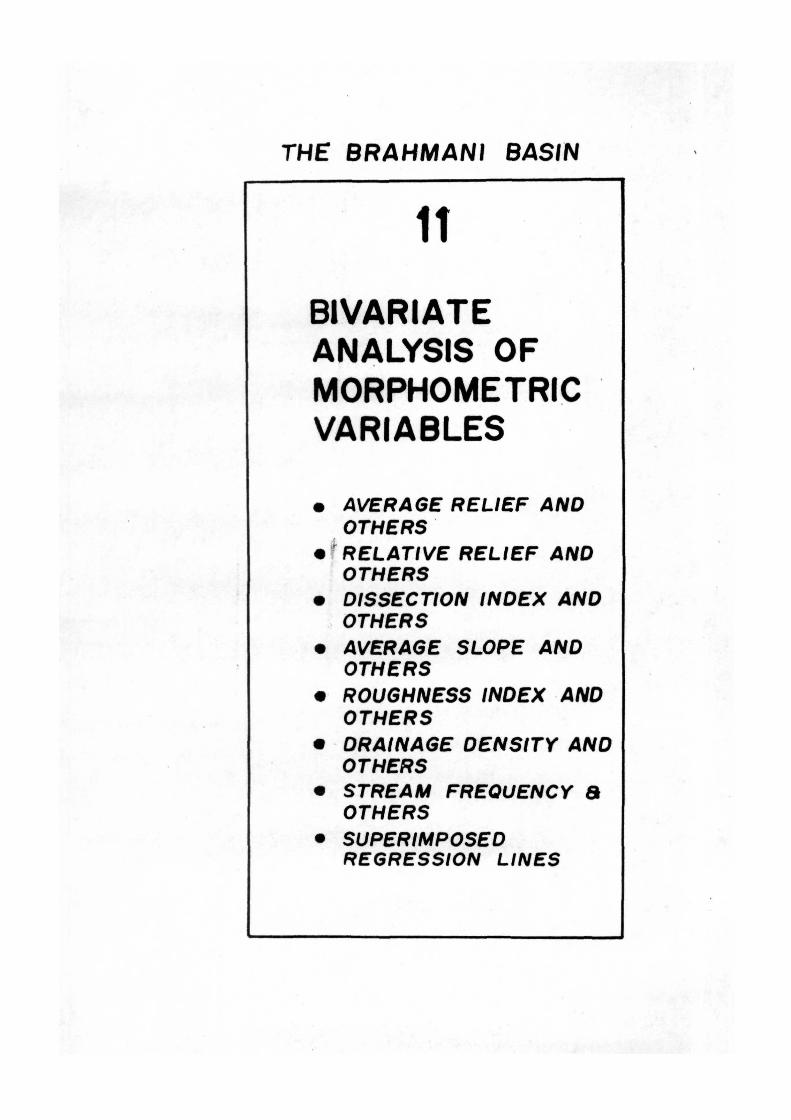
Bivariate relationships such as coefficient of correla-
tion (r), coefficient of determination (R 2 ) and linear,
regr.ession are used to show the nature and degree of relation
ship between two variables. It is noted that in any such study
correlation coefficient (r) can show a range from + 1 to- 1.
When correlation coefficient is+ l,the degree of relationship
between two variables is perfectly positive and when it is -1,
the . degree of correlation is considered to be perfectly nega
tive . When the correl ation coefficient is zero, there is no
relationship between two variables. Thus, higher positive and
negative values infer correspondingly higher positive or nega
tive correlations.
,
Page 3
TA
BL
E
11
.1
B IV
AR
J A
TE
RE
LA
TIO
NS
HIP
. B
ETW
EEN
A
VER
AG
E R
EL
IEF
AN
D
OTH
ER
MO
RPH
O'M
ET
RIC
V
AR
IAB
LE
S
SL
N
o.
1.
2.
3.
4.
5.
6.
7.
Rela
tio
nsh
ip
betw
een
Av
era
ge R
eli
ef
(X)
&
Rela
tiv
e R
eli
ef
(Y)
Av
era
ge R
eli
ef
(X)
&
Dis
secti
on
In
dex
(Y
)
Av
era
ae R
eli
ef
(X)
&
Drai
n~ge
Den
sit
y
(Y)
Av
erag
e R
eli
ef
(X)
&
Dra
inag
e T
ex
ture
(Y
)
Ave
rag
e R
eli
ef
(X)
&
Str
eam
Fre
qu
en
cy
(Y
)
Av
era
ge R
eli
ef
Av
era
ge s
lop
e
Av
era
ge R
eli
ef
Ro
ug
hn
ess
In
dex
(X)
&
( y)
(X)
&
Co
eff
icie
nt
of
co
rrela
tio
n
( r)
0.9
18
7
0.7
77
4
0.6
80
0
0.0
80
8
0.6
98
3
0.9
24
9
0.9
12
0
Co
eff
icie
nt
of
Dete
rmin
ati
on
R
2 (i
n%
)
84
.39
73
60
.43
71
46
.24
05
o. 6
53
0
48
.76
57
85
.54
70
83
.17
49
Lin
ear
Reg
ressio
n
Eq
uati
on
(Y
=
a
+
bX
)
-1
7.2
95
88
1
+
0.4
56
06
5
X
0.0
74
09
0 +
0
.00
10
99
X
O. 6
97
87
6 +
0
. 00
54
30
X
.
0.9
98
61
1
+
0.0
00
36
1
X
1.0
52
38
4 +
0
.01
69
10
X
0.9
88
15
5 +
0
.03
26
30
X
-... 1
.49
61
65
+
0.0
47
27
5
X
...,_
...
w
CD ~
Page 4
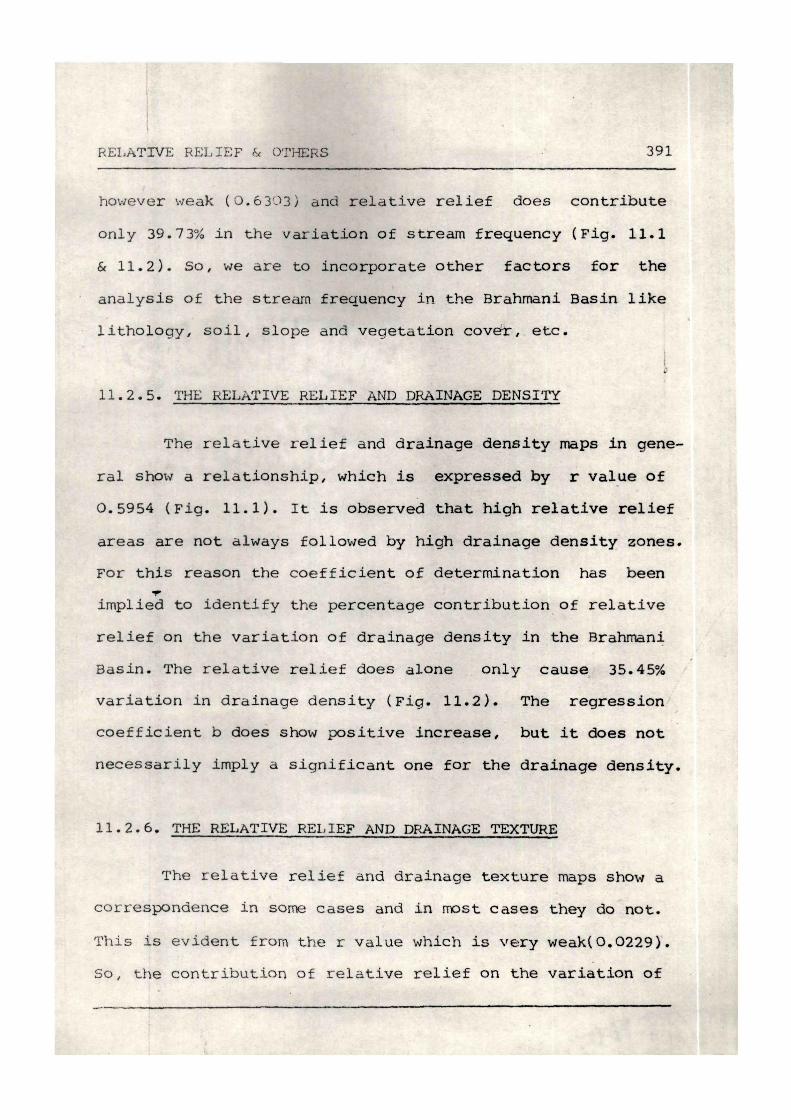
[ MA TR/X OF CORRELA T/ON CO-EFFIC/ENTi_]
l I
A.R. R.R. D. I. R.I. A.S. S . F . D. D. D. T.
A. R . ·9181 ·7774 ·9120 ·9249 ·6983 ·6800 ·0808
R. R. ·8942 ·9764 ·9890 ·6303 -5954 ·0229 q
D. I. ·8994 ·9134 ·6961 -6449 -·0761 I
j R . I. I -9853 -6563 '. 6133 -0156
A.S. ·6904 ·6514 -0387
S. F -9545 - ·1415
D. D. I -·1897
D .T -- .~ --
A .R . Average Relief A.S Average Slope
R.R. Relative Relief S.F Stream Frequency
D./ . Dissection Index D.O. Drainage Density
R . I. Roughness Index D.T. Drainage Texture
FIG . 11.1
Page 5
RELATIVE RELIEF & OTHERS 386
to other morphometric variables except drainage texture. The
high average relief areas are concurred by low drainage den-
sity, although there are some small patches where the areas
have higher zones of density. The high average relief zones
are mainly confined to the upper middle parts of the Basin
where dense forests protec t the surface from rain drops and
a ccount for the drainage density of l ow value.
The average relie f and drainage texture actually show
no re l ationship ( r = 0.0808 ). ! I
The morphometric variables like average slope, rough-
ness index, dissection index ,strea m frequency are positively
correlated with average relief a nd degree of correlation is
very high.
11. 2. RELATIONSHIP BE'I't-'IEEN RELATIVE RELIEF & OTHER VARIABLES
Like average relief with others
shows high positive correlation with
relative relief also I
other . ~
morphometric
variables except drainage texture (Fig. 11.1). Table (11.2)
gives a vivid picture how the rel a tive relief is related to
other morphometric v a riables.
Correlation coeffic ient can be kept into two distinct
groups according to their nature : (a) variables showing
strong correlations and (b) variables which are weakly
Page 6
TA
BL
E
11.2
BIV
AR
IAT
E
REL
AT
ION
SH
IP
BET
WEE
N
REL
AT
IVE
R
EL
IEF
A
ND
O
THER
M
OR
PHO
MET
RIC
VA
RIA
BL
ES
Sl.
N
o.
1.
2.
3.
4.
5.
6.
t I
t t
: Co
eff
icie
nt
of
: C
oeff
icie
nt
of
: R
ela
tio
nsh
ip
betw
een
C
orr
ela
tio
n.
: D
ete
rmin
ati
on
. ( r)
:
R 2
( in
%
) I
I
Rela
tiv
e R
eli
ef
(X)
&
0.8
94
2
79
.95
75
D
issecti
on
Ind
ex
(Y
)
Rela
ti
ve R
eli
ef
(X)
&
0.9
76
4
95
.3
35
4
Ro
ug
hn
ess
In
dex
( y)
Rela
tiv
e R
eli
ef
(X)
&
0.9
89
0
97
.81
25
A
vera
ge S
lop
e
(Y)
Rela
tiv
e R
eli
ef
(X)
&
0.6
303
3
9.7
27
8
Str
eam
F
req
ue
nc
y (Y
)
Rela
tiv
e R
eli
ef
(X)
&
o. 5
95
4
35
.45
01
D
rain
ag
e
Den
sity
(Y
)
Rela
tiv
e
Rel
ief
(X)
&
0.0
22
9
0.0
52
4 D
rain
ag
e T
ex
ture
(Y
)
Lin
ear
Reg
ress
ion
E
qu
ati
on
. (Y
=
a
+
bX
)
0.1
10
99
2
+
0.0
02
54
6
X
0.
35
58
15
+
0
.10
19
50
X
0.2
92
99
7
+
0.0
70
28
0
X
1.9
15
23
7 +
0
.0
30
74
3
X
0.9
85
24
8
+
0.
03
07
43
X
1.0
327
78
+
0
.00
02
07
X
c
w
(J)
-....J
Page 7
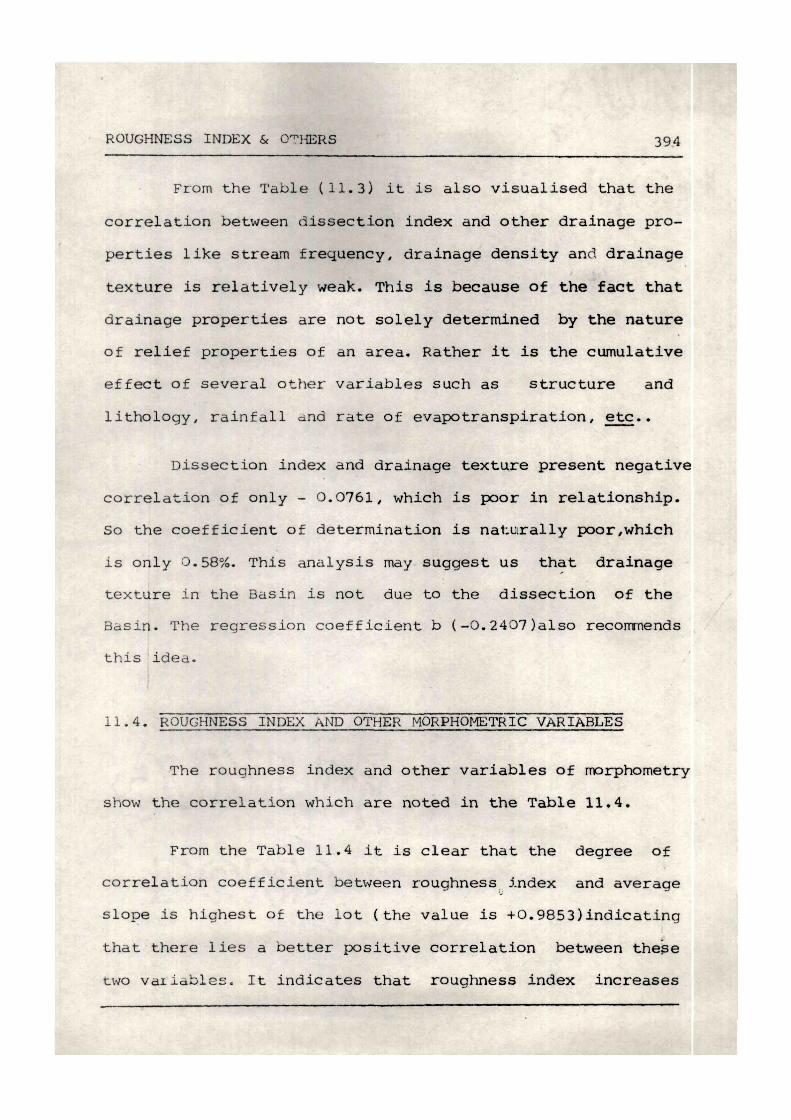
[MATRIX OF CO-EFFICIENT OF DETERMINATIONS I - -
A.R . R. R. . D. I. R.I. A.S. S . F. D.O . D. T.
I I A . R . 84·94 80·44 83·17 85·55 48·77 46·24 ·6530
R. R. 79·96 95·34 97·81 39·73 35·45 ·0524
D. /. 80·89 83·43 48·46 q41·59 ·5791
R.I. I I 97·09 43·07 37-61 ·0243 i
I I I
A.S . 47-66 42-43 ·1499
S . F . 91· 12 2·003
D. O. I 3·599
D. T. -- -
A.R . Average Relief A .S. Average Slope
R.R. Relative Relief S. F. Stream Frequency
0 . 1. Dissection Index D.O. Drainage Density
R . I . Roughness Index D.T. Drainage Texture
F IG. 11.2
Page 8
RELAT I VE RELIE F & OTHERS 38 8
correl a ted.
Of t hese var iabl es r o ughness i ndex, average slope and
dissection index are highly correlated with relative relief.
This type o f correla t i ons i s accepted as all of them are ~
rel ief properties. On the o ther hand drainage properties
such as dra inage densi t y , d r a inage texture . a nd stream fre-
~uency show a weak pesitive cor rel a t i ons with r e lative relief .
The weakest among these correlations is that - between relative
relie f a nd drainage t exture , the r value being + 0.0229
(Fig. 11 .1 ) . I n cas e o f drainage density and stream frequency,
the r val ues are+ 0 .5954 a nd+ 0.6303 respectively.
11 . 2 .1 . THE RELATIVE REL IEF AND DISSECTION INDEX
These variabl es show h igh positive correlation. The
high relative relief zones a r e occupi ed by high dissection
areas. The 79 . 96% v a r iati o n i n dissection index is explained
alone by r elative r el i e f (Fig. 11.2).The two maps of relative
rel ie f and dissec t i on index s how close relationship both
visua lly a nd statis tically .
11 . 2.2 . THE RELATIVE REL IE F AND ROUGHNESS INDEX
These a r e also h ighly correlated. The degree of
co r r e latio n is revea led by r value whi ch is 0 . 9764 . The
Page 9
RELATIVE RELIEF & OTHERS 390
roughness of the Brahmani Basin is controlled by relative
relief by 95.34%. The regression coefficient (b) of the ana-
lysis shows that \vith increase in relative relief the rough-
ness v alues do increase.
11.2. 3. THE RELATIVE REL I EF AND AVERAGE SLOPE
Slope is the i nherent property of landscape.It is the
major parameter which a c t ual ly controls the landscape fea-
ture~ . The a verage slope shows a highest correlation of
0 . 98~0 with relative rel i e f in the Brahmani Basin (Fig. 11.1).
The coefficien t o f detGrmina tion reveals that relative relief
causes t he v a r iation of 97 . 8 1% in average slope (Fig. 11.2).
The regression coef fici e nt b shows very significant increase
in average slope with i ncrease in relative relief.
11.2 .4. THE RELATIVE REL I EF AND STREAM FREQUENCY
The relative relief and stream frequency maps show
tha t appa rently high relative relief zones are . covered by
high stream f r equency. Though high stream frequency values
f all in the high relative relief zones, these values lie at
the periphery of the h igh relative relief boundary.The proba-
b l e cause is the existence of ephemeral rills which develop
on the high relative relief zones and integrate into streams
at the base of these slopes. The correlation between them is
Page 10
RELATIVE RELIEF & OTHERS 391
however weak ( 0 .6 303) and relative relief does contribute
only 39.73% in the variation of stream frequency (Fig. 11.1
& 11.2). So, we are to incorporate other factors for the
analys is of the stream frequency in the Brahmani Basin like
lithology, soil, slope and vegetation cover, etc.
11.2 . 5 . THE RELATIVE RELIEF AND DRAINAGE DENSITY
The relative relief and drainage density maps in gene-
ral show a relationship, which is expressed by r value of
0.5954 (Fig. 11.1). It is observed that high relative relief
areas are not always foll owed by high drainage density zones.
For this reason the coefficient of determination has been ~
implied to identify the percentage contribution of relative
relief on the variation of drainage density in the Brahmani
Basin . The relative relief does alone only cause 35.45%
variation in drainage density (Fig . 11.2). The regression
coefficient b does show positive increase, but it does not
necessarily imply a significant one for the drainage density.
11.2.6 . THE RELATIVE RELIEF AND DRAINAGE TEXTURE
The relative relief and drainage texture maps show a
correspondence in some cases and in rrost cases they do not.
This is evident from the r value which is ve~ry weak(0.0229}.
so, the contribution of relative relief on the variation of
Page 11
DI SSECTION INDEX & OTHERS ~92 •'
drainage texture is onli 0.05%. The drainage texture, there-
fore , doe s not depend on relative relief as revealed from the
analys is of r, R2 and b .
11 . 3 . RELATI ONSHIP BETWEEN DISSECTION INDEX & OTHER VARIABLES
The dissection ind ex is also considered as an indepen-
dent v ariable likel y t o h a ve a fair degree of cor relation with
other v ariables. The c orrel a tion coefficient, coefficient of
determina t i on a nd regress ion have been calculated from the
da ta extracted from topographical sheet (1:50,000) of the
Brahmani Basin a nd are tabulated (Table 11.3).
It is v is ua lized f rom the table that dissection index
i s stro ngly corre l a~ed with relief properties,~·· average
slope (+ 0 . 9134) a nd r oughness index (+ 0.8994).There exists
s t r ong positive corr el a tion between dissection index and
average slope and dissection index and rou9hness index. This
is because relativ e re l ie f is a common element for dissection
index , a verage s lope an d r oughness index. Again if the ampli-
tude of relie f tends to i nc r ease with a consta nt distance the
values o f aver age slope a nd roughness ind ex wil l a lso increase. I
Thus lt may be i nfe rred t hat all these v a r iabl e s a re closely
linked up with each o ther i n a concealed t ie of relative
relief . So i t is commonly found that i n t h e highly dissected
parts o f the Basin, a ll t hese variab les are higher.
Page 12
' I '------
TA
BL
E
11
.3
BIV
AR
IAT
E
RE
LA
TIO
NS
HIP
B
ETW
EEN
D
ISS
EC
TIO
N
IND
EX
A
ND
O
THER
M
OR
PHO
MET
RIC
V
AR
IAB
LE
S
Sl.
N
o.
1.
2.
3.
4.
5.
Rela
tio
nsh
ip
betw
een
Dis
secti
on
In
dex
(X
) &
R
ou
gh
ness
In
dex
( y)
Dis
sec
tio
n
Ind
ex
(X
) &
A
vera
ge
Slo
pe
Dis
secti
on
In
dex
(X
) &
S
tream
F
req
uen
cy
(Y
)
Dis
secti
on
In
dex
(X
) &
D
rain
ag
e D
en
sit
y
(Y)
Dis
secti
on
In
dex
(X
) &
D
rain
ag
e T
ex
ture
Co
eff
icj.en
t o
f C
orr
ela
tio
n
(r
)
0.8
99
4
o. 9
13
4
0.6
96
1
0.6
44
9
-0
.07
61
Co
eff
icie
nt
of
Dete
rmin
ati
on
R
2 (i
n%
)
80
.89
20
83
.42
99
48
.45
55
41
.58
96
oo. 5
79
1
i::
Lin
ear
Reg
ress
ion
Eq
uati
on
(
Y
= a
+
bX
)
-2
.67
62
+
32
.98
14
81
-1
.80
92
59
+
2
2.7
96
29
6
0.6
04
81
5
+
11.9
25
92
5
0.5
86
66
7
+
03
.66
66
66
X
X
X
X
1.0
88
14
8 +
(-
.24
07
41
) X
w
\0
w
~
Page 13
ROUGHNESS INDEX & o~HERS 394
From the Table ( 11 .3) it i s a lso v i sua lised that the
correl ation bet ween d issection index and other drainage pro
perties like s t ream f req uency, drainage density and drainage
textur e i s r e l a t i v e l y weak. This is because of the fact that
drainage properti es are not solely determined by the nature
of rel ief properties of a n a rea. Rather it is the cumulative
effect of several other var iables such as structure a nd
lithology, rainfall dnd ra t e o f evapotranspirati on, etc ••
Dissection index a nd drai nage texture present negative
correlation of o nly- 0 .0761, which is poor in relationship.
so the coefficient of determination is na1~utrally poor ,which
is only 0 .58%. This analysis may suggest us that drainage
texture in the Basin is not due t o the dissection of the
Basin . The regression coefficient b (-0 .2 407) a lso recommends
this ·idea.
11.4 . ROUGHNESS INDEX AND OTHER MORPHOMETRIC VARIABLES
The roughness index a nd other variables of morphometry
show the correlation which are noted in the Table 11.4.
From the Table 11 . 4 it is clear that the degree o f
correlation coefficient betwe e n r oughness ,, j_ndex and ave r age
slope is highest of the lot (the val ue is +0 .9853)indicating
that · there lies a better positi v e correlation between the~e
two vaziables . It i ndic a t es that roughness index increases
Page 14
TA
BL
E
11
.4
BIV
AR
IAT
E
RE
LA
TIO
NS
HIP
B
ETW
EE
N R
OU
GH
NES
S IN
DE
X A
ND
O
THER
V
AR
IAB
LE
S
Sl
. N
o.
1.
2.
3.
4.
Rela
tio
nsh
ip
betw
een
Ro
ugh
ness
In
dex
(X
) &
A
vera
ge S
lop
e (
Y)
Ro
ug
hn
ess
In
dex
(X
} &
S
tream
Fre
qu
en
cy
(Y)
Ro
ug
hn
ess
In
dex
(
X}
&
Dra
inag
e D
en
sity
(Y
)
Ro
ug
hn
ess
Ind
ex
(X
) &
D
rain
ag
e T
extu
re
Co
rrela
tio
n
of
Co
eff
icie
nt
( r)
0.9
85
3
0.6
56
3
0.6
13
3
0.0
15
6
Co
eff
icie
nt
of
Dete
rmin
a 1:
.io
n
R2
(in
%)
97
.08
56
4 3
. 07
30
37
.61
37
00
.02
43
Lin
ear
Re
gre
ss
ion
E
qu
atio
n
( Y
=
a
+
bX
)
0.
12
13
19
+
0
.67
05
82
X
-1.7
88
29
1
+
0.
30
65
74
X
0.9
49
71
0
+
0.0
94
46
2
X
1.0
34
71
0 +
0
.00
13
49
X
e
w
1.0
lJ1
Page 15
AVERAGE SLOPE & OTHERS 396
degree of slope . The coefficient of determination for the
case is obviously high (97.09%).
The table also reveals that the correlation between
roughness index a nd drainage properties such as drainage den
sity and stream frequency is medium. They are + 0.6563 and
+ o. 6193 respectively. But roughness inde>: and drainage tex-
t ure are ve ry weakly corre l ated. These two variables present
corre l at ion of only + 0 . ~1 56 which is very poor in relation-
ship. so the coeff icien t o f determination (0.0243%) is also
very :weak . I
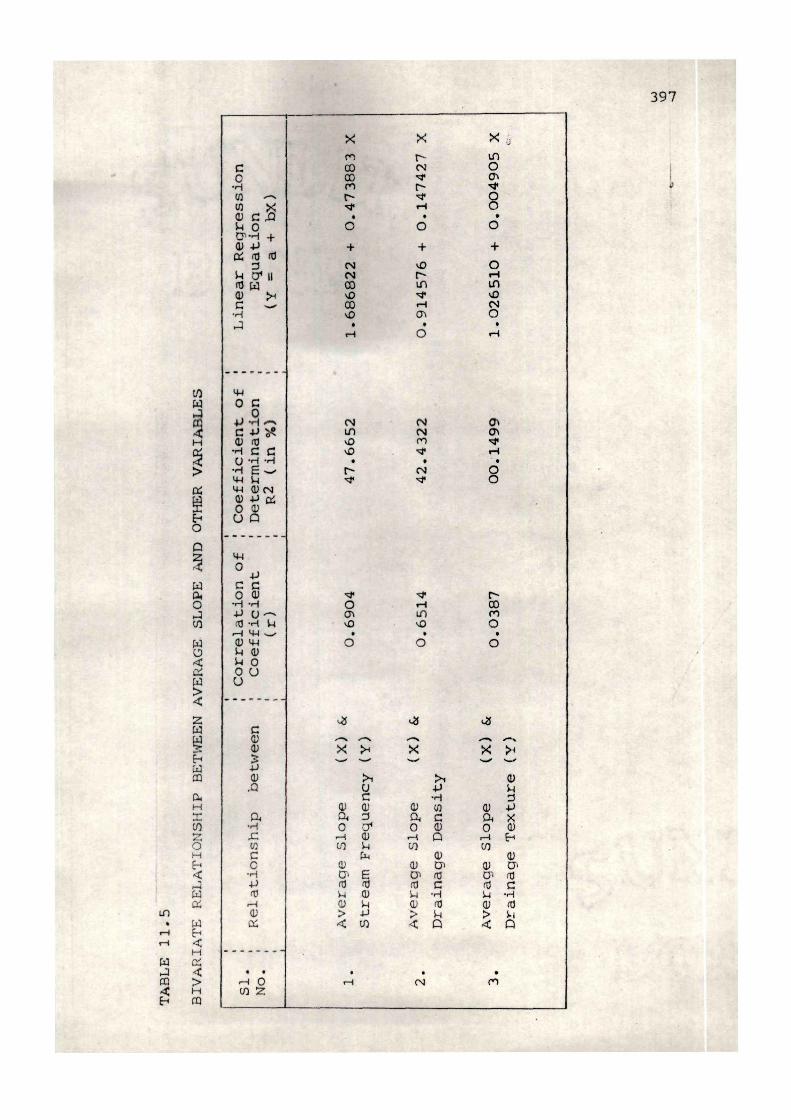
11.5. AVERAGE SLOPE AND OTHER MORPHOMETRIC VARIABLES
Coefficient of correlation {r), determination (R 2 ) and
r egression coefficient values between average slope and other
mo rphometric variables have been calculated and furnished in
t h e Table 11.5.
Among the variables the I relationship between avera~e
slope and stream frequency is highest denoting + 0.6904 and
the de.termination is 47.67% for the variation of stream fre-
quency accounted by average slope. There is weak positive
correlation (+0.0387) between average slope and drainage
texture . correlation coefficient of the variables average
s l ope and drainage density is medium (+0.6514). The average
slope contributes 42 . 43% for the variation of drainage density.
Page 16
TA
BL
E
11
.5
BIV
AR
IAT
E
RE
LA
TIO
NS
HIP
B
ETW
EEN
A
VE
RA
GE
S
LO
PE
A
ND
O
THER
V
AR
IAB
LE
S
Sl.
N
o.
1.
2.
3.
Rela
tio
nsh
ip
betw
ee
n
Av
era
ge S
lop
e
(X)
&
Str
eam
F
req
uen
cy
(Y
)
Av
era
ge
Slo
pe
(X)
&
Dra
inag
e D
en
sity
Av
era
ge
Slo
pe
(X)
&
DY
ain
ag
e T
ex
ture
(Y
)
Co
rrela
tio
n o
f C
oeff
icie
nt
( r)
0.6
90
4
0.6
51
4
0.0
38
7
Co
eff
icie
nt
of
Dete
rmin
ati
on
R
2 (in
%)
47
.66
52
42
.43
22
00
.14
99
Lin
ear
Reg
ressio
n
Eq
uati
on
(Y
=
a
+
bX
)
1.6
86
82
2
+
0.4
73
88
3 X
0.9
14
57
6
+
0.1
47
42
7
X
1.0
26
51
0 +
0
.00
49
05
X
<".
:--
t,--
Page 17
STREAM FREQUENCY & OTHERS 398
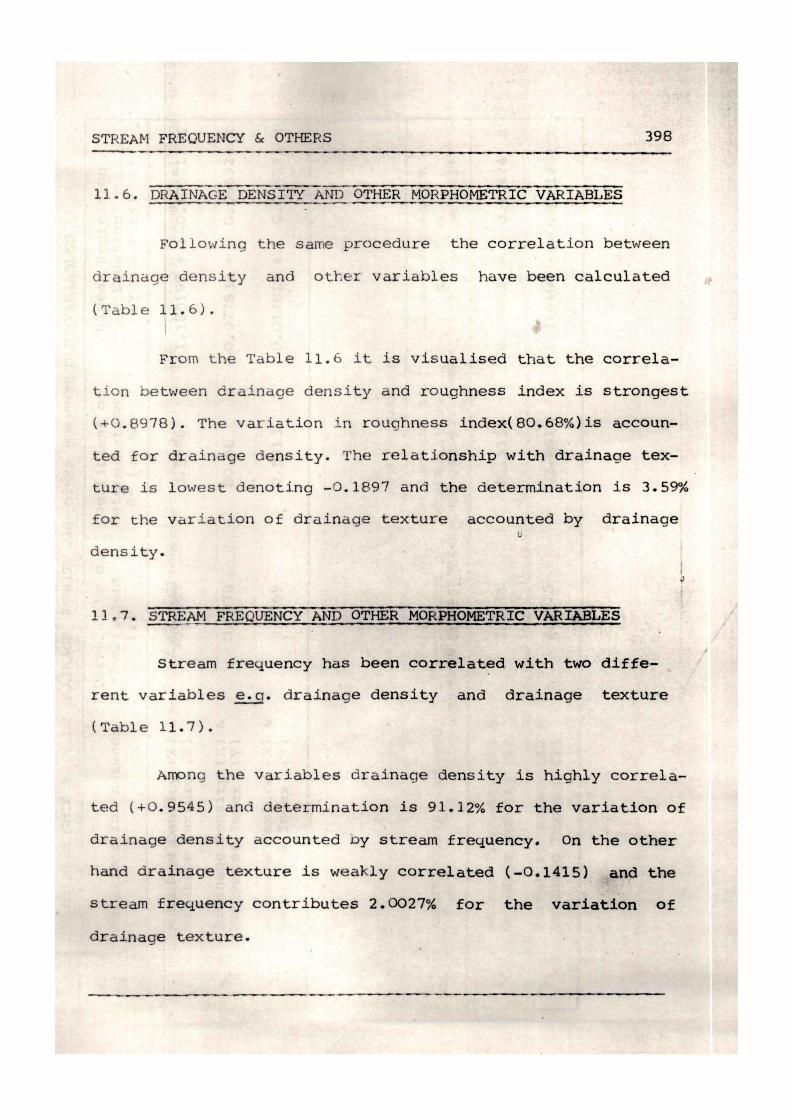
11.6. DRAINAGE DENSITY AND OTHER MORPHOMETRIC VARIABLES
Following the same procedure the correlation between
drainage density and otter variables have been calculated
(Table 11.6). I
From the Table 11.6 it is visualised tha t the correla-
tion between drainage density a nd roughness index is strongest
(+0.8978) . The variation i n roughness index(80.68%)is accoun-
ted for drainage density. The relationship with drainage tex-
ture is lowest denoting - 0 .1897 and the determination is 3.5~~
for the Vdriation of drainage texture accounted by drainage
density .
11.7. STREAM FREQUENCY AND OTHER MORPHOMETRIC VAR~ES
Stream frequency has been correlated with two diffe
rent variables ~· drainage density and drainage texture
(Table 11.7).
I
I ~
Among the variables drainage density is highly correla
ted (+0.9545) and determination is 91.12% for the variation of
drainage density a ccounted ny stream frequency. On the other
hand drainage texture is weakly correlated (-0.1415) and the
stream frequency contributes 2.0027% for the variation of
drainage texture.
Page 18
SUPERIMPOSED REGRESSION LINES OF
MORPHOMETRIC VARIABLES
6 5 4 3 2 6 1!5 ·6
>- X w w oc >- u 0 ~ ~ :z: ul 'Z X w ~ (/) ~ a.. - w ><4 :Z:4 oB . oro .. 20 - ~ · 4 w w w .J ~ 0 [ !/)
!/)
w (/)
w w w (!) (!) ~ (!) z <t
~2 ~4 :5 rEI ~2 6 <t <i oc w ~ oc oc f- > 0
0 0 0 !/) <t 0::
0 0 0 0 50 100 150 200 RELATIVE RELIEF (Me t res)
2 8
7 6 5 4 3 2
I· I· 6
>- lL. w >- u X w oc !:: z w :J ~ w 0 w ~ (/)
~ w z oc X/ z, 04 0..4 -4 5 0 7 w w w 0 1- 0 oc ..J
!/) u.. (/) z llJ (/) 0 (!) w w
1-<t ~ (!) z 'Z·5 ~2 <t2 :x:2
u
Ci oc (!) W· l oc w ::> (/)
oc 1- > 0 (/)
0 (/) <t oc 0
0 0 0 0 0 0 100 200
AVERAGE RELIEF (M et res)
FIG . 11.3
Page 19
SUPURIMPOSED REGRESSION LINES OF
3 r 3.- 12r 12°;:...._----------------:;.,...------::::o""i /
""'~ I 4 w 0::2 :::> IX w I-
3 2 >-
W CL ~8, w :::> 0 0 .J w U)
~I ~I ~4
'
k / / ,......-- 4 _, 7 ::;:> w w I fE z z ~ - :::i w w '
~ ~ ~ I ;; t . I l ol ol o~ ~ 1 ~ 1 ~ 20
ROUGHNESS INDEX
3
-5 4 3 12
>- >-t-2 ~4 U) w w z :::> CL
UJ 0 0 0 w _J
a::
~ I ~ 1.1...
w [w UJ • U)
C!>l ~I ~2 e!>4 ~I ~ z ~ ~ :X:
- <i w a:: (!)
~ a:: a:: UJ :::>
~ 0 1- > 0 U) ~ a::
• 0 0 0 ().I
DISSECTION INDEX
FIG. 11.4
MORPHOMETRIC VARIABLES
3-
3
w (!)
~, z <i a:: 0
3r 3
2 I 1 I ' w a:: ~2 X w I-
UJ
~ c: 0
~,~!'I/' , 2 q
~ a:: 0
ol oL 0
3
I >-<..> z UJ4 :::> 0 UJ a:: 1.1...
0
I l l I 2 4 6
STREAM FREQUENCY
6
AVERAGE SLOPE
Page 20
I
SUPERIIMPOSED REGRESSI ON LINES 402
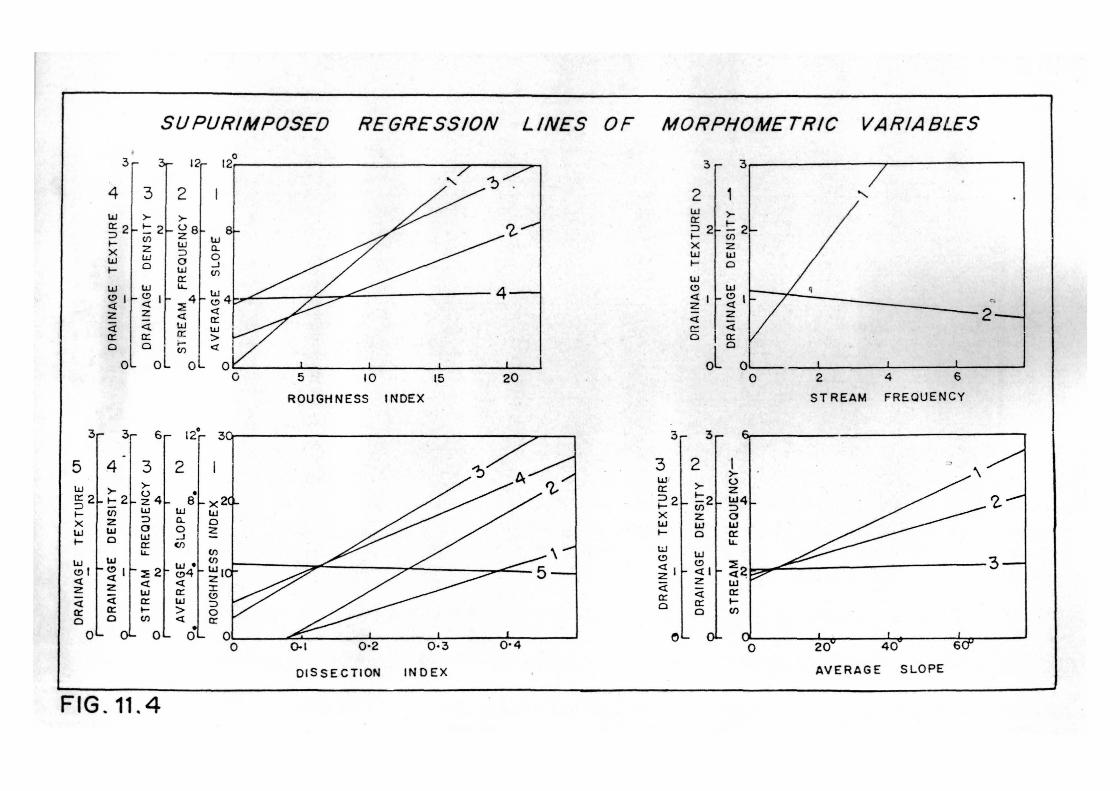
- -----11.8 . SUPER I MPOSED REGRESS I ON L INES
The s uperimposed r eg r e ssio n l ines of morphometr i c
variables of t he Brahmani Basin on average r e lief (Fig. 11.3)
reveal a v e ry i nterestin g f act with increase in average re-
l ief all the variables show increasing trend values except
drainage texture . Th e drainage texture shows almost parallel ·'
t rend with increas e i n a verage relief. Same is the case among
regress ion lines on relative relief, roughness index,average
slope, etc •.
. The superimposed regr e ssion lines of variables on
dissection index and stream f req ue ncy a lso p r esent some inte-
r esting phenomena . With i ncrease in the dissection index and
stream frequenc y , al l t he morphometric variables show increa-
sing tre nd value s excep t drainage texture. The texture shows ,
negativ e trend with inc rea se in dissection index and stream
f requency (Fig . 11.4).


![ASSESSMENT OF CLASS OF WATER IN RIVER BRAHMANI, …ijesr.org/admin/upload_journal/journal_Bhagirathi 2se18sr.pdf · branches[4]. The left branch is called Brahmani main and the right](https://static.documents.pub/doc/80x56/5e696200917b5c67994fd5f8/assessment-of-class-of-water-in-river-brahmani-ijesrorgadminuploadjournaljournalbhagirathi.jpg)