26
The Brazilian Economy and the Pharmaceutical Market São Paulo, April 9th, 2010
The Brazilian Economy and the Pharmaceutical Market
São Paulo, April 9th, 2010
2
The Brazilian Economy

3
% per year
Source: IBGE and Ministry of Economy
GDP- Annual Growth Rate

4
Source: IMF
IMF Projected GDP growth
% Grouth

5
% contribution to GDP growth
* ProjectedSource: Central Bank of Brazil
Net Domestic and Foreign Demand
6
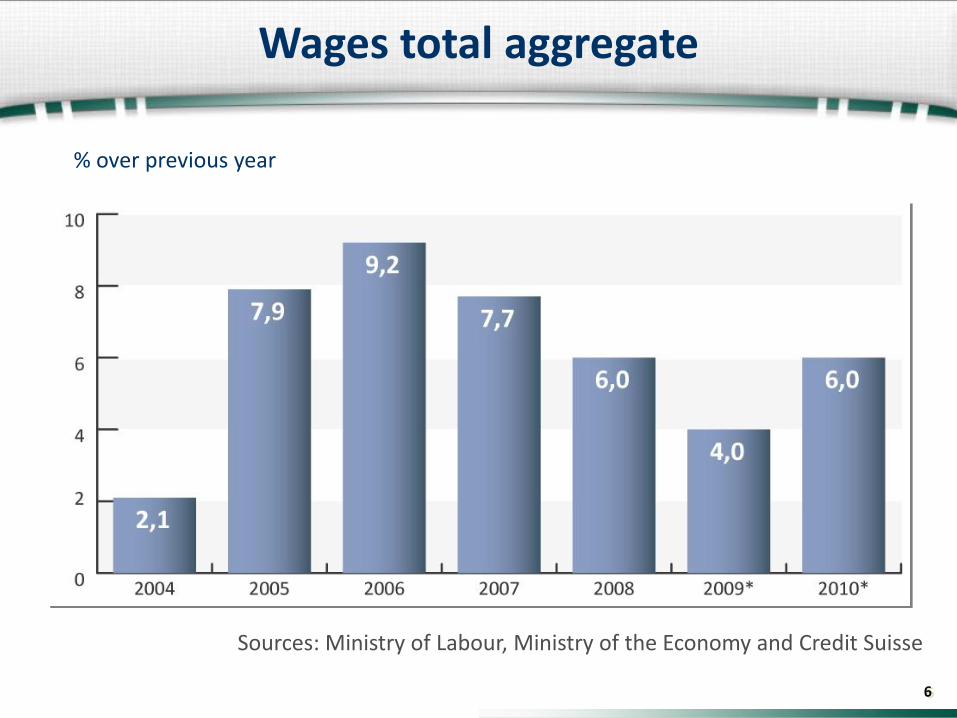
% over previous year
Sources: Ministry of Labour, Ministry of the Economy and Credit Suisse
Wages total aggregate

7
USD billions
* Up to 01/15/2010Source: Central Bank of Brazil
Foreign Exchange Reserves

8
% of GDP
Source: Central Bank of Brazil
Net Foreign Debt
9
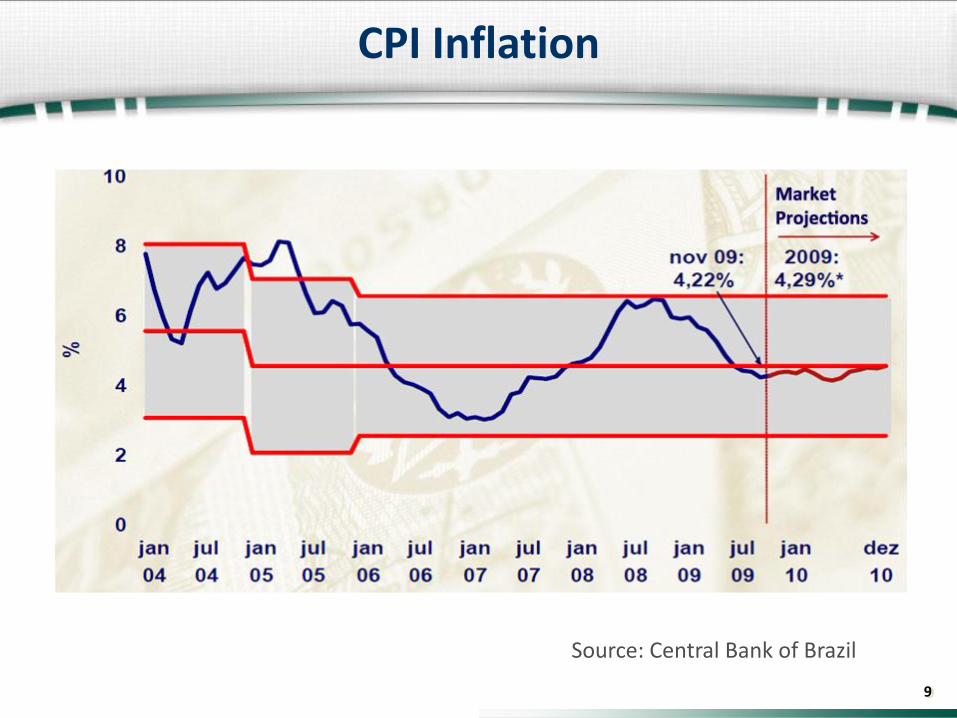
Source: Central Bank of Brazil
CPI Inflation

10
The Brazilian Pharmaceutical Market and the World Market

11
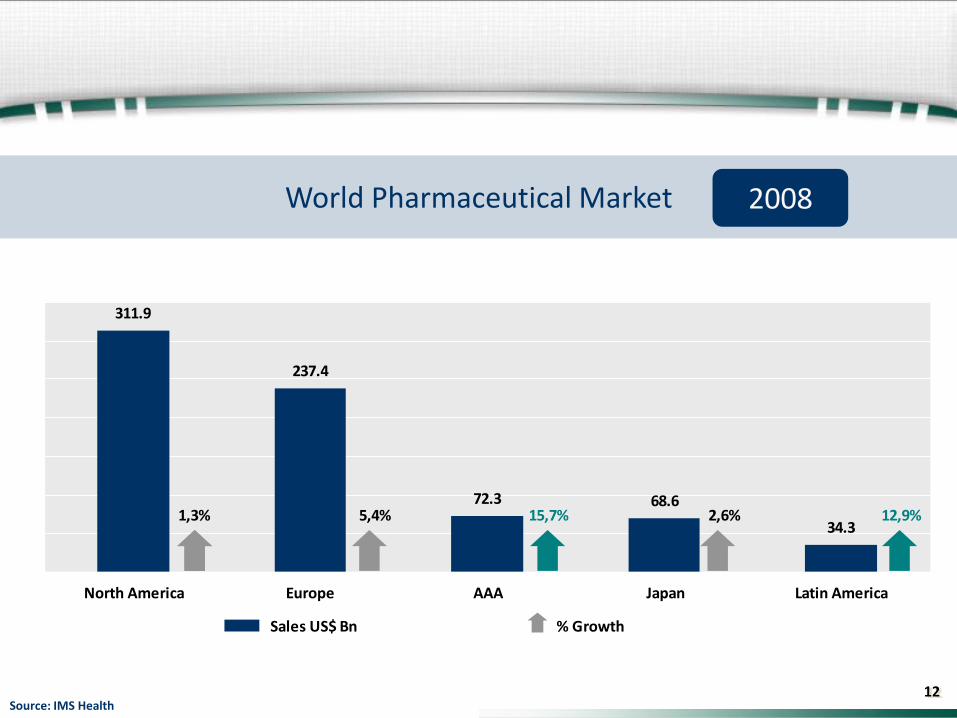
Worldwide $ 724.5 100.0 % 4.4 7.0
North America 311.9 43.1 1.3 6.9
Europe 237.4 32.8 5.4 6.5
AAA 72.3 10.0 15.7 13.2
Japan 68.6 9.5 2.6 2.9
Latin America 34.3 4.7 12.9 12.7
10 Key Markets 564.0 77.8 3.1 6.1
Audited Market 2008 % Growth (Const US$)
MAT Dec 2008 Sales US$bn % Mkt Shr 2008CAGR 03-07
Growth in Asia and Latin America leads global market to an audited $725bn in 2008
Source: IMS Health
12
34.3
68.672.3
237.4
311.9
North America Europe AAA Japan Latin America
1,3% 5,4% 15,7% 2,6% 12,9%
Sales US$ Bn % Growth
World Pharmaceutical Market 2008
Source: IMS Health

13
Generic
19,221,5
23,6
26,4
30,2
2005 2006 2007 2008 2009
Brazilian Pharmaceutical Market 2009
53%
9%
50%
11%
48%
12%
45%
14%
42%
15%
38% 39% 40% 41% 43%
14,5%
2009
Source: IMS Health
R$billion
Pharma
Generic
OTC
14
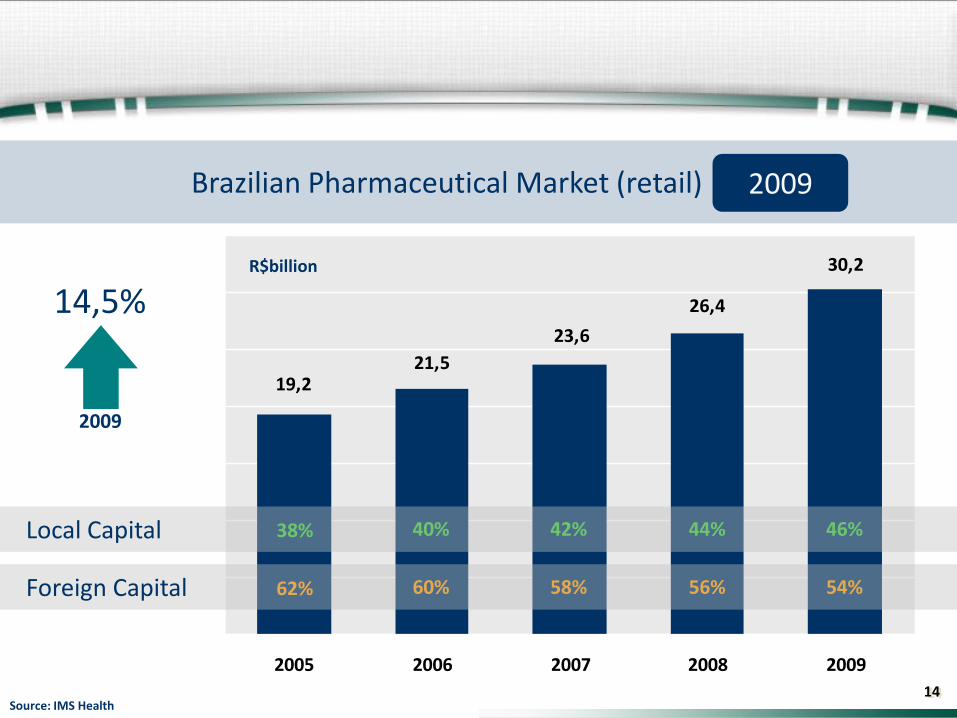
19,221,5
23,6
26,4
30,2
2005 2006 2007 2008 2009
Brazilian Pharmaceutical Market (retail) 2009
62%
38%
60%
40%
58%
42%
56%
44%
54%
46%
14,5%
2009
Source: IMS Health
R$billion
Foreign Capital
Local Capital

15
Share of sales 2008US$ 34 billion
Brazil 36 %
Mexico 25 %
Venezuela 13 %
Argentina 9 %
Colombia 5 %
Others 12 %
LATIN AMERICA
Source: IMS Health

16
Country US$bn 2008% Mkt 2008
% Growth Const US$
2008
CAGR 03-07
US $ 291.0 40.2 1.1 6.8
Japan 68.6 9.5 2.6 2.9
Germany 41.1 5.7 4.9 3.5
China 19.6 2.7 26.7 21.6
Brazil 12.5 1.7 12.1 12.1
Turkey 10.5 1.5 11.1 21.9
Korea 9.6 1.3 11.2 12.6
Mexico 8.5 1.2 1.8 8.6
India 7.7 1.1 10.2 13.8
Russian Fed. 6.2 0.9 10.4 20.9
Three largest markets p/ comparison
Pharmerging maintain mostly strong growth
Source: IMS Health

17
RK US$ Ind.
09 08 Corporations Million Growth Evol.
Total 12.360 11,6%
1 1 EMS CORP 953 11,8% 100,2
2 2 SANOFI-AVENTIS 769 11,4% 99,8
3 3 ACHE 701 14,5% 102,6
4 4 MEDLEY 696 15,1% 103,1
5 5 NOVARTIS CORP 552 5,4% 94,4
6 7 EUROFARMA 489 26,6% 113,4
7 6 BAYER CORP 483 1,8% 91,2
8 8 PFIZER 374 0,6% 90,1
9 9 JOHNSON+JOHNSON CO 348 3,4% 92,6
10 10 GSK CORP 316 6,8% 95,7
Nota 1: Retail Only Stable
Accelerated Growth
Steep Drop
> 95 e < 105
> 105
< 95Source: IMS / PMB – MAT ABRIL 2009
Brazil - Top 10 - Pharma Companies

18
RK US$ Ind.
09 08 Corporations Million Growth Evol.
Total 12.360 11,6%
11 13 ASTRAZENECA BRASIL 297 24,4% 111,5
12 11 BOEHRINGER ING 276 2,4% 91,7
13 12 NYCOMED PHARMA LTD 269 5,1% 94,2
14 14 ROCHE 248 5,1% 94,2
15 16 BIOLAB 246 9,9% 98,5
16 15 D M IND. FTCA 240 1,6% 91,0
17 17 MANTECORP I Q FARM 236 6,0% 95,0
18 18 SCHERING PLOUGH 235 10,5% 99,0
19 24 SANDOZ DO BRASIL 228 43,4% 128,5
20 19 MERCK A. G. 216 12,1% 100,5
Source: IMS / PMB – MAT ABRIL 2009
Brazil - Top 11 – 20 Pharma Companies
Stable
Accelerated Growth
Steep Drop
> 95 e < 105
> 105
< 95
Nota 1: Retail Only
19
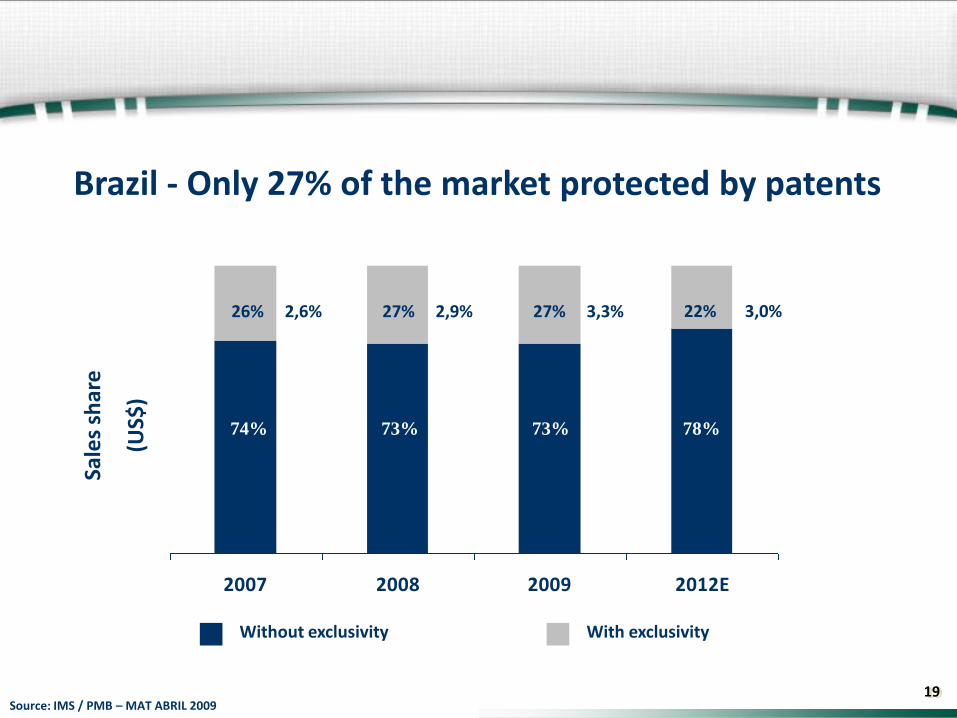
2007 2008 2009 2012E
Sale
s sh
are
(US$
)
26% 27% 27% 22%2,6% 2,9% 3,3% 3,0%
74% 73% 73% 78%
Without exclusivity With exclusivity
Source: IMS / PMB – MAT ABRIL 2009
Brazil - Only 27% of the market protected by patents
20
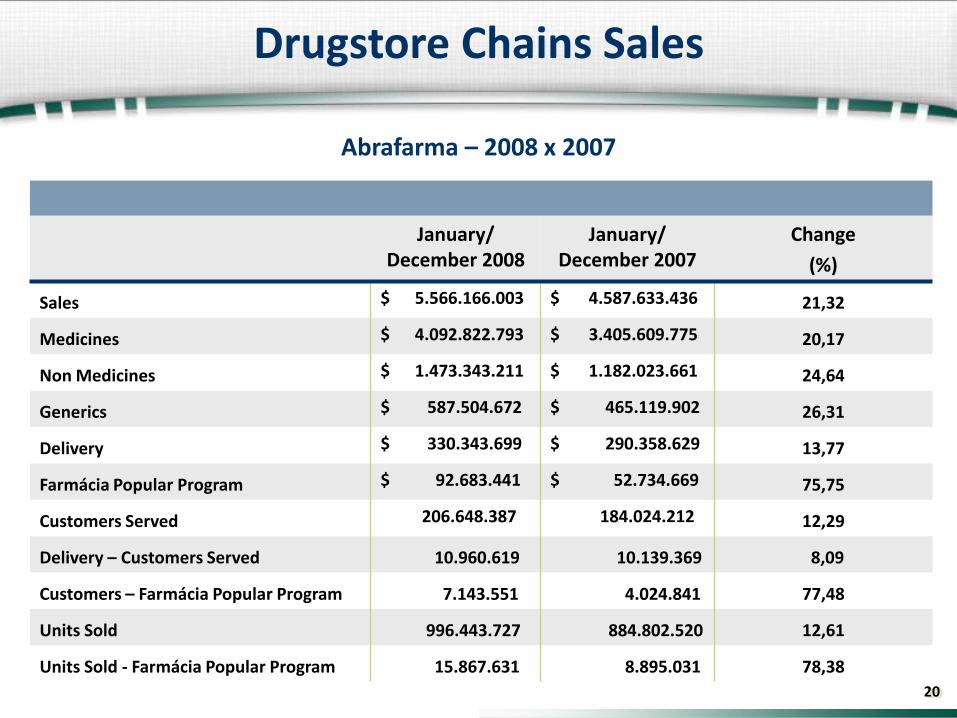
January/ December 2008
January/ December 2007
Change
(%)
Sales $ 5.566.166.003 $ 4.587.633.436 21,32
Medicines $ 4.092.822.793 $ 3.405.609.775 20,17
Non Medicines $ 1.473.343.211 $ 1.182.023.661 24,64
Generics $ 587.504.672 $ 465.119.902 26,31
Delivery $ 330.343.699 $ 290.358.629 13,77
Farmácia Popular Program $ 92.683.441 $ 52.734.669 75,75
Customers Served 206.648.387 184.024.212 12,29
Delivery – Customers Served 10.960.619 10.139.369 8,09
Customers – Farmácia Popular Program 7.143.551 4.024.841 77,48
Units Sold 996.443.727 884.802.520 12,61
Units Sold - Farmácia Popular Program 15.867.631 8.895.031 78,38
Abrafarma – 2008 x 2007
Drugstore Chains Sales
21
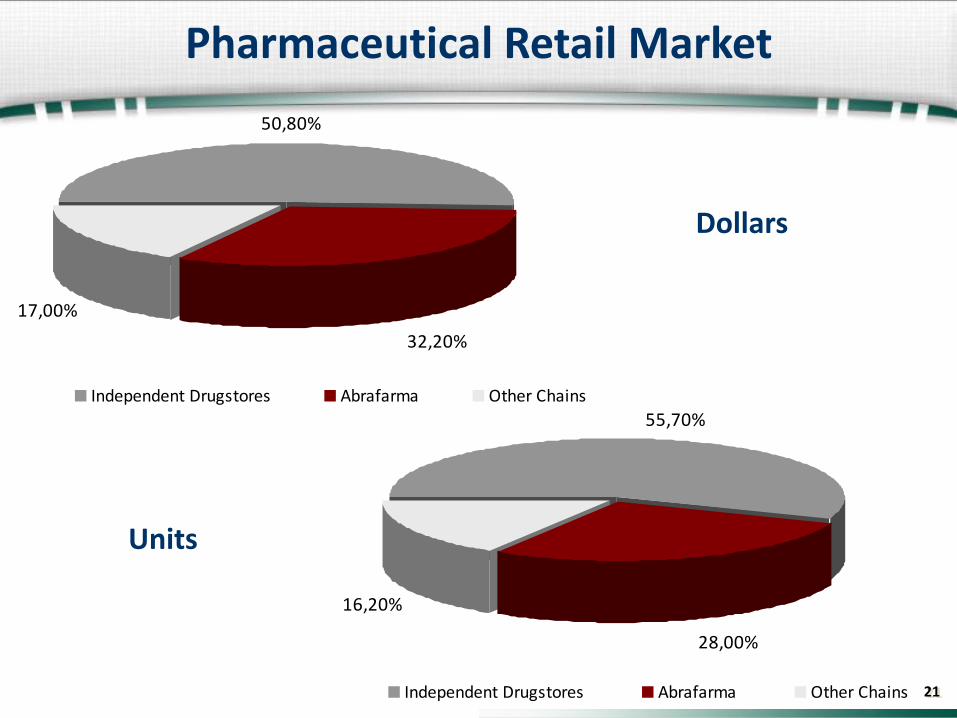
50,80%
32,20%
17,00%
Independent Drugstores Abrafarma Other Chains
55,70%
28,00%
16,20%
Independent Drugstores Abrafarma Other Chains
Dollars
Units
Pharmaceutical Retail Market
22
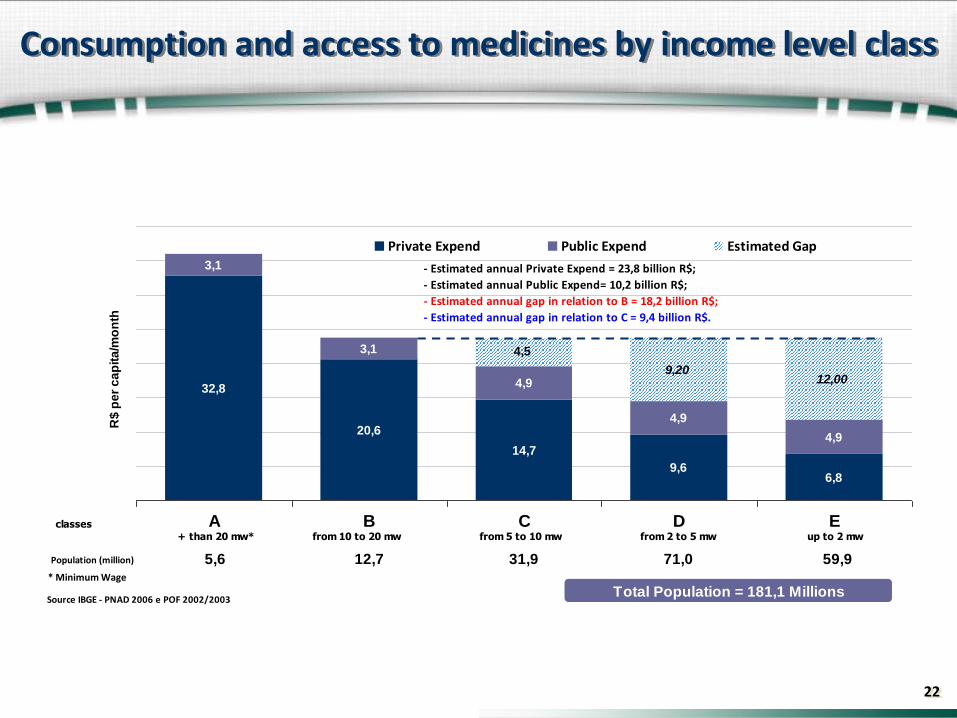
Consumption and access to medicines by income level class
32,8
20,6
14,7
9,66,8
3,1
3,1
4,9
4,9
9,2012,004,9
A B C D E
R$
pe
r c
ap
ita
/mo
nth
Private Expend Public Expend Estimated Gap
Source IBGE - PNAD 2006 e POF 2002/2003
4,5
- Estimated annual Private Expend = 23,8 billion R$;
- Estimated annual Public Expend= 10,2 billion R$;
- Estimated annual gap in relation to B = 18,2 billion R$;
- Estimated annual gap in relation to C = 9,4 billion R$.
+ than 20 mw* from 10 to 20 mw from 5 to 10 mw from 2 to 5 mw up to 2 mw
5,6 12,7 71,0 59,9Population (million)
classes
31,9
Total Population = 181,1 Millions* Minimum Wage
23
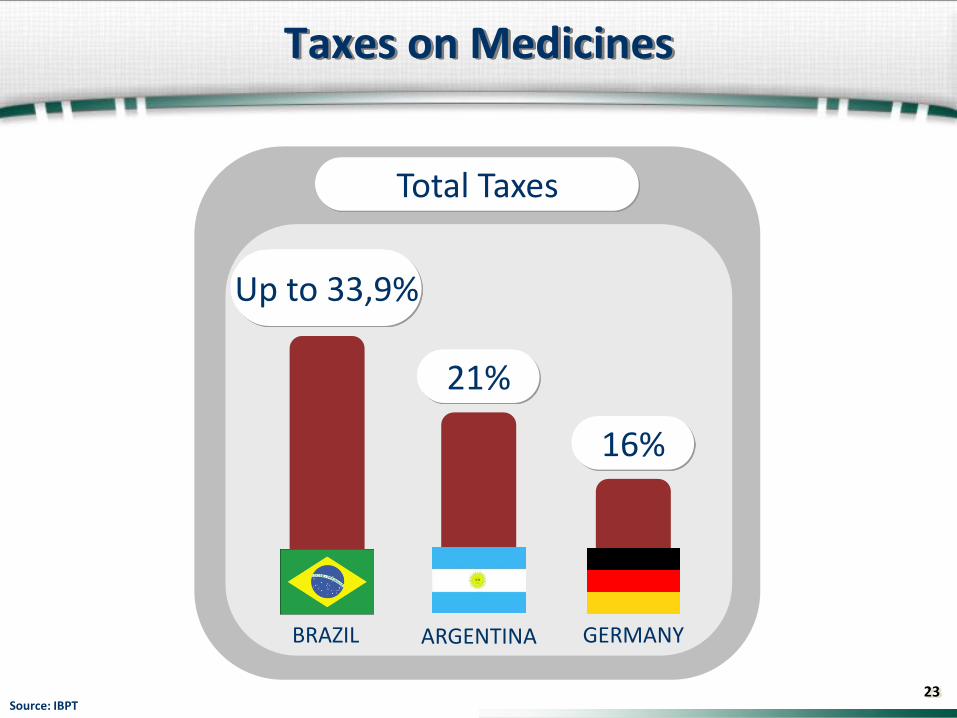
Taxes on Medicines
Source: IBPT
Total Taxes
Up to 33,9%
21%
16%
BRAZIL ARGENTINA GERMANY

24
Countries without Taxes on Medicines
Taxes
Source: IBPT
Exempt
UNITED STATES MEXICO
COLOMBIA UNITED KINGDOM
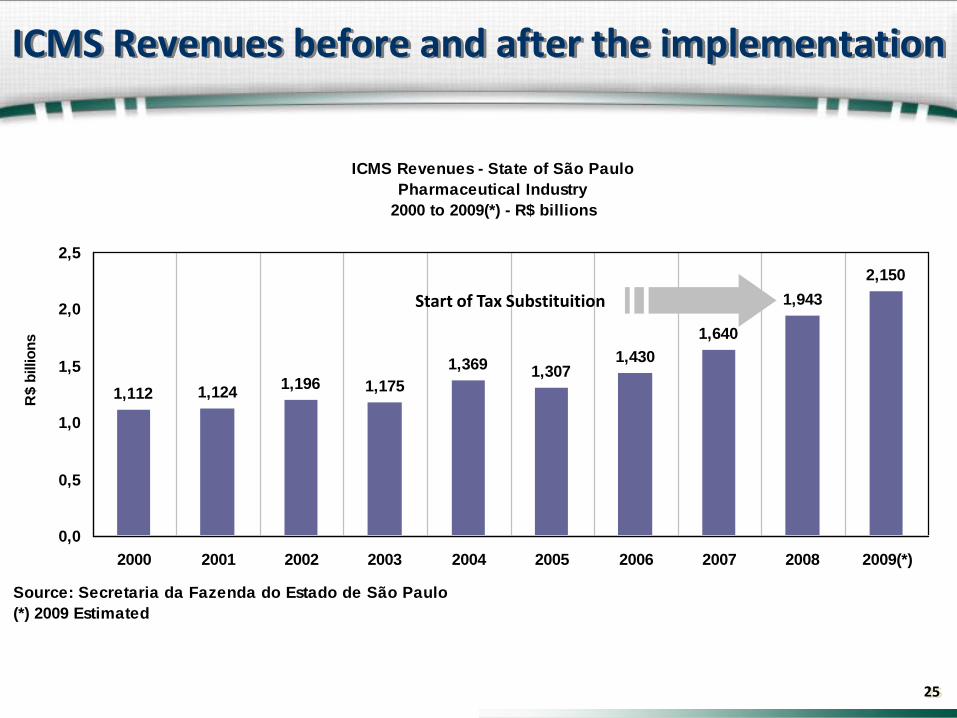
25
ICMS Revenues - State of São Paulo
Pharmaceutical Industry
2000 to 2009(*) - R$ billions
1,112 1,1241,196 1,175
1,369 1,3071,430
1,640
1,943
2,150
0,0
0,5
1,0
1,5
2,0
2,5
2000 2001 2002 2003 2004 2005 2006 2007 2008 2009(*)
Source: Secretaria da Fazenda do Estado de São Paulo
(*) 2009 Estimated
R$
billio
ns
ICMS Revenues before and after the implementation
Start of Tax Substituition

26
12,6%
13,1%
14,0%
15,1%
15,3%
15,5%
17,5%
20,6%
21,8%
28,2%
28,3%
30,3%
30,4%
30,4%
31,8%
32,3%
33,9%
0% 5% 10% 15% 20% 25% 30% 35% 40%
Milk
Animal Medicines
Flour
Salt
Rice and Beans
Books
Cow Meat
Eggs
Fruits
Powder Milk
Boats/Airplanes
Theater/Movie
Toilet paper
Sugar
Tractor
Restaurant Lunch/Dinner
Human Medicines
Source: IBPT
Taxes on selected items


