36
The Breeding Bird Survey 2016 incorporating the Waterways Breeding Bird Survey The population trends of the UK’s breeding birds

The Breeding Bird Survey 2016 incorporating the Waterways Breeding Bird Survey
The population trends of the UK’s breeding birds
2
British Trust for Ornithology The Nunnery Thetford Norfolk IP24 2PU www.bto.org
Joint Nature Conservation Committee Monkstone House City Road Peterborough PE1 1JY www.jncc.defra.gov.uk
Royal Society for the Protection of Birds The Lodge Sandy Bedfordshire SG19 2DL www.rspb.org.uk
City Road Peterborough PE1 1JY
acknowledgemenTsWe are grateful to the following people for
their help in 2016: Neil Calbrade, Ben Darvill,
Mark Hammond, David Jarrett, Kelvin Jones,
Andrew Joys, Maria Knight, John Marchant,
Andy Musgrove, Steve Pritchard, Kate Risely,
Anna Robinson, William Skellorn, Dave Turvey,
Justin Walker, Shane Wolsey and Karen Wright.
Many people have contributed to the scheme’s
development and organisation, including
Nicholas Aebischer, Mandy Andrews, Mark
Avery, Stephen Baillie, Ian Bainbridge, Helen
Baker, Richard Bashford, Jessa Battersby, George
Boobyer, Andy Brown, Steve Buckland, Nick
Carter, Steve Carter, Dan Chamberlain, Rachel
Coombes, Humphrey Crick, Sarah Davis, Iain
Downie, Sarah Eglington, Steve Freeman, Colin
Galbraith, David Gibbons, John Goss-Custard,
Rhys Green, Jeremy Greenwood, Richard Gregory,
of BBS-Online, and to the BTO Information
Systems Team who have continued to develop
the system and provide technical support.
The founder sponsors of the 1998 WBBS pilot
year were Thames Water, British Waterways,
Severn Trent, Hyder (Welsh Water) and Anglian
Water. Since then surveys have been funded
by the Environment Agency and BTO, and
sponsored by Severn Trent, Anglian Water and
by Essex & Suffolk Water.
Report production was by Sarah
Harris and we are very grateful to
John Marchant for proofreading
the report. The report was printed
by Swallowtail, Norwich, using
paper from responsible sources.
Rob Keen, Ian McLean, Mike Meharg, Richard
Minter, Ian Mitchell, David Morris, Dorian Moss,
Nancy Ockendon, Will Peach, Ken Perry, Mike
Raven, Brenda Read, Warren Read, Angela
Rickard, Sandra Sparkes, Ken Smith, David Stroud,
Pierre Tellier, Chris Thaxter, Richard Thewlis, Derek
Thomas, Mike Toms, Lawrence Way, Richard
Weyl, Andy Wilson (BBS logo) and Lucy Wright.
We acknowledge the support of the Northern
Ireland Environment Agency who funded
professional fi eldworkers to cover 52 squares
in Northern Ireland. Natural England, Scottish
Natural Heritage and Forestry Commission
Scotland have contributed to additional surveys
on Upland BBS and Scottish Woodland BBS
squares in previous years. We are very grateful
to the RSPB for funding the initial development
THE BBS TEAM AT THE BTOSarah Harris is the BBS National Organiser and fi rst point of contact for BBS or WBBS queries. Sarah is responsible for the day-to-day running of these surveys, liaising with BTO Regional Organisers and volunteers, maintaining the databases, promoting the schemes, and producing the annual report.
Dario Massimino, Research Ecologist in the Population Ecology and Modelling Team, worked on the bird population trends for 2016 and Stuart Newson assisted in the production and development of the mammal population trends. David Noble is the Principal Ecologist for Monitoring, responsible for strategic developments in biodiversity monitoring. Dawn Balmer is Head of Surveys, which includes both BBS and WBBS, among other surveys, Simon Gillings oversees the BBS research programme and James Pearce-Higgins is the Director of Science at BTO.
Contact the BBS National Organiser: Sarah Harris, british Trust for ornithologyemail: [email protected], Tel: 01842 750050
THE BBS PARTNERSHIPTh e Breeding Bird Survey (BBS), now incorporating the Waterways Breeding Bird Survey (WBBS), is run by the British Trust for Ornithology (BTO) and is funded jointly by BTO, the Joint Nature Conservation Committee (JNCC) (on behalf of the statutory nature conservation bodies: Natural England, Natural Resources Wales, Scottish Natural Heritage and Department of Agriculture, Environment and Rural Aff airs, Northern Ireland), and the Royal Society for the Protection of Birds (RSPB).
Th e members of the BBS Steering Committee in 2016 were James Pearce-Higgins (Chair, BTO), Deborah Procter (JNCC), Mark Eaton (RSPB), David Noble (BTO), Simon Gillings (BTO) and Dawn Balmer (BTO).
THE 2016 BBS REPORT
The 2016 BBS Report
co
Ver
imag
e –
nu
ThaT
ch
: jo
hn
flo
wer
daY
ONLINE RESOURCES...Further information, including population trend graphs, can be found at www.bto.org/bbs, and a full species-by-species discussion of these results, and those from other surveys, can be found on the BirdTrends website at www.bto.org/birdtrends.
This report can be downloaded from www.bto.org/bbs/results/bbsreport.htm.

3
INSIDE...This is the twenty-second annual report of the BTO/JNCC/RSPB Breeding Bird Survey (BBS), containing the population trends of widespread UK bird species during the period 1994–2016.
The BBS is the main scheme for monitoring the population changes of the UK’s common breeding birds, providing an important indicator of the health of the countryside. BBS trends are produced each year for over 110 species, and the results are used widely to set priorities and inform conservation action.
The Breeding Bird Survey Partnership has now adopted the Waterways Breeding Bird Survey, previously funded by BTO, with financial support from the Environment Agency, and this report will now incorporate news, trends and research from this waterways-specific monitoring scheme.
purp
le h
ero
n: j
aso
n w
ard
, cu
rlew
& k
ing
fish
er: n
eil
cal
br
ade
ciTaTion
Harris, S.J., Massimino, D., Gillings, S., Eaton, M.A., Noble, D.G., Balmer, D.E., Procter, D. & Pearce-Higgins, J.W. 2017. The Breeding Bird Survey 2016. BTO Research Report 700 British Trust for Ornithology, Thetford.
Published by the British Trust for Ornithology, the Joint Nature Conservation Committee and the Royal Society for the Protection of Birds, August 2017.
© British Trust for Ornithology, Joint Nature Conservation Committee and Royal Society for the Protection of Birds, 2017.
BTO Research Report 700ISSN 1368-9932ISBN 978-1-908581-79-2
The 2016 BBS Report
The BBS year...................................................................................................................................................................................................4
Sightings and coverage in 2016........................................................6
More than just trendy graphs.......................................................................8
Conservation actions for migratory landbirds in Africa................................................................................................................................................10
Minding the gaps..........................................................................................................................................................12
Interpreting the results................................................................................................................13
UK trends...................................................................................................................................................................................................................14
England trends.............................................................................................................................................................................16
Scotland trends..........................................................................................................................................................................18
Wales trends................................................................................................................................................................................................20
Northern Ireland trends.......................................................................................................22
BBS on the Channel Islands and Isle of Man........................................................................................................................................................ ................23
English region trends............................................................................................................................24
Background and methods.........................................................................................26
Published and forthcoming papers....................27
Mammal monitoring and trends......................................28
Red and Roe Deer in Scotland......................................................30
WBBS news and methods.........................................................................................32
WBBS trends.........................................................................................................................................................................................34
Special thanks......................................................................................................................back cover
pg32pg30
pg12pg6

4
By Sarah Harris, BBS National Organiser, BTO
Record-breaking coverage, website developments for both BBS Online and the Wider Countryside Butterfl y Survey, and latest developments, a new BBS Twitter account and Upland Rover scheme.
The BBS year
The BBS year
WIDER COUNTRYSIDE BUTTERFLY SURVEYDuring the lifetime of the Wider Countryside Butterfl y Survey (WCBS), 757 BBS squares have been revisited during July and August to carry out this survey. Th is equates to 45% of all squares contributing to the WCBS. Butterfl y Conservation volunteers cover the remaining 55% of WCBS sites.
A total of 771 squares were surveyed in 2016, 39% of which were BBS squares. Th is was a slight decrease in coverage from 2015, with BBS coverage down by 3%. During the core recording period in 2016, 43 species were recorded from 1,288 visits to 644 squares. Large White, Small White and Speckled Wood were more widespread than in 2015, and Peacock, Small Copper and Silver-washed Fritillary were less widespread than in any other year of the WCBS.
Meadow Brown, Marbled White and Brimstone were more widespread in 2016 than in any other year of the WCBS.
A new data-entry system on the UK Butterfl y Monitoring Scheme (UKBMS) website was introduced for the WCBS in the summer of 2016. Both the old and the new system were available for data entry.
From 2017 onwards, only the new system will be available – for which BBS volunteers need to register with the UKBMS website. For guidance on how to register and use this new system for the fi rst time, email [email protected].
Wider Countryside Butterfl y Survey Annual Newsletter 2016 Season and the UKBMS report www.bto.org/volunteer-surveys/bbs/bbs-publications/other-reports
FIND OUT MORE...
In 2016, the Breeding Bird Survey achieved the highest coverage to date with 3,837 squares covered, only possible due to the dedication of 2,796 skilled volunteers. Thanks to all involved.
Coverage of Upland Adjacent squares increased to 113. Th ese are squares adjacent to those considered ‘upland’ squares, enabling volunteers to cover a second upland square during the visit to their ‘core’ BBS square, and thus collect more data during visits to often very challenging squares. Th e aim of Upland Adjacent squares is to increase coverage in under-represented, remote areas of our uplands. See more on our research into further increasing the coverage in remote areas on page 12.
mea
do
w b
row
n: m
oss
TaY
lor,
mar
ble
d w
hiT
e: jo
hn
flo
wer
daY
, bri
msT
on
e: a
mY
lew
is
Th e proportion of squares for which Detection Type (whether a bird was fi rst detected by song, call or visually) was recorded also increased, to 77% of all squares covered, as did the number of squares for which data were entered online, to 96%. However, all data submissions – online or paper – are gratefully received.
Th e main purpose of the BBS is the calculation of population trends for common and widespread species in the UK. In 2016 it was possible to calculate trends for 111 bird species and nine mammal species. Trends are calculated at a UK, country and English-region scale where the sample size allows. As a result, a staggering 848 bird trends and 53 mammal trends have been calculated for these species at the various scales.

5The BBS year
LOOKING FORWARDWith increases in the number of species for which trends can be calculated, calculations participation and data for the survey’s ‘optional extras’ such as Detection Type and Mammal Recording, the future of the BBS is looking very positive. Of course, it is always important to think how we can improve the survey further, whether by increasing coverage in remote areas or improving the time taken to turn the data received into meaningful outputs.
Upland RoversUpland Rovers, mentioned on page 12, is part of future plans to increase coverage in remote areas across the UK. Upland Rovers enables volunteers to undertake one-off visits to a selection of the more remote BBS squares. Th e standard BBS methodology requires two visits to each square annually, over four weeks apart; however, we have taken the diffi cult decision to permit single one-off visits to remote upland squares on the basis that some information is better than none, just for these carefully selected squares. If you live near or are holidaying in a remote area of the UK, why not look online to view a map of available Upland Rover squares? Find out more at www.bto.org/upland-rovers.
Data entry and reporting In order to achieve earlier reporting, all data should be entered by the end of August and ideally as soon after the survey takes place as possible – when fi eld notes are fresh in the mind. Earlier data submission would allow the publication of this report to be brought forward, ideally to a date before the beginning of the following year’s survey period. Th is would also allow data to be provided to Bird Clubs and local Bird Reports earlier than is currently possible. Guidance and video tutorials covering BBS Online can be found here: www.bto.org/volunteer-surveys/bbs/taking-part/bbs-online.
TweetingTh e Breeding Bird Survey now has a Twitter account, @BBS_birds, enabling volunteers to share news from their Breeding Bird Survey, Wider Countryside Butterfl y Survey or Waterways Breeding Bird Survey visits, along with sharing news and research from the survey itself.
Below are some news and images from a selection of BBS squares from visits in the 2017 season, with more to follow in the 2017 BBS report.

6
RECORDBREAKING!3,837squares weresurveyedin 2016
Sightings and coverage in 2016
Sightings and coverage
2016 was a record-breaking year for coverage, with an increase of 90 squares from 2015, and 78 squares more than the all-time record achieved in 2007. What an achievement! And with greater coverage come more robust trends and the possibility of reporting on a greater suite of species. Thank you to all who contributed to the survey.
SIGHTINGSTwo hundred and twenty species were recorded during the Breeding Bird Survey in 2016. Woodpigeon, Blackbird, Rook and Wren were the most numerous, with singles of Montagu’s Harrier, Purple Heron, Glaucous Gull and Curlew Sandpiper, amongst others, providing a little diversity and excitement.
The number of species on squares varies hugely, with 55 squares containing five species or fewer through to a square
co
mm
on
sc
oTe
r: s
ebas
Tian
baV
ersT
oc
k
England Scotland Wales Northern Ireland
Channel Islands
Isle of Man UK total
1994 1,175 245 123 25 1 4 1,573
1995 1,342 286 121 17 1 4 1,771
1996 1,436 309 117 65 7 4 1,938
1997 1,676 315 139 75 6 6 2,217
1998 1,715 313 194 85 7 6 2,320
1999 1,796 275 223 95 7 5 2,401
2000 1,766 246 215 83 7 3 2,320
2001* 539 78 22 0 7 646
2002 1,652 231 215 97 7 3 2,205
2003 1,740 255 214 109 7 4 2,329
2004 1,887 274 255 102 11 6 2,535
2005 2,182 305 271 120 13 3 2,894
2006 2,574 336 272 108 19 5 3,314
2007 2,822 517 269 131 16 4 3,759
2008 2,558 436 242 121 15 1 3,373
2009 2,571 431 235 116 17 3,370
2010 2,569 331 247 115 16 3,278
2011 2,539 359 224 110 15 3,247
2012 2,672 383 274 117 21 4 3,471
2013 2,730 474 332 127 26 3,689
2014 2,735 482 339 120 27 3,703
2015 2,826 476 341 78 23 3 3,747
2016 2,864 489 333 126 23 2 3,837
Table 1 Number of BBS squares surveyed
on the banks of the River Mersey hosting an impressive 67 species. Whether for a species which we can report population trends or not, all records are valuable and are used in a variety of ways for research and analysis.
COLONY DATAColony data were collected on 457 squares in 2016, and included data for 19 colonial nesting species.
RECORDING DETECTION TYPESome more good news was that the number of squares for which ‘Detection Type’ is recorded (whereby it is noted whether a bird is first detected by song, call or visually) continued to increase. When first introduced in 2014, surveyors in 67% of squares reported this information, this rose to 74% in 2015 and then to 77% in 2016! It is hoped these data will allow for more precise estimates of abundance, by providing a measure of what proportion of the population are detected for each species during surveys, and thus how many individuals go undetected.
This Common Scoter was a welcome bonus at an inland square just outside Birmingham.
*2001 – foot-and-mouth disease

7
COVERAGE OVERVIEWFantastic news in that 2016 saw coverage reach a new high! Th is map illustrates square distribution including the ‘core’ BBS squares, the 113 ‘bolt-on’ Upland Adjacent squares covered in 2016, and those squares introduced to the survey as Scottish Woodland Squares and still surveyed today.
Squares from the Upland BBS, covered in the past by professional fi eldworkers, are not shown on this map nor in table 1 on page 6, but data from these squares are included in the data analysis and trend calculations for the years they were surveyed. Please see ‘Backgrounds and Methods’ on page 26 for more information on these surveys.
Core BBS
Upland Adjacent
Scottish Woodland
KEY
Channel Islands“After a decline in coverage from 2014 to 2015, coverage appears
stable, solely thanks to the e� orts of volunteers and Regional Organisers.”
Sarah Harris, bbs national organiser
Scotland“Coverage in Scotland
continues to grow, which is fantastic. Targeted training
and other initiatives have helped to improve coverage of
more remote areas. A huge thank you to our wonderful
volunteers who often go ‘above and beyond’ to collect these valuable data. Maybe
in 2017 we will see more than 500 squares covered?”
Ben Darvill, bTo development and engagement manager,
scotland
Northern Ireland “2016 saw a welcome return of the funding for professionally surveyed squares, and on top of the volunteer support, which held up well, the total squares surveyed increased year on year by 61% to 126 – a level that will help maintaina credible number of species trends in Northern Ireland.”Shane Wolsey, bTo northern ireland offi cer
Wales“It is so heartening for the future that the e� ort put in by the team across Wales has not only contributed to record UK BBS coverage, but has brought on new volunteers, and further encouraged existing volunteers. Congratulations and thank you to the whole team across Wales for your e� ort.”Kelvin Jones, bTo cymru development offi cer, wales
England“Remarkably, BBS coverage in England increased again in 2016, for the � fth year in a row, setting a new record. At this rate, it can’t be long before 3,000 squares are surveyed, which will mean trends for more species, more regional trends, and greater precision in trends for species that we already report upon – priceless information for conservation. � ank you all!”Mark Eaton, rspb principal conservation scientist
Isle of Man“Coverage continues on the Isle of Man for the second year running, thanks to a dedicated BBS volunteer, keeping the isle on the BBS map!” Sarah Harris, bbs national organiser
Sightings and coverage

8
GOLD-STANDARD MONITORINGWe’re continually looking at ways to develop the scheme to make better use of the data BBS volunteers collect. A recurring theme has been detectability. Doing a BBS square and putting records into distance bands really brings home how some species can be detected at much greater distances than others. Analyses of these patterns has predictably confirmed that large species and those of open habitats are more easily detected, and are helping us quantify how detectability varies with time of day and season. In 2014, detectability recording was introduced and in 2016 surveyors on 77% of squares recorded whether birds were detected first by sight or sound, allowing us to measure more precisely how detectability varies with distance and behaviour. Collectively, these detectability insights allow us to get closer to estimating breeding density, allowing us to produce better population estimates, such as those we’ve developed for individual habitats.
Another aspect that affects how many birds are recorded on a square is the skill of the observer. This is a tricky thing to measure and a difficult subject to approach. We’ve found some evidence of an experience effect, whereby surveyors take longer and find slightly fewer species in the first year covering a new square compared to subsequent years. However, this effect is so small it has no impact on trends produced for 75 of 76 species. We’ve yet to look at the impact of other aspects of observer variation, such as how accurately and consistently we estimate the distance to a singing Wren.
In 2016, BBS volunteers counted a staggering 1.2 million birds, providing the key ingredient for the production of population trends. These data are also central to a programme of development and interpretation work to ensure BBS remains a gold-standard scheme delivering insights about the UK’s common and widespread birds. As we embark on a new BTO/JNCC/RSPB partnership, it’s time to reflect on what we have learnt from our partnership working over the last seven years, and what’s ahead for our collaboration.
By Simon Gillings Head of Population Ecology & Modelling, BTO, and Deborah Procter, Senior Monitoring Ecologist, JNCC
What’s been learnt over the recent period of partnership? It’s time to reflect on what we have learnt from the last seven years, and what lies ahead for our collaboration.
BBS Research and Outputs
More than just trendy graphs
MONITORING STATUS AND CAUSES OF CHANGEThe trends we produce not only indicate which species are faring better or worse, they also allow us to delve into underlying causes. By combining square-level trends in numbers of birds and deer we’ve been able to show that deer browsing is negatively impacting five of 11 birds of woodland understorey, including the red-listed Nightingale and Willow Tit. For a wider suite of 59 species, the two factors that most clearly distinguished increasing and declining species were their breeding habitat and migration strategy. For migrants, species wintering in different parts of Africa declined at different times. This ground-breaking BBS study has been the inspiration for much of our recent tracking work. Closer to home, we found that BBS squares that are good for birds are generally also good for butterflies, giving some reassurance that monitoring one group of species well is useful more widely (though never the complete story). Analysis of patterns of change in Curlew populations across the country is providing important evidence about the likely drivers of those changes, which can be used to inform conservation responses.
UNDERSTANDING ECOLOGICAL PROCESSESThe annual nature of visits and the wide geographical spread of squares make BBS data invaluable for quantifying bird responses to climate change. Our BTO atlases have shown how species have colonised new northerly locations; analyses of BBS data shows this is also matched by shifts in the abundance of species, many of which are becoming more abundant in the north. As patterns of abundance change, so the community of species at a location changes. We’ve detected a widespread increase in species richness, particularly in the uplands, but as communities have become richer they have become more similar to each other. This occurs as a result of the generally positive impacts of warmer temperatures on common and widespread generalist species, which have become more common, but less positive impacts on species with more specialist habitat requirements.

wil
low
TiT
: ed
mu
nd
fel
low
es
SUSTAINING SPECIES AND HABITATSMuch of the BBS-funded work has involved detecting changes in populations and communities and understanding the causes of change. Those same data can also be used to identify solutions to reverse population declines. Partly in response to significant declines in bird populations in urban habitats identified by our analysis of habitat-specific trends, work is currently under way to investigate how the extent and configuration of habitats in urban BBS squares impact the species present. Importantly, this work can be used to improve the design of the new estates and towns that are likely to be built in response to the need for more housing for an increasing population, so that they are more beneficial for biodiversity, and might also be better for people.
Square-level trends in numbers of birds and deer enabled us to show that deer browsing is negatively impacting five of 11 birds of woodland understorey in lowland England, including species such as Willow Tit.
LOOKING AHEADIn April 2017 a new BTO/JNCC/RSPB five-year BBS agreement was established by the partners. This continuing collaboration has a mix of maintaining the well-established approaches that have delivered so much over the years as well as expanding the scope of field data gathering. A particularly welcome change is that the WBBS (see page 32) has now become a formal part of the agreement. Other developments include continuing to explore how we can get more data from hard-to-reach or more remote areas. The partnership will also be investigating options to innovate in our analytical approaches, for example to produce new short-term trends for rapidly increasing species (e.g. Mandarin, Egyptian Goose, Little Egret).

10 BBS Research and Outputs
By David Stroud, JNCC, Nicola Crockford, Principal Policy Offi cer, RSPB, and Kate Hand, Senior International Policy Offi cer, RSPB
How data from the Breeding Bird Survey are used to direct the conservation of migratory landbirds.
Conservation actions for migratory landbirds in Africa
gr
assh
opp
er w
arb
ler
& sw
ifT:
gr
aham
caT
leY,
Tu
rTle
do
Ve: T
om
sTr
eeTe
r, s
edg
e w
arb
ler:
pau
l h
illi
on
, Yel
low
wag
Tail
: ch
ris
knig
hTs
The consequences of land-use change in UK for birds have become increasingly understood, and are now the focus of a range of conservation measures – notably agri-environment schemes – to halt and reverse negative population trends. However, less well understood are the various negative impacts on populations of long-distance migrants during non-breeding periods when they are away from the UK.
CONSERVING SHARED SPECIESTh e Convention on Migratory Species (CMS) provides a range of mechanisms through which its 124 Parties can collaborate internationally to conserve shared species. Th e 1995 African–Eurasian Waterbird Agreement is well known and has stimulated a wide range of activities for migrant waterbirds, whilst the UK sponsored the development of a Memorandum of Understanding on
migrant raptors in 2008. More recently, in 2014, the Convention adopted an African–Eurasian Migratory Landbirds Action Plan (AEMLAP) with the aim of improving the conservation status of long-distance landbird migrants, especially those that overwinter south of the Sahara in the Sahel.
An initial drafting workshop hosted by Ghana in 2012 developed a framework for national and international conservation actions focusing especially on non-breeding habitats which are less likely to be subject to conservation activities.
Th e geographic scope of the Plan is enormous – stretching across Eurasia from Iceland to Kamchatka, from high-arctic Svalbard to South Africa – encompassing the totality of multiple species’ migration systems. It includes many species monitored by BBS (see table 2) and UK data provide a key input to assessing the international status of these species.
Table 2 A selection of the African–Eurasian migrant landbirds monitored by the BBS and included within the scope of AEMLAP
Turtle dove wood warbler grasshopper warbler redstart
cuckoo chiffchaff sedge warbler whinchat
swift willow warbler reed warbler wheatear
sand martin blackcap spotted flycatcher Yellow wagtail
swallow garden warbler nightingale Tree pipit
house martin whitethroat pied flycatcher meadow pipit

11BBS Research and Outputs
UNDERSTANDING THE ISSUESTh e unfavourable conservation status of many African–Eurasian migrants is thought to be, at least in part, caused by the loss, degradation and fragmentation of non-breeding habitats resulting from economic activities, land-use practices (that are often unsustainable), ultimately caused by growing human populations. Understanding and addressing these issues are priority themes for the Plan.
Climate change is likely to have an exacerbating eff ect, causing ecological dislocations in time and space with implications for these migrants.
A selection of the key issues identifi ed in the Plan include:
AEMLAP www.tinyurl.com/y7utqb5j
Abuja Declaration www.birdlife.org/sites/default/fi les/abuja_declaration.pdf
Migrant Landbird Study Group www.migrantlandbirds.org/index.php
Pan-European Common Bird Monitoring Scheme www.ebcc.info/index.php?ID=28
PROVIDING A FOCUSOften such high-level plans seem to be just a statement of the blindingly obvious, yet the valuable detail comes in their implementation. Th us, research is needed to understand what a “biodiversity-friendly farming system” is, and whether it is the same in all Sahelian countries. Already AEMLAP is providing a focus for researchers – including those from BTO, RSPB and many European universities, with an increasing range of studies starting to understand the ecology of migrants on their wintering areas.
To better understand the complex impacts of land-use change on people and biodiversity in West Africa, an international workshop was held in Abuja, Nigeria, in 2016. Th e meeting helped fl esh out some immediate actions that countries could take to promote sustainable West African land uses, as well as longer-term needs.
Th e CMS Conference of the Parties in October this year will provide an opportunity to review AEMLAP implementation. Ultimately progress will need to be assessed in terms of species’ conservation status. Given the extent of the issues identifi ed in the Plan, the huge geographic areas concerned, and the immensity of the economic and other counter-pressures to be addressed,
we can be sure that progress will be slow. However, the international community has an agreed international framework for action and that is a major step forward.
Our knowledge of UK trends for relevant migrants depends completely on BBS. Th e data annually collected by the survey are collated with those of other European countries by the Pan-European Common Bird Monitoring Scheme to provide critical inputs to AEMLAP.
To all those involved, thank you and keep counting!
action plan themes conservation needs
habitat conservation
promote agricultural policies that support participatory, sustainable natural resource management practices
promote biodiversity-friendly farming systems
develop policies that maintain and manage natural and semi-natural habitats of value for migrant landbirds
protection of sites of national and international importance
designate important sites under relevant national and international conservation regimes
Taking and tradeidentify migrant landbirds subject to taking and trade
undertake actions to regulate legal trade and eliminate illegal killing
mortality through collisions with infrastructure
avoid, reduce and mitigate collisions with existing and new infrastructure through implementation of best-practice development and planning policies
capacity development in other countries support provision of targeted research and monitoring training
education and awareness improve public awareness and understanding about migrant landbirds in all countries
research and monitoring develop and implement standardised national monitoring schemes
FIND OUT MORE...

BBS Research and Outputs12
Minding the gaps
How can BBS coverage in remote areas be improved?
By Dawn Balmer, Head of Surveys, BTO
Although we generally have excellent coverage of BBS squares across the UK, and covering a broad range of habitat types, it is crucial to constantly review the quality and usefulness of the information collected.
REMOTE AREASOne area that has long been identifi ed as needing better coverage is in the remote regions of the UK. Th is is often a challenging landscape to get to, far from where volunteers live, and away from the road network. Once a surveyor has got as close as possible by road, more often than not there is a long walk in to their square, sometimes even requiring an overnight stay in the mountains! BBS volunteers that carry out two BBS visits each summer in these remote and often upland squares are quite remarkable – thank you!
UPLAND ADJACENT SQUARES In 2010 the concept of ‘Upland Adjacent squares’ was introduced, whereby volunteers covering a BBS square in the uplands can also cover the adjacent square on the same visit if the ‘core’ BBS square is considered an eligible upland square. Uptake of this option has been good, with 113 squares covered in 2016, collecting additional data for this under-represented habitat type with every BBS visit to the uplands.
FURTHER IMPROVEMENTSCovering Upland Adjacent squares is a great way to capitalise on the eff ort of getting to the square, but we need to fi nd other ways to get a wider range of squarescovered in the uplands if we're to produce robust trends for species like Whinchat, or for countries beyond England. Th e pattern of coverage of remote, and often upland, squares was studied in detail to characterise each available 1-km square in terms of population density, elevation, steepness, forest cover and distance and ascent from the nearest public road. Th is proved very enlightening and highlighted the importance of tackling coverage, or lack of it, in remote areas. Th e BBS methods have been rigorously designed to ensure that robust trends are produced at relevant spatial scales (UK, country, region, county where
1212
possible) and the potential biases limited. With this in mind, any potential changes to the BBS methodology are always considered very carefully. Four potential interventions to reduce bias and increase coverage in the uplands were identifi ed. One of these, Upland Rovers, was trialled in 2017 and the costs and benefi ts of the remaining options are currently being considered.
UPLAND ROVERS Th e concept of Upland Rovers (volunteers off ering single, one-off visits to specially selected squares) was identifi ed as being quickly implementable and was trialled during the second half of the 2017 season. It is hoped this will continue as the next development in the mission to ‘even out’ coverage across the UK. Find out more about Upland Rovers at www.bto.org/upland-rovers. Further work will focus on the other proposals over coming months.
future considerations
Research into increasing coverage in theuplands is not over yet! There are other optionswhich need to be explored, or might proveuseful if current plans, i.e. Upland Adjacent squares and Upland Rovers, are insuffi cient.
• Upland Rovers (pilot in 2017) – single visits tocarefully selected, remote squares• Replacement of inaccessible squares withmore accessible alternatives, which are‘matched’ with respect to habitat and othercharacteristics• Research into a method of generating ‘random’squares in an unbiased way whilst excludingthe most inaccessible squares
• Research into how to adjust the bias identifi edwith uneven coverage during trend calculations
wh
inc
haT
: ed
mu
nd
fel
low
es

Understanding Population Trends 1313
Interpreting BBS and WBBS results
The pages which follow (pages 14–25) contain the annual bird population trend statistics for the Breeding Bird Survey (BBS) and pages 34–35 cover the Waterways Breeding Bird Survey (WBBS) results. For the most part, the table and graph layouts are the same: some guidance on reading these tables and graphs is therefore provided here, with other relevant hints on interpreting the information displayed.
THRESHOLDS FOR TRENDSTo produce robust results we produce trends only for species with suffi cient data. To judge this we look at the average number of squares per year on which a species has been recorded since the survey began in 1994. For UK trends we consider species above a reporting threshold of 40 squares, with the exception of Mandarin Duck and Nightingale. Th ese two species have a primarily English distribution and reach the reporting threshold in England, and are therefore included in the UK trends.
For countries within the UK, English Regions and UK WBBS trends, the threshold is 30 squares since the surveys began, 1994 for BBS and 1998 for WBBS.
BBS ‘ADD-ON’ SQUARES‘Add-on’ squares surveyed over the lifetime of the BBS, using BBS methodologies, have been included in these trends.
Th ese include Upland BBS, Upland Adjacent and Scottish Woodland squares. Upland BBS and Scottish Woodland squares were originally surveyed by professional fi eldworkers: Scottish Woodland squares are now surveyed by volunteers.
Upland Adjacent squares are also covered by volunteers during visits to survey their core BBS square: these were introduced as an option to increase coverage in remote upland areas (see page 12).
species Sample 15–16 95–15 LCL UCL(common Tern) 68 -13 16 -51 188
feral pigeon 707 -10 -21 * -32 -8
stock dove 847 -13 * 20 * 7 35
INTERPRETING GRAPHSAll BBS and WBBS graphs are displayed in the same way throughout the report. Beware, however, the index axis does vary in scale as do the time periods between the surveys.
BBS index graphs for 1994–2016 show:• smoothed trend – dark green line• confi dence interval – pale green shading
• annual index values – blue dots
• Trendsforspeciesinbracketsarereportedwithcaveats (see page 26).
• Red-listed and Amber-listed species from ‘Birds of Conservation Concern 4’ are shown in the relevant colour.
• Th esampleisthemeannumberofsquaresperyearon which the species was recorded during BBS: 1994–2016 or WBBS: 1998–2016.
• Trendsarepresentedasthepercentagechangeovertwo periods.
• Th e short-term change covers the most recent year of the survey, i.e. for BBS and WBBS: 2015 to 2016 (15–16 in the tables).
• Th e long-term change covers the lifetime of the survey, i.e for BBS: 1994–2016 and WBBS: 1998–2016. It has been smoothed, and the end years truncated. For BBS this is labelled as 95–15 in the tables and for WBBS, as 99–15.
• Trends with statistically signifi cant changes are marked with an asterisk (*), where the 95% confi dence limits of the change do not overlap zero.
• LCLandUCLarethelowerandupper95%confi dence limits for the 1995–2015 trend for BBS, 1999–2015 for WBBS.
TRENDS AND TABLES EXPLAINED
BBS Trend graphs online: www.bto.org/bbs-graphsBBS Trend tables online: www.bto.org/bbs-tablesWBBS results online: www.bto.org/volunteer-surveys/wbbs/results
ONLINE RESOURCES...

BBS Population Trends14
United Kingdom –population trends
Wood Warblerdeclined by57%in the UK between 1995 and 2015
WOODLAND WANDERERSSpotted Flycatcher, Wood Warbler, Garden Warbler and Nightingale all have some traits in common. Th ey are long-distance migrants, travelling down to the humid zone of sub-Saharan West Africa, occupying woodland habitats and they are all in decline. Th ree of the four are found on the Red List of Birds of Conservation Concern (BoCC4). Garden Warbler remains on the Green List.
Due to their largely English distribution, Nightingale are discussed in more details in the English population trends section (page 16).
Suggested drivers for the long-term decline seen in Spotted Flycatcher (-38%), Wood Warbler (-57%) and Garden Warbler (-23%) include changes in land use and climate in wintering areas, issues along migration routes and changes back in the breeding grounds here in the UK. It
is therefore diffi cult to pinpoint what exactly is causing the declines in these woodland species.
All inhabit woodlands, albeit in slightly diff erent ways; Spotted Flycatcher prefer deciduous woodlands with open glades, Wood Warbler like closed-canopy beech or oak woodland and Garden Warbler favour scrub and woodland edge.
With slightly diff erent habitat preferences here in the UK and little known about preferences in wintering grounds, it remains hard to pinpoint where drivers of decline are playing a part. Tracking projects could hold the key to fi lling this knowledge gap.
Predation of nests has been a suggestion as infl uencing Spotted Flycatcher declines and deer browsing may be impacting on the Garden Warbler, by reducing foraging and nesting areas. Research in southwest
FIND OUT MORE...
Eaton, M.A., Aebischer, N.J., Brown, A.F., Hearn, R.D., Lock, L., Musgrove, A.J., Noble, D.G., Stroud, D.A. & Gregory, R.D. 2015. Birds of Conservation Concern 4: the population status of birds in the United Kingdom, Channel Islands and Isle of Man. British Birds 108: 708–746. (www.britishbirds.co.uk/wp-content/uploads/2014/07/BoCC4.pdf)
BirdTrends www.bto.org/birdtrends
England, Wales and in West Africa is attempting to identify the cause of Wood Warbler declines.
WOODLAND POSITIVESIt’s not all negative news though. Th e short-distance migrant, Chiff chaff , and UK year-round resident, Nuthatch both increased during 1995–2015, by 109% and 90% respectively.
In general, short-distance migrants, which travel to the Mediterranean and North Africa, are faring better than those heading further south. Th e increasing Chiff chaff trend is in part due to large increases in Scotland, as the species’ range extends further north and further uphill as climate change makes these areas more suitable.
Nuthatch, a species of mixed and deciduous woodland, is also expanding northwards, having fi rst bred in the Scottish Borders in 1989. In this case, milder winters and increased food availability – including at garden feeding stations – are thought to be possible reasons for the increase.
Data from BBS squares across the UK have been used to calculate population trends for 111 bird species, of which 68 had statistically signifi cant long-term trends. Species included are those which reach the reporting threshold for the UK as well as Mandarin Duck and Nightingale, which reach the reporting threshold in England.
STATISTICALLY SIGNIFICANT RESULTSperiod no. species greatest change
long-term (95–15) increases 36 ring-necked parakeet: 1,455%long-term (95–15) declines 32 Turtle dove: -94%short-term (15–16) increases 5 spotted flycatcher: 34%short-term (15–16) declines 25 (barn owl): -35%
Total number of long-term statistically signifi cant results by Birds of Conservation Concern 4 (bocc4) status: red, amber or green.
1321 29
Turtle dove Tree sparrow swift greylag
goose greenfi nch red kite
19 2 6 236 7
Total number of long-term increasing or declining by bocc4 status, followed by the species with the greatest population change for each status list.

15
Table 3 UK population trends during 2015–16 and 1995–2015
BBS Population Trends
species Sample 15–16 95–15 LCL UCL species Sample 15–16 95–15 LCL UCLmute swan 264 -18 26 -5 80 blue Tit 2,435 -7 * 1 -3 4
greylag goose 240 26 232 * 7 632 great Tit 2,316 -12 * 37 * 31 42
canada goose 518 -31 * 75 * 42 141 coal Tit 865 -9 0 -12 12
shelduck 152 0 -5 -43 44 willow Tit 47 -34 -80 * -86 -71
mandarin duck 33 -6 405 not estimable marsh Tit 148 -15 -41 * -52 -27
gadwall 43 43 131 * 35 337 skylark 1,803 2 -22 * -27 -17
mallard 1,379 2 18 * 6 34 sand martin 138 16 39 -21 128
Tufted duck 163 -7 43 * 8 87 swallow 2,074 -19 * 18 * 9 27
goosander 43 -41 -21 -50 40 house martin 962 -9 -11 * -20 0
red-legged partridge 576 -21 * 6 -6 21 long-tailed Tit 1,018 2 17 * 6 31
red grouse 148 -27 * 13 -8 48 wood warbler 53 -11 -57 * -77 -25
grey partridge 223 -26 * -60 * -67 -53 chiffchaff 1,643 8 * 109 * 97 124
pheasant 1,926 -9 * 29 * 21 38 willow warbler 1,426 -1 -11 * -21 -3
(cormorant) 253 8 17 -11 49 blackcap 1,726 -11 * 145 * 128 161
(little egret) 46 -10 2,894 not estimable garden warbler 456 -17 * -23 * -32 -11
(grey heron) 677 -7 -12 -23 2 lesser whitethroat 286 2 6 -11 23
little grebe 72 -7 42 0 98 whitethroat 1,440 6 30 * 20 45
great crested grebe 74 -20 10 -29 52 grasshopper warbler 85 -7 -17 -44 30
red kite 145 8 1,231* 673 2,254 sedge warbler 307 0 -10 -28 15
sparrowhawk 356 -20 * -16 * -27 -2 reed warbler 135 8 17 -8 48
buzzard 1,095 -1 84 * 67 105 nuthatch 543 -10 * 90 * 67 114
moorhen 660 -8 -12 * -20 -2 Treecreeper 373 4 9 -6 22
coot 282 -12 17 -7 44 wren 2,579 9 * 32 * 26 38
oystercatcher 359 -5 -23 * -32 -11 starling 1,786 -10 * -51 * -55 -47
golden plover 66 -16 -20 -41 2 dipper 64 15 -20 -46 15
lapwing 690 -13 * -43 * -49 -34 blackbird 2,603 -2 22 * 18 28
curlew 528 3 -48 * -55 -42 song Thrush 2,102 5 22 * 16 29
common sandpiper 72 0 -15 -34 6 mistle Thrush 1,185 4 -25 * -32 -17
redshank 88 -10 -38 -60 0 spotted flycatcher 191 34 * -38 * -54 -21
snipe 170 -11 19 -2 43 robin 2,500 7 * 25 * 21 30
(common Tern) 68 -13 16 -51 188 nightingale 33 -9 -48 * -66 -18
feral pigeon 707 -10 -21 * -32 -8 pied flycatcher 40 -15 -41 -74 4
stock dove 847 -13 * 20 * 7 35 redstart 183 -8 43 * 19 69
woodpigeon 2,627 -3 35 * 27 43 whinchat 77 9 -51 * -66 -35
collared dove 1,409 -7 * 3 -5 10 stonechat 158 18 53 * 12 104
Turtle dove 131 -22 -94 * -96 -93 wheatear 358 -9 -16 -34 2
cuckoo 705 -9 * -43 * -49 -35 dunnock 2,175 -1 23 * 18 30
(barn owl) 48 -35 * 217 * 116 379 house sparrow 1,680 -6 * -6 * -13 -1
little owl 94 23 -57 * -66 -43 Tree sparrow 195 -8 119 * 67 192
(Tawny owl) 94 -13 -28 * -44 -6 Yellow wagtail 163 21 * -42 * -51 -29
swift 1,046 -7 -51 * -56 -44 grey wagtail 225 -4 -6 -23 12
kingfi sher 56 16 -8 -37 49 pied wagtail 1,317 -4 0 -8 8
green woodpecker 852 -4 31 * 20 46 Tree pipit 147 -3 8 -18 36
gt spotted woodpecker 1,149 -7 * 130 * 114 151 meadow pipit 836 -5 -7 -14 2
kestrel 675 -31 * -38 * -45 -29 chaffi nch 2,614 -11 * -2 -5 4
hobby 44 -12 -12 -39 33 bullfi nch 650 -5 10 -2 21
peregrine 51 -8 -13 -43 28 greenfi nch 1,815 -16 * -46 * -49 -42
ring-necked parakeet 78 12 1,455* 509 7,301 linnet 1,252 -8 -21 * -28 -11
magpie 1,990 -6 * -2 -6 3 lesser redpoll 174 -13 27 -5 66
jay 818 -8 19 * 9 31 crossbill 59 -19 -2 -47 38
jackdaw 1,841 -11 * 54 * 43 70 goldfi nch 1,776 -6 122 * 105 138
rook 1,364 -1 -20 * -29 -10 siskin 199 -10 61 * 18 96
carrion crow 2,497 1 18 * 10 26 Yellowhammer 1,220 -5 -16 * -22 -9
hooded crow 138 -14 17 -8 52 reed bunting 526 -12 31 * 14 51
raven 333 7 46 * 6 101 corn bunting 145 -13 -34 * -49 -19
goldcrest 829 3 11 -7 35
INTERPRETING THE RESULTS: see page 13
TREND GRAPHS ONLINE: www.bto.org/bbs-graphs

16
England –population trends
BBS Population Trends
WOODLAND BIRDSWillow Tit has suff ered a decline of 82% in England between 1995 and 2015. Th is has resulted in some localised extinctions and contraction in range, which is now largely concentrated in a band from northeast England to south Wales.
Unlike their Scandinavian and European cousins, race borealis, birds in England, kleinschmidt, do not tend to nest in coniferous woodlands, preferring young, damp woodlands with some dead wood for nesting. Suitability of some woodlands aff ected by deer browsing, drying up of soils due to increasingly dry summers and canopy closure are thought to have contributed to this decline.
Humid-zone migrant, the Nightingale, has also declined in England, by 48% long term (1995–2015). Th is is thought to be due to a combination of issues here in the UK, such as deer browsing, and habitat degradation on the wintering grounds.
OH DEER...For both Willow Tit and Nightingale, deer have been found to have a negative impact on the understorey habitats in which they both forage, and where Nightingale nests.
Roe Deer, a species that has increased by 60% in England since 1995, is thought to be the deer species having the greatest impact on both Willow Tit and Nightingale.
An experimental study published in 2010 showed a correlation between Nightingale declines and deer increases, by excluding deer from certain areas suitable for nesting and comparing the number of Nightingale territories inside and outside the area. Over nine years, territories increased tenfold inside the deer exclusion zone.
nig
hTi
ng
ale:
ed
mu
nd
fel
low
es
Of the 111 species for which UK trends are available, 105 trends were produced for England. Seventy of these English long-term trends were statistically signifi cant. Crossbill sits just below the reporting threshold and Cetti’s Warbler is getting closer to this target each year.
STATISTICALLY SIGNIFICANT RESULTSperiod no. species greatest change
long-term (95–15) increases 34 red kite: 19,918%
long-term (95–15) declines 36 Turtle dove: -94%short-term (15–16) increases 6 Yellow wagtail: 20%short-term (15–16) declines 24 canada goose: -36%
Nightingale declined by48%in England between 1995 and 2015
FIND OUT MORE...
Holt, C.A., Fuller, R.J. & Dolman, P.M. 2010. Experimental evidence that deer browsing reduces habitat suitability for breeding Common Nightingales Luscinia megarhynchos. Ibis 152: 335–346.
Newson, S.E., Johnston, A., Renwick, A.R., Baillie, S.R. & Fuller, R.J. 2012. Modelling large-scale relationships between changes in woodland deer and bird populations. Journal of Applied Ecology 49: 278–286.

17
Table 5 Trends in Wales during 2013–14 and 1995–2013
BBS Population Trends
Table 4 Trends in England during 2015–16 and 1995–2015
species Sample 15–16 95–15 LCL UCL species Sample 15–16 95–15 LCL UCLmute swan 226 -10 12 -9 56 blue Tit 1,974 -5 * -1 -6 4
greylag goose 198 -9 284 * 143 598 great Tit 1,875 -9 * 28 * 23 33
canada goose 478 -36 * 60 * 32 118 coal Tit 580 -13 * 19 * 0 46
shelduck 123 0 29 -15 70 willow Tit 42 -39 -82 * -87 -71
mandarin duck 32 -3 414 not estimable marsh Tit 135 -20 * -41 * -52 -26
gadwall 41 32 121 * 18 365 skylark 1,440 1 -23 * -28 -18
mallard 1,156 2 28 * 13 52 sand martin 86 -11 9 -31 42
Tufted duck 142 4 26 -6 62 swallow 1,595 -16 * 15 * 7 25
red-legged partridge 557 -18 * 0 -13 14 house martin 744 4 -28 * -35 -18
red grouse 87 -12 14 -21 67 long-tailed Tit 900 -7 10 0 23
grey partridge 200 -20 -57 * -64 -47 chiffchaff 1,379 9 * 111 * 98 125
pheasant 1,617 -7 * 29 * 20 39 willow warbler 945 -2 -43 * -50 -37
(cormorant) 211 -19 * 13 -8 54 blackcap 1,467 -9 * 117 * 105 134
(little egret) 42 -12 2,779 not estimable garden warbler 371 -10 -31 * -40 -21
(grey heron) 556 0 -18 * -30 -8 lesser whitethroat 273 6 8 -8 27
little grebe 57 -9 16 -28 68 whitethroat 1,237 2 28 * 19 36
great crested grebe 67 -17 -3 -30 34 grasshopper warbler 39 -8 -31 * -57 -2
red kite 108 13 >10,000* 8,028 20,258 sedge warbler 195 13 -21 * -41 -2
sparrowhawk 295 -22 * -21 * -30 -9 reed warbler 127 11 16 -7 57
buzzard 754 2 194 * 154 245 nuthatch 462 -8 * 91 * 67 115
moorhen 611 -7 -13 * -22 -4 Treecreeper 279 1 1 -13 14
coot 254 -12 19 -3 55 wren 2,017 10 * 27 * 20 32
oystercatcher 201 -3 50 * 27 78 starling 1,454 -6 -60 * -63 -56
lapwing 580 -7 -25 * -34 -16 dipper 31 -18 -39 -62 14
curlew 345 10 -31 * -40 -19 blackbird 2,073 0 19 * 15 24
common sandpiper 31 15 -43 * -64 -14 song Thrush 1,642 10 * 20 * 14 30
redshank 62 -7 -35 * -53 -17 mistle Thrush 936 5 -38 * -43 -32
snipe 91 -20 13 -17 62 spotted flycatcher 133 0 -61 * -69 -52
(common Tern) 63 5 32 -17 136 robin 1,974 8 * 29 * 24 34
feral pigeon 577 -11 -29 * -40 -18 nightingale 33 -9 -48 * -66 -7
stock dove 780 -11 * 18 * 2 36 redstart 102 -14 28 * 2 59
woodpigeon 2,097 -2 38 * 29 46 whinchat 33 16 -37 * -62 -15
collared dove 1,226 -8 * 0 -8 9 stonechat 69 26 55 -1 166
Turtle dove 129 -22 -94 * -96 -92 wheatear 201 -16 -14 -40 19
cuckoo 544 -8 -69 * -72 -65 dunnock 1,771 2 17 * 11 25
(barn owl) 46 -35 * 238 * 149 430 house sparrow 1,369 -4 * -18 * -24 -11
little owl 91 28 -57 * -67 -44 Tree sparrow 152 1 69 * 32 137
(Tawny owl) 81 36 -29 * -43 -7 Yellow wagtail 159 20 * -41 * -51 -26
swift 903 -3 -50 * -57 -42 grey wagtail 152 -5 7 -15 36
kingfi sher 50 6 0 -30 45 pied wagtail 995 -1 -2 -10 8
green woodpecker 798 -6 41 * 30 54 Tree pipit 75 -28 * -46 * -67 -15
gt spotted woodpecker 1,000 -12 * 105 * 90 121 meadow pipit 451 -11 * -9 -20 2
kestrel 596 -25 * -24 * -30 -15 chaffi nch 2,038 -10 * -4 -9 0
hobby 43 -11 -9 -38 34 bullfi nch 503 18 * 6 -6 16
peregrine 31 13 45 -17 147 greenfi nch 1,532 -12 * -43 * -46 -39
ring-necked parakeet 78 12 1,455* 503 5,022 linnet 1,014 -3 -20 * -27 -12
magpie 1,664 -4 * 0 -4 5 lesser redpoll 68 33 -3 -39 62
jay 704 -2 6 -3 16 goldfi nch 1,463 0 118 * 103 133
jackdaw 1,480 -10 * 65 * 52 78 siskin 76 -15 69 -14 225
rook 1,087 -5 -13 * -22 -2 Yellowhammer 1,059 -3 -26 * -31 -21
carrion crow 2,051 4 27 * 18 35 reed bunting 398 -2 39 * 20 58
raven 156 5 130 * 2 296 corn bunting 138 -7 -33 * -48 -16
goldcrest 593 7 39 * 19 73
INTERPRETING THE RESULTS: see page 13
TREND GRAPHS ONLINE: www.bto.org/bbs-graphs
TREND TABLES ONLINE: www.bto.org/bbs-tables
18 BBS Population Trends
Scotland –population trends
Greylag Goose increased by221%in Scotland between 1995 and 2015
STATISTICALLY SIGNIFICANT RESULTS
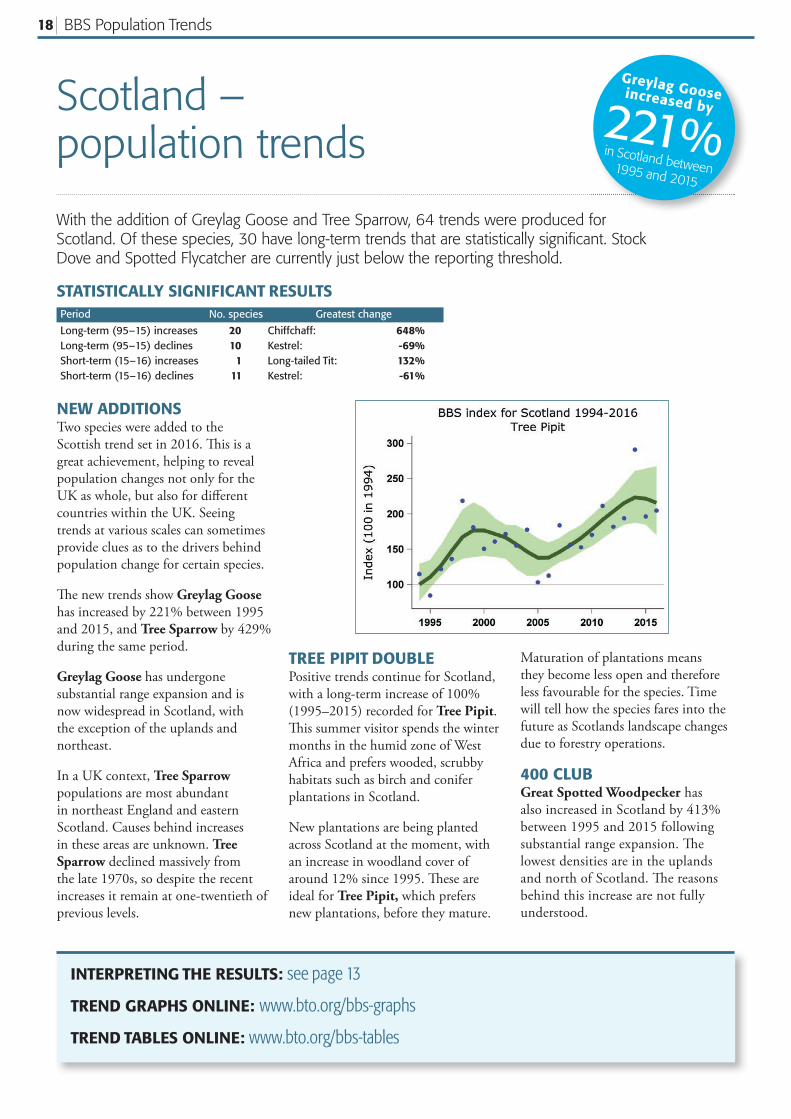
With the addition of Greylag Goose and Tree Sparrow, 64 trends were produced for Scotland. Of these species, 30 have long-term trends that are statistically signifi cant. Stock Dove and Spotted Flycatcher are currently just below the reporting threshold.
period no. species greatest change
long-term (95–15) increases 20 chiffchaff: 648%long-term (95–15) declines 10 kestrel: -69%short-term (15–16) increases 1 long-tailed Tit: 132%short-term (15–16) declines 11 kestrel: -61%
NEW ADDITIONSTwo species were added to the Scottish trend set in 2016. Th is is a great achievement, helping to reveal population changes not only for the UK as whole, but also for diff erent countries within the UK. Seeing trends at various scales can sometimes provide clues as to the drivers behind population change for certain species.
Th e new trends show Greylag Goose has increased by 221% between 1995 and 2015, and Tree Sparrow by 429% during the same period.
Greylag Goose has undergone substantial range expansion and is now widespread in Scotland, with the exception of the uplands and northeast.
In a UK context, Tree Sparrow populations are most abundant in northeast England and eastern Scotland. Causes behind increases in these areas are unknown. Tree Sparrow declined massively from the late 1970s, so despite the recent increases it remain at one-twentieth of previous levels.
Maturation of plantations means they become less open and therefore less favourable for the species. Time will tell how the species fares into the future as Scotlands landscape changes due to forestry operations.
400 CLUBGreat Spotted Woodpecker has also increased in Scotland by 413% between 1995 and 2015 following substantial range expansion. Th e lowest densities are in the uplands and north of Scotland. Th e reasons behind this increase are not fully understood.
TREE PIPIT DOUBLEPositive trends continue for Scotland, with a long-term increase of 100% (1995–2015) recorded for Tree Pipit. Th is summer visitor spends the winter months in the humid zone of West Africa and prefers wooded, scrubby habitats such as birch and conifer plantations in Scotland.
New plantations are being planted across Scotland at the moment, with an increase in woodland cover of around 12% since 1995. Th ese are ideal for Tree Pipit, which prefers new plantations, before they mature.
INTERPRETING THE RESULTS: see page 13
TREND GRAPHS ONLINE: www.bto.org/bbs-graphs
TREND TABLES ONLINE: www.bto.org/bbs-tables

19BBS Population Trends
Table 5 Trends in Scotland during 2015–16 and 1995–2015
species Sample 15–16 95–15 LCL UCL species Sample 15–16 95–15 LCL UCLgreylag goose 30 59 221 -36 964 house martin 75 -21 121 * 50 228
mallard 113 13 -12 -28 9 long-tailed Tit 33 132 * 63 -10 164
red grouse 55 -35 * 8 -15 39 chiffchaff 65 5 648 * 382 1,220
pheasant 154 -18 * 20 -3 43 willow warbler 229 -2 19 -1 33
(grey heron) 54 -6 0 -29 38 blackcap 73 -9 460 * 283 771
buzzard 156 -4 22 -1 53 whitethroat 91 23 117 * 25 253
oystercatcher 139 -6 -37 * -49 -27 sedge warbler 58 -18 21 -26 85
golden plover 38 -22 -31 * -52 -8 Treecreeper 40 -4 11 -30 56
lapwing 88 -19 * -58 * -69 -46 wren 244 8 67 * 44 86
curlew 128 -2 -59 * -68 -50 starling 160 -14 -26 * -43 -2
common sandpiper 35 0 -13 -32 5 blackbird 217 -9 37 * 17 73
snipe 62 -13 22 -2 62 song Thrush 193 -2 28 * 8 55
feral pigeon 71 -22 4 -33 61 mistle Thrush 82 12 28 -4 82
woodpigeon 228 -10 13 -12 44 robin 217 5 35 * 15 53
collared dove 59 -1 20 -24 82 stonechat 37 11 23 -24 89
cuckoo 79 -5 33 * 8 68 wheatear 86 -10 -20 -40 8
swift 54 -31 -57 * -70 -34 dunnock 154 -18 * 57 * 30 89
gt spotted woodpecker 59 7 413 * 273 631 house sparrow 108 -14 * 50 * 16 93
kestrel 41 -61 * -69 * -80 -46 Tree sparrow 31 -23 429 * 175 1137
magpie 58 -11 39 -3 116 grey wagtail 32 15 -20 -47 8
jackdaw 132 -14 23 -6 65 pied wagtail 147 -11 -4 -19 12
rook 120 19 -33 * -52 -4 Tree pipit 36 4 100 * 28 175
carrion crow 212 -3 -6 -25 25 meadow pipit 224 0 -10 -22 0
hooded crow 53 -14 -27 -54 10 chaffi nch 260 -13 * 4 -6 20
raven 53 4 35 -16 116 bullfi nch 46 -35 * 46 -8 100
goldcrest 98 8 14 -18 65 greenfi nch 108 -35 -55 * -71 -35
blue Tit 181 -13 * 5 -12 21 linnet 96 -16 -20 -42 6
great Tit 170 -20 * 64 * 38 96 lesser redpoll 52 -19 40 -10 114
coal Tit 142 3 -13 -32 14 goldfi nch 109 -16 181 * 104 282
skylark 223 6 -23 * -33 -11 siskin 81 -13 61 * 15 99
sand martin 34 36 87 -34 479 Yellowhammer 119 -10 37 * 14 62
swallow 196 -26 * 33 * 8 56 reed bunting 66 -30 41 * 6 86
Tree
pip
iT: g
rah
am c
aTle
Y

20 BBS Population Trends
Wales –population trends
TWO NEW TRENDSTh e Siskin is a bird of coniferous woodland. Th ere are several suggestions for the drivers behind the UK increase of 61% long term (1995–2015), and increase in Wales by 84% since 1995. Th ese include exploitation of garden feeding stations, and the ability to utilise these when the cone crop is poor, along with the
increased availability of maturing conifer plantations. Conversely, the European trend for Siskin shows a 7% decline from 1980 to 2014.
With an increase of 29%, Reed Bunting joins the other 55 species for which we can report trends in Wales. Th is is not a statistically signifi cant increase, but suggests the Welsh Reed
Buntings are experiencing the same positive trends as elsewhere in the UK.
Th is could be a sign of recovery from pre-BBS declines in the 1970s, which are thought to have been due to agricultural intensifi cation. Reed Bunting was moved from the Red to the Amber list of Birds of Conservation Concern in the 2009 assessment.
Siskinincreased by84%in Wales between 1995 and 2015
STATISTICALLY SIGNIFICANT RESULTSperiod no. species greatest change
long-term (95–15) increases 19 gt spotted woodpecker: 180%long-term (95–15) declines 9 starling: -70%short-term (15–16) increases 2 stonechat: 42%short-term (15–16) declines 8 curlew: -42%
Two additions to the reporting for Wales, Siskin and Reed Bunting, brings the total number of population trends up to 56. Of these, 28 show statistically signifi cant changes in the long term. Red Kite, Canada Goose and Grey Wagtail are all just below the reporting threshold of being recorded on an average of 30 squares or more since the start of the survey.
sisk
in: j
oh
n h
ard
ing

21BBS Population Trends
Table 6 Trends in Wales during 2015–16 and 1995–2015
species Sample 15–16 95–15 LCL UCL species Sample 15–16 95–15 LCL UCLmallard 72 -29 -12 -55 55 willow warbler 168 -4 -12 -25 2
pheasant 102 -11 47 * 12 84 blackcap 136 -8 151 * 105 207
(grey heron) 44 -46 -10 -40 44 garden warbler 60 -18 -23 -45 10
buzzard 151 1 -2 -20 15 whitethroat 90 9 -19 * -37 -1
curlew 35 -42 * -68 * -79 -53 nuthatch 77 -6 47 * 15 84
feral pigeon 37 30 49 * 1 115 Treecreeper 43 25 36 -12 92
stock dove 33 -15 88 * 18 214 wren 211 9 * 34 * 20 47
woodpigeon 201 -13 * 26 * 7 46 starling 81 -38 * -70 * -80 -57
collared dove 78 -6 21 -25 75 blackbird 211 -8 38 * 27 49
cuckoo 61 -16 -16 -41 11 song Thrush 178 3 24 * 11 42
swift 66 -27 -59 * -72 -38 mistle Thrush 105 -5 -4 -27 28
green woodpecker 47 29 -20 -51 35 robin 206 5 11 0 24
gt spotted woodpecker 88 4 180 * 118 283 redstart 67 -6 33 * 9 78
magpie 172 -11 -21 * -32 -11 stonechat 40 42 * 139 * 63 294
jay 79 -10 38 -1 88 wheatear 58 12 -21 -42 6
jackdaw 149 -14 * 27 -16 90 dunnock 165 2 34 * 16 58
rook 81 3 -42 * -62 -15 house sparrow 134 -3 79 * 45 124
carrion crow 217 -8 14 -7 32 pied wagtail 125 -5 8 -9 33
raven 99 7 34 -10 126 Tree pipit 36 -1 -12 -41 40
goldcrest 89 -13 -30 -54 14 meadow pipit 94 -8 7 -15 37
blue Tit 190 -13 * 11 -5 25 chaffi nch 211 -19 * -13 * -23 0
great Tit 182 -7 36 * 16 57 bullfi nch 67 -9 2 -22 27
coal Tit 79 -21 -24 -43 3 greenfi nch 114 -14 -52 * -65 -38
skylark 108 -7 6 -15 36 linnet 97 -10 -9 -33 22
swallow 184 -22 * 30 * 5 67 goldfi nch 140 -13 76 * 38 125
house martin 92 -29 -1 -32 41 siskin 31 49 84 * 10 242
long-tailed Tit 65 -29 38 -1 103 Yellowhammer 33 25 -57 * -73 -38
chiffchaff 153 8 67 * 37 96 reed bunting 30 -38 * 29 -12 115
INTERPRETING THE RESULTS: see page 13
TREND GRAPHS ONLINE: www.bto.org/bbs-graphs
TREND TABLES ONLINE: www.bto.org/bbs-tables

22 BBS Population Trends
Northern Ireland –population trends
22
Song Thrush increased by52%in Northern Ireland between 1995 and 2015
STATISTICALLY SIGNIFICANT RESULTS
In Northern Ireland, population trends were calculated for 34 species: of these, 18 showed statistically signifi cant changes, most of which were long-term increases. Species just below the reporting threshold are Sedge Warbler, Lesser Redpoll and Mallard.
period no. species greatest change
long-term (95–15) increases 12 hooded crow: 179%long-term (95–15) declines 2 greenfi nch: -52%short-term (15–16) increases 0 short-term (15–16) declines 4 bullfi nch: -41%
PAST AND PRESENTJust over half the UK breeding population of Song Th rush has been lost since 1967. Change in fi rst-winter survival has been suggested as the reason for this decline, but it is not clear what the driver behind this was. Habitat loss has also been suggested as a driver of decline, with removal of hedgerows and new fi eld drainage systems reducing the availability of good foraging areas.
Deer browsing aff ecting the understorey habitats of woodlands, in which Song Th rush nest and forage, may also have contributed to the historical declines.
However, from 1995 to 2015, Song Th rush has increased by 52% in Northern Ireland and this is the largest of all increases when comparing with the UK – with a 22% increase – and country trends.
Th e reason for this change in the population trend is unknown, and it is unclear why the population is increasing faster in certain areas, such as Northern Ireland.
GREAT NEWSWith an increase of 172% from 1995 to 2015, Great Tit is another species doing well in the woodlands of Northern Ireland.
Increases in Great Tit numbers have been recorded since the 1960s via the Breeding Bird Survey and its predecessor, the Common Birds Census, with a UK increase during that period of 104%.
Earlier egg laying has been recorded in the UK, amounting to an advance of 11 days since 1968, in accordance with earlier spring greening in woodlands, though it is unclear whether this is having an infl uence on the overall population changes recorded by the two schemes.
Food provision at garden feeding stations has become more widespread and Great Tit are able to readily exploit this, especially through the winter months when natural food supply can became sparse. Warmer winters may also be playing a part in increasing survival rates.
gre
aT T
iT: j
oh
n h
ard
ing
INTERPRETING THE RESULTS: see page 13

BBS Population Trends 23
Table 7 Trends in Northern Ireland during 2015–16 and 1995–2015
species Sample 15–16 95–15 LCL UCL species Sample 15–16 95–15 LCL UCLpheasant 41 -9 89 * 3 194 blackcap 41 -26 >10,000 not estimable
buzzard 32 -3 >10,000 not estimable wren 92 4 69 * 19 111
woodpigeon 85 1 87 * 34 136 starling 79 -7 33 -7 98
collared dove 34 -4 97 * 2 174 blackbird 87 -8 40 * 2 67
magpie 83 -6 6 -19 47 song Thrush 78 -10 52 * 13 104
jackdaw 76 -11 98 * 31 149 mistle Thrush 59 -6 -2 -55 71
rook 73 -22 -13 -47 25 robin 88 6 19 -5 39
hooded crow 82 -18 179 * 105 278 dunnock 70 -6 86 -1 149
goldcrest 45 2 35 -20 64 house sparrow 56 -14 * 54 -11 150
blue Tit 77 -12 14 -22 47 pied wagtail 46 12 66 not estimable
great Tit 74 -32 * 172 * 92 226 meadow pipit 63 -24 * 22 -9 78
coal Tit 64 -25 48 -11 105 chaffi nch 91 -9 50 * 17 68
skylark 31 -4 -48 * -61 -38 bullfi nch 33 -41 * 31 -29 68
swallow 84 -16 -6 -33 43 greenfi nch 47 -26 -52 * -75 -7
house martin 45 -29 108 * 16 242 linnet 36 -22 -4 -41 47
chiffchaff 35 -22 18 -25 45 goldfi nch 51 -41 722 not estimable
willow warbler 80 11 72 * 25 96 reed bunting 32 -21 -14 -44 62
son
g T
hru
sh: g
rah
am c
aTle
Y
Channel Islands and the Isle of ManChannel IslandsCoverage in 2016 fell slightly, after peaking in 2013 and 2014, though matched the 2015 coverage of 23 squares. Herring Gull was the most numerous of the 82 bird species recorded and of course the Channel Islands continue to keep Short-toed Treecreeper on the BBS species list for another year. Data collected on these squares are used in the calculation of the UK population trends.
Isle of ManEff orts continue to maintain coverage on the Isle of Man, with two squares covered in 2016. Twenty-eight bird species were recorded, the most numerous being Rook. As with the Channel Islands, these data feed into the UK population trends.

24 BBS Population Trends
English regions –population trends
Regional summaries of the trends are provided here and the largest statistically signifi cant long-term trends (1995–2015) are highlighted. Regional variations can be seen throughout the table opposite, providing an insight into the complexity of changing population trends across England.
It is hoped that, with time and increased coverage, it will be possible to examine regional trends for other countries within the UK as well.
NORTH WESTFifty-seven trends calculated, 31 were signifi cant: 21 increases and 10 declines. Nuthatch increased by 376% and Swift declined by 57%. Of the regional trends produced for Sparrowhawk, the decline has been greatest in the North West (-46%).
NORTH EASTTh irty-six trends calculated, 16 were signifi cant: 8 increases and 8 declines. Chiff chaff increased by 286% and Swift declined by 65%. Of the regional trends produced for Mallard, the increase has been greatest in the North East (85%).
YORKSHIREFifty-fi ve trends calculated, 31 were signifi cant: 20 increases and 11 declines. Greylag Goose increased by 727% and Grey Partridge declined by 70%. Yorkshire is the only region where Red Grouse and Snipe reach the reporting threshold.
EAST MIDLANDSFifty-fi ve trends calculated, 27 were signifi cant: 18 increases and 9 declines. Chiff chaff increased by 416% and Cuckoo declined by 86%. Of the regional trends produced for Green Woodpecker, the increase has been greatest in the East Midlands (221%).
EAST OF ENGLANDSixty-eight trends calculated, 44 were signifi cant: 23 increases and 21 declines. Chiff chaff increased by 136% and Turtle Dove declined by 93%. Th e East of England is the only region where Shelduck and Corn Bunting reach the reporting threshold.
WEST MIDLANDSFifty-two trends calculated, 32 were signifi cant: 19 increases and 13 declines. Goldfi nch increased by 222% and Cuckoo declined by 75%.
Of the regional trends produced for Song Th rush, the increase has been greatest in the West Midlands (94%).
SOUTH EASTSixty-eight trends calculated, 46 were signifi cant: 21 increases and 25 declines. Red Kite increased by 10,584% and Turtle Dove declined by 95%. Th e South East is the only region where Tufted Duck, Red Kite and Marsh Tit reach the reporting threshold.
SOUTH WESTSixty trends calculated, 32 were signifi cant: 19 increases and 13 declines. Great Spotted Woodpecker increased by 128% and Cuckoo declined by 78%. Th e South West is the only region where Raven and Grey Wagtail reach the reporting threshold.
LONDONTwenty-seven trends calculated, of which 21 were signifi cant: 14 increases and 7 declines. Goldfi nch increased by 412% and House Sparrow declined by 73%. Of the regional trends produced for Great Tit (108%) and Chaffi nch (88%), the increases have been greatest in the London region.
478trends
calculated in English Regions
Region Counties Squares covered in 2016
1 North West Cheshire, Cumbria, Lancashire, Greater Manchester, Merseyside 269
2 North East Cleveland, County Durham, Northumberland 116
3 Yorkshire & Humber East Yorkshire, North Lincolnshire, North Yorkshire, South Yorkshire, West Yorkshire 296
4 East Midlands Derbyshire, Northamptonshire, Leicestershire & Rutland, Lincolnshire, Nottinghamshire 298
5 East of England Bedfordshire, Cambridgeshire, Essex, Hertfordshire, Norfolk, Suffolk 381
6 West Midlands Birmingham, Herefordshire, Shropshire, Staffordshire, Warwickshire, Worcestershire 237
7 South East Berkshire, Buckinghamshire, Hampshire, Isle of Wight, Kent, Oxfordshire, Surrey, Sussex 666
8 South West Avon, Cornwall, Devon, Dorset, Gloucestershire, Somerset, Wiltshire 495
9 London Greater London 106
Table 8 Counties in each region and squares covered in 2016 FIND OUT MORE...
English regions:
More detailed information is available on the BBS webpages under ‘Latest Results’, including short-term trends (2015–16) and trend graphs.
(www.bto.org/bbs)
The threshold for reporting trends for a region is 30 squares per year, on average, since the survey began. Regional population trends have been calculated for 79 species, in as many as all nine English regions, depending on where the sample size was adequate to report trends.

25BBS Population Trends
species north west north east Yorkshireeast
midlands
east of
england
west
midlandssouth east south west london
mute swan 27 42 -1 57 39 36greylag goose 727 * 38 94 * 46 126 * 37canada goose 104 * 71 143 * 33 62 * 43 46 59 4 71 32 118 98 * 49shelduck 19 36mallard 23 * 160 85 * 33 34 * 106 14 107 -4 193 81 * 119 33 239 45 * 155 -20 43Tufted duck 75 30red-legged partridge 17 52 -48 * 78 -21 * 180 14 36 81 * 122 120 * 59red grouse 24 50grey partridge -70 * 30 -32 32 -53 * 43 -79 * 30pheasant 138 * 144 31 71 64 * 149 5 156 -16 * 277 68 * 142 18 * 393 56 * 276(cormorant) -19 48 55 48 -19 32(grey heron) -26 * 80 -14 36 -13 51 -42 * 83 4 59 -18 124 -12 82red kite >10,000* 67sparrowhawk -46 * 33 -18 47 -20 67 0 49buzzard 99 * 76 >10,000 36 >10,000 55 >10,000 64 201 * 99 1092* 167 13 228moorhen -15 70 14 40 -25 60 -18 126 -19 61 -28 * 144 -2 68coot -13 31 -12 39 78 30 29 65oystercatcher -1 61 244 * 47 88 * 33lapwing -27 * 115 -22 46 4 110 -19 63 -28 * 74 -22 40 -57 * 102curlew -49 * 93 -36 * 50 4 114snipe 53 38feral pigeon -32 76 -46 * 60 -44 * 49 -34 * 76 -44 * 43 -22 109 -37 * 67 -24 * 73stock dove 92 * 58 45 54 -14 76 -5 143 71 * 86 35 * 203 25 128woodpigeon 80 * 220 19 84 90 * 171 24 194 34 * 324 26 * 184 23 * 489 47 * 350 56 * 82collared dove 16 134 -12 33 -25 * 81 18 112 48 * 210 -35 * 117 -6 296 0 192 -10 52Turtle dove -93 * 61 -95 * 44cuckoo -42 * 34 -51 * 43 -86 * 49 -74 * 106 -75 * 53 -70 * 162 -78 * 74swift -57 * 109 -65 * 32 -42 * 85 -28 81 -32 * 151 -49 * 75 -55 * 169 -61 * 142 -54 * 58green woodpecker 221 * 47 121 * 171 46 65 25 * 311 4 131 46 * 31gt spotted woodpecker 91 * 90 87 * 49 153 * 63 66 * 149 151 * 108 84 * 310 128 * 165 53 * 38kestrel -32 * 72 -41 * 59 -9 64 -16 108 -30 * 43 -32 * 135 -41 * 77ring-necked parakeet 690 * 32 >10,000 42magpie -8 187 -9 35 -21 100 24 145 29 * 244 -8 163 8 417 -7 291 36 * 81jay 41 71 2 31 28 * 118 -10 63 -9 235 1 109 -14 40jackdaw 71 * 145 1 62 67 * 119 125 * 122 128 * 224 80 * 141 72 * 373 40 * 273rook -27 91 -28 * 48 -37 * 109 5 97 5 180 -10 88 4 252 -24 * 219carrion crow 45 * 228 -3 82 48 * 176 40 * 182 91 * 301 5 182 21 * 473 10 345 46 * 82raven 125 72goldcrest 77 * 45 94 30 73 * 74 105 * 46 32 * 196 -10 131blue Tit -11 207 -13 64 1 151 30 * 179 22 * 302 -10 182 -5 476 -9 333 13 81great Tit 30 * 193 61 * 57 56 * 132 45 * 166 16 * 287 13 176 11 * 464 39 * 323 108 * 76coal Tit 34 72 30 41 74 * 45 0 39 9 64 51 * 50 -9 150 4 102marsh Tit -40 * 52skylark -22 122 -28 * 70 4 150 -22 * 157 -27 * 277 -22 * 116 -29 * 315 -26 * 221swallow -1 200 9 75 4 160 80 * 151 10 227 4 146 15 323 32 * 298house martin 8 99 4 68 37 58 -39 * 99 -38 * 82 -60 * 145 -23 * 149long-tailed Tit 12 86 44 52 52 * 79 27 * 152 -18 89 -23 * 245 33 * 148 78 * 33chiffchaff 370 * 106 286 * 43 306 * 78 416 * 101 136 * 208 158 * 143 57 * 374 37 * 292 144 * 33willow warbler -2 150 -33 * 68 1 118 -58 * 93 -81 * 114 -52 * 90 -78 * 151 -60 * 153blackcap 204 * 119 61 * 42 115 * 90 108 * 122 97 * 242 123 * 139 107 * 391 128 * 277 171 * 46garden warbler -31 30 -41 33 -34 * 59 -24 * 45 -40 * 98 -21 63lesser whitethroat 5 35 24 75 -29 * 56 -19 41whitethroat 21 89 44 * 40 13 83 92 * 137 12 249 28 * 108 50 * 298 22 * 209sedge warbler -28 45 -12 34 -12 33reed warbler -5 40 -21 33nuthatch 376 * 43 116 * 31 153 * 52 48 * 187 71 * 87Treecreeper 4 30 -5 94 -2 50wren 60 * 218 33 * 78 34 * 176 34 * 184 31 * 298 29 * 178 12 * 466 15 * 342 42 * 76starling -53 * 175 -47 * 59 -61 * 121 -47 * 132 -51 * 231 -66 * 132 -65 * 332 -72 * 193 -57 * 79blackbird 41 * 218 22 73 43 * 168 33 * 191 3 316 32 * 184 1 488 20 * 351 -28 * 82song Thrush 59 * 168 4 63 54 * 115 35 * 137 -1 237 94 * 155 -6 424 17 * 292 -35 * 51mistle Thrush -19 121 -8 40 -45 * 82 -20 84 -54 * 134 -1 89 -56 * 227 -47 * 126 -53 * 34robin 39 * 209 50 * 71 60 * 148 27 179 26 * 296 44 * 182 14 * 472 18 * 338 84 * 79wheatear -31 53 3 47dunnock 27 * 182 23 59 2 128 9 169 25 * 272 35 * 168 5 421 18 311 29 * 62house sparrow -9 161 -29 44 -8 98 -1 121 -33 * 197 -8 143 -31 * 304 5 233 -73 * 69Tree sparrow 127 * 31 226 * 41 11 34Yellow wagtail -42 * 37 -41 * 48grey wagtail -22 31pied wagtail -13 132 20 49 0 104 -19 96 1 151 7 87 -17 * 201 -3 152meadow pipit -1 93 -6 55 16 105 -44 * 41 -55 * 42 -45 * 49 -13 49chaffi nch 0 218 10 82 30 * 174 22 * 189 10 * 315 -34 * 180 -18 * 476 -15 * 346 88 * 57bullfi nch -12 42 30 51 -10 65 21 55 -28 * 134 6 109greenfi nch -38 * 155 -43 * 44 -42 * 103 -39 * 138 -33 * 250 -31 * 141 -52 * 374 -54 * 267 -28 60linnet -27 94 -31 49 -16 95 -25 117 -14 172 -29 75 -32 * 224 -16 180goldfi nch 145 * 167 119 * 53 150 * 122 172 * 135 81 * 213 222 * 129 66 * 329 96 * 264 412 * 50Yellowhammer -29 * 55 -46 * 43 -20 * 87 -3 136 -19 * 219 -47 * 104 -41 * 248 -18 * 164reed bunting 9 65 70 45 71 * 62 35 * 81 -32 * 60 34 34corn bunting -33 * 39
Table 9 Trends in English regions during 1995–2015
Background and Methods26
Background, methods and recent papers
26
BACKGROUND AND METHODS The BBS was launched, in 1994, to provide more representative habitat and geographical coverage than the main survey running at the time, the Common Birds Census (CBC). The CBC ended in 2000, and the overlap period between 1994 and 2000 allowed BTO to develop methods for calculating long-term trends (from the 1960s to the present) using information from both schemes.
The BBS is a line-transect survey based on randomly located 1-km squares. Squares are chosen through stratified random sampling, with more squares in areas with more potential volunteers. The difference in sampling densities is taken into account when calculating trends. BBS volunteers make two early-morning visits to their square during the April–June survey period, recording all birds encountered while walking two 1-km transects across their square. Each 1-km transect is divided into five 200-m sections for ease of recording. Birds are recorded in three distance categories, or as ‘in flight’, in order to assess detectability and work out species density. To assess further the detectability of species the option of recording how birds were first detected (by song, call or visually) was introduced in 2014. Observers also record the habitat along the transects, and record any mammals seen during the survey. Surveying a BBS square involves around six hours of fieldwork per year, and the aim is for each volunteer to survey the same square (or squares) every year.
As BBS squares are selected randomly, they can turn up within any kind of habitat. Some squares can never be surveyed, and these truly ‘uncoverable’ sites are removed from the system. However, squares that are temporarily inaccessible, or which are not taken up due to their remote location, are retained in order to maintain the integrity of the sampling design.
The BBS National Organiser, based at BTO HQ, is responsible for the overall running of the scheme, and is the main point of contact for the network of volunteer Regional Organisers (ROs). ROs are responsible for finding new volunteers and allocating squares to observers in their region. At the end of the season they validate submissions made online, and collect paper submissions and return them to BTO HQ. We are very grateful for the assistance of the ROs.
The BBS provides reliable population trends for a large proportion of our breeding species. Trends can also be
produced for specific countries, regions or habitats. For these analyses, we take the higher count from the two visits for each species, summed over all four distance categories and ten transect sections. Only squares that have been surveyed in at least two years are included in the analyses. Population changes are estimated using a log-linear model with Poisson error terms. Counts are modelled as a function of year and site effects, weighted to account for differences in sampling densities across the UK, with standard errors adjusted for overdispersion.
Since 2009, data from additional randomly selected 1-km squares surveyed as part of the Scottish Woodland BBS and the Upland BBS have been included in the BBS sample. These squares were surveyed using the same methodology as standard BBS squares, and results were incorporated into trends accounting for additional sampling effort. Since 2010, the option of adding an Upland Adjacent square to an existing ‘Eligible Upland’ BBS square has been encouraged, with the aim of increasing coverage in upland areas. These data are treated separately during the analyses.
Work has been carried out to assess the reliability of BBS trends, to ensure that reported trends are based on reliable data and sufficient sample sizes. This work has resulted in the following exclusions and caveats:
• We do not report population trends for five species of gull (Black-headed, Common, Lesser Black-backed, Herring and Great Black-backed), as a large proportion of the records are of non-breeding, wintering or migratory individuals.
• Trends for rare breeding species with substantial wintering populations (e.g. Fieldfare) are excluded.
• Trends for Cormorant, Grey Heron, Little Egret and Common Tern are reported with the caveat that counts may contain a high proportion of birds away from breeding sites.
• Trends for Tawny Owl and Barn Owl are reported with the caveat that the BBS monitors nocturnal species poorly.
• Counts for six wader species (Oystercatcher, Golden Plover, Lapwing, Snipe, Curlew and Redshank) are corrected to exclude counts from non-breeding flocks, and observations of Golden Plover in habitat unsuitable for breeding are also excluded.

Key BBS outputs 27
PUBLISHED AND FORTHCOMING PAPERS...
Robinson, R.A., Leech, D.I., Massimino, D., Woodward, I., Eglington, S.M., Marchant, J.H., Sullivan, M.J.P., Barimore, C., Dadam, D., Hammond, M.J., Harris, S.J., Noble, D.G., Walker, R.H. & Baillie, S.R. 2016. BirdTrends 2016: trends in numbers, breeding success and survival for UK breeding birds. Research Report 691. BTO, Thetford. (www.bto.org/birdtrends)
Hayhow, D.B., Bond, A.L., Douse, A., Eaton, M.A., Frost, T., Grice, P.V., Hall, C., Harris, S.J., Havery, S., Hearn, R.D., Noble, D.G., Oppel, S., Williams, J., Win, I. & Wotton, S. 2017. The state of the UK’s birds 2016. RSPB, BTO, WWT, JNCC, NE, DAERA, NRW and SNH, Sandy, Bedfordshire. (www.bto.org/research-data-services/publications/state-uk-birds)
JNCC 2016. Seabird Population Trends and Causes of Change: 1986–2015 Report. Joint Nature Conservation Committee. (www.jncc.defra.gov.uk/page-3201)
Defra 2017. Wild bird populations in the UK, 1970 to 2015. (www.gov.uk/government/statistics/wild-bird-populations-in-the-uk)
PECBMS 2016. Trends of common birds in Europe, 2016 update. (www.ebcc.info/index.php?ID=612)
Further reading
Franks, S.E., Douglas, D.J.T., Gillings, S. & Pearce-Higgins, J.W. (in press) Environmental correlates of breeding abundance and population change of Eurasian Curlew Numenius arquata in Britain. Bird Study.
Stanbury, A., Brown, A., Eaton, M., Aebischer, N., Gillings, S., Hearn, R., Noble, D., Stroud, D. & Gregory, R. (in press)An assessment of the risk of extinction for birds in Great Britain. British Birds.
Sullivan, M.J.P., Pearce-Higgins, J.W., Newson, S.E., Scholefi eld, P., Brereton, T. & Oliver, T.H. (in press) A national-scale model of linear features improves predictions of farmland biodiversity. Journal of Applied Ecology.
Elston, D.A., Brewer, M.J., Martay, B., Johnston, A., Henrys, P.A., Bell, J.R., Harrington, R., Monteith, D., Brereton, T.M., Boughey, K.L. & Pearce-Higgins, J.W. (in press) A new approach to modelling the relationship between annual population abundance indices and weather data. Journal of Agricultural, Biological and Environmental Statistics.
Morrison, C.A., Robinson, R.A., Butler, S. Clark, J.A. & Gill, J.A. 2016. Demographic drivers of decline and recovery in an Afro-Palaearctic migratory bird population. Proceedings of the Royal Society B 283: 20161387.
cu
rlew
: gr
aham
caT
leY

Trends for nine mammal species – now including trends for countries as well as for the UK as a whole
Mammal monitoring and population trends
speciessquares
recordedred squirrel 25grey squirrel 1,045european beaver 1bank Vole 19short-tailed Vole 21water Vole 6harvest mouse 2wood mouse 17Yellow-necked mouse 1house mouse 5common rat 55rabbit 1,957brown hare 932mountain/irish hare 76hedgehog 50mole 529common shrew 55pygmy shrew 6lesser white-toothed shrew 1noctule bat 1soprano pipistrelle 1pipistrelle bat sp 6red fox 487badger 314otter 26pine marten 10stoat 35weasel 14polecat 2american mink 7common seal 3grey seal 9wild boar 4reeves’ muntjac 201red deer 114sika deer 18fallow deer 124roe deer 819chinese water deer 11feral goat 6park cattle 4
Table 10 All mammal species recorded in 2016
squares recorded: number of squares on which species were recorded, including counts, fi eld signs, dead animals and local knowledge.
Reeves’ Muntjac increased by104%in the UK between 1996 and 2015
28 Mammal Population Trends
Mammal data were collected on 3,452 of 3,837 BBS squares surveyed (90%) in 2016. This allows for population trends to be calculated for nine of the UKs most easily detected and widespread mammal species. Thank you to all who submit these data.
Th is optional recording during bird count visits provides valuable data on mammal distribution and population change. An example of the use of these data is given on pages 30–31.
FIFTY-THREE TRENDSWhen considering the various scales for which mammal trends are produced, from UK down to English Regions, the total number of population trends calculated is 53. Th is provides an insight into how populations are changing in diff erent areas of the UK (tables 11–16).
RECORD TYPESRecords include counts of live mammals, records of signs of presence, and local knowledge. If none of these were detected, a submission of a ‘null return’ (where no mammals or evidence of presence was found) is submitted: absence data can be as valuable as counts. Of the 3,452 squares for which
mammal data were received, 2,883 had records of live mammals counted during the survey visit, 122 had indirect evidence only (local knowledge, fi eld signs) and 447 squares had mammal recording, but no evidence of presence was established.
REEVES’ MUNTJACWoodland birds and deer have featured strongly throughout this report. Reeves’ Muntjac has increased more than any other mammal species reported by the BBS, with a trend of 104% between 1996 and 2015.
Two of the four deer species for which the trends can be calculated, Fallow Deer and Reeves’ Muntjac, are non-native, and all four have increased at each regional scale (UK, country and English Region) since 1995 when the option of mammal recording was fi rst introduced as an optional extra to the survey.
Reeves’ Muntjac

• Trends are expressed as the percentage change, and marked with an asterisk (*) where the 95% confi dence limits of the change do not overlap zero (indicating that there has been a signifi cant change).
• Trends for Red and Fallow Deer are reported with caveats. These are herding species and trends should be interpreted with caution, the presence or absence of a herd in a given BBS visit could infl uence the overall trend.
Mammal Population Trends
species Scientifi c name Sample 96–15 LCL UCLgrey squirrel Sciurus carolinensis 736 -9 * -22 -3
rabbit Oryctolagus cuniculus 1,418 -61 * -68 -53
brown hare Lepus europaeus 706 -12 * -20 -1
mountain/irish hare Lepus timidus 50 -33 -61 18
red fox Vulpes vulpes 284 -39 * -49 -29
reeves’ muntjac Muntiacus reevesi 95 104 * 36 196
red deer Cervus elaphus 64 14 0 44
fallow deer Dama dama 62 13 -5 37
roe deer Capreolus capreolus 418 64 * 42 91
Table 11 Mammal trends in uk during 1996–2015
Table 12 Mammal trends in england during 1996–2015
Table 13 Mammal trends in scotland during 1996–2015
Table 14 Mammal trends in wales during 1996–2015
Table 15 Mammal trends in northern ireland during 1996–2015species Scientifi c name Sample 96–15 LCL UCL
grey squirrel Sciurus carolinensis 657 -10 * -22 -4
rabbit Oryctolagus cuniculus 1,162 -45 * -52 -35
brown hare Lepus europaeus 604 -9 -18 2
red fox Vulpes vulpes 229 -44 * -53 -33
reeves’ muntjac Muntiacus reevesi 95 104 * 31 219
fallow deer Dama dama 58 12 -4 38
roe deer Capreolus capreolus 323 60 * 35 93
species Scientifi c name Sample 96–15 LCL UCLrabbit Oryctolagus cuniculus 114 -83 * -89 -71
brown hare Lepus europaeus 76 -24 -50 7
red deer Cervus elaphus 43 2 -19 91
roe deer Capreolus capreolus 94 72 * 22 126
species Scientifi c name Sample 96–15 LCL UCLgrey squirrel Sciurus carolinensis 56 9 -35 63
rabbit Oryctolagus cuniculus 93 -44 * -59 -8
species Scientifi c name Sample 96–15 LCL UCLrabbit Oryctolagus cuniculus 44 -29 -61 3
species North West North East Yorkshire East Midlands
East of England
West Midlands South East South West London
grey squirrel 66 * 58 -31 32 37 45 -23 * 97 -36 * 74 -23 * 197 12 98 28 50rabbit -42 * 109 -71 * 40 -16 113 -81* 109 -40 * 204 -47 * 110 -61 * 288 -28 178brown hare -42 * 62 -9 70 37* 89 -1 145 -23 41 -24 100 -20 69red fox -21 31 -35 * 65 -43 * 46reeves’ muntjac 104 * 45 51 32roe deer 65 * 117 39 * 98
Table 16 Mammal trends in english regions during 1996–2015
29re
eVes
’ mu
nTj
ac: p
aul
new
Ton
• The sample is the mean number of squares per year on which the species was recorded during 1995–2016.
• The trend since the start of the survey, covering the years 1995–2016, has been smoothed, and the end years truncated (fi gure in bold).
• LCL and UCL are the lower and upper 95% confi dence limits for the 1996–2015 trend (displayed in Tables 11–15).
MAMMAL TREND GRAPHS ONLINE:www.bto.org/bbs-mammals

30
Using BBS mammal data to help inform deer management in Scotland
THE MISSIONBTO were approached by Scottish Natural Heritage (SNH) in 2016 to assist with a review they were conducting for Scottish Government into the eff ectiveness of deer management in Scotland. Information on the abundance and trends of Red and Roe Deer was required.
THE METHODSCount data for Red and Roe Deer were used to estimate abundance and change in abundance across Scotland. Using statistical modelling it was possible to combine the count information with land-cover data to ‘fi ll in the gaps’ between BBS squares, smoothing abundance estimates across the country. Th e smoothing eff ect does not take into account the abrupt changes in abundance caused by barriers, such as the sea, which can prevent mammal presence even when close to populations just over the water. Deer presence on some island groups were accounted for by removal of predictions of absent species from both Western and Northern Isles. However, assumed presence on some of the smaller inner isles, where in fact one or other species is absent, was not corrected. Another diffi culty was faced when attempting to model abundance on islands, where BBS squares may be too few to interpolate from. Abundance was calculated for 1995–99 and 2012–15; the two periods were then compared, giving abundance change over time for Red Deer and Roe Deer in turn.
THE RESULTSFour maps were produced, all of which are displayed on the page opposite. Th e abundance maps show predicted abundance in the later years (2012–15) at a 1-km resolution. Th e darker colours correspond to higher abundance (expressed as the number of deer we would expect to count in a 1-km square if the square was surveyed following the BBS procedure).
Mammal data are now recorded on 90% of all BBS squares and this allows the ‘standard’ population trends to be calculated annually for the UK, countries and English Regions, but their uses go further than that: research!
By Sarah Harris, BBS National Organiser, BTO
Mammal Research and Outputs
Red and Roe Deer in Scotland
3030
Th e abundance change maps show information about changes in abundance from 1995–99 and 2012–15 at a 10-km resolution. Th e map presents two diff erent pieces of information, using combinations of dot colour and size. Colour shows the relative change in abundance, with blue colours showing increase and red colours showing decline. Grey colours indicate little or no change. Th e relative change is simply the proportional change in abundance between the two time frames. Dot size indicates the mean abundance of that species across both periods, so that locations with large dots were estimated to contain more deer than those with small dots.
Th e SNH report itself, concluded that deer are an important part of Scotland's natural heritage but also recognised their impacts. Th e impacts of deer and success of deer management was reported to vary across the country and the report advised that there is more to do when looking into deer management and highlighted the importance of working alongside the Deer sector. As with any conservation implementation, or indeed species management, it is crucial that current data are examined and facts recognised then used to inform decisions in an unbiased manner, as demonstrated by this report.
THE CAVEATTh e spatial models used to make these maps involve assumptions – so errors can arise, especially in areas of low BBS coverage. It is better to concentrate on the big picture than look at individual squares. With time and increased coverage of BBS squares recording mammal data, these predictions could be improved.
THANK YOUMany thanks to all the volunteers opting to record mammals and signs of mammal on their BBS squares, enabling informed decision making.
Deer Management in Scotland: Report to the Scottish Government from Scottish Natural Heritage 2016 www.snh.gov.uk/publications-data-and-research/publications/search-the-catalogue/publication-detail/?id=2449
FIND OUT MORE...
90%of BBS squares now record mammal data during bird surveys

Mammal Research and Outputs 31
Red Deer abundance mapYears: 2012–2015
Red Deer abundance change mapchange between 1995–1999 and 2012–2015
Roe Deer abundance mapYears: 2012–2015
Roe Deer abundance change mapchange between 1995–1999 and 2012–2015
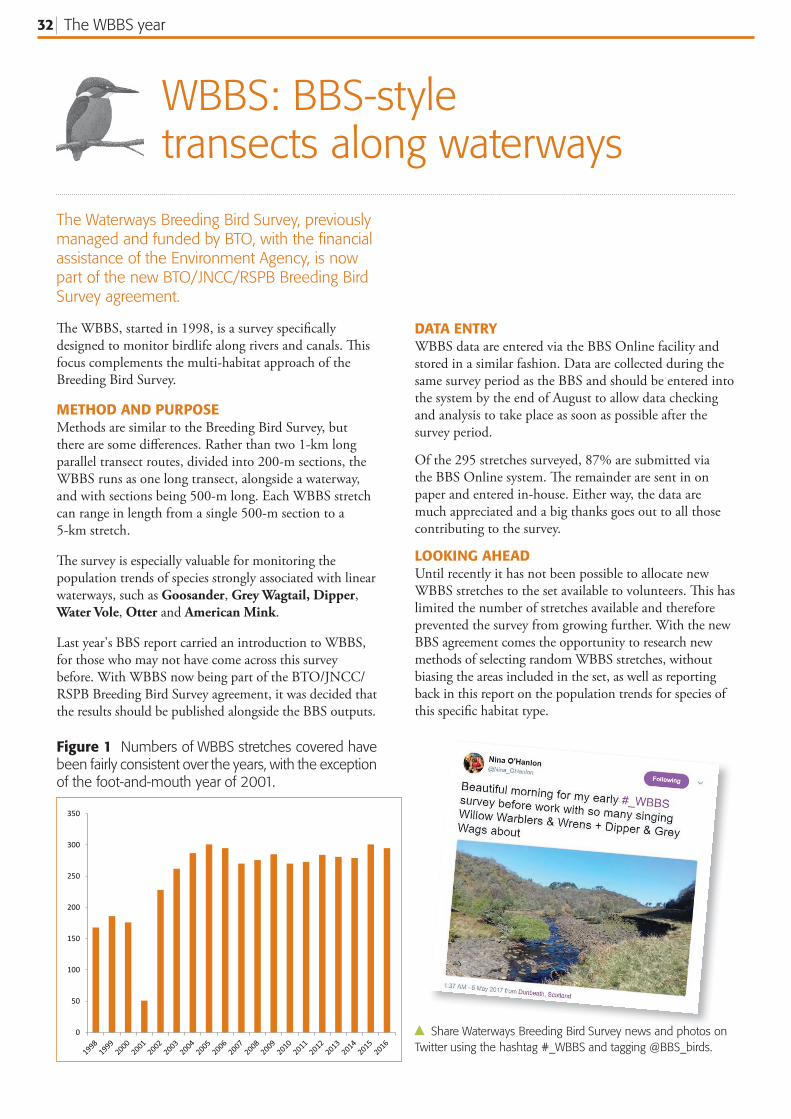
The WBBS year32
Th e WBBS, started in 1998, is a survey specifi cally designed to monitor birdlife along rivers and canals. Th is focus complements the multi-habitat approach of the Breeding Bird Survey.
METHOD AND PURPOSEMethods are similar to the Breeding Bird Survey, but there are some diff erences. Rather than two 1-km long parallel transect routes, divided into 200-m sections, the WBBS runs as one long transect, alongside a waterway, and with sections being 500-m long. Each WBBS stretch can range in length from a single 500-m section to a 5-km stretch.
Th e survey is especially valuable for monitoring the population trends of species strongly associated with linear waterways, such as Goosander, Grey Wagtail, Dipper, Water Vole, Otter and American Mink.
Last year's BBS report carried an introduction to WBBS, for those who may not have come across this survey before. With WBBS now being part of the BTO/JNCC/RSPB Breeding Bird Survey agreement, it was decided that the results should be published alongside the BBS outputs.
The Waterways Breeding Bird Survey, previously managed and funded by BTO, with the fi nancial assistance of the Environment Agency, is now part of the new BTO/JNCC/RSPB Breeding Bird Survey agreement.
0
50
100
150
200
250
300
350
Share Waterways Breeding Bird Survey news and photos on Twitter using the hashtag #_WBBS and tagging @BBS_birds.
Figure 1 Numbers of WBBS stretches covered have been fairly consistent over the years, with the exception of the foot-and-mouth year of 2001.
DATA ENTRYWBBS data are entered via the BBS Online facility and stored in a similar fashion. Data are collected during the same survey period as the BBS and should be entered into the system by the end of August to allow data checking and analysis to take place as soon as possible after the survey period.
Of the 295 stretches surveyed, 87% are submitted via the BBS Online system. Th e remainder are sent in on paper and entered in-house. Either way, the data are much appreciated and a big thanks goes out to all those contributing to the survey.
LOOKING AHEADUntil recently it has not been possible to allocate new WBBS stretches to the set available to volunteers. Th is has limited the number of stretches available and therefore prevented the survey from growing further. With the new BBS agreement comes the opportunity to research new methods of selecting random WBBS stretches, without biasing the areas included in the set, as well as reporting back in this report on the population trends for species of this specifi c habitat type.
WBBS: BBS-style transects along waterways

The WBBS year 33
COVERAGETwo hundred and sixty-one volunteers surveyed 295 WBBS stretches in 2016. Th is is a slight drop from 301 in 2015, but longer term, coverage looks stable (see fi gure 1). Th e map below illustrates the distribution of coverage, with the locations of WBBS stretches as purple dots.
Volunteers covered up to three stretches for the survey and recorded an impressive 173 bird species.
Species recorded include the most numerous such as Wren, Chaffi nch, Woodpigeon and Robin, through to the more unusual species such as Goshawk, Great White Egret and Water Pipit.
gre
Y w
agTa
il, d
ippe
r &
co
mm
on
san
dpi
per:
ed
mu
nd
fel
low
es, o
YsTe
rcaT
ch
er: j
ill
pake
nh
am

34 WBBS Population Trends
United Kingdom –WBBS population trends
WORRIES AT WATERWAYSOf the twenty-four long-term trends produced for the WBBS, eight have statistically signifi cant changes, seven of which are declines. Considering all the long-term trends, four were indicating increases and 20, declines.
DIVING DEEPERGenerally, declines detected in WBBS trends are greater than those revealed by the Breeding Bird Survey which by comparing the two population trends (BBS and WBBS), clues may be unravelled as to why trends for certain species are changing. Is it something to do with waterways, such as water quality, food or adjacent habitat?
LAPWING LOSSESDeclines in Lapwing are evident from the BBS results – 43% between 1995 and 2015 – and in waterways specifi cally as monitored by WBBS, showing a slightly greater decline of 54% from 1999 to 2015.
During the 1980s, agricultural intensifi cation was identifi ed as a key driver of decline, with drainage of farmland, increased use of fertilisers and pesticides, earlier and more frequent mowing, increased grazing pressures and a less varied agricultural landscape to cater for nesting and foraging requirements all playing a part. In the uplands, aff orestation has been identifi ed as reducing suitable habitat for Lapwing. Conservation
and management measures, such as under agri-environment schemes, have failed to date to reverse the negative eff ects of modern agriculture on Lapwing at the national scale.
MOORHENWBBS shows a 23% decline in Moorhen from 1999 to 2015. Th is is similar to the BBS trend (-12%). Moorhen is susceptible to harsh winters and year-to-year fl uctuations can be expected. Reasons behind the long-term declines are poorly understood, but the spread of non-native American Mink, an important predator, especially along waterways, has been identifi ed as a possible driver.
Th is highlights the value of recording mammals during WBBS visits, providing scope for future research on the possible impact along waterways, of species such as American Mink.
MIGRATION IN THE MIXFor species which nest along waterways, but spend the winter months elsewhere, identifying the reasons for decline becomes that much more complex. Common Sandpiper and Sedge Warbler have undergone declines between 1999 and 2015, along waterways, of 28% and 45% respectively.
Both migrate; Common Sandpiper to West Africa, and Sedge Warbler to south of the Sahara, in the West African Sahel. Th erefore, populations may be infl uenced during migration, when at wintering locations or here, on UK waterways. Previous research has shown how low rainfall levels in the Sahel, prior to Sedge Warbler arrival, can have a signifi cant impact on overwinter survival. Th is can help explain annual fl uctuations seen in the BBS population trends, but the continued, long-term decline revealed by the WBBS requires further research.
Twenty-four trends have been produced for a selection of species associated with waterways, and for which robust trends can be calculated using the data available. These trends provide an indication of the health of bird populations in this habitat type in particular, rather than for all UK habitat types overall, as is the case for the standard Breeding Bird Survey trends.
Lapwing declined by54%along UK waterways between 1999 and 2015
STATISTICALLY SIGNIFICANT RESULTSperiod no. species greatest change
long-term (99–15) increases 1 whitethroat: 25%
long-term (99–15) declines 7 lapwing: -54%short-term (15–16) increases 3 sand martin 43%short-term (15–16) declines 1 mallard -9%

35WBBS Population Trends
SPECIAL THANKSAs is the case with the Breeding Bird Survey (see back cover), the Waterways Breeding Bird Survey also relies on the dedication and enthusiasm of Regional Organisers (RO) who manage the survey locally. Without these volunteers, it would not be possible to manage such large surveys and we are in debt to them all.
Th e back covers shows a complete list of the ROs who manage the Breeding Bird Survey locally; many of these ROs also manage the WBBS. Please see opposite for the list of those WBBS Regional Organisers who focus solely on managing WBBS locally (and are therefore not listed on the back page). Regions without a WBBS RO have been marked as ‘vacant’. Please do email [email protected] if you would like to fi nd out more about becoming a Regional Organiser and what is involved.
Once again, a huge thanks goes out to all the Regional Organisers, volunteers and landowners who enable this survey to be the success it is. Th ank you all.
wbbs regional organisers in 2016:ENGLANDHuntingdon & Peterborough Derek LangslowLancashire (North-West) VACANTStaffordshire (North and West) Scott PetrekWorcestershire Steve Davies
SCOTLANDLanark, Renfrew & Dunbarton VACANT
NORTHERN IRELANDAntrim & Belfast Michael StinsonArmagh Michael StinsonDown Michael StinsonLondonderry Michael Stinson
WBBS Regional Organisers not listed on the back cover of this report. For any regions not listed, the RO is also the BBS Regional Organiser and mentioned on the back cover.
Table 17 WBBS UK population trends during 2015–16 and 1999–2015
species Sample 15–16 99–15 LCL UCL species Sample 15–16 99–15 LCL UCLmute swan 111 -13 -12 -34 20 curlew 62 11 -47 * -62 -28
greylag goose 52 -51 73 -10 223 common sandpiper 69 -15 -28 * -40 -14
canada goose 97 24 * 64 -4 166 (common Tern) 31 -14 -11 -40 35
mallard 232 -9 * -1 -11 12 kingfi sher 71 23 -19 -39 2
Tufted duck 44 -24 -35 -61 24 sand martin 76 43 * -5 -47 68
goosander 53 -11 16 -21 59 grey wagtail 128 9 -9 -24 10
(cormorant) 67 15 -1 -26 37 pied wagtail 156 -9 -23 -37 -2
(grey heron) 174 -12 -30 * -40 -17 dipper 91 3 -10 -29 16
moorhen 147 -4 -23 * -35 -10 sedge warbler 91 2 -45 * -56 -32
coot 70 -2 -24 -51 6 reed warbler 56 15 * -11 -30 13
oystercatcher 76 6 -35 * -48 -17 whitethroat 127 -4 25 * 6 46
lapwing 82 -9 -54 * -70 -32 reed bunting 112 2 -3 -16 10
species Sampleshelduck 26redshank 22mandarin 22great crested grebe 21snipe 21gadwall 20little grebe 16marsh Tit 14grasshopper warbler 13little egret 12cetti’s warbler 9
Table 18: Additional species of interest for WBBS but for which sample size is currently just too low to calculate robust trends from the survey.
lapw
ing
: ho
war
d s
Toc
kdal
e
INTERPRETING THE RESULTS: see page 13
RESULTS ONLINE: www.bto.org/volunteer-surveys/wbbs/results

SPECIAL THANKS We would like to thank all surveyors and ROs for making the BBS the success it is today. Space does not permit all observers to be acknowledged individually here, but we would especially like to thank the ROs for their efforts.
British Trust for OrnithologyThe NunneryThetfordNorfolkIP24 2PU
01842 [email protected]/bbs
bbs regional organisers in 2016:
BTO Research Report 700
ISSN 1368-9932
ISBN 978-1-908581-79-2
we would be grateful for help organising the bbs in regions currently without a Regional Organiser (marked VACANT). If you live in one of these regions and would be interested in taking on the role, please let us know.
Many thanks are due to the following ROs who retired during the past year, having supported the BBS in their regions: Terry Coster, Pat Cullen, Peter Kent, Peter Overton, Ruth Wilson and Ian Woodward.
We would like to thank and welcome Rod Bleach, James Cassels, Mike Daly, Peter Ellis, Mike Gibson, David Kennett, Kevin Mawhinney, Dave McGarvie and Michael Williams who have taken over as ROs during the past year.
Finally, we would like to thank all the landowners who kindly allow volunteers to walk BBS transects on their land.
ENGLANDAvon Dave StoddardBedfordshire Judith KnightBerkshire Sarah & Ken WhiteBirmingham & West Midlands Steve DaviesBuckinghamshire Phil TizzardCambridgeshire Rob PopleCheshire (Mid) Paul MillerCheshire (North-East and South) Hugh PulsfordCleveland Vic FairbrotherCornwall Peter Kent (now Michael Williams)Cumbria Colin Gay with
Stephen Westerberg & Dave PiercyDerbyshire (North, South) Dave BudworthDevon Stella BeavanDorset Claire YoungDurham David SowerbuttsEssex (North-East) Rod BleachEssex (North-West) Graham SmithEssex (South) Terry Coster (now VACANT)Gloucestershire Gordon KirkHampshire Glynne EvansHerefordshire Chris RobinsonHertfordshire Martin KetcherHuntingdon & Peterborough Mick TwinnIsle of Wight Jim BaldwinIsles of Scilly Will WagstaffKent Geoff OrtonLancashire (East) Tony CooperLancashire (North-West) Jerry MartinLancashire (South) VACANT Leicestershire & Rutland Dave WrightLincolnshire (East) Phil EspinLincolnshire (North) Chris GunnLincolnshire (South) Hugh DorringtonLincolnshire (West) Peter Overton (now Mike Daly)London (North) VACANTLondon (South) Richard ArnoldManchester Nick HiltonMerseyside Bob HarrisNorfolk (North-East) Chris HudsonNorfolk (North-West) Bob OsborneNorfolk (South-East) Rachel WarrenNorfolk (South-West) Vince MatthewsNorthamptonshire Barrie GalpinNorthumberland Muriel CadwallenderNottinghamshire Lynda MilnerOxfordshire (North) Frances BuckelOxfordshire (South) John MellingShropshire Jonathan GroomSomerset Eve TigwellStaffordshire (North, South, West) Gerald GittensSuffolk Mick WrightSurrey Penny WilliamsSussex Helen CrabtreeThe Wirral Paul MillerWarwickshire Mark SmithWiltshire (North, South) Bill QuantrillWorcestershire Harry GreenYorkshire (Bradford) Mike DentonYorkshire (Central) Mike BrownYorkshire (East, Hull) Geoff DobbsYorkshire (Leeds & Wakefi eld) VACANTYorkshire (North-East) Graham OliverYorkshire (North-West) Gerald LightYorkshire (Richmond) Mike GibsonYorkshire (South-East) Aidan GillYorkshire (South-West) Grant BiggYorkshire (York) Rob Chapman
SCOTLANDAberdeen Moray SouterAngus Peter EllisArgyll (Mull, Coll, Tiree & Morven) Geoff SmallArgyll (mainland & Gigha) & Bute Nigel ScrivenArran James CasselsAyrshire Brian BroadleyBenbecula & The Uists Yvonne BentingBorders Dave McGarvieCaithness Donald OmandCentral Neil BielbyDumfries Andy RichesFife & Kinross Norman ElkinsInverness (East & Speyside, West) Hugh InsleyIslay, Jura & Colonsay David WoodKincardine & Deeside Graham Cooper
Kirkcudbright Andrew BielinskiLanark, Renfrew & Dunbarton Andy WinningtonLewis & Harris Chris ReynoldsLothian Alan HeavisidesMoray & Nairn Melvin MorrisonOrkney Colin CorsePerthshire Mike BellRhum, Eigg, Canna & Muck Bob SwannRoss-shire Simon CohenShetland Dave OkillSkye Carol HawleySutherland Bob SwannWigtown Geoff Sheppard
WALESBTO Wales Offi cer John LloydAnglesey Ian HawkinsBrecknock Andrew KingCaernarfon Geoff GibbsCardigan Moira ConveryCarmarthen Terry WellsClwyd (East) Anne BrenchleyClwyd (West) Mel ab OwainGlamorgan (Mid, South) Wayne MorrisGlamorgan (West) Lyndon JefferyGwent Jerry LewisMerioneth Rob MortonMontgomery Jane KelsallPembrokeshire Annie HaycockRadnorshire Carlton Parry
NORTHERN IRELANDBTO Northern Ireland Offi cer Shane WolseyAntrim & Belfast Ruth Wilson (now Kevin
Mawhinney)Armagh Stephen HewittDown Alastair McIlwainFermanagh Michael StinsonLondonderry John ClarkeTyrone Michael Stinson
CHANNEL ISLANDSChannel Islands (excl. Jersey) Chris MourantJersey Tony Paintin
ISLE OF MANIsle of Man Pat Cullen (now David Kennett)


