IFRS fair value measurement and accounting policy choice in the United Kingdom and Australia David Cairns a , Dianne Massoudi b , Ross Taplin c , Ann Tarca b, * a London School of Economics and Political Science, London, UK b Business School, University of Western Australia, 35 Stirling Highway, Crawley, Western Australia 6009, Australia c Curtin University of Technology, Western Australia, Australia article info Article history: Received 18 April 2009 Received in revised form 15 July 2010 Accepted 3 August 2010 Keywords: Fair value measurement Accounting policy choice Within country comparability Between country comparability T index abstract This study investigates the use of fair value measurement by 228 listed companies in the UK and Australia around the time of adoption of IFRS from 1 January 2005. We test whether within and between country comparability in policy choices (as measured by T indices) has changed in relation to (a) mandatory and (b) optional use of fair value measurement. Mandatory requirements related to financial instruments (IAS 39) and share-based payments (IFRS 2) have increased comparability, with a weaker effect for biological assets (IAS 41). In relation to the optional use of fair value, comparability increased in relation to property (IAS 16) because some companies discontinued fair value measurement. Under IAS 39, the fair value option for other financial assets and other financial liabilities decreased comparability. Options to use fair value in other areas (intangible assets, plant and equipment and investment properties) are not generally taken up, either for on-going measurement or on IFRS adoption (under the ‘deemed cost’ option). The results suggest a conservative approach and/or lack of incentives to use fair value measurement for most companies. Exceptions include some banks and insurance companies (for other financial assets and liabilities) and companies holding investment properties. Ó 2010 Elsevier Ltd. All rights reserved. 1. Introduction The aim of this study is to investigate the use of fair value measurement and its impact on accounting policy choice and the comparability of financial statements in the United Kingdom (UK) and Australia around the adoption of International Financial Reporting Standards (IFRS) from 1 January 2005. Listed companies in the UK were required to use IFRS in their consolidated financial statements; they also had the option of using IFRS in parent and single company financial statements. In Australia, all reporting entities were required to prepare consolidated and single company financial statements under Australian equivalents to IFRS (AIFRS). In both countries, the adoption of IFRS was a part of the global trend favouring IFRS over national GAAP, and which represents the greatest ever change in financial reporting. The study focuses on the consolidated financial statements of listed companies. Widespread adoption of IFRS from 2005 was a significant step towards promoting the use of common standards internationally. Our interest is whether comparability of financial reporting increases in practice, following adoption of common standards. Prior to adoption of IFRS, listed companies in both the UK and Australia presented their consolidated financial statements in accordance with national * Corresponding author. Tel.: þ61 8 6488 3868; fax: þ61 8 6488 1047. E-mail address: [email protected](A. Tarca). Contents lists available at ScienceDirect The British Accounting Review journal homepage: www.elsevier.com/locate/bar 0890-8389/$ – see front matter Ó 2010 Elsevier Ltd. All rights reserved. doi:10.1016/j.bar.2010.10.003 The British Accounting Review 43 (2011) 1–21
Transcript
The British Accounting Review 43 (2011) 1–21
Contents lists available at ScienceDirect
The British Accounting Review
journal homepage: www.elsevier .com/locate/bar
IFRS fair value measurement and accounting policy choice in the UnitedKingdom and Australia
David Cairns a, Dianne Massoudi b, Ross Taplin c, Ann Tarca b,*
a London School of Economics and Political Science, London, UKbBusiness School, University of Western Australia, 35 Stirling Highway, Crawley, Western Australia 6009, AustraliacCurtin University of Technology, Western Australia, Australia
a r t i c l e i n f o
Article history:Received 18 April 2009Received in revised form 15 July 2010Accepted 3 August 2010
Keywords:Fair value measurementAccounting policy choiceWithin country comparabilityBetween country comparabilityT index
0890-8389/$ – see front matter � 2010 Elsevier Ltddoi:10.1016/j.bar.2010.10.003
a b s t r a c t
This study investigates the use of fair value measurement by 228 listed companies in theUK and Australia around the time of adoption of IFRS from 1 January 2005. We testwhether within and between country comparability in policy choices (as measured by Tindices) has changed in relation to (a) mandatory and (b) optional use of fair valuemeasurement. Mandatory requirements related to financial instruments (IAS 39) andshare-based payments (IFRS 2) have increased comparability, with a weaker effect forbiological assets (IAS 41). In relation to the optional use of fair value, comparabilityincreased in relation to property (IAS 16) because some companies discontinued fair valuemeasurement. Under IAS 39, the fair value option for other financial assets and otherfinancial liabilities decreased comparability. Options to use fair value in other areas(intangible assets, plant and equipment and investment properties) are not generally takenup, either for on-going measurement or on IFRS adoption (under the ‘deemed cost’ option).The results suggest a conservative approach and/or lack of incentives to use fair valuemeasurement for most companies. Exceptions include some banks and insurancecompanies (for other financial assets and liabilities) and companies holding investmentproperties.
� 2010 Elsevier Ltd. All rights reserved.
1. Introduction
The aim of this study is to investigate the use of fair valuemeasurement and its impact on accounting policy choice and thecomparability of financial statements in the United Kingdom (UK) and Australia around the adoption of InternationalFinancial Reporting Standards (IFRS) from 1 January 2005. Listed companies in the UK were required to use IFRS in theirconsolidated financial statements; they also had the option of using IFRS in parent and single company financial statements.In Australia, all reporting entities were required to prepare consolidated and single company financial statements underAustralian equivalents to IFRS (AIFRS). In both countries, the adoption of IFRS was a part of the global trend favouring IFRSover national GAAP, and which represents the greatest ever change in financial reporting.
The study focuses on the consolidated financial statements of listed companies. Widespread adoption of IFRS from 2005was a significant step towards promoting the use of common standards internationally. Our interest is whether comparabilityof financial reporting increases in practice, following adoption of common standards. Prior to adoption of IFRS, listedcompanies in both the UK and Australia presented their consolidated financial statements in accordance with national
D. Cairns et al. / The British Accounting Review 43 (2011) 1–212
company law, domestic accounting standards and stock exchange requirements (henceforth, collectively referred to as UKGAAP and Australian GAAP respectively).1 We select UK and Australian companies for study because both UK GAAP andAustralian GAAP permitted a ‘mixed attribute’ measurement model, that is, they permitted the use of several measurementbases. Generally, tangible, intangible and financial assets were measured initially at cost and subsequently at cost-basedamounts (depreciated/amortised/written down cost). However, both UK GAAP and Australian GAAP permitted, and occa-sionally required, subsequent measurement of tangible assets, intangible assets and some financial assets at current values(usually, but not always, fair value). Companies used the permissions to varying degrees.
An investigation of fair value measurement is important because many commentators have suggested that fair valuemeasurement would be more pervasive under IFRS than under national GAAP (Ball, 2006; Ernst & Young, 2003, 2005;FitchRatings, 2005). Some suggested that IFRS were a ‘fair value based accounting framework with some exceptions forhistorical cost’ (FitchRatings, 2005) and that financial reporting under IFRS largely involved the measurement of assets andliabilities at each balance sheet date at fair value (Ernst & Young, 2005). These commentators also speculated that the IASBwould, in the future, extend the use of fair value measurement at each balance sheet date beyond that required by IFRS in2005.
One of the primary aims of adoption of IFRS is to improve the international comparability of financial reporting.Comparability is one of the four principal characteristics of IFRS financial statements and requires that, among other things,the measurement of the financial effect of like transactions and other events must be carried out in a consistent way fordifferent entities (IASB Framework, paragraph 39). Therefore, the IASB’s objective is to require like transactions and events tobe accounted for and reported in a like way and unlike transactions and events to be accounted for and reported differently,both within an entity over time and among entities.2 The IASB intends not to permit choices in accounting treatment and hasreconsidered, and will continue to reconsider, those transactions and events for which IFRS permit a choice of accountingtreatment (Preface to International Financial Reporting Standards, paragraph 13).
The matters of interest, therefore, are the extent to which fair value measurement has increased following IFRS adoptionandwhether fair valuemeasurement has increased the comparability of financial statements between companies within eachcountry and between companies from the UK and Australia. In other words, we are interested in whether the fair valuemeasurement requirements in IFRS ensure that like assets and liabilities are measured in a like way.
Several prior studies have attempted to assess increases in harmonisation by comparing national accounting standardsand practices between companies in the same countries and between companies in different countries. The studies measuredifferences between national standards of various countries or the practices adopted by companies in different countries inorder to assess progress of so-called ‘international harmonisation’ of financial reporting. Prior studies made their compari-sons in the context of the transposition of European Union company law directives into national accounting laws andstandards and, to a lesser extent, the influence of international and US standards on national standards and practices (Archer,Delvaille, & McLeay, 1995; Emenyonu & Gray, 1992; Herrmann & Thomas, 1995; Parker & Morris, 2001; van der Tas, 1988,1992).3 These studies were carried out at a time when national standards varied and when national and internationalstandards and European Union company law directives allowed a significant number of accounting policy choices.
We differ from prior literature because our study’s setting features two countries using the same international standardsand there have been significant efforts by the IASB and its predecessor body to remove accounting policy choices since theprior studies. These changes also affect the interpretation of the results. When IFRS require companies to use onemeasurement policy, any observed lack of comparability also implies a possible lack of compliance with IFRS requirements.
We follow the prior literature by using indices to compare policy choices of different companies over time, and, hence,measure comparability within and between countries. Comparability improves when the indices show that companies’ policychoices for like transactions and events are clustered around like methods. When IFRS require companies to use onemeasurement policy (e.g. IAS 39 requires the use of fair value measurement for derivative instruments), the indices will showimproved comparability when the IFRS requirements replace more flexible national requirements. When IFRS continue toallow choices for like transactions and events (e.g. IAS 39 allows measurement at fair value or amortised cost for somefinancial assets and liabilities), the indices show greater comparability if more companies make the same choice thanwas thecase under national standards.
In this study we first compare themeasurement policies used under national GAAP and IFRS in each country to investigatewhether national comparability has increased under IFRS (within country comparability). Second, we are interested inwhether the measurement policies used under IFRS in the UK and Australia are more comparable than previously (betweencountry comparability). This would be evidence of IFRS achieving their objective of greater comparability between countries.
We are also interested in the extent of use of fair value measurement in IFRS financial statements. We wish to clarifyperceptions about how much fair value measurement occurs in IFRS financial statements to ensure that capital marketparticipants are properly informed about the nature and impact of IFRS. This is important as IFRS are widely used and arebeing considered for use in more countries and by many more entities. Misconceptions about the extent of fair valuemeasurement in IFRS may mislead users of IFRS financial statements. Such misconceptions may also have standard setting
1 In the case of the UK, company law has been heavily influenced by the accounting requirements in the European Union’s company law directives.2 See discussion of this concept in Gerboth (1973).3 Material or de jure harmonisation is defined by Tay and Parker (1990) as a movement away from total diversity of practice.
D. Cairns et al. / The British Accounting Review 43 (2011) 1–21 3
consequences by affecting the level of constituents’ support for individual standards and ultimately the quality of IFRS.Therefore, we consider the extent to which fair value measurement is used when preparers have a choice between fair valuemeasurement and historical cost-based measurement. This evidence is relevant for financial statement preparers, users,standard setters and regulators. It shows preparers’ perceptions about the usefulness of fair value informationwhen IFRS alsoallow historical cost-based measurement. This provides feedback on what companies do in practice rather than on whatpeople say in lobbying submissions. It also reveals the effects of options in standards on comparability, which is useful forstandard setters as they review the impact of IFRS and consider the extent to which they should include options in standardsin the future.
The research questions can be summarised as follows: (1) Domandatory IFRS fair value requirements (a) increase the use offair valuemeasurement and (b) increase comparability both within and between countries compared to prior national GAAP?(2)When IFRS allowcompanies a choice between fair valuemeasurement and historical cost-basedmeasurement, (a) does theuse of fair value measurement increase and (b) what is the effect of choice on within and between country comparability?
Our sample consists of 228 large listed companies (114 each from the UK and Australia) from 22 industry sectors. The datasource is the consolidated financial statements for the first IFRS reporting period (the adoption year) and the last periodpresented under UK GAAP or Australian GAAP (the transition year).4
Our study adds to thosewhich address the impact of IFRS adoption. Studies are beginning to explore capital market effects,such as cost of capital, information asymmetry and effects for analysts of mandatory IFRS in numerous countries (Hail & Leuz,2007). We focus on a very early step in the financial reporting process, namely the accounting policy choices for themeasurement of assets and liabilities being made by companies. Evidence about these policy choices provides a necessarybackground to understanding capital market effects. Based on the rationale for IFRS adoption, comparability of methodsaffects the usefulness of accounting information, a primary information attribute being studied whenwe attempt to measureadoption effects (e.g. Daske, Hail, Leuz, & Verdi, 2008; Horton, Serafeim, & Serafeim, 2008).
The effect of country differences in the application of IFRS has been raised as a possible impediment to successful IFRSadoption (Ball, 2006; Ball, Robin, & Wu, 2003; Hail & Leuz, 2007). Differences in institutional setting (including legal and taxsystems, sources of finance and market regulation) may affect the way standards are used in practice. Nobes (2006) suggeststhat the use of common standards will not necessarily mean the end of international differences in financial reporting. Forexample, he argues that ‘overt options’ in IFRSmay be exercised in a systematically different way in one jurisdiction comparedto another. In response to Nobes (2006), we provide evidence about theway some overt options are used in two countries. Ourstudy complements those exploring reasons for, and the impact of, policy choice under IFRS (e.g. Christensen&Nikolaev, 2009;Danbolt & Rees, 2008).
We also add to studies which explore impact of the use of current valuemeasures in accounting (Aboody, Barth, & Kasznik,1999; Amir,1993; Barth,1994; Barth, Beaver, & Landsman,1996; Barth & Clinch,1998; Brown, Izan, & Loh,1992; Easton, Eddey,& Harris, 1993). Fair value measurement is controversial and was strongly debated prior to the financial crisis commencing in2007 (ICAEW, 2006) and subsequently has been discussed as a possible ‘cause’ of the crisis (Laux & Leuz, 2009). Ourcontribution is to show the extent to which companies are using fair value measurement under IFRS (considering bothmandatory and voluntarily use) in order to improve our understanding of the context within which the fair valuemeasurement debate takes place.
2. Background
IFRS require or allow the use of fair values in five sets of circumstances, as follows:
(1) for the measurement of transactions and other events and, hence, the measurement of the resulting assets, liabilities andequity items on their initial recognition in the financial statements;
(2) for the allocation of the total amount at which a transaction or other event is measured among its component parts;
(3) for the measurement of the deemed cost of some assets on the transition to IFRS from other accounting standards;
(4) in the determination of the recoverable amount of assets when testing those assets for impairment; and
(5) for the measurement of assets and liabilities at each balance sheet date.
Fair values are used in circumstances 1 and 2 to determine the historical cost of transactions (the fair value of consid-eration give up). The use of fair values in these circumstances is generally not a change from UKGAAP or Australian GAAP nora policy choice and is, with one exception, outside the scope of this study. The exception is the use of fair values for themeasurement of share-based payments; this was a change from national GAAP at the time of the transition to IFRS.
4 As defined in IFRS 1 First-time adoption of IFRS.
D. Cairns et al. / The British Accounting Review 43 (2011) 1–214
Fair values are used in circumstance 3 to deal, primarily, with the circumstances in which an entity may not have accu-mulated the necessary information under prior national GAAP to determine IFRS costs (IFRS 1, paragraph BC41). However IFRS1 does not restrict its use to such circumstances with the result that all entities had a policy choice of using fair values as IFRSdeemed cost. Therefore, this use of fair value measurement is within the scope of this study. The circumstances do not ariseunder, and therefore are not dealt with in, national GAAP.
Fair values are used in circumstance 4 as part of the well-established practice of ensuring that the carrying amounts ofassets do not exceed the amounts that can be recovered from the use, sale or receipt of those assets. This use of fair values inthis circumstance is not a change from national GAAP and is not a policy choice. Therefore, it is outside the scope of this study.
In circumstance 5, fair values are used for the subsequent measurement of assets and liabilities at each balance sheet dateand, therefore, must be updated at each balance sheet date. This use of fair values represents either a policy choice or a changefrom national GAAP and is, therefore, the primary focus of this study. We examine those accounting issues on which IFRSrequire the use of fair value measurement (derivatives, held-for-trading and available-for-sale financial assets and somebiological assets). We also examine those accounting issues onwhich IFRS allow a choice of either fair value measurement orhistorical cost-based measurement (property, plant and equipment, investment property, intangible assets and otherfinancial assets and financial liabilities).
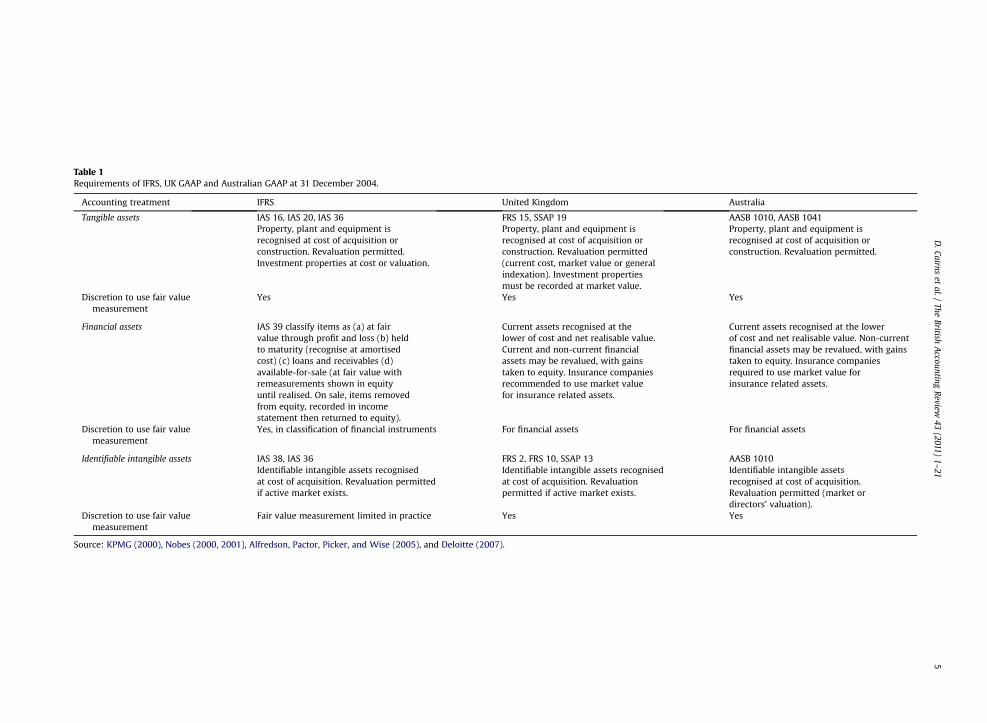
We now discuss the requirements of IFRS, UK GAAP and Australian GAAP in 2005 (shown in Table 1) for items within thescope of the study and relevant prior research.
2.1. Tangible assets – property, plant and equipment (other than investment property)
Under UK GAAP, Australian GAAP and IFRS, items of property, plant and equipment are measured at initial recognition atthe cost of acquisition or construction. They are measured subsequently using either a cost model or a revaluation model(based on the use of fair values). Thus discretion to use fair value measurement at each balance sheet date exists under IFRS,UKGAAP and Australian GAAP (Table 1). Under the cost model, items are measured at cost less accumulated depreciation andany accumulated impairment losses. Under the revaluation model, items are measured at fair value less any subsequentaccumulated depreciation and accumulated impairment losses after the date of the revaluation. An entity may use therevaluation model provided that it applies the model to all the items in the same class of property, plant and equipment,the revaluations are made to fair value and revaluations are carried out with sufficient regularity that the carrying amounts ofthe revalued assets do not differ materially from fair value at the balance sheet date.5
In the past, many UK and Australian companies used the revaluation model. Their practice has been explained in terms ofcontracting theory and political costs (Brown et al., 1992; Cotter & Zimmer, 1995; Whittred & Chan, 1992). Other motivationsare to communicate performance expectations and to avoid takeovers when assets are undervalued (Aboody et al., 1999). Linand Peasnell (2000a, 2000b) find that specific national factors, in this case equity depletion resulting primarily from thewriting off of goodwill against equity on acquisition, influence revaluation decisions. Aboody et al. (1999) show that in the UK43% of companies recorded an asset revaluation reserve (based on company-years 1983–1995). Barth and Clinch (1998) reportthat 45% of Australian companies revalued property, plant and equipment in the period 1991–1995. However, the use of therevaluation model declined substantially in the UK and Australia from the early 1990s as economies experienced lowerinflation and accounting standards introduced stricter revaluation requirements.6
2.2. Tangible assets – investment property
UnderUKGAAP, Australian GAAPand IFRS, investment property ismeasured at initial recognition at the cost of acquisition orconstruction (Table 1).UnderUKGAAP, investmentproperty ismeasuredat subsequentbalance sheet dates atopenmarketvalueand no depreciation is charged. The use of the cost model is prohibited (SSAP 19).7 Australian GAAP did not include a separatestandard for investmentpropertyand thusAASB1010appliedwhichallowed theuseof a costmodel ora revaluationmodel, bothwith depreciation. Many Australian companies with investment properties used the revaluation model. IAS 40 Investmentproperty reflects a compromise between the two approaches. It requires that investment property is measured at subsequentbalance sheet dates using either a fair model (without depreciation) or the cost model (with depreciation). While IAS 40expresses a clear preference for the fair valuemodel, companies have discretion about using fair valuemeasurement (Table 1).8
5 This restriction was added in the 1993 version of IAS 16 and, as a consequence in, the UK’s FRS 15 and Australia’s AASB 1010.6 Companies were permitted to retain FRS 15 and AASB 1010 revaluations as ‘deemed cost’ under standards revised in the 1990s.7 The requirement to use market value stems from the opposition of UK property investment companies to the depreciation of investment property and
their belief that depreciation could not be segregated from other changes in value. The property companies persuaded the then Accounting StandardsCommittee that the use of cost less depreciation for investment property would not result in a true and fair view (Rutherford, 2007). However, as the ECFourth Directive (and, hence, UK company law) requires the depreciation, UK companies must use the true and fair override in company lawwhen applyingSSAP 19 in order to overcome the conflict with the law.
8 The IFRS approach to investment property is one example where the UK persuaded the former IASC to follow its lead even though other countries(including Australia) did not share the UK’s objection to the depreciation of investment property. However, the IAS 40 fair value model differs from the SSAP19 model. Under the IAS 40 fair value model, changes in fair value are included in profit and loss whereas SSAP 19 includes them in equity. The definition ofinvestment property in IAS 40 is, in some respects, broader than the definition in SSAP 19.
Table 1Requirements of IFRS, UK GAAP and Australian GAAP at 31 December 2004.
Accounting treatment IFRS United Kingdom Australia
Tangible assets IAS 16, IAS 20, IAS 36 FRS 15, SSAP 19 AASB 1010, AASB 1041Property, plant and equipment isrecognised at cost of acquisition orconstruction. Revaluation permitted.Investment properties at cost or valuation.
Property, plant and equipment isrecognised at cost of acquisition orconstruction. Revaluation permitted(current cost, market value or generalindexation). Investment propertiesmust be recorded at market value.
Property, plant and equipment isrecognised at cost of acquisition orconstruction. Revaluation permitted.
Discretion to use fair valuemeasurement
Yes Yes Yes
Financial assets IAS 39 classify items as (a) at fairvalue through profit and loss (b) heldto maturity (recognise at amortisedcost) (c) loans and receivables (d)available-for-sale (at fair value withremeasurements shown in equityuntil realised. On sale, items removedfrom equity, recorded in incomestatement then returned to equity).
Current assets recognised at thelower of cost and net realisable value.Current and non-current financialassets may be revalued, with gainstaken to equity. Insurance companiesrecommended to use market valuefor insurance related assets.
Current assets recognised at the lowerof cost and net realisable value. Non-currentfinancial assets may be revalued, with gainstaken to equity. Insurance companiesrequired to use market value forinsurance related assets.
Discretion to use fair valuemeasurement
Yes, in classification of financial instruments For financial assets For financial assets
Identifiable intangible assets recognisedat cost of acquisition. Revaluationpermitted if active market exists.
Identifiable intangible assetsrecognised at cost of acquisition.Revaluation permitted (market ordirectors’ valuation).
Discretion to use fair valuemeasurement
Fair value measurement limited in practice Yes Yes
Source: KPMG (2000), Nobes (2000, 2001), Alfredson, Pactor, Picker, and Wise (2005), and Deloitte (2007).
D.Cairns
etal./
TheBritish
Accounting
Review43
(2011)1–21
5
D. Cairns et al. / The British Accounting Review 43 (2011) 1–216
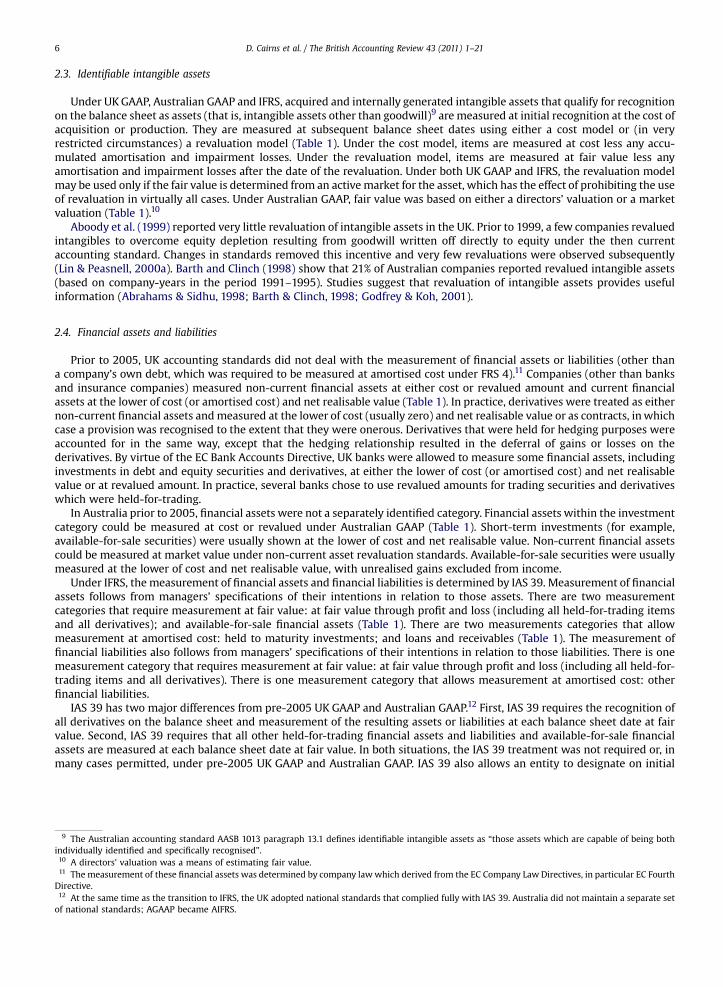
2.3. Identifiable intangible assets
Under UKGAAP, Australian GAAP and IFRS, acquired and internally generated intangible assets that qualify for recognitionon the balance sheet as assets (that is, intangible assets other than goodwill)9 are measured at initial recognition at the cost ofacquisition or production. They are measured at subsequent balance sheet dates using either a cost model or (in veryrestricted circumstances) a revaluation model (Table 1). Under the cost model, items are measured at cost less any accu-mulated amortisation and impairment losses. Under the revaluation model, items are measured at fair value less anyamortisation and impairment losses after the date of the revaluation. Under both UK GAAP and IFRS, the revaluation modelmay be used only if the fair value is determined from an active market for the asset, which has the effect of prohibiting the useof revaluation in virtually all cases. Under Australian GAAP, fair value was based on either a directors’ valuation or a marketvaluation (Table 1).10
Aboody et al. (1999) reported very little revaluation of intangible assets in the UK. Prior to 1999, a few companies revaluedintangibles to overcome equity depletion resulting from goodwill written off directly to equity under the then currentaccounting standard. Changes in standards removed this incentive and very few revaluations were observed subsequently(Lin & Peasnell, 2000a). Barth and Clinch (1998) show that 21% of Australian companies reported revalued intangible assets(based on company-years in the period 1991–1995). Studies suggest that revaluation of intangible assets provides usefulinformation (Abrahams & Sidhu, 1998; Barth & Clinch, 1998; Godfrey & Koh, 2001).
2.4. Financial assets and liabilities
Prior to 2005, UK accounting standards did not deal with the measurement of financial assets or liabilities (other thana company’s own debt, which was required to be measured at amortised cost under FRS 4).11 Companies (other than banksand insurance companies) measured non-current financial assets at either cost or revalued amount and current financialassets at the lower of cost (or amortised cost) and net realisable value (Table 1). In practice, derivatives were treated as eithernon-current financial assets andmeasured at the lower of cost (usually zero) and net realisable value or as contracts, inwhichcase a provision was recognised to the extent that they were onerous. Derivatives that were held for hedging purposes wereaccounted for in the same way, except that the hedging relationship resulted in the deferral of gains or losses on thederivatives. By virtue of the EC Bank Accounts Directive, UK banks were allowed to measure some financial assets, includinginvestments in debt and equity securities and derivatives, at either the lower of cost (or amortised cost) and net realisablevalue or at revalued amount. In practice, several banks chose to use revalued amounts for trading securities and derivativeswhich were held-for-trading.
In Australia prior to 2005, financial assets were not a separately identified category. Financial assets within the investmentcategory could be measured at cost or revalued under Australian GAAP (Table 1). Short-term investments (for example,available-for-sale securities) were usually shown at the lower of cost and net realisable value. Non-current financial assetscould be measured at market value under non-current asset revaluation standards. Available-for-sale securities were usuallymeasured at the lower of cost and net realisable value, with unrealised gains excluded from income.
Under IFRS, the measurement of financial assets and financial liabilities is determined by IAS 39. Measurement of financialassets follows from managers’ specifications of their intentions in relation to those assets. There are two measurementcategories that require measurement at fair value: at fair value through profit and loss (including all held-for-trading itemsand all derivatives); and available-for-sale financial assets (Table 1). There are two measurements categories that allowmeasurement at amortised cost: held to maturity investments; and loans and receivables (Table 1). The measurement offinancial liabilities also follows from managers’ specifications of their intentions in relation to those liabilities. There is onemeasurement category that requires measurement at fair value: at fair value through profit and loss (including all held-for-trading items and all derivatives). There is one measurement category that allows measurement at amortised cost: otherfinancial liabilities.
IAS 39 has two major differences from pre-2005 UK GAAP and Australian GAAP.12 First, IAS 39 requires the recognition ofall derivatives on the balance sheet and measurement of the resulting assets or liabilities at each balance sheet date at fairvalue. Second, IAS 39 requires that all other held-for-trading financial assets and liabilities and available-for-sale financialassets are measured at each balance sheet date at fair value. In both situations, the IAS 39 treatment was not required or, inmany cases permitted, under pre-2005 UK GAAP and Australian GAAP. IAS 39 also allows an entity to designate on initial
9 The Australian accounting standard AASB 1013 paragraph 13.1 defines identifiable intangible assets as “those assets which are capable of being bothindividually identified and specifically recognised”.10 A directors’ valuation was a means of estimating fair value.11 The measurement of these financial assets was determined by company lawwhich derived from the EC Company Law Directives, in particular EC FourthDirective.12 At the same time as the transition to IFRS, the UK adopted national standards that complied fully with IAS 39. Australia did not maintain a separate setof national standards; AGAAP became AIFRS.
D. Cairns et al. / The British Accounting Review 43 (2011) 1–21 7
recognition many financial assets or financial liabilities that would otherwise be measured at amortised cost as at fair valuethrough profit or loss and, therefore, measure them at fair value at each balance sheet date (the so-called ‘fair value option’).13
Landsman (2007) reviews studies suggesting that fair values of financial instruments (notably banks’ investment secu-rities) are relevant to investors, providing a rationale for the choice of fair value measurement by some companies prior to2005. Fair value measurement of financial assets has been strongly opposed by some financial statement preparers, whoclaim that such measurements are unreliable and introduce excessive volatility (Beresford, 1998; Penman, 2007). However,opposition could also arise because financial instrument standards may restrict companies’ flexibility in managing theirfinancial portfolios (Chalmers & Godfrey, 2000; Johnson & Swieringa, 1996).
2.5. Share-based payment
Prior to the adoption of IFRS 2 Share-based payment, UK and Australian accounting standards did not deal comprehensivelywith share-based payment, in particular all share-based payments to employees, including the granting of share options.Under pre-2005 UK GAAP, some share-based payments to employees were measured at their intrinsic value at grant date inaccordance with UITF Abstract 17 but others were exempt from this requirement and were recognised only when the shareswere issued. As a result, many equity settled share-based payments were frequently omitted from financial statements untilemployees were required to make payments or companies were required to issue shares. Furthermore, the amounts recordedwere usually limited to the amounts, if any, paid by the employees to the companies. Similarly, in Australia an expense wasrecognised on issue of shares rather than granting of options (Brown & Yew, 2002). From 2005, IFRS 2 requires companies torecognise an expense in relation to employee compensation involving shares or shares options and tomeasure this expense atthe fair value of the shares or options at grant date.
2.6. Biological assets and harvested agricultural produce
Prior to 2005, UK GAAP did not deal comprehensively with the measurement of biological assets (living plants andanimals) and harvested agricultural produce. Under pre-2005 UK GAAP, biological assets were usually measured usinga cost model (at cost or cost less accumulated depreciation and any impairment losses). Harvested agricultural producewas accounted for in the same way as inventories and measured at the lower of cost and net realisable value. IAS 41Agriculture requires that biological assets are measured on acquisition and at subsequent balance sheet dates at fair valueless costs to sell, unless the entity determines on initial recognition that fair value cannot be determined reliably. Har-vested agricultural produce is always measured at fair value less costs to sell. Fair value less costs to sell at the point ofharvest is cost at that date for the purposes of measuring subsequent inventories. These requirements differedsubstantially from UK GAAP but are largely consistent with prior Australian GAAP. AASB 1037 (which required marketvalue measurement for biological assets and produce, with changes in value taken to the income statement) was issued in1998.
3. Hypotheses
We examine the use of fair value measurement in the following three scenarios:
(A) for the measurement of share-based payments in accordance with IFRS 2 (for which there were no equivalent pre-2005UK GAAP or Australian GAAP);
(B) for the measurement of the deemed cost of property, plant and equipment, investment property and intangible assets inaccordance with IFRS 1 on the transition to IFRS from UK GAAP and Australian GAAP (a use which is unique to IFRS andwhich created an opportunity to incorporate one-off revaluations to fair value or carry over old revaluations into their IFRSfinancial statements); and
(C) for the subsequent measurement of property, plant and equipment (IAS 16), investment property (IAS 40), intangibleassets (IAS 38), biological assets (IAS 41), harvested agricultural produce (IAS 41), and financial assets and financialliabilities (IAS 39) at each balance sheet date.
We expect companies to use fair value measurement when required to do so by accounting standards. That is, we expectcompanies to comply with themandatory fair valuemeasurement requirements in IAS 39, IAS 41 and IFRS 2. Large companies(as included in this study) have both the available resources and necessary incentives to comply with accounting standards.They have reputations to protect, meaning theywill seek to complywith laws and accounting standards to receive unqualified
13 In practice, few entities use this fair value option and those that use it do so for only selected items, for example, loans that contain embeddedderivatives and for other items for which it would simplify hedge accounting or eliminate a mismatch between the measurement of related financial assetsand financial liabilities.
D. Cairns et al. / The British Accounting Review 43 (2011) 1–218
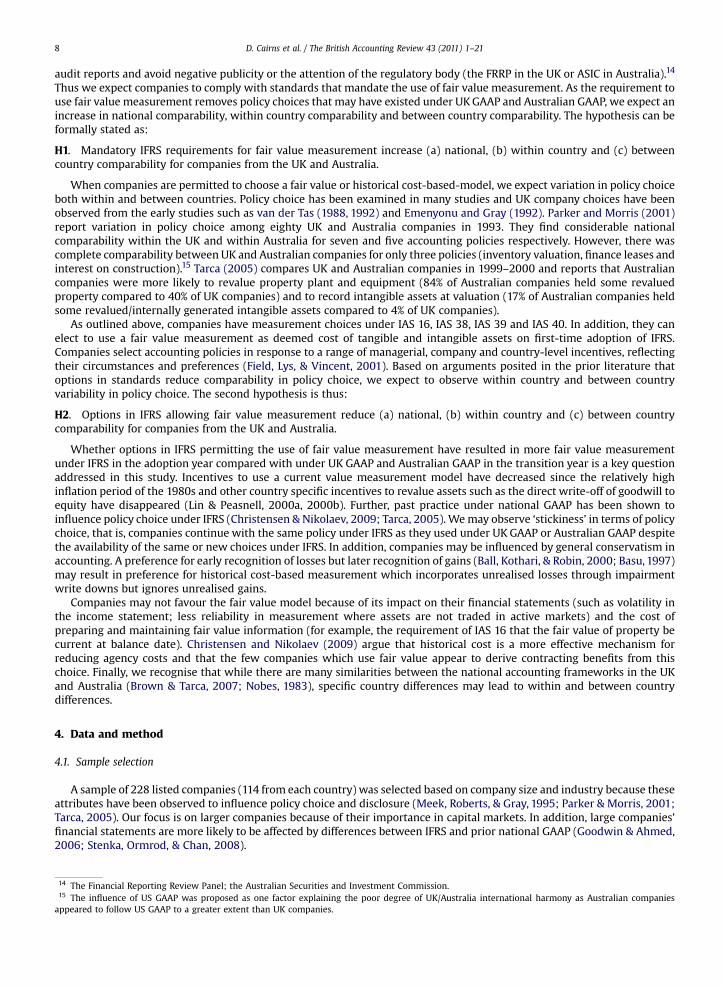
audit reports and avoid negative publicity or the attention of the regulatory body (the FRRP in the UK or ASIC in Australia).14
Thus we expect companies to comply with standards that mandate the use of fair value measurement. As the requirement touse fair value measurement removes policy choices that may have existed under UKGAAP and Australian GAAP, we expect anincrease in national comparability, within country comparability and between country comparability. The hypothesis can beformally stated as:
H1. Mandatory IFRS requirements for fair value measurement increase (a) national, (b) within country and (c) betweencountry comparability for companies from the UK and Australia.
When companies are permitted to choose a fair value or historical cost-based-model, we expect variation in policy choiceboth within and between countries. Policy choice has been examined in many studies and UK company choices have beenobserved from the early studies such as van der Tas (1988, 1992) and Emenyonu and Gray (1992). Parker and Morris (2001)report variation in policy choice among eighty UK and Australia companies in 1993. They find considerable nationalcomparability within the UK and within Australia for seven and five accounting policies respectively. However, there wascomplete comparability between UK and Australian companies for only three policies (inventory valuation, finance leases andinterest on construction).15 Tarca (2005) compares UK and Australian companies in 1999–2000 and reports that Australiancompanies were more likely to revalue property plant and equipment (84% of Australian companies held some revaluedproperty compared to 40% of UK companies) and to record intangible assets at valuation (17% of Australian companies heldsome revalued/internally generated intangible assets compared to 4% of UK companies).
As outlined above, companies have measurement choices under IAS 16, IAS 38, IAS 39 and IAS 40. In addition, they canelect to use a fair value measurement as deemed cost of tangible and intangible assets on first-time adoption of IFRS.Companies select accounting policies in response to a range of managerial, company and country-level incentives, reflectingtheir circumstances and preferences (Field, Lys, & Vincent, 2001). Based on arguments posited in the prior literature thatoptions in standards reduce comparability in policy choice, we expect to observe within country and between countryvariability in policy choice. The second hypothesis is thus:
H2. Options in IFRS allowing fair value measurement reduce (a) national, (b) within country and (c) between countrycomparability for companies from the UK and Australia.
Whether options in IFRS permitting the use of fair value measurement have resulted in more fair value measurementunder IFRS in the adoption year compared with under UK GAAP and Australian GAAP in the transition year is a key questionaddressed in this study. Incentives to use a current value measurement model have decreased since the relatively highinflation period of the 1980s and other country specific incentives to revalue assets such as the direct write-off of goodwill toequity have disappeared (Lin & Peasnell, 2000a, 2000b). Further, past practice under national GAAP has been shown toinfluence policy choice under IFRS (Christensen & Nikolaev, 2009; Tarca, 2005). Wemay observe ‘stickiness’ in terms of policychoice, that is, companies continue with the same policy under IFRS as they used under UK GAAP or Australian GAAP despitethe availability of the same or new choices under IFRS. In addition, companies may be influenced by general conservatism inaccounting. A preference for early recognition of losses but later recognition of gains (Ball, Kothari, & Robin, 2000; Basu, 1997)may result in preference for historical cost-based measurement which incorporates unrealised losses through impairmentwrite downs but ignores unrealised gains.
Companies may not favour the fair value model because of its impact on their financial statements (such as volatility inthe income statement; less reliability in measurement where assets are not traded in active markets) and the cost ofpreparing and maintaining fair value information (for example, the requirement of IAS 16 that the fair value of property becurrent at balance date). Christensen and Nikolaev (2009) argue that historical cost is a more effective mechanism forreducing agency costs and that the few companies which use fair value appear to derive contracting benefits from thischoice. Finally, we recognise that while there are many similarities between the national accounting frameworks in the UKand Australia (Brown & Tarca, 2007; Nobes, 1983), specific country differences may lead to within and between countrydifferences.
4. Data and method
4.1. Sample selection
A sample of 228 listed companies (114 from each country) was selected based on company size and industry because theseattributes have been observed to influence policy choice and disclosure (Meek, Roberts, & Gray, 1995; Parker & Morris, 2001;Tarca, 2005). Our focus is on larger companies because of their importance in capital markets. In addition, large companies’financial statements are more likely to be affected by differences between IFRS and prior national GAAP (Goodwin & Ahmed,2006; Stenka, Ormrod, & Chan, 2008).
14 The Financial Reporting Review Panel; the Australian Securities and Investment Commission.15 The influence of US GAAP was proposed as one factor explaining the poor degree of UK/Australia international harmony as Australian companiesappeared to follow US GAAP to a greater extent than UK companies.
D. Cairns et al. / The British Accounting Review 43 (2011) 1–21 9
The largest companies by market capitalisation in each of 22 industry sectors (based on GICS classification) wereselected.16 The UK companies range in size from GBP million 100.39 to 106,631.00 (median 2750.42) and are larger than theAustralian companies, which range in size fromGBPmillion 48.49 to 44,125.75 (median 939.26). For each country, the sampleincludes 13 companies from Materials; nine each from Consumer Services & Supplies and Energy; eight each from Banks,Capital Goods and Health Care Equipment & Services; six each from Diversified Financials, Food, Beverage & Tobacco, Mediaand Real Estate; and five or fewer companies from the other sectors.
Annual reports were collected directly from company websites for two years, being the first IFRS reporting period (theadoption year) and the latest period presented under UK GAAP or Australian GAAP (the transition year).17 Year-end datesvaried, with the most common date for the adoption year being 31 December 2005 in the UK (66 companies, 57% of sample)and 30 June 2006 in Australia (49 companies, 61% of sample).
4.2. Data collection
A checklist was developed by the researchers to collect data about policy choice in relation to the measurement of theselected itemsunder IFRS in the adoptionyear andunderUKGAAPandAustralianGAAP in the transitionyear (see Appendix 1).It contains 20 items relating to the following IFRS and their equivalents under UK GAAP and Australian GAAP: IAS 16 Propertyplant and equipment (four items), IAS 40 Investment property (two items), IAS 38 Intangible assets (two items), IAS 41 Agriculture(three items), IAS 39 Recognition andmeasurement of financial instruments (five items), IFRS 2 Share-based payment (two items)and IFRS 1 First-time adoption of IFRS (four items).
Each company’s annual report was read and its policy choices under IFRS (adoption year) and UKGAAP or Australian GAAP(transition year) were scored 1 or 0 to record the policies used in each year. For example, in relation to property, plant andequipment, the coders recorded the measurement method used (cost, deemed cost or revaluation) for property and for plantand equipment under IFRS (adoption year) and UKGAAP or Australian GAAP (transition year). (Information in relation to IFRS1 First-time adoption of IFRS was collected as at the transition date only, e.g. the deemed cost information for property, plantand equipment.)
If a company’s accounting policy for a particular item was not stated and could not be determined from other notedisclosures, the company was shown as ‘not applicable’ in relation to that item. Since companies provide detailed notedisclosures to comply with IFRS, wewere able to ascertain that the policy was not applicable rather than simply not disclosed.Thus, we believe the not applicable category captures companies which do not hold that class of asset, rather than companieswhich do not disclose their policy choice. In addition, we checked that the statements in the accounting policy note werecorrect by checking the income statement/balance sheet notes. If ‘boilerplate’ policy notes were used, we made a correctclassification by referring to the financial statement notes. For example, some companies gave policy notes for all four classesof financial instruments. We recorded policy choices for only those financial instruments actually held by the company, asdetermined from the balance sheet notes.
In relation to prior national GAAPs, additional data collection was required to capture companies’ policies. For financialinstruments, prior national GAAP did not use the categories required by IAS 39. Therefore we classified financial instrumentsas disclosed under national GAAP to the IAS 39 categories to allow comparison between the transition and adoption years.Similarly, the financial statements under national GAAP did not provide disclosures about share-based payments which weredirectly comparable to IFRS accounts. Therefore, we reconstructed the GAAP information from that provided in various placesin the financial statements and annual reports.
In general, consistency and accuracy of coding was promoted in several ways. In each country, the coder was trained by thechief researcher and all coding was completed by one coder to promote consistency. It was then reviewed by one of the chiefresearchers to ensure accuracy. Finally, the two chief researchers compared coding of UK and Australian data to ensurecomparability.
4.3. Data analysis
As outlined above, many prior studies have used indices to compare accounting policy choices by companies and, hence,measure comparability between and within countries (Archer et al., 1995; Emenyonu & Gray, 1992; Herrmann & Thomas,1995; Parker & Morris, 2001; van der Tas, 1988, 1992). We employ T indices developed by Taplin (2004), which extend theH, C and I indices developed by van der Tas (1988) to a flexible framework containing many specific indices. This flexibilityenables different indices to be used for different policy choices or to examine sensitivity of conclusions to the choice of indexand provides a simple way of describing which particular index is computed in a particular situation.
16 Automobiles and Components, Banks, Capital Goods, Commercial Services & Supplies, Consumer Durables & Apparel, Consumer Services, DiversifiedFinancials, Energy, Food & Staples Retailing, Food, Beverage & Tobacco, Health Care Equipment & Services, Insurance, Materials, Media, Pharmaceuticals,Biotechnology & Life Sciences, Real Estate, Retailing, Software & Services, Technology, Hardware & Equipment, Telecommunications Services, Transportationand Utilities.17 As defined in IFRS 1 First-time adoption of IFRS.
D. Cairns et al. / The British Accounting Review 43 (2011) 1–2110
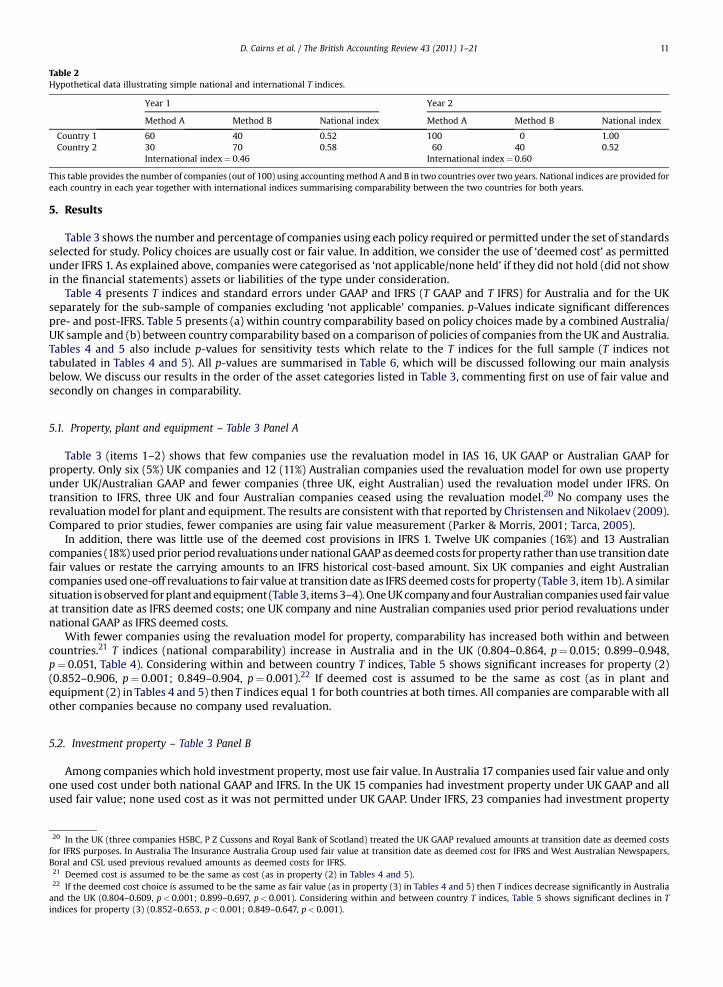
The T index has the simple interpretation as the probability that two randomly selected companies have financialstatements that are comparable.18 It takes values from 0 (when all companies have financial statements non-comparable toeach other) to 1 (when all companies have financial statements that are comparable with each other). Table 2 provideshypothetical data and resulting T indices for two possible policy choices (A and B) in two countries (1 and 2) for two years toillustrate how indices quantify comparability. For example, in this data 60 companies use accounting method A and 40 useaccountingmethod B in country 1 during year 1. The corresponding T index value of T¼ 0.62þ 0.42¼ 0.52 indicates that if twocompanies were randomly selected from country 1 there is a 52% chance their accounts will use the samemethod in year 1. Inyear 2 all companies in country 1 use method A so the comparability increases to 100%.
The international index for year 1 (T¼ 0.6� 0.3þ 0.4� 0.7¼ 0.46) compares companies in different countries by forcingthe two randomly selected companies to be from different countries. Although this summary of international comparabilityincreases to 0.60 in year 2, this occurs with a decrease in comparability within country 2 even though companies from bothcountries are more likely to use method A in year 2 compared to year 1. Thus different indices add insights into concepts ofcomparability from different perspectives.
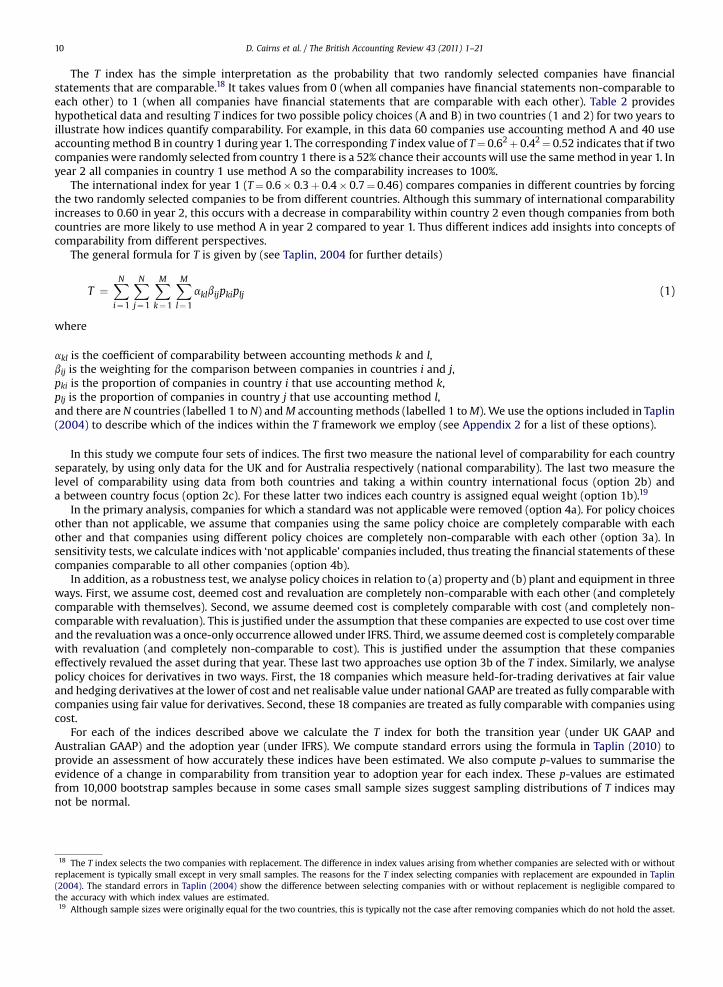
The general formula for T is given by (see Taplin, 2004 for further details)
T ¼XN
i¼1
XN
j¼1
XM
k¼1
XM
l¼1
aklbijpkiplj (1)
where
akl is the coefficient of comparability between accounting methods k and l,bij is the weighting for the comparison between companies in countries i and j,pki is the proportion of companies in country i that use accounting method k,plj is the proportion of companies in country j that use accounting method l,and there are N countries (labelled 1 to N) andM accounting methods (labelled 1 toM). We use the options included in Taplin(2004) to describe which of the indices within the T framework we employ (see Appendix 2 for a list of these options).
In this study we compute four sets of indices. The first two measure the national level of comparability for each countryseparately, by using only data for the UK and for Australia respectively (national comparability). The last two measure thelevel of comparability using data from both countries and taking a within country international focus (option 2b) anda between country focus (option 2c). For these latter two indices each country is assigned equal weight (option 1b).19
In the primary analysis, companies for which a standard was not applicable were removed (option 4a). For policy choicesother than not applicable, we assume that companies using the same policy choice are completely comparable with eachother and that companies using different policy choices are completely non-comparable with each other (option 3a). Insensitivity tests, we calculate indices with ‘not applicable’ companies included, thus treating the financial statements of thesecompanies comparable to all other companies (option 4b).
In addition, as a robustness test, we analyse policy choices in relation to (a) property and (b) plant and equipment in threeways. First, we assume cost, deemed cost and revaluation are completely non-comparable with each other (and completelycomparable with themselves). Second, we assume deemed cost is completely comparable with cost (and completely non-comparable with revaluation). This is justified under the assumption that these companies are expected to use cost over timeand the revaluationwas a once-only occurrence allowed under IFRS. Third, we assume deemed cost is completely comparablewith revaluation (and completely non-comparable to cost). This is justified under the assumption that these companieseffectively revalued the asset during that year. These last two approaches use option 3b of the T index. Similarly, we analysepolicy choices for derivatives in two ways. First, the 18 companies which measure held-for-trading derivatives at fair valueand hedging derivatives at the lower of cost and net realisable value under national GAAP are treated as fully comparable withcompanies using fair value for derivatives. Second, these 18 companies are treated as fully comparable with companies usingcost.
For each of the indices described above we calculate the T index for both the transition year (under UK GAAP andAustralian GAAP) and the adoption year (under IFRS). We compute standard errors using the formula in Taplin (2010) toprovide an assessment of how accurately these indices have been estimated. We also compute p-values to summarise theevidence of a change in comparability from transition year to adoption year for each index. These p-values are estimatedfrom 10,000 bootstrap samples because in some cases small sample sizes suggest sampling distributions of T indices maynot be normal.
18 The T index selects the two companies with replacement. The difference in index values arising from whether companies are selected with or withoutreplacement is typically small except in very small samples. The reasons for the T index selecting companies with replacement are expounded in Taplin(2004). The standard errors in Taplin (2004) show the difference between selecting companies with or without replacement is negligible compared tothe accuracy with which index values are estimated.19 Although sample sizes were originally equal for the two countries, this is typically not the case after removing companies which do not hold the asset.
Table 2Hypothetical data illustrating simple national and international T indices.
Year 1 Year 2
Method A Method B National index Method A Method B National index
International index¼ 0.46 International index¼ 0.60
This table provides the number of companies (out of 100) using accountingmethod A and B in two countries over two years. National indices are provided foreach country in each year together with international indices summarising comparability between the two countries for both years.
D. Cairns et al. / The British Accounting Review 43 (2011) 1–21 11
5. Results
Table 3 shows the number and percentage of companies using each policy required or permitted under the set of standardsselected for study. Policy choices are usually cost or fair value. In addition, we consider the use of ‘deemed cost’ as permittedunder IFRS 1. As explained above, companies were categorised as ‘not applicable/none held’ if they did not hold (did not showin the financial statements) assets or liabilities of the type under consideration.
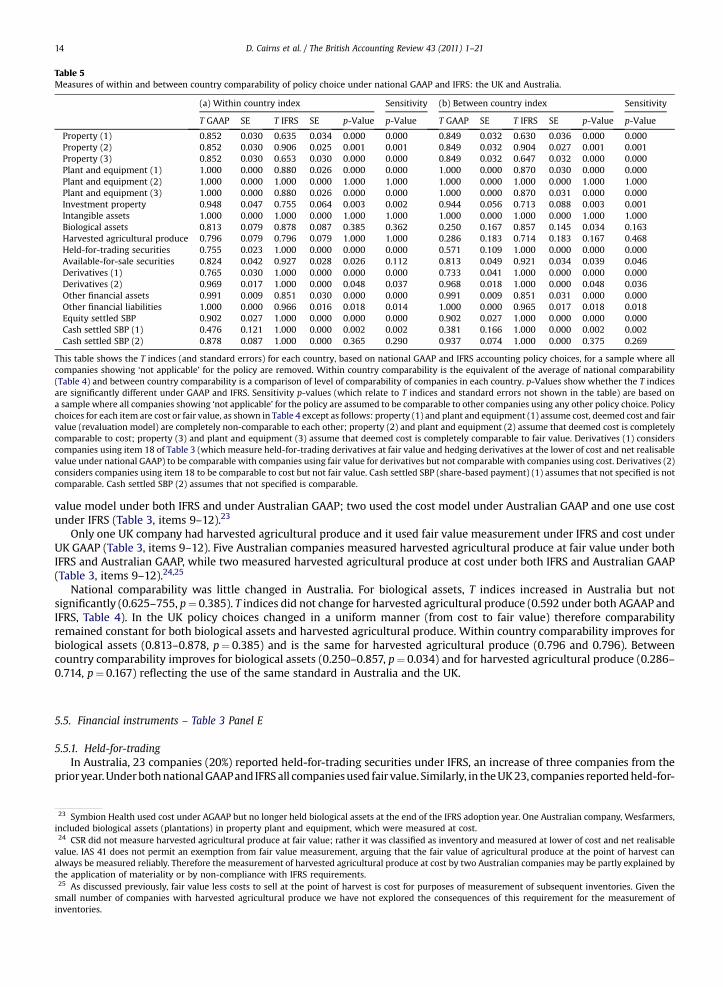
Table 4 presents T indices and standard errors under GAAP and IFRS (T GAAP and T IFRS) for Australia and for the UKseparately for the sub-sample of companies excluding ‘not applicable’ companies. p-Values indicate significant differencespre- and post-IFRS. Table 5 presents (a) within country comparability based on policy choices made by a combined Australia/UK sample and (b) between country comparability based on a comparison of policies of companies from the UK and Australia.Tables 4 and 5 also include p-values for sensitivity tests which relate to the T indices for the full sample (T indices nottabulated in Tables 4 and 5). All p-values are summarised in Table 6, which will be discussed following our main analysisbelow. We discuss our results in the order of the asset categories listed in Table 3, commenting first on use of fair value andsecondly on changes in comparability.
5.1. Property, plant and equipment – Table 3 Panel A
Table 3 (items 1–2) shows that few companies use the revaluation model in IAS 16, UK GAAP or Australian GAAP forproperty. Only six (5%) UK companies and 12 (11%) Australian companies used the revaluation model for own use propertyunder UK/Australian GAAP and fewer companies (three UK, eight Australian) used the revaluation model under IFRS. Ontransition to IFRS, three UK and four Australian companies ceased using the revaluation model.20 No company uses therevaluationmodel for plant and equipment. The results are consistent with that reported by Christensen and Nikolaev (2009).Compared to prior studies, fewer companies are using fair value measurement (Parker & Morris, 2001; Tarca, 2005).
In addition, there was little use of the deemed cost provisions in IFRS 1. Twelve UK companies (16%) and 13 Australiancompanies (18%) usedprior period revaluationsunder nationalGAAPasdeemedcosts for property rather thanuse transition datefair values or restate the carrying amounts to an IFRS historical cost-based amount. Six UK companies and eight Australiancompanies used one-off revaluations to fair value at transition date as IFRS deemed costs for property (Table 3, item1b). A similarsituation isobserved forplant andequipment (Table3, items3–4).OneUKcompanyand fourAustralian companies used fair valueat transition date as IFRS deemed costs; one UK company and nine Australian companies used prior period revaluations undernational GAAP as IFRS deemed costs.
With fewer companies using the revaluation model for property, comparability has increased both within and betweencountries.21 T indices (national comparability) increase in Australia and in the UK (0.804–0.864, p¼ 0.015; 0.899–0.948,p¼ 0.051, Table 4). Considering within and between country T indices, Table 5 shows significant increases for property (2)(0.852–0.906, p¼ 0.001; 0.849–0.904, p¼ 0.001).22 If deemed cost is assumed to be the same as cost (as in plant andequipment (2) in Tables 4 and 5) then T indices equal 1 for both countries at both times. All companies are comparable with allother companies because no company used revaluation.
5.2. Investment property – Table 3 Panel B
Among companies which hold investment property, most use fair value. In Australia 17 companies used fair value and onlyone used cost under both national GAAP and IFRS. In the UK 15 companies had investment property under UK GAAP and allused fair value; none used cost as it was not permitted under UK GAAP. Under IFRS, 23 companies had investment property
20 In the UK (three companies HSBC, P Z Cussons and Royal Bank of Scotland) treated the UK GAAP revalued amounts at transition date as deemed costsfor IFRS purposes. In Australia The Insurance Australia Group used fair value at transition date as deemed cost for IFRS and West Australian Newspapers,Boral and CSL used previous revalued amounts as deemed costs for IFRS.21 Deemed cost is assumed to be the same as cost (as in property (2) in Tables 4 and 5).22 If the deemed cost choice is assumed to be the same as fair value (as in property (3) in Tables 4 and 5) then T indices decrease significantly in Australiaand the UK (0.804–0.609, p< 0.001; 0.899–0.697, p< 0.001). Considering within and between country T indices, Table 5 shows significant declines in Tindices for property (3) (0.852–0.653, p< 0.001; 0.849–0.647, p< 0.001).
Table 3Measurement policy choice under national GAAP and IFRS 2004–2006.
UK GAAP UK IFRS AUST GAAP AUST IFRS
Transition year Adoption year Transition year Adoption year
Not applicable/none held 105 92 103 90 107 94 106 93
This table presents data about policy choice by companies from the UK and Australia under national GAAP in transition year and under IFRS in adoption year.The order of the table follows the data collection checklist (Appendix 1).
D. Cairns et al. / The British Accounting Review 43 (2011) 1–2112
Table 4Measures of comparability of policy choice under national GAAP and IFRS: national comparability for the UK and Australia.
UK Sensitivity Australia Sensitivity
T GAAP SE T IFRS SE p-Value p-Value T GAAP SE T IFRS SE p-Value p-Value
This table shows the T indices (and standard errors) measuring national comparability for each country, based on national GAAP and IFRS accounting policychoices, for a sample where all companies showing ‘not applicable’ for the policy are removed. p-Values show whether the T indices are significantlydifferent under GAAP and IFRS. Sensitivity p-values (which relate to T indices and standard errors not shown in the table) are based on a sample where allcompanies showing ‘not applicable’ for the policy are assumed to be comparable to other companies using any other policy choice. Policy choices for eachitem are cost or fair value, as shown in Table 4 except as follows: property (1) and plant and equipment (1) assume cost, deemed cost and fair value(revaluation model) are completely non-comparable to each other; property (2) and plant and equipment (2) assume that deemed cost is completelycomparable to cost; Property (3) and Plant and equipment (3) assume that deemed cost is completely comparable to fair value. Derivatives (1) considerscompanies using item 18 of Table 3 (which measure held-for-trading derivatives at fair value and hedging derivatives at the lower of cost and net realisablevalue under national GAAP) to be comparable with companies using fair value for derivatives but not comparable with companies using cost. Derivatives (2)considers companies using item 18 to be comparable to cost but not fair value. Cash settled SBP (share-based payment) (1) assumes that not specified is notcomparable. Cash settled SBP (2) assumes that not specified is comparable.
D. Cairns et al. / The British Accounting Review 43 (2011) 1–21 13
reflecting the broader definition of investment property in IAS 40 for which 17 companies used fair value and six used cost. NoUK or Australian company used fair value at transition date or any earlier date as IFRS deemed cost (Table 3, item 5b).
Thus, there was no change in national comparability in Australia. However, both within and between country compara-bility showed a significant decline (0.948–0.755, p¼ 0.003; 0.944–0.713, p¼ 0.003, Table 5). The adoption of the cost modelby six UK companies under IFRS led to a reduction in national comparability. T indices show a significant decline (1.000–0.614,p¼ 0.003, Table 4.) The reduction in the UK reflects, partly, the use of the cost model by companies affected by the broaderdefinition of investment property in IFRS as well as the decision by two companies to switch from the SSAP 19 fair valuemodel to the IAS 40 cost model. It illustrates the point that the introduction of options will reduce comparability if there arecompany incentives to make use of the new option.
5.3. Intangible assets – Table 3 Panel C
No companies measured intangible assets at fair value under national GAAP and IFRS (Table 3, items 7–8) and none usedfair value at transition date or any earlier date as IFRS deemed cost (Table 3, item 7b). Companies in both countries wereconstrained by the IAS 38 and IFRS 1 requirement that fair value must be determined from an active market. Some Australiancompanies had revalued identifiable intangible assets in prior periods under national GAAP. However, all of these companieshad changed their policies prior to the end of the transition year so that the national GAAP policy at transition date was ‘cost’in all cases. There is no significant change in the national comparability T indices in Australia or in the UK (Table 4) or in the Tindices measuring within and between country comparability (Table 5).
5.4. Agriculture – Table 3 Panel D
IAS 41 applies to few companies in our sample. Only two UK companies had biological assets and both used fair valuemeasurement under IFRS, a change from cost under UK GAAP (Table 3, items 9–12). In Australia, six companies used the fair
Table 5Measures of within and between country comparability of policy choice under national GAAP and IFRS: the UK and Australia.
(a) Within country index Sensitivity (b) Between country index Sensitivity
T GAAP SE T IFRS SE p-Value p-Value T GAAP SE T IFRS SE p-Value p-Value
This table shows the T indices (and standard errors) for each country, based on national GAAP and IFRS accounting policy choices, for a sample where allcompanies showing ‘not applicable’ for the policy are removed. Within country comparability is the equivalent of the average of national comparability(Table 4) and between country comparability is a comparison of level of comparability of companies in each country. p-Values show whether the T indicesare significantly different under GAAP and IFRS. Sensitivity p-values (which relate to T indices and standard errors not shown in the table) are based ona sample where all companies showing ‘not applicable’ for the policy are assumed to be comparable to other companies using any other policy choice. Policychoices for each item are cost or fair value, as shown in Table 4 except as follows: property (1) and plant and equipment (1) assume cost, deemed cost and fairvalue (revaluation model) are completely non-comparable to each other; property (2) and plant and equipment (2) assume that deemed cost is completelycomparable to cost; property (3) and plant and equipment (3) assume that deemed cost is completely comparable to fair value. Derivatives (1) considerscompanies using item 18 of Table 3 (which measure held-for-trading derivatives at fair value and hedging derivatives at the lower of cost and net realisablevalue under national GAAP) to be comparable with companies using fair value for derivatives but not comparable with companies using cost. Derivatives (2)considers companies using item 18 to be comparable to cost but not fair value. Cash settled SBP (share-based payment) (1) assumes that not specified is notcomparable. Cash settled SBP (2) assumes that not specified is comparable.
D. Cairns et al. / The British Accounting Review 43 (2011) 1–2114
value model under both IFRS and under Australian GAAP; two used the cost model under Australian GAAP and one use costunder IFRS (Table 3, items 9–12).23
Only one UK company had harvested agricultural produce and it used fair value measurement under IFRS and cost underUK GAAP (Table 3, items 9–12). Five Australian companies measured harvested agricultural produce at fair value under bothIFRS and Australian GAAP, while two measured harvested agricultural produce at cost under both IFRS and Australian GAAP(Table 3, items 9–12).24,25
National comparability was little changed in Australia. For biological assets, T indices increased in Australia but notsignificantly (0.625–755, p¼ 0.385). T indices did not change for harvested agricultural produce (0.592 under both AGAAP andIFRS, Table 4). In the UK policy choices changed in a uniform manner (from cost to fair value) therefore comparabilityremained constant for both biological assets and harvested agricultural produce. Within country comparability improves forbiological assets (0.813–0.878, p¼ 0.385) and is the same for harvested agricultural produce (0.796 and 0.796). Betweencountry comparability improves for biological assets (0.250–0.857, p¼ 0.034) and for harvested agricultural produce (0.286–0.714, p¼ 0.167) reflecting the use of the same standard in Australia and the UK.
5.5. Financial instruments – Table 3 Panel E
5.5.1. Held-for-tradingIn Australia, 23 companies (20%) reported held-for-trading securities under IFRS, an increase of three companies from the
prioryear.UnderbothnationalGAAPand IFRS all companiesused fair value. Similarly, in theUK23, companies reportedheld-for-
23 Symbion Health used cost under AGAAP but no longer held biological assets at the end of the IFRS adoption year. One Australian company, Wesfarmers,included biological assets (plantations) in property plant and equipment, which were measured at cost.24 CSR did not measure harvested agricultural produce at fair value; rather it was classified as inventory and measured at lower of cost and net realisablevalue. IAS 41 does not permit an exemption from fair value measurement, arguing that the fair value of agricultural produce at the point of harvest canalways be measured reliably. Therefore the measurement of harvested agricultural produce at cost by two Australian companies may be partly explained bythe application of materiality or by non-compliance with IFRS requirements.25 As discussed previously, fair value less costs to sell at the point of harvest is cost for purposes of measurement of subsequent inventories. Given thesmall number of companies with harvested agricultural produce we have not explored the consequences of this requirement for the measurement ofinventories.
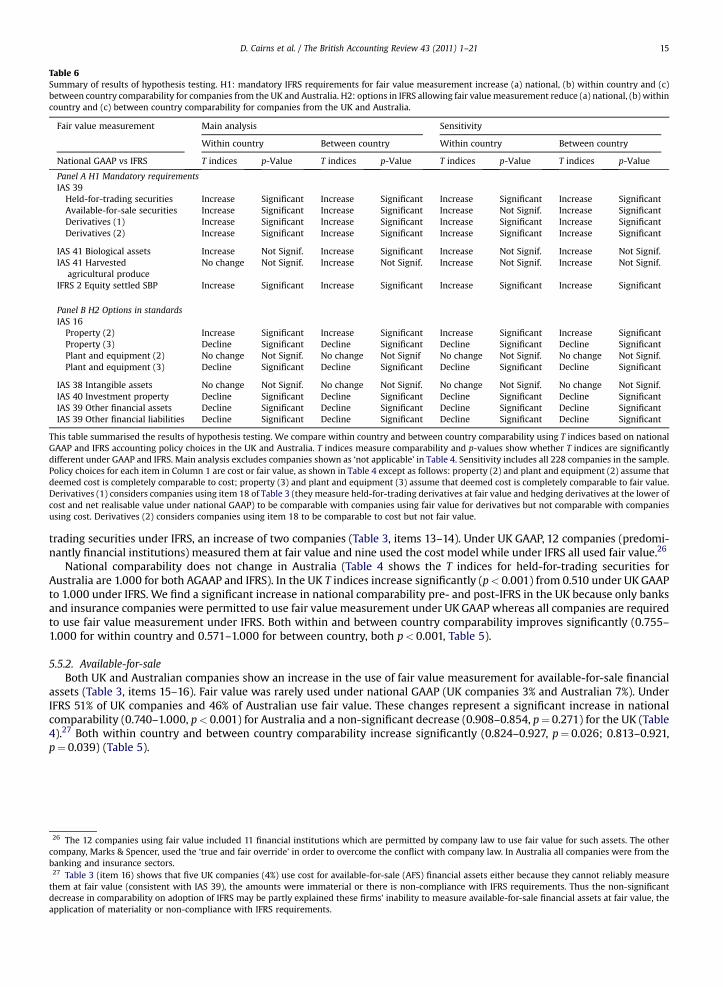
Table 6Summary of results of hypothesis testing. H1: mandatory IFRS requirements for fair value measurement increase (a) national, (b) within country and (c)between country comparability for companies from the UK and Australia. H2: options in IFRS allowing fair value measurement reduce (a) national, (b) withincountry and (c) between country comparability for companies from the UK and Australia.
Fair value measurement Main analysis Sensitivity
Within country Between country Within country Between country
National GAAP vs IFRS T indices p-Value T indices p-Value T indices p-Value T indices p-Value
Panel B H2 Options in standardsIAS 16Property (2) Increase Significant Increase Significant Increase Significant Increase SignificantProperty (3) Decline Significant Decline Significant Decline Significant Decline SignificantPlant and equipment (2) No change Not Signif. No change Not Signif No change Not Signif. No change Not Signif.Plant and equipment (3) Decline Significant Decline Significant Decline Significant Decline Significant
IAS 38 Intangible assets No change Not Signif. No change Not Signif. No change Not Signif. No change Not Signif.IAS 40 Investment property Decline Significant Decline Significant Decline Significant Decline SignificantIAS 39 Other financial assets Decline Significant Decline Significant Decline Significant Decline SignificantIAS 39 Other financial liabilities Decline Significant Decline Significant Decline Significant Decline Significant
This table summarised the results of hypothesis testing. We compare within country and between country comparability using T indices based on nationalGAAP and IFRS accounting policy choices in the UK and Australia. T indices measure comparability and p-values show whether T indices are significantlydifferent under GAAP and IFRS. Main analysis excludes companies shown as ‘not applicable’ in Table 4. Sensitivity includes all 228 companies in the sample.Policy choices for each item in Column 1 are cost or fair value, as shown in Table 4 except as follows: property (2) and plant and equipment (2) assume thatdeemed cost is completely comparable to cost; property (3) and plant and equipment (3) assume that deemed cost is completely comparable to fair value.Derivatives (1) considers companies using item 18 of Table 3 (they measure held-for-trading derivatives at fair value and hedging derivatives at the lower ofcost and net realisable value under national GAAP) to be comparable with companies using fair value for derivatives but not comparable with companiesusing cost. Derivatives (2) considers companies using item 18 to be comparable to cost but not fair value.
D. Cairns et al. / The British Accounting Review 43 (2011) 1–21 15
trading securities under IFRS, an increase of two companies (Table 3, items 13–14). Under UK GAAP, 12 companies (predomi-nantly financial institutions) measured them at fair value and nine used the cost model while under IFRS all used fair value.26
National comparability does not change in Australia (Table 4 shows the T indices for held-for-trading securities forAustralia are 1.000 for both AGAAP and IFRS). In the UK T indices increase significantly (p< 0.001) from 0.510 under UKGAAPto 1.000 under IFRS. We find a significant increase in national comparability pre- and post-IFRS in the UK because only banksand insurance companies were permitted to use fair value measurement under UKGAAP whereas all companies are requiredto use fair value measurement under IFRS. Both within and between country comparability improves significantly (0.755–1.000 for within country and 0.571–1.000 for between country, both p< 0.001, Table 5).
5.5.2. Available-for-saleBoth UK and Australian companies show an increase in the use of fair value measurement for available-for-sale financial
assets (Table 3, items 15–16). Fair value was rarely used under national GAAP (UK companies 3% and Australian 7%). UnderIFRS 51% of UK companies and 46% of Australian use fair value. These changes represent a significant increase in nationalcomparability (0.740–1.000, p< 0.001) for Australia and a non-significant decrease (0.908–0.854, p¼ 0.271) for the UK (Table4).27 Both within country and between country comparability increase significantly (0.824–0.927, p¼ 0.026; 0.813–0.921,p¼ 0.039) (Table 5).
26 The 12 companies using fair value included 11 financial institutions which are permitted by company law to use fair value for such assets. The othercompany, Marks & Spencer, used the ‘true and fair override’ in order to overcome the conflict with company law. In Australia all companies were from thebanking and insurance sectors.27 Table 3 (item 16) shows that five UK companies (4%) use cost for available-for-sale (AFS) financial assets either because they cannot reliably measurethem at fair value (consistent with IAS 39), the amounts were immaterial or there is non-compliance with IFRS requirements. Thus the non-significantdecrease in comparability on adoption of IFRS may be partly explained these firms’ inability to measure available-for-sale financial assets at fair value, theapplication of materiality or non-compliance with IFRS requirements.
D. Cairns et al. / The British Accounting Review 43 (2011) 1–2116
5.5.3. DerivativesBoth UK and Australian companies showan increase in the use of fair valuemeasurement for derivatives. Under IFRS 92% of
UK companies and 89% of Australian use fair value compared to no UK and three Australian companies under prior nationalGAAP (Table 3, items 17–19). A few companies (six UK and 19 Australian) measured held-for-trading derivatives at fair value ateach balance sheet date under national GAAP but used the lower of cost and net realisable value approach for hedgingderivatives. In calculating T indiceswe classified this second group as equivalent to fair value (derivatives (1) in Tables 4 and 5).National comparability increases under IFRS. T indices increase significantly in Australia and the UK (0.639–1.000, p< 0.001;0.891–1.000, p¼ 0.002).28 Similar results are observed for the within and between country T indices reported in Table 5; bothshow a significant increase in comparability (0.765–1.000, p< 0.001; 0.733–1.000, p< 0.001).
5.5.4. Other financial assets and liabilitiesTable 3 shows that there is little use of voluntary fair value measurement for other financial assets and liabilities, that is,
those financial assets and financial liabilities that would otherwise not qualify for the fair value through profit and losscategory (Table 3, items 20–21 and 22–23). Eight (7%) UK companies (banks and insurance) and ten (9%) Australian companieselected to use fair value measurement for other financial assets under IFRS (compared to no UK and one Australian companyunder national GAAP). The UK companies all used the option selectively for only some financial assets (mainly those asso-ciated with insurance liabilities or structured loans that include embedded derivatives). Therefore, the substantial majority oftheir other financial assets (mainly loans and receivables) were measured at amortised cost. The ten Australian companiesinclude five insurance companies, two Materials sector and one Consumer Services, one Commercial Services and one foodand staples retail company. Again, the fair value optionwas used selectively for only some financial assets with the result thatthe substantial majority of the other financial assets (mainly loans and receivables) were measured at amortised cost.
Four UK companies, but no Australian company, elected to use fair value measurement for other financial liabilities underIFRS, compared to no companies under national GAAP. The four UK companies (three banks and one other company) used thefair value option selectively for only some financial assets (mainly those associated with insurance activities or debt thatincluded embedded derivatives). The substantial majority of other financial liabilities (mainly own debt, customer deposits ofbanks and payables) was measured at amortised cost. National comparability declines, reflecting use of the fair value option forother financial assets. T indices decline significantly in Australia and the UK (0.982–0.833, p< 0.001; 1.000–0.869, p< 0.001,Table 4). Within and between country indices also decline significantly (0.991–0.851, p< 0.001; 0.991–0.851, p< 0.001, Table 5).
For financial liabilities, comparability declines in the UK. Use of the fair value option leads to a significant decline in thenational T index (1.000–0.932, p¼ 0.018). The T indices do not change in Australia because no company uses the fair valueoption. Within country and between country T indices reveal a significant decline (1.000–0.966, p¼ 0.018; 1.000–0.965,p¼ 0.018) (Table 5) because the pattern of use of the option differs in the two countries.
5.6. Share-based payment – Table 3 Panel F
Table 3 (items 24–25) shows that 112 (98%) UK companies and 102 (89%) Australian companies reported equity settledshare-based payments in their first IFRS financial statements andmeasured the resulting expense at fair value at grant date.29
Under UKGAAP, four companies (3%) used fair value and 107 (94%) used intrinsic value or issue price to measure share-basedpayment. Similarly, under AGAAP, seven companies (6%) used fair value and 97 (85%) used intrinsic value or issue price tomeasure share-based payment. Thus comparability has increased in the UK and Australia for equity settled plans. National Tindices increase significantly (0.874–1.000, p¼ 0.001; 0.931–1.000, p¼ 0.016, Table 4). Similarly, within and between countryT indices show a significant increase in comparability (0.902–1.000, p< 0.001; 0.902–1.000, p< 0.001, Table 5).30
5.7. Summary and sensitivity analysis
Table 6 provides a summary of our results described above for within and between country comparability and also forsensitivity tests.31 In relation to H1 (Table 6, Panel A), which proposed that within and between country comparability wouldincrease in relation to mandatory requirements for fair value measurement, the strongest results are for IAS 39 and IFRS 2. Bothwithin and between country comparability increase significantly for held-for-trading, available-for-sale and derivative securitiesas well as for share-based payment. H1 is only partially supported for IAS 41 (reflecting the small number of companies withbiological assets). Within country comparability has not increased significantly but between country comparability (for
28 If companies in group 18 of Panel E Table 3 are considered comparable to companies using cost but not to those using fair value, results are similar forAustralia (significant increase in T index) but not for the UK (no change in the T index) (Table 4 derivatives (2)). Both the within and between country Tindices reported in Table 5 show a significant increase in comparability (0.969–1.000, p¼ 0.048; 0.968–1.000, p¼ 0.048) providing support for theconclusion of increased comparability for measurement of derivatives under IFRS.29 Companies reported far more equity settled plans than cash settled plans, so we focus our analysis on the former.30 The same effect (i.e. a significant increase in comparability) is observed for cash settled plans (assuming the ‘not specified’ companies are notcomparable, as per cash settled SBP (1), Tables 4 and 5).31 We have not provided a summary in relation to national comparability because the two country average of national comparability is captured in thewithin country measures.
D. Cairns et al. / The British Accounting Review 43 (2011) 1–21 17
biological assets) has improved. Taken together, these results suggest that mandatory fair value measurement improvescomparability within and between the UK and Australia for financial instruments and share-based payment.
For standards which permit choice of fair value measurement, a range of outcomes is observed (Table 6, Panel B). Theprediction of H2 (a within and between country decline in comparability) is supported in relation to IAS 39 Other financialassets and Other financial liabilities. The fair value option gave companies a choice of using fair value measurement. It wastaken by some companies in each country for other financial assets and by some companies in the UK for other financialliabilities, resulting in a significant decline in comparability both within and between the countries. Similarly, for IAS 40within and between country comparability for investment properties declined significantly as some UK companies exercisedthe choice available in this standard.
In relation to IAS 16 comparability increases rather than declines as companiesmademore comparable choices and generallyavoided the use of fair value measurement for property (Table 6, property 2). For plant and equipment, cost was preferred overfair value under both GAAP and IFRS so no change in comparability is observed (Table 6, plant and equipment 2). We exploredthe use of the ‘deemed cost’ option for both property and plant and equipment. If we treat ‘deemed cost’ as a one-off fair valuemeasurement, we find comparability for property and for plant and equipment declines significantly, thus supporting H2 (Table6, property 3 and plant and equipment 3). This is the only area where use of the ‘deemed cost’ option affects our results asoverall the option was not widely used. The results suggest that even the relatively inexpensive option of a one-off revaluationon adoption of IFRS (that is, an opportunity to introduce fair valuemeasurementwithout committing to yearly revaluations)wasnot attractive tomany companies. In relation to intangible assets, all companies use cost. Fair valuemeasurement does not occurand there are no changes in comparability around IFRS adoption either within or between the countries.32
Sensitivity tests (p-values but not T indices or standard errors are shown in Tables 4 and 5) provide extensive support forour main results. Recall that in the main analysis we exclude companies shown as ‘not applicable’. In the sensitivity tests weinclude these companies and treat them as having comparable choices to all other companies. Therefore the sensitivity testsreflect a less stringent measure of comparability. Comparing the main analysis and sensitivity tests, we reach the sameconclusions regarding the significance of changes in the T indices for all policy choices except two. The first is available-for-sale securities: a non-significant increase in within country comparability is observed. The second is biological assets: a non-significant increase in between country comparability is observed.
6. Conclusions
This study investigates the use of fair value measurement by 228 listed companies in the UK and Australia around theadoption of IFRS from 1 January 2005. We consider the extent to which fair value measurement has increased in relation toboth mandatory and voluntary requirements in IFRS. We also measure whether national, within and between countrycomparability has changed as a result of (a) mandatory and (b) optional use of fair value measurement. The extent of use offair value measurement is important as it is one of the most controversial aspects of IFRS and does not have unequivocalsupport. The extent of within and between country comparability is of interest because of the potential for greater compa-rability to contribute to higher quality financial information and thus benefits from the adoption of IFRS.
Whether the benefits of IFRS are being realised is currently under investigation and our study contributes to this area ofliterature. In relation to mandatory requirements, we observe the expected increase in use of fair value measurement forfinancial instruments and share-based payment, leading to increases inwithin and between country comparability. Greater useof fair value measurement should be useful to investors (Aboody et al., 1999; Barth & Clinch, 1998; Easton et al., 1993; Horton,2007; Landsman, 2007) so our evidence may provide explanations for improvements in the information environment observedpost-IFRS in the UK and Australia (Cotter, Tarca & Wee, in press; Horton et al., 2008). Our study thus complements thoseaddressing IFRS impact and provides useful feedback for standard setters, regulators and other parties evaluating IFRS.
We find little use of fair value measurement in areas where it is optional, other than for investment property. In spite ofprior practices in both countries, few companies revalue other property under IFRS or use fair value at transition date as the‘deemed cost’ on transition to IFRS. No company measures intangible assets or plant and equipment at fair value at eachbalance sheet date. There is limited and selective use of the fair value option tomeasure at fair value other financial assets andliabilities that would otherwise be measured at amortised cost.
Our results are informative about preparers’ choices under IFRS and thus are relevant to informing capital marketparticipants about the way IFRS are being used. We show a very conservative approach to the optional use of fair valuemeasurement, implying the likelihood of less intentional or unintentional measurement error in financial statements, whichmay reassure some investors and analysts. On the other hand, greater use of cost measures means that less current infor-mation is provided, which may not be consistent with the preferences of some standard setters and needs of some users offinancial reports for more relevant information. The changes from UK GAAP/Australian GAAP to IFRS also lead to changes inwithin and between country comparability.We add to prior studies using indices in the national GAAP setting. Ours is the first
32 This finding is based on the policy choices as presented in transition and adoption year annual reports. Further analysis of earlier AGAAP policies showsthat 31 companies were forced to change their policy in relation to identifiable intangible assets under IFRS, which they did prior to the end of thetransition year. For further discussion, see Chalmers, Clinch, and Godfrey (2008) and Cheung, Evans, and Wright (2008).
D. Cairns et al. / The British Accounting Review 43 (2011) 1–2118
study to measure comparability under IFRS. In addition, we report on the significance of changes using Taplin’s (2010) Tindices on an original data set, which extends how the indices have been used previously.
The IASB identifies comparability as an important qualitative aspect of financial information, thus the extent to which ithas increased under IFRS is a measure of benefits of IFRS. However, questions about comparability cannot be separated fromissues about the relevance of particular measurement attributes. Within and between country comparability for derivativesand share-based payments have increased as a result of the mandatory use of fair value measurement, arguably improvingboth comparability and relevance, consistent with the IASB’s objectives. In contrast, within and between country compa-rability for property, plant and equipment have increased as a result of companies electing to use historical cost-basedmeasurement and abandoning prior policies of revaluation. In this case, comparability may have increased at the expense ofrelevance. We observe that the use of the fair value option for financial assets or financial liabilities that would otherwise bemeasured at amortised cost reduces within and between country comparability because some companies have elected to usefair value which may be more relevant notwithstanding the loss of comparability.
Fewstudies have so far evaluated theuse of IFRS options in thepost 2005 setting, so our evidence provides insights for users offinancial statements and also regulators as they consider the extent to which standards should permit options. We observe verylittle use of remeasurement on first-time adoption (the ‘deemed cost’ option), which reflects the likelihood that prior nationalGAAPhistorical cost-based amountswere the same as IFRS historical cost-based amounts. The optionwasusedby theminority ofcompanies forwhichnationalGAAP carrying amounts includedprior period revaluations, so avoiding theneed to determine IFRShistorical cost-based amounts. The optionwas also usedbyavery small number of companies as anopportunity created by IFRS1for one-off valuations (which were not permitted by prior national GAAP and are not permitted by IFRS). The fact that thesubstantialmajorityof companies did not use the option in thisway suggests a lack of economic incentives to bring current valuesinto the accounts, but also gives assurance that the optionwas not used opportunistically by most companies (Ball, 2006).
Nobes (2006) suggests that IFRS options may allow between countries differences to continue. Our results showcompanies in two countries with many commonalities in their institutional frameworks continue to use options in similarways (e.g. the IAS 16 revaluation option; the IAS 39 fair value option). Future studies could compare the use of options incountries with more dissimilar institutional frameworks.
We find that some changes in comparability reflect specific country influences such as the requirements of prior standards(e.g. investment property in the UK). We also observe industry effects in relation to use of measurement options (e.g. IAS 39fair value option used by banks and insurance companies), which is consistent with the benefits of fair value varying with thenature of firm assets and operations. Our results confirm that, as proposed by ICAEW (2006), standard setters should considerapplicability of measurement methods to particular industries.
The generalisability of our findings is limited by the small size of the sample and the focus on only large companies in twocountries. Future research may address the questions we raise more broadly, by considering more companies and othercountries. Nevertheless, the UK and Australia were the obvious countries inwhich to conduct our study, given their history ofasset revaluation, a practice not as prevalent in other countries. It is also appropriate to study large companies because of theireconomic importance and key role in capital markets.
Acknowledgment
The authors thank Frances Gunnell for research assistance.
Appendix 1. Checklist for data collection
IAS 16 Property plant & equipment1a Are all classes of property (own use real estate) measured at each balance sheet date using the cost model
(cost less depreciation and any impairment losses)?2 Are any classes of property measured at each balance sheet date using the revaluation model (current fair value less any
subsequent depreciation and impairment losses with changes in fair value usually included in equity)? If so, specify details3a Are all classes of plant and equipment measured at each balance sheet date using the cost model (cost less depreciation
and any impairment losses)?4 Are any classes of plant and equipment measured at each balance sheet date using the revaluation model
(current fair value less any subsequent depreciation and impairment losses with changes in fair valueusually included in equity)? If so, specify details
IAS 40 Investment property5a Is investment property measured at each balance sheet date using the cost model (cost less depreciation
and any impairment losses)?6 Is investment property measured at each balance sheet date using the fair value model (current fair value
with changes in fair value included in profit or loss)? If so, specify details
IAS 38 Intangible assets7a Are all classes of intangible assets measured at each balance sheet date using the cost model
(cost less depreciation and any impairment losses)?8 Are any intangible assets measured at each balance sheet date using the revaluation model (current fair value less
any subsequent depreciation and impairment losses with changes in fair value usually included in equity)?If so, specify details
IAS 41 Agriculture9 Are biological assets measured at fair value less estimated point-of-sale costs with changes
in fair value included in profit or loss?10 Are biological assets measured at cost less depreciation and any impairment losses? If so, specify details.11/12 Is harvested agricultural produce measured at fair value less point-of-sale costs with changes in fair value
included in profit or loss? If not, specify details.
IAS 39 Financial instruments: recognition and measurement13/14 Are investments in equity or debt securities classified as held-for-trading measured at fair value at each
balance sheet date with changes in fair value included in profit or loss? If not, specify details.15/16 Are investments in equity or debt securities classified as available-for-sale measured at fair value at each
balance sheet date with changes in fair value usually included in equity? If not, specify details17/18/19 Are derivatives measured at fair value at each balance sheet date with changes in fair value included in profit
or loss (subject to cash flow hedge accounting)? If not, specify details.20/21 Are any other financial assets classified as at fair value through profit or loss and measured at fair value at each
balance sheet date with changes in fair value included in profit or loss (fair value option)? If so, specify details.22/23 Are any other financial liabilities classified as at fair value through profit or loss and measured at fair value at each
balance sheet date with changes in fair value included in profit or loss (fair value option)? If so, specify details.
IFRS 2 Share-based payments24/25 Are equity settled share-based payments measured by reference to the fair value of the equity instrument granted?
If not, specify details.26/27 Are cash settled share-based payments measured at the fair value of the liability? If not, specify details.
IFRS 1 First-time adoption of IFRS1b Did the entity determine the deemed IFRS cost of any items of own use property at the transition date to IFRS using:
� fair value at transition date;� previous GAAP revaluations to fair value;� previous GAAP cost adjusted to reflect changes in a general price index; or� previous GAAP cost adjusted to reflect changes in a specific price index?If so, specify details.
3b Did the entity determine the deemed IFRS cost of any items of plant and equipment at the transition date to IFRS using:� fair value at transition date;� previous GAAP revaluations to fair value;� previous GAAP cost adjusted to reflect changes in a general price index; or� previous GAAP cost adjusted to reflect changes in a specific price index?If so, specify details.
5b Did the entity determine the deemed IFRS cost of any investment property accounted for using the cost modelat the transition date to IFRS using:� fair value at transition date;� previous GAAP revaluations to fair value;� previous GAAP cost adjusted to reflect changes in a general price index; or� previous GAAP cost adjusted to reflect changes in a specific price index?If so, specify details.
7b Did the entity determine the deemed IFRS cost of any intangible assets at the transition date to IFRS using:� fair value at transition date;� previous GAAP revaluations to fair value;� previous GAAP cost adjusted to reflect changes in a general price index; or� previous GAAP cost adjusted to reflect changes in a specific price index?If so, specify details.
D. Cairns et al. / The British Accounting Review 43 (2011) 1–21 19
Appendix 2. Options for T indices (from Taplin, 2004)
1. Company/country weightings(1a) companies areweighted equally, bi¼ ni/n, where ni is the number of companies from country i in the sample and n is the
total number of companies in the sample, so bi is the proportion of companies in the sample from country i. This meansa country receives weight proportional to the number of companies sampled from that country,
(1b) countries are weighted equally, bi¼ 1/N, where N is the number of countries,(1c) countries are weighted according to the total population number of companies in each country, bi ¼ ui=
PNi¼1 ui where
ui is the total number of companies in country i (for example, the total number of companies listed on the stock exchangerather than the number of companies in the sample).
2. International focus(2a) overall, bij¼ bibj,(2b) within country, bij ¼ bibj=
PNi¼1 b
2i if i¼ j and bij¼ 0 if isj,
(2c) between country, bij¼ 0 if i¼ j and bij ¼ bibj=PN
i¼1Pjsi
bibj if isj.3. Multiple accounting policies(3a) multiple accounting policies are not allowed, akl¼ 0 if ksl,
D. Cairns et al. / The British Accounting Review 43 (2011) 1–2120
(3b) multiple accounting policies are allowed if completely comparable, akl¼ 1 when methods k and l are completelycomparable and akl¼ 0 when they are completely incomparable,
(3c) multiple accounting policies are allowable with fractional comparability, akl takes a value on the continuum from0 (completely incomparable) to 1 (completely comparable).
4. Non-disclosure(4a) not applicable, companies who do not disclose a method are removed from the sample,(4b) comparable to everything, akM¼ aMl¼ aMM¼ 1 for all accounting methods k and l,(4c) comparable to nothing, akM¼ aMl¼ aMM¼ 0 for all accounting methods k and l,(4d) comparable to the standard (or default) method s, aks¼ akM, asl¼ aMl for all k and l.
References
Aboody, D., Barth, M., & Kasznik, R. (1999). Revaluations of fixed assets and future company performance: evidence from the UK. Journal of Accounting andEconomics, 26, 149–178.
Abrahams, T., & Sidhu, B. (1998). The role of R&D capitalisation in firm valuation and performance measurement. Australian Journal of Management, 23(2),169–183.
Alfredson, K., Pactor, P., Picker, R., & Wise, T. (2005). Applying international accounting standards. Wiley.Amir, E. (1993). The market valuation of accounting information: the case of postretirement benefits other than pensions. Accounting Review, 68, 703–724.Archer, S., Delvaille, P., & McLeay, S. (1995). The measurement of harmonisation and the comparability of financial statement items: within-country and
between-country effects. Accounting and Business Research, 25(98), 67–80.Ball, R. (2006). International financial reporting standards (IFRS): pros and cons for investors. Accounting and Business Research International Accounting
Policy Forum 5–27.Ball, R., Kothari, S., & Robin, A. (2000). The effect of international institutional factors on properties of accounting earnings. Journal of Accounting and
Economics, 29(1), 1–51.Ball, R., Robin, A., & Wu, J. (2003). Incentives versus standards: properties of accounting income in four East Asian countries. Journal of Accounting and
Economics, 36(1–3), 235–270.Barth, M. (1994). Fair-value accounting: evidence from investment securities and the market valuation of banks. The Accounting Review, 69(1), 1–25.Barth, M., Beaver, W., & Landsman, W. (1996). Value-relevance of banks’ fair value disclosures under SFAS no. 107. Accounting Review, 71(4), 513–537.Barth, M., & Clinch, G. (1998). Revalued financial tangible and intangible assets: associations with share prices and non-market based value estimates.
Journal of Accounting Research, 36(Suppl.), 199–233.Basu, S. (1997). The conservatism principle and the asymmetric timeliness of earnings. Journal of Accounting and Economics, 24, 3–37.Beresford, D. (1998). Will the derivatives project go the way of stock options? The CPA Journal, 68(1), 36–41.Brown, P., Izan, H., & Loh, A. (1992). Fixed asset revaluations and managerial incentives. Abacus, 28, 36–57.Brown, P., & Tarca, A. (2007). Achieving high quality, comparable financial reporting: a comparison of independent enforcement bodies in Australia and the
United Kingdom. Abacus, 43(4), 438–473.Brown, P., & Yew, E. (2002). How do investors regards ESOs? Australian Accounting Review, 21(27), 36–42.Chalmers, K., Clinch, G., & Godfrey, J. (2008). Adoption of international financial reporting standards: impact on value relevance of intangible assets.
Australian Accounting Review, 18(3), 237–247.Chalmers, K., & Godfrey, J. (2000). Practice versus prescription in the disclosure and recognition of derivatives. Australian Accounting Review, 10(2), 40–50.Cheung, E., Evans, E., & Wright, S. (2008). Adoption of IFRS in Australia: the case of AASB 138 (IAS 38) intangible assets. Australian Accounting Review, 18(3),
248–256.Christensen, H., & Nikolaev, V. (2009). Who uses fair value accounting for non-financial assets after IFRS adoption? University of Chicago Booth School of
Business. Working paper, no. 09-12.Cotter, J., Tarca, A., & Wee, M. (2010). IFRS adoption and analysts’ earnings forecasts: Australian evidence. Accounting and Finance, in press.Cotter, J., & Zimmer, I. (1995). Asset revaluations and assessment of borrowing capacity. Abacus, 31, 136–151.Danbolt, J., & Rees, W. (2008). An experiment in fair value accounting: UK investment vehicles. European Accounting Review, 17(2), 271–303.Daske, H., Hail, L., Leuz, C., & Verdi, R. (2008). Mandatory IFRS reporting around the world: early evidence on the economic consequences. Journal of
Accounting Research, 46(5), 1085–1142.Deloitte. (2007). IASPLUS comparison of IFRSs to national and regional GAAPs. Available at http://www.iasplus.com/country/compare.htm Accessed 03.04.07.Easton, P., Eddey, H., & Harris, T. (1993). An investigation of revaluations of tangible long-lived assets. Journal of Accounting Research, 31(Suppl.), 1–38.Emenyonu, E., & Gray, S. (1992). EC accounting harmonisation: an empirical study of measurement practices in France, Germany and the UK. Accounting and
Business Research, 23, 49–58.Ernst & Young. (October 2003). First time adoption of international financial reporting standards. Accounting brief. http://www.ey.com/au. Accessed March
2004.Ernst & Young. (May 2005). How fair is fair value? IFRS stakeholder series.Field, T., Lys, T., & Vincent, L. (2001). Empirical research on accounting choice. Journal of Accounting and Economics, 31, 255–307.FitchRatings. (14 March 2005). Accounting and financial reporting risk: 2005 global outlook. FitchRatings credit policy.Gerboth, D. (July 1973). Research, intuition, and politics in accounting enquiry. The Accounting Review 475–482.Godfrey, J., & Koh, S. (2001). The relevance to company valuation of capitalising intangible assets in total and by category. Australian Accounting Review,
11(2), 39–49.Goodwin, J., & Ahmed, K. (2006). The impact of international financial reporting standards: does size matter? Managerial Auditing Journal, 21(5), 460–475.Hail, L., & Leuz, C. (2007). Capital market effects of mandatory IFRS reporting in the EU: empirical evidence. Available at http://www.afm.nl/marktpartijen/
upl_documents/AFM_Report_IFRS_271207.pdf Accessed 30.10.09.Herrmann, D., & Thomas, W. (1995). Harmonisation of accounting and measurement practices in the European Community. Accounting and Business
Research, 25, 253–265.Horton, J. (2007). The value relevance of ‘realistic reporting’: evidence from UK life insurers. Accounting and Business Research, 37(3), 175–197.Horton, J., Serafeim, G., & Serafeim, I. (2008). Does mandatory IFRS adoption improve the information environment?. Working paper London School of
Economics, Harvard University and University of Piraeus.Institute of Chartered Accountants in England and Wales (ICAEW). (2006). Information for better markets: Measurement in financial reporting. London: ICAEW.Johnson, L., & Swieringa, R. (1996). Anatomy of an agenda decision: statement no. 115. Accounting Horizons, 10, 149–158.KPMG. (2000). Global accounting UK, IAS and US compared. Switzerland: KPMG International.Landsman, W. (2007). Is financial accounting information relevant and reliable? Evidence from capital market research. Accounting and Business Research
19–30, [Special issue].Laux, C., & Leuz, C. (2009). Fair value accounting: making sense of the recent debate. Accounting, Organizations and Society, 34(6–7), 826–834.
D. Cairns et al. / The British Accounting Review 43 (2011) 1–21 21
Lin, Y., & Peasnell, K. (2000a). Fixed asset revaluation and equity depletion in the UK. Journal of Business, Finance and Accounting, 27(3–4), 359–394.Lin, Y., & Peasnell, K. (2000b). Asset revaluation and current cost accounting: UK corporate disclosure decisions in 1983. British Accounting Review, 32,
161–187.Meek, G., Roberts, C., & Gray, S. (1995). Factors influencing voluntary annual report disclosures by US, UK and continental European multinational
corporations. Journal of International Business Studies, 26(3), 555–572.Nobes, C. (1983). A judgmental international classification of financial reporting practices. Journal of Business Finance and Accounting, Spring.Nobes, C. (2000). GAAP 2000: A survey of national accounting rules in 53 countries. England: Arthur Andersen, BDO, Deloitte Touche Tohmatsu, Ernst & Young
International, Grant Thornton, KPMG, PricewaterhouseCoopers.Nobes, C. (2001). GAAP 2001: A survey of national accounting rules benchmarked against international accounting standards. England: Arthur Andersen, BDO,
Deloitte Touche Tohmatsu, Ernst and Young International, Grant Thornton, KPMG, PricewaterhouseCooper.Nobes, C. (2006). The survival of international differences under IFRS: towards a research agenda. Accounting and Business Research, 36(3), 233–245.Parker, R., & Morris, R. (2001). The influence of US GAAP on the harmony of accounting measurement policies of large companies in the UK and Australia.
Abacus, 37(3), 297–328.Penman, S. (2007). Financial reporting quality: is fair value a plus or minus? Accounting and Business Research 33–44, [Special issue].Rutherford, B. (2007). Financial reporting in the UK: A history of the Accounting Standards Committee 1969–1990. United Kingdom: Routledge.Stenka, R., Ormrod, P., & Chan, A. (2008). Accounting for business combinations – the consequences of IFRS adoption for UK listed entities. Available at
http://papers.ssrn.com/sol3/papers.cfm?abstract_id¼1276826.Taplin, R. (2004). A unified approach to the measurement of international accounting harmony. Accounting and Business Research, 34(1), 57–73.Taplin, R. (2010). Statistical inference using the T index to quantify the level of comparability between accounts. Accounting and Business Research, 40(1),
75–104.Tarca, A. (2005). International convergence of accounting standards: an investigation of the use of IAS options not acceptable under US GAAP. International
Journal of Business Studies, 13(1), 67–86.van der Tas, L. G. (1988). Measuring harmonisation of financial reporting practice. Accounting and Business Research, 18(70), 157–169.van der Tas, L. G. (1992). Evidence of EC financial reporting harmonisation: the case of deferred taxation. European Accounting Review, 1(1), 69–104.Tay, J., & Parker, R. (1990). Measuring international harmonisation and standardization. Abacus, 26(1), 71–88.Whittred, G., & Chan, Y. (1992). Asset revaluations and mitigation of underinvestment. Abacus, 28, 58–74.