Page 1
This report is available online at: https://www.brookings.edu/research/student-outcomes-at-community-colleges-what-factors-
explain-variation-in-loan-repayment-and-earnings/
THE BROOKINGS INSTITUTION | SEPTEMBER 2021
Student Outcomes at Community Colleges:
What Factors Explain Variation in Loan Repayment and Earnings?
Lesley J. Turner
Vanderbilt University
Cody Christensen
Vanderbilt University
Page 2
HUTCHINS CENTER ON FISCAL & MONETARY POLICY
ABSTRACT
Community colleges play an important role in providing access to higher education and promoting
economic mobility, but student outcomes vary widely across institutions. Although community colleges
have been largely excluded from recent federal accountability action, the potential re-regulation of Gainful
Employment raises the question of whether these schools should be subject to future accountability
measures. If variation in student outcomes across community college programs is correlated with factors
and policies under an institution’s control, this would suggest that there are “levers of action” that a
college can pull to improve student outcomes. However, if variation is primarily explained by factors that
are outside of an institution’s control, such as the characteristics of students the school serves, then
accountability policies could penalize community colleges for fulfilling their mission of providing access to
their local communities. To shed light on these questions, we examine the program-, institution-, and
state-level correlates of community college student outcomes, using program-level data on post-college
earnings and loan repayment for more than 1,200 community colleges. We find that student
demographics are correlated with net earnings and loan repayment, largely because programs that enroll
more underrepresented minority and female students have worse outcomes. Student demographics
explain a relatively small share of the variation in earnings and repayment. In contrast, field of study
explains most of the variation in net earnings across programs and much of the variation in loan
repayment. Moreover, after controlling for field of study, we find a positive association between the share
of students in a program who are underrepresented minorities and net earnings, suggesting that
programs that enroll more Black and Hispanic students are more likely to be in fields that lead to smaller
earnings gains. Finally, we show that institutions that enroll the largest shares of minority students tend
to offer fewer programs with high earning premia and more seats in programs that have lower net
earnings, on average. These findings have significant implications for devising federal accountability
standards and underline the importance of both providing incentives for institutions to offer programs
that lead to economic stability and supporting the important role this sector plays in providing equitable
access to a postsecondary education.
ACKNOWLEDGMENTS
The authors are grateful to Adam Looney and David Wessel for useful comments and suggestions. We
thank Arnold Ventures for their support.
_________________________________________________________________________________________________________
Student O utcomes at Community Colleg es 2
Page 3
_________________________________________________________________________________________________________
Student O utcomes at Community Colleg es 3
HUTCHINS CENTER ON FISCAL & MONETARY POLICY
I. Introduction
Community colleges—open access, public two-year institutions—play an important role in America’s
higher education system. They educate millions of students each year, function as less expensive entry
points for individuals seeking to transfer to four-year institutions, and absorb displaced workers during
economic recessions (Rouse, 1995; Bahr et al, 2013; Barr and Turner, 2013). Community colleges are also
important for advancing equity and social mobility. By definition, they are local institutions with open-
door admissions policies and thus provide nontraditional students and other disadvantaged populations
with access to higher education (Bailey and Morest, 2006; Romano and Eddy, 2018).
At the same time, many community college students struggle during and after their time in college.
While outcomes vary widely across institutions, on average, community college students face lower
graduation rates, a higher risk of student loan default, and weaker economic success compared to similar
students who attend four-year public and non-profit universities (Looney and Yannelis, 2015; Long, 2018;
Miller, 2018).
Ideally, community colleges would both provide access to higher education and enhance students’
economic outcomes. In reality, the need to maintain low tuition combined with declining support from
state governments often creates tension between these two goals.1 This makes community colleges a
particularly challenging sector for federal policymakers to regulate. Indeed, in recent years, policymakers
have largely excluded community colleges from federal accountability measures. However, given the
potential re-regulation of the Gainful Employment (GE) provision (or a similar accountability measure),
whether community colleges should be subject to accountability pressure is an important question. Under
the past iteration of GE, only non-degree (i.e., “certificate”) programs in community colleges were subject
to regulation.2 If GE is re-regulated, policymakers should think carefully about whether expanding GE to
include associate degree programs (or contracting the rule to exclude all community college programs)
would best serve students in this sector.
There are potential benefits and consequences to including community college programs in federal
accountability measures. Federal accountability pressure could lead to improvements in instructional
quality and programmatic offerings or incentivize state policy makers to revisit decisions around funding
for community colleges and prospective students. If done well, this could result in improved student
outcomes. On the other hand, if programs providing access to underserved groups face disproportionate
accountability, that could reduce educational opportunities available to such students.
Using a nationally representative sample of community college programs, we explore whether
“demographics are destiny” for community colleges or whether factors under the control of institutions
and states also contribute to variation in student success. This question has important implications: if
variation in student outcomes across community college programs is correlated with factors and policies
under an institution’s control, this would suggest that there are “levers of action” that a college can pull to
. . .
1. State appropriations to community colleges were approximately $3,800 per full-time-equivalent (FTE) student in 2017
(Cummings et al. 2021) and actually fell (in real terms) over the decade spanning the Great Recession. Community colleges
are quite reliant on state and local appropriations. On average, the majority of institutional revenue received by community
colleges came in this form (Ma, Pender, and Libassi 2020).
2. The “gainful employment” definition was established in regulations authorized by the Higher Education Act that were initiated
by the Obama administration in 2010 largely in response to abuse by the career training sector and were the subject of
subsequent negotiated rulemaking. Although GE was never fully implemented, it would have restricted eligibility to participate
in federal student aid for programs with high levels of student debt relative to typical post-college earnings. The regulations
went into effect in July 2015 but were rescinded by the Trump administration in 2019.
Page 4
_________________________________________________________________________________________________________
Student O utcomes at Community Colleg es 4
HUTCHINS CENTER ON FISCAL & MONETARY POLICY
improve student outcomes. However, if variation in program outcomes is primarily explained by factors
that are outside of an institution’s control, such as the characteristics of students the school serves, then
accountability policies could penalize many community colleges for fulfilling their mission to serve
students in the local community.
We find that program demographics are correlated with earnings and loan repayment, with those
serving more students of color having worse outcomes. However, accounting for institutional inputs and
program mix reduces the size of the association between loan repayment and student race/ethnicity. In
the case of net earnings, accounting for field of study reverses this relationship, with the share of students
who are underrepresented minorities being associated with higher net earnings. Lastly, we find that the
majority of the variation in program-level earnings and much of the variation in loan repayment is largely
explained by the mix of program offerings. It is important to note that these correlations do not
necessarily reflect a causal relationship. Nonetheless, given that the differences in outcomes by program
of study we find are consistent with existing causal evidence on earnings returns across programs (e.g.,
Jespen et al., 2014; Bahr et al., 2015; Stevens, Kurlaender, and Grosz, 2019; Grosz, 2020), our findings
indicate if community colleges were to shift program offerings in response to accountability pressure,
students would likely benefit. Such changes need not take the form of a wholesale restructuring of
program offerings but rather as an expansion of the number of seats offered in high-return programs.3
The remainder of this paper is organized as follows. Section II discusses existing evidence on
institution- and program-level postsecondary outcomes of former community college students. Section III
describes the data and analysis sample. Section IV presents results on the associations between
community college characteristics and student outcomes, and Section V concludes with a discussion about
the policy implications of this analysis.
II. Evidence on the determinants of community college students’ outcomes
There is a large body of research on the economic returns to attending a community college (Kane and
Rouse, 1993; Leigh and Gill, 1997; Marcotte et al., 2005; Jacobson, LaLonde, and Sullivan, 2005).
Relative to high school graduates, associate degree-holders have higher average wages and annual
earnings, although the magnitude varies by state, institutional attributes, and student characteristics
(Calcagno et al., 2008; Porchea et al., 2016). The evidence is mixed on the returns to sub-associate degree
credentials. Some studies find positive returns to obtaining an undergraduate certificate, while others find
little or no evidence that certificate programs improve labor market outcomes (Jespen, Troske, and
Coomes, 2012).
Recently, new research has shed light on the program-level labor market outcomes of former
community college students (Jespen et al., 2014; Bahr et al., 2015; Dadgar and Trimble, 2015; Xu and
Trimble, 2016; Minaya and Scott-Clayton, 2017; Stevens, Kurlaender, and Grosz, 2019). These studies
leverage longitudinal administrative data from a particular community college system linked to
corresponding records from the state’s unemployment insurance database. By comparing within-student
differences in earnings before and after attending a program, researchers are able to estimate the
economic returns to different fields of study and credentials. This research generally finds that associate
programs in allied health and nursing lead to the largest earnings gains. Vocational and trades certificates
(particularly long-term certificates) also increase earnings, on average. Returns to liberal arts programs
. . .
3. Grosz (2020) shows that despite binding capacity constraints and high returns to nursing associate degrees, because funding
is allocated on a per-student basis and such programs are relatively high cost, there are limited incentives for schools to
expand these programs.
Page 5
_________________________________________________________________________________________________________
Student O utcomes at Community Colleg es 5
HUTCHINS CENTER ON FISCAL & MONETARY POLICY
(at the associate and certificate level) are mixed, with some studies finding positive returns while others
find little or no returns. Short-term certificates in cosmetology and culinary studies typically have small or
negative effects on earnings. However, this research has only been conducted in a handful of states. Given
the large variation in state-level policies and local labor market conditions, program-level estimates from
these studies may not be generalizable to other settings (Xu & Trimble, 2016).
Our study makes several contributions. It is one of the first to examine the variation program-level
outcomes for the universe of all two-year postsecondary institutions for which there are available data.4
Also, we provide some of the first descriptive evidence about the variation in labor market outcomes
within similar programs across different community colleges. Third, we use program-level loan
repayment rates (in addition to program-level earnings) as a secondary measure of post-college economic
success. Previous research has not studied program-level loan repayment due to a lack of available data.
The goal of this study is to identify program- and institution-level characteristics that are correlated
with labor market outcomes of former community college students. These characteristics include
students’ race and gender, the types and mix of programs offered, and other program- and institution-
level policies. Special attention is given to factors that community colleges have direct control over;
namely, program offerings.
We focus on program-level outcomes because school-level averages can mask substantial
heterogeneity that exists between programs and across different credential levels (Marcotte et al., 2005;
Calcagno et al., 2008) even within a single institution (Matsudaira and Turner, 2020). Program-level
analysis provides a more-accurate picture of the labor market outcomes that students from a given
program are likely to experience after attending a college (Schneider and Sigelman, 2018; Carnevale et al.,
2020).
III. Data and Analysis Sample
Our analyses focus on certificate and associate degree programs at community colleges. We focus on two
outcome measures – earnings and loan repayment rates – which we describe in detail below. A total of
1,240 community colleges report earnings or loan repayment data at the school-level with 94 percent
reporting these data for at least one program. Programs are defined using unique 2-digit classification of
instructional program (CIP) codes, by credential level, by postsecondary institution.5 We combine data
from a variety of sources to measure program-, school-, and state-level characteristics and policies
potentially related to community college student outcomes.
A. Student outcomes
Earnings. Our primary measure of program-level earnings is the “Net Earnings Premium” (NEP).
Generally speaking, a program’s NEP measures the extent to which former students’ earnings gains are
large enough to cover the direct and indirect costs of attending the program (Matsudaira and Turner,
2020). Specifically, NEP is defined as the median earnings of all program exiters with earnings three years
after program exit, minus median “counterfactual earnings,” minus out-of-pocket expenses related to
. . .
4. Our data, described in Section III, cover programs serving between 65 and 99 percent of community college students.
5. Postsecondary institutions are classified using six-digit Office of Postsecondary Education Identifier (OPEID) numbers. A few
community colleges also offer a small number of bachelor’s degree programs. We consider a public institution to be a
community college if it is categorized as a predominantly certificate or associate degree-granting institution in the College
Scorecard.
Page 6
_________________________________________________________________________________________________________
Student O utcomes at Community Colleg es 6
HUTCHINS CENTER ON FISCAL & MONETARY POLICY
attending the program (amortized over 20 years).6 The calculation for program-level NEP is show in
equation (1).
𝑁𝐸𝑃 = (Median Cohort Earnings ) − (Median Counterfactual Earnings) (1)
−(Amortized Out of Pocket Expenses)
We do not observe outcomes of students who attended very small programs due to privacy
considerations. Because the underlying data used to construct the NEP are reported at the 4-digit CIP
level (which is then aggregated to the 2-digit CIP level), about 35 percent of community college students
attend a program that is too small for earnings data to be publicly reported. Raked weights are used to
reweight programs to be representative of community colleges nationwide in terms of CIP code and
credential level.
Loan repayment. We use a dollar-based loan repayment rate proposed by Matsudaira and Turner (2020).
As shown in equation (2), a program’s loan repayment rate (LRR) equals the change in the aggregate
balance of the cohort, three years after repayment entry, relative to the original cohort balance.
𝐿𝑅𝑅 = 1 −(Balance in year 3)
(Balance at origination) (2)
A program with an LRR equal to one indicates that every borrower from the given program has fully
repaid his or her loan balance within three years of entering repayment. A positive LRR indicates that the
cohort has made progress in reducing their aggregate loan balance while one with a negative LRR
indicates that the program’s repayment cohort has, on average, negatively amortized on their debt. The
data used to calculate loan repayment rates comes from NSLDS and includes students who entered
repayment in 2016.7 Although only 5 percent of programs (containing less than 1 percent of students) are
missing an LRR, we also use weights to ensure that the set of programs with a nonmissing LRR are
reflective of enrollment across all programs in terms of field by credential level.
Program-level loan repayment and net earnings are moderately correlated (𝜌 = 0.314). While both
metrics should be related to program costs and post-college economic success, there are a few reasons
why the measures may not be more aligned. First, the NEP will not capture unreported tipped income and
earnings from self-employment, which may make up a substantial portion of earned income in some
sectors. Second, if students who borrow make up a small share of all students in a program or receive very
. . .
6. Median earnings of program exiters are derived from the College Scorecard program-level data with several adjustments to the
College Scorecard data. First, because earnings for the pooled 2016-2017 cohort are measured one year after exit, while the
NEP aims to measure earnings three years after exit, each program’s median earnings are adjusted using the estimated income
growth rate for individuals in the American Community Survey (ACS) with the same credential and field of study. Second, the
NEP is intended to reflect the outcomes of both graduates and non-completers, but the Scorecard data only pertains to program
graduates. To account for differences in earnings between completers and noncompleters within undergraduate programs,
Matsudaira and Turner (2020) scale program-level earnings by the ratio of completer to non-completer earnings at the institution-
level and the average completion rate. In other words, program-level Scorecard earnings are scaled down more when (a) there
is a large earnings premium between completers and non-completers at an institution, and (b) when the program-level completion
rate is small, meaning there is a large share of non-completers in a given program.
Out-of-pocket costs are estimated using estimated years of enrollment (at the credential level) multiplied by per-student collected
tuition and fees revenue. In the case of undergraduate certificate and associate degree programs, counterfactual earnings equal
median earnings of prime-aged working adults with only a high school degree in the same state as the institution, as measured
in the American Community Survey (ACS).
7. Borrowers who are back in school, have a military deferment, or are not required to repay their loans for another reason (e.g.,
death, disability, defrauded) are excluded from the numerator and denominator.
Page 7
_________________________________________________________________________________________________________
Student O utcomes at Community Colleg es 7
HUTCHINS CENTER ON FISCAL & MONETARY POLICY
different earnings gains, we might expect these two measures to diverge. Nonetheless, to the extent that
students who borrow take on additional risk, a metric that reflects their post-college success may be useful
even if this group is not representative.
B. Program-level correlates of student outcomes
Figures 1 and 2 show the ranking of programs by NEP and LRR, respectively. Programs are defined by
their field of study and credential. Although the ordering of programs shown in Figures 1 and 2 depends
on the outcome, skilled trades (e.g., construction, mechanic, and repair technologies), allied health, and
STEM (e.g., engineering, computer and information sciences) programs tend to be at the top of the
distribution of earnings and loan repayment while education, service, consumer science, and liberal arts
programs tend to be at the bottom.
We generate estimates of the racial/ethnic and gender composition of programs using IPEDS
completions data. We calculate the share of completers that are American Indian or Alaskan Native
(AIAN), Asian, Black, Hispanic, and White, as well as the share of completers that are women.8 Given that
program-level demographic data in IPEDS only includes graduates, while the NEP and LRR measures are
intended to apply to both completers and noncompleters, our approach imposes the assumption that
graduation rates are the same for students in different demographic groups. To reduce measurement
error due to small programs, we calculate demographic shares using a three-year average, spanning the
2015 to 2017 academic years.
Figure 1: Average net earnings premium by program
Notes: Two-digit CIP codes are listed in Appendix C. Programs with fewer than 4000 total students nationwide are
not shown.
. . .
8. A small number of completers fall outside one of these five race/ethnicity categories (e.g., students of two or more races, foreign
students). We exclude these counts when calculating the share of students in each racial/ethnic group.
Page 8
_________________________________________________________________________________________________________
Student O utcomes at Community Colleg es 8
HUTCHINS CENTER ON FISCAL & MONETARY POLICY
Figure 2: Average loan repayment rate by program
Notes: Two-digit CIP codes are listed in Appendix C. Programs with fewer than 4000 total students nationwide are
not shown.
Figures 3 through 5 provide visual evidence of the correlation between program demographic
characteristics and student outcomes. For each demographic characteristic, we construct 40 evenly
spaced intervals and plot the average outcome (NEP or LRR). Associate and certificate programs are
plotted in separate panels. The solid line is the linear fit of the average outcome on the share of students
who have the specified demographic characteristic (weighted by the number of students), and the
estimated slope (𝛽) is shown in each panel.
The racial/ethnic composition of a program and a program’s NEP are correlated and programs that
serve more underrepresented minority students tend to have lower net earnings. As an example, focusing
on Panel A of Figure 3, 𝛽 = −1.2 for certificate programs. This indicates that a 10-percentage point
increase in the share of students in a program who are underrepresented minorities is correlated with a
$120 lower program NEP. This correlation is larger in associate degree programs: a 10-percentage point
increase in the share of students that are underrepresented minorities is correlated with a $540 reduction
in a program’s NEP. We see the opposite relationship between net earnings and the share of students that
are White in Figure 4.
Page 9
_________________________________________________________________________________________________________
Student O utcomes at Community Colleg es 9
HUTCHINS CENTER ON FISCAL & MONETARY POLICY
Figure 3: Correlations between Student Outcomes and Demographics: %
Underrepresented Minority
Notes: Larger circles indicate a larger underlying number of exiters. URM = American Indian or Native Alaskan,
Black, or Hispanic.
Page 10
_________________________________________________________________________________________________________
Student O utcomes at Community Colleg es 10
HUTCHINS CENTER ON FISCAL & MONETARY POLICY
Figure 4: Correlations between Student Outcomes and Demographics: % White
Notes: Larger circles indicate a larger underlying number of exiters.
Page 11
_________________________________________________________________________________________________________
Student O utcomes at Community Colleg es 11
HUTCHINS CENTER ON FISCAL & MONETARY POLICY
Gender is also correlated with net earnings in certificate programs, with a 10-percentage point
increase in the share of students who are women being correlated with a $610 reduction in average net
earnings. The relationship between gender composition and net earnings for associate degree programs
appears nonlinear. The relationship between program-level NEP and gender composition appears
negative for associate programs that have fewer than 70 percent women, but the relationship appears
positive for associate programs that are between 70 and 90 percent female.
These figures also show strong correlations between program demographics and loan repayment
rates. Panel B of Figure 3 suggests that a 10-percentage point increase in the share of students that are
underrepresented minorities is correlated with a 1.1 percentage point lower share of a cohort’s balance
that is repaid after three years. We find an opposite correlation in Panel B of Figure 4, which shows the
share of students that are White. A 10-percentage point increase in the share of students that are White is
associated with a 1 percentage point higher share of a cohort’s balance that is repaid after three years.
Lastly, we see that a program’s gender composition is also correlated with repayment rates. As seen in
Panel B of Figure 5, a 10-percentage point increase in the share of students that are female is associated
with approximately a half of a percentage point drop in the fraction of a cohort’s balance that is repaid
after three years.
These patterns are concerning for the prospect of using earnings and loan repayment in an
accountability system that covers community college programs. The broad goals of accountability in
higher education should be to provide incentives for schools to make changes that will improve student
outcomes and, possibly, to exclude schools or programs that consistently produce poor outcomes from
participating in Title IV federal student aid programs. Community colleges are open-access institutions
and generally serve students in the surrounding geographic area. If performance on these prospective
metrics is a function of the types of students an institution serves, it is unlikely that linking incentives (or
penalties) to performance will lead to desired goals of improving program quality. Instead, such
accountability pressures may even serve to restrict access to higher education for students who could
benefit the most.
In Section IV, we explore whether these simple correlations between student demographics and
program performance can be partially explained by factors that are potentially under the control of a
school (or state). In the remainder of this section, we describe the factors and policies under
consideration.
Page 12
_________________________________________________________________________________________________________
Student O utcomes at Community Colleg es 12
HUTCHINS CENTER ON FISCAL & MONETARY POLICY
Figure 5: Correlations between Student Outcomes and Demographics: % Female
Notes: Larger circles indicate a larger underlying number of exiters.
Page 13
_________________________________________________________________________________________________________
Student O utcomes at Community Colleg es 13
HUTCHINS CENTER ON FISCAL & MONETARY POLICY
C. School-level correlates of student outcomes
At the school-level, we consider the role of both costs and inputs. We use two measures of costs found in
the College Scorecard: collected tuition and fees per full-time equivalent (FTE) student and the average
cost of attendance for federal student aid recipients.9 Collected tuition and fees accounts for institutional
discounts applied to the sticker price of tuition, while the latter measure includes cost of living expenses
and nets out grants from the institution, state, and federal government. We include these measures in our
analysis because increases in financial aid and/or reductions in tuition have been shown increase
community college enrollment and attainment (e.g., Martorell et al., 2014; Denning, 2017; Denning,
Marx, and Turner, 2019; Anderson, 2020; Acton, 2021).
When examining the correlates of net earnings, we also include an indicator for whether the
community college participates in federal student loan programs. This measures the extent to which
students can access federal loans to finance their college costs.10
Research suggests that when institutions
opt-out of federal loan programs, student attainment is lower (Dunlopc, 2013; Wiederspan, 2016). Fewer
than 10 percent of community colleges in our data opt out.
School-level inputs include spending on instruction per full-time-equivalent (FTE) student, per-FTE
spending on student services, average faculty salaries, and the percent of faculty that are full-time.11
While
Stange (2012) finds that per-student spending is largely uncorrelated with academic outcomes within the
community college sector, reductions in instructional spending following funding shocks to four-year
public institutions has been shown to lower attainment (Deming and Walters, 2017).
D. State-level correlates of student outcomes
At the state-level, we consider states with free community college programs and performance-based
funding (PBF) policies. We classify a state as either having a first-dollar free community college program,
last-dollar program, or no program before 2017.12 According to Mishory (2018), five states had
implemented a first-dollar free community college program by 2017 (Indiana, Louisiana, Mississippi,
Oklahoma, and Washington) and an additional five states had a last-dollar free community college
program (Delaware, Minnesota, Missouri, Oregon, and Tennessee).
We use data collected by InformEd States on the presence and structure of states’ performance-based
funding systems.13
Measures include a binary indicator for whether the state had PBF for community
colleges between 2014 and 2016, the percent of funding to community colleges allocated based on
performance, indicators for whether the state had bonus funding for adult, low-income, minority, or
. . .
9. Schools can report an average cost of attendance for the academic year or over the length of the largest program. About 90
percent of schools report an academic year average cost of attendance.
10. Loan program participation comes from Cochrane and Szabo-Kubitz (2016).
11. With the except of spending on student services per FTE, all of these measures come from the College Scorecard. We use the
2015 Delta Cost Project data – available at https://deltacostproject.org/delta-cost-data – to construct the remaining measure.
12. Last-dollar free college programs cover any remaining costs after all other sources of grant aid are applied. In these states,
students with sufficient grant aid to cover tuition and fees do not receive any monetary benefit from the free college program,
although other requirements or supports (e.g., community service, mentoring) may still affect their enrollment, attainment, and
post-college outcomes (Carruthers and Fox, 2016). In first-dollar programs, state and federal grant aid can be used to cover
living expenses and other non-tuition costs.
13. These data are available at: https://informedstates.org/data.
Page 14
_________________________________________________________________________________________________________
Student O utcomes at Community Colleg es 14
HUTCHINS CENTER ON FISCAL & MONETARY POLICY
academically underprepared community college student enrollment over this period, and indicators for
whether the state had bonus funding for STEM and health-related fields in community colleges. Evidence
on the effects of PBF suggests that linking funding to outcomes can lead to small improvements in
retention and graduation (Ortagus et al. 2020).
Finally, we include two measures of overall funding for community colleges: state and local
appropriations per FTE in 2015, and the amount of general fund appropriations to all two-year public
institutions in the state, averaged over the years 2014 through 2016.14 Chakrabarti et al. (2020) show that
shocks to state public higher education appropriations affect community college students’ attainment and
student debt levels. Based on this evidence, it is reasonable to expect that state appropriations for
community colleges could influence program-level earnings and loan repayment rates.
E. Characteristics of schools and state policies
Table 1 displays the average characteristics of community colleges, where characteristics are presented
separately for community colleges that predominantly offered certificates ("predominantly certificate-
granting”) and those that predominantly offered associate degree programs ("predominantly associate-
granting”). Panel A shows that the average NEP at predominantly associate-granting and predominantly
certificate-granting community colleges is $8,300 and $8,500, respectively. Median earnings 10 years
after college entry are $30,000 for predominantly certificate-granting community colleges and $32,000
for predominantly associate-granting community colleges.15
Three years after entering repayment, borrowers have reduced their aggregate loan balance by 1 to 2
percent on average. Approximately 30 percent of borrowers from predominantly certificate-granting
community colleges and 38 percent of borrowers from predominantly associate-granting community
colleges had made any progress paying down their loans in the first three years of repayment.
Turning to Panel B, close to 60 percent of community college students are women and around 50
percent are first generation students. Students at predominantly certificate-granting community colleges
are more likely to be White (62 versus 49 percent), while those in predominantly associate-granting
community colleges are more likely to be Asian (7 versus 4 percent) or Hispanic (28 versus 17 percent).
About 15 percent of students in each type of community college are Black and 1 percent are Native
American or Alaskan Native ("AIAN”).
. . .
14. Per-student appropriations were obtained from the Delta Cost Project and total general fund appropriations are from InformEd
States.
15. As a point of comparison, average median earnings for high school graduates in the states these institutions are located in are
just under $20,000.
Page 15
_________________________________________________________________________________________________________
Student O utcomes at Community Colleg es 15
HUTCHINS CENTER ON FISCAL & MONETARY POLICY
Table 1: Community college student outcomes, demographics, costs, and financial aid
receipt
Notes: Sample includes 554 predominantly certificate-granting institutions and 683 predominantly associate degree
institutions. School-level NEP equals the weighted average of program NEPs in the school. Median earnings 10 years
after entry comes from the College Scorecard and applies to all students who had earnings and were not enrolled in a
higher education institution 10 years after they entered the school. The dollar-based loan repayment rate is the
school-level analogue to the programmatic LRR. The borrower-based repayment rate represents the share of
borrowers who reduced their loan balance by at least $1, measured 3 years after entering repayment. Weighted
averages and standard deviations by number of program exiters (net earnings premium and dollar-based loan
repayment rate), number of former students with earnings 10 years after entering college (median earnings at 10
years), number of borrowers in the repayment cohort (borrower-based loan repayment rate), or number of
undergraduate students (Panels B and C).
Collected tuition and fees and the average cost of attendance are similar across predominantly
certificate-granting and associate-granting community colleges. Panel C shows that students pay an
average of about $2,000 in out-of-pocket costs for tuition and fees, and just under $13,000 in average
living expenses. Close to 90 percent of students in each type of community college receive Pell Grants and
around 40 percent borrow federal student loans. Between 8 and 9 percent of community college students
cannot take out federal loans, however, because they attend an institution that has opted out of
participating in these programs.
Predominant degree =
(1) Mean (2) SD (3) Mean (4) SD
A. Outcomes
Net earnings premium ($1k) 8.5 (9.1) 8.3 (7.8)
Med. earnings 10 years after entry ($1k)30.0 (4.2) 32.1 (3.9)
Dollar-based loan repayment rate 0.01 (0.05) 0.02 (0.04)
Borrower-based loan repayment rate 0.30 (0.08) 0.38 (0.09)
B. Student demographics
Percent female 0.59 (0.05) 0.58 (0.05)
Percent race/ethnicity =
AIAN 0.01 (0.03) 0.01 (0.04)
Asian 0.04 (0.06) 0.07 (0.08)
Black 0.15 (0.13) 0.16 (0.13)
Hispanic 0.17 (0.20) 0.28 (0.22)
White 0.62 (0.22) 0.49 (0.24)
First generation student 0.51 (0.06) 0.49 (0.06)
C. Costs and financial aid receipt
Tuition per FTE $2,044 (1027) $2,229 (1415)
Average net cost $12,594 (2028) $12,749 (2723)
Percent ever received Pell Grant 0.88 (0.07) 0.88 (0.09)
Percent ever received fed. Loans 0.41 (0.19) 0.37 (0.22)
Does not participate in fed loans 0.09 0.08
Associate degreeCertificate
Page 16
_________________________________________________________________________________________________________
Student O utcomes at Community Colleg es 16
HUTCHINS CENTER ON FISCAL & MONETARY POLICY
Table 2 provides descriptive statistics on community college inputs and state-level policies. Panel A
shows that per-student spending on instruction averages about $5,000 and faculty are paid between
$7,000 and $8,000 per month (or $63,000 to $69,000 for a 9-month academic year), on average.
Around 45 percent of faculty are full-time at both types of community colleges. Five percent of
predominantly associate-granting community colleges are in states with first-dollar free community
college programs before 2017 and 7 percent are located in states that with last-dollar free community
college programs. However, 44 percent of predominantly certificate-granting community colleges are in a
state with a first-dollar free community college program.16
Table 2: Community college inputs and state characteristics
Notes: Sample includes 554 predominantly certificate-granting institutions and 683 predominantly associate degree
institutions. Weighted averages and standard deviations (for non-binary measures) by number of undergraduate
students.
Finally, the majority of community colleges are located in states with performance-based funding.
Specifically, 66 percent of predominantly certificate-granting community colleges and 56 percent of
. . .
16. Most free community college programs have explicit restrictions on the length of time students can take-up the benefits after
graduating from high school. To the extent that sub-associate degree seeking students are more likely to be non-traditional
aged students, fewer than 44 percent will be eligible for the program.
Predominant degree =
(1) Mean (2) SD (3) Mean (4) SD
A. Inputs
Instructional spending per FTE $5,023 (2444) $5,340 (1653)
Average monthly faculty salary $7,003 (1999) $7,742 (1641)
Percent faculty full-time 0.44 (0.24) 0.46 (0.27)
B. State characteristics
Free community college program
First dollar 0.44 0.05
Last dollar 0.02 0.07
Performance based funding
Any 0.66 0.56
Percent from PBF 0.07 (0.14) 0.06 (0.16)
Bonus for
Adults 0.13 0.22
Low-income 0.60 0.43
Minority 0.11 0.14
Acad. disadvantaged 0.56 0.37
STEM 0.55 0.39
Health 0.12 0.30
State funding for CCs ($1m) $1,049 (1747) $1,562 (1878)
Associate degreeCertificate
Page 17
_________________________________________________________________________________________________________
Student O utcomes at Community Colleg es 17
HUTCHINS CENTER ON FISCAL & MONETARY POLICY
predominantly associate-granting community colleges are in states with some form of performance-based
funding. Yet, on average, less than one tenth of state funding is tied to performance.17
Most states with PBF provide additional funding based on enrollment of low-income students and
academically disadvantaged students and for STEM-focused programs. Predominantly certificate-
granting community colleges are in states that provide around $1 billion to the community college sector
(about $1,600 per student) while predominantly associate-granting community colleges are in states that
provide close to $1.6 billion (about $1,800 per student).
IV. Correlates of community college program performance
Student demographic characteristics are correlated with program-level Net Earnings Premiums and Loan
Repayment Rates. We quantify these raw correlations in Table 3, which presents results from weighted
ordinary least squares (OLS) regressions of the outcome measures (NEP and LRR) on the racial/ethnic
and gender composition of students within a program. Appendix A contains additional information on
these methods.
For each demographic group, the point estimate can be interpreted as the change in expected net
earnings (Panel A) or loan repayment (Panel B) when moving from a program with the average share of
students in that group to a program with a 10-percentage point higher share of students in that group
(relative to White or male students). For example, 14 percent of students in associate degree programs
are, on average, Black, while 68 percent are White. Column 2 in Table 3 (Panel A) shows a point estimate
of -0.349 for “% Black.” This means that an associate degree program with 24 percent Black students and
58 percent White students is predicted to have a net earnings premium that is $349 lower relative to a
program with average enrollment shares of White and Black students.
These estimates suggest that a program’s race/ethnicity and gender composition are significantly
correlated with program-level net earnings and loan repayment. The R-squared of each regression can be
interpreted as the percent of variation in the outcome that is explained by the included regressors. Panel A
of Table 3 shows that student demographic characteristics explain less than 2 percent of the variation in
associate degree program net earnings and less than 8 percent of certificate program net earnings.
Student demographics explain between 14 and 20 percent of the variation in loan repayment.
. . .
17. That said, in three states, the majority of funding for community colleges is based on performance: Tennessee (80 percent),
Ohio (83.3 percent), and North Dakota (100 percent).
Page 18
_________________________________________________________________________________________________________
Student O utcomes at Community Colleg es 18
HUTCHINS CENTER ON FISCAL & MONETARY POLICY
Table 3: Correlations between Program Demographics and Student Outcomes
Notes: Point estimates and standard errors from regressions of the outcome measure on the race/ethnicity and
gender composition of a program. Each point estimate represents the predicted change in the outcome due to a 10-
percentage point increase in the representation of that group (relative to % White students for race/ethnicity and
relative to % male students for % female). Observations are weighted to reflect the distribution of students across all
programs at the specified credential level. Robust standard errors clustered by institution; ∗∗ 𝑝 < 0.01, ∗ 𝑝 < 0.05,
+ 𝑝 < 0.10.
We next turn to see whether the correlation between student demographics and program outcomes
can be accounted for by program-, school-, and state-level factors and the extent to which these factors
explain the remaining variation in outcomes. If, for instance, community colleges that serve more female
or underrepresented minority students also offer a different mix of programs, spend less on instruction,
(1) Certificate (2) Associate (3) Combined
A. Net earnings ($1k)
% Asian -1.417 0.627 0.047
(1.235) (0.642) (0.596)
% Black -0.245 -0.349 -0.301
(0.193) (0.157)* (0.134)*
% Hispanic 0.272 -0.780 -0.418
(0.385) (0.197)** (0.243)+
% AIAN -5.734 1.421 -0.404
(2.085)** (1.169) (1.123)
% Female -0.608 -0.040 -0.396
(0.107)** (0.175) (0.108)**
R-squared 0.078 0.018 0.019
Number of programs 1,228 2,708 3,936
B. Loan repayment rate
% Asian -0.003 0.001 0.001
(0.006) (0.002) (0.002)
% Black -0.015 -0.016 -0.015
(0.001)** (0.001)** (0.001)**
% Hispanic -0.003 -0.008 -0.007
(0.003) (0.001)** (0.001)**
% AIAN -0.002 -0.019 -0.010
(0.004) (0.005)** (0.005)+
% Female -0.004 -0.005 -0.004
(0.001)** (0.001)** (0.0005)**
R-squared 0.138 0.203 0.168
Number of programs 2,813 7,792 10,605
Page 19
_________________________________________________________________________________________________________
Student O utcomes at Community Colleg es 19
HUTCHINS CENTER ON FISCAL & MONETARY POLICY
charge higher tuition, or are located in states with less beneficial policies, then the magnitude of the
correlation between race and outcomes should fall as we control for these factors.
We conduct these analyses by sequentially adding variables to the baseline models we estimate in
Table 3. In total, we add three sets of control variables to the model. The first set of controls add measures
of institutional inputs and costs (Panel C of Table 1 and Panel A of Table 2). The next set of controls are
for field of study, and the final set of controls are for state-level policies (Panels B and C of Table 2). Point
estimates and significance levels for each racial/ethnic group and outcome measure are presented in
Figures 6 and 7. In both figures, estimates for certificate programs and associate programs are presented
in Panels A and B, respectively.
Figure 6 shows the associations between program-level race/ethnicity compositions and net earnings.
The baseline model estimates – represented by the light blue bars in Figure 6 – correspond to the
estimates from a regression of net earnings on the race/ethnic composition of programs shown in Table 3.
The first set of controls we add to the baseline model are for institution-level inputs and costs. These
variables, for example, account for the extent to which prices and institutional spending vary with student
demographics. The strength of the association between race/ethnicity and NEP declines for both
certificate and associate degree programs after accounting for institutional factors. For associate degree
programs, the magnitude of the association between the share of students in a program who are Black and
net earnings falls by 18 percent after accounting for institution-level factors. The magnitude of the
association between the share Hispanic and program NEP falls by 10 percent. Changes in these
associations for certificate programs are less pronounced, although the raw association between net
earnings and program demographics are generally smaller.
The third specification controls for field of study. These controls account for the possibility that some
schools may offer more programs that lead to high earnings – such as health and STEM – whereas others
might have more program offerings in less-lucrative fields in the arts, public service, or humanities.
Accounting for field of study reverses the association between net earnings and the share of Black and
share of Hispanic students in an associate degree program. Specifically, within a given field of study, an
associate degree program with relatively more Black students is predicted to have significantly higher net
earnings than one with more White students. This finding suggests that within a given field of study,
earnings outcomes are not necessarily worse (and may in fact be better) when a program has higher URM
enrollment. Second, it suggests that field of study itself is correlated with the share of students who are
underrepresented minorities and that Black and Hispanic students are more likely to enroll in programs
where students have low post-college net earnings. Student demographics only explain 2 percent of the
variation in net earnings demographics, but when combined with school inputs and field of study, over 65
percent of the variation is explained.18
. . .
18. The R-squared indicates the share of variation in the outcome that is explained by covariates. Table 3, Panel A, Column 2
shows that a regression of net earnings on student demographics results in an R-squared of 0.02. After adding controls for
school inputs and field of study, the R-squared increases to 0.656 (Appendix Table B.2, specification 3).
Page 20
_________________________________________________________________________________________________________
Student O utcomes at Community Colleg es 20
HUTCHINS CENTER ON FISCAL & MONETARY POLICY
Figure 6: Correlations Between Student Race/Ethnicity and Program Net Earnings
Notes: See Appendix B for full list of estimates and for the covariates included in each model.
Page 21
_________________________________________________________________________________________________________
Student O utcomes at Community Colleg es 21
HUTCHINS CENTER ON FISCAL & MONETARY POLICY
For certificate programs, associations between the share of students who are Black and who are
Hispanic continue to be small but are both positive after controlling for field of study. The negative
association between the American Indian/Alaskan Native share of students remains but falls by 35
percent.
The final set of controls we include are for state-level funding (including performance-based funding)
and free college policies. Estimates from this fully-specified model are depicted by the yellow bars. We
observe a positive association between the share of students in associate programs that are Black and
program-level NEP. A ten-percentage point difference in the share of Black students in an associate
degree program corresponds to $700 higher predicted net earnings after controlling for all of the
observable factors described above. We observe similar positive associations for programs with more
American Indian/Alaskan Native students at the associate degree level. For certificate programs, the
share of students who are American Indian or Alaskan Native continues to have a marginally significant
(p < 0.10) negative association with net earnings, but the size of this relationship falls by an additional 37
percent once state-level factors are taken into account.
We now turn to the loan repayment rate metric; estimates are shown in Figure 7. We find strong
negative associations between loan repayment and nearly all race/ethnicity categories for both associate
and certificate programs. In the fully specified model – controlling for school inputs and costs, program
types and mixture, and state-level policies – we see that increases in the share of certificate program
students who are Black continues to have a strong negative association with loan repayment (Panel A).
Controlling for school-level inputs leads to a 16 percent reduction in the magnitude of this association. In
contrast to the patterns shown in Figure 6, however, additional controls for program of study and state-
level policies do not lead to further reductions. The share of Black, Hispanic, and Native American
students in associate degree programs is also associated with statistically significant lower loan repayment
(Panel B). For associate degree programs, however, institutional inputs and field of study can explain
some of this relationship – controlling for both sets of factors reduces the size of the association between
loan repayment and the share of students who are Black by 26 percent, the share Hispanic by 51 percent,
and the share AIAN by 14 percent.
Taken together, the estimates from Figures 6 and 7 suggest that the raw differences in predicted
earnings outcomes (and to some extent loan repayment outcomes for associate degree programs) for
programs with high and low shares of underrepresented minority students could be explained by
differences in (A) the mixture of programs offered by community colleges with high and low shares of
underrepresented minorities, and/or (B) differences in the within-school distribution of
underrepresented minorities and White students across programs. We explore the importance of each of
these two channels by examining whether there are systematic differences in the program offerings at
community colleges with large and small shares of underrepresented minority students.
Page 22
_________________________________________________________________________________________________________
Student O utcomes at Community Colleg es 22
HUTCHINS CENTER ON FISCAL & MONETARY POLICY
Figure 7: Correlations Between Student Race/Ethnicity and Program Loan Repayment Rate
Notes: See Appendix B for full list of estimates and for the covariates included in each model.
Page 23
_________________________________________________________________________________________________________
Student O utcomes at Community Colleg es 23
HUTCHINS CENTER ON FISCAL & MONETARY POLICY
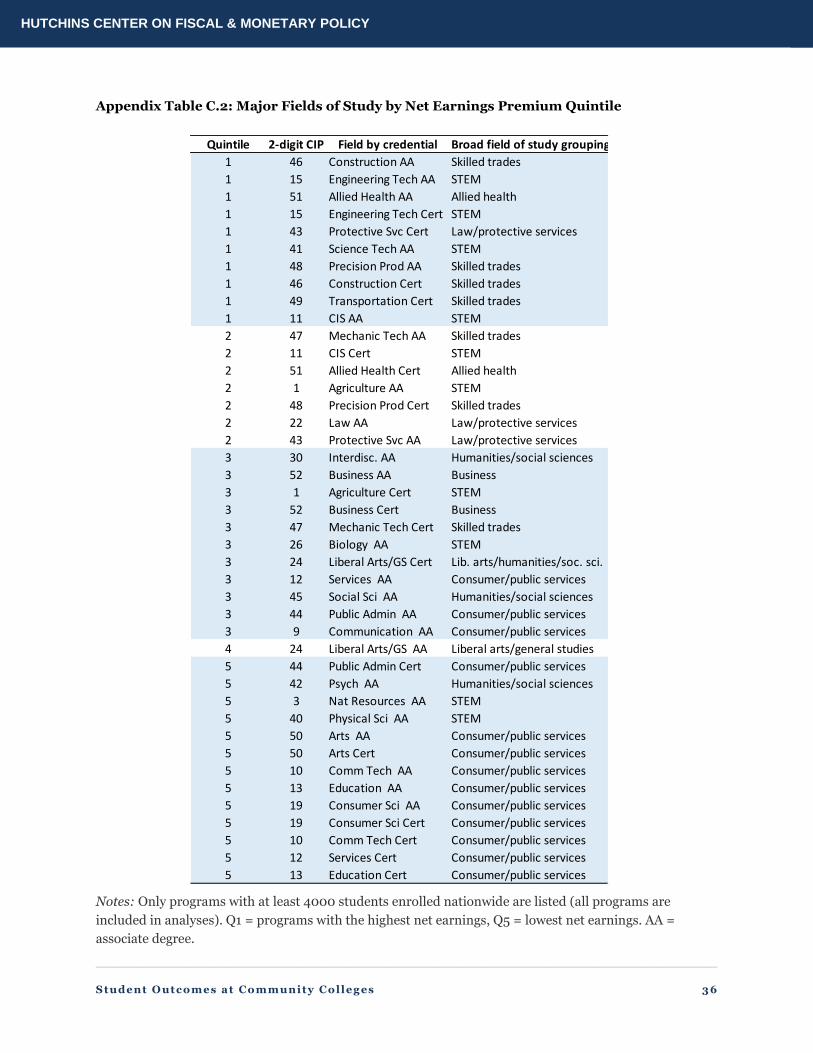
As there are more than 80 unique field of study by credential level categories, we create two broader
groupings of programs. First, we divide programs into five groups (quintiles) based on average net
earnings (shown in Figure 1), pooling associate and certificate programs. Second, roughly following
Carnevale (2020), we create 15 categories of broad field of study by credential level groups (e.g., Allied
Health, STEM, Liberal Arts, etc.). Appendix C contains additional information on the construction of
these groupings.19
Programs in the top 20 percent of net earnings typically have an average NEP of $12,500 or more.
This group includes associate degree programs in construction, engineering technology, Allied Health,
and science technology, as well as certificate programs in engineering technology, protective services, and
construction. Conversely, programs in the bottom 20 percent of net earnings have low—and sometimes
negative—average earning premiums and include service and education certificate programs as well as
education and consumer science associate degree programs. A full breakdown of programs by NEP
quintile is shown in Appendix C.
Next, we divide institutions into four equal-sized groups (quartiles) based on the share of students
who are underrepresented minorities. At least 57 percent of students enrolled in schools in the top
quartile are underrepresented minorities while in the bottom quartile, URM students make up less than
23 percent of the student body. For each of these four groups of institutions, we calculate the share of
program seats in each net earnings quintile (Table 4).20
If program offerings did not vary with the
race/ethnicity of the student body, we would expect to see around 20 percent of program seats in each net
earnings quintile.21
In fact, the availability of programs with the highest net earnings decreases as we move from schools
with low URM enrollment to those with high URM shares. For institutions serving the lowest share of
URM students, 24 percent of program offerings are those with the highest average net earnings premium,
and just seven percent of programs at these institutions are programs with the lowest average net
earnings premium. Conversely, at institutions that serve the highest concentration of URM students, just
16 percent of programs that are offered are programs with the highest earnings premiums, while 12
percent of programs at these institutions are programs with the lowest expected NEP. Said differently,
institutions that enroll the largest shares of minority students tend to offer fewer programs with high
earnings premia. Relative to institutions that enroll mostly White students, these community colleges
tend to offer more seats in programs that have lower net earnings, on average.
. . .
19. There is a good deal of overlap between programs in the top two net earnings quintiles and programs classified as skilled
trades, STEM, allied health, and protective services. Almost all programs in the bottom quintile are classified as consumer and
public services, liberal arts, and business
20. Shares are based on the number of completers, which is a reasonable proxy for the number of available seats in a given field
and degree or credential program.
21. In theory, the bottom quintile should also have approximately 20 percent of students. In practice, around 27 percent of
community college students enroll in a liberal arts/general studies associate degree program, which leads to an uneven
distribution of enrollment in programs between the second to last and bottom quintiles.
Page 24
_________________________________________________________________________________________________________________________________________________
Student O utcomes at Community Colleg es 24
HUTCHINS CENTER ON FISCAL & MONETARY POLICY
Table 4: Program Offerings by Share Underrepresented Minority Quartile
Notes: This table displays the share of program seats by program earnings quintile in a school, where schools are divided into four equally sized groups (quartiles)
based on the share of students who are underrepresented minorities. Schools in the lowest quartile are those with URM enrollment making up less than 23 percent
of the student body. Schools in the second and third quartiles are those with URM students making up 23-37% and 38-56% of all students, respectively. Schools in
the top quartile are those with URM students making up more than 56 percent of the student body. Earnings quintiles are based on the distribution of programs
(2-digit CIP by credential level) by average NEP (see Figure 1 and Appendix B). The range of average net earnings for each quintile is shown below each (row)
category. *The second quintile only includes liberal arts/general studies associate degree programs, which enroll approximately 27 percent of community college
students. As a result, programs in the bottom quintile contain about 10 percent of all community college students. N = 1239 schools.
Quartile URM enrollment:
Bottom quartile: Schools w/
the smallest share of URM
students (< 23% URM)
Second quartile (23 - 37%) Third quartile (38 - 56%)
Top quartile: schools with the
highest share of URM
students (> 56%)
Net earnings quintile:
Top quintile
(NEP > $12,150)
Fourth quintile
($7,450 - $12,150)
Third quintile
($2,870 - $12,150)
Second quintile*
($2,670 - $2,870)
Bottom quintile
(< $2,670)
19%
17%
28%
26%
10%
16%
15%
27%
30%
12%
24%
23%
20%
26%
7%
20%
19%
24%
27%
10%
Page 25
_________________________________________________________________________________________________________
Student O utcomes at Community Colleg es 25
HUTCHINS CENTER ON FISCAL & MONETARY POLICY
We next turn to look at specific fields of study and credentials. Table 5 focuses on schools at the top
and bottom of the distribution of URM enrollment, using the same quartiles as Table 4. For this analysis,
we group programs into broad fields of study (see Appendix C for details). The first two columns show the
percent of program offerings in the broad field and credential level. The third column illustrates the
difference in availability of each program group. For instance, the relative availability of skilled trades
associate degree programs is almost three times greater in schools that have the lowest concentration of
URM students compared to schools with the highest. Schools with the lowest share of URM students offer
twice as many STEM associate degree seats as those serving the most URM students.
Table 5: Specific Program Offerings by Share URM Quartile
Note: Q1 URM enrollment = (0, 0.23); Q4 = [0.57, 1). See Appendix C for programs in each net earnings quintile.
Taken together, Tables 4 and 5 suggest that school-level differences in the availability of programs in
the skilled trades, STEM fields, and Allied Health – which typically have the highest net earning
premiums, on average – likely contribute to the negative correlation between student demographics and
program level outcomes.
V. Conclusion
The evidence presented in this study reveals the complexity in regulating the community college sector.
Institution-level accountability measures – such as the Cohort Default Rate or institutional accreditation
– ignore the wide variation in student outcomes across different programs and fields of study. But even
accountability measures that are specific to programs – such as the GE rule – raise potential concerns.
This is because many factors correlate with student outcomes. Some of these factors are under the control
of the institution, while other are not.
Q1 Q4 Q1 to Q4 ratio
By broad field of study and credential
Skilled trades associate 0.03 0.01 2.89
Allied health certificate 0.14 0.06 2.10
Allied health associate 0.12 0.08 1.52
Skilled trades certificate 0.08 0.05 1.52
STEM associate 0.06 0.04 1.40
STEM certificate 0.04 0.04 1.14
Business associate 0.06 0.06 0.99
Liberal arts/GS associate 0.26 0.29 0.87
Business certificate 0.04 0.05 0.82
Service associate 0.07 0.09 0.80
Law/protection associate 0.00 0.00 0.80
Service certificate 0.05 0.08 0.57
Lib. Arts/humanities/soc sci. cert. 0.02 0.04 0.56
Law/protection certificate 0.00 0.00 0.38
Social science associate 0.02 0.08 0.23
Page 26
_________________________________________________________________________________________________________
Student O utcomes at Community Colleg es 26
HUTCHINS CENTER ON FISCAL & MONETARY POLICY
In particular, community colleges do not have control over the students they enroll. Similarly,
community colleges do not have control over their geographic location or strength of the surrounding
labor market. These factors may be important determinants of a students’ future economic success but are
outside of the scope of what could be changed by a federal accountability. Moreover, programs located
within institutions that serve large shares of underrepresented students could be unfairly punished by
program-level accountability metrics, since the students that attend these institutions will likely face
greater challenges in the labor market, all else equal.
At the same time, the fact that community colleges provide access to low-income and minority
students underlines the importance of ensuring these students receive some benefit from enrolling. While
earnings and employment are far from the only benefits of attending college, students who enter college
with few resources should expect to see some economic benefit in return for their time and money.
Indeed, our findings suggest that community colleges do have control over other important factors that
can improve students’ economic circumstances. For example, community colleges and state higher
education leaders have some control over the types and mixture of programs they offer (or encourage
students to enroll in), the mix of full-time/adjunct faculty they hire, spending on instruction and student
services, and, at the state-level, the amount and structure of community college funding. As we
demonstrate, these factors are correlated with student outcomes.
On balance, we find that demographics are not destiny for program-level outcomes in the community
college sector. Negative associations between program-level demographics and earnings shrink after
controlling for a rich set of program-, institution-, and state-level factors. An important contributor to the
differences in outcomes between Black and White students at community colleges appears to be the
programs of study they are offered rather than the characteristics of students themselves.
Regulating the community college sector is an inherently tricky business, but we find that community
colleges have room to improve when it comes to the labor market outcomes of their former students.
Page 27
_________________________________________________________________________________________________________
Student O utcomes at Community Colleg es 27
HUTCHINS CENTER ON FISCAL & MONETARY POLICY
REFERENCES
Acton, R. (2021). Effects of reduced community college tuition on college choices and degree completion. Education Finance and
Policy, 16(3), 388-417.
Anderson, D. M. (2020). When financial aid is scarce: The challenge of allocating college aid where it is needed most. Journal of
Public Economics, 190, 104253.
Bahr, P.R., Toth, C. Thirolf, K. & Masse, J.C., (2013). A Review and Critique of the Literature on Community College Students’
Transition Process and Outcomes in Four-Year Institutions. Higher Education: Handbook of Theory and Research (28), p.
459-511.
Bahr, P.R., Dynarski, S., Jacob, B., Kreisman, D., Sosa, A., & Wiederspan, M., (2015). Labor Market Returns to Community College
Awards: Evidence From Michigan. CAPSEE working paper.
Bailey, T., & Morest, V.S., (2006). Defending the Community College Equity Agenda in Defending the Community College Equity
Agenda, Bailey, T., & Morest, V.S. (eds.). Baltimore, MD: John Hopkins University Press.
Barr, A., & Turner, S.E., (2013). Expanding Enrollments and Contracting State Budgets: The Effect of the Great Recession on Higher
Education. The Annals of the American Academy of Political and Social Science (650), p. 168-193.
Calcagno, J.C., Bailey, T., Jenkins, D., Kienzl, G., & Leinbach, T., (2008). Community College Student Success: What Institutional
Characteristics Make a Difference? Economics of Education Review 27, 632-645.
Carnevale, A.P., Garcia, T.I., Ridley, N., & Quinn, M.C., (2020). The Overlooked Value of Certificates and Associate’s Degrees: What
Students Need to Know Before they go to College. Washington, DC: Georgetown University Center on Education and the
Workforce.
Carruthers, C. K., & Fox, W. F. (2016). Aid for all: College coaching, financial aid, and post-secondary persistence in Tennessee.
Economics of Education Review, 51, 97-112.
Carruthers, C. K., Fox, W. F., & Jepsen, C. (2020). Promise Kept? Free Community College, Attainment, and Earnings in Tennessee.
Working paper.
Chakrabarti, R., Gorton, N., & Lovenheim, M. F. (2020). State investment in higher education: Effects on human capital formation,
student debt, and long-term financial outcomes of students. National Bureau of Economic Research working paper 27885.
Cochrane, D., & Szabo-Kubitz, L. (2016). States of Denial: Where Community College Students Lack Access to Federal Student
Loans. Washington, DC: Institute for College Access & Success.
Cummings, K., Laderman, K., Lee, J., Tandberg, D., & Weeden, D. (2021). Investigating the Impacts of State Higher Education
Appropriations and Financial Aid. Boulder, Colorado: State Higher Education Executive Officers Association.
Dadgar, M., & Trimble, M.J., (2015). Labor Market Returns to Sub-Baccalaureate Credentials: How Much Does a Community
College Degree or Certificate Pay? Educational Evaluation and Policy Analysis 37(4): 399-418.
Deming, D. J., & Walters, C. R. (2017). The impact of price caps and spending cuts on US postsecondary attainment. National
Bureau of Economic Research working paper 23736.
Denning, J. T. (2017). College on the cheap: Consequences of community college tuition reductions. American Economic Journal:
Economic Policy, 9(2), 155-88.
Denning, J. T., Marx, B. M., & Turner, L. J. (2019). ProPelled: The effects of grants on graduation, earnings, and welfare. American
Economic Journal: Applied Economics, 11(3), 193-224.
Dunlop, E. (2013). What do Stafford Loans actually buy you? The effect of Stafford Loan access on community college students.
National Center for Analysis of Longitudinal Data in Education Research. Working Paper 94.
Grosz, M. (2020). The returns to a large community college program: Evidence from admissions lotteries. American Economic
Journal: Economic Policy, 12(1), 226-53.
Hoxby, C.M., & Turner, S.E., (2019). Measuring Opportunity in U.S. Higher Education. National Bureau of Economic Research
working paper 25479.
Hurwitz, M., & Lee, J., (2018). Grade Inflation and the Role of Standardized Testing in Measuring Success: Testing, Grades, and the
Future of College Admissions, Buckley, J., Letukas, L., and Wildavsky, B., (eds.). Baltimore, MD: John Hopkins University
Press.
Jacobson, L.S., LaLonde, R.J., & Sullivan, D.G., (2005). Estimating the Returns to Community College Schooling for Displaced
Workers. Journal of Econometrics 125(1), 271-304.
Page 28
_________________________________________________________________________________________________________
Student O utcomes at Community Colleg es 28
HUTCHINS CENTER ON FISCAL & MONETARY POLICY
Jepsen, C., Troske, K., & Coomes, P., (2014). The Labor-Market Returns to Community College Degrees, Diplomas, and
Certificates. Journal of Labor Economics, 32(1): 95-121.
Kane, T.J., and Rouse, C.E., (1993). Labor-Market Returns to Two- and Four-Year College. The American Economic Review 85(3),
600-614.
Leigh, D.E., & Gill, A.M., (1997). Labor Market Returns to community Colleges: Evidence for Returning Adults, The Journal of
Human Resources 32(2), 334-353.
Long, B.T., (2018). The College Completion Landscape: Trends, Challenges, and Why it Matters. Washington, DC: American
Enterprise Institute.
Looney, A. & Yannelis, C., (2015). A Crisis in Student Loans? How Changes in the Characteristics of Borrowers and in the
Institutions They Attended Contributed to Rising Loan Defaults. Brookings Papers on Economic Activity, 2, 1-89.
Ma, J., Pender, M., & Libassi, C. J. (2020). Trends in College Pricing and Student Aid 2020. New York: College Board.
Marcotte, D.E., Bailey, T., Borkoski, C., & Kienzl, G.S., (2005). The Returns of a Community College Education: Evidence from the
National Education Longitudinal Study. Educational Evaluation and Policy Analysis, 27, 157-175.
Martorell, P., McCall, B. & McFarlin, I. (2014). Do Public Tuition Subsidies Promote College Enrollment? Evidence from Community
College Taxing Districts in Texas. Center for Economic Studies (CES) Working Paper 14-32.
Matsudaira, J. D., & Turner, L. J. (2020). Towards a Framework for Accountability for Federal Financial Assistance Programs in
Postsecondary Education. Washington, DC: Brookings Institution.
Miller, B. (2018). Getting Repayment Rates Right. Washington, DC: Center for American Progress.
Minaya, V. & Scott-Clayton, J., (2017). Labor Market Trajectories for Community College Graduates: New Evidence Spanning the
Great Recession. CAPSEE working paper.
Mishory, J. (2018) The Future of Statewide College Promise Programs A State Guide to Free College. Washington, DC: The Century
Foundation Report.
Ortagus, J. C., Kelchen, R., Rosinger, K., and Voorhees, N. (2020). Performance-based funding in American higher education: A
systematic synthesis of the intended and unintended consequences. Educational Evaluation and Policy Analysis 42(4): 520-
550.
Porchea, S.F., Allen, J., Robbins, S., & Phelps, R.P., (2016). Predictors of Long-Term Enrollment and Degree Outcomes for
Community College Students: Integrating Academic, Psychosocial, Socio-Demographic, and Situational Factors. The Journal of
Higher Education 81(6):750-778.
Romano, R.M., & Eddy, P.L., (2017). Community Colleges and Social Mobility. Change: The Magazine of Higher Learning 49(6),
55-62.
Rouse, C.E., (1995). Democratization or Diversion? The Effect of Community Colleges on Educational Attainment. Journal of
Business & Economic Statistics 13(2), p. 217-224.
Sacket, P.R., & Kuncel, N.R., (2018). Eight Myths about Standardized Admissions Testing in Measuring Success: Testing, Grades,
and the Future of College Admissions, Buckley, J., Letukas, L., and Wildavsky, B., (eds.). Baltimore, MD: John Hopkins
University Press.
Schneider, M., & Sigelman, M., (2018). Saving the Associate of Arts Degree: How an A.A. Degree can Become a Better Path to Labor
Market Success. Washington, DC: American Enterprise Institute.
Shaw, E.J., (2018). The Core Case for Testing: The State of Our Research Knowledge in Measuring Success: Testing, Grades, and
the Future of College Admissions, Buckley, J., Letukas, L., and Wildavsky, B., (eds.). Baltimore, MD: John Hopkins University
Press.
Stevens, A.H., Kurlaender, M. & Grosz, M., (2019). Career Technical Education and Labor Market Outcomes: Evidence from
California Community Colleges. Journal of Human Resources 54(4): 986-1036.
Wiederspan, M. (2016). Denying loan access: The student-level consequences when community colleges opt out of the Stafford loan
program. Economics of Education Review, 51, 79-96.
Xu, D., and Trimble, M.J., (2016). What About Certificates? Evidence on the Labor Market Returns to Non-Degree Community
College Awards in Two States. Educational Evaluation and Policy Analysis 38(2): 272-292.
Page 29
_________________________________________________________________________________________________________
Student O utcomes at Community Colleg es 29
HUTCHINS CENTER ON FISCAL & MONETARY POLICY
APPENDIX A: METHODS
The goal of this paper is to examine characteristics and policies associated with community college
students’ earnings and loan repayment outcomes. To do so, we estimate four ordinary least squares (OLS)
models. Each model iteratively adds new sets of control variables. Models are run separately for certificate
and associate degree programs and for the pooled set of programs. In all cases, observations are weighted
to account for missing data on earnings and loan repayment such that the set of programs with
nonmissing data is representative of all programs nationwide when weights are used.1 We calculate
robust standard errors that are clustered at the institution-level.
Model 1 regresses the outcome variables (LRR and NEP, respectively) on the percentage of students in
the program by race/ethnicity (percent White is the omitted category) and by gender (percent male is the
omitted category). Y is the outcome of program p with credential level c, Race is a vector of control
variables for program p’s racial/ethnic, Gender is the percent of students in program p that are women,
and e is the error term. Standard errors are clustered at the institution level.
𝑌𝑝𝑐 = 𝛽0 + 𝛽1𝑅𝑎𝑐𝑒𝑝𝑐 + 𝛽2𝐺𝑒𝑛𝑑𝑒𝑟𝑝𝑐 + 𝑢𝑝𝑐 (1)
Model 2 adds a vector of control variables for institutional characteristics (𝑋𝑗) and Model 3 adds a
vector of program fixed effects or program by credential level fixed effects in the pooled model (𝐶𝐼𝑃𝑝).
Model 4 adds controls for state characteristics (𝑍𝑠). upc is the residual from each regression.
𝑌𝑝𝑐 = 𝛽0 + 𝛽𝑅𝑅𝑎𝑐𝑒𝑝𝑐 + 𝛽𝐺𝐺𝑒𝑛𝑑𝑒𝑟𝑝𝑐 + 𝛽𝑋𝑋𝑗 + 𝑢𝑝𝑐 (2)
𝑌𝑝𝑐 = 𝛽0 + 𝛽𝑅𝑅𝑎𝑐𝑒𝑝𝑐 + 𝛽𝐺𝐺𝑒𝑛𝑑𝑒𝑟𝑝𝑐 + 𝛽𝑋𝑋𝑗 + 𝛽𝐶𝐼𝑃𝐶𝐼𝑃𝑝𝑐 + 𝑢𝑝𝑐 (3)
𝑌𝑝𝑐 = 𝛽0 + 𝛽𝑅𝑅𝑎𝑐𝑒𝑝𝑐 + 𝛽𝐺𝐺𝑒𝑛𝑑𝑒𝑟𝑝𝑐 + 𝛽𝑋𝑋𝑗 + 𝛽𝐶𝐼𝑃𝐶𝐼𝑃𝑝𝑐 + 𝛽𝑆𝑡𝑍𝑠 + 𝑢𝑝𝑐 (4)
The estimates from these four regression models correspond to the four bars in Figures 6 and 7.
Specifically, Equation 1 is the model for the “Raw” estimates; Equation 2 is the model for the “+ School
inputs and costs” estimates; Equation 3 is the model for the “+ Programs” estimates; Equation 4 is the
model for the “+Free College and PBF” estimates.
A small number of schools are missing data used to construct specific covariates. In these cases, we
include an indicator for whether this variable is missing and set the value of the variable equal to zero.2
. . .
1. See Matsudaira and Turner (2020) for additional details on the construction of these weights.
2. Specifically, 5 percent of programs (6 percent of students) are in schools missing information on state and local appropriations,
3 percent of programs (2 percent of students) are in schools without information on spending on student services, 5 percent of
programs (2 percent of students) are in schools without data on the percent of faculty that are full-time, and 4 percent of
programs (2 percent of students) are missing data on faculty salaries. Finally, information on state general fund appropriations
to community colleges is missing for 0.5 percent of programs (N = 53) because this data is not available in the state of South
Dakota.
Page 30
_________________________________________________________________________________________________________
Student O utcomes at Community Colleg es 30
HUTCHINS CENTER ON FISCAL & MONETARY POLICY
APPENDIX B: ADDITIONAL TABLES AND FIGURES
Table B.1: Correlations
between Certificate Program
Net Earnings and Student,
School, and State
Characteristics
Page 31
_________________________________________________________________________________________________________
Student O utcomes at Community Colleg es 31
HUTCHINS CENTER ON FISCAL & MONETARY POLICY
Table B.2: Correlations between Associate Program Net Earnings and Student, School, and
State Characteristics
(1) (2) (3) (4)
R-squared 0.018 0.021 0.656 0.669
% Asian 0.627 0.619 0.187 0.240
(0.642) (0.651) (0.498) (0.536)
% Black -0.349 -0.287 0.630 0.700
(0.157)* (0.162)+ (0.134)** (0.120)**
% Hispanic -0.780 -0.703 0.217 0.004
(0.197)** (0.208)** (0.230) (0.232)
% AIAN 1.421 1.545 1.599 1.234
(1.169) (1.171) (0.631)* (0.599)*
% Female -0.040 -0.028 -1.401 -1.394
(0.175) (0.176) (0.296)** (0.275)**
Average net cost ($1k) -0.080 -0.137 -0.123
(0.114) (0.095) (0.092)
T&F per FTE ($1k) 0.291 0.356 0.523
(0.163)+ (0.132)** (0.141)**
Fed loan opt-out 2.527 0.987 1.228
(1.368)+ (0.961) (1.015)
Instr. spend/FTE ($1k) 0.025 -0.230 -0.277
(0.155) (0.139)+ (0.155)+
Student svc. spend/FTE ($1k) 0.029 -0.020 -0.171
(0.510) (0.473) (0.524)
Faculty salary ($1k) -0.006 0.367 0.295
(0.240) (0.222)+ (0.218)
% faculty FT 0.284 0.681 1.042
(1.280) (1.137) (1.253)
Free college - first dollar -0.713
(0.739)
Free college - last dollar -0.577
(0.862)
State + local approps/FTE ($1k) -0.034
(0.146)
State CC budget ($1m) 0.0003
(0.0004)
Any PBF 1.860
(0.949)+
Percent budget BPF -2.841
(2.259)
PBF bonus: low income 1.565
(1.049)
PBF bonus: adults -0.100
(1.528)
PBF bonus: URM -0.138
(1.264)
PBF bonus: acad. Disadvantaged -0.667
(0.98)
PBF bonus: STEM -0.486
(1.56)
PBF bonus: health -0.339
(1.626)
Field of study FE X X
Number of programs 2,708 2,708 2,708 2,708
Page 32
_________________________________________________________________________________________________________
Student O utcomes at Community Colleg es 32
HUTCHINS CENTER ON FISCAL & MONETARY POLICY
Table B.3: Correlations between Certificate Program Loan Repayment and Student,
School, & State Characteristics
(1) (2) (3) (4)
R-squared 0.138 0.211 0.243 0.272
% Asian -0.003 -0.011 -0.008 -0.009
(0.006) (0.007)+ (0.007) (0.007)
% Black -0.015 -0.012 -0.013 -0.012
(0.001)** (0.002)** (0.002)** (0.002)**
% Hispanic -0.003 -0.002 -0.001 -0.003
(0.003) (0.003) (0.003) (0.003)
% AIAN -0.002 -0.008 -0.004 -0.007
(0.004) (0.005) (0.005) (0.007)
% Female -0.004 -0.004 -0.007 -0.006
(0.001)** (0.001)** (0.002)** (0.002)**
Average net cost ($1k) 0.003 0.002 0.002
(0.002) (0.002) (0.002)
T&F per FTE ($1k) 0.001 0.001 0.002
(0.003) (0.003) (0.003)
Instr. spend/FTE ($1k) 0.003 0.003 0.001
(0.001)* (0.001)* (0.001)
Student svc. spend/FTE ($1k) 0.010 0.009 0.002
(0.004)* (0.004)* (0.005)
Faculty salary ($1k) 0.005 0.005 0.005
(0.002)* (0.002)* (0.002)*
% faculty FT -0.016 -0.016 -0.015
(0.011) (0.011) (0.009)+
Free college - first dollar -0.002
(0.009)
Free college - last dollar 0.001
(0.011)
State + local approps/FTE ($1k) 0.003
(0.001)*
State CC budget ($1m) 0.000002
(0.000004)
Any PBF -0.008
(0.011)
Percent budget BPF 0.036
(0.026)
PBF bonus: low income 0.057
(0.016)**
PBF bonus: adults -0.049
(0.016)**
PBF bonus: URM 0.023
(0.011)*
PBF bonus: acad. Disadvantaged 0.017
(0.013)
PBF bonus: STEM -0.088
(0.017)**
PBF bonus: health 0.059
(0.016)**
Number of programs 2,813 2,813 2,813 2,813
Page 33
_________________________________________________________________________________________________________
Student O utcomes at Community Colleg es 33
HUTCHINS CENTER ON FISCAL & MONETARY POLICY
Table B.4: Correlations between Associate Program Loan Repayment and Student, School,
and State Characteristics
(1) (2) (3) (4)
R-squared 0.203 0.251 0.358 0.407
% Asian 0.001 0.0002 0.001 0.002
(0.002) (0.002) (0.002) (0.002)
% Black -0.016 -0.014 -0.012 -0.012
(0.001)** (0.001)** (0.001)** (0.001)**
% Hispanic -0.008 -0.006 -0.004 -0.004
(0.001)** (0.001)** (0.001)** (0.001)**
% AIAN -0.019 -0.018 -0.016 -0.021
(0.005)** (0.005)** (0.004)** (0.005)**
% Female -0.005 -0.005 -0.009 -0.008
(0.001)** (0.001)** (0.001)** (0.001)**
Average net cost ($1k) 0.001 0.001 0.001
(0.001) (0.001) (0.001)
T&F per FTE ($1k) 0.003 0.004 0.003
(0.002)* (0.002)* (0.002)*
Instr. spend/FTE ($1k) 0.003 0.002 0.002
(0.001)** (0.001)** (0.001)
Student svc. spend/FTE ($1k) 0.006 0.007 0.004
(0.003)+ (0.003)* (0.003)
Faculty salary ($1k) -0.001 -0.00003 0.002
(0.002) (0.002) (0.002)
% faculty FT -0.001 -0.001 -0.003
(0.006) (0.006) (0.006)
Free college - first dollar -0.014
(0.006)*
Free college - last dollar -0.029
(0.009)**
State + local approps/FTE ($1k) 0.002
(0.001)+
State CC budget ($1m) -0.00001
(0.000002)**
Any PBF -0.024
(0.007)**
Percent budget BPF 0.048
(0.021)*
PBF bonus: low income 0.036
(0.009)**
PBF bonus: adults -0.067
(0.012)**
PBF bonus: URM 0.018
(0.007)*
PBF bonus: acad. Disadvantaged 0.039
(0.008)**
PBF bonus: STEM -0.066
(0.012)**
PBF bonus: health 0.055
(0.011)**
Field of study FE X X
Number of programs 7,792 7,792 7,792 7,792
Page 34
_________________________________________________________________________________________________________
Student O utcomes at Community Colleg es 34
HUTCHINS CENTER ON FISCAL & MONETARY POLICY
APPENDIX C: FIELD OF STUDY GROUPINGS
Appendix Table C.1A: CIP Groupings of Certificate Programs
CIP Grouping 2-digit CIP 2-digit CIP Label
(1) Skilled trades
47 Mechanic Tech
48 Precision Prod
46 Construction
49 Transportation
(2) Business 52 Business
(3) Consumer and
Public Services
31 Parks/Rec
9 Communication
50 Arts
10 Comm Tech
25 Library Sci
13 Education
44 Public Admin
12 Services
19 Consumer Sci
(4) Law/Protective
Svc
22 Law
43 Protective Svc
(5) Health 51 Allied Health
(6) Liberal Arts,
Humanities, and Social
Sciences
5 Area Studies
24 Liberal Arts/GS
30 Interdisciplinary
23 English
42 Psych
16 Foreign Lang
45 Social Sci
38 Philosophy
39 Theology
54 History
(7) STEM
14 Engineering
41 Science Tech
15 Engineering Tech
11 CIS
4 Architecture
26 Biology
27 Math/Stat
40 Physical Sci
1 Agriculture
3 Nat Resources
Page 35
_________________________________________________________________________________________________________
Student O utcomes at Community Colleg es 35
HUTCHINS CENTER ON FISCAL & MONETARY POLICY
Appendix Table C.1B: CIP Groupings of Associate Degree Programs
CIP Grouping 2-digit CIP 2-digit CIP Label
(1) Skilled trades
48 Precision Prod
47 Mechanic Tech
49 Transportation
46 Construction
(2) Business 52 Business
(3) Consumer and Public
Services
44 Public Admin
9 Communication
10 Comm Tech
25 Library Sci
31 Parks/Rec
50 Arts
13 Education
12 Services
19 Consumer Sci
(4) Law and Protective Svc
22 Law
43 Protective Svc
29 Military Tech
(5) Health 51 Allied Health
(6) Humanities and Social
Sciences
38 Philosophy
45 Social Sci
5 Area Studies
23 English
42 Psych
16 Foreign Lang
54 History
30 Interdisciplinary
39 Theology
(7) Liberal Arts/Gen.
Studies 24 Liberal Arts/GS
(8) STEM
27 Math/Stat
41 Science Tech
11 CIS
14 Engineering
40 Physical Sci
26 Biology
4 Architecture
15 Engineering Tech
3 Nat Resources
1 Agriculture
Page 36
_________________________________________________________________________________________________________
Student O utcomes at Community Colleg es 36
HUTCHINS CENTER ON FISCAL & MONETARY POLICY
Appendix Table C.2: Major Fields of Study by Net Earnings Premium Quintile
Notes: Only programs with at least 4000 students enrolled nationwide are listed (all programs are
included in analyses). Q1 = programs with the highest net earnings, Q5 = lowest net earnings. AA =
associate degree.
Quintile 2-digit CIP Field by credential Broad field of study grouping
1 46 Construction AA Skilled trades
1 15 Engineering Tech AA STEM
1 51 Allied Health AA Allied health
1 15 Engineering Tech Cert STEM
1 43 Protective Svc Cert Law/protective services
1 41 Science Tech AA STEM
1 48 Precision Prod AA Skilled trades
1 46 Construction Cert Skilled trades
1 49 Transportation Cert Skilled trades
1 11 CIS AA STEM
2 47 Mechanic Tech AA Skilled trades
2 11 CIS Cert STEM
2 51 Allied Health Cert Allied health
2 1 Agriculture AA STEM
2 48 Precision Prod Cert Skilled trades
2 22 Law AA Law/protective services
2 43 Protective Svc AA Law/protective services
3 30 Interdisc. AA Humanities/social sciences
3 52 Business AA Business
3 1 Agriculture Cert STEM
3 52 Business Cert Business
3 47 Mechanic Tech Cert Skilled trades
3 26 Biology AA STEM
3 24 Liberal Arts/GS Cert Lib. arts/humanities/soc. sci.
3 12 Services AA Consumer/public services
3 45 Social Sci AA Humanities/social sciences
3 44 Public Admin AA Consumer/public services
3 9 Communication AA Consumer/public services
4 24 Liberal Arts/GS AA Liberal arts/general studies
5 44 Public Admin Cert Consumer/public services
5 42 Psych AA Humanities/social sciences
5 3 Nat Resources AA STEM
5 40 Physical Sci AA STEM
5 50 Arts AA Consumer/public services
5 50 Arts Cert Consumer/public services
5 10 Comm Tech AA Consumer/public services
5 13 Education AA Consumer/public services
5 19 Consumer Sci AA Consumer/public services
5 19 Consumer Sci Cert Consumer/public services
5 10 Comm Tech Cert Consumer/public services
5 12 Services Cert Consumer/public services
5 13 Education Cert Consumer/public services
Page 37
HUTCHINS CENTER ON FISCAL & MONETARY POLICY
.
The mission of the Hutchins Center on Fiscal and Monetary Policy is to improve the quality and efficacy of fiscal and monetary policies and public understanding of them.
Questions about the research? Email [email protected] . Be sure to include the title of this paper in your inquiry.
© 2021 The Brookings Institution | 1775 Massachusetts Ave., NW, Washington, DC 20036 | 202.797.6000