The Bugs Coleopteran Ecology Package (BugsCEP) database: 1000 sites and half a million fossils later Philip I. Buckland Department of Historical, Philosophical and Religious Studies, Environmental Archaeology Lab, Umeå University, Umeå SE-90187, Sweden article info Article history: Available online xxx abstract The Bugs database project started in the late 1980s as what would now be considered a relatively simple system, albeit advanced for its time, linking fossil beetle species lists to modern habitat and distribution information. Since then, Bugs has grown into a complex database of fossils records, habitat and distri- bution data, dating and climate reference data wrapped into an advanced software analysis package. At the time of writing, the database contains raw data and metadata for 1124 sites, and Russell Coope directly contributed to the analysis of over 154 (14%) of them, some 98790 identifications published in 231 publications. Such quantifications are infeasible without databases, and the analytical power of combining a database of modern and fossil insects with analysis tools is potentially immense for numerous areas of science ranging from conservation to Quaternary geology. BugsCEP, The Bugs Coleopteran Ecology Package, is the latest incarnation of the Bugs database project. Released in 2007, the database is continually added too and is available for free download from http:// www.bugscep.com. The software tools include quantitative habitat reconstruction and visualisation, correlation matrices, MCR climate reconstruction, searching by habitat and retrieving, among other things, a list of taxa known from the selected habitat types. It also provides a system for entering, storing and managing palaeoentomological data as well as a number of expert system like reporting facilities. Work is underway to create an online version of BugsCEP, implemented through the Strategic Envi- ronmental Archaeology Database (SEAD) project (http://www.sead.se). The aim is to provide more direct access to the latest data, a community orientated updating system, and integration with other proxy data. Eventually, the tools available in the offline BugsCEP will be duplicated and Bugs will be entirely in the web. This paper summarises aspects of the current scope, capabilities and applications of the BugsCEP database and software, with special reference to and quantifications of the contributions of Russell Coope to the field of palaeoentomology as represented in the database. The paper also serves to illustrate the potential for the use of BugsCEP in biographical studies, and discusses some of the issues relating to the use of large scale sources of quantitative data. All datasets used in this article are available through the current version of BugsCEP available at http:// www.bugscep.com. Ó 2014 Elsevier Ltd and INQUA. All rights reserved. 1. Introduction The Bugs database was initiated in the 1980s as a database of coleopteran fossil records and ecological information to be used as a tool in interpreting Quaternary entomological data (Sadler et al., 1992). It was used to collate data and information from disparate sources in the international entomological literature and analogue fossil insect datasets, reducing the need for extensive library searches when looking for information on the habitat of beetles found fossil. Perhaps most usefully, it provided a means to rapidly summarise the habitat information, bibliographic data and known fossil record of all taxa found at a site. Environmental in- terpretations and reconstructions could thus be more efficiently undertaken. From the very start the aim was to partner advanced database tools and interfaces with the database, rather than simply making data available, and later versions have continued to be developed in this spirit. Subsequently, the system has been through various revisions and improvements, with the latest version becoming an advanced E-mail addresses: [email protected], [email protected]. Contents lists available at ScienceDirect Quaternary International journal homepage: www.elsevier.com/locate/quaint 1040-6182/$ e see front matter Ó 2014 Elsevier Ltd and INQUA. All rights reserved. http://dx.doi.org/10.1016/j.quaint.2014.01.030 Quaternary International xxx (2014) 1e11 Please cite this article in press as: Buckland, P.I., The Bugs Coleopteran Ecology Package (BugsCEP) database: 1000 sites and half a million fossils later, Quaternary International (2014), http://dx.doi.org/10.1016/j.quaint.2014.01.030
Transcript
lable at ScienceDirect
Quaternary International xxx (2014) 1e11
Contents lists avai
Quaternary International
journal homepage: www.elsevier .com/locate/quaint
The Bugs Coleopteran Ecology Package (BugsCEP) database: 1000 sitesand half a million fossils later
Philip I. BucklandDepartment of Historical, Philosophical and Religious Studies, Environmental Archaeology Lab, Umeå University, Umeå SE-90187, Sweden
1040-6182/$ e see front matter � 2014 Elsevier Ltd ahttp://dx.doi.org/10.1016/j.quaint.2014.01.030
Please cite this article in press as: Buckland,later, Quaternary International (2014), http:
a b s t r a c t
The Bugs database project started in the late 1980s as what would now be considered a relatively simplesystem, albeit advanced for its time, linking fossil beetle species lists to modern habitat and distributioninformation. Since then, Bugs has grown into a complex database of fossils records, habitat and distri-bution data, dating and climate reference data wrapped into an advanced software analysis package. Atthe time of writing, the database contains raw data and metadata for 1124 sites, and Russell Coopedirectly contributed to the analysis of over 154 (14%) of them, some 98790 identifications published in231 publications. Such quantifications are infeasible without databases, and the analytical power ofcombining a database of modern and fossil insects with analysis tools is potentially immense fornumerous areas of science ranging from conservation to Quaternary geology.
BugsCEP, The Bugs Coleopteran Ecology Package, is the latest incarnation of the Bugs database project.Released in 2007, the database is continually added too and is available for free download from http://www.bugscep.com. The software tools include quantitative habitat reconstruction and visualisation,correlation matrices, MCR climate reconstruction, searching by habitat and retrieving, among otherthings, a list of taxa known from the selected habitat types. It also provides a system for entering, storingand managing palaeoentomological data as well as a number of expert system like reporting facilities.
Work is underway to create an online version of BugsCEP, implemented through the Strategic Envi-ronmental Archaeology Database (SEAD) project (http://www.sead.se). The aim is to provide more directaccess to the latest data, a community orientated updating system, and integrationwith other proxy data.Eventually, the tools available in the offline BugsCEP will be duplicated and Bugs will be entirely in theweb.
This paper summarises aspects of the current scope, capabilities and applications of the BugsCEPdatabase and software, with special reference to and quantifications of the contributions of Russell Coopeto the field of palaeoentomology as represented in the database. The paper also serves to illustrate thepotential for the use of BugsCEP in biographical studies, and discusses some of the issues relating to theuse of large scale sources of quantitative data.
All datasets used in this article are available through the current version of BugsCEP available at http://www.bugscep.com.
� 2014 Elsevier Ltd and INQUA. All rights reserved.
1. Introduction
The Bugs database was initiated in the 1980s as a database ofcoleopteran fossil records and ecological information to be used asa tool in interpreting Quaternary entomological data (Sadler et al.,1992). It was used to collate data and information from disparatesources in the international entomological literature and analoguefossil insect datasets, reducing the need for extensive library
P.I., The Bugs Coleopteran Eco//dx.doi.org/10.1016/j.quaint.2
searches when looking for information on the habitat of beetlesfound fossil. Perhaps most usefully, it provided a means to rapidlysummarise the habitat information, bibliographic data and knownfossil record of all taxa found at a site. Environmental in-terpretations and reconstructions could thus be more efficientlyundertaken. From the very start the aim was to partner advanceddatabase tools and interfaces with the database, rather than simplymaking data available, and later versions have continued to bedeveloped in this spirit.
Subsequently, the system has been through various revisionsand improvements, with the latest version becoming an advanced
logy Package (BugsCEP) database: 1000 sites and half a million fossils014.01.030
P.I. Buckland / Quaternary International xxx (2014) 1e112
software application for aiding studies in, to name but a few,Quaternary science, archaeology, ecology and conservation(Buckland and Buckland, 2006; Buckland, 2007). The database isalso extensively expanded, both in terms of scientific scope and theamount of data. The work of Russell Coope and colleagues hasdirectly contributed to a significant part of the data held in Bugs,and it could be argued that Russell is indirectly responsible foralmost the entirety of the rest of the data by way of his formerstudents and colleagues.
2. System origins, evolution and usage
The Bugs system began as a DBase4 database coupled withinterface software developed in Clipper (Sadler et al., 1992). Theevolution of Bugs from this version to the current one is describedby Buckland (2007), and the present iteration includes a consid-erable expansion in terms of scope and application.
Although originally designed as a tool for archaeology, palae-oecology and the Quaternary sciences, Bugs has potential applica-tions far beyond these fields. The full potential, especially withrespect to its use in modern ecology, biogeography and conserva-tion sciences, has yet to be realised, but the list of known publica-tions using or referring to the system indicates an expansionbeyond the initial target user group (Fig. 1). To this date, at least 100publications have acknowledged the use of Bugs or BugsCEP as asource of data, data repository or research tool since 1997 (seehttp://bugscep.com/publications.html). Of the 93 publications cit-ing the database and identified on the internet by the authors, 58%of them could be considered as being outside of the initial projectscope. (The authors would be most grateful for any additions to thislist, irrespective of whether the publication cites the database ornot).
The data in BugsCEP are being continually updated, and newsoftware and accessibility tools are under development within thescope of the SEAD (Strategic Environmental Archaeology Database)project (http://www.sead.se; Buckland, 2014; Buckland andEriksson, 2014; Buckland et al., 2010). The statistics and enumera-tions presented in this paper reflect the status of the Bugs databaseon the 17th June 2013.
3. Geographical, chronological and ecological scope, andRussell Coope’s contribution
A recent enumeration of records for the various data areas ofBugsCEP is available elsewhere (http://www.bugscep.com; Bucklandet al., 2014) and will not be repeated in full here. Similarly, a
Fig. 1. Simple classification of publications citing or using (either acknowledged orconsulted) the Bugs database 1997e2012. (Note that this list includes 28 publicationsco-authored by a member of the Bugs development team).
Please cite this article in press as: Buckland, P.I., The Bugs Coleopteran Ecolater, Quaternary International (2014), http://dx.doi.org/10.1016/j.quaint.2
bibliography of Russell Coope’s publications is available at http://www.bugscep.com/downloads/coope_bibliography_2013.pdf.Buckland (2007) presented an overview of the geographical andchronological extent of the Bugs database, which is updated here toreflect the expanded database, with an indication of the extent towhichCoope’swork is directly represented in thedatabase. Note thatthe figures cited here to an extent reflect the way in which data hasbeenentered into thedatabase, and that therewill inevitablybegaps,inparticularwith respect to the dating evidencewhich is often eitherdifficult to source or insufficiently detailed to relate to a particularsample. A number of unpublished sites and reports attached toobscure archaeological monographs are missing, and the compilerswould be happy to make these datasets publicly available throughthe database.
3.1. Geographical extent
At the time of writing, the database contains raw data andmetadata for 1135 sites, and Russell Coope directly contributed tothe analysis of over 154 (14%) of them (Fig. 2); several NorthAmerican sites and one on South Georgia (Coope, 1963) are notincluded. This represents some 98790 identifications published in231 papers, some of which are explored further below. ConnectingBugsCEP to GIS software or exporting query results for GIS use,increases the descriptive and analytical power of the databaseconsiderably, especially in terms of quantifying the spatial extent ofparticular aspects of the fossil record. Advanced queries may becreated in the Microsoft Access backend for linking data on moderndistribution and rarity with the geographical data in the fossil re-cord (Fig. 3). By examining the dating and spatial evidence forparticular species, it is possible to trace the movement of pests andsynanthropic species (e.g. Bain and King, 2011). The reference datain BugsCEP may also be used to model potential past and futurespeciesmovements with respect to climate change (e.g. Vickers andBuckland, in press).
In addition to studies of biogeography, GIS techniquesmaybe alsoapplied to biographical questions. For example, the geographicalmid-point of all sites on which Coope worked is latitude 52.7000,longitude �0.1224, just north of Whipchicken Road on the edge ofCrowland in Cambridgeshire, UK (https://maps.google.com/maps?q¼52.7000386079137,þ-0.122489305971223&hl¼en&sll¼52.700039,-0.122489&sspn¼0.019921,0.028281&doflg¼ptk&t¼m&z¼15).Themid-point for his British Isles sites is somewhatmore telling, justwest of Kegworth, some 60 km northeast of Birmingham (https://maps.google.com/maps?q¼52.8342843896639,þ-1.2955754602437andhl¼enandll¼52.955257,-1.175537andspn¼1.267479,1.809998andsll¼52.700938,-0.100937andsspn¼0.318725,0.452499andt¼mandz¼9). The spatial distribution of both modern and fossil insectcollection sitesmay tell usmore about where entomologists live andwork than itdoes about themodernor fossil record, and thepitfalls ofusing these incomplete and heavily biased data should always beconsidered when drawing conclusions on the past and present dis-tribution of species. It is only through the application of soundecological knowledge thatmeaningful inferences can be drawn fromsuch large amounts of data, however tempting large scale quantifi-cations, such as some of those presented in this paper, may be.
BugsCEP primarily contains data on the European fossil insectrecord, although it includes an increasingly large number of extra-European sites (ca. 100; see Buckland et al. 2014 for more details).The dominance of the British Isles data is clearly visible (Fig. 2;58% of sites), and would undoubtedly skew any large scale anal-ysis in the direction of the habitats favoured by the past andpresent fauna of these islands (see below). This bias would alsoinevitably lead to problems in geostatistical analyses, such assurface interpolation of environmental variables using kriging.
logy Package (BugsCEP) database: 1000 sites and half a million fossils014.01.030
Fig. 2. Geographical extent of Coope sites (þ) against a background of other European sites in BugsCEP (dots).
Fig. 3. Map showing the relative proportion of five habitats as represented at fossilsites by beetle species with Holocene records but now extinct in the UK. The under-lying data were extracted from BugsCEP using a set of queries connecting the fossilrecord to a list of extinct species compiled from red data book data and a manualassessment of distribution data in the database. The map was then produced in ESRI’sArcMap, and the list of species published as a section in the current Checklist of BritishBeetles (Duff 2012). Note the large proportion of sites where indicating the presence ofspecies requiring “Wood and tree” habitats, which have now become extinct, possiblyan indication of the loss of mid-Holocene woodland habitats, although the details ofindividual sites and species need further analysis.
P.I. Buckland / Quaternary International xxx (2014) 1e11 3
Please cite this article in press as: Buckland, P.I., The Bugs Coleopteran Ecolater, Quaternary International (2014), http://dx.doi.org/10.1016/j.quaint.2
Patterns at the small scale would inevitably be over representedas a result of the tight packing of sites in the UK, resulting in dataartefacts such as anomalous climate reconstructions, in the areaswhere sites are sparse, such as northern Scandinavia or even theNorth Sea. The centre of gravity for all sites in the database is40 km off the eastern coast of East Anglia, a point which shifts tothe north of Germany with removal of the British sites. Fossilinsect databases are under development for at least NorthAmerican (Grimm et al., 2013), Russian (Sher et al., 2005) andJapanese (e.g. Shiyake, 2013) faunas, and the integration of in-ternational datasets should be considered a priority goal. Not onlyfor increasing the data sharing and re-use capacity of insect an-alyses, but also in providing a broader ecological and climatic basefor analyses.
3.2. Chronological extent
By necessity of the disparate nature of the data sources behindthe fossil insect record, dating evidence is varied in its form, ac-curacy and reliability. To cater for this, and to provide the capacityfor storing data as recorded in a variety of sources, BugsCEP em-ploys three categories for the storage of dates: 1) radiometric,including anything relying on a decay curve (Fig. 4; e.g. 14C, AAR, U-series); 2) period dates, where only broad determination of asample to cultural, vegetation or geological period has beenpossible (Fig. 5; e.g. oxygen isotope stages, Blytt and Sernandervegetation zones, archaeological periods); and 3) calendar,including anything dated to a specific year or range of calendaryears (Fig. 6; e.g. coin or other artefact-based dates, historicalevents, dendrochronology). Whilst every effort has been made toensure the reliability of these dates, there are inevitably a largenumber of omissions and generalisations, much of which derivesfrom the inconsistent reporting of dates in publications. As aconsequence, the broad period dates have been used to patch holesand make the datasets more generally useful for looking at thewider chronological aspects of species distributions.
logy Package (BugsCEP) database: 1000 sites and half a million fossils014.01.030
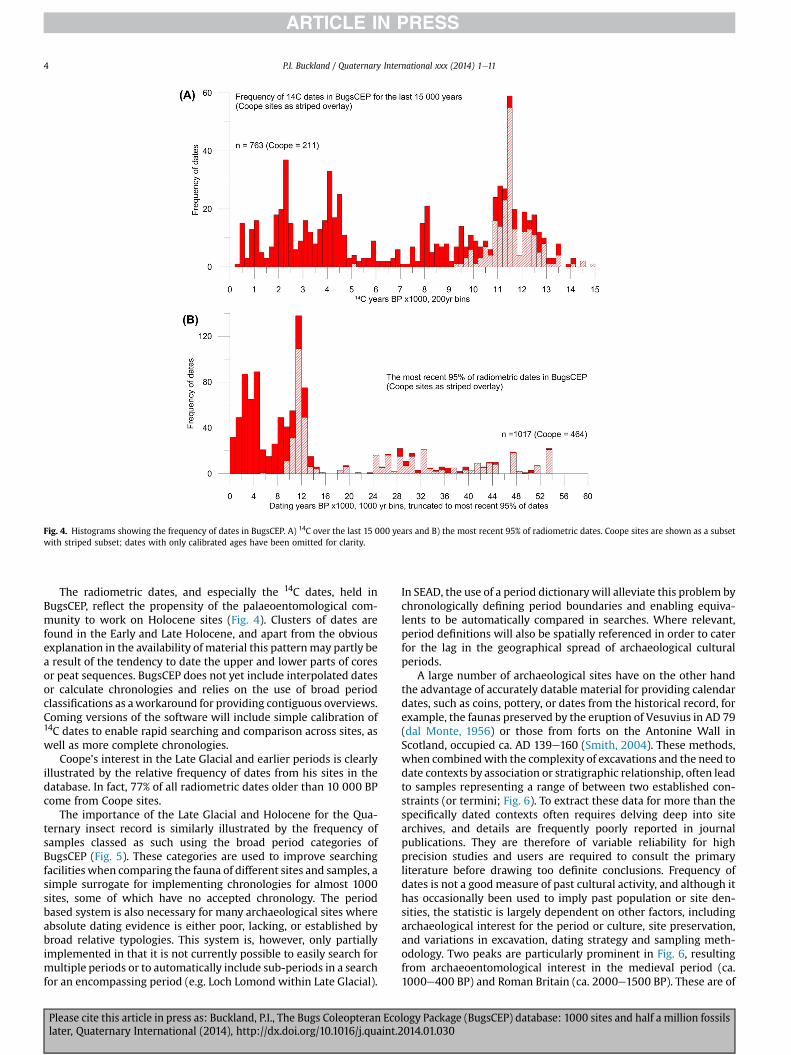
Fig. 4. Histograms showing the frequency of dates in BugsCEP. A) 14C over the last 15 000 years and B) the most recent 95% of radiometric dates. Coope sites are shown as a subsetwith striped subset; dates with only calibrated ages have been omitted for clarity.
P.I. Buckland / Quaternary International xxx (2014) 1e114
The radiometric dates, and especially the 14C dates, held inBugsCEP, reflect the propensity of the palaeoentomological com-munity to work on Holocene sites (Fig. 4). Clusters of dates arefound in the Early and Late Holocene, and apart from the obviousexplanation in the availability of material this patternmay partly bea result of the tendency to date the upper and lower parts of coresor peat sequences. BugsCEP does not yet include interpolated datesor calculate chronologies and relies on the use of broad periodclassifications as aworkaround for providing contiguous overviews.Coming versions of the software will include simple calibration of14C dates to enable rapid searching and comparison across sites, aswell as more complete chronologies.
Coope’s interest in the Late Glacial and earlier periods is clearlyillustrated by the relative frequency of dates from his sites in thedatabase. In fact, 77% of all radiometric dates older than 10 000 BPcome from Coope sites.
The importance of the Late Glacial and Holocene for the Qua-ternary insect record is similarly illustrated by the frequency ofsamples classed as such using the broad period categories ofBugsCEP (Fig. 5). These categories are used to improve searchingfacilities when comparing the fauna of different sites and samples, asimple surrogate for implementing chronologies for almost 1000sites, some of which have no accepted chronology. The periodbased system is also necessary for many archaeological sites whereabsolute dating evidence is either poor, lacking, or established bybroad relative typologies. This system is, however, only partiallyimplemented in that it is not currently possible to easily search formultiple periods or to automatically include sub-periods in a searchfor an encompassing period (e.g. Loch Lomond within Late Glacial).
Please cite this article in press as: Buckland, P.I., The Bugs Coleopteran Ecolater, Quaternary International (2014), http://dx.doi.org/10.1016/j.quaint.2
In SEAD, the use of a period dictionary will alleviate this problem bychronologically defining period boundaries and enabling equiva-lents to be automatically compared in searches. Where relevant,period definitions will also be spatially referenced in order to caterfor the lag in the geographical spread of archaeological culturalperiods.
A large number of archaeological sites have on the other handthe advantage of accurately datable material for providing calendardates, such as coins, pottery, or dates from the historical record, forexample, the faunas preserved by the eruption of Vesuvius in AD 79(dal Monte, 1956) or those from forts on the Antonine Wall inScotland, occupied ca. AD 139e160 (Smith, 2004). These methods,when combinedwith the complexity of excavations and the need todate contexts by association or stratigraphic relationship, often leadto samples representing a range of between two established con-straints (or termini; Fig. 6). To extract these data for more than thespecifically dated contexts often requires delving deep into sitearchives, and details are frequently poorly reported in journalpublications. They are therefore of variable reliability for highprecision studies and users are required to consult the primaryliterature before drawing too definite conclusions. Frequency ofdates is not a good measure of past cultural activity, and although ithas occasionally been used to imply past population or site den-sities, the statistic is largely dependent on other factors, includingarchaeological interest for the period or culture, site preservation,and variations in excavation, dating strategy and sampling meth-odology. Two peaks are particularly prominent in Fig. 6, resultingfrom archaeoentomological interest in the medieval period (ca.1000e400 BP) and Roman Britain (ca. 2000e1500 BP). These are of
logy Package (BugsCEP) database: 1000 sites and half a million fossils014.01.030
Fig. 5. Bar chart showing number of samples classed as belonging to each chronological, cultural or historical period. Note that these periods need revision and more thoroughlydefining chronologically and geographically in order to provide a reliable source for biogeography studies. Samples from Coope sites are shown as a striped subset.
P.I. Buckland / Quaternary International xxx (2014) 1e11 5
course not only popular periods for research, but benefit fromabundant datable material and to an extent corroboration historicalrecords.
4. Analysis tools
Whilst a relational database allowing comparisons between theQuaternary fossil record and modern habitat and distributional
Fig. 6. Histogram showing frequency of calendar date termini (from, to) by age BP (present ¼between dating termini.
Please cite this article in press as: Buckland, P.I., The Bugs Coleopteran Ecolater, Quaternary International (2014), http://dx.doi.org/10.1016/j.quaint.2
data has considerable value, it is further enhanced by the additionof tools for data analysis. Simple data features such as synonymy,species associations and some keys, part of an uncompleted projectby the late Peter Skidmore, who incidentally also provided theillustration for the software’s front page, with additional commentson identification, and size range of species extend the work into adesk-based system to assist in basic laboratory work. The whole issupported by an extensive bibliography of over 5000 references.
1950 for comparative purposes). The inset shows the same data but plotted as ranges
logy Package (BugsCEP) database: 1000 sites and half a million fossils014.01.030
P.I. Buckland / Quaternary International xxx (2014) 1e116
Whilst Coope had a seemingly unerring ability to retrodictcontemporary climate from a fossil insect assemblage, it was theneed to place numerical parameters around such apparently ac-curate inferences that lead to the development of MCR, mutualclimatic range. Initially devised by Atkinson, Briffa and Coope(1986) and expanded by Joachim and Perry (Atkinson et al., 1986,1987), the module has now been re-written and incorporatedwithin BugsCEP (Buckland, 2007).
4.1. Climate reconstruction
Essentially, MCR (Mutual Climatic Range) uses geographicdistribution to define the climate space occupied by species interms of two defining parameters, mean summer temperatures,and annual temperature range, the latter effectively a measure ofcontinentality. These are quantified from modern and historicalcollection data into species envelopes in terms of TMax, meantemperature of the warmest month and TRange, the differencebetween TMax and TMin, mean temperature of the coldestmonth. TRange may also be considered an index of con-tinentality. Individual species’ climate envelopes are then over-lain to define an area of mutual climate range, although notnecessarily co-occurrence, for the species found in a sample.Currently data only include the original envelopes for carabids,staphylinids, scarabaeids and a few other groups painstakinglyput together and digitised by Joachim and Perry in the dayswhen Fortran was the only language capable of dealing with thenumerics involved, and there is a desperate need to update thebasic information, utilising a more advanced GIS and primaryspecimen data. As national databases of modern distributionhave become more readily available (e.g. Luff, 1998; Cox, 2007for UK examples; Artdatabanken, 2013 for Sweden), this taskhas become more easily accomplished both in terms of refiningenvelopes and expanding to other groups not only of Coleopterabut also other frequent insect fossils such as the Formicidae,ants. The development of international, point source databasesystems for collection and museum data, such as the GlobalBiodiversity Information Facility (GBIF, 2013), although as yetunreliable for the task (see e.g. Buckland and Eriksson, 2014),should also make the future construction of envelopes easier.Despite the limitations imposed by reliance upon often poorprimary data, MCR has been routinely applied to Pleistoceneassemblages for over twenty years, and its basic Lyellian phi-losophy has attracted Quaternary scientists working with othergroups, including plant macrofossils (Pross et al., 2000;Thompson et al., 2012), terrestrial mollusca (Moine et al., 2002)and ostracoda (Horne, 2007). In addition, it has been applied toassemblages in other geographical regions, including Beringia(Alfimov and Berman, 2009) and Japan (Shiyake, 2013). Theapplication of the method, however, has often had problemswhich are difficult to overcome, relating more to contexttaphonomy and minimum species diversity per sample thandistributional data. The stochastic nature of sampling means thatthe same context may provide either a broad date range from asingle relatively eurythermal species or a narrow one from astenotherm. These problems are, however, common to allquantitative reconstruction methods, and are reduced by dataand method transparency. For this reason, BugsCEP displays thespecies and envelopes being utilised for the MCR reconstruction,and does not apply the now questioned calibration techniqueused to derive mean temperatures in earlier studies (seeBuckland, 2007; Elias, 2010).
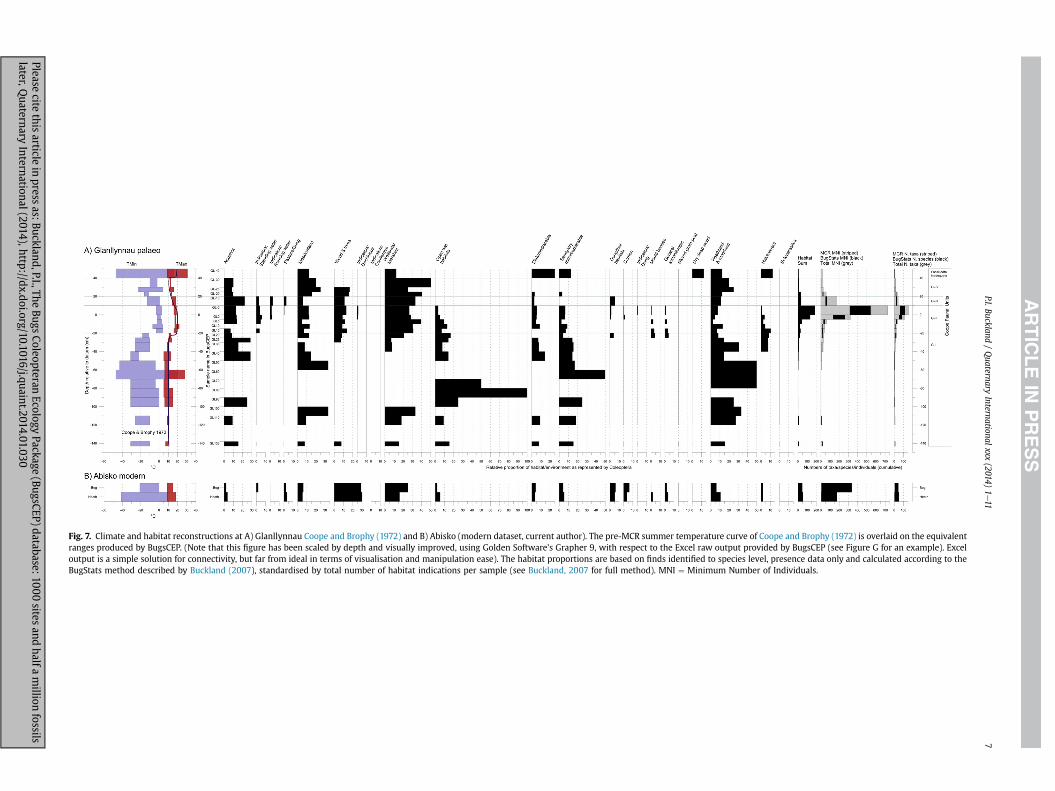
Standardisation of sample size across a varying sequence ofsediments may appear statistically sound, but may be of little realvalue (see below). In the case of open exposures, as in Coope and
Please cite this article in press as: Buckland, P.I., The Bugs Coleopteran Ecolater, Quaternary International (2014), http://dx.doi.org/10.1016/j.quaint.2
Brophy’s (1972) Glanlynnau work, long before the days of MCR,the answer was to go back and get more material, thereby creatinga more useful reconstruction both in terms of climate and envi-ronment (Fig. 7). The resultant summer temperature curve, drawnby Coope as a guestimate mid-line is remarkably similar to thatobtained by MCR and both emphasise the step-like nature of thetransition from cool (July average w11 �C) to warm (w17 �C)summers, something which involved him and co-workers inseemingly endless disagreements, particularly with palynologists,until similar evidence for rapid transitions emerged from theGreenland ice cores some twenty years later (cf. Alley et al., 1993).BugsCEP allows the generation of similar MCR diagrams in a matterof seconds, and Fig. 8, utilising Osborne’s (1980) West Bromwichsequence, shows the similar abrupt transition into the Holocene inits raw, unscaled, output formwith jackknife limits added from theadvanced output.
Whilst MCR is ideal for the broad brush treatment of glacial,interglacial, stadial interstadial climate, it currently lacks thedetail to apply to examine later Holocene climate change, wherehuman impact becomes increasingly the dominant factor, andmore reliable envelopes are required for a broader range ofspecies. Robinson (2013) has recently argued for a short periodof significantly warmer summers during the Bronze Age on thebasis of dung faunas from sites in southern England. MCR onsites such as Stanwick in Northamptonshire (Robinson, 2013)and Wilsford in Wiltshire (Osborne, 1989) would appear tosupport this, although there are still too few dated sites todifferentiate effectively between human impact and climatechange. In the case of the dung fauna, the ploughing up of oldgrassland and more recently the use of ‘biocides’ on domesticstock has significantly altered the fauna to the extent that reli-able habitat data for some species relies heavily on olderrecords.
Climate reconstruction methods can often be turned their headsto model potential biogeographic impacts of future, or past climatescenarios. BugsCEP provides simple tools for listing the specieswhich would be able to survive in any given temperature range, orwhich species could theoretically co-exist in the same climate givenunlimited migration possibilities. Again, the limits here are thequality and extent of the calibration data, with only 436 species inthe MCR calibration dataset. It is however, possible to do areasonable amount of modelling on this basis, albeit with a degreeof back-end hacking, and the system lends itself well to, forexample, evaluating existing theories on island biogeography andspecies survival over varying climate periods (e.g. Vickers andBuckland, in press).
4.2. Habitat data, reconstruction, comparing and standardisingacross samples
A notorious problem in ecology and palaeoecology alike is theestablishment of a frame of reference for comparing samples ofdifferent size (volume, weight, spatial and chronological extent),collected using different methods (bulk samples, stratigraphicsampling, cores, pitfall traps), from different depositional envi-ronments (lakes, bogs, archaeological sites) and representingdifferent environments with differing population structures andsedimentation rates. These differences are accompanied bydifferent of sampling and taphonomic problems which must beaccounted for, or at least considered, when interpreting theenvironmental implications of the fossil insect fauna. Raw mini-mum numbers of individuals (MNI) most often tells us moreabout the nature of the samples themselves than the environ-ments from which their fossils originated. These problems havebeen discussed with respect to palaeoentomology and
logy Package (BugsCEP) database: 1000 sites and half a million fossils014.01.030
Fig. 7. Climate and habitat reconstructions at A) Glanllynnau Coope and Brophy (1972) and B) Abisko (modern dataset, current author). The pre-MCR summer temperature curve of Coope and Brophy (1972) is overlaid on the equivalentranges produced by BugsCEP. (Note that this figure has been scaled by depth and visually improved, using Golden Software’s Grapher 9, with respect to the Excel raw output provided by BugsCEP (see Figure G for an example). Exceloutput is a simple solution for connectivity, but far from ideal in terms of visualisation and manipulation ease). The habitat proportions are based on finds identified to species level, presence data only and calculated according to theBugStats method described by Buckland (2007), standardised by total number of habitat indications per sample (see Buckland, 2007 for full method). MNI ¼ Minimum Number of Individuals.
Fig. 8. BugsMCR diagrams for the West Bromwich sequence (Osborne, 1980), dated to between 12 195 � 160 (Sample A) and 9080 � 455 (Sample M) 14C BP. The black floating boxeswith whiskers show the area of maximum overlap (box) and extreme extent resulting from removing any one species from the MCR calculations (whiskers). The rapid shift insummer temperatures is seen between samples E and F. The pale floating boxes indicate MCR ranges derived from less than three species and without jackknife calculations. Thenumber of species used in the MCR calculations is shown by the wide bars on the TMax graph.
P.I. Buckland / Quaternary International xxx (2014) 1e118
archaeoentomology by several authors (e.g. Carrot and Kenward,2001; Buckland, 2007) and a number of approaches proposed todeal with them. BugsCEP provides tools for aiding the compari-son of samples, both in terms of species numbers and the envi-ronmental implications of the species found at any site. It doesnot, however, provide the facility to standardise by sampleweight or volume, but instead focusses on the numbers of taxa,individuals and habitat statistics (see Buckland, 2007 for fullmethod description).
Fig. 7 shows habitats standardised by the total count of habitatindications for each sample. This reduces the effects of varyingnumbers of species and/or individuals between samples, which inthe case of highly variable sites, like Glanllynnau, would over-power any environmental signals in the data, and tend tomirror the observation data (observe the form of the MNI diagramin Fig. 7). In this example, only numbers of species are used,essentially illustrating the environmental implications of thespecies present in each sample. The software can also be set toinclude abundance data in the calculations, in order to examinethe importance of varying numbers of individuals between sam-ples and habitats, or compare samples containing comparablenumbers of individuals. Higher level taxa (e.g. Aphodius sp.) mayalso be included to generalise the reconstruction, a useful facilityfor sites with poor preservation and where only a broad envi-ronmental description is required. The system can be used to lookat fossil and modern assemblages alike, as suggested by the in-clusion of the Abisko reconstruction at the bottom of Fig. 7, andthus provides a mechanism for the quantitative comparison ofthese fauna. Interestingly, the modern Abisko fauna gives aclimate reconstruction similar to the colder parts of the Glanl-lynnau sequence, as expected, but Abisko’s dwarf shrub/wetlandenvironment appears more to be more similar to the warmerparts (the data for the “Abisko modern” reconstruction areavailable in BugsCEP.
The environmental reconstruction function is provided as aninvestigative tool, not a system for producing answers, in palae-oenvironmental reconstruction. It allows users to reduce the
Please cite this article in press as: Buckland, P.I., The Bugs Coleopteran Ecolater, Quaternary International (2014), http://dx.doi.org/10.1016/j.quaint.2
sensitivity of their reconstructions to variations in species numberscaused by variations in sample size, preservation or populationrichness. The system of database coupled habitat codes (ecocodes)and standardisation methods (BugStats) is also designed to allowsamples to be compared between sites irrespective of author, andthus allows for more objective inter-site overviews than are easilyachievable when comparing texts. It should not be forgotten,however, that variation in the number of fossils per unit samplevolume is a product of complex environmental, biological andtaphonomic processes which we should attempt to understand interms of habitat, sedimentology and sampling when reconstructingthe past.
4.3. Exploring data and the variable representation of environments
Databases provide unique possibilities for exploring andquantifying variability in the empirical evidence behind palae-oenvironmental reconstructions. The under-representation of in-sect species in the fossil record is perhaps illustrated by the factthat of the 10,546 taxa for which the database holds referencedata, only 4418 have a published fossil record (Table 1; assumingat least a 90% coverage of the published Quaternary fossil recordfor Europe). Such summary numbers are, however, potentiallydeceptive as the selection of reference taxa is often a function ofthe data entry strategy for the database, some hidden implica-tions of which are discussed below. Although a little used facility,the database may also be used to quantify information from abibliographic perspective, as Table 1 illustrates for the datacontribution of Coope. This line of enquiry could potentially becombined with the above overview of dating and geographicalevidence (Figures C, D and E), as well as citation records, forcompiling research histories, looking at trends in the interests andfoci of individuals over their careers and the re-use and persis-tence of data, something which is particularly evident in thehabitat data for the rarer species, where the only captures in acountry may have been made over a century ago and the primarydata are reiterated by later authors.
logy Package (BugsCEP) database: 1000 sites and half a million fossils014.01.030
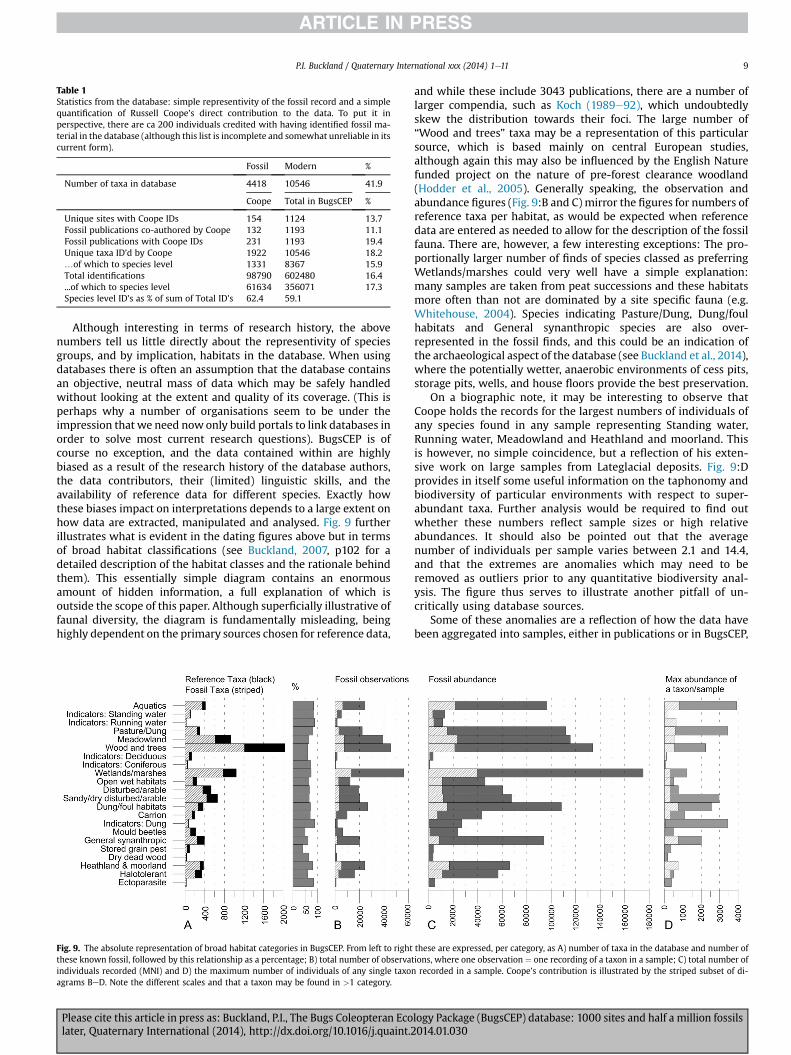
Table 1Statistics from the database: simple representivity of the fossil record and a simplequantification of Russell Coope’s direct contribution to the data. To put it inperspective, there are ca 200 individuals credited with having identified fossil ma-terial in the database (although this list is incomplete and somewhat unreliable in itscurrent form).
Fossil Modern %
Number of taxa in database 4418 10546 41.9
Coope Total in BugsCEP %
Unique sites with Coope IDs 154 1124 13.7Fossil publications co-authored by Coope 132 1193 11.1Fossil publications with Coope IDs 231 1193 19.4Unique taxa ID’d by Coope 1922 10546 18.2.of which to species level 1331 8367 15.9Total identifications 98790 602480 16.4...of which to species level 61634 356071 17.3Species level ID’s as % of sum of Total ID’s 62.4 59.1
P.I. Buckland / Quaternary International xxx (2014) 1e11 9
Although interesting in terms of research history, the abovenumbers tell us little directly about the representivity of speciesgroups, and by implication, habitats in the database. When usingdatabases there is often an assumption that the database containsan objective, neutral mass of data which may be safely handledwithout looking at the extent and quality of its coverage. (This isperhaps why a number of organisations seem to be under theimpression that we need nowonly build portals to link databases inorder to solve most current research questions). BugsCEP is ofcourse no exception, and the data contained within are highlybiased as a result of the research history of the database authors,the data contributors, their (limited) linguistic skills, and theavailability of reference data for different species. Exactly howthese biases impact on interpretations depends to a large extent onhow data are extracted, manipulated and analysed. Fig. 9 furtherillustrates what is evident in the dating figures above but in termsof broad habitat classifications (see Buckland, 2007, p102 for adetailed description of the habitat classes and the rationale behindthem). This essentially simple diagram contains an enormousamount of hidden information, a full explanation of which isoutside the scope of this paper. Although superficially illustrative offaunal diversity, the diagram is fundamentally misleading, beinghighly dependent on the primary sources chosen for reference data,
Fig. 9. The absolute representation of broad habitat categories in BugsCEP. From left to rightthese known fossil, followed by this relationship as a percentage; B) total number of observaindividuals recorded (MNI) and D) the maximum number of individuals of any single taxoagrams BeD. Note the different scales and that a taxon may be found in >1 category.
Please cite this article in press as: Buckland, P.I., The Bugs Coleopteran Ecolater, Quaternary International (2014), http://dx.doi.org/10.1016/j.quaint.2
and while these include 3043 publications, there are a number oflarger compendia, such as Koch (1989e92), which undoubtedlyskew the distribution towards their foci. The large number of“Wood and trees” taxa may be a representation of this particularsource, which is based mainly on central European studies,although again this may also be influenced by the English Naturefunded project on the nature of pre-forest clearance woodland(Hodder et al., 2005). Generally speaking, the observation andabundance figures (Fig. 9:B and C) mirror the figures for numbers ofreference taxa per habitat, as would be expected when referencedata are entered as needed to allow for the description of the fossilfauna. There are, however, a few interesting exceptions: The pro-portionally larger number of finds of species classed as preferringWetlands/marshes could very well have a simple explanation:many samples are taken from peat successions and these habitatsmore often than not are dominated by a site specific fauna (e.g.Whitehouse, 2004). Species indicating Pasture/Dung, Dung/foulhabitats and General synanthropic species are also over-represented in the fossil finds, and this could be an indication ofthe archaeological aspect of the database (see Buckland et al., 2014),where the potentially wetter, anaerobic environments of cess pits,storage pits, wells, and house floors provide the best preservation.
On a biographic note, it may be interesting to observe thatCoope holds the records for the largest numbers of individuals ofany species found in any sample representing Standing water,Running water, Meadowland and Heathland and moorland. Thisis however, no simple coincidence, but a reflection of his exten-sive work on large samples from Lateglacial deposits. Fig. 9:Dprovides in itself some useful information on the taphonomy andbiodiversity of particular environments with respect to super-abundant taxa. Further analysis would be required to find outwhether these numbers reflect sample sizes or high relativeabundances. It should also be pointed out that the averagenumber of individuals per sample varies between 2.1 and 14.4,and that the extremes are anomalies which may need to beremoved as outliers prior to any quantitative biodiversity anal-ysis. The figure thus serves to illustrate another pitfall of un-critically using database sources.
Some of these anomalies are a reflection of how the data havebeen aggregated into samples, either in publications or in BugsCEP,
these are expressed, per category, as A) number of taxa in the database and number oftions, where one observation ¼ one recording of a taxon in a sample; C) total number ofn recorded in a sample. Coope’s contribution is illustrated by the striped subset of di-
logy Package (BugsCEP) database: 1000 sites and half a million fossils014.01.030
P.I. Buckland / Quaternary International xxx (2014) 1e1110
pending full quantification or in absence of a full list of taxa persample. The Lateglacial assemblage from Lobsigensee (Elias andWilkinson, 1983), for example, produced almost 4000 unresolv-able specimens of the aquatic genus Ochthebius. Examination of thesample metadata shows, however, that the data from this site arenumber of individuals per faunal unit, and not per physical sample.This number is topped only by the 8351 pupae of the (non-BugsEcoCode classified) fly Trachyopella coprina (Duda) identified by thelate Peter Skidmore from an Anglo-Scandinavian ditch at Tuquoy inScotland (Skidmore, 1996). Aggregated data fromWabmer’s (1995)survey of modern pasture habitats also provides large peaks for theseveral dung related categories. In these cases it is perhaps thepresence of particular species and the relative frequency of taxawithin the site that are of most use to the palaeoentomologist,although the database needs many more quantified modern as-semblages entering to allow effective comparison with fossil data.Robinson’s (2013) recent work with the scarabaeid dung fauna,whilst not utilising BugsCEP, points in the right direction.
The BugsCEP software provides a variety of tools for searchingalmost any aspect of the database, including the ecology, rarity,distribution and temperature range components of the modernreference data. It also allows the user to explore the details of anyBugStats based reconstruction, in both spreadsheet and reportforms, in the spirit of total research transparency. Such facilities notonly provide for powerful exploratory data analysis, but also in-crease the range of potential users beyond those interested in in-sects and at least into the realms of climate science, biodiversityand conservation studies. The ability to easily connect any of theseresults with data from the fossil record is an extremely powerfultool for helping to understand the origins of the modern landscapefrom any number of angles.
5. Current developments and multiproxy analyses
In terms of software, although not data entry, the BugsCEPsystem is currently in limbo awaiting transfer to the StrategicEnvironmental Archaeology Database (SEAD; http://www.sead.se;e.g. Buckland, 2014). The data are being ported over at the time ofwriting and soon will be available online. Having been written fornow obsolete versions of both Microsoft Office and Windows,BugsCEP is becoming increasingly difficult to run on new com-puters, and the authors have little time available for the continualmaintenance required to fix problems caused by endless Windowsupdates. The system is a complex patchwork of program modulestotalling approximately 70 000 lines of code, and it will inevitablytake some time before the full functionality is realised on a webbased platform. For this reason BugsCEP will be supported for aslong as possible in parallel with SEAD.
Moving Bugs onto the web provides scope for a number ofsubstantial improvements in terms of data entry, accessibility andlinking with other datasets (see Buckland, 2014; Buckland andEriksson, 2014). Projects are underway in Sweden as part of SEADto connect the insect data, and in particular the results of envi-ronmental reconstructions, to spatially referenced cultural heritagedata. The long term plan with this is to provide a systemwhich willbe able to provide online graphical landscape reconstructions,based on real data, for areas around national monuments. Inaddition to insect data, SEAD will provide data on plant macro-fossils, pollen, geochemistry, dendrochronology and ceramics toallow for a more comprehensive reconstruction of past cultural andnatural environments. There are any number of hurdles to cross onthe way to fulfilling this vision, not least the collection and digiti-sation of more empirical data e the keystone of all science. TheBugs database is also scheduled for mirroring in the internationalNeotoma database (http://www.neotomadb.org; Grimm et al.,
Please cite this article in press as: Buckland, P.I., The Bugs Coleopteran Ecolater, Quaternary International (2014), http://dx.doi.org/10.1016/j.quaint.2
2013), a move which will greatly enhance the capacity for multi-proxy and international syntheses.
6. Conclusions
BugsCEP has come a long way since its humble, yet ground-breaking origins, and is scheduled for even greater things. The in-clusion of tools for faunal and environmental analysis has greatlyimproved its applicability to areas of science far beyond theinherently multidisciplinary fields of Quaternary entomology andarchaeoentomology. Although powerful both in terms of the largemass of aggregated data, which allows for large scale spatial andchronological analyses, and in terms of integrating modern andfossil data, the database and software should only be used in thecontext of a detailed knowledge of insect ecology if reliable con-clusions are to be drawn through its use.
Acknowledgements
Like all long term projects, BugsCEP builds on its humble pre-cursors, devised initially by Jon Sadler and Mike Rains. Paul Buck-land has been responsible for suggesting numerous features,without which the system would be little more than an archive, aswell as entering the bulk of the data. Data entry is an underap-preciated and often massively under-budgeted component of anydatabase project, and it is only as a result of Paul’s decades oftireless work that the database has been sustained. Corrections andadditions to the contents of database should be directed to Paul. Asdemonstrated in this article, Russell Coope is responsible for thecreation of the largest subset of these data. Through a more com-plex process, involving genetics and undoubtedly cats, he is alsoindirectly responsible for turning a young programmer into a youngpalaeoentomologist and thus the current form of the software.Finally, a database is nothing without its data contributors, who areindividually acknowledged through their records in the database’sbibliography.
References
Alfimov, A.V., Berman, D.I., 2009. Possible errors of the Mutual Climatic Range(MCR) method in reconstructing the Pleistocene climate of Beringia. Entomo-logical Review 89 (4), 487e499.
Alley, R.B., Meese, D.A., Shuman, C.A., Gow, A.J., Taylor, K.C., Grootes, P.M.,White, J.W.C., Ram, M., Waddington, E.D., Mayewski, P., Zielinski, G.A., 1993.Abrupt increase in the Greenland snow accumulation at the end of the YoungerDryas event. Nature 362, 527e529.
Artdatabanken, 2013. The Swedish Species Information Centre. URL: http://www.slu.se/en/collaborative-centres-and-projects/artdatabanken/species/(last accessed 08.07.13.).
Atkinson, T.C., Briffa, K.R., Coope, G.R., Joachim, M.J., Perry, D.W., 1986. Climaticcalibration of coleopteran data. In: Berglund, B.E. (Ed.), Handbook of HolocenePalaeoecology and Palaeohydrology. John Wiley and Sons Ltd, London, pp. 851e858.
Atkinson, T.C., Briffa, K.R., Coope, G.R., 1987. Seasonal temperatures in Britain duringthe past 22,000 years reconstructed using beetle remains. Nature 325, 587e592.
Bain, A., King, G., 2011. Asylum for Wayward immigrants: historic ports and colonialsettlements in Northeast North America. Journal of the North Atlantic 1, 109e124.
Buckland, P.I., 2007. The Development and Implementation of Software for Palae-oenvironmental and Palaeoclimatological Research: the Bugs ColeopteranEcology Package (BugsCEP) (PhD thesis). In: Archaeology and Environment, vol.23. Environmental Archaeology Lab. Department of Archaeology and SámiStudies. University of Umeå, Sweden. URL: http://urn.kb.se/resolve?urn¼urn:nbn:se:umu:diva-1105.
Buckland, P.I., 2014. SEAD - The Strategic Environmental Archaeology Database.Inter-linking multiproxy environmental data with archaeological investigationsand ecology. In: Earl, G., Sly, T., Chrysanthi, A., Murrieta-Flores, P.,Papadopoulos, C., Romanowska, I., Wheatley, D. (Eds.), CAA2012, Proceedings ofthe 40th Annual Conference of Computer Applications and QuantitativeMethods in Archaeology (CAA). Southampton, England. Amsterdam.
Buckland, P.I., Buckland, P.C., 2006. BugsCEP Coleopteran Ecology Package. In: IGBPPAGES/World Data Center for Paleoclimatology Data Contribution Series #
logy Package (BugsCEP) database: 1000 sites and half a million fossils014.01.030
Buckland, P.I., Eriksson, E.J., Linderholm, J., Viklund, K., Engelmark, R., Palm, F.,Svensson, P., Buckland, P.C., Panagiotakopulu, E., Olofsson, J., 2010. Integratinghuman dimensions of Arctic palaeoenvironmental Science: SEAD e the stra-tegic environmental archaeology database. Journal of Archaeological Science38, 345e351.
Carrot, J., Kenward, H., 2001. Species, associations among insect remains from urbanarchaeological deposits and their significance in reconstructing the past humanenvironment. Journal of Archaeological Science 28, 887e905.
Coope, G.R., 1963. The occurrence of the beetle Hydromedion sparsutum (Müll.) in apeat profile from Jason Island, South Georgia. British Antarctic Survey Bulletin 1,25e26.
Coope, G.R., Brophy, J.A., 1972. Late Glacial environmental changes indicated by acoleopteran succession from North Wales. Boreas 1, 97e142.
Cox, M.L., 2007. Atlas of the Seed and Leaf Beetles of Britain and Ireland(Coleoptera: Bruchidae, Chrysomelidae, Megalopodidae and Orsodacnidae.Pisces, Newbury.
dal Monte, G., 1956. La presenza di insetti dei granai in frumento trovato neg1i scavidi Ercolano. Redia 41, 23e28.
Duff, A. (Ed.), 2012. Checklist of beetles of the British Isles.Elias, S.A., 2010. Advances in Quaternary Entomology. In: Developments in Qua-
gensee (Swiss Plateau). Studies in the Late Quaternary of Lobsigensee 3. Revuede Paléobiologie 2, 189e204.
GBIF, 2013. The Global Biodiversity Information Facility. URL: http://www.gbif.org/(last accessed 08.07.13.).
Grimm, E.C., Bradshaw, R.H.W., Brewer, S., Flantua, S., Giesecke, T., Lézine, A.-M.,Takahara, H., Williams, J.W., 2013. Databases and their application. In: Elias, S.A.(Ed.), The Encyclopedia of Quaternary Science, vol. 3. Elsevier, Amsterdam,pp. 831e838.
Hodder, K.H., Bullock, J.M., Buckland, P.C., Kirby, K.J., 2005. Large Herbivores in theWildwood and Modern Naturalistic Grazing Systems. English Nature,Peterborough.
Horne, D.J., 2007. A Mutual Temperature Range method for Quaternary palae-oclimatic analysis using European nonmarine Ostracoda. Quaternary ScienceReview 26 (9e10), 1398e1415.
Please cite this article in press as: Buckland, P.I., The Bugs Coleopteran Ecolater, Quaternary International (2014), http://dx.doi.org/10.1016/j.quaint.2
Koch, K., 1989-92. Ökologie IeIII. Die Käfer Mitteleuropas. Goecke and Evers,Krefeld.
Luff, M.L., 1998. Provisional Atlas of the Ground Beetles (Coleoptera, Carabidae) ofBritain. Centre for Ecology and Hydrology, Monks Wood.
Moine, O., Rousseau, D.-D., Jolly, D., Vianey-Liaud, M., 2002. Paleoclimate recon-struction using Mutual Climatic Range on terrestrial mollusks. QuaternaryResearch 57, 162e172.
Osborne, P.J., 1980. The Late Devensian Flandrian transition depicted by serial insectfaunas from West Bromwich, England. Boreas 9, 139e147.
Osborne, P.J., 1989. Insects. In: Ashbee, P., Bell, M., Proudfoot, E. (Eds.), WilsfordShaft Excavations 1960e62. English Heritage, London, pp. 96e99.
Pross, J., Klotz, S., Mosbrugger, V., 2000. Reconstructing palaeotempertures for theEarly and Middle Pleistocene using the mutual climatic range method based onplant fossils. Quaternary Science Reviews 19, 1785e1799.
Robinson, M., 2013. The relative abundance of Onthophagus species in British as-semblages of dung beetles as evidence of climate change. EnvironmentalArchaeology 18, 132e142.
Sadler, J.P., Buckland, P.C., Rains, M., 1992. BUGS: an entomological database. An-tenna 16, 158e166.
Sher, A.V., Kuzmina, S.A., Kuznetsova, T.V., Sulerzhitsky, L.D., 2005. New insightsinto the Weichselian environment and climate of the East Siberian Arctic,derived from fossil insects, plants, and mammals. Quaternary Science Reviews24 (5), 533e569.
Shiyake, S., 2013. Applying the Mutual Climatic Range method to the beetle assem-blages in Japan using accurate data of climate and distribution ofmodern species.Quaternary International. http://dx.doi.org/10.1016/j.quaint.2013.06.002.
Skidmore, P., 1996. A Dipterological Perspective on the Holocene History of theNorth Atlantic Area (Unpublished PhD thesis). University of Sheffield.
Smith, D.N., 2004. The insect remains from the well. In: Bishop, M.C. (Ed.), InvereskGate: Excavations in the Roman Civil Settlement at Inveresk, East Lothian,1996e2000, STAR Monograph 7, pp. 81e88. Loanhead, Midlothian.
Thompson, R.S., Anderson, K.H., Pelltier, R.T., Strickland, L.E., Bartlein, P.J.,Shafer, S.L., 2012. Quantitative estimation of climatic parameters from vegeta-tion data in North America by the mutual climatic range technique. QuaternaryScience Reviews 51, 18e39.
Vickers, K., Buckland, P.I. Predicting island beetle faunas by their climate ranges ethe tabula rasa/refugia theory in the North Atlantic. Journal of Biogeography (inpress).
Waßmer, T., 1995. Mistkäfer (Scarabaeoidea et Hydrophilidae) als Bioindikatorenfür die naturschützerische Bewertung von Weidebiotopen. Zeitschrift fürÖkologie und Naturschutz 4, 135e142.
Whitehouse, N., 2004. Mire ontogeny, environmental and climatic change inferredfrom fossil beetle successions from Hatfield Moors, eastern England. The Ho-locene 14, 79e93.
logy Package (BugsCEP) database: 1000 sites and half a million fossils014.01.030