7

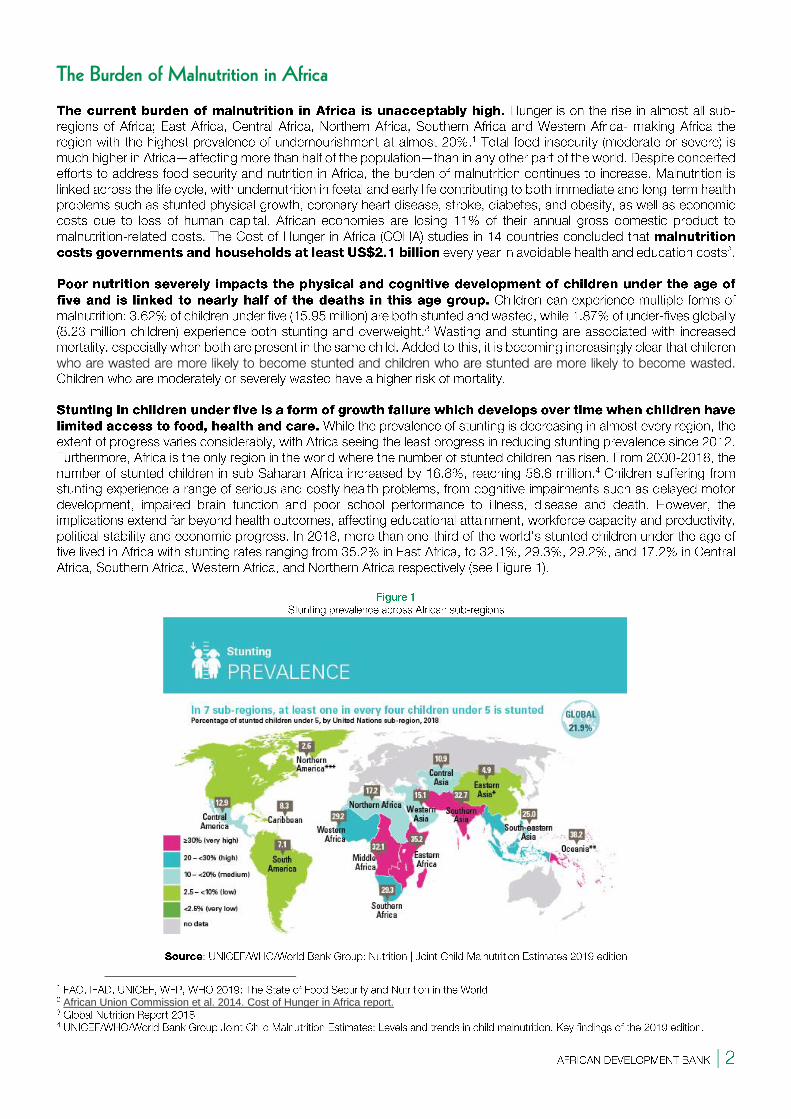
The Burden of Malnutrition in Africa
African Union Commission et al. 2014. Cost of Hunger in Africa report.
Anemia is one of the most important indicator of micronutrient deficiencies, as this is caused by the deficiency
of many of them, and its effects are exacerbated by several diseases. T
WHO | Double burden of malnutrition: https://www.who.int/nutrition/double-burden-malnutrition/en/

far-reaching effects on both maternal health during pregnancy and mental development during early childhood. Severe iodine deficiency in pregnant women can result in lower IQ scores in
children by the time they are school-aged.
a sharp drop in the number of iodine-deficient countries, from 113 in 1993 to only 15 in 2016. However, approximately 28% of the global population (~1.8 billion people), including 240 million school-aged children, continue to be at risk of iodine deficiency and its consequences due to insufficient dietary iodine.7, 8 Continuous monitoring and support to USI programs is needed ensure successful USI globally.
African Countries on Course to Achieve the WHO Nutrition Targets
Major Drivers of Malnutrition in Africa
2018 Nutrit ion global profile | globalnutrit ionreport.org
World
Sources: UNICEF/WHO/World Bank Group: Joint child malnutrit ion estimates, UNICEF global databases: Infant and Young Child Feeding, NCD Risk Factor Collaboration, WHO Global Health Observatory.
Notes: The methodologies for tracking differ between targets. Data on the adult indicators are based on modelled estimates. See Appendix 1 of the 2018 Global Nutrition Report for details of
the methods and sources used to assess progress towards global nutrit ion targets.
Economics and demography
Poverty rates (%) and GDP (PPP$)
Source: World Bank 2018.
Note: GDP = gross domestic product. PPP = purchasing power
parity.
Under-5 mortality (per 000 live births)
Source: UN Inter-agency Group for Child
Mortality Estimation 2018.
Population
Source: UN Population Division 2017.
Note: n = 184 (under-5); n = 193 (rural); n = 184 (over 65)
Underlying determinantsFood supply
Source: FAOSTAT 2018.
Gender-related determinants
Source: UNICEF 2018.
Note: n = 114.
Population density of health workersper 1,000 people
Source: WHO's Global Health Workforce Statistics, OECD,supplemented by country data. n = 191
Female secondary educationenrolment (net, % population)
Source: UNESCO Institute for Statist ics 2018.
Drinking water coverage (% population)
Source: WHO/UNICEF Joint Monitoring Programme 2017.
Sanitation coverage (% population)
Source: WHO/UNICEF Joint Monitoring Programme 2017.
Government expenditures (% total)
Source: IFPRI 2015.
1
Under-5 stunting Under-5 wasting Under-5 overweight WRA anaemia Exclusive breastfeeding
24/194 on course 37/194 on course 38/194 on course 0/194 on course 31/194 on course
Adult female obesity Adult male obesity Adult female diabetes Adult male diabetes
0/194 on course 0/194 on course 26/194 on course 8/194 on course
Population (millions) 7,633 2018
Under-5 population (millions) 677 2018
Rural (%) 45 2017
≥65 years (millions) 675 2018
Early childbearing: births by age
18 (%)18 2015
Physicians 1.49 2016
Nurses and midwives 3.4 2016
Community health workers 0.52 2016


Acknowledgements


