Page 1
DEPARTMENT OF COMMERCE
Technologic PapersOF THE
Bureau of StandardsS. W. STRATTON, Director
No. 77
DENSITY AND THERMAL EXPANSION OFAMERICAN PETROLEUM OILS
BY
H. W. BEARCE, Assistant Physicist
and
E. L. PEFFER, Laboratory Assistant
Bureau of Standards
ISSUED AUGUST 26, 1616
WASHINGTONGOVERNMENT PRINTING OFFICE
1916
Page 2
ADDITIONAL COPIES
OF THIS PUBLICATION MAY BE PROCUKED FROMTHE SUPERINTENDENT OF DOCUMENTS
GOVERNMENT PRINTING OFFICE
WASHINGTON, D. C.
AT
10 CENTS PER COPY
A complete list of the Bureau's publications maybe obtained free of charge on application to
the Bureau of Standards, Washington, D. C,
Page 3
DENSITY AND THERMAL EXPANSION OF AMERICANPETROLEUM OILS
By H. W. Bearce and E. L. Peffer
CONTENTSPage
I. Introduction 3
1. Object of investigation 3
II. Material used 4III. Methods of measurement employed 4IV. Apparatus used 4V. Calibration of apparatus . 6
VI. Temperature range of density determinations 6
VII. Method of procedure 6
1
.
By the method of hydrostatic weighing 6
2. By the picnometer method 8
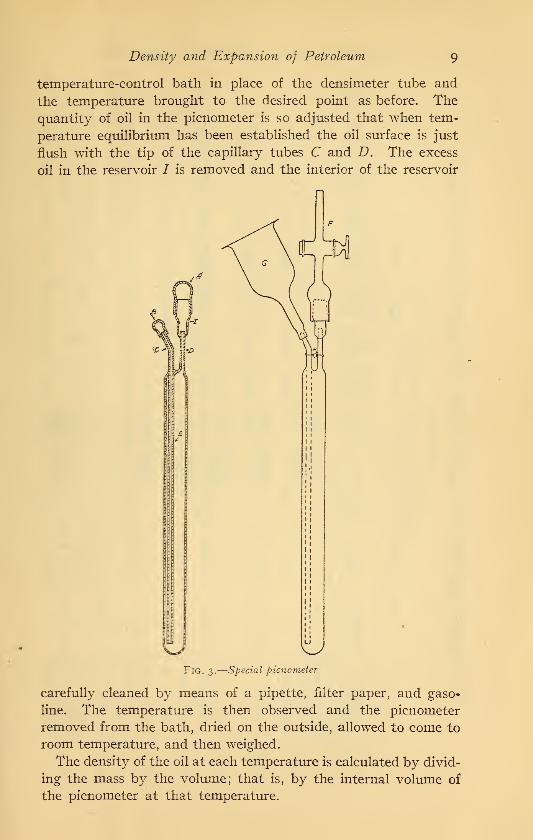
VIII. Sample records of observations and calculation of density 10
Table 3 .—By method of hydrostatic weighing 10
Table 4.—By picnometer method 11
IX. Calculation of results 12
X. Reduction of observations 12
XI. Results in detail 14
XII. Plot of a and £ against density at 25 C 17
XIII. Tabulated values of D25, a and /3 18
XIV. Calculation of standard density and volumetric tables 18
XV. Applicability and accuracy of the expansion tables of Circular No. 57 .
.
19
1. Sources of error 21
XVI. Rate of expansion of fuel oils and lubricating oils at high temperatures
.
22
XVII. Comparison of results with previous work 23
XVIII. Conclusion 25
I. INTRODUCTION
1. OBJECT OF INVESTIGATION
The work presented in this paper was undertaken for the
purpose of securing data from which to calculate standard den-
sity and volumetric tables for American petroleum oils. Thedata have been secured and the tables prepared and published
as Circular No. 57 of this Bureau. These tables are intended to
be applicable to all petroleum oils, both crude and refined, pro-
duced in the United States. They cover a density range of 0.620
to 0.950, and a temperature range of 30 F to 120 F. In addi-
tion to these, a special table for heavy lubricating and fuel oils
has been prepared with a temperature range up to 210 F.
3
Page 4
4 Technologic Papers of the Bureau of Standards
II. MATERIAL USED
The material used in the investigation here reported was for
the most part supplied by producers and refiners of oil in various
parts of the United States. Oil samples were received from the
States of Pennsylvania, New York, Ohio, Louisiana, Texas,
Oklahoma, Kansas, Indiana, and California.
A part of the samples of lubricating oil were of unknownorigin, having been submitted to the Bureau for test in connec-
tion with the fulfillment of contracts with the Government for
lubricating oils.
It is assumed that the samples examined fairly represent the
commercial petroleum oils produced in the United States. Asthe object of the investigation was to determine the rate of
expansion of commercial petroleum oils, no special precautions
were taken to insure more than ordinary purity in the samples
collected.
III. METHODS OF MEASUREMENT EMPLOYED
In making the density determinations on the oil samples two
methods were employed: (a) The method of hydrostatic weigh-
ing; (b) the picnometer method.
In making use of the first method a sinker or plummet of
known mass and volume is weighed in the sample of oil whose
density is to be measured, and the density is calculated from
the known volume and the difference between the weight of the
sinker in vacuo and when immersed in the oil.
By the second method the weight of a known volume of the
oil in question is determined, and the density calculated in the
usual way. Details of the calculation will be given at a later
point in this paper.
IV. APPARATUS USED
The greater part of the apparatus used in this investigation
has been previously described in publications 1 of the Bureau
and need not be described in great detail here. The essential
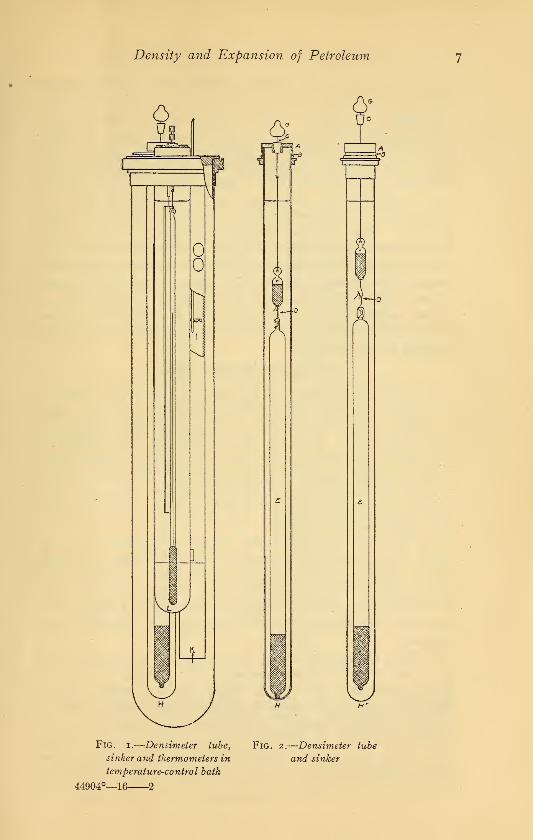
features of the apparatus used in the method of hydrostatic
weighing are shown in Figs, i and 2. The picnometer is shownin Fig. 3.
1 Bureau of Standards Bulletin, 9, p. 371; Technologic Paper No. 9, P- !•
Page 5
Density and Expansion of Petroleum 5
The sinker employed has a mass of 99.9630 g, and the follow-
ing volumes at the temperatures indicated:
TABLE 1
Volume of Sinker No. 7
Tempera-ture indegrees
centigrade
Volumein milli-
liters
10
20
25
30
40
50
47. 6882
47. 6998
47. 7113
47. 7170
47. 7227
47. 7339
47. 7450
The picnometers used have the following internal volumes at
the temperatures indicated:
TABLE 2
Tempera-ture indegrees
centigrade
Internal volume inmilliliters
No. 1 No. 2
25
50
75
95
108. 3803
108. 4543
108. 5378
108. 6283
108. 6906
109. 0834
109. 1545
109. 2335
109. 3216
109. 3954
The picnometers have the following external volumes at 20
C: No. 1, 156.041 ml; No. 2, 155.592 ml. The external volume
is used only in calculating the correction for air buoyancy and
need not be known with great accuracy.
The temperature control bath (Fig. 1) is so arranged that either
the densimeter tube H (Fig. 2) or the picnometer (Fig. 3) may be
used. By means of an electric heating coil and a refrigerating
brine coil any desired temperature between o° and 50 C may be
secured and automatically maintained within the bath.
The temperature of the bath is observed by means of mercury
thermometers suspended in the bath parallel to the picnometer
or densimeter tube, as shown in Fig. 1. The thermometers are
subdivided to o?i C, and by means of a long-focus microscope are
read to o?oi C.
The thermometers used are well aged and have been frequently
calibrated, and when used repeatedly over the same temperature
Page 6
6 Technologic Papers of the Bureau of Standards
range in the same regular order and with occasional determina-
tions of the ice point, the temperature observations are very con-
sistent and are believed to be reliable to o?oi or o?02 C. Thetemperatures were nearly always read with a stationary or slowly
rising meniscus, as a falling meniscus is known to be unsteady and
unreliable.
V. CALIBRATION OF APPARATUS
The density sinker and the picnometers were calibrated by the
use of pure, air-free, twice-distilled water, assuming Chappuis's 2
values for the density of water to be correct. Calibrations were
made at each temperature at which densities were to be deter-
mined.
Throughout this paper all densities are expressed in grams per
milliliter and all weights are reduced to vacuo. The densities are,
therefore, in all cases numerically the same as true specific gravi-
ties at the various temperatures referred to water at 4 C as unity.
VI. TEMPERATURE RANGE OF DENSITY DETERMINA-TIONS
Density determinations were made on most of the samples at
the following temperatures: o°, io°, 20 , 25 , 30 , 40 , and 50 C.
On a few samples determinations were not made at the lower
temperatures, while on others the temperatures were carried up
to 75 , 85 , and 95 C.
VII. METHOD OF PROCEDURE
1. BY THE METHOD OF HYDROSTATIC WEIGHING
The oil sample whose density is to be measured is placed in the
densimeter tube H with the sinker E immersed in it (Fig. 1) and
the tube secured in position in the temperature-control bath.
The temperature of the bath is then brought to the point at which
the first density determination is to be made and is allowed to
remain constant until the apparatus reaches a condition of tem-
perature equilibrium. After about 20 minutes at the constant
temperature observations are begun. First, a weighing is madewith the sinker E immersed in the oil sample and suspended from
the arm of a balance. The temperature is then read on each of
two thermometers suspended in the tube L, which is immersed in
the same bath and close to the densimeter tube H. Next, a weigh-
ing is made with the sinker E detached from the suspension andresting on the botton of the tube H. Then, a second weighing is
2 P. Chappuis, Bureau International des Poids et Mesures, Travaux et Memoires, XIII; 1907.
Page 7
Density and Expansion of Petroleum
Fig. i.—Densimeter tube, Fig. 2.
—
Densimeter tube
sinker and thermometers in and sinker
temperature-control bath
44904°—16 2
Page 8
8 Technologic Papers of the Bureau of Standards
made with the sinker E suspended; and, finally, the temperature
is again read on the two thermometers.
By means of the small sinker F the suspension wire is kept in
position and passing through the surface of the oil at all times,
both when the large sinker E is suspended and when it is detached.
In this way the effect of surface tension on the suspension wire is
eliminated. The observations at each temperature, as outlined
above, consist of two weighings with the sinker attached, one
weighing with it detached, and two readings on each of two ther-
mometers. The reason for making two weighings with the sinker
attached and only one with it detached is because in the former case
a slight change in the temperature of the oil makes an appreciable
change in the apparent weight of the sinker on account of its large
volume, while in the latter case the change is not appreciable.
After completing the observations at one point the tempera-
ture of the bath is changed to the next in the series and the process
repeated in the same order.
2. BY THE PICNOMETER METHOD
The method of hydrostatic weighing above described is applica-
ble only to such oils as are of sufficient fluidity to allow the sinker
to readily take up a position of static equilibrium when sus-
pended in the oil. With the more viscous oils the sensibility of
the balance is greatly reduced and the weighings become moredifficult to make, and of doubtful accuracy. For such oils it is
therefore necessary, or at least desirable, to use some other
method. The method usually resorted to is that of the picnom-
eter or specific-gravity bottle.
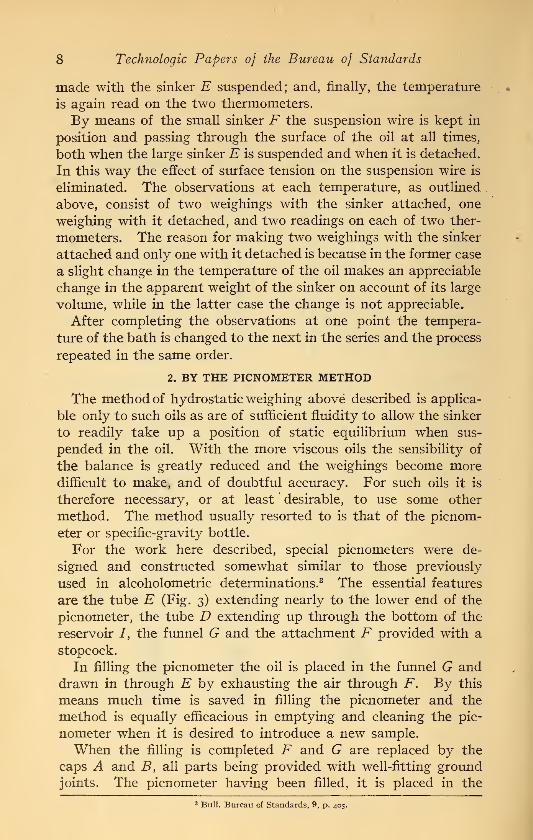
For the work here described, special picnometers were de-
signed and constructed somewhat similar to those previously
used in alcoholometric determinations. 3 The essential features
are the tube E (Fig. 3) extending nearly to the lower end of the
picnometer, the tube D extending up through the bottom of the
reservoir /, the funnel G and the attachment F provided with a
stopcock.
In filling the picnometer the oil is placed in the funnel G anddrawn in through E by exhausting the air through F. By this
means much time is saved in filling the picnometer and the
method is equally efficacious in emptying and cleaning the pic-
nometer when it is desired to introduce a new sample.
When the filling is completed F and G are replaced by the
caps A and B, all parts being provided with well-fitting groundjoints. The picnometer having been filled, it is placed in the
3 Bull. Bureau of Standards, 9, p. 405.
Page 9
Density and Expansion of Petroleum g
temperature-control bath in place of the densimeter tube and
the temperature brought to the desired point as before. The
quantity of oil in the picnometer is so adjusted that when tem-
perature equilibrium has been established the oil surface is just
flush with the tip of the capillary tubes C and D. The excess
oil in the reservoir / is removed and the interior of the reservoir
Fig. 3.
—
Special picnometer
carefully cleaned by means of a pipette, filter paper, and gaso-
line. The temperature is then observed and the picnometer
removed from the bath, dried on the outside, allowed to come to
room temperature, and then weighed.
The density of the oil at each temperature is calculated by divid-
ing the mass by the volume; that is, by the internal volume of
the picnometer at that temperature.
Page 10
IO Technologic Papers of the Bureau of Standards
co
wp
o
ol-H
Po
oQ&
co
o6—
f
H
COmo
oCO
QOow
t
<
*0Q 2a
O <D
'd 3
W «
•§ 3•S °
a
in o o O m o §o
CQ CM CM CO
>>"20 § CIinCO g r-. COm
3.2^. a R s; COin eg
VOt- c^ c^ t~ t> t> r-
cu >—'
-<->t2
H o"«d
t •—' tfl VO o ^^ ^ CO eg coO S w CD o o o o c oStago.2"S <o0-".Si3
oo oo 8 s oo oo s©d
!
o o
+
o
+
o
1
o
1
o
1
>.SO o c^COCXI
c^ CM CfN
vo
s.2-^- |VO
a\ COc^ VO CM
vS£- r~ t^ c- c^ tr^0"ii M
^"o« d
a* a „o VO o o o •* oCT\ a\ CO oo VO coVO co OI VO eg co
3.5£go S^ 3 a C~ vo VO t--
eg CO
>*S"Srt <* "*t>-
<*
^^ <T) CO83
en CO ON in^.l.'drt O o> co CO o t>m.S2 <u-« CO o o CO in ON
^ o ft—
bo © eg o CO
VO VOCO CO CO CO CO CO CO
« !u"3C^ e> I>. _ P-3 _, in
£•5X3 en UO o to CMeg ino
2-- S 2* bO CTi o TT- t-- CT> >H Tf
H*1a
CO cxi cxi CM CO cokO VO VO vo VO VO VO
U . _ "m Oi f» 00 CO OI CfN CfN
Buoyancorrec-
tion
on
weight;
CO co 00 co ooo o o o o o obl o
do o o o o o
1 1 1 1 1 1 1
3-" <uI2g-S,-* 3
^ * V£> O CO 1j- <J\ 1-1 m 00 o o\ CM O ^_ OO o m co "*CJ CSJ og c~- a\ co t> 00 O0 CO co* tr- VO IO •X) VO VO vo CO CO CO eg eg pa t^ t>. r^
«--as* bD°NON Oi o o o >* Tl- »* t^ l> t^ ON ON ON r-> tH Tf<J- -*
ftga3 eg eg c<i c\i <nJ eg c-j cxi eg cxi cxi CM CM CM CM COCO CO CO CO CO
^•s.sVO VO 10 \£>\0 VO VO VO VO VO VO VO VO vo VO VO VO VO VO VO VO
<U bfi
SI« 13
Ot-P 00 CO c3 O CTi O3 i-i a> c r\ CO o c3 a-Tr--; CM t~~ Tf-r- ee t oo o o3 Ot~- I-^ Tf V!3 OON - H(Mr m on in
00 IO 3 CXI CO i- in cm u3 COrHO3 S^C \ CM ON CM
bO^ i-l r Or-tC3 r>rtt CO H HHp l> vo O VO
32 dcoc5 rHCOr dcoc3 dcoc3 d co c3 d eocr> d co dCO Pa <M CO Ca CXI 00 Pa CM 00 Ca CM CO P4 HCCr HCOH
£ftg<X! o a\ ^ CO ^ o
o C7> o o o CO ON ON
d d •* d dCXI " CM eg eg CO
CO os m IO ON28
<u o ON en o o o ,-H o O CO CO CfN 0^
<u 3 <t tf d c d d ^r d CN d dcq
1 + *"* *H CM CXI CM CM CM eg CO CO
g <DH Oh CM oq CM o t>. eo CO -rf 00 OI
5 1o ON
TT1
o o od . d
od
Od
00 00
dOI
CfN
ON
den
dCq (M
i
^ ~ CM CM CM CM CM eg CO CO
o envn _, rf VO m ,_, _,
o o o o o o O ow-2 d3 <*>
la11
+ 1 + + + + 1
_, o ^ o ^ O CO
o od
1 1
o
1
o o
1
o o
1
3CM vO vo o CXI CO l> >n in 00 CO „. m o ON
ffidas
00 CO o o o o 0\ CT\ t* CJ\ CfN ON CO
Is.
_)! ^ d d d d Tjl * d d d deg ca CM eg CM eg CO CO
« CM
co CO CO o 00 CXI ,_, CM T}- in 00 ON I-.—. "* *ON CTv o o
d dod
Od
00 CO
dON <JJ VO °^ CfN
di2 • eg CM CM CM eg CM CM O ^ CO <n
5£
aa a a a a a* ad CB di
Hd
o**
oCO
&oCO
ftmin
ft
o*r-> «H rH pj p4 CO
Page 11
Density and Expansion of Petroleum ii
U1
VO
i--
o
1
,_,
lOt»
r-*<*•
t~-
*
^
CO
g00
VO
8o
1
CTl
00 00 00
co co COVO VO
iv
NOP9
CTi co cn
a\*
t^ 00e» t-
p. t.t~ I>.
•>*
o
o
1
<*
vD©•aS ?
00
«N(J\
3D.
cq
*
1
« 2
fjS3C_CU
in o in wCM IT) t- C
O
Density
at
inte-
gral
tem-perature
*-< vo m- in,r» co i-i co
•^1 ro r^ i-h ooH m co cm o-C Ol o\ Ol (Ji
M o •
Correc-
tion
to
integraldegrees
,-1 If i-l <N1
cm o Tt- mo o o oo o o oo o © ©©+ + + +
Cm" o
O CVJ CO CTl_ in co r- -h5 n n o oog in co cm oC d Ol Ol OlM o •
R o W
o.S.8>a-
CO O CO 00m oo o o_ in co co a\j3 ii- m vo voe 00 00 00 COo o o o
3«•SPoa>*4
CM •*• (M COro in c\ cmi-l CO i-H >-•
M -<J- r- o t>
co i-J © ooo o o oi
Weight
of
pic- nometer
(empty)
to ""J'-' «^ «H
True
weight
of
picnome-
ter
(filled)
VO 00 VO c~CTi cm vo oi00 H o~i CO
M m oi i-i oo
o oo r^ in©CTI Ov CT»
Correc-
tion
for
airbuoyancy
co m vo o\VO VO 00 00mm in in
M _ _ ,_( _©+ + + +
Apparent
weight
of
picnome-
ter
(filled)
CO CO O 00CO vo oo oco m co co
M -s- t» © t^»
© co tC mO C\ Ol o>(M i-l rt rt
i ,,
SI'SCM VO CO 00CO O VO o
o in o mmcm m t> oi
o
8-2
(M VO
o m ocm m
(M VO CO 00
f. CO © VO o
o in o mmcm m C>- CTl
en
ISis
©
© o
+ 1
(M VO "3- r-<© o o oo O
II 1 +
£ S
00 !>•
o~ °o in ©
cm m
+ N H f> t>CO —l g VO O
U in d b in ino cm m *^ t-» ct>
d
m
3 o e
o
5
>o
a a8 8
3 3
Page 12
12 Technologic Papers of the Bureau of Standards
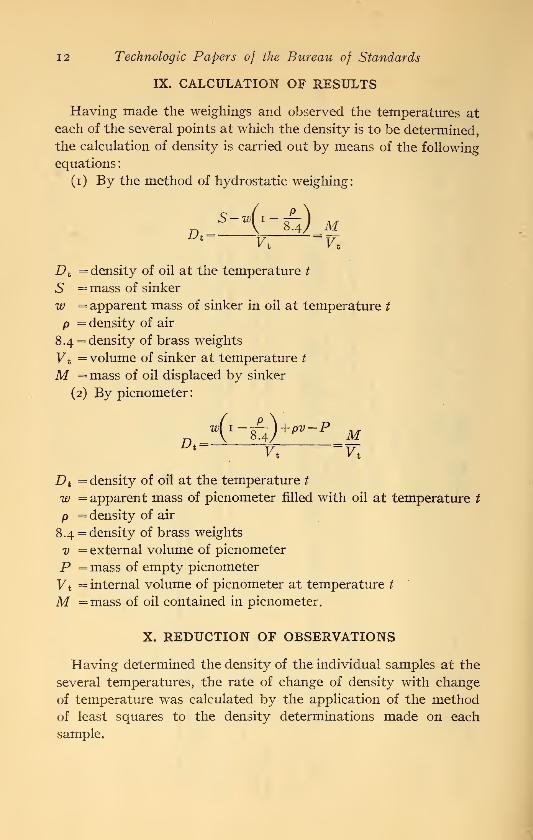
IX. CALCULATION OF RESULTS
Having made the weighings and observed the temperatures at
each of the several points at which the density is to be determined,
the calculation of density is carried out by means of the following
equations
:
(i) By the method of hydrostatic weighing:
Dt __ _
D t= density of oil at the temperature t
S = mass of sinker
w = apparent mass of sinker in oil at temperature t
p = density of air
8.4 = density of brass weights
V% = volume of sinker at temperature /
M =mass of oil displaced by sinker
(2) By picnometer:
^(i-^+^-p MD% ^ -p.
D t= density of oil at the temperature t
w = apparent mass of picnometer filled with oil at temperature t
p = density of air
8.4 = density of brass weights
v = external volume of picnometer
P = mass of empty picnometer
V t= internal volume of picnometer at temperature t
M =mass of oil contained in picnometer.
X. REDUCTION OF OBSERVATIONS
Having determined the density of the individual samples at the
several temperatures, the rate of change of density with change
of temperature was calculated by the application of the methodof least squares to the density determinations made on each
sample.
Page 13
Density and Expansion of Petroleum 13
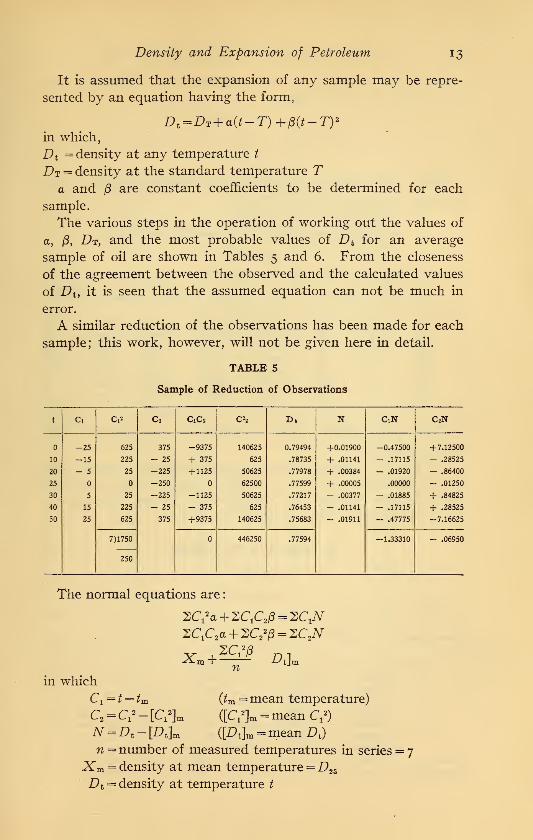
It is assumed that the expansion of any sample may be repre-
sented by an equation having the form,
D t=DT+ a(t-T) +(3(t-T) 2
in which,
D t= density at any temperature /
Dt = density at the standard temperature Ta and (3 are constant coefficients to be determined for each
sample.
The various steps in the operation of working out the values of
a, /3, Dt, and the most probable values of D t for an average
sample of oil are shown in Tables 5 and 6. From the closeness
of the agreement between the observed and the calculated values
of D t , it is seen that the assumed equation can not be much in
error.
A similar reduction of the observations has been made for each
sample; this work, however, will not be given here in detail.
TABLE 5
Sample of Reduction of Observations
t Ci Ci* c2 CiCs Ch D» N CiN C 2N
-25 625 375 -9375 140625 0.79494 +0.01900 -0.47500 +7.12500
10 -15 225 - 25 + 375 625 .78735 + .01141 - .17115 - .28525
20 - 5 25 -225 +1125 50625 .77978 + .00384 - .01920 - .86400
25 -250 62500 .77599 + .00005 .00000 - .01250
30 5 25 -225 -1125 50625 .77217 - .00377 - .01885 + .84825
40 15 225 - 25 - 375 625 .76453 - .01141 - .17115 + .28525
50 25 625 375 +9375 140625 .75683 - .01911 - .47775 -7.16625
7)1750 446250 .77594 -1.33310 - .06950
250
The normal equations are
:
SC12a+SC1C2i8 =SC1iV
SC1C2a +SC22
i8=SC2iV
2C±2pxm +
nD tl
in which
C1= t — tm (tm =mean temperature)
C2= C,2 - [Cx
2]m ([Cfln = mean C, 2
)
N=A - [Dt]m ([A]m = mean D t)
n = number of measured temperatures in series = 7Xm = density at mean temperature =D25
Dt = density at temperature t
Page 14
14 Technologic Papers of the Bureau of Standards
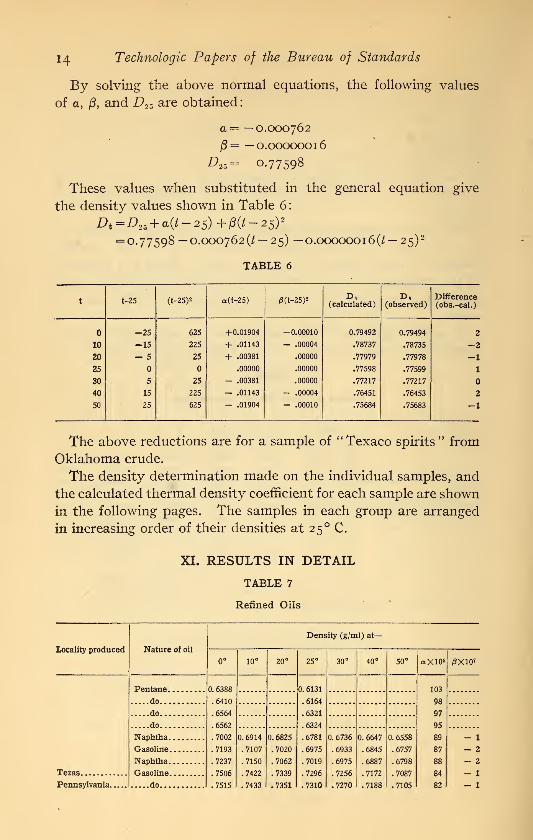
By solving the above normal equations, the following values
of a, j8, and D25 are obtained
:
a= —0.000762
/3= —0.00000016
D25= 0.77598
These values when substituted in the general equation give
the density values shown in Table 6
:
Dt =D25 + a(t-2 5)+P(t-2 5y= 0.77598— 0.000762(2 — 25) —0.00000016(2 — 25)
2
TABLE 6
t t-25 (t-25)2 a (t-25) 0(t-25)2(calculated) (observed)
Difference(obs.-cal.)
-25 625 +0.01904 -0.00010 0.79492 0.79494 2
10 -15 225 + .01143 — .00004 .78737 .78735 -220 - 5 25 + .00381 .00000 .77979 .77978 -1
25 .00000 .00000 .77598 .77599 1
30 5 25 — .00381 .00000 .77217 .77217
40 15 225 - .01143 - .00004 .76451 .76453 2
50 25 625 - .01904 - .00010 .75684 .75683 -1
The above reductions are for a sample of " Texaco spirits " from
Oklahoma crude.
The density determination made on the individual samples, and
the calculated thermal density coefficient for each sample are shown
in the following pages. The samples in each group are arranged
in increasing order of their densities at 25 ° C.
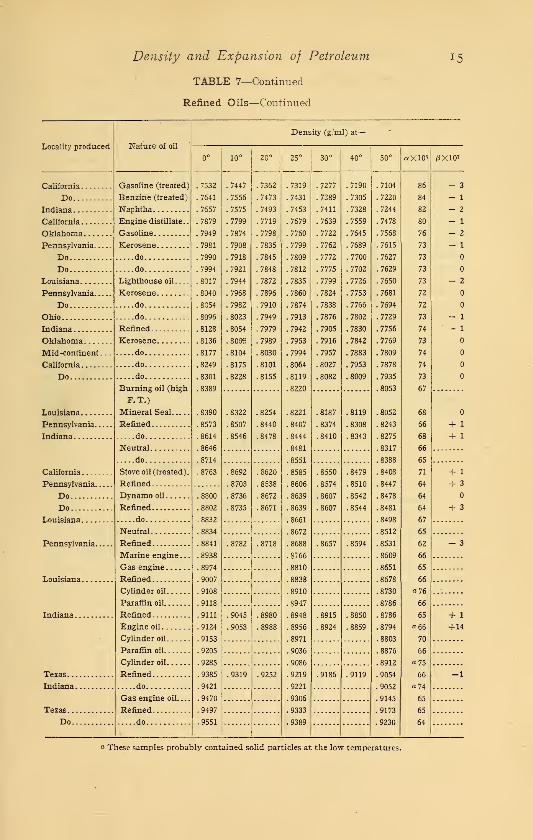
XI. RESULTS IN DETAIL
TABLE 7
Refined Oils
Locality produced Nature of oil
Density (g/ml) at—
0° 10° 20° 25° 30° 40° 50° «X105 0X10'
0. 6388
.6410
.6564
.6562
.7002
.7193
.7237
.7506
.7515
0. 6131
.6164
.6321
.6324
.6781
.6975
.7019
.7296
.7310
103
98
97
95
89
87
88
84
82
.....do
do
do
0. 6914
.7107
.7150
.7422
.7433
0.6825
.7020
.7062
.7339
.7351
0. 6736
.6933
.6975
.7256
.7270
0. 6647
.6845
.6887
.7172
.7188
0. 6558
.6757
.6798
.7087
.7105
— 1
Gasoline - 2
Naphtha — 2
Texas — 1
Pennsylvania do - 1
Page 15
Density and Expansion of Petroleum
TABLE 7—Continued
Refined Oils—Continued
15
Locality produced
California
DoIndiana
California
Oklahoma
Pennsylvania.
.
DoDo
Louisiana
Pennsylvania.
.
DoOhio
Indiana
Oklahoma
Mid-continent
.
California
Do
Louisiana
Pennsylvania.
Indiana
California
Pennsylvania.
DoDo
Louisiana
Pennsylvania.
Louisiana.
Indiana
.
Texas. .
.
Indiana
.
Texas.
.
Do.
Density (g/ml) at-
Nature of oil
Gasoline (treated)
Benzine (treated)
Naphtha
Engine distillate..
Gasoline
Kerosene
....do
....do
Lighthouse oil.
Kerosene
....do
....do....
Refined..
Kerosene.
....do....
....do
....do
Burning oil (high
F.T.)
Mineral Seal
Refined
do
Neutral
....do
Stove oil (treated).
Refined
Dynamo oil
Refined
....do
Neutral
Refined
Marine engine .
.
Gas engine
Refined
Cylinder oil
Paraffin oil
Refined
Engine oil
Cylinder oil
Paraffin oil
Cylinder oil
Refined
do
Gas engine oil...
Refined
do
7532
7641
7657
7879
7949
7981
7990
7994
8017
8040
8054
8096
8128
8136
8177
8249
8301
8390
8573
8614
8646
,8714
,8763
8800
8802
8832
8834
8841
8938
8974
9007
9108
9118
9111
9124
9153
9205
9285
9385
9421
,9470
9497
9551
10° 20° 25° 30° 40° 50° aX10-5! /3X10?
7447
7556
7575
7799
7874
7908
7918
7921
7944
7968
7982
8023
8054
8062
8104
8175
8228
8322
8507
,8546
8692
8703
8736
8735
8782
9045
9053
9319
.7362
.7473
.7493
.7719
.7798
.7835
.7845
.7848
.7872
.7896
.7910
.7949
.7979
.7989
.8030
.8101
.8155
.8254
.8440
.8478
.8620
.8538
.8672
.8671
8718
9252
7319
,7431
,7453
,7679
,7760
,7799
,7809
,7812
,7835
,7860
,7874
,7913
,7942
,7953
,7994
,8064
,8119
,8220
8221
,8407
,8444
,8481
,8551
,8585
,8606
.8639
.8639
,8661
,8672
,8688
.8766
.8810
.8838
,8910
,8947
,8948
.8956
.8971
.9036
.9086
.9219
.9221
.9306
,9333
,9389
.7277
.7389
.7411
.7639
.7722
.7762
.7772
.7775
.7799
.7824
.7838
.7876
.7905
.7916
.7957
.8027
,8187
,8374
,8410
8550
8574
8607
8607
8657
8915
8924
9186
.7190
.7305
.7328
.7559
.7645
.7689
.7700
.7702
.7726
.7753
.7766
.7802
.7830
.7842
.7883
.7953
.8009
.8119
.8308
.8343
8479
8510
8542
8544
8594
8850
8859
9119
.7104
.7220
.7244
.7478
.7568
.7615
.7627
.7629
.7650
.7681
.7694
.7729
.7756
.7769
.7809
.7878
.7935
.8053
.8052
.8243
.8275
.8317
.8447
.8478
.8481
.8498
.8512
.8531
.8609
.8651
.8678
.8730
.8786
.8786
.8794
.8803
.8876
.8912
.9054
.9052
.9145
.9173
.9230
86
84
82
80
76
73
73
73
73
72
72
73
74
73
74
74
73
67
68
66
68
66
65
71
64
64
64
67
65
62
66
65
66
a 76
66
65
a 66
70
66
a 75
66
a 74
65
65
64
- 3
- 1
- 2
- 1
- 2
- 1
- 2
- 1
- 1
+ 1
+ 1
+ 1
+ 3
+ 3
+ 1
+14
-1
a These samples probably contained solid particles at the low temperatures.
Page 16
1
6
Technologic Papers of the Bureau of Standards
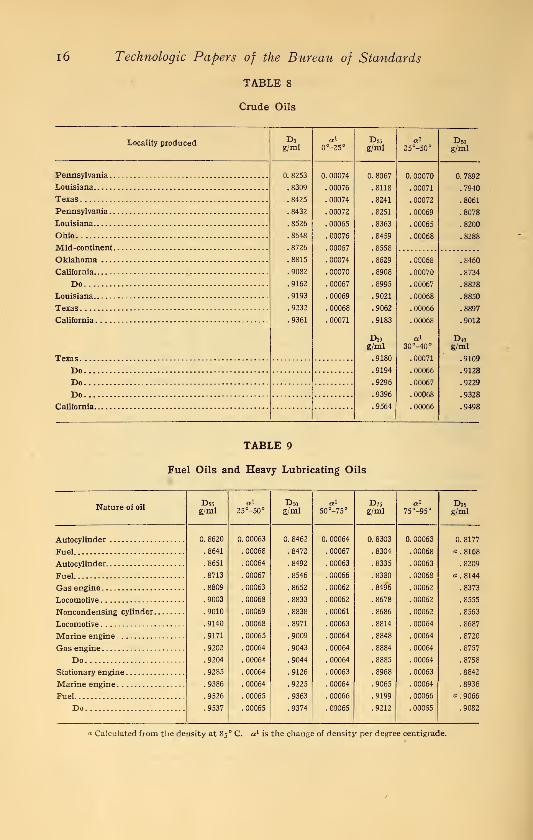
TABLE 8
Crude Oils
Locality produced Dog/ml 0°-25°
D25
g/ml 25°-50°D50g/ml
Pennsylvania 0. 8253
.8309
.8425
.8432
.8526
.8648
.8726
.8815
.9082
.9162
.9193
.9232
.9361
0. 00074
. 00076
. 00074
. 00072
. 00065
. 00076
. 00067
. 00074
. 00070
. 00067
. 00069
. 00068
. 00071
0. 8067
.8118
.8241
.8251
.8363
.8459
.8558
.8629
.8908
.8995
.9021
.9062
.9183
D3o
g/ml
.9180
.9194
.9296
.9396
.9564
0. 00070
. 00071
. 00072
. 00069
. 00065
. 00068
7892
7940
Texas
8078
8200
Ohio 8288
. 00068
. 00070
. 00067
. 00068
. 00066
. 00068
30°-40°
. 00071
. 00066
. 00067
.00068
. 00066
8460
.8734
Do 8828
.8850
Texas .8897
9012
Texas
D40g/ml
.9109
Do .9128
Do .9229
Do .9328
.9498
TABLE 9
Fuel Oils and Heavy Lubricating Oils
Nature of oil
Autocylinder
Fuel
Autocylinder
Fuel
Gas engine
Locomotive
Noncondensing cylinder
Locomotive
Marine engine
Gas engine
DoStationary engine
Marine engine
Fuel
Do
D25
g/ml
0. 8620
.8641
.8651
.8713
.8809
.9003
.9010
.9140
.9171
.9202
.9204
.9285
.9386
.9526
.9537
25°-50°
0. 00063
. 00068
. 00064
. 00067
. 00063
. 00068
. 00069
. 00068
. 00065
. 00064
. 00064
.00064
. 00064
. 00065
. 00065
D50g/ml
0. 8462
.8472
.8492
.8546
.8652
.8833
.8838
.8971
.9009
.9043
.9044
.9126
.9225
.9363
.9374
50°-75 c
0. 00064
. 00067
. 00063
. 00066
. 00062
. 00062
. 00061
. 00063
. 00064
. 00064
. 00064
. 00063
. 00064
. 00066
. 00065
D75
g/ml
0. 8303
8304
,8335
8380
8496
8678
8686
8814
8848
8884
8885
8968
9065
9199
9212
75°-95°
0. 00063
. 00068
. 00063
. 00068
. 00062
. 00062
. 00062
. 00064
. 00064
. 00064
. 00064
. 00063
. 00064
. 00066
. 00055
D95
g/ml
0. 8177
a . 8168
.8209
a . 8144
. . 8373
. 8555
.8563
.8687
.8720
.8757
.8758
.8842
.8936
a . 9066
.9082
a Calculated from the density at 85 ° C. a 1 is the change of density per degree centigrade.
Page 17
Density and Expansion of Petroleum 17
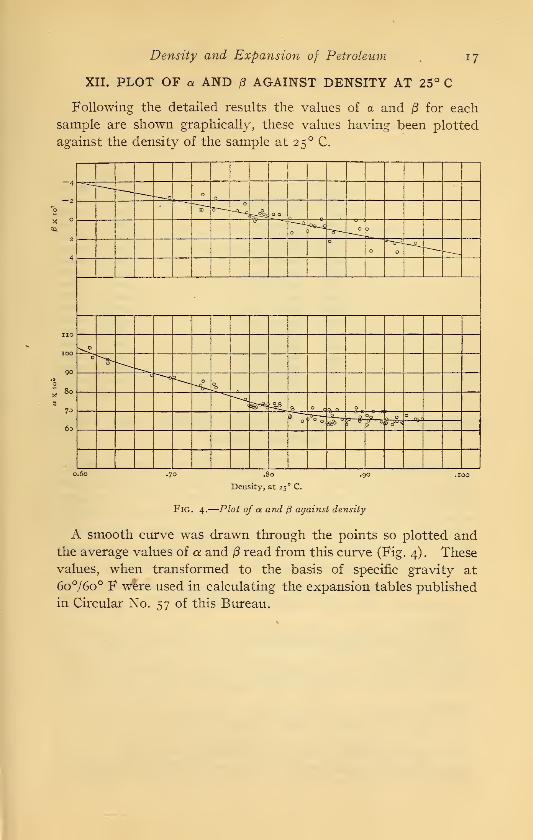
XII. PLOT OF a AND /3 AGAINST DENSITY AT 25° C
Following the detailed results the values of a and 13 for each
sample are shown graphically, these values having been plotted
against the density of the sample at 25 ° C.
4
—u> O
3D -^5*-^
)
4
i—^_i ^^O
>^o
90
80
73
o~
OOO
<^°^ -S§.
§ "7^T °o -,
61fr17
pu
°t B oW<5 j
.80
Density, at 25 ° C.
Fig. 4.
—
Plot of a and j3 against density
A smooth curve was drawn through the points so plotted andthe average values of a and /3 read from this curve (Fig. 4) . These
values, when transformed to the basis of specific gravity at
6o°/6o° F were used in calculating the expansion tables published
in Circular No. 57 of this Bureau.
Page 18
1
8
Technologic Papers of the Bureau of Standards
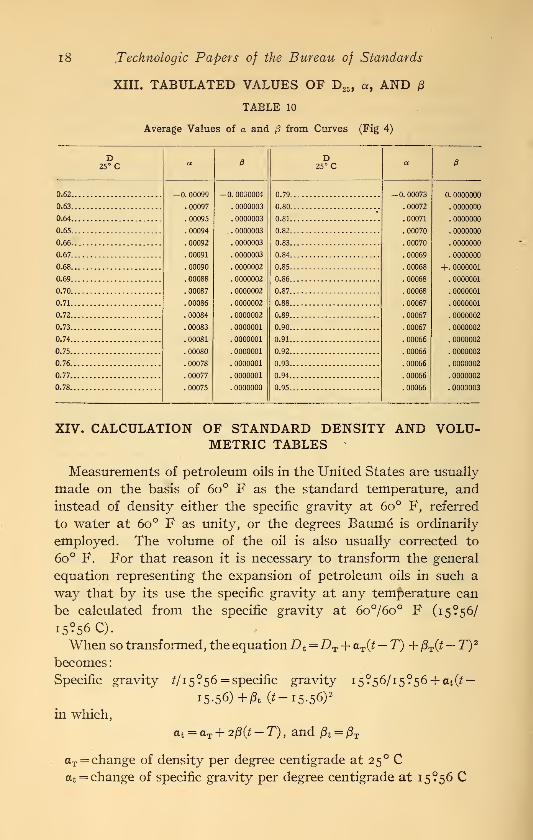
XIII. TABULATED VALUES OF D25 , a, ANDTABLE 10
Average Values of a and p from Curves (Fig 4)
D25° C
0.62,
0.63
0.64
0.65
0.66
0.67.
0.68.
0.69.
0.70.
0.71.
0.72.
0.73.
0.74.
0.75.
0.76.
0.77.
0.78.
a (8
-0. 00099 -0. 0000004
i 00097 . 0000003
. 00095 . 0000003
. 00094 . . 0000003
. 00092 . 0000003
. 00091 . 0000003
. 00090 . 0000002
. 00088 . 0000002
. 00087 . 0000002
. 00086 . 0000002
. 00084 . 0000002
. 00083 . 0000001
. 00081 . 0000001
. 00080 . 0000001
. 00078 . 0000001
. 00077 . 0000001
. 00075 . 0000000
0. 0000000
. 0000000
. 0000000
. 0000000
. 0000000
. 0000000
+. 0000001
. 0000001
. 0000001
. 0000001
. 0000002
. 0000002
. 0000002
. 0000002
. 0000002
. 0000002
. 0000003
XIV. CALCULATION OF STANDARD DENSITY AND VOLU-METRIC TABLES '
Measurements of petroleum oils in the United States are usually
made on the basis of 6o° F as the standard temperature, and
instead of density either the specific gravity at 6o° F, referred
to water at 6o° F as unity, or the degrees Baume is ordinarily
employed. The volume of the oil is also usually corrected to
6o° F. For that reason it is necessary to transform the general
equation representing the expansion of petroleum oils in such a
way that by its use the specific gravity at any temperature can
be calculated from the specific gravity at 6o°/6o° F (i5?56/
I5?56C).
When so transformed, the equationD t=DT + aT (t — T)+ @T (t — T) 2
becomes
:
Specific gravity t/i 5 ?56 = specific gravity i5?56/i5?56 + at0f—
15.56) +ft (*-i5-56) 2
in which,
a t = aT + 2/3(2 — T) , and /3t = &T
aT = change of density per degree centigrade at 25 ° Ca t = change of specific gravity per degree centigrade at 15^56 C
Page 19
Density and Expansion of Petroleum 19
For the purpose of calculating the volume of oil at any tem-
perature from the volume at 6o° F (15^56 C), the equation is put
in the form:
in which
^t = FIs9s6C [i+A 0-15.56) +B a-15.56)2
]
«t j r> a •>. ftA = -^~ and B=A 2 -D 25
£>.
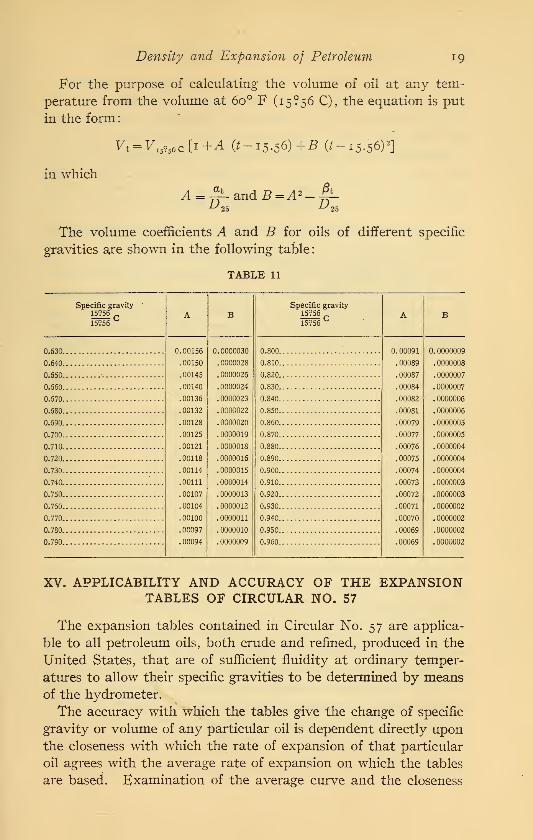
The volume coefficients A and B for oils of different specific
gravities are shown in the following table
:
TABLE 11
Specific gravity '
15956
15956u A B
Specific gravity15956
15956**
A B
0.630 0.00156
.00150
.00145
.00140
.00136
.00132
.00128
.00125
.00121
.00118
.00114
.00111
.00107
.00104
.00100
.00097
.00094
0.0000030
.0000028
.0000026
.0000024
.0000023
.0000022
.0000020
.0000019
.0000018
.0000016
.0000015
.0000014
.0000013
.0000012
.0000011
. 0000010
.0000009
0.800 0.00091
.00089
.00087
.00084
.00082
.00081
.00079
.00077
.00076
.00075
.00074
.00073
.00072
.00071
.00070
.00069
.00069
0. 0000009
0.640 0.810 . 0000008
0.650 0.820 . 0000007
0.660 0.830 . 0000007
0.670 0.840 . 0000006
0.680 0.850 . 0000006
0.690 0.860 . 0000005
0.700 0.870 .0000005
0.710 0.880 .0000004
0.720 0.890 .0000004
0.730 0.900 . 0000004
0.740 0.910 . 0000003
0.750 0.920 .0000003
0.760 0.930 . 0000002
0.770 0.940 . 0000002
0.780 0.950 .0000002
0.790 0.960 . 0000002
XV. APPLICABILITY AND ACCURACY OF THE EXPANSIONTABLES OF CIRCULAR NO. 57
The expansion tables contained in Circular No. 57 are applica-
ble to all petroleum oils, both crude and refined, produced in the
United States, that are of sufficient fluidity at ordinary temper-
atures to allow their specific gravities to be determined by meansof the hydrometer.
The accuracy with which the tables give the change of specific
gravity or volume of any particular oil is dependent directly uponthe closeness with which the rate of expansion of that particular
oil agrees with the average rate of expansion on which the tables
are based. Examination of the average curve and the closeness
Page 20
20 Technologic Papers of the Bureau of Standards
with which the individual determinations agree with it indicate
that it is very unlikely that the change of specific gravity per
degree centigrade of any sample of oil will differ from the aver-
age change for oils of that specific gravity by more than twounits of the fifth decimal place (0.00002) . For example, the aver-
age change of specific gravity per degree centigrade at 25 ° C for
oils having a specific gravity of 0.8000 is 0.00072, and it is very
unlikely that any sample of American petroleum oil having a spe-
2S°cific gravity of 0.8000 at -%- C will have a rate of change less than
0.00070 or more than 0.00074 Per degree at 25 ° C.
Let it be supposed that the rate of expansion of some particu-
lar oil differs from the average rate by this maximum amount,
then the specific-gravity value calculated from the average rate
of expansion will be in error for this particular oil by 0.00002 per
degree centigrade, and if the reduction is made over a tempera-
ture range of io° C the error in the reduced specific gravity
caused by the error in the assumed rate of expansion will amountto two units in the fourth decimal place.
On account of the variation in the rate of expansion of different
oils of the same density it has been deemed advisable to carry
the expansion tables only to the nearest five units of the fourth
decimal place over a temperature range of about io° C on each
side of the standard temperature, and to the nearest unit in the
third decimal place outside of this range. By thus arbitrarily
limiting the implied accuracy of the tables, it is believed that the
slight variations that occur between different samples of the same
density need not be considered. In commercial measurements of
petroleum oils density or specific-gravity determinations are
seldom made with greater accuracy than one unit of the third
decimal place (0.001), and it is therefore unnecessary to carry
commercial oil tables beyond that point.
It is quite possible that further work on American petroleums,
with greater uniformity in the methods of examination, and
especially in the time of examination after the collection of the
samples, may make it possible to classify the oils from different
localities and to take into account the slight differences that have
not been considered in the calculation of the tables of Circular 57.
It may then be possible and desirable to separate the oils into
groups, and for each group to construct a table that will be more
exact for that group than are the general tables of Circular 57.,
Page 21
Density and Expansion of Petroleum 21
It may, for example, be found desirable to have different tables
for Pennsylvania and for California oils, as it is generally believed
that California oils have a much higher rate of expansion than do
central or eastern oils. The present investigation has not shownany great difference, though the California oils have shown a
slightly higher rate of expansion.
1. SOURCES OF ERROR
The errors entering into density determinations made by the
methods described in this paper are of two kinds, namely, (a)
errors in weighing; (6) errors in temperature measurement.
In the work herein reported the magnitude of these errors is, in
general, such as to produce errors of not more than from two to
four units in the fifth decimal place of the determined densities of
the oil samples. It is very unlikely that any of the density deter-
minations are in error by more than five units in the fifth decimal
place.
The density determinations were usually made over a tempera-
ture interval of io° C, and it is therefore apparent that the result-
ing error in the rate of change of density with change of tempera-
ture can not well be more than 0.0000 1 per degree centigrade,
even if both density determinations are in error by the maximumamount and in opposite directions. Since the errors in the ob-
served densities are, on the average, as likely to occur in one
direction as in the other, and further, since the observed densities
were subjected to an adjustment by the method of least squares,
to determine the most probable density at each temperature, it is
evident that the final errors in the densities and in the rate of
change of density with change of temperature can not be very
great.
It has already been pointed out that the differences occurring
in the rate of expansion of two oils of the same density may be of
the order of two units of the fifth decimal place per degree centi-
grade, and these unavoidable differences are sufficient to render
insignificant the experimental errors in the density determinations.
It is evident, therefore, that expansion tables based on the
results contained in this paper are susceptible of an accuracy for
all petroleum oils well within the demands of observations that are
themselves reliable to one unit in the third decimal place.
Page 22
22 Technologic Papers of the Bureau of Standards
XVI. RATE OF EXPANSION OF FUEL OILS AND LUBRI-CATING OILS OF HIGH TEMPERATURES
The Bureau has several times been requested to furnish infor-
mation in regard to the rate of change of density and volume of
petroleum oils at high temperatures, especially in connection
with the calculation of volume of fuel oil at the standard tem-
perature of 60° F, from its volume measured at relatively high
temperatures when fresh from the topping plant. The informa-
tion is also desired for use in the stillroom, where specific-gravity
determinations of the different cuts must be made with as little
delay as possible. It was therefore thought advisable to makedensity determinations on certain of the oil samples at tempera-
tures considerably higher than 50 C, the upper temperature limit
of the greater part of the investigation. Accordingly, determina-
tions were made on several samples at temperatures up to 95 ° C.
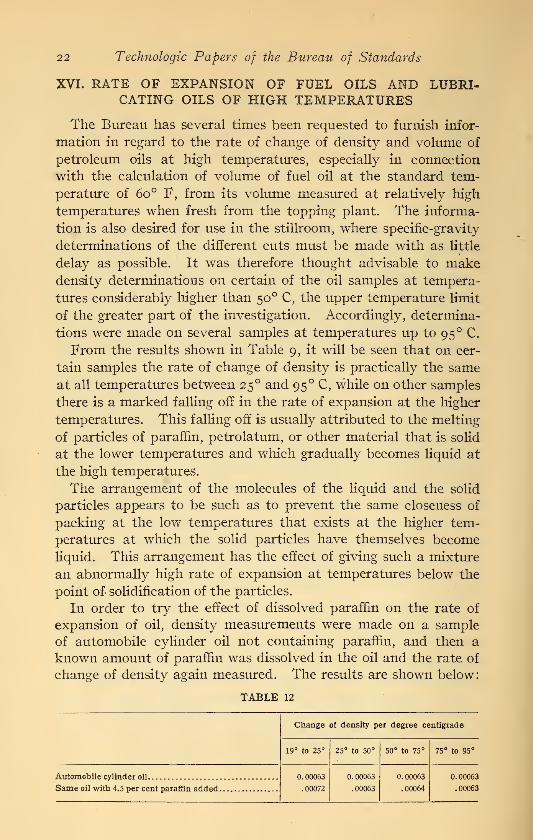
From the results shown in Table 9, it will be seen that on cer-
tain samples the rate of change of density is practically the same
at all temperatures between 25 ° and 95 ° C, while on other samples
there is a marked falling off in the rate of expansion at the higher
temperatures. This failing off is usually attributed to the melting
of particles of paraffin, petrolatum, or other material that is solid
at the lower temperatures and which gradually becomes liquid at
the high temperatures.
The arrangement of the molecules of the liquid and the solid
particles appears to be such as to prevent the same closeness of
packing at the low temperatures that exists at the higher tem-
peratures at which the solid particles have themselves become
liquid. This arrangement has the effect of giving such a mixture
an abnormally high rate of expansion at temperatures below the
point of solidification of the particles.
In order to try the effect of dissolved paraffin on the rate of
expansion of oil, density measurements were made on a sample
of automobile cylinder oil not containing paraffin, and then a
known amount of paraffin was dissolved in the oil and the rate of
change of density again measured. The results are shown below:
TABLE 12
Change of density per degree centigrade
19° to 25° 25° to 50° 50° to 75° 75° to 95°
0. 00063
.00072
0. 00063
.00063
0. 00063
.00064
0.00063
Same oil with 4.5 per cent paraffin added .00063
Page 23
Density and Expansion of Petroleum 23
It is seen that the dissolved paraffin caused a marked increase
in the rate of expansion between 19 and 25 ° C, while at the higher
temperatures the rate was not materially changed.' It is probable that if measurements had been made at lower
temperatures a still further increase in the rate of expansion
would have been found, but conditions were such that at that
time the measurements could not conveniently be carried lower.
The sample was, however, placed in a glass tube and packed in
an ice bath and its appearance noted as its temperature was
lowered. At temperatures above 25 ° C the oil was as clear as
before the paraffin was added; at about 20 C it became some-
what cloudy; and at 15 C it was very cloudy or opaque, with
a characteristic flaky appearance. At still lower temperatures it
became practically a solid vaseline-like mass with very pro-
nounced irregular fractures and transverse fissures.
The behavior of the above sample was very similar to that of
certain other samples previously examined, in which abnormally
high rates of expansion were found at the lower temperatures,
and this would seem to indicate that their high rate of expansion
was also due to the presence of dissolved substances that became
solid at low temperature.
XVII. COMPARISON OF RESULTS WITH PREVIOUS WORK
The results presented in this paper, so far as comparison can
be made, are in substantial agreement with those given by D.
Holde in his book entitled ''Examination of hydrocarbon oils,"
and that of other experimenters; for example, Hans Hofer and
Augustus H. Gill.
Since the direct object of this investigation was to obtain data
from which to calculate expansion tables for petroleum oils, the
work itself can perhaps best be judged by a consideration of these
tables. A comparison of the tables (Circular No 57, this Bureau)
with those published by the Kaiserlichen Normal Eichungs Kom-mission (Germany) in 1892 and republished in 1906 shows that
when reduced to the same basis they are in excellent agreement
throughout their entire range. Only in rare instances do the
reduced specific gravities differ by more than one unit in the third
decimal place. In most cases the two tables are in perfect agree-
ment or differ by not more than five units in the fourth decimal
place.
Page 24
24 Technologic Papers of the Bureau of Standards
Another table that is used to some extent in this country is the
Baume table published by C. J. Tagliabue in his Manual for
Inspectors of Coal Oil. It is interesting to compare this with
the new table prepared by this Bureau. (Table 2, Circular No.
57.) Such a comparison shows that for the heavier grades of
oil the agreement between the two tables is all that could be
wished. For example, with oils having observed values of 20,
30 , and 40 Baume at various temperatures, the two tables give
the following values for the degrees Baume at 60° F.
:
TABLE 13
[A= Data in this column from Bureau of Standards Circular No. 57, Table 2. B= Data in this column from
Tagliabue's Manual for Inspectors of Coal Oil, 8th ed.]
Observed values,20° Be.
Observed values,30° Be.
Observed values,40° Be.
Observed temperature, °F Degrees Baume at60° F
Degrees Baume at60° F
Degrees Baume at60° F
A B A B A B
30 21.7
21.2
20.6
20.0
19.4
18.9
18.3
17.8
17.2
21.8
21.1
20.5
20.0
19.4
18.9
18.4
17.8
a 17.3
32.0
31.4
30.7
30.0
29.3
28.7
28.0
27.4
26.8
32.2
31.4
30.7
30.0
29.3
28.6
28.0
27.3
a 26.7
42.4
41.6
40.8
40.0
39.2
38.5
37.7
37.0
36.3
42.5
40.. 41.6
50 40.8
60 40.0
70 39.2
80 38.4
90 37.6
100 36.8
no . a 36.1
a Extrapolated from 109 ° F.
For the lighter oils, however, the agreement between the two
tables is by no means as good as for the heavier oils. A compari-
son of 70 , 8o°, and 90 Baume is given in Table 14.


![A study of commercial dial micrometers for measuring the ...nvlpubs.nist.gov/nistpubs/nbstechnologic/nbstechnologicpaperT226.pdf · AmJT] CommercialDialMicrometers. 127 II.DESCRIPTIONOFINSTRUMENTS.](https://static.documents.pub/doc/80x56/5a79309f7f8b9a4a518ba557/a-study-of-commercial-dial-micrometers-for-measuring-the-commercialdialmicrometers.jpg)


![$m mi fm - NISTnvlpubs.nist.gov/nistpubs/Legacy/NSRDS/nbsnsrds28.pdfTheparticipationofT.G.Coker,F.W.Dampier,P.K.Lorenz,H.Siegenthaler, ... FFaradayConstant TTemperaturein°K ... oftheTemkinrelation[8]](https://static.documents.pub/doc/80x56/5ac385f77f8b9a57528c3245/m-mi-fm-fwdampierpklorenzhsiegenthaler-ffaradayconstant-ttemperatureink.jpg)


