76
The Buzzards Bay National Estuary Program Pocket Guide to Hydric Soils for Wetland Delineations in Massachusetts Version 2.1 The Buzzards Bay National Estuary Program November, 2014
The Buzzards Bay National Estuary Program
Pocket Guide to Hydric
Soils for Wetland
Delineations in
Massachusetts
Version 2.1
The Buzzards Bay National Estuary Program
November, 2014
This document is a compilation of material taken from Delineating Bordering
Vegetated Wetlands under the Wetlands Protection Act, published by the
Massachusetts Department of Environmental Protection, Division of Wetlands, and
Waterways and the Regional Supplement to the Corps of Engineers Wetland
Delineation Manual: Northcentral and Northeast Region (Version 2.0), published by
the U.S. Army Engineer Research and Development Center.
This document also includes excerpts from the Field Indicators of Hydric Soils in the
United States, A Guide for Identifying and Delineation Hydric Soils, Version 7.0,
including the 2013 Errata, as well as Field Indicators for Identifying Hydric Soils in
New England, 3rd ed.
This document is meant to be a companion to “The Buzzards Bay National Estuary
Program Pocket Guide to Delineating Wetlands,” available at the Buzzards Bay
National Estuary Program website, www.buzzardsbay.org.
Special thanks to Peter Fletcher for tips regarding the arrangement of the booklet.
Unless otherwise noted, photos are from the Regional Supplement to the Corps of
Engineers Wetland Delineation Manual: Northcentral and Northeast Region (Version
2.0).
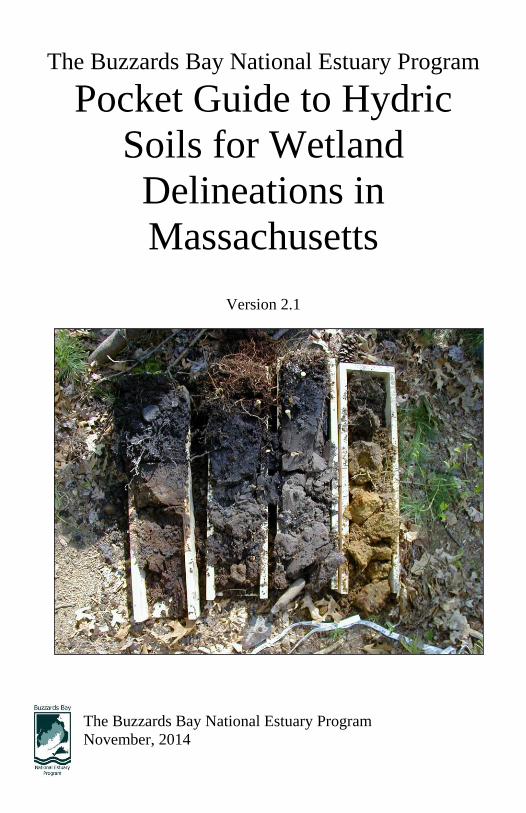
Cover photo: Soil samples from Carver. Wettest from right to left. These are
disturbed, sandy spodosols (evergreen forest soils). Notice the redoximorphic features
in all samples. Photo credit: John Rockwell.
Table of Contents
Preface ................................................................................. i
1. All Soils
Histosols ……….............................................................. 1
Histic Epipedon ............................................................... 3
Sulfidic Materials ............................................................. 4
Gleyed Matrix .................................................................. 5
Depleted Matrix................................................................ 7
Redox Depletions ............................................................13
Chroma 3 with Very Dark Surface ………………………. 17
2. Sandy Soils ................................................................... 18
Sandy Mucky Mineral ……............................................. 19
Stripped Matrix .............................................................. 20
Dark Surface ……………............................................... 21
Thin Dark Surface ......................................................... 22
Sandy with Redox & Thick, Very Dark Surface ………... 23
5cm Mucky Peat or Peat ………………………………... 24
3. Soils with evidence of Spodic Development ……...... 25
Stripped Matrix ............................................................... 27
Polyvalue below Surface ................................................ 28
Thin Dark Surface .......................................................... 29
Mesic Spodic ................................................................. 30
Other Spodosols ………………………………………….. 31
4. Unique or Specialized Indicators of Hydric Soils.
Floodplain Soils ………………………….......................... 36
A-Horizons that are Thick and Very Dark ....................... 41
Soil from Highly Colored Parent Material ....................... 48
Redox Depressions ....................................................... 55
2cm Muck ...................................................................... 56
Coast Prairie Redox ........................................................57
Very Shallow Dark Surface ............................................ 58
5. Areas Where the Hydrology has been Recently
Altered …….……………………………………………… 59
Appendices
Appendix A - MLRA Boundaries …………………………… 60 Appendix B - Thickness Criteria For Particularly Difficult Soils …………………………….…… 61 Appendix C - Spodosol Field Criteria ……………………... 63 Appendix D - Mucky Mineral Field Identification For Particularly Difficult Soils …………….…. 64 Appendix E - Redox Features- Faint vs. Distinct ……….… 65 Appendix F - ACOE Memo regarding use of “Field Indicators for Identifying Hydric Soils in New England, Version 3” …………………… 66 Appendix G – Observing and Recording Hue, Value and Chroma …………………………………... 67 Postscript: Indicators of Hydrology ……………………….... 67
i
Preface
Introduction
Since 1995, the use of Hydric Soils has been an important part of the delineation
process in wetland delineation pursuant to the M.G.L. Chapter 131, section 40,
the Massachusetts Wetlands Protection Act.
Hydric Soils are considered a confirmation of wetland hydrology as called for in
the regulatory definition of a bordering vegetated wetland, found in 310 CMR
10.55 (2)(c)., and should be part of every wetland delineation.
In disturbed sites, the presence of hydric soils is sufficient to determine that
“there are indicators of saturated or inundated conditions sufficient to support a
predominance of wetland indicator plants.”
For areas that have been recently drained, DEP has determined that “hydric soils
are often the best indicators for delineating recently drained wetlands.”
Areas where vegetation has been altered or removed - such as golf courses,
lawns, and agricultural fields - require the use of soils and other indicators of
hydrology to delineate BVW boundaries. In some cases, such as where
vegetation has been cut or removed (e.g. ongoing forestry activity), remnant
vegetation should be considered, but other indicators of hydrology also should
be used to establish the BVW boundary.
Areas where fill has been placed in wetlands require the analysis of soils directly
beneath the fill.
The DEP Wetland Delineation Manual, Delineating Bordering Vegetated
Wetlands under the Wetlands Protection Act, published by the Massachusetts
Department of Environmental Protection, Division of Wetlands and Waterways,
created a regulatory framework for assessing soils.
Page 29 of the DEP Manual lists “some hydric soil indicators.” On pages 30
and 31 of the Manual, DEP lists six soil types that are hard to analyze. In
Addition, in the first paragraph on page 30, DEP states, “In particularly difficult
cases, consultation with the Natural Resources Conservation Service is
recommended.” NRCS uses the latest federal hydric soil list. A list of these
soils can be found in the Regional Supplement to the Corps of Engineers
Wetland Delineation Manual: Northcentral and Northeast Region (Version 2.0),
ii
which is based on Field Indicators of Hydric Soils of the United States, Version
71.
Delineations by their nature take place at the transition from hydric to non-
hydric soils. So it should not be considered unusual for the delineator to
encounter problem areas.
In addition to the hydric soil morphologies found in the DEP Manual and the
Regional Supplement, practitioners should be aware that the use of Field
Indicators for Identifying Hydric Soils in New England, Version 3 is valid at
problem sites. This is further explained in a March 11, 2011 memo from Ruth
M. Ladd, Chief of the Policy Analysis and Technical Support Branch of the
New England District ACOE, which is provided in Appendix F.
Organization of Booklet
Soils are listed first by descriptive name, then by the source, and finally the
indicator (the DEP listed soils have no indicator numbers). Sources used in this
booklet are:
DEP: Delineating Bordering Vegetated Wetlands under the Wetlands Protection
Act,
ACOE: Regional Supplement to the Corps of Engineers Wetland Delineation
Manual: Northcentral and Northeast Region (Version 2.0), and
HSNE: Field Indicators for Identifying Hydric Soils in New England, Version 3
Notes Regarding the Use of the ACOE Indicators from the Regional
Supplement
Many of the ACOE hydric soil indicators were developed specifically for
wetland delineation purposes. During the development of these indicators, soils
in the interior of wetlands were not always examined; therefore, there are
wetlands that lack any of the approved hydric soil indicators in the wettest
interior portions.
Wetland delineators and other users of the these hydric soil indicators should
concentrate their sampling efforts near the wetland edge and, if these soils are
hydric, assume that soils in the wetter, interior portions of the wetland are also
hydric, even if they lack an indicator.
1 We have included information from the 2013 Errata for this booklet.
iii
ACOE hydric soil indicators are presented in three groups. Indicators for “All
Soils” are used in any soil regardless of texture. Indicators for “Sandy Soils” are
used in soil layers with USDA textures of loamy fine sand or coarser. Indicators
for “Loamy and Clayey Soils” are used with soil layers of loamy very fine sand
and finer.
Both sandy and loamy/clayey layers may be present in the same soil profile.
Therefore, a soil that contains a loamy surface layer over sand is hydric if it
meets all of the requirements of matrix color, amount and contrast of redox
concentrations, depth, and thickness for a specific A (All Soils), F (Loamy and
Clayey Soils), or S (Sandy Soils) indicator.
It is permissible to combine certain ACOE hydric soil indicators if all
requirements of the individual indicators are met except thickness (see Hydric
Soil Technical Note 4,
http://soils.usda.gov/use/hydric/ntchs/tech_notes/index.html). See Appendix B
for notes on thickness.
“All soils” refers to soils with any USDA soil texture. Use the “A” indicators
regardless of soil texture.
“Sandy soils” refers to soil materials with a USDA soil texture of loamy fine
sand and coarser. Use the “S” indicators in soil layers consisting of sandy soil
materials.
“Loamy and clayey soils” refers to soil materials with USDA textures of loamy
very fine sand and finer. Use the “F” indicators in soil layers consisting of
loamy or clayey soil materials
All mineral layers above any of the layers meeting an A, S, or F indicator must
have a dominant chroma of 2 or less, or the layer(s) with a dominant chroma of
more than 2 must be less than 6 in. thick, except for indicators S6, F8, F12, and
F21 to meet any hydric soil indicator. Nodules and concretions are not
considered to be redox concentrations unless otherwise noted.
Notes regarding the use of Field Indicators for Hydric Soils in New
England, Version 3
In problem areas it is permissible to use soil morphologies described in Field
Indicators for Hydric Soils in New England, Version 3, (See memo from Ruth
iv
Ladd in Appendix F). This is particularly useful in areas with red soil materials
and in areas with soil exhibiting some spodic development.
Some of the more common technical terms used in the HSNE soils are provided
below:
A or Ap Horizon, Dark – A or Ap horizon that has moist colors with chromas
2 or less and values 3 or less.
A or Ap Horizon, Very Dark – A or Ap horizon that has moist colors with
chromas 2 or less and values less than 3.
Thick, A and Ap Horizons – For the purposes of the HSNE soils, thick means
greater than 10 inches and less than or equal to 15 inches.
Very Thick, A and Ap Horizons – For the purposes of the HSNE soils, very
thick means greater than 15 inches (38 cm).
Final Notes
Some of these soil morphologies should not be considered conclusive evidence
of saturated or inundated conditions without an independent confirmation of
hydrology. There soils are so noted in the BBNEP Notes.
A list of wetland hydrology indicators can be found in the Postscript on page
67.
For basic information on the use of soils in wetland delineation see “The
Buzzards Bay National Estuary Program Pocket Guide to Delineating
Wetlands.”
1
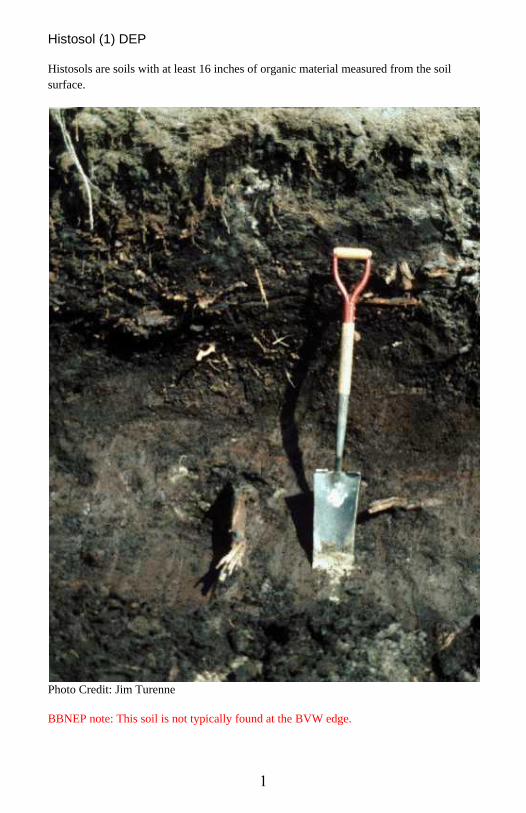
Histosol (1) DEP Histosols are soils with at least 16 inches of organic material measured from the soil
surface.
Photo Credit: Jim Turenne
BBNEP note: This soil is not typically found at the BVW edge.
2
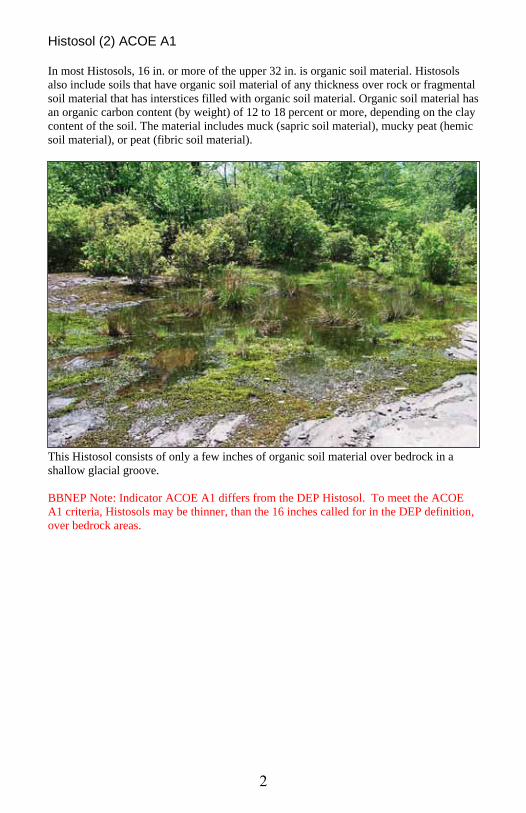
Histosol (2) ACOE A1 In most Histosols, 16 in. or more of the upper 32 in. is organic soil material. Histosols
also include soils that have organic soil material of any thickness over rock or fragmental
soil material that has interstices filled with organic soil material. Organic soil material has
an organic carbon content (by weight) of 12 to 18 percent or more, depending on the clay
content of the soil. The material includes muck (sapric soil material), mucky peat (hemic
soil material), or peat (fibric soil material).
This Histosol consists of only a few inches of organic soil material over bedrock in a
shallow glacial groove.
BBNEP Note: Indicator ACOE A1 differs from the DEP Histosol. To meet the ACOE
A1 criteria, Histosols may be thinner, than the 16 inches called for in the DEP definition,
over bedrock areas.
3
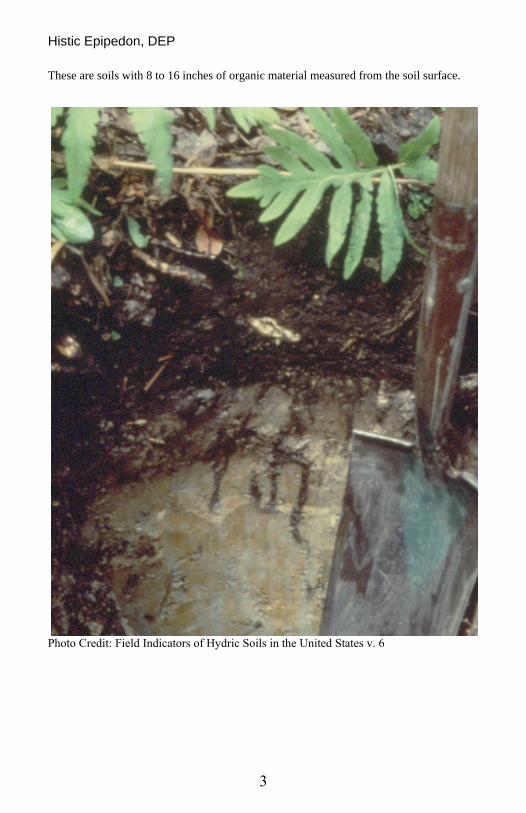
Histic Epipedon, DEP
These are soils with 8 to 16 inches of organic material measured from the soil surface.
Photo Credit: Field Indicators of Hydric Soils in the United States v. 6
4
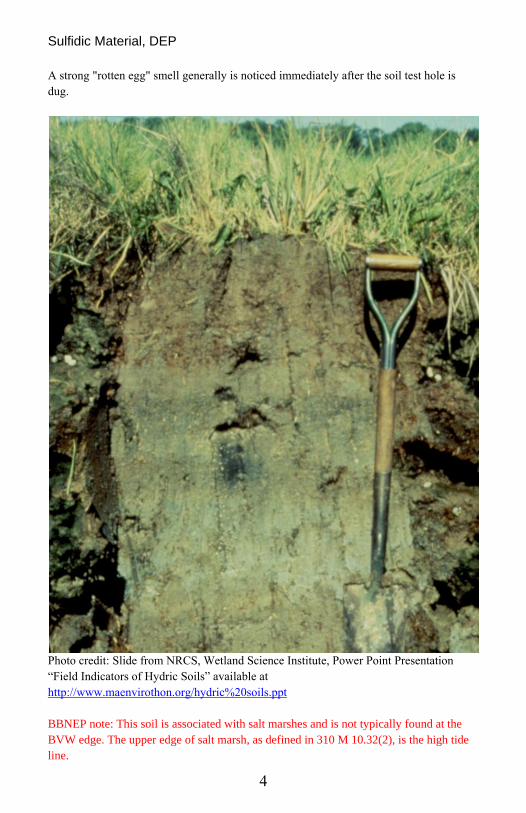
Sulfidic Material, DEP
A strong "rotten egg" smell generally is noticed immediately after the soil test hole is
dug.
Photo credit: Slide from NRCS, Wetland Science Institute, Power Point Presentation
“Field Indicators of Hydric Soils” available at
http://www.maenvirothon.org/hydric%20soils.ppt
BBNEP note: This soil is associated with salt marshes and is not typically found at the
BVW edge. The upper edge of salt marsh, as defined in 310 M 10.32(2), is the high tide
line.
5
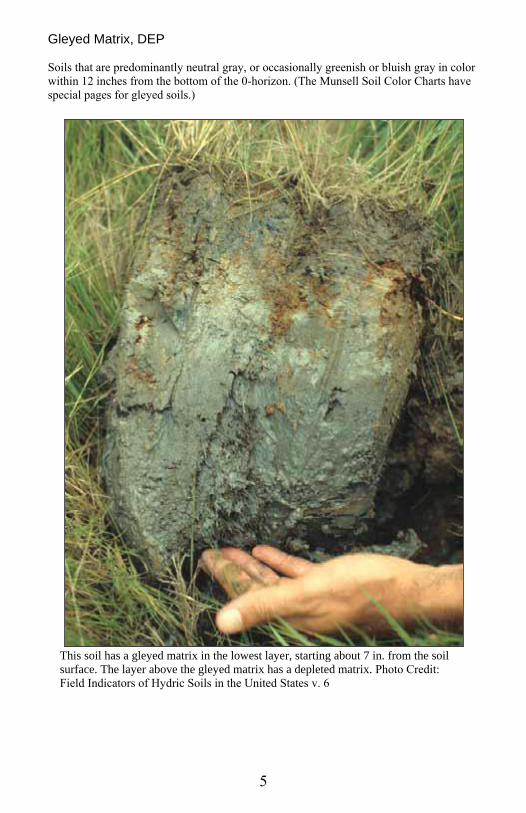
Gleyed Matrix, DEP
Soils that are predominantly neutral gray, or occasionally greenish or bluish gray in color
within 12 inches from the bottom of the 0-horizon. (The Munsell Soil Color Charts have
special pages for gleyed soils.)
This soil has a gleyed matrix in the lowest layer, starting about 7 in. from the soil
surface. The layer above the gleyed matrix has a depleted matrix. Photo Credit:
Field Indicators of Hydric Soils in the United States v. 6
6
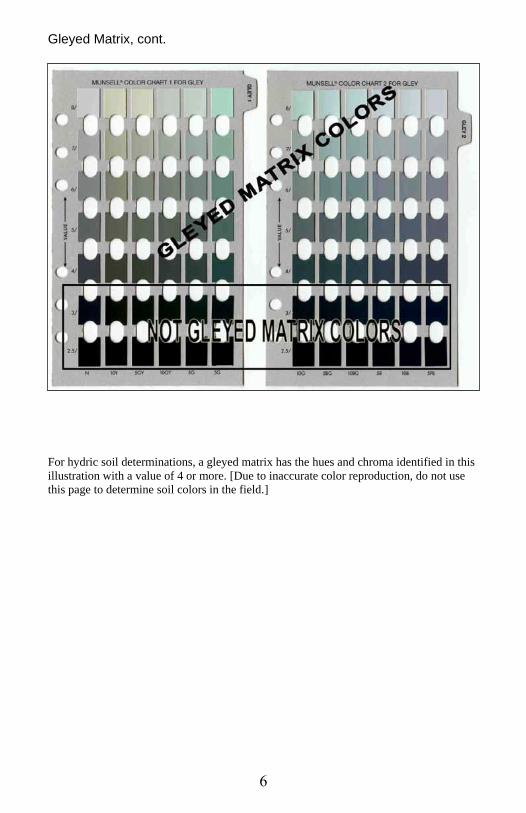
Gleyed Matrix, cont.
For hydric soil determinations, a gleyed matrix has the hues and chroma identified in this
illustration with a value of 4 or more. [Due to inaccurate color reproduction, do not use
this page to determine soil colors in the field.]
7
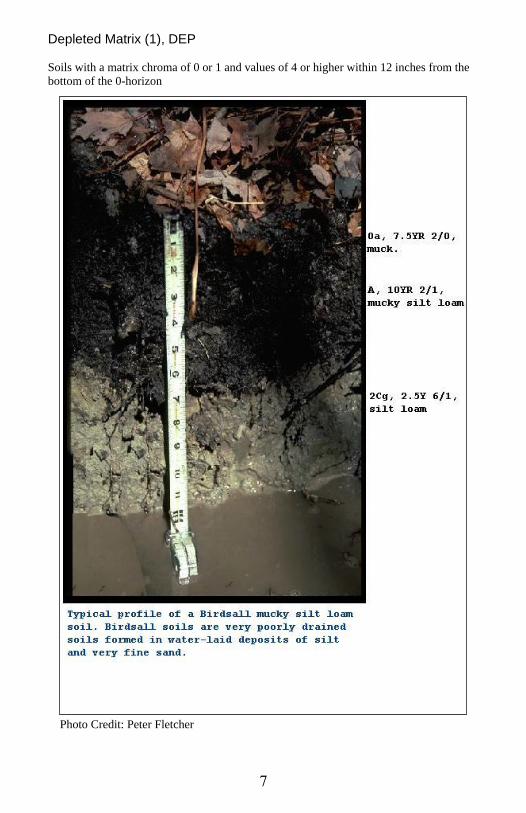
Depleted Matrix (1), DEP
Soils with a matrix chroma of 0 or 1 and values of 4 or higher within 12 inches from the
bottom of the 0-horizon
Photo Credit: Peter Fletcher
8
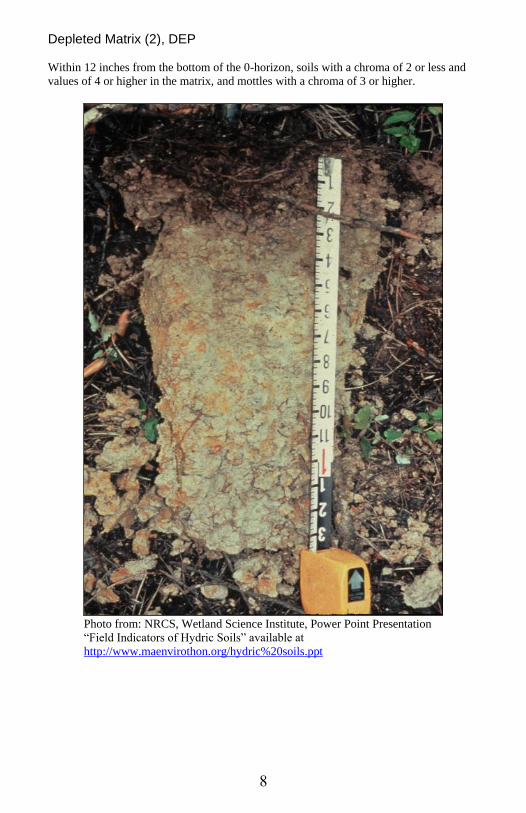
Depleted Matrix (2), DEP
Within 12 inches from the bottom of the 0-horizon, soils with a chroma of 2 or less and
values of 4 or higher in the matrix, and mottles with a chroma of 3 or higher.
Photo from: NRCS, Wetland Science Institute, Power Point Presentation
“Field Indicators of Hydric Soils” available at
http://www.maenvirothon.org/hydric%20soils.ppt
9
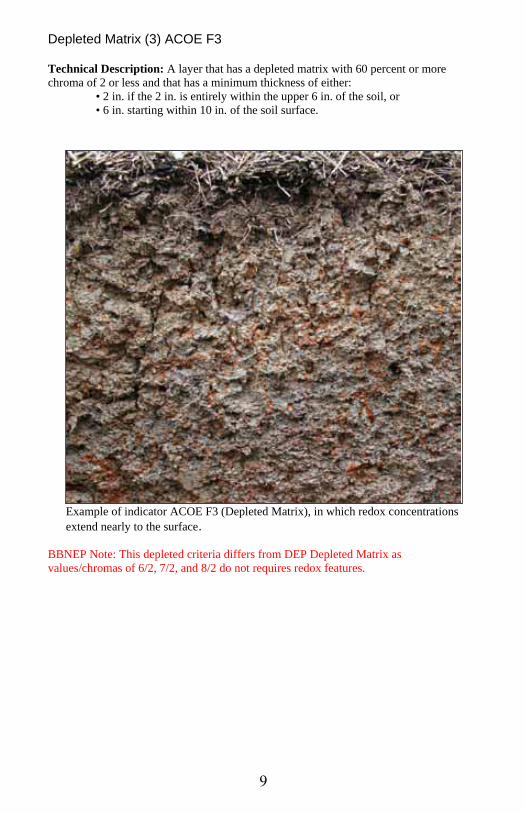
Depleted Matrix (3) ACOE F3 Technical Description: A layer that has a depleted matrix with 60 percent or more
chroma of 2 or less and that has a minimum thickness of either:
• 2 in. if the 2 in. is entirely within the upper 6 in. of the soil, or
• 6 in. starting within 10 in. of the soil surface.
Example of indicator ACOE F3 (Depleted Matrix), in which redox concentrations
extend nearly to the surface.
BBNEP Note: This depleted criteria differs from DEP Depleted Matrix as
values/chromas of 6/2, 7/2, and 8/2 do not requires redox features.
10
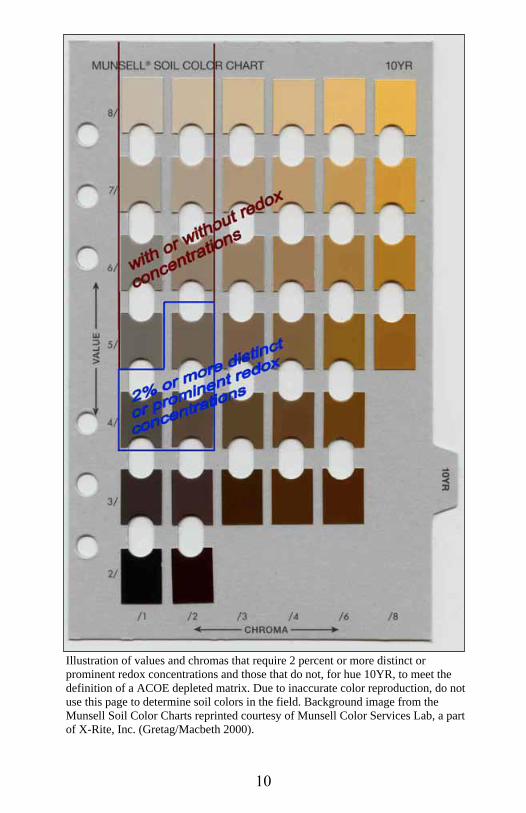
Illustration of values and chromas that require 2 percent or more distinct or
prominent redox concentrations and those that do not, for hue 10YR, to meet the
definition of a ACOE depleted matrix. Due to inaccurate color reproduction, do not
use this page to determine soil colors in the field. Background image from the
Munsell Soil Color Charts reprinted courtesy of Munsell Color Services Lab, a part
of X-Rite, Inc. (Gretag/Macbeth 2000).
11
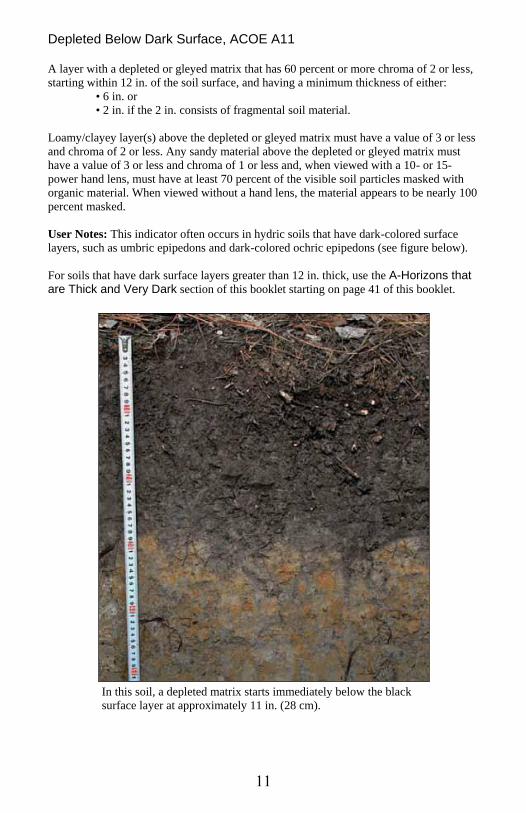
Depleted Below Dark Surface, ACOE A11 A layer with a depleted or gleyed matrix that has 60 percent or more chroma of 2 or less,
starting within 12 in. of the soil surface, and having a minimum thickness of either:
• 6 in. or
• 2 in. if the 2 in. consists of fragmental soil material.
Loamy/clayey layer(s) above the depleted or gleyed matrix must have a value of 3 or less
and chroma of 2 or less. Any sandy material above the depleted or gleyed matrix must
have a value of 3 or less and chroma of 1 or less and, when viewed with a 10- or 15-
power hand lens, must have at least 70 percent of the visible soil particles masked with
organic material. When viewed without a hand lens, the material appears to be nearly 100
percent masked.
User Notes: This indicator often occurs in hydric soils that have dark-colored surface
layers, such as umbric epipedons and dark-colored ochric epipedons (see figure below).
For soils that have dark surface layers greater than 12 in. thick, use the A-Horizons that are Thick and Very Dark section of this booklet starting on page 41 of this booklet.
In this soil, a depleted matrix starts immediately below the black
surface layer at approximately 11 in. (28 cm).
12
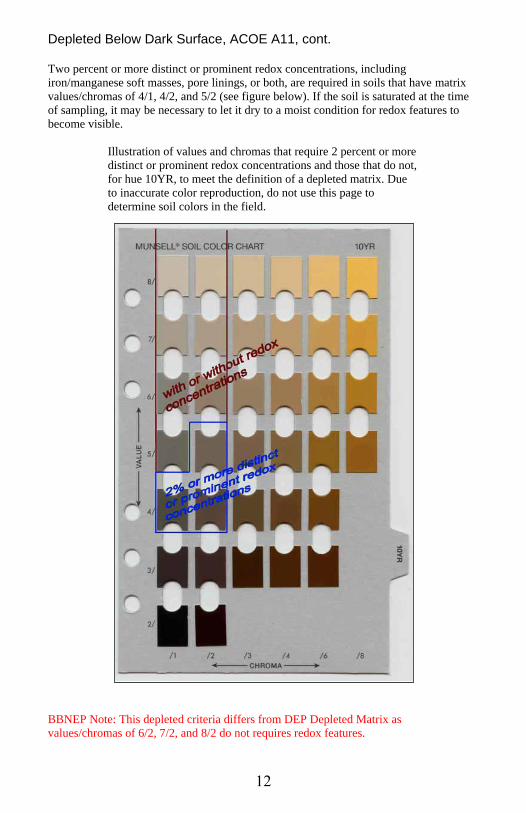
Depleted Below Dark Surface, ACOE A11, cont. Two percent or more distinct or prominent redox concentrations, including
iron/manganese soft masses, pore linings, or both, are required in soils that have matrix
values/chromas of 4/1, 4/2, and 5/2 (see figure below). If the soil is saturated at the time
of sampling, it may be necessary to let it dry to a moist condition for redox features to
become visible.
Illustration of values and chromas that require 2 percent or more
distinct or prominent redox concentrations and those that do not,
for hue 10YR, to meet the definition of a depleted matrix. Due
to inaccurate color reproduction, do not use this page to
determine soil colors in the field.
BBNEP Note: This depleted criteria differs from DEP Depleted Matrix as
values/chromas of 6/2, 7/2, and 8/2 do not requires redox features.
13
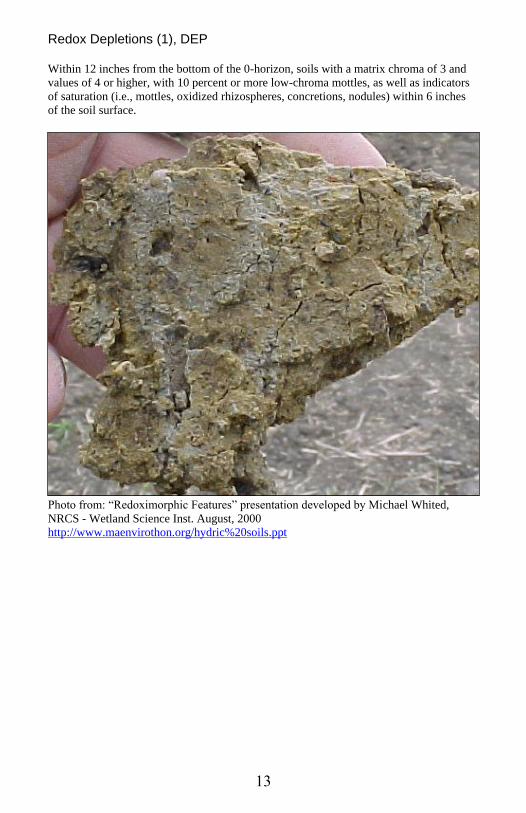
Redox Depletions (1), DEP Within 12 inches from the bottom of the 0-horizon, soils with a matrix chroma of 3 and
values of 4 or higher, with 10 percent or more low-chroma mottles, as well as indicators
of saturation (i.e., mottles, oxidized rhizospheres, concretions, nodules) within 6 inches
of the soil surface.
Photo from: “Redoximorphic Features” presentation developed by Michael Whited,
NRCS - Wetland Science Inst. August, 2000
http://www.maenvirothon.org/hydric%20soils.ppt
14
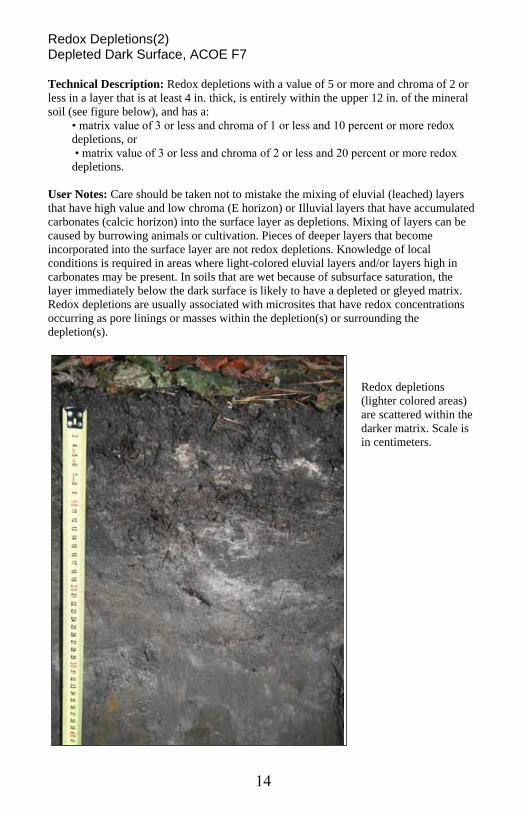
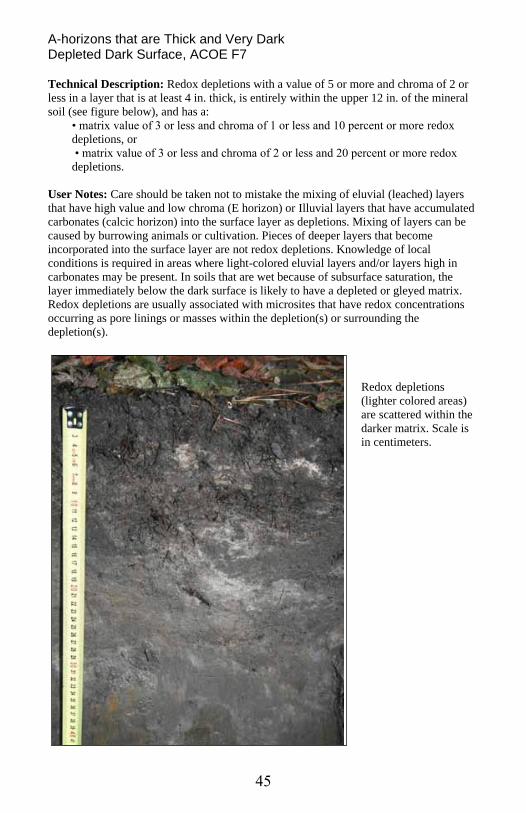
Redox Depletions(2) Depleted Dark Surface, ACOE F7 Technical Description: Redox depletions with a value of 5 or more and chroma of 2 or
less in a layer that is at least 4 in. thick, is entirely within the upper 12 in. of the mineral
soil (see figure below), and has a:
• matrix value of 3 or less and chroma of 1 or less and 10 percent or more redox
depletions, or
• matrix value of 3 or less and chroma of 2 or less and 20 percent or more redox
depletions.
User Notes: Care should be taken not to mistake the mixing of eluvial (leached) layers
that have high value and low chroma (E horizon) or Illuvial layers that have accumulated
carbonates (calcic horizon) into the surface layer as depletions. Mixing of layers can be
caused by burrowing animals or cultivation. Pieces of deeper layers that become
incorporated into the surface layer are not redox depletions. Knowledge of local
conditions is required in areas where light-colored eluvial layers and/or layers high in
carbonates may be present. In soils that are wet because of subsurface saturation, the
layer immediately below the dark surface is likely to have a depleted or gleyed matrix.
Redox depletions are usually associated with microsites that have redox concentrations
occurring as pore linings or masses within the depletion(s) or surrounding the
depletion(s).
Redox depletions
(lighter colored areas)
are scattered within the
darker matrix. Scale is
in centimeters.
15
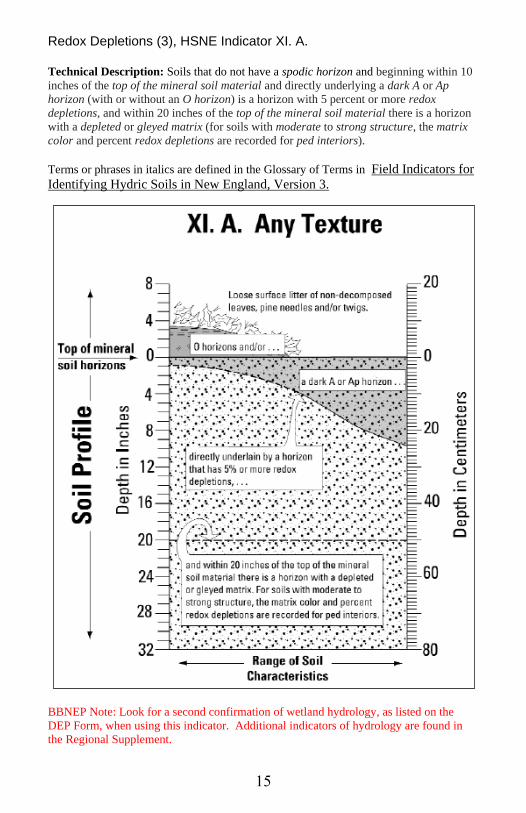
Redox Depletions (3), HSNE Indicator XI. A.
Technical Description: Soils that do not have a spodic horizon and beginning within 10
inches of the top of the mineral soil material and directly underlying a dark A or Ap
horizon (with or without an O horizon) is a horizon with 5 percent or more redox
depletions, and within 20 inches of the top of the mineral soil material there is a horizon
with a depleted or gleyed matrix (for soils with moderate to strong structure, the matrix
color and percent redox depletions are recorded for ped interiors).
Terms or phrases in italics are defined in the Glossary of Terms in Field Indicators for
Identifying Hydric Soils in New England, Version 3.
BBNEP Note: Look for a second confirmation of wetland hydrology, as listed on the
DEP Form, when using this indicator. Additional indicators of hydrology are found in
the Regional Supplement.
16
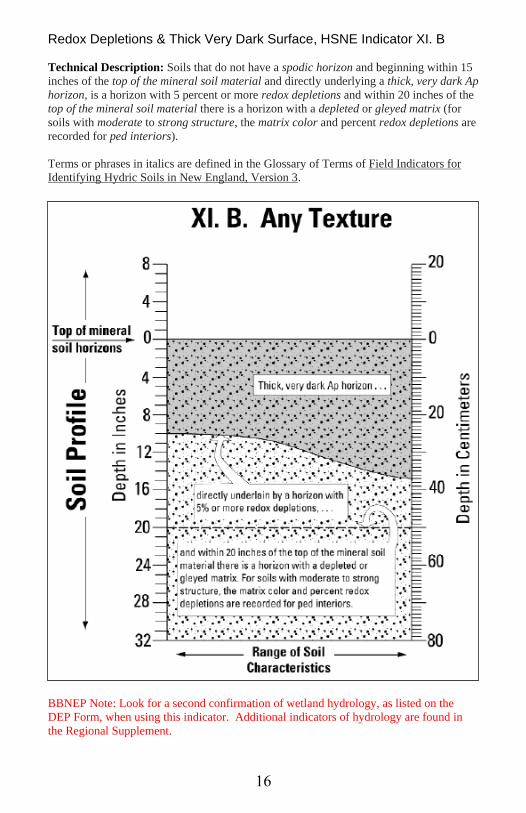
Redox Depletions & Thick Very Dark Surface, HSNE Indicator XI. B
Technical Description: Soils that do not have a spodic horizon and beginning within 15
inches of the top of the mineral soil material and directly underlying a thick, very dark Ap
horizon, is a horizon with 5 percent or more redox depletions and within 20 inches of the
top of the mineral soil material there is a horizon with a depleted or gleyed matrix (for
soils with moderate to strong structure, the matrix color and percent redox depletions are
recorded for ped interiors).
Terms or phrases in italics are defined in the Glossary of Terms of Field Indicators for
Identifying Hydric Soils in New England, Version 3.
BBNEP Note: Look for a second confirmation of wetland hydrology, as listed on the
DEP Form, when using this indicator. Additional indicators of hydrology are found in
the Regional Supplement.
17
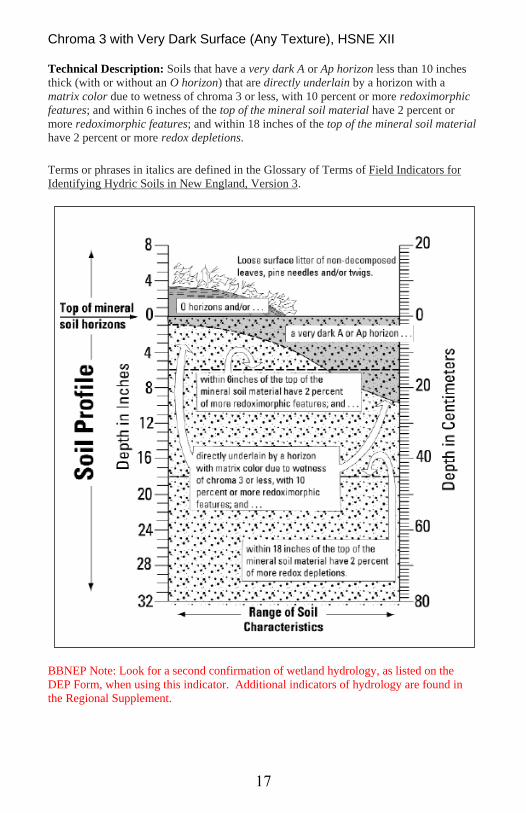
Chroma 3 with Very Dark Surface (Any Texture), HSNE XII Technical Description: Soils that have a very dark A or Ap horizon less than 10 inches
thick (with or without an O horizon) that are directly underlain by a horizon with a
matrix color due to wetness of chroma 3 or less, with 10 percent or more redoximorphic
features; and within 6 inches of the top of the mineral soil material have 2 percent or
more redoximorphic features; and within 18 inches of the top of the mineral soil material
have 2 percent or more redox depletions.
Terms or phrases in italics are defined in the Glossary of Terms of Field Indicators for
Identifying Hydric Soils in New England, Version 3.
BBNEP Note: Look for a second confirmation of wetland hydrology, as listed on the
DEP Form, when using this indicator. Additional indicators of hydrology are found in
the Regional Supplement.
18
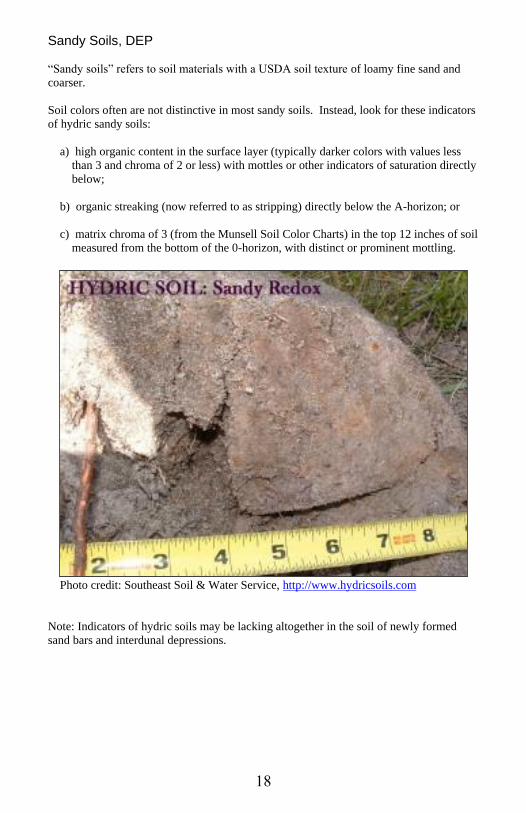
Sandy Soils, DEP
“Sandy soils” refers to soil materials with a USDA soil texture of loamy fine sand and
coarser.
Soil colors often are not distinctive in most sandy soils. Instead, look for these indicators
of hydric sandy soils:
a) high organic content in the surface layer (typically darker colors with values less
than 3 and chroma of 2 or less) with mottles or other indicators of saturation directly
below;
b) organic streaking (now referred to as stripping) directly below the A-horizon; or
c) matrix chroma of 3 (from the Munsell Soil Color Charts) in the top 12 inches of soil
measured from the bottom of the 0-horizon, with distinct or prominent mottling.
Photo credit: Southeast Soil & Water Service, http://www.hydricsoils.com
Note: Indicators of hydric soils may be lacking altogether in the soil of newly formed
sand bars and interdunal depressions.
19
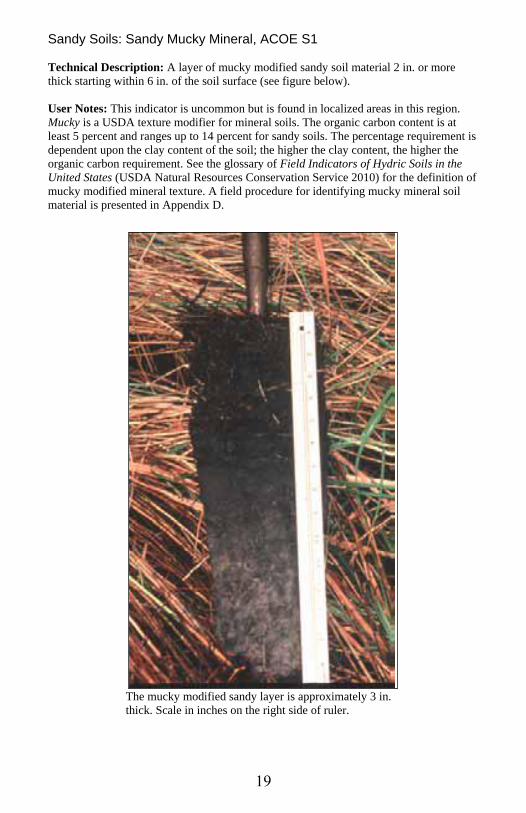
Sandy Soils: Sandy Mucky Mineral, ACOE S1
Technical Description: A layer of mucky modified sandy soil material 2 in. or more
thick starting within 6 in. of the soil surface (see figure below).
User Notes: This indicator is uncommon but is found in localized areas in this region.
Mucky is a USDA texture modifier for mineral soils. The organic carbon content is at
least 5 percent and ranges up to 14 percent for sandy soils. The percentage requirement is
dependent upon the clay content of the soil; the higher the clay content, the higher the
organic carbon requirement. See the glossary of Field Indicators of Hydric Soils in the
United States (USDA Natural Resources Conservation Service 2010) for the definition of
mucky modified mineral texture. A field procedure for identifying mucky mineral soil
material is presented in Appendix D.
The mucky modified sandy layer is approximately 3 in.
thick. Scale in inches on the right side of ruler.
20
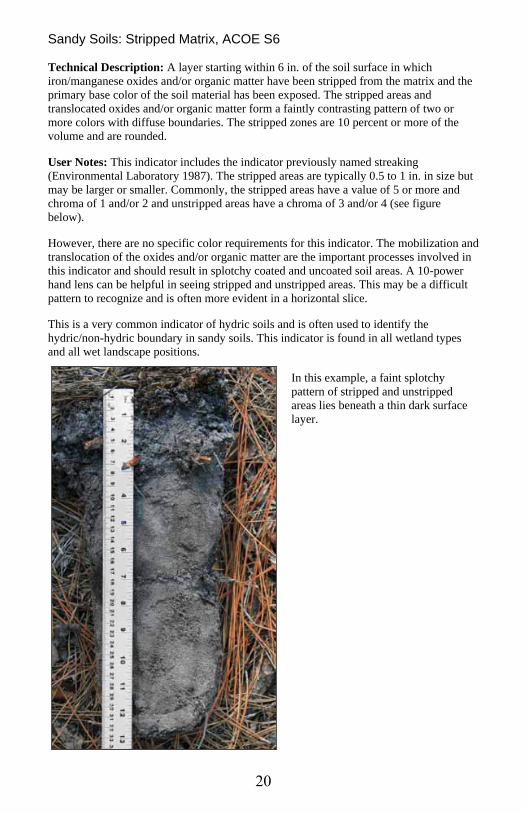
Sandy Soils: Stripped Matrix, ACOE S6
Technical Description: A layer starting within 6 in. of the soil surface in which
iron/manganese oxides and/or organic matter have been stripped from the matrix and the
primary base color of the soil material has been exposed. The stripped areas and
translocated oxides and/or organic matter form a faintly contrasting pattern of two or
more colors with diffuse boundaries. The stripped zones are 10 percent or more of the
volume and are rounded.
User Notes: This indicator includes the indicator previously named streaking
(Environmental Laboratory 1987). The stripped areas are typically 0.5 to 1 in. in size but
may be larger or smaller. Commonly, the stripped areas have a value of 5 or more and
chroma of 1 and/or 2 and unstripped areas have a chroma of 3 and/or 4 (see figure
below).
However, there are no specific color requirements for this indicator. The mobilization and
translocation of the oxides and/or organic matter are the important processes involved in
this indicator and should result in splotchy coated and uncoated soil areas. A 10-power
hand lens can be helpful in seeing stripped and unstripped areas. This may be a difficult
pattern to recognize and is often more evident in a horizontal slice.
This is a very common indicator of hydric soils and is often used to identify the
hydric/non-hydric boundary in sandy soils. This indicator is found in all wetland types
and all wet landscape positions.
In this example, a faint splotchy
pattern of stripped and unstripped
areas lies beneath a thin dark surface
layer.
21
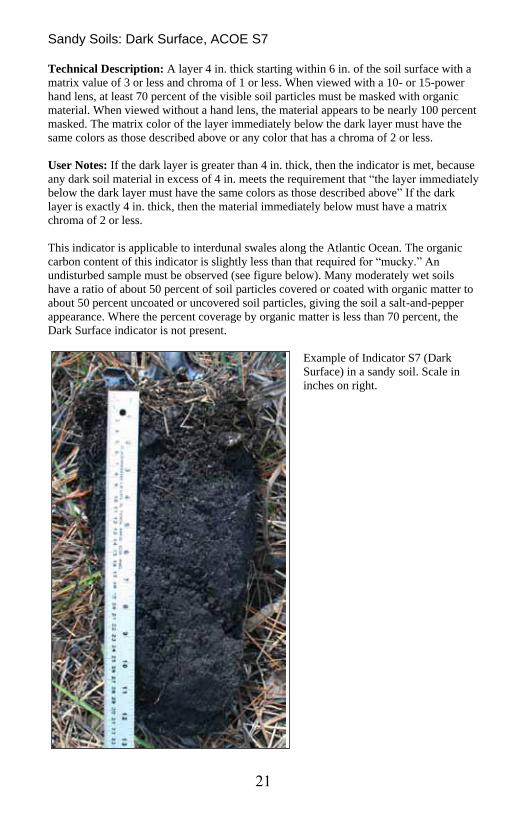
Sandy Soils: Dark Surface, ACOE S7 Technical Description: A layer 4 in. thick starting within 6 in. of the soil surface with a
matrix value of 3 or less and chroma of 1 or less. When viewed with a 10- or 15-power
hand lens, at least 70 percent of the visible soil particles must be masked with organic
material. When viewed without a hand lens, the material appears to be nearly 100 percent
masked. The matrix color of the layer immediately below the dark layer must have the
same colors as those described above or any color that has a chroma of 2 or less.
User Notes: If the dark layer is greater than 4 in. thick, then the indicator is met, because
any dark soil material in excess of 4 in. meets the requirement that “the layer immediately
below the dark layer must have the same colors as those described above” If the dark
layer is exactly 4 in. thick, then the material immediately below must have a matrix
chroma of 2 or less.
This indicator is applicable to interdunal swales along the Atlantic Ocean. The organic
carbon content of this indicator is slightly less than that required for “mucky.” An
undisturbed sample must be observed (see figure below). Many moderately wet soils
have a ratio of about 50 percent of soil particles covered or coated with organic matter to
about 50 percent uncoated or uncovered soil particles, giving the soil a salt-and-pepper
appearance. Where the percent coverage by organic matter is less than 70 percent, the
Dark Surface indicator is not present.
Example of Indicator S7 (Dark
Surface) in a sandy soil. Scale in
inches on right.
22
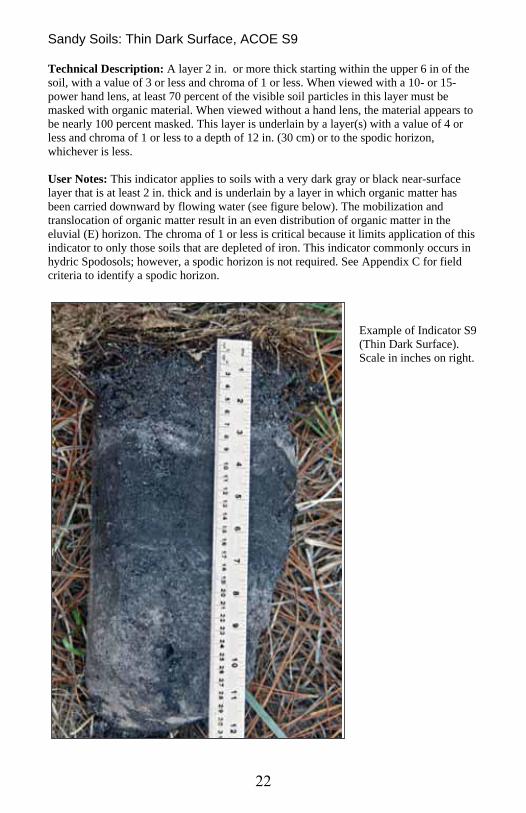
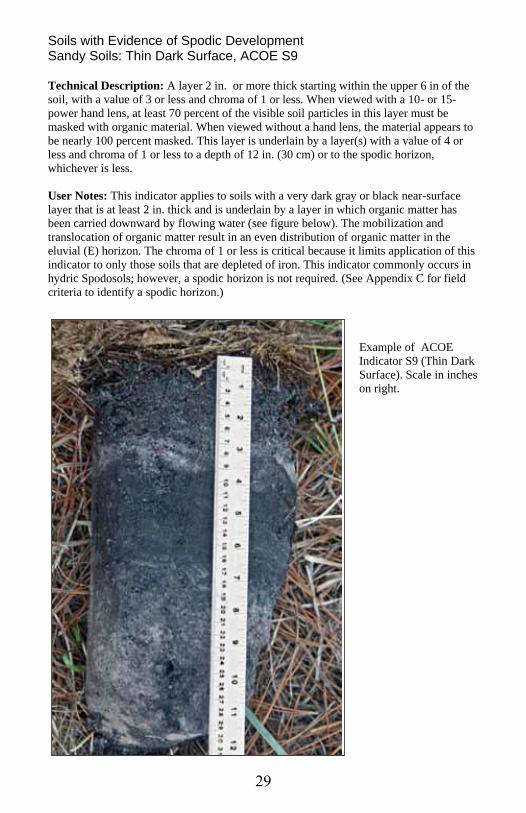
Sandy Soils: Thin Dark Surface, ACOE S9 Technical Description: A layer 2 in. or more thick starting within the upper 6 in of the
soil, with a value of 3 or less and chroma of 1 or less. When viewed with a 10- or 15-
power hand lens, at least 70 percent of the visible soil particles in this layer must be
masked with organic material. When viewed without a hand lens, the material appears to
be nearly 100 percent masked. This layer is underlain by a layer(s) with a value of 4 or
less and chroma of 1 or less to a depth of 12 in. (30 cm) or to the spodic horizon,
whichever is less.
User Notes: This indicator applies to soils with a very dark gray or black near-surface
layer that is at least 2 in. thick and is underlain by a layer in which organic matter has
been carried downward by flowing water (see figure below). The mobilization and
translocation of organic matter result in an even distribution of organic matter in the
eluvial (E) horizon. The chroma of 1 or less is critical because it limits application of this
indicator to only those soils that are depleted of iron. This indicator commonly occurs in
hydric Spodosols; however, a spodic horizon is not required. See Appendix C for field
criteria to identify a spodic horizon.
Example of Indicator S9
(Thin Dark Surface).
Scale in inches on right.
23
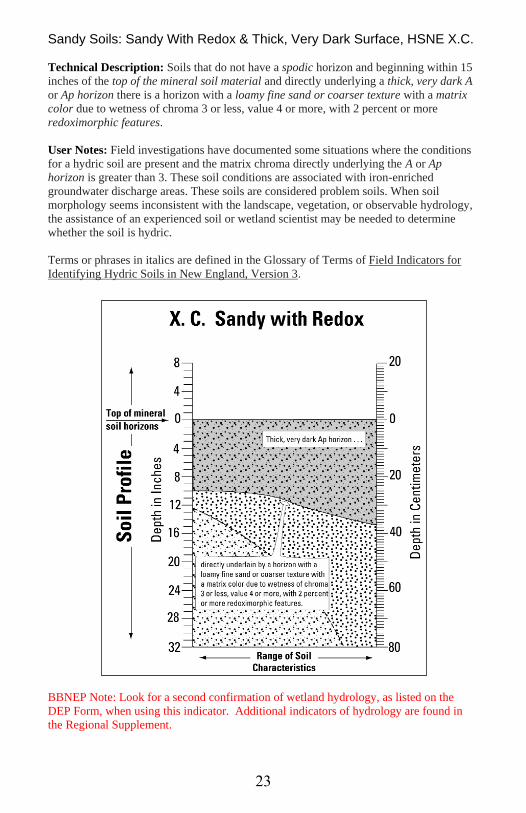
Sandy Soils: Sandy With Redox & Thick, Very Dark Surface, HSNE X.C.
Technical Description: Soils that do not have a spodic horizon and beginning within 15
inches of the top of the mineral soil material and directly underlying a thick, very dark A
or Ap horizon there is a horizon with a loamy fine sand or coarser texture with a matrix
color due to wetness of chroma 3 or less, value 4 or more, with 2 percent or more
redoximorphic features.
User Notes: Field investigations have documented some situations where the conditions
for a hydric soil are present and the matrix chroma directly underlying the A or Ap
horizon is greater than 3. These soil conditions are associated with iron-enriched
groundwater discharge areas. These soils are considered problem soils. When soil
morphology seems inconsistent with the landscape, vegetation, or observable hydrology,
the assistance of an experienced soil or wetland scientist may be needed to determine
whether the soil is hydric.
Terms or phrases in italics are defined in the Glossary of Terms of Field Indicators for
Identifying Hydric Soils in New England, Version 3.
BBNEP Note: Look for a second confirmation of wetland hydrology, as listed on the
DEP Form, when using this indicator. Additional indicators of hydrology are found in
the Regional Supplement.
24
Sandy Soils: 5 cm Mucky Peat or Peat, ACOE S3 Technical Description: A layer of mucky peat or peat 2 in. or more thick with a value of
3 or less and chroma of 2 or less, starting within 6 in. of the soil surface, and underlain by
sandy soil material.
Applicable Subregions: not in the Long Island/Cape Cod Subregion (MLRA 149B of
LRR S).
User Notes: In this region, this indicator is applicable primarily to interdunal swales
along the Great Lakes and Atlantic coast. Mucky peat (hemic soil material) and peat
(fibric soil material) have at least 12 to 18 percent organic carbon. Organic soil material
is called peat if virtually all of the plant remains are sufficiently intact to permit
identification of plant remains. Mucky peat is an intermediate stage of decomposition
between peat and highly decomposed muck. See the glossary of Field Indicators of
Hydric Soils in the United States (USDA Natural Resources Conservation Service 2010)
for definitions. See the Concepts section of the Regional Supplement for field methods to
identify organic soil materials.
BBNEP Note: Look for a second confirmation of wetland hydrology, as listed on the
DEP Form, when using this indicator. Additional indicators of hydrology are found in
the Regional Supplement.
25
Soils with Evidence of Spodic Development Evergreen Forest Soils, DEP Sandy soils on Cape Cod and other areas may possess gray colored E-horizons just
beneath the surface. These colors are not necessarily the result of saturation or
inundation, but form as a result of the leaching of organic material and aluminum and
iron oxides by organic acids. These soils are called spodosols and the gray layer that
forms below the surface is known as the E-horizon. Organic material and aluminum and
iron oxides are deposited in a layer below the E-horizon called the spodic horizon.
Hydric indicators in spodosols include a combination of two or more of the following
features, with one occurring within the upper 12 inches of the soil surface and others
documented below the soil surface:
a) a thick, black, sandy surface layer;
b) organic streaking (now referred to as stripping) in the E-horizon;
c) mottles within the E-horizon;
d) oxidized rhizospheres within the A or E-horizon;
e) iron concretions/nodules within the E-horizon or spodic horizon;
f) a partially or wholly cemented spodic horizon usually within 18 inches of the
surface measured from the bottom of the 0-horizon; and mottling within the spodic
horizon.
Non-hydric spodosols can be recognized by brightly colored soil material below the E-
horizon and without mottles or other indicators of saturation.
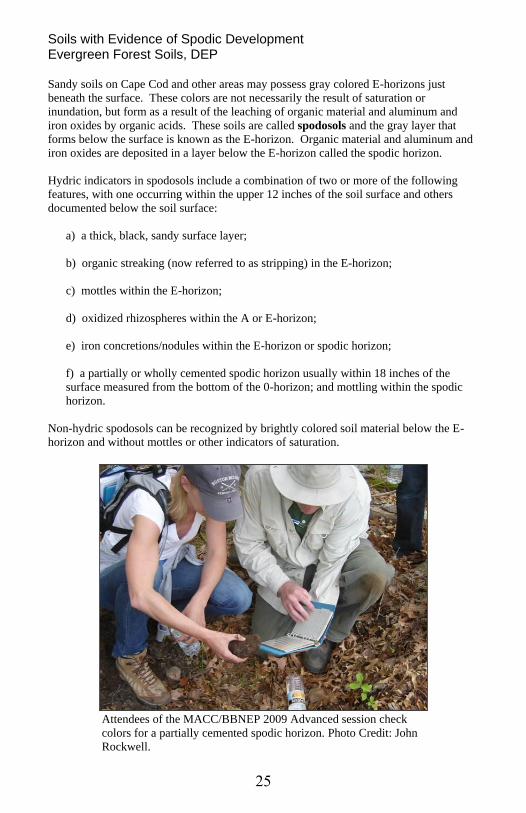
Attendees of the MACC/BBNEP 2009 Advanced session check
colors for a partially cemented spodic horizon. Photo Credit: John
Rockwell.
26
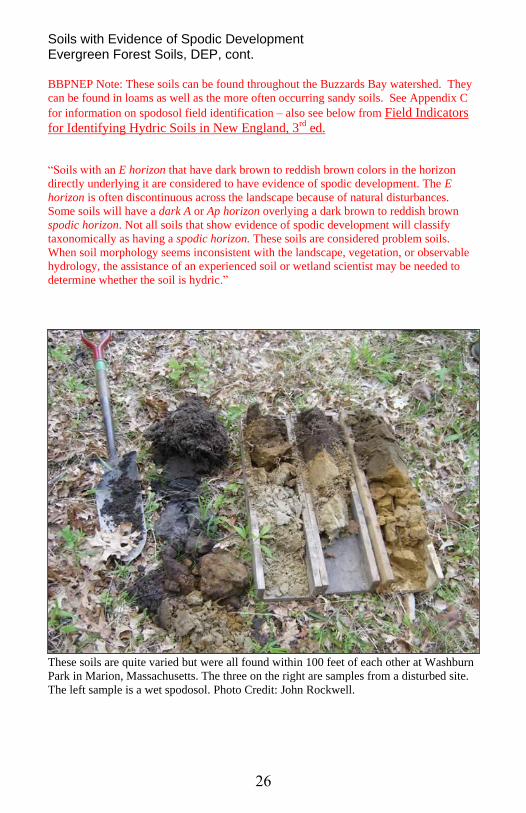
Soils with Evidence of Spodic Development Evergreen Forest Soils, DEP, cont. BBPNEP Note: These soils can be found throughout the Buzzards Bay watershed. They
can be found in loams as well as the more often occurring sandy soils. See Appendix C
for information on spodosol field identification – also see below from Field Indicators
for Identifying Hydric Soils in New England, 3rd ed.
“Soils with an E horizon that have dark brown to reddish brown colors in the horizon
directly underlying it are considered to have evidence of spodic development. The E
horizon is often discontinuous across the landscape because of natural disturbances.
Some soils will have a dark A or Ap horizon overlying a dark brown to reddish brown
spodic horizon. Not all soils that show evidence of spodic development will classify
taxonomically as having a spodic horizon. These soils are considered problem soils.
When soil morphology seems inconsistent with the landscape, vegetation, or observable
hydrology, the assistance of an experienced soil or wetland scientist may be needed to
determine whether the soil is hydric.”
These soils are quite varied but were all found within 100 feet of each other at Washburn
Park in Marion, Massachusetts. The three on the right are samples from a disturbed site.
The left sample is a wet spodosol. Photo Credit: John Rockwell.
27
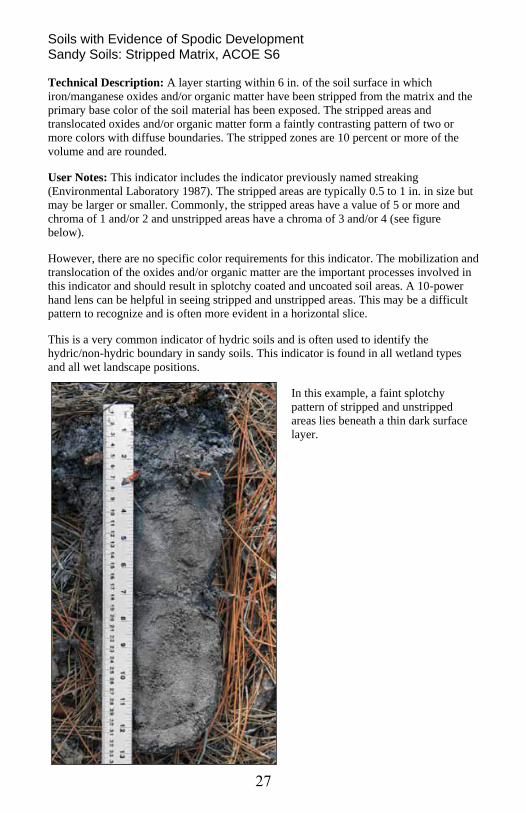
Soils with Evidence of Spodic Development Sandy Soils: Stripped Matrix, ACOE S6
Technical Description: A layer starting within 6 in. of the soil surface in which
iron/manganese oxides and/or organic matter have been stripped from the matrix and the
primary base color of the soil material has been exposed. The stripped areas and
translocated oxides and/or organic matter form a faintly contrasting pattern of two or
more colors with diffuse boundaries. The stripped zones are 10 percent or more of the
volume and are rounded.
User Notes: This indicator includes the indicator previously named streaking
(Environmental Laboratory 1987). The stripped areas are typically 0.5 to 1 in. in size but
may be larger or smaller. Commonly, the stripped areas have a value of 5 or more and
chroma of 1 and/or 2 and unstripped areas have a chroma of 3 and/or 4 (see figure
below).
However, there are no specific color requirements for this indicator. The mobilization and
translocation of the oxides and/or organic matter are the important processes involved in
this indicator and should result in splotchy coated and uncoated soil areas. A 10-power
hand lens can be helpful in seeing stripped and unstripped areas. This may be a difficult
pattern to recognize and is often more evident in a horizontal slice.
This is a very common indicator of hydric soils and is often used to identify the
hydric/non-hydric boundary in sandy soils. This indicator is found in all wetland types
and all wet landscape positions.
In this example, a faint splotchy
pattern of stripped and unstripped
areas lies beneath a thin dark surface
layer.
28
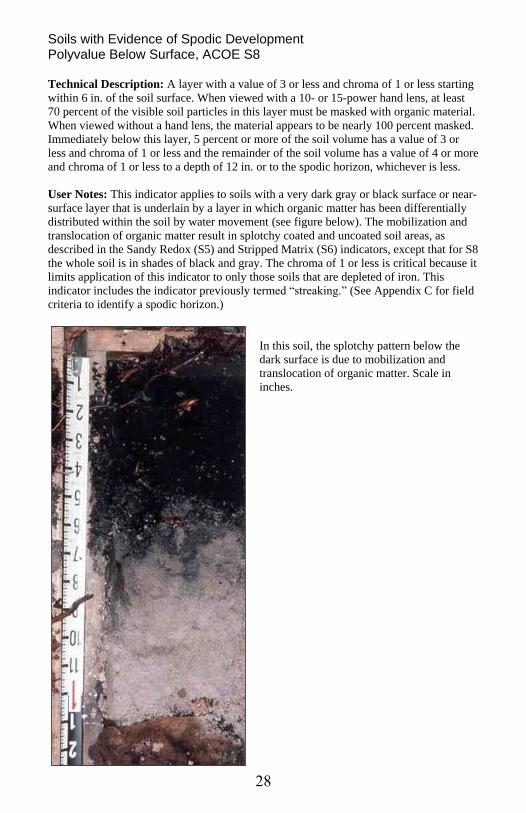
Soils with Evidence of Spodic Development Polyvalue Below Surface, ACOE S8 Technical Description: A layer with a value of 3 or less and chroma of 1 or less starting
within 6 in. of the soil surface. When viewed with a 10- or 15-power hand lens, at least
70 percent of the visible soil particles in this layer must be masked with organic material.
When viewed without a hand lens, the material appears to be nearly 100 percent masked.
Immediately below this layer, 5 percent or more of the soil volume has a value of 3 or
less and chroma of 1 or less and the remainder of the soil volume has a value of 4 or more
and chroma of 1 or less to a depth of 12 in. or to the spodic horizon, whichever is less.
User Notes: This indicator applies to soils with a very dark gray or black surface or near-
surface layer that is underlain by a layer in which organic matter has been differentially
distributed within the soil by water movement (see figure below). The mobilization and
translocation of organic matter result in splotchy coated and uncoated soil areas, as
described in the Sandy Redox (S5) and Stripped Matrix (S6) indicators, except that for S8
the whole soil is in shades of black and gray. The chroma of 1 or less is critical because it
limits application of this indicator to only those soils that are depleted of iron. This
indicator includes the indicator previously termed “streaking.” (See Appendix C for field
criteria to identify a spodic horizon.)
In this soil, the splotchy pattern below the
dark surface is due to mobilization and
translocation of organic matter. Scale in
inches.
29
Soils with Evidence of Spodic Development Sandy Soils: Thin Dark Surface, ACOE S9 Technical Description: A layer 2 in. or more thick starting within the upper 6 in of the
soil, with a value of 3 or less and chroma of 1 or less. When viewed with a 10- or 15-
power hand lens, at least 70 percent of the visible soil particles in this layer must be
masked with organic material. When viewed without a hand lens, the material appears to
be nearly 100 percent masked. This layer is underlain by a layer(s) with a value of 4 or
less and chroma of 1 or less to a depth of 12 in. (30 cm) or to the spodic horizon,
whichever is less.
User Notes: This indicator applies to soils with a very dark gray or black near-surface
layer that is at least 2 in. thick and is underlain by a layer in which organic matter has
been carried downward by flowing water (see figure below). The mobilization and
translocation of organic matter result in an even distribution of organic matter in the
eluvial (E) horizon. The chroma of 1 or less is critical because it limits application of this
indicator to only those soils that are depleted of iron. This indicator commonly occurs in
hydric Spodosols; however, a spodic horizon is not required. (See Appendix C for field
criteria to identify a spodic horizon.)
Example of ACOE
Indicator S9 (Thin Dark
Surface). Scale in inches
on right.
30
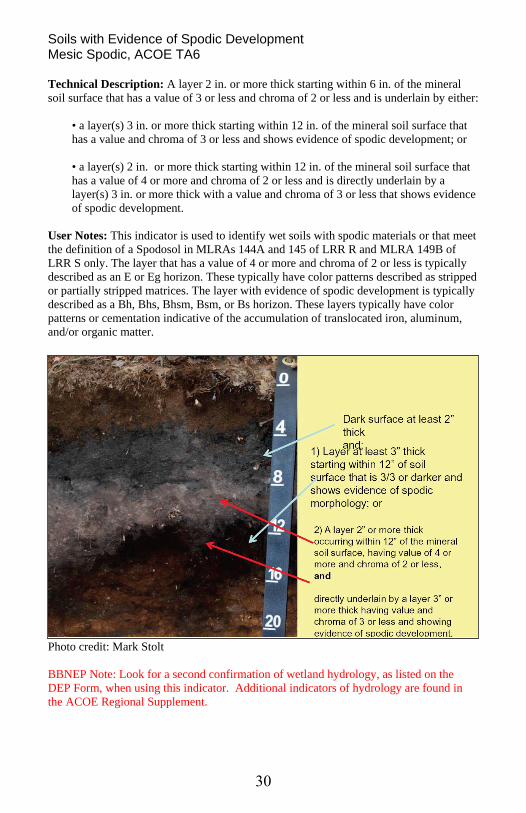
Soils with Evidence of Spodic Development Mesic Spodic, ACOE TA6 Technical Description: A layer 2 in. or more thick starting within 6 in. of the mineral
soil surface that has a value of 3 or less and chroma of 2 or less and is underlain by either:
• a layer(s) 3 in. or more thick starting within 12 in. of the mineral soil surface that
has a value and chroma of 3 or less and shows evidence of spodic development; or
• a layer(s) 2 in. or more thick starting within 12 in. of the mineral soil surface that
has a value of 4 or more and chroma of 2 or less and is directly underlain by a
layer(s) 3 in. or more thick with a value and chroma of 3 or less that shows evidence
of spodic development.
User Notes: This indicator is used to identify wet soils with spodic materials or that meet
the definition of a Spodosol in MLRAs 144A and 145 of LRR R and MLRA 149B of
LRR S only. The layer that has a value of 4 or more and chroma of 2 or less is typically
described as an E or Eg horizon. These typically have color patterns described as stripped
or partially stripped matrices. The layer with evidence of spodic development is typically
described as a Bh, Bhs, Bhsm, Bsm, or Bs horizon. These layers typically have color
patterns or cementation indicative of the accumulation of translocated iron, aluminum,
and/or organic matter.
Photo credit: Mark Stolt
BBNEP Note: Look for a second confirmation of wetland hydrology, as listed on the
DEP Form, when using this indicator. Additional indicators of hydrology are found in
the ACOE Regional Supplement.
31
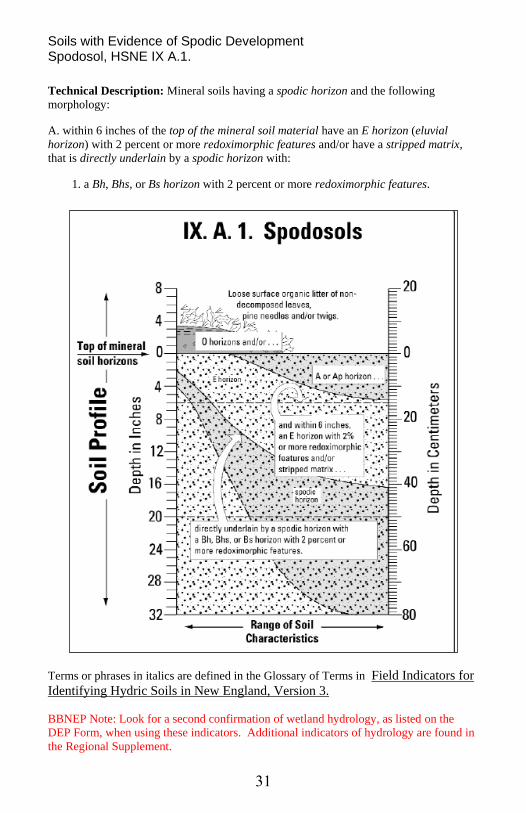
Soils with Evidence of Spodic Development Spodosol, HSNE IX A.1.
Technical Description: Mineral soils having a spodic horizon and the following
morphology:
A. within 6 inches of the top of the mineral soil material have an E horizon (eluvial
horizon) with 2 percent or more redoximorphic features and/or have a stripped matrix,
that is directly underlain by a spodic horizon with:
1. a Bh, Bhs, or Bs horizon with 2 percent or more redoximorphic features.
Terms or phrases in italics are defined in the Glossary of Terms in Field Indicators for
Identifying Hydric Soils in New England, Version 3.
BBNEP Note: Look for a second confirmation of wetland hydrology, as listed on the
DEP Form, when using these indicators. Additional indicators of hydrology are found in
the Regional Supplement.
32
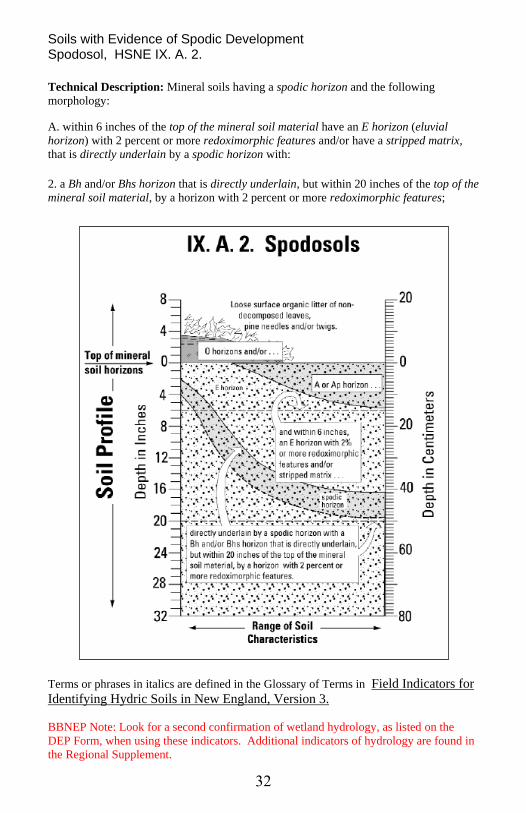
Soils with Evidence of Spodic Development Spodosol, HSNE IX. A. 2.
Technical Description: Mineral soils having a spodic horizon and the following
morphology:
A. within 6 inches of the top of the mineral soil material have an E horizon (eluvial
horizon) with 2 percent or more redoximorphic features and/or have a stripped matrix,
that is directly underlain by a spodic horizon with:
2. a Bh and/or Bhs horizon that is directly underlain, but within 20 inches of the top of the
mineral soil material, by a horizon with 2 percent or more redoximorphic features;
Terms or phrases in italics are defined in the Glossary of Terms in Field Indicators for
Identifying Hydric Soils in New England, Version 3.
BBNEP Note: Look for a second confirmation of wetland hydrology, as listed on the
DEP Form, when using these indicators. Additional indicators of hydrology are found in
the Regional Supplement.
33
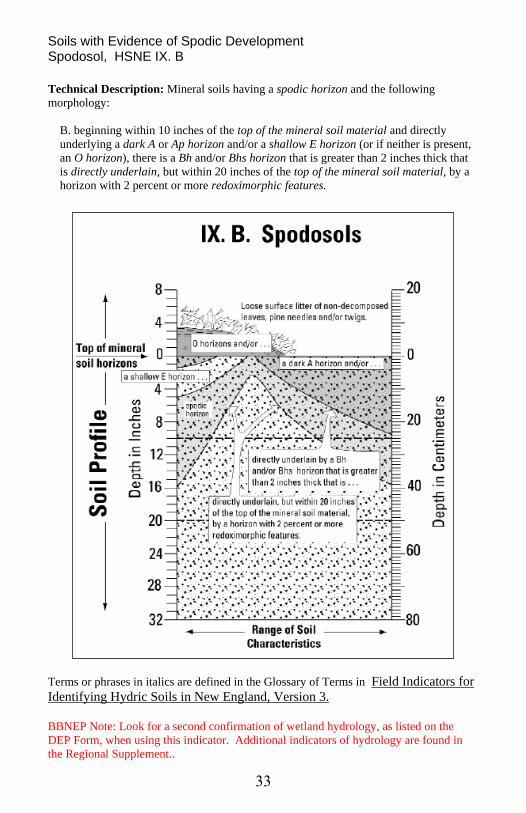
Soils with Evidence of Spodic Development Spodosol, HSNE IX. B
Technical Description: Mineral soils having a spodic horizon and the following
morphology:
B. beginning within 10 inches of the top of the mineral soil material and directly
underlying a dark A or Ap horizon and/or a shallow E horizon (or if neither is present,
an O horizon), there is a Bh and/or Bhs horizon that is greater than 2 inches thick that
is directly underlain, but within 20 inches of the top of the mineral soil material, by a
horizon with 2 percent or more redoximorphic features.
Terms or phrases in italics are defined in the Glossary of Terms in Field Indicators for
Identifying Hydric Soils in New England, Version 3.
BBNEP Note: Look for a second confirmation of wetland hydrology, as listed on the
DEP Form, when using this indicator. Additional indicators of hydrology are found in
the Regional Supplement..
34
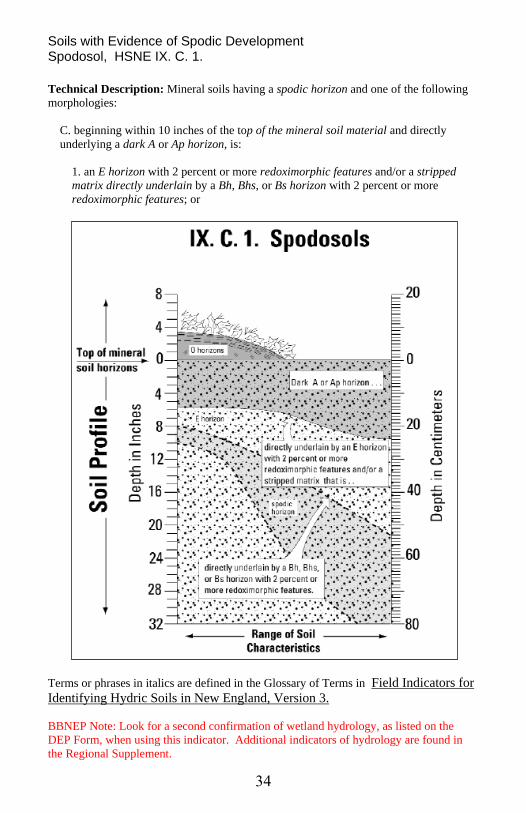
Soils with Evidence of Spodic Development Spodosol, HSNE IX. C. 1.
Technical Description: Mineral soils having a spodic horizon and one of the following
morphologies:
C. beginning within 10 inches of the top of the mineral soil material and directly
underlying a dark A or Ap horizon, is:
1. an E horizon with 2 percent or more redoximorphic features and/or a stripped
matrix directly underlain by a Bh, Bhs, or Bs horizon with 2 percent or more
redoximorphic features; or
36
Terms or phrases in italics are defined in the Glossary of Terms in Field Indicators for
Identifying Hydric Soils in New England, Version 3.
BBNEP Note: Look for a second confirmation of wetland hydrology, as listed on the
DEP Form, when using this indicator. Additional indicators of hydrology are found in
the Regional Supplement.
35
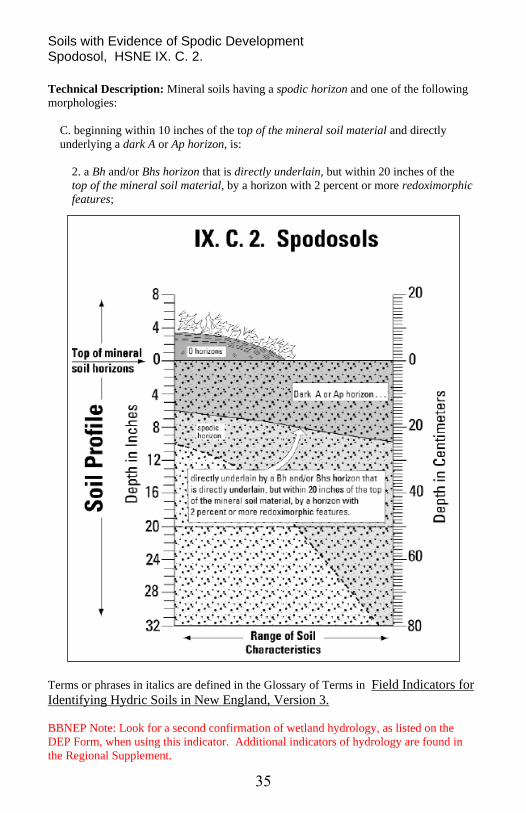
Soils with Evidence of Spodic Development Spodosol, HSNE IX. C. 2.
Technical Description: Mineral soils having a spodic horizon and one of the following
morphologies:
C. beginning within 10 inches of the top of the mineral soil material and directly
underlying a dark A or Ap horizon, is:
2. a Bh and/or Bhs horizon that is directly underlain, but within 20 inches of the
top of the mineral soil material, by a horizon with 2 percent or more redoximorphic
features;
Terms or phrases in italics are defined in the Glossary of Terms in Field Indicators for
Identifying Hydric Soils in New England, Version 3.
BBNEP Note: Look for a second confirmation of wetland hydrology, as listed on the
DEP Form, when using this indicator. Additional indicators of hydrology are found in
the Regional Supplement.
36
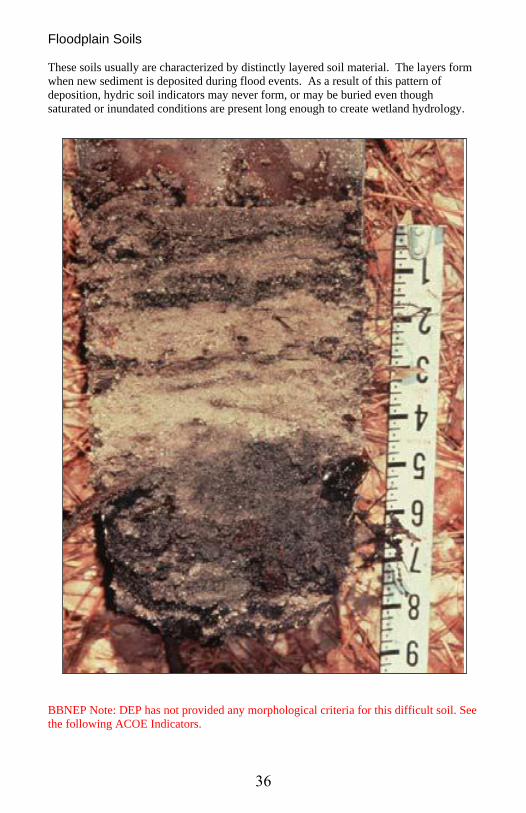
Floodplain Soils
These soils usually are characterized by distinctly layered soil material. The layers form
when new sediment is deposited during flood events. As a result of this pattern of
deposition, hydric soil indicators may never form, or may be buried even though
saturated or inundated conditions are present long enough to create wetland hydrology.
BBNEP Note: DEP has not provided any morphological criteria for this difficult soil. See
the following ACOE Indicators.
37
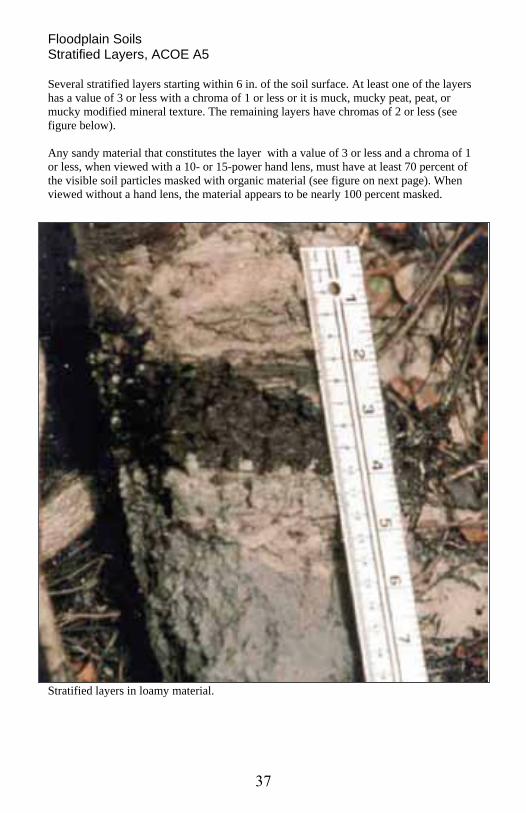
Floodplain Soils Stratified Layers, ACOE A5 Several stratified layers starting within 6 in. of the soil surface. At least one of the layers
has a value of 3 or less with a chroma of 1 or less or it is muck, mucky peat, peat, or
mucky modified mineral texture. The remaining layers have chromas of 2 or less (see
figure below).
Any sandy material that constitutes the layer with a value of 3 or less and a chroma of 1
or less, when viewed with a 10- or 15-power hand lens, must have at least 70 percent of
the visible soil particles masked with organic material (see figure on next page). When
viewed without a hand lens, the material appears to be nearly 100 percent masked.
Stratified layers in loamy material.
38
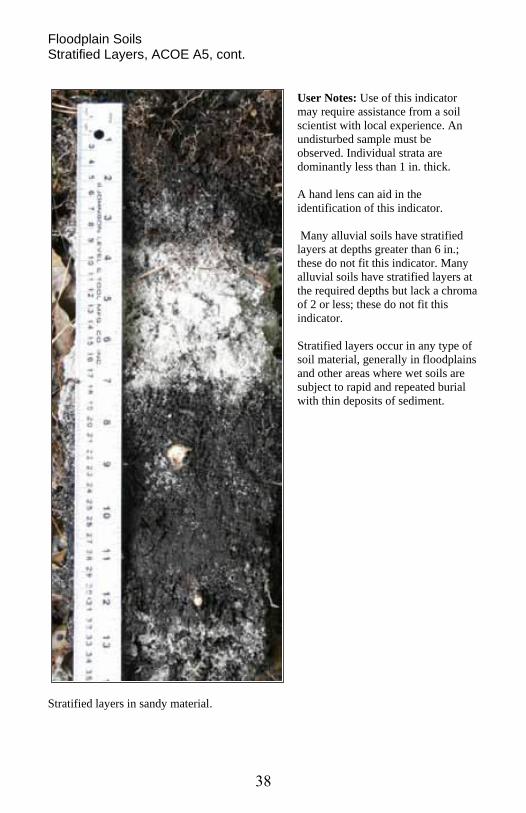
Floodplain Soils Stratified Layers, ACOE A5, cont.
User Notes: Use of this indicator
may require assistance from a soil
scientist with local experience. An
undisturbed sample must be
observed. Individual strata are
dominantly less than 1 in. thick.
A hand lens can aid in the
identification of this indicator.
Many alluvial soils have stratified
layers at depths greater than 6 in.;
these do not fit this indicator. Many
alluvial soils have stratified layers at
the required depths but lack a chroma
of 2 or less; these do not fit this
indicator.
Stratified layers occur in any type of
soil material, generally in floodplains
and other areas where wet soils are
subject to rapid and repeated burial
with thin deposits of sediment.
Stratified layers in sandy material.
39
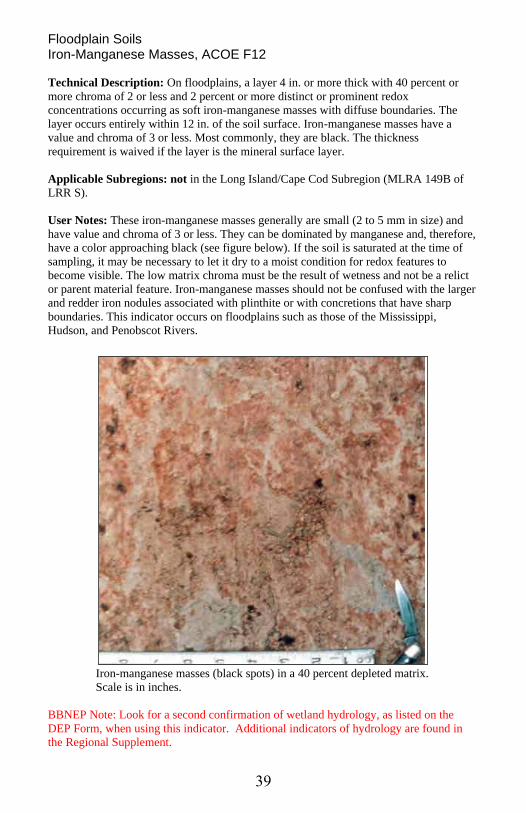
Floodplain Soils Iron-Manganese Masses, ACOE F12
Technical Description: On floodplains, a layer 4 in. or more thick with 40 percent or
more chroma of 2 or less and 2 percent or more distinct or prominent redox
concentrations occurring as soft iron-manganese masses with diffuse boundaries. The
layer occurs entirely within 12 in. of the soil surface. Iron-manganese masses have a
value and chroma of 3 or less. Most commonly, they are black. The thickness
requirement is waived if the layer is the mineral surface layer.
Applicable Subregions: not in the Long Island/Cape Cod Subregion (MLRA 149B of
LRR S).
User Notes: These iron-manganese masses generally are small (2 to 5 mm in size) and
have value and chroma of 3 or less. They can be dominated by manganese and, therefore,
have a color approaching black (see figure below). If the soil is saturated at the time of
sampling, it may be necessary to let it dry to a moist condition for redox features to
become visible. The low matrix chroma must be the result of wetness and not be a relict
or parent material feature. Iron-manganese masses should not be confused with the larger
and redder iron nodules associated with plinthite or with concretions that have sharp
boundaries. This indicator occurs on floodplains such as those of the Mississippi,
Hudson, and Penobscot Rivers.
Iron-manganese masses (black spots) in a 40 percent depleted matrix.
Scale is in inches.
BBNEP Note: Look for a second confirmation of wetland hydrology, as listed on the
DEP Form, when using this indicator. Additional indicators of hydrology are found in
the Regional Supplement.
40
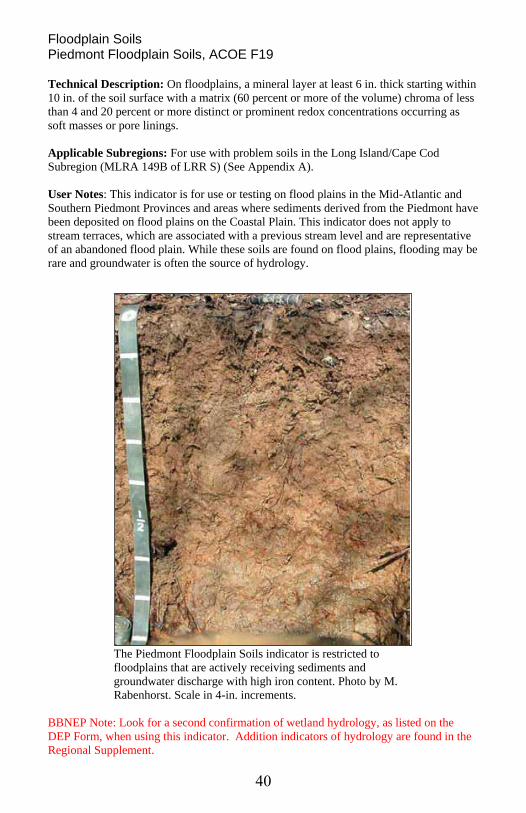
Floodplain Soils Piedmont Floodplain Soils, ACOE F19 Technical Description: On floodplains, a mineral layer at least 6 in. thick starting within
10 in. of the soil surface with a matrix (60 percent or more of the volume) chroma of less
than 4 and 20 percent or more distinct or prominent redox concentrations occurring as
soft masses or pore linings.
Applicable Subregions: For use with problem soils in the Long Island/Cape Cod
Subregion (MLRA 149B of LRR S) (See Appendix A).
User Notes: This indicator is for use or testing on flood plains in the Mid-Atlantic and
Southern Piedmont Provinces and areas where sediments derived from the Piedmont have
been deposited on flood plains on the Coastal Plain. This indicator does not apply to
stream terraces, which are associated with a previous stream level and are representative
of an abandoned flood plain. While these soils are found on flood plains, flooding may be
rare and groundwater is often the source of hydrology.
The Piedmont Floodplain Soils indicator is restricted to
floodplains that are actively receiving sediments and
groundwater discharge with high iron content. Photo by M.
Rabenhorst. Scale in 4-in. increments.
BBNEP Note: Look for a second confirmation of wetland hydrology, as listed on the
DEP Form, when using this indicator. Addition indicators of hydrology are found in the
Regional Supplement.
41
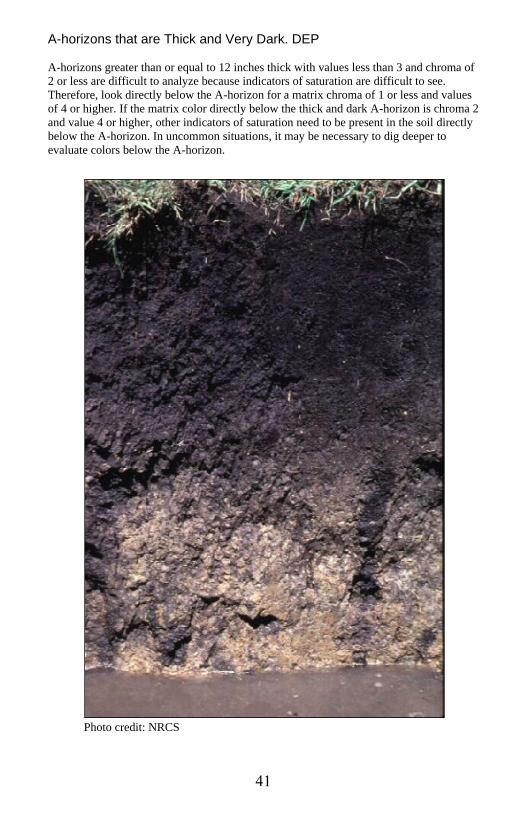
A-horizons that are Thick and Very Dark. DEP
A-horizons greater than or equal to 12 inches thick with values less than 3 and chroma of
2 or less are difficult to analyze because indicators of saturation are difficult to see.
Therefore, look directly below the A-horizon for a matrix chroma of 1 or less and values
of 4 or higher. If the matrix color directly below the thick and dark A-horizon is chroma 2
and value 4 or higher, other indicators of saturation need to be present in the soil directly
below the A-horizon. In uncommon situations, it may be necessary to dig deeper to
evaluate colors below the A-horizon.
Photo credit: NRCS
42
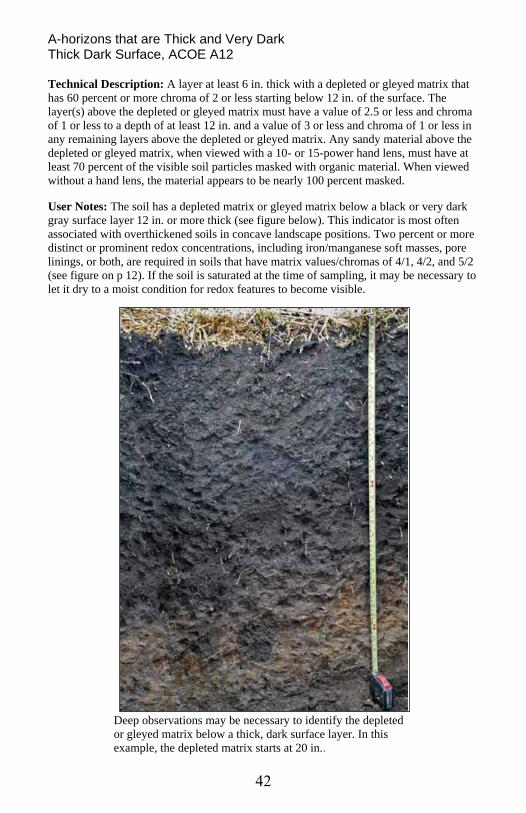
A-horizons that are Thick and Very Dark Thick Dark Surface, ACOE A12 Technical Description: A layer at least 6 in. thick with a depleted or gleyed matrix that
has 60 percent or more chroma of 2 or less starting below 12 in. of the surface. The
layer(s) above the depleted or gleyed matrix must have a value of 2.5 or less and chroma
of 1 or less to a depth of at least 12 in. and a value of 3 or less and chroma of 1 or less in
any remaining layers above the depleted or gleyed matrix. Any sandy material above the
depleted or gleyed matrix, when viewed with a 10- or 15-power hand lens, must have at
least 70 percent of the visible soil particles masked with organic material. When viewed
without a hand lens, the material appears to be nearly 100 percent masked.
User Notes: The soil has a depleted matrix or gleyed matrix below a black or very dark
gray surface layer 12 in. or more thick (see figure below). This indicator is most often
associated with overthickened soils in concave landscape positions. Two percent or more
distinct or prominent redox concentrations, including iron/manganese soft masses, pore
linings, or both, are required in soils that have matrix values/chromas of 4/1, 4/2, and 5/2
(see figure on p 12). If the soil is saturated at the time of sampling, it may be necessary to
let it dry to a moist condition for redox features to become visible.
Deep observations may be necessary to identify the depleted
or gleyed matrix below a thick, dark surface layer. In this
example, the depleted matrix starts at 20 in..
43
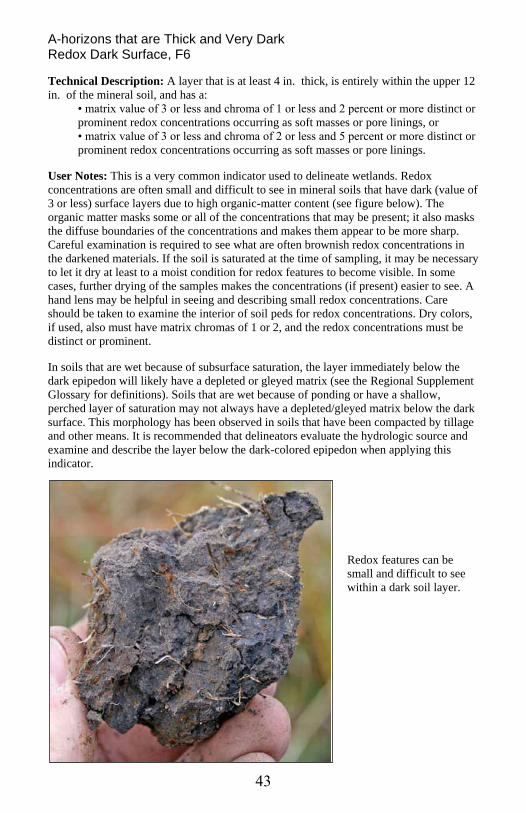
A-horizons that are Thick and Very Dark Redox Dark Surface, F6
Technical Description: A layer that is at least 4 in. thick, is entirely within the upper 12
in. of the mineral soil, and has a:
• matrix value of 3 or less and chroma of 1 or less and 2 percent or more distinct or
prominent redox concentrations occurring as soft masses or pore linings, or
• matrix value of 3 or less and chroma of 2 or less and 5 percent or more distinct or
prominent redox concentrations occurring as soft masses or pore linings.
User Notes: This is a very common indicator used to delineate wetlands. Redox
concentrations are often small and difficult to see in mineral soils that have dark (value of
3 or less) surface layers due to high organic-matter content (see figure below). The
organic matter masks some or all of the concentrations that may be present; it also masks
the diffuse boundaries of the concentrations and makes them appear to be more sharp.
Careful examination is required to see what are often brownish redox concentrations in
the darkened materials. If the soil is saturated at the time of sampling, it may be necessary
to let it dry at least to a moist condition for redox features to become visible. In some
cases, further drying of the samples makes the concentrations (if present) easier to see. A
hand lens may be helpful in seeing and describing small redox concentrations. Care
should be taken to examine the interior of soil peds for redox concentrations. Dry colors,
if used, also must have matrix chromas of 1 or 2, and the redox concentrations must be
distinct or prominent.
In soils that are wet because of subsurface saturation, the layer immediately below the
dark epipedon will likely have a depleted or gleyed matrix (see the Regional Supplement
Glossary for definitions). Soils that are wet because of ponding or have a shallow,
perched layer of saturation may not always have a depleted/gleyed matrix below the dark
surface. This morphology has been observed in soils that have been compacted by tillage
and other means. It is recommended that delineators evaluate the hydrologic source and
examine and describe the layer below the dark-colored epipedon when applying this
indicator.
Redox features can be
small and difficult to see
within a dark soil layer.
44
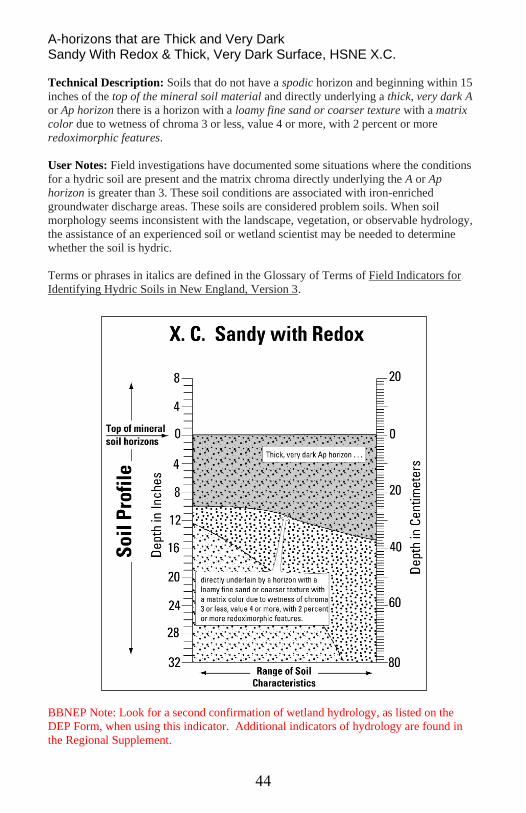
A-horizons that are Thick and Very Dark Sandy With Redox & Thick, Very Dark Surface, HSNE X.C.
Technical Description: Soils that do not have a spodic horizon and beginning within 15
inches of the top of the mineral soil material and directly underlying a thick, very dark A
or Ap horizon there is a horizon with a loamy fine sand or coarser texture with a matrix
color due to wetness of chroma 3 or less, value 4 or more, with 2 percent or more
redoximorphic features.
User Notes: Field investigations have documented some situations where the conditions
for a hydric soil are present and the matrix chroma directly underlying the A or Ap
horizon is greater than 3. These soil conditions are associated with iron-enriched
groundwater discharge areas. These soils are considered problem soils. When soil
morphology seems inconsistent with the landscape, vegetation, or observable hydrology,
the assistance of an experienced soil or wetland scientist may be needed to determine
whether the soil is hydric.
Terms or phrases in italics are defined in the Glossary of Terms of Field Indicators for
Identifying Hydric Soils in New England, Version 3.
BBNEP Note: Look for a second confirmation of wetland hydrology, as listed on the
DEP Form, when using this indicator. Additional indicators of hydrology are found in
the Regional Supplement.
45
A-horizons that are Thick and Very Dark Depleted Dark Surface, ACOE F7 Technical Description: Redox depletions with a value of 5 or more and chroma of 2 or
less in a layer that is at least 4 in. thick, is entirely within the upper 12 in. of the mineral
soil (see figure below), and has a:
• matrix value of 3 or less and chroma of 1 or less and 10 percent or more redox
depletions, or
• matrix value of 3 or less and chroma of 2 or less and 20 percent or more redox
depletions.
User Notes: Care should be taken not to mistake the mixing of eluvial (leached) layers
that have high value and low chroma (E horizon) or Illuvial layers that have accumulated
carbonates (calcic horizon) into the surface layer as depletions. Mixing of layers can be
caused by burrowing animals or cultivation. Pieces of deeper layers that become
incorporated into the surface layer are not redox depletions. Knowledge of local
conditions is required in areas where light-colored eluvial layers and/or layers high in
carbonates may be present. In soils that are wet because of subsurface saturation, the
layer immediately below the dark surface is likely to have a depleted or gleyed matrix.
Redox depletions are usually associated with microsites that have redox concentrations
occurring as pore linings or masses within the depletion(s) or surrounding the
depletion(s).
Redox depletions
(lighter colored areas)
are scattered within the
darker matrix. Scale is
in centimeters.
46
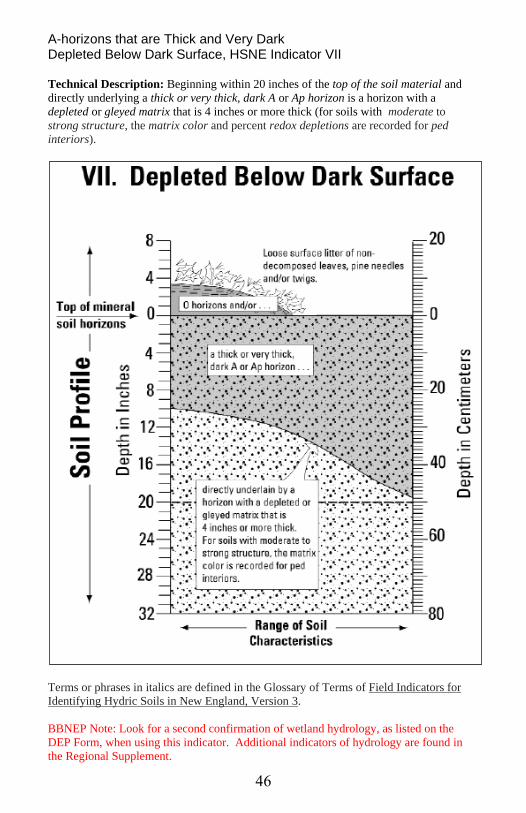
A-horizons that are Thick and Very Dark Depleted Below Dark Surface, HSNE Indicator VII Technical Description: Beginning within 20 inches of the top of the soil material and
directly underlying a thick or very thick, dark A or Ap horizon is a horizon with a
depleted or gleyed matrix that is 4 inches or more thick (for soils with moderate to
strong structure, the matrix color and percent redox depletions are recorded for ped
interiors).
Terms or phrases in italics are defined in the Glossary of Terms of Field Indicators for
Identifying Hydric Soils in New England, Version 3.
BBNEP Note: Look for a second confirmation of wetland hydrology, as listed on the
DEP Form, when using this indicator. Additional indicators of hydrology are found in
the Regional Supplement.
47
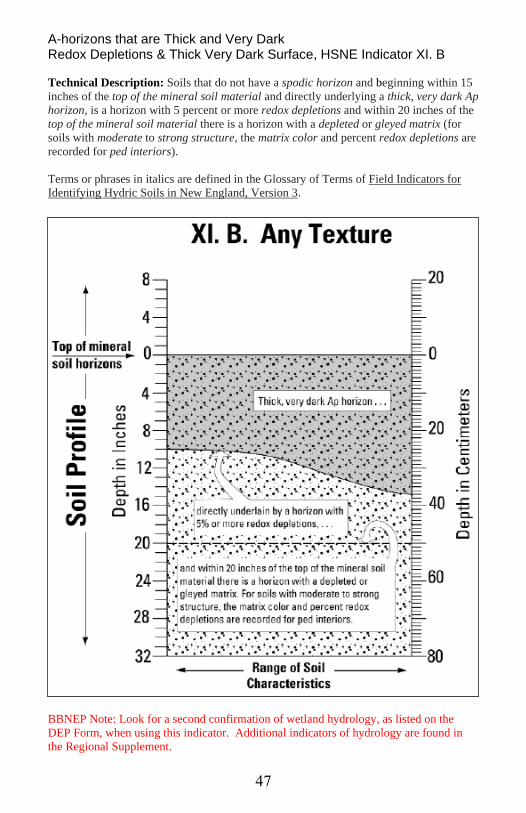
A-horizons that are Thick and Very Dark Redox Depletions & Thick Very Dark Surface, HSNE Indicator XI. B
Technical Description: Soils that do not have a spodic horizon and beginning within 15
inches of the top of the mineral soil material and directly underlying a thick, very dark Ap
horizon, is a horizon with 5 percent or more redox depletions and within 20 inches of the
top of the mineral soil material there is a horizon with a depleted or gleyed matrix (for
soils with moderate to strong structure, the matrix color and percent redox depletions are
recorded for ped interiors).
Terms or phrases in italics are defined in the Glossary of Terms of Field Indicators for
Identifying Hydric Soils in New England, Version 3.
BBNEP Note: Look for a second confirmation of wetland hydrology, as listed on the
DEP Form, when using this indicator. Additional indicators of hydrology are found in
the Regional Supplement.
48
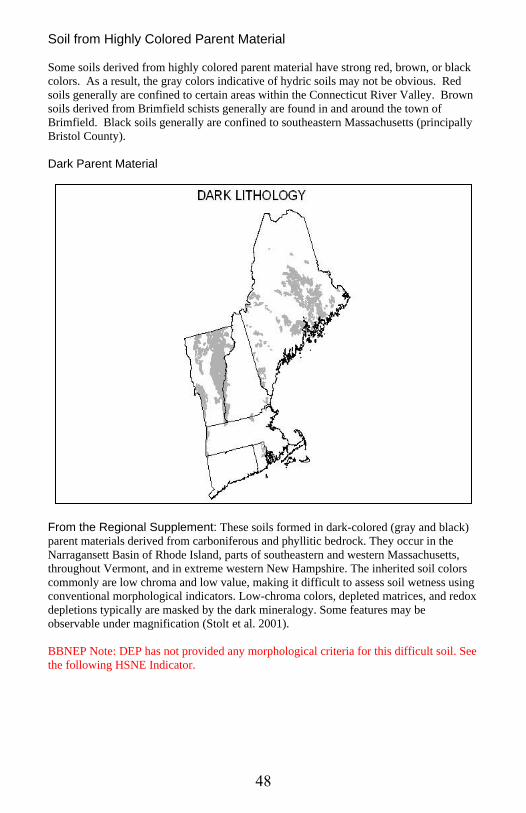
Soil from Highly Colored Parent Material
Some soils derived from highly colored parent material have strong red, brown, or black
colors. As a result, the gray colors indicative of hydric soils may not be obvious. Red
soils generally are confined to certain areas within the Connecticut River Valley. Brown
soils derived from Brimfield schists generally are found in and around the town of
Brimfield. Black soils generally are confined to southeastern Massachusetts (principally
Bristol County).
Dark Parent Material
From the Regional Supplement: These soils formed in dark-colored (gray and black)
parent materials derived from carboniferous and phyllitic bedrock. They occur in the
Narragansett Basin of Rhode Island, parts of southeastern and western Massachusetts,
throughout Vermont, and in extreme western New Hampshire. The inherited soil colors
commonly are low chroma and low value, making it difficult to assess soil wetness using
conventional morphological indicators. Low-chroma colors, depleted matrices, and redox
depletions typically are masked by the dark mineralogy. Some features may be
observable under magnification (Stolt et al. 2001).
BBNEP Note: DEP has not provided any morphological criteria for this difficult soil. See
the following HSNE Indicator.
49
Soil from Highly Colored Parent Material Dark Parent Material
Dark Surface Materials, HSNE VIII Technical Description: Soils with a matrix chroma of 2 or less that extends to a depth of
20 inches below the top of the mineral soil material, and that have a dark A or Ap horizon
(with or without an O horizon) that is directly underlain by a horizon with a matrix value
of less than 4, and within 12 inches of the top of the mineral soil material or directly
underlying an A or Ap horizon, whichever is shallower, 2 percent or more redoximorphic
features that extend to:
A. a depth of 20 inches below the top of the mineral soil material; or
B. a depleted or gleyed matrix, whichever is shallower;
Photo Credit: Jim Turrene
BBNEP Note: Look for a second confirmation of wetland hydrology, as listed on the
DEP Form, when using this indicator. Additional indicators of hydrology are found in
the Regional Supplement.
50
Soil from Highly Colored Parent Material Dark Parent Material
Dark Surface Materials, HSNE VIII, cont.
51
Soil from Highly Colored Parent Material Red Parent Materials
These maps were prepared by Al Averill and Darlene Monds of the NRCS
Massachusetts office.
From the Regional Supplement: Soils derived from red parent materials are a
challenge for hydric soil identification because the red, iron-rich materials contain
minerals that are resistant to weathering and chemical reduction under anaerobic
conditions. This inhibits the formation of redoximorphic features and typical hydric soil
morphology. These soils are found in scattered locations throughout the region in areas of
Mesozoic geologic materials or alluvium derived from these formations, including the
Great Lakes region and river valleys in Connecticut and Massachusetts. A transect
sampling approach can be helpful in making a hydric soil determination in soils derived
from red parent materials. This involves describing the soil profile in an obvious non-
wetland location and an obvious wetland location to identify particular soil features that
are related to the wetness gradient. Relevant features may include a change in soil matrix
chroma (e.g., from 4 to 3) or the presence of redox depletions or reddish-black
manganese concentrations. (ACOE) Hydric soil indicators F8 (Redox Depressions), F12
(Iron-Manganese Masses), and F21 (Red Parent Material) may be useful in identifying
hydric soils in areas with red parent materials.
BBNEP Note: DEP has not provided any morphological criteria for this difficult soil. For
Red Parent Materials see ACOE indicators F21 and TF2. These difficult soils are not
found in the Buzzards Bay watershed
52
Soil from Highly Colored Parent Material Red Parent Materials, ACOE F21
Technical Description: A layer derived from red parent materials that is at least 4 inches
thick, starting within 10 inches of the soil surface with a hue of 7.5YR or redder. The
matrix has a value and chroma greater than 2 and less than or equal to 4. The layer must
contain 10 percent or more depletions and/or distinct or prominent redox concentrations
occurring as soft masses or pore linings. Redox depletions should differ in color by
having:
Value one or more higher and chroma one or more lower than the matrix, or
Value of 4 or more and chroma of 2 or less.
User Notes: This indicator was developed for use in areas of red parent material, such as
residuum in the Piedmont Province Triassic lowlands section or the Paleozoic “red beds”
of the Appalachian Mountains, and in alluvium or colluvium derived from these
materials. In glaciated areas, the indicator may form in glacial till, outwash, deltaic
sediments, or glaciolacustrine sediments derived from similar red lithologies. In order to
confirm that it is appropriate to apply this indicator to particular soils, soils formed from
similar parent materials in the area should have been evaluated to determine their Color
Change Propensity Index (CCPI) and be shown to have CCPI values below 30
(Rabenhorst and Parikh, 2000.) It cannot be assumed that sediment overlying red colored
bedrock is derived solely from that bedrock. The total percentage of all redox
concentrations and redox depletions must add up to at least 10% to meet the threshold for
this indicator.
This indicator should be used only in areas of red parent material that is resistant to
reduction. Not all red soils formed in red parent material.
53
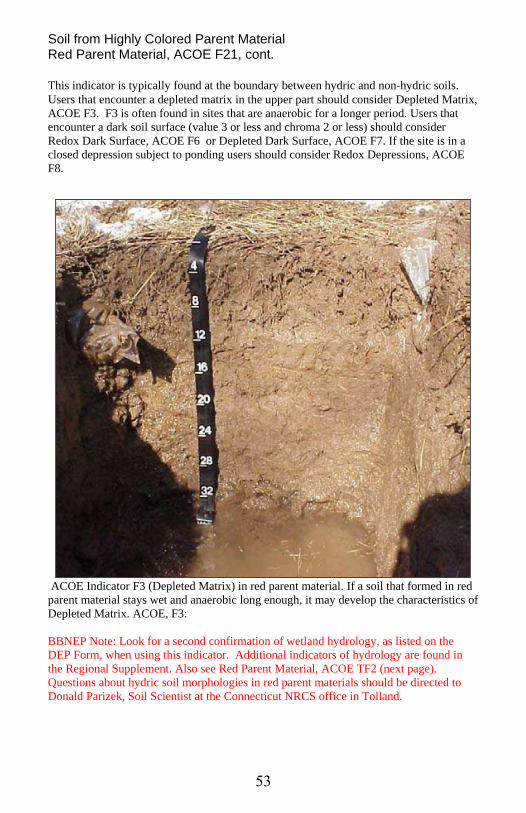
Soil from Highly Colored Parent Material Red Parent Material, ACOE F21, cont.
This indicator is typically found at the boundary between hydric and non‐hydric soils.
Users that encounter a depleted matrix in the upper part should consider Depleted Matrix,
ACOE F3. F3 is often found in sites that are anaerobic for a longer period. Users that
encounter a dark soil surface (value 3 or less and chroma 2 or less) should consider
Redox Dark Surface, ACOE F6 or Depleted Dark Surface, ACOE F7. If the site is in a
closed depression subject to ponding users should consider Redox Depressions, ACOE
F8.
ACOE Indicator F3 (Depleted Matrix) in red parent material. If a soil that formed in red
parent material stays wet and anaerobic long enough, it may develop the characteristics of
Depleted Matrix. ACOE, F3:
BBNEP Note: Look for a second confirmation of wetland hydrology, as listed on the
DEP Form, when using this indicator. Additional indicators of hydrology are found in
the Regional Supplement. Also see Red Parent Material, ACOE TF2 (next page).
Questions about hydric soil morphologies in red parent materials should be directed to
Donald Parizek, Soil Scientist at the Connecticut NRCS office in Tolland.
54
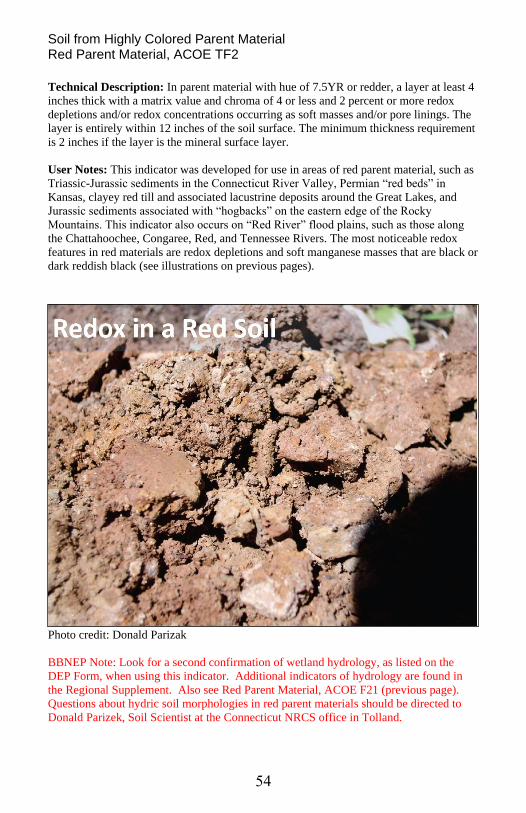
Soil from Highly Colored Parent Material Red Parent Material, ACOE TF2
Technical Description: In parent material with hue of 7.5YR or redder, a layer at least 4
inches thick with a matrix value and chroma of 4 or less and 2 percent or more redox
depletions and/or redox concentrations occurring as soft masses and/or pore linings. The
layer is entirely within 12 inches of the soil surface. The minimum thickness requirement
is 2 inches if the layer is the mineral surface layer.
User Notes: This indicator was developed for use in areas of red parent material, such as
Triassic-Jurassic sediments in the Connecticut River Valley, Permian “red beds” in
Kansas, clayey red till and associated lacustrine deposits around the Great Lakes, and
Jurassic sediments associated with “hogbacks” on the eastern edge of the Rocky
Mountains. This indicator also occurs on “Red River” flood plains, such as those along
the Chattahoochee, Congaree, Red, and Tennessee Rivers. The most noticeable redox
features in red materials are redox depletions and soft manganese masses that are black or
dark reddish black (see illustrations on previous pages).
Photo credit: Donald Parizak
BBNEP Note: Look for a second confirmation of wetland hydrology, as listed on the
DEP Form, when using this indicator. Additional indicators of hydrology are found in
the Regional Supplement. Also see Red Parent Material, ACOE F21 (previous page).
Questions about hydric soil morphologies in red parent materials should be directed to
Donald Parizek, Soil Scientist at the Connecticut NRCS office in Tolland.
55
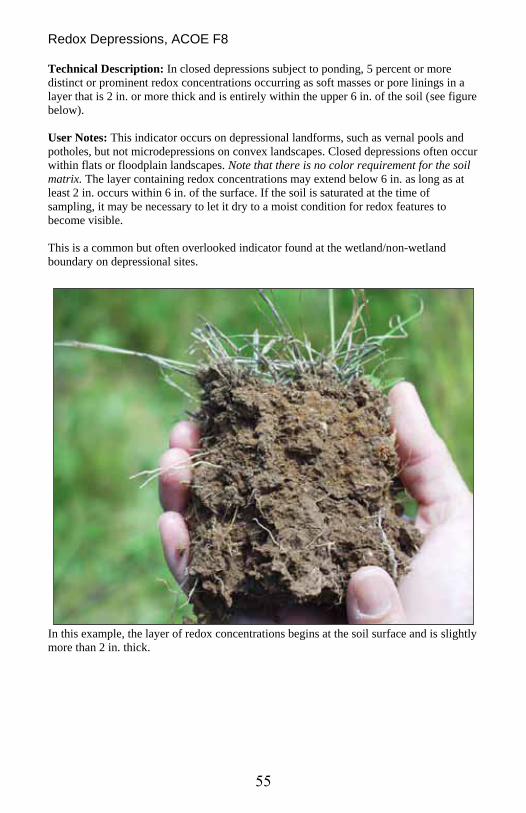
Redox Depressions, ACOE F8 Technical Description: In closed depressions subject to ponding, 5 percent or more
distinct or prominent redox concentrations occurring as soft masses or pore linings in a
layer that is 2 in. or more thick and is entirely within the upper 6 in. of the soil (see figure
below).
User Notes: This indicator occurs on depressional landforms, such as vernal pools and
potholes, but not microdepressions on convex landscapes. Closed depressions often occur
within flats or floodplain landscapes. Note that there is no color requirement for the soil
matrix. The layer containing redox concentrations may extend below 6 in. as long as at
least 2 in. occurs within 6 in. of the surface. If the soil is saturated at the time of
sampling, it may be necessary to let it dry to a moist condition for redox features to
become visible.
This is a common but often overlooked indicator found at the wetland/non-wetland
boundary on depressional sites.
In this example, the layer of redox concentrations begins at the soil surface and is slightly
more than 2 in. thick.
56
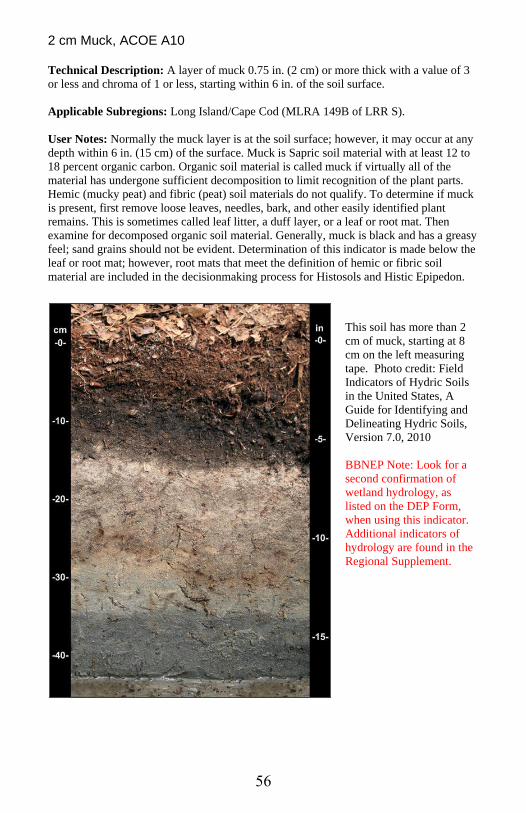
2 cm Muck, ACOE A10 Technical Description: A layer of muck 0.75 in. (2 cm) or more thick with a value of 3
or less and chroma of 1 or less, starting within 6 in. of the soil surface.
Applicable Subregions: Long Island/Cape Cod (MLRA 149B of LRR S).
User Notes: Normally the muck layer is at the soil surface; however, it may occur at any
depth within 6 in. (15 cm) of the surface. Muck is Sapric soil material with at least 12 to
18 percent organic carbon. Organic soil material is called muck if virtually all of the
material has undergone sufficient decomposition to limit recognition of the plant parts.
Hemic (mucky peat) and fibric (peat) soil materials do not qualify. To determine if muck
is present, first remove loose leaves, needles, bark, and other easily identified plant
remains. This is sometimes called leaf litter, a duff layer, or a leaf or root mat. Then
examine for decomposed organic soil material. Generally, muck is black and has a greasy
feel; sand grains should not be evident. Determination of this indicator is made below the
leaf or root mat; however, root mats that meet the definition of hemic or fibric soil
material are included in the decisionmaking process for Histosols and Histic Epipedon.
This soil has more than 2
cm of muck, starting at 8
cm on the left measuring
tape. Photo credit: Field
Indicators of Hydric Soils
in the United States, A
Guide for Identifying and
Delineating Hydric Soils,
Version 7.0, 2010
BBNEP Note: Look for a
second confirmation of
wetland hydrology, as
listed on the DEP Form,
when using this indicator.
Additional indicators of
hydrology are found in the
Regional Supplement.
57
Coast Prairie Redox, ACOE A16 Technical Description: A layer starting within 6 in. of the soil surface that is at least 4
in. (10 cm) thick and has a matrix chroma of 3 or less with 2 percent or more distinct or
prominent redox concentrations occurring as soft masses and/or pore linings.
Applicable Subregions: not in the Long Island/Cape Cod Subregion (MLRA 149B of
LRR S).
User Notes: These hydric soils occur mainly on depressional and intermound landforms.
Redox concentrations occur mainly as iron- dominated pore linings. Common to many
redox concentrations are required. If the soil is saturated at the time of sampling, it may
be necessary to let it dry to a moist condition for redox features to become visible.
Chroma 3 matrices are allowed because they may be the color of stripped sand grains, or
because few to common sand-sized reddish particles may be present and may prevent
obtaining a chroma of 2 or less.
BBNEP Note: Look for a second confirmation of wetland hydrology, as listed on the
DEP Form, when using this indicator. Additional indicators of hydrology are found in
the Regional Supplement.
58
Very Shallow Dark Surface, ACOE TF12
Technical Description: In depressions and other concave landforms, one of the
following:
• If bedrock occurs between 6 in. and 10 in., a layer at least 6 in. thick starting within
4 in. of the soil surface with a value of 3 or less and chroma of 1 or less, and the
remaining soil to bedrock must have the same colors as above or any other color that
has a chroma of 2 or less.
• If bedrock occurs within 6 in., more than half of the soil thickness must have a value
of 3 or less and chroma of 1 or less, and the remaining soil to bedrock must have the
same colors as above or any other color that has a chroma of 2 or less.
BBNEP Note: Look for a second confirmation of wetland hydrology, as listed on the
DEP Form, when using this indicator. Additional indicators of hydrology are found in
the Regional Supplement.
59
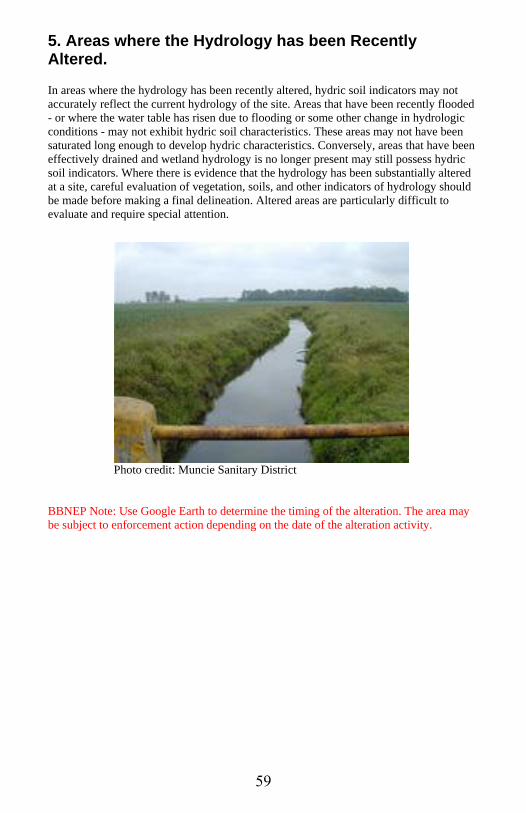
5. Areas where the Hydrology has been Recently Altered. In areas where the hydrology has been recently altered, hydric soil indicators may not
accurately reflect the current hydrology of the site. Areas that have been recently flooded
- or where the water table has risen due to flooding or some other change in hydrologic
conditions - may not exhibit hydric soil characteristics. These areas may not have been
saturated long enough to develop hydric characteristics. Conversely, areas that have been
effectively drained and wetland hydrology is no longer present may still possess hydric
soil indicators. Where there is evidence that the hydrology has been substantially altered
at a site, careful evaluation of vegetation, soils, and other indicators of hydrology should
be made before making a final delineation. Altered areas are particularly difficult to
evaluate and require special attention.
Photo credit: Muncie Sanitary District
BBNEP Note: Use Google Earth to determine the timing of the alteration. The area may
be subject to enforcement action depending on the date of the alteration activity.
60
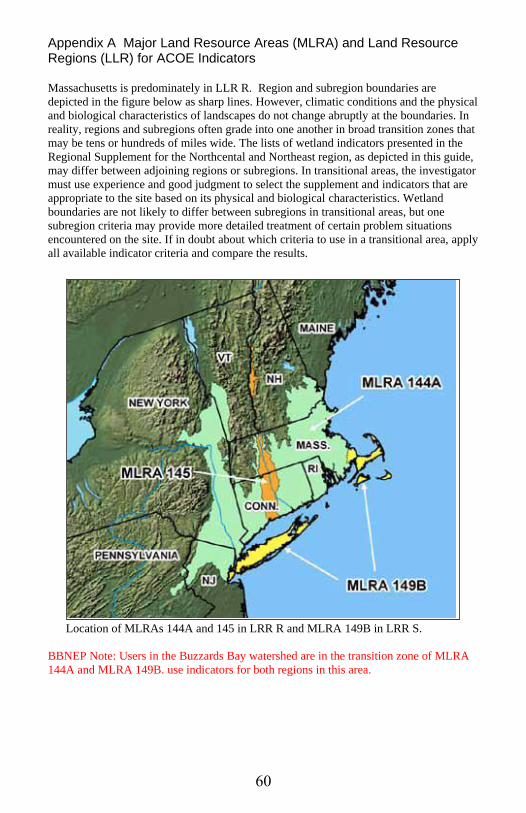
Appendix A Major Land Resource Areas (MLRA) and Land Resource Regions (LLR) for ACOE Indicators Massachusetts is predominately in LLR R. Region and subregion boundaries are
depicted in the figure below as sharp lines. However, climatic conditions and the physical
and biological characteristics of landscapes do not change abruptly at the boundaries. In
reality, regions and subregions often grade into one another in broad transition zones that
may be tens or hundreds of miles wide. The lists of wetland indicators presented in the
Regional Supplement for the Northcental and Northeast region, as depicted in this guide,
may differ between adjoining regions or subregions. In transitional areas, the investigator
must use experience and good judgment to select the supplement and indicators that are
appropriate to the site based on its physical and biological characteristics. Wetland
boundaries are not likely to differ between subregions in transitional areas, but one
subregion criteria may provide more detailed treatment of certain problem situations
encountered on the site. If in doubt about which criteria to use in a transitional area, apply
all available indicator criteria and compare the results.
Location of MLRAs 144A and 145 in LRR R and MLRA 149B in LRR S.
BBNEP Note: Users in the Buzzards Bay watershed are in the transition zone of MLRA
144A and MLRA 149B. use indicators for both regions in this area.
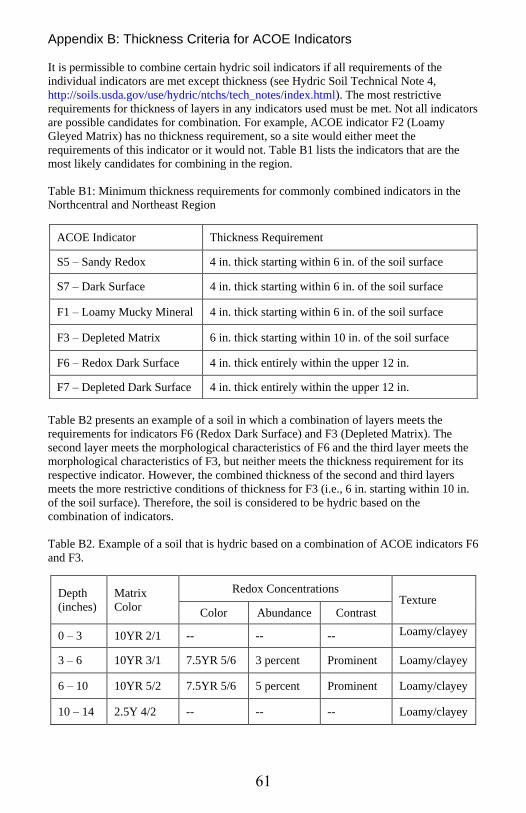
61
Appendix B: Thickness Criteria for ACOE Indicators
It is permissible to combine certain hydric soil indicators if all requirements of the
individual indicators are met except thickness (see Hydric Soil Technical Note 4,
http://soils.usda.gov/use/hydric/ntchs/tech_notes/index.html). The most restrictive
requirements for thickness of layers in any indicators used must be met. Not all indicators
are possible candidates for combination. For example, ACOE indicator F2 (Loamy
Gleyed Matrix) has no thickness requirement, so a site would either meet the
requirements of this indicator or it would not. Table B1 lists the indicators that are the
most likely candidates for combining in the region.
Table B1: Minimum thickness requirements for commonly combined indicators in the
Northcentral and Northeast Region
Table B2 presents an example of a soil in which a combination of layers meets the
requirements for indicators F6 (Redox Dark Surface) and F3 (Depleted Matrix). The
second layer meets the morphological characteristics of F6 and the third layer meets the
morphological characteristics of F3, but neither meets the thickness requirement for its
respective indicator. However, the combined thickness of the second and third layers
meets the more restrictive conditions of thickness for F3 (i.e., 6 in. starting within 10 in.
of the soil surface). Therefore, the soil is considered to be hydric based on the
combination of indicators.
Table B2. Example of a soil that is hydric based on a combination of ACOE indicators F6
and F3.
ACOE Indicator Thickness Requirement
S5 – Sandy Redox 4 in. thick starting within 6 in. of the soil surface
S7 – Dark Surface 4 in. thick starting within 6 in. of the soil surface
F1 – Loamy Mucky Mineral 4 in. thick starting within 6 in. of the soil surface
F3 – Depleted Matrix 6 in. thick starting within 10 in. of the soil surface
F6 – Redox Dark Surface 4 in. thick entirely within the upper 12 in.
F7 – Depleted Dark Surface 4 in. thick entirely within the upper 12 in.
Depth
(inches)
Matrix
Color
Redox Concentrations Texture
Color Abundance Contrast
0 – 3 10YR 2/1 -- -- -- Loamy/clayey
3 – 6 10YR 3/1 7.5YR 5/6 3 percent Prominent Loamy/clayey
6 – 10 10YR 5/2 7.5YR 5/6 5 percent Prominent Loamy/clayey
10 – 14 2.5Y 4/2 -- -- -- Loamy/clayey
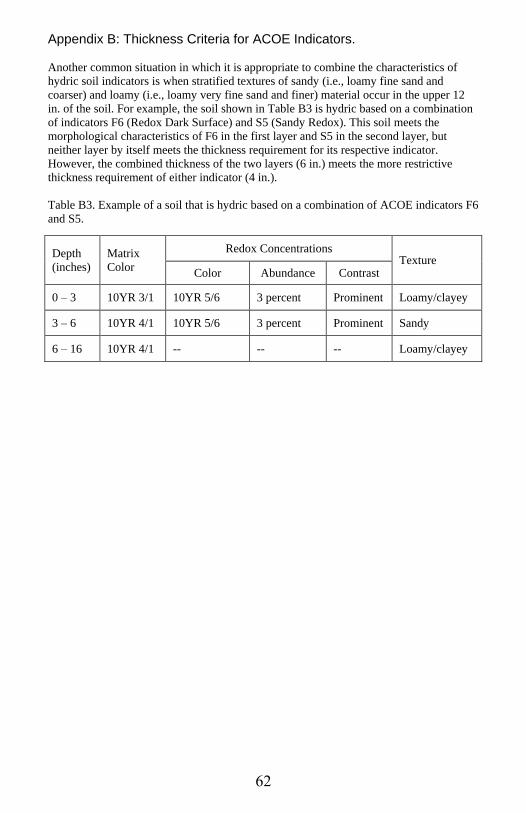
62
Appendix B: Thickness Criteria for ACOE Indicators.
Another common situation in which it is appropriate to combine the characteristics of
hydric soil indicators is when stratified textures of sandy (i.e., loamy fine sand and
coarser) and loamy (i.e., loamy very fine sand and finer) material occur in the upper 12
in. of the soil. For example, the soil shown in Table B3 is hydric based on a combination
of indicators F6 (Redox Dark Surface) and S5 (Sandy Redox). This soil meets the
morphological characteristics of F6 in the first layer and S5 in the second layer, but
neither layer by itself meets the thickness requirement for its respective indicator.
However, the combined thickness of the two layers (6 in.) meets the more restrictive
thickness requirement of either indicator (4 in.).
Table B3. Example of a soil that is hydric based on a combination of ACOE indicators F6
and S5.
Depth
(inches)
Matrix
Color
Redox Concentrations Texture
Color Abundance Contrast
0 – 3 10YR 3/1 10YR 5/6 3 percent Prominent Loamy/clayey
3 – 6 10YR 4/1 10YR 5/6 3 percent Prominent Sandy
6 – 16 10YR 4/1 -- -- -- Loamy/clayey
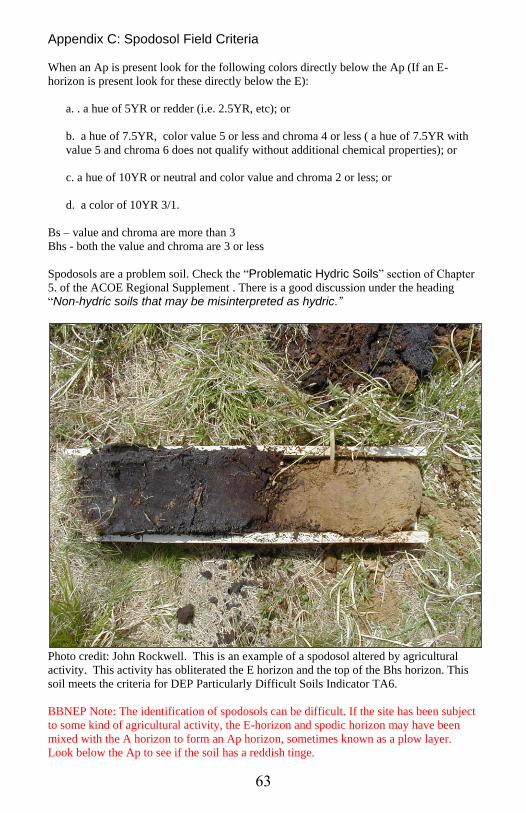
63
Appendix C: Spodosol Field Criteria
When an Ap is present look for the following colors directly below the Ap (If an E-
horizon is present look for these directly below the E):
a. . a hue of 5YR or redder (i.e. 2.5YR, etc); or
b. a hue of 7.5YR, color value 5 or less and chroma 4 or less ( a hue of 7.5YR with
value 5 and chroma 6 does not qualify without additional chemical properties); or
c. a hue of 10YR or neutral and color value and chroma 2 or less; or
d. a color of 10YR 3/1.
Bs – value and chroma are more than 3
Bhs - both the value and chroma are 3 or less
Spodosols are a problem soil. Check the “Problematic Hydric Soils” section of Chapter
5. of the ACOE Regional Supplement . There is a good discussion under the heading
“Non-hydric soils that may be misinterpreted as hydric.”
Photo credit: John Rockwell. This is an example of a spodosol altered by agricultural
activity. This activity has obliterated the E horizon and the top of the Bhs horizon. This
soil meets the criteria for DEP Particularly Difficult Soils Indicator TA6.
BBNEP Note: The identification of spodosols can be difficult. If the site has been subject
to some kind of agricultural activity, the E-horizon and spodic horizon may have been
mixed with the A horizon to form an Ap horizon, sometimes known as a plow layer.
Look below the Ap to see if the soil has a reddish tinge.
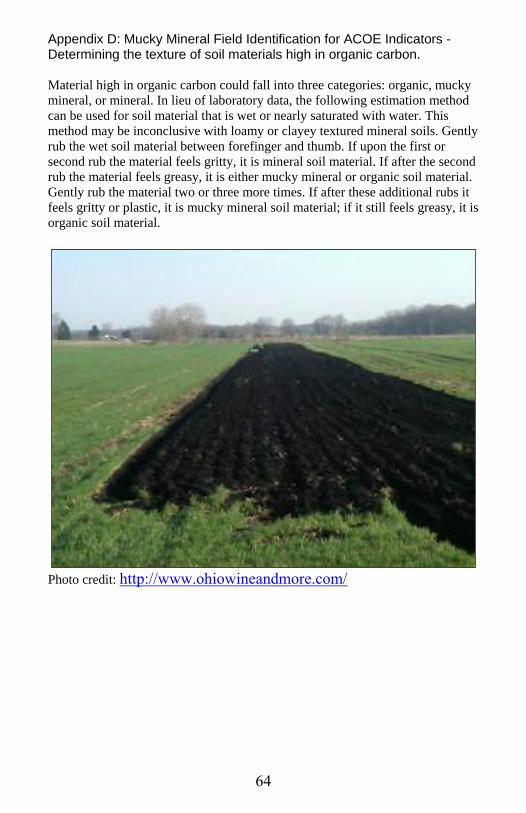
64
Appendix D: Mucky Mineral Field Identification for ACOE Indicators - Determining the texture of soil materials high in organic carbon. Material high in organic carbon could fall into three categories: organic, mucky
mineral, or mineral. In lieu of laboratory data, the following estimation method
can be used for soil material that is wet or nearly saturated with water. This
method may be inconclusive with loamy or clayey textured mineral soils. Gently
rub the wet soil material between forefinger and thumb. If upon the first or
second rub the material feels gritty, it is mineral soil material. If after the second
rub the material feels greasy, it is either mucky mineral or organic soil material.
Gently rub the material two or three more times. If after these additional rubs it
feels gritty or plastic, it is mucky mineral soil material; if it still feels greasy, it is
organic soil material.
Photo credit: http://www.ohiowineandmore.com/
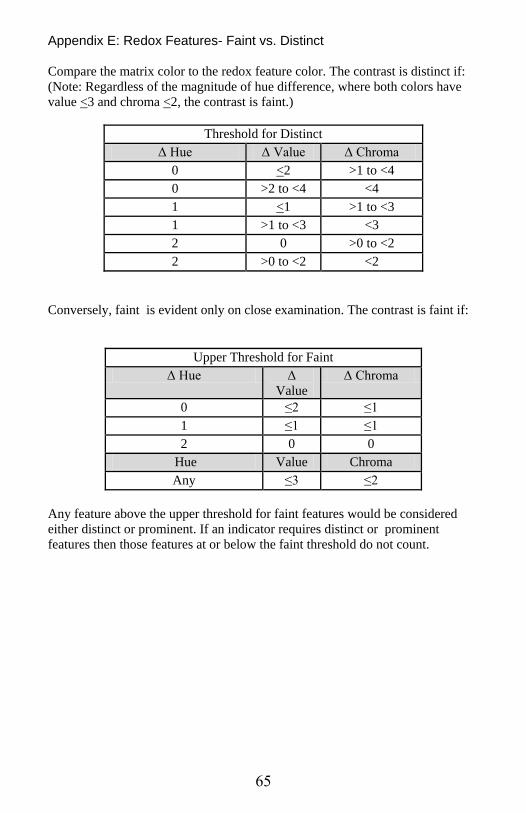
65
Appendix E: Redox Features- Faint vs. Distinct Compare the matrix color to the redox feature color. The contrast is distinct if:
(Note: Regardless of the magnitude of hue difference, where both colors have
value <3 and chroma <2, the contrast is faint.)
Threshold for Distinct
Δ Hue Δ Value Δ Chroma
0 <2 >1 to <4
0 >2 to <4 <4
1 <1 >1 to <3
1 >1 to <3 <3
2 0 >0 to <2
2 >0 to <2 <2
Conversely, faint is evident only on close examination. The contrast is faint if:
Upper Threshold for Faint
Δ Hue Δ
Value
Δ Chroma
0 ≤2 ≤1
1 ≤1 ≤1
2 0 0
Hue Value Chroma
Any ≤3 ≤2
Any feature above the upper threshold for faint features would be considered
either distinct or prominent. If an indicator requires distinct or prominent
features then those features at or below the faint threshold do not count.
66
Appendix F: ACOE Memo regarding use of “Field Indicators for Identifying Hydric Soils in New England, Version 3
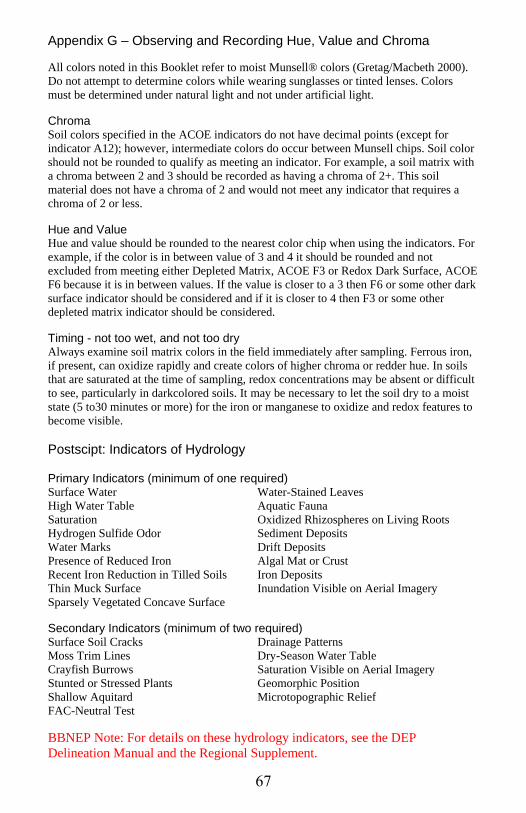
67
Appendix G – Observing and Recording Hue, Value and Chroma
All colors noted in this Booklet refer to moist Munsell® colors (Gretag/Macbeth 2000).
Do not attempt to determine colors while wearing sunglasses or tinted lenses. Colors
must be determined under natural light and not under artificial light.
Chroma Soil colors specified in the ACOE indicators do not have decimal points (except for
indicator A12); however, intermediate colors do occur between Munsell chips. Soil color
should not be rounded to qualify as meeting an indicator. For example, a soil matrix with
a chroma between 2 and 3 should be recorded as having a chroma of 2+. This soil
material does not have a chroma of 2 and would not meet any indicator that requires a
chroma of 2 or less.
Hue and Value Hue and value should be rounded to the nearest color chip when using the indicators. For
example, if the color is in between value of 3 and 4 it should be rounded and not
excluded from meeting either Depleted Matrix, ACOE F3 or Redox Dark Surface, ACOE
F6 because it is in between values. If the value is closer to a 3 then F6 or some other dark
surface indicator should be considered and if it is closer to 4 then F3 or some other
depleted matrix indicator should be considered.
Timing - not too wet, and not too dry Always examine soil matrix colors in the field immediately after sampling. Ferrous iron,
if present, can oxidize rapidly and create colors of higher chroma or redder hue. In soils
that are saturated at the time of sampling, redox concentrations may be absent or difficult
to see, particularly in darkcolored soils. It may be necessary to let the soil dry to a moist
state (5 to30 minutes or more) for the iron or manganese to oxidize and redox features to
become visible.
Postscipt: Indicators of Hydrology
Primary Indicators (minimum of one required) Surface Water Water-Stained Leaves
High Water Table Aquatic Fauna
Saturation Oxidized Rhizospheres on Living Roots
Hydrogen Sulfide Odor Sediment Deposits
Water Marks Drift Deposits
Presence of Reduced Iron Algal Mat or Crust
Recent Iron Reduction in Tilled Soils Iron Deposits
Thin Muck Surface Inundation Visible on Aerial Imagery
Sparsely Vegetated Concave Surface
Secondary Indicators (minimum of two required) Surface Soil Cracks Drainage Patterns
Moss Trim Lines Dry-Season Water Table
Crayfish Burrows Saturation Visible on Aerial Imagery
Stunted or Stressed Plants Geomorphic Position
Shallow Aquitard Microtopographic Relief
FAC-Neutral Test
BBNEP Note: For details on these hydrology indicators, see the DEP
Delineation Manual and the Regional Supplement.

Buzzards Bay National Estuary Program
2870 Cranberry Highway
East Wareham, MA 02538
#508-291-3625 x 14
www.buzzardsbay.org


