46
The Carbon Footprint GEOG 401 2/16/2017 Guest Lecturer: Ryan Longman

The Carbon Footprint
GEOG 401
2/16/2017
Guest Lecturer: Ryan Longman

What is Carbon Dioxide?
- A colorless, odorless gas produced by burning carbon and organic compounds and by plant respiration.
- Non-toxic gas that in its solid form is known as “dry-ice”.
Deposition occurs at -78.5 °C (-109.3 °F)

Carbon in our atmosphere
• 0.04% by volume (400 ppm)
• The Keeling Curve is a graph which plots ongoing CO2 concentration in the Earths Atmosphere since 1958.
• Based on continuous measurements taken at Mauna Loa Observatory (MLO) in Hawai‘i under the supervision of Charles David Keeling
• Seasonal cycles
• Steady year to year increase

Highest CO2 Last ~800K yrs CO2 & Air Temperature are well
correlated
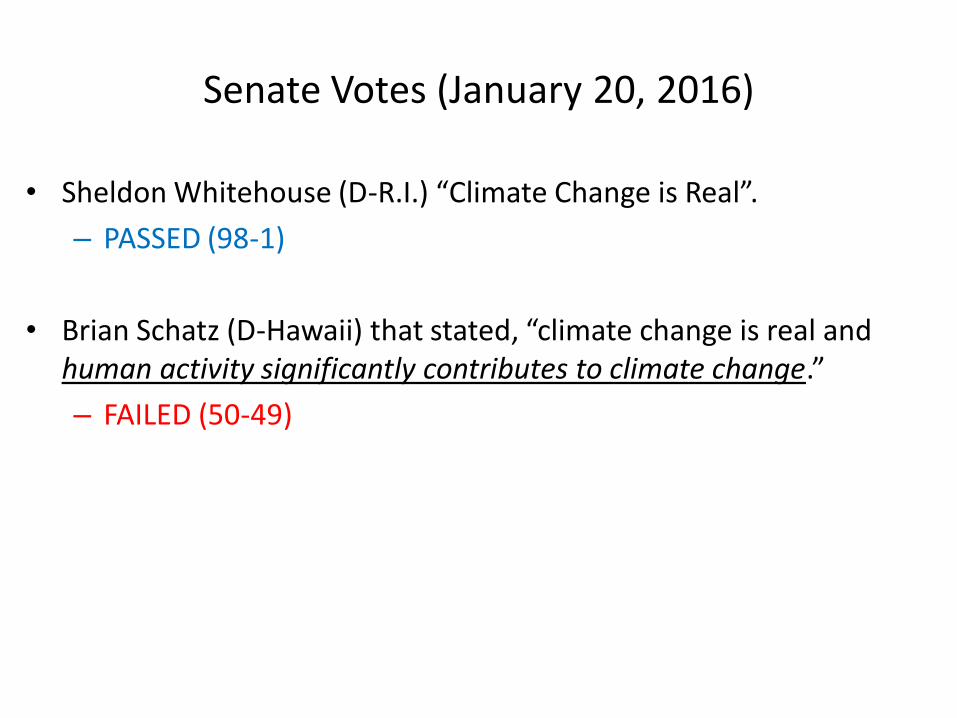
Senate Votes (January 20, 2016)
• Sheldon Whitehouse (D-R.I.) “Climate Change is Real”.
– PASSED (98-1)
• Brian Schatz (D-Hawaii) that stated, “climate change is real and human activity significantly contributes to climate change.”
– FAILED (50-49)

How has science concluded that humans are responsible for the increase of CO2 in the Earths
Atmosphere?

• Elements are presented in order of increasing atomic number.
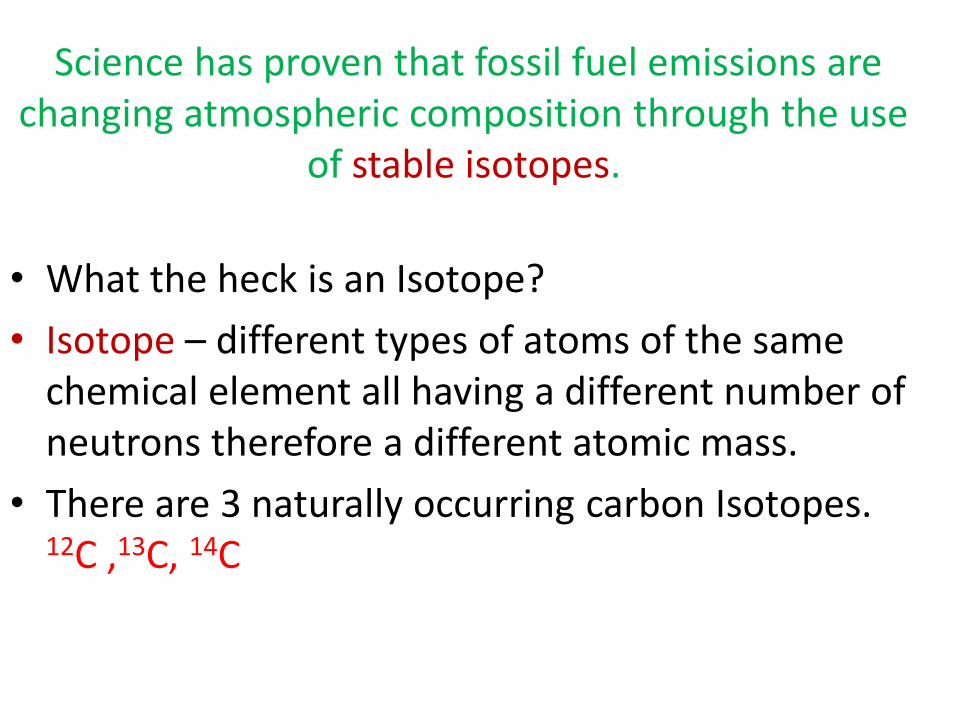
Science has proven that fossil fuel emissions are changing atmospheric composition through the use
of stable isotopes.
• What the heck is an Isotope?
• Isotope – different types of atoms of the same chemical element all having a different number of neutrons therefore a different atomic mass.
• There are 3 naturally occurring carbon Isotopes. 12C ,13C, 14C
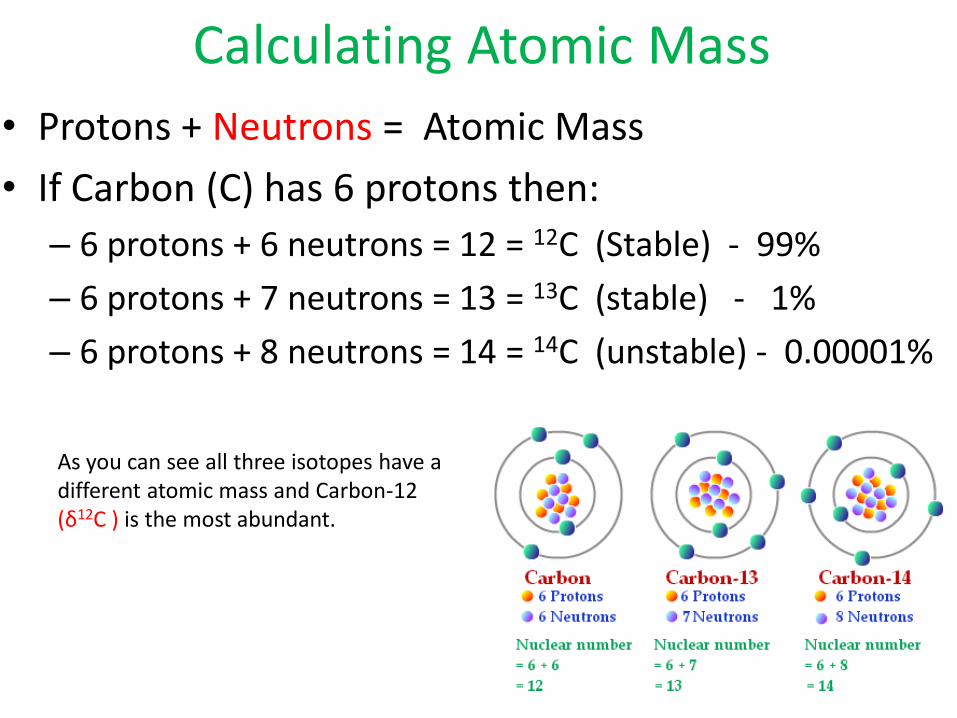
Calculating Atomic Mass
• Protons + Neutrons = Atomic Mass
• If Carbon (C) has 6 protons then:
– 6 protons + 6 neutrons = 12 = 12C (Stable) - 99%
– 6 protons + 7 neutrons = 13 = 13C (stable) - 1%
– 6 protons + 8 neutrons = 14 = 14C (unstable) - 0.00001%
As you can see all three isotopes have a different atomic mass and Carbon-12 (δ12C ) is the most abundant.

What does Isotope stability mean?
• 14C is an unstable isotope which means it decays over time.
• It has a half life of 5730 years
Using the 14C isotope is possible to go back ~50,000 yrs

Stable Carbon Isotopes.
• 12C and 13C are stable isotopes which means they do not decay over time.
• 12C and 13C can be used to tell us about our current atmospheric chemistry and allow us to compare it the chemistry of the past.
• The atmospheric concentration ratio between these two isotopes also provides us the evidence we need to determine the amount of anthropogenic inputs of CO2 into the atmosphere.

To understand this you need to first know something about photosynthesis.
• Plants draw in CO2 from atmosphere and use the energy from the Sun to fix the inorganic carbon into a useable organic form. •Plants prefer to take in 12CO2 because the lower atomic mass (12) of this isotope requires less energy to process than 13CO2 (atomic mass 13). •Therefore plants discriminate against 13CO2 . In other words, it’s not there favorite “flavor”

• If plants prefer 12CO2 over 13CO2 then there should be a steady ratio of 13C/ 12C in the atmosphere (assuming biomass doesn’t‘ change much)
• How is it possible then to determine the atmospheric anthropogenic inputs of CO2 using isotopes?
• First we have to ask some questions.
– What is the main source of anthropogenic CO2 to the atmosphere?
– What are fossil fuels made of ?
– What type of carbon atom is associated with plants?
– If fossil fuels are burned what will happen to the 13C/12C
concentrations in the atmosphere?
Plants
12C
Decrease
Fossil Fuels


Part 2
What is a carbon footprint?
• Carbon Footprint – a measure of the impact that human activities have on the environment in terms of the amount of greenhouse gases (GHG) produced, measured in units of CO2.
– Measures the total greenhouse gas emissions caused directly and indirectly by a person, organization, event or product.
– Is calculated by considering the amount of greenhouse gas emitted/ removed or embodied in the life cycle of a product.

Why is CO2
used to measure
footprints?
• Radiative Forcing – is a measure of the net change in the energy balance of the Earth system in response to some external perturbation.
• Measured in W m-2. Positive = warming and Negative = cooling • 61 % of the forcing is a result of CO2.
• 17 % of the forcing is a result off CH4 IPCC (2013)

Life Cycle Methodologies
• Many companies do not account for the entire supply chain that results in final goods and services.
– Overlook up to 75% of the GHGs involved.
– Are there better ways to calculate a carbon foot print?
1. Cradle to Grave – Full life cycle of a product. – resource extraction
to disposal phase.
2. Cradle to Gate – partial product life resource extraction to factory gate. (Use and disposal are omitted.)
3. Cradle to Cradle – product is recycled.
4. Gate to Gate – looks at only one value added process

CO2 Equivalent
• Green house gases have different atmospheric concentration and different strength as a GHG.
• Because of this variability, carbon footprints are measured in tons of CO2 – eq, or the tons of CO2 that would cause the same level of radiative forcing as the emissions of a given GHG.

Total GHG Emissions 2013
in the U.S. GHG emission from transportation have
increased by a 18% since 1990. – Over 90% of the fuel is petroleum based.
– Due to increased demand for travel
– Stagnation of fuel efficiency.
Over 70% of our electricity comes from burning fossil fuels, mostly coal and natural gas.
http://www.epa.gov/
Why the decrease? Total GHG


• Can you see any differences between GHG EMISSIONS and PER CAPITA Emissions?

Per Capita CO2 Emissions
• Global Avg. = 4 tons of CO2 -eq/yr
• USA Avg. = 20 tons of CO2 -eq/yr
http://www.asiacarbon.com/ http://jtorresbutet.wordpress.com/

• Primary footprint is dominated by transportation and household electricity use.
• Secondary footprint is dominated by diet, clothing and personal products.
A study by the Renewable & Appropriate Energy Laboratory at UC Berkeley shows who you are and where you live makes a big difference in the activities that have the largest impact on your carbon footprint.
• California = Low electricity (5%)
• St. Louis = High electricity (25%)
http://coolclimate.berkeley.edu/

Uraban/Suburban Carbon Footprint
• Where do you think the carbon footprint bigger, cites or suburbs?
• Studies have shown that urbanization can deliver large carbon reductions by reducing per capita energy use in transport housing and construction.
• New study shows that this is offset by suburban areas.
• Carbon footprint actually increases until you reach 3000 person per
square mile.
Jones and Kammen (2014)

Carbon Visuals • If we could see carbon dioxide would we take it
more seriously?
http://www.carbonvisuals.com/
http://www.carbonvisuals.com/products-and-services/animation

Carbon Credits • Carbon Credit = 1 tonne of CO2 –eq either removed,
avoided or sequestered. – Renewable energy
– Forestation and afforestation
– Energy efficiency
– Methane capture
• The Carbon credit system was ratified in conjunction with the Kyoto Protocol.
• Credits are traded on the international market.
• Two Markets – Voluntary carbon offset market
– Compliance carbon offset market (Cap and Trade)

Who Gets the Money?
• In the voluntary market – carbon offsets are used to fund projects which absorb or eliminate an amount of carbon dioxide gas that is equal to the amount emitted.
• In the compliance market companies profit by reducing their footprints and selling their right to produce CO2. (Cap and Trade)
• China is rolling out the worlds largest cap and trade system this year.
Does it actually Work? • Essentially, carbon offsets work by allowing polluters to pay others to
make their carbon reductions for them.
– Reduce personal responsibility? (do what I want without guilt?)
– License for large companies to pollute freely
– Corruption?
• Are offset services actually being provided
• Are companies reporting correctly
– Is this superior to the idea of a carbon tax?
The American Clean Energy and Security Act(ACES) was approved by the House of Representatives on June 26, 2009 by a vote of 219-212, but was defeated in the Senate

Carbon Tax • Carbon Tax – polluters will pay per tonne of carbon they release into
the atmosphere.
– Price will be set at $40 and increase gradually
– The amount of carbon pollution involved in producing a product would start to be factored into its final price.
– Products produced through dirty processes will become more expensive.
– Encourages to businesses to switch to clean energy sources.
• Finland was the first country in intact a carbon tax in 1990.
• British Colombia, Canada (2008), Australia (2012; repealed in 2014), Ireland (2012), Sweden (1991), Great Britain (2001), New Zealand, Quebec, Canada (2007) .
• Boulder (Colorado) – first in the US (2007) -7$ per ton of carbon
http://www.nature.com/news/us-republican-idea-for-tax-on-carbon-makes-climate-sense-1.21477

Part 3 Where are we now? Where are we headed?

Anthropogenic “Forced” Change

IPCC AR4 2007 FAQ 2.1, Figure 1

Our Current CO2 Concentration
Jan. 2017: 406.07 ppm Jan. 2016: 402.52 ppm Jan. 2015: 399.96 ppm
On May 9th (2013) the daily average of carbon dioxide (CO2) in the atmosphere passed the 400 ppm mark
Preindustrial levels
280 ppm
Increasing at rate of 2.89 ppm/yr

During 2016, the average temperature across global land and ocean surfaces was 1.69°F (0.94°C) above the 20th century average. This was the highest among all 137 years in the 1880–2016

Deniers of Change • Elected House Majority
leader Paul Ryan. • “I don’t know the
answer to that question and I don’t think science does either”
• Senator Jim Inhofe of Oklahoma is the new Chairman of the Environmental and Public works committee.
• He has written a book dismissing climate science as a hoax.

http://thinkprogress.org/climate/2015/01/08/3608427/climate-denier-caucus-114th-congress/
The Anti-Science Climate Denier Caucus
170 elected representatives have taken over $63.8 million from the fossil fuel industry that’s driving the carbon emissions which cause climate change.
Over 56 percent of Republicans in the 114th congress either denied or questioned the science behind climate change

Contributions from the fossil fuel industry
• 38 Climate Deniers in the Senate have taken
– ~28 million dollars
• 131 Climate Deniers in the House have taken
– ~35million dollars

Our Elected Officials
• Senator Lisa Murkowski, (R-AK) – Incoming Chairman, Energy & Natural Resources Committee, $733,144 from oil and gas industry in her career
• Sen. Mike Enzi (R-WY), $489,933 from oil and gas industry in his career
• Ex-Governor Rick Perry (R-TX), $977,624 from oil and gas for his 2012 Presidential Campaign
• Speaker John Boehner (R-OH), $1,463,788 from oil and gas industry in his career
• Previous Senate Majority Leader Mitch McConnell (R-KY), $1,783,169 from oil and gas industry in his career.
• Senator Mitch McConnell (R-KY), $1,783,169 from oil and gas industry in his career
• Senator Rand Paul (R-KY), $129,305 from oil and gas industry in his career
• Senate Majority leader Rep. Paul Ryan (R-WI), on whether human activity causes climate change, $508,549 from oil and gas industry in his career.
• Senator Ted Cruz (R-TX), $932,568 from oil and gas industry in his career
• Ex-Rep. Steve Stockman (R-TX), $118,100 from oil and gas industry in his career

Future Scenarios
• We are currently on the greatest trajectory (RCP 8.5).
IPCC (2013)

There is still hope
• The Conference of the parties is the supreme body of the united Nations Framework Convention on Climate change (UNFCCC).
Conference of the Parties (COP)
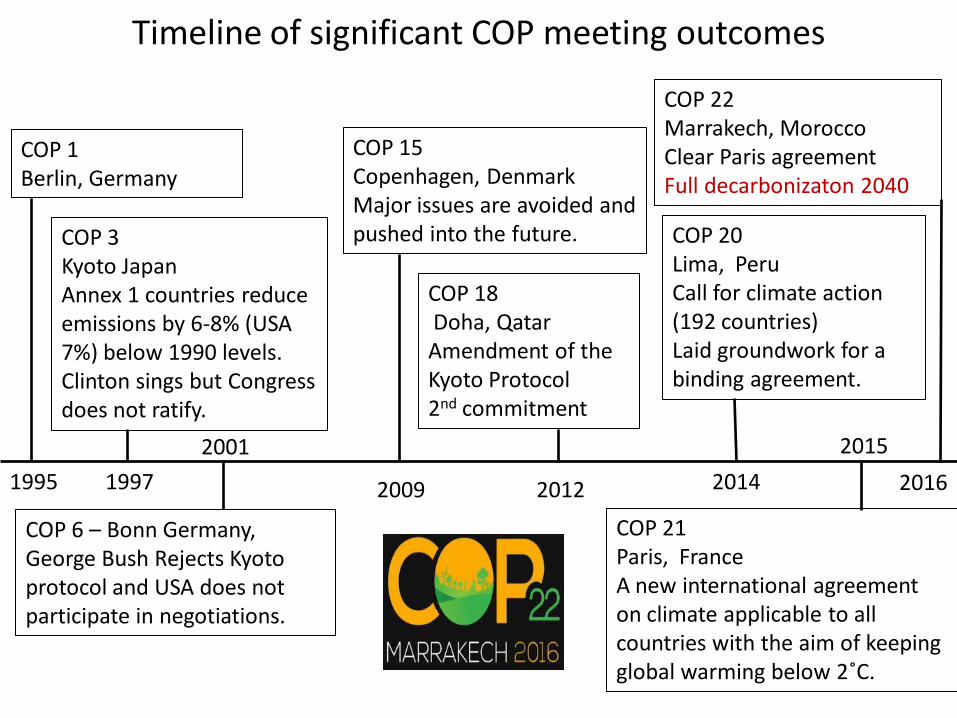
COP 3 Kyoto Japan Annex 1 countries reduce emissions by 6-8% (USA 7%) below 1990 levels. Clinton sings but Congress does not ratify.
COP 1 Berlin, Germany
COP 15 Copenhagen, Denmark Major issues are avoided and pushed into the future.
COP 6 – Bonn Germany, George Bush Rejects Kyoto protocol and USA does not participate in negotiations.
COP 20 Lima, Peru Call for climate action (192 countries) Laid groundwork for a binding agreement.
COP 21 Paris, France A new international agreement on climate applicable to all countries with the aim of keeping global warming below 2˚C.
COP 18 Doha, Qatar Amendment of the Kyoto Protocol 2nd commitment
2012 1995 1997
2001
2009 2014
2015
Timeline of significant COP meeting outcomes
COP 22 Marrakech, Morocco Clear Paris agreement Full decarbonizaton 2040
2016

131/197 Parties have ratified
• Keep global temperatures below 2˚C (optimistically 1.5 ˚C )
• Limit the amount of GHG’s to what the Earth can absorb naturally.
• To review each countries contribution to cutting emissions every 5 years.
• Rich countries help poorer countries.
• On 4 November 2016 the Agreement went into force.

HOW?
• Crops for carbon capture?
– 1/3 of total arable land on the planet. 1/3 land in the U.S.
– Loss of terrestrial species perhaps worse than climate change itself.
• Plowing biochar into agricultural plots?
– Earths albedo would be decreased
– Add pulverized reflective rock like silicate to offset this
– To cut 12% of emissions would take 45% of the Earths land surface.
– Huge environmental implications as a result of the mining not to mention huge costs ($60 Trillion).
• Ocean fertilization with Iron to increase its ability to store carbon? – Unintended consequences to Marine Life

The Target Must Be Zero • Longer term sea level rise impacts will continue well past eh 21st
century.
• As much as 1/3 of emissions could be cut by stopping deforestation.
• Renewable power

Thank You
Any Questions


