The Caribbean Community Climate Change Centre THE CARIBBEAN AT 1.5 AN INVESTIGATION OF THE RELATIVE IMPACT OF RCP2.6 & 4.5 ON WATER AVAILABILITY IN BARBADOS IN 2050 • UWI - CERMES Water Group , Dr Adrian Cashman
Transcript
The Caribbean Community Climate Change Centre
THE CARIBBEAN AT 1.5
AN INVESTIGATION OF THE RELATIVE IMPACT OF RCP2.6 & 4.5 ON WATER AVAILABILITY IN
BARBADOS IN 2050
• UWI- CERMES Water Group, Dr Adrian Cashman
Lorem ipsum dolor sit amet, consectetur adipiscing elit, sed do eiusmod tempor incididunt ut labore et
dolore magna aliqua.
HOW CAN THIS PROGRAMME/ACTIVITY/ RESEARCH ADDRESS
1. Climate Policy Level
• Inform national Integrated Water Resources Management &
Adaptation strategies
• Inform investments in Adaptation options
2. Climate Technical/ Research Level
• Reinforces the importance of monitoring & data collection
• Highlights the role modelling can play in informing decision-
making
3. Climate Individual/ Community Level
Lorem ipsum dolor sit amet, consectetur adipiscing elit, sed do eiusmod tempor incididunt ut labore et
dolore magna aliqua.
Sustainable Water Management under Climate Change in Small
Island Developing States of the Caribbean (Water-aCCSIS)
&
Global Local Caribbean Climate Change Adaptation
and Mitigation Scenarios (GoLoCarSce)
1. Basic Data
1. Sectors: Water & Economic
2. Place of interventions: Barbados
3. Financial: Funded by ACP Caribbean Pacific Research Program for Sustainable Development &
IDRC
2. Justification: Adaptation strategies need to take a long term perspective and to
use available information to inform decision-making
3. Major objectives: To investigate the impact of climate change on water availability
Groundwater Resources
• Estimate of available yields have varied greatly over the years:
• Senn (1946) 112.05 Mm3/a
• Tullstrom (1964) 65.70 Mm3/a
• Stanley Associates (1978)
• Normal rainfall conditions 90.90 Mm3/a
• 1:15 year Drought condition 57.02 Mm3/a
• 1996 estimate 82.27 Mm3/a
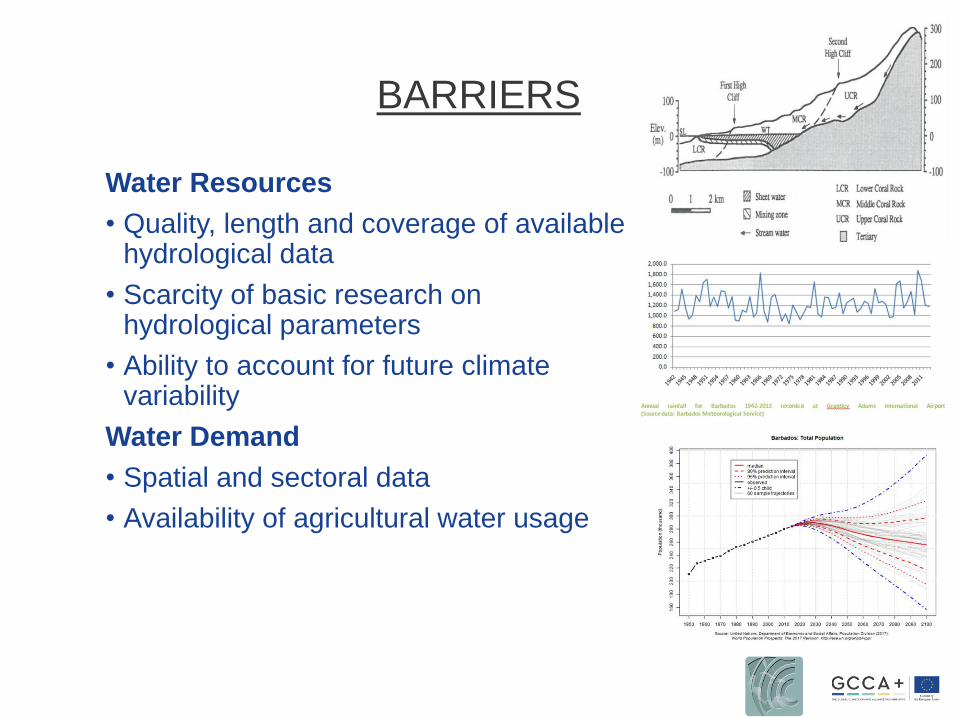
Based on average rainfalls of between 1,500 – 1,400 mm/a
Long term average rainfall (1942-2015) is closer to 1,200 mm/a
BARRIERS
Water Resources
• Quality, length and coverage of available hydrological data
• Scarcity of basic research on hydrological parameters
• Ability to account for future climate variability
Water Demand
• Spatial and sectoral data
• Availability of agricultural water usage
Lorem ipsum dolor sit amet, consectetur adipiscing elit, sed do eiusmod tempor incididunt ut labore et
dolore magna aliqua.
RESULTS
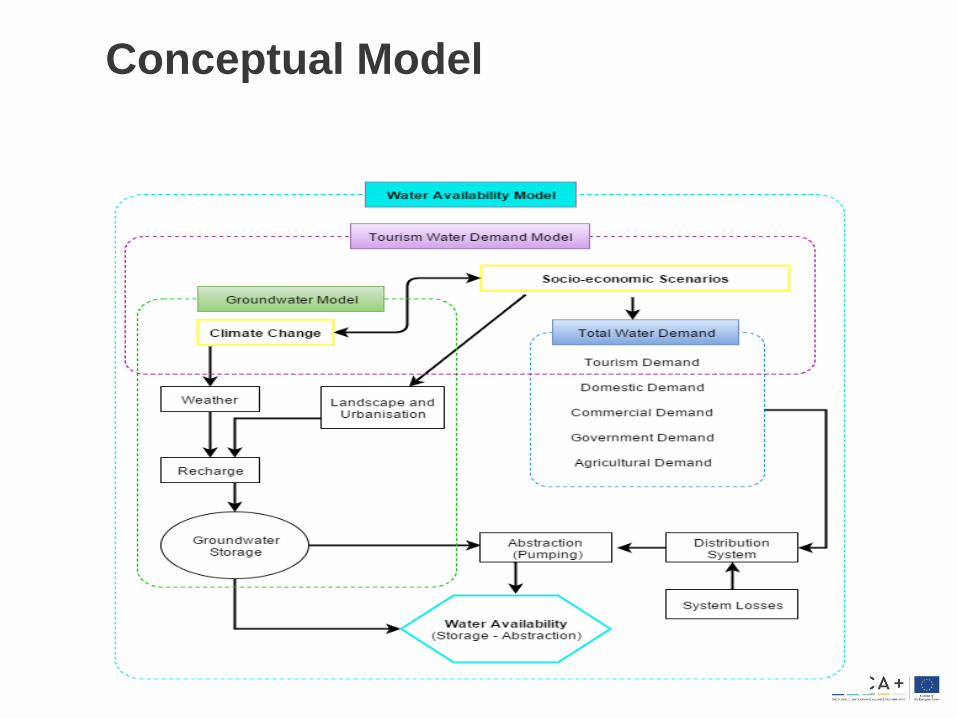
Conceptual Model
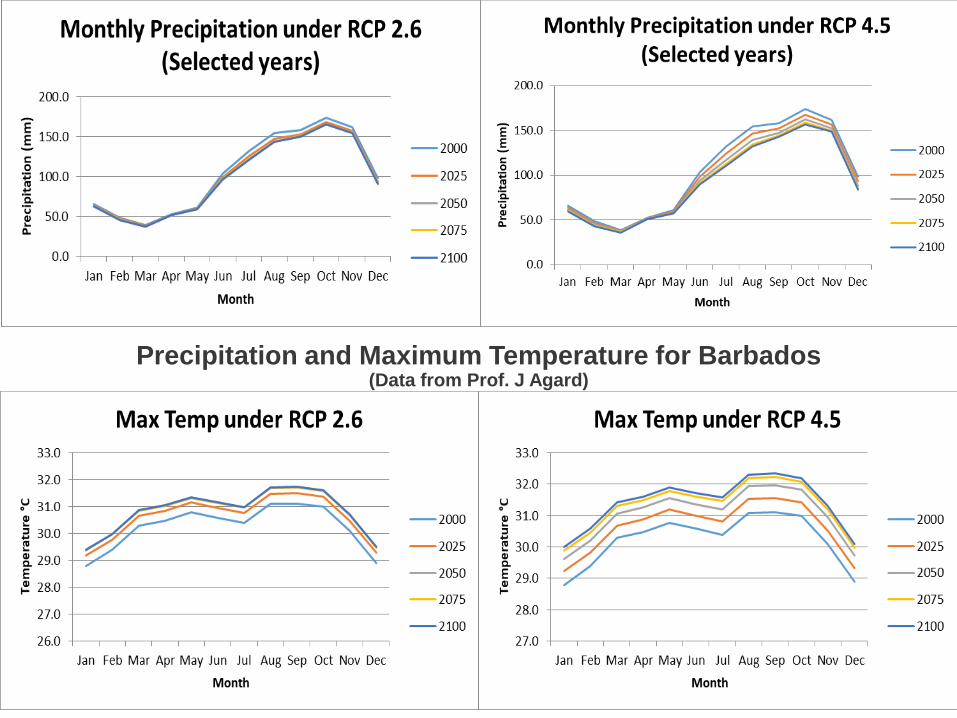
Precipitation and Maximum Temperature for Barbados(Data from Prof. J Agard)
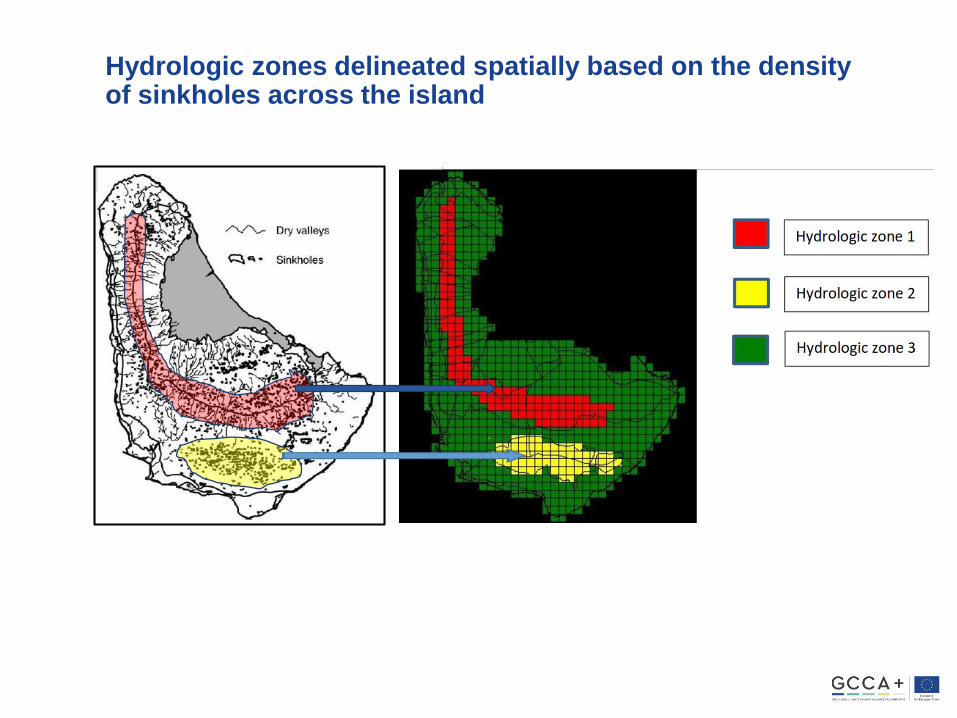
Hydrologic zones delineated spatially based on the density of sinkholes across the island
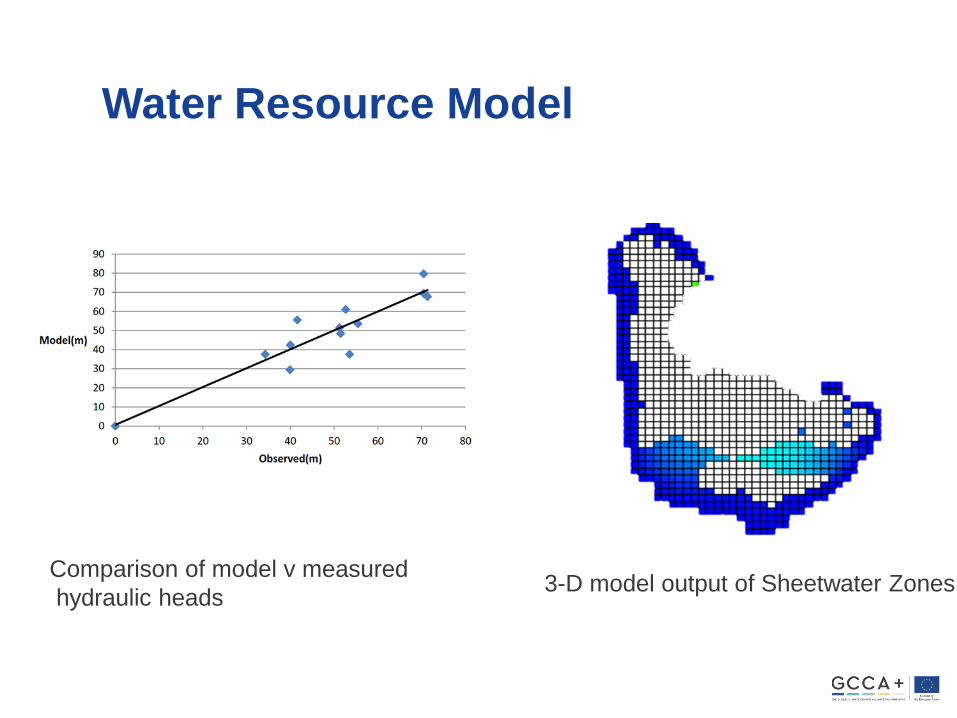
Water Resource Model
Comparison of model v measured
hydraulic heads3-D model output of Sheetwater Zones
Groundwater Resource ModelDeveloped by Karl Payne & Anuradha Maharaj
• Developed a 3-D representation of
Barbados’ groundwater aquifers
using MODFLOW 2000
• Model has been calibrated to field
observations from BWA and gives
a good representation of the
occurrence of the sheet water zone
(main supply aquifer) when
compared to actual occurrence
• Model captures groundwater flow
dynamics within aquifers.
• Model predicts changes in
hydraulic head due to changes in
hydrologic stresses.
• Model complexity is constrained by
data limitations. Model strikes a
balance between simplicity &
accuracy.
• Model does not (yet) account for
decreases in supply due to saline
intrusion.
Groundwater Modelling Results - 2050
• Under RCP 2.6 Aquifer steady state yield 26.90 Mm3/a
• Under RCP 4.5 Aquifer steady state yield 23.00 Mm3/a
Two conclusions:
1. Compared to the existing levels of abstraction (currently at or exceeding the safe yield), climate change will have a significant impact on the safe yield
2. The difference between RCP 2.6 and 4.5 in terms of impact on yields is not as acute as the overall impact of other changes
Water Demand Modelling
Note this does not include losses from the water distribution system.
Water Demand Modelling - 2050
• Considered the impact of 4 different socio-economic development pathways as well as 3 RCP scenarios on sectoral water demands
• This resulted in 7 different modelling scenarios for a time-slice of 2046-2055
• Socio-economic scenarios were developed as part of the Future Foresight research work
Scenario
number
1 2 3 4 5 6 7
Socio-
economic
scenario
CS1: Cool
Runnings
CS1: Cool
Runnings
CS2: Island
in the Sun
CS3: The
Harder they
Come
CS3: The
Harder they
Come
CS4: Pirates
of the
Caribbean
CS4: Pirates
of the
Caribbean
RCP 2.6 4.5 2.6 4.5 8.5 4.5 8.5
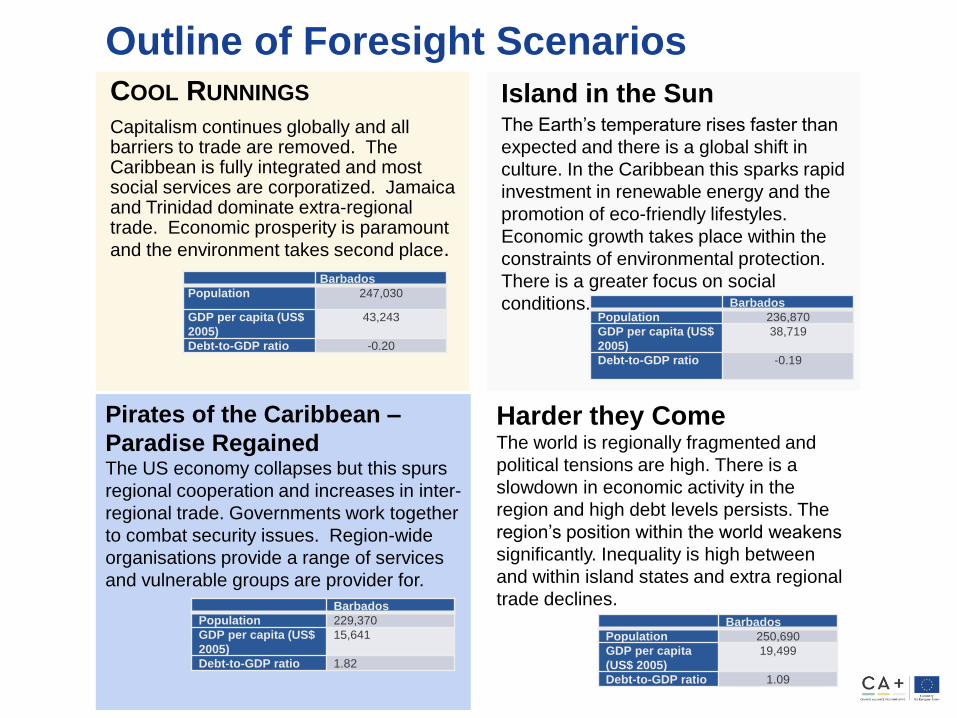
Outline of Foresight ScenariosCOOL RUNNINGS
Capitalism continues globally and all barriers to trade are removed. The Caribbean is fully integrated and most social services are corporatized. Jamaica and Trinidad dominate extra-regional trade. Economic prosperity is paramount
and the environment takes second place.
Barbados
Population 247,030
GDP per capita (US$
2005)
43,243
Debt-to-GDP ratio -0.20
Island in the SunThe Earth’s temperature rises faster than
expected and there is a global shift in
culture. In the Caribbean this sparks rapid
investment in renewable energy and the
promotion of eco-friendly lifestyles.
Economic growth takes place within the
constraints of environmental protection.
There is a greater focus on social
conditions. Barbados
Population 236,870
GDP per capita (US$
2005)
38,719
Debt-to-GDP ratio -0.19
Harder they ComeThe world is regionally fragmented and
political tensions are high. There is a
slowdown in economic activity in the
region and high debt levels persists. The
region’s position within the world weakens
significantly. Inequality is high between
and within island states and extra regional
trade declines.Barbados
Population 250,690
GDP per capita
(US$ 2005)
19,499
Debt-to-GDP ratio 1.09
Pirates of the Caribbean –
Paradise RegainedThe US economy collapses but this spurs
regional cooperation and increases in inter-
regional trade. Governments work together
to combat security issues. Region-wide
organisations provide a range of services
and vulnerable groups are provider for.
Barbados
Population 229,370
GDP per capita (US$
2005)
15,641
Debt-to-GDP ratio 1.82
Water Demand Modelling - 2050
• Water Demand Modelling incorporated sub-models for:• Tourism water demand
• Hotels, Cruise, Restaurants & Golf courses
• Domestic water demand• Calculate water use per household per month with a reducing logarithmic
trend to project forward and combined with estimates of population and households
• Commercial water demand• Calculated from historical level of water demand per month per unit of
commercial GDP with forecasted GDP per capita, population and a forecasted share of commerce in GDP
• Government water demand• Calculate using historical level of water demand per month per unit of
government GDP combined with forecasted GDP per capita, population and a forecast of the share of government in GDP
• Irrigated Agriculture water demand• Calculated as water use per unit of agricultural GDP and regressed this on
rainfall
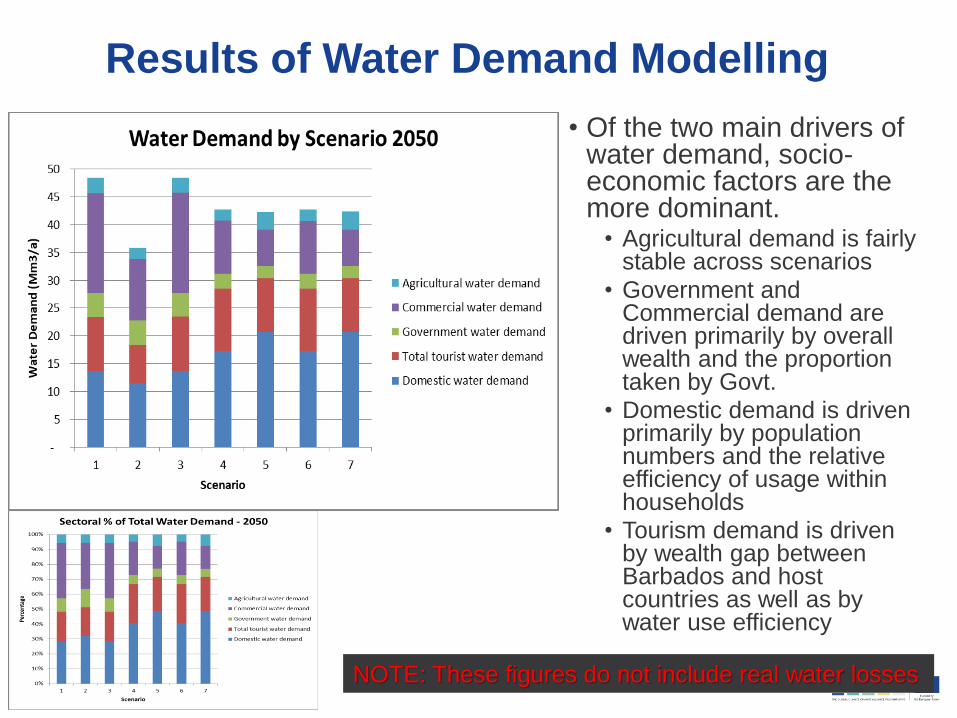
Results of Water Demand Modelling
• Of the two main drivers of water demand, socio-economic factors are the more dominant.
• Agricultural demand is fairly stable across scenarios
• Government and Commercial demand are driven primarily by overall wealth and the proportion taken by Govt.
• Domestic demand is driven primarily by population numbers and the relative efficiency of usage within households
• Tourism demand is driven by wealth gap between Barbados and host countries as well as by water use efficiency
NOTE: These figures do not include real water losses
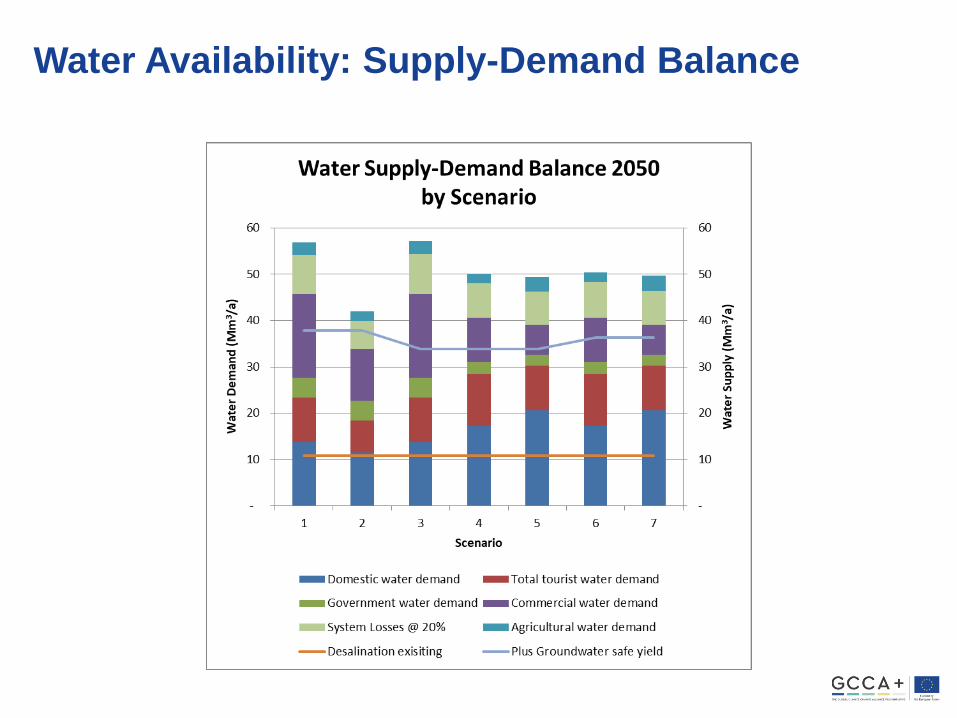
Water Availability: Supply-Demand Balance
Adaptation Policy Implications
A. Increase supply
B. Decrease demand (alter consumer behaviour)
C. Do Both
Policy Option: Increase supply
• Increase desalination capacity• Actively being considered – 2 additional plants
• High Capex and Opex
• Energy considerations
• Harness run-off • Capture run-off and use directly
• Rainwater harvesting
• Check dams
• Capture run-off and increase aquifer recharge
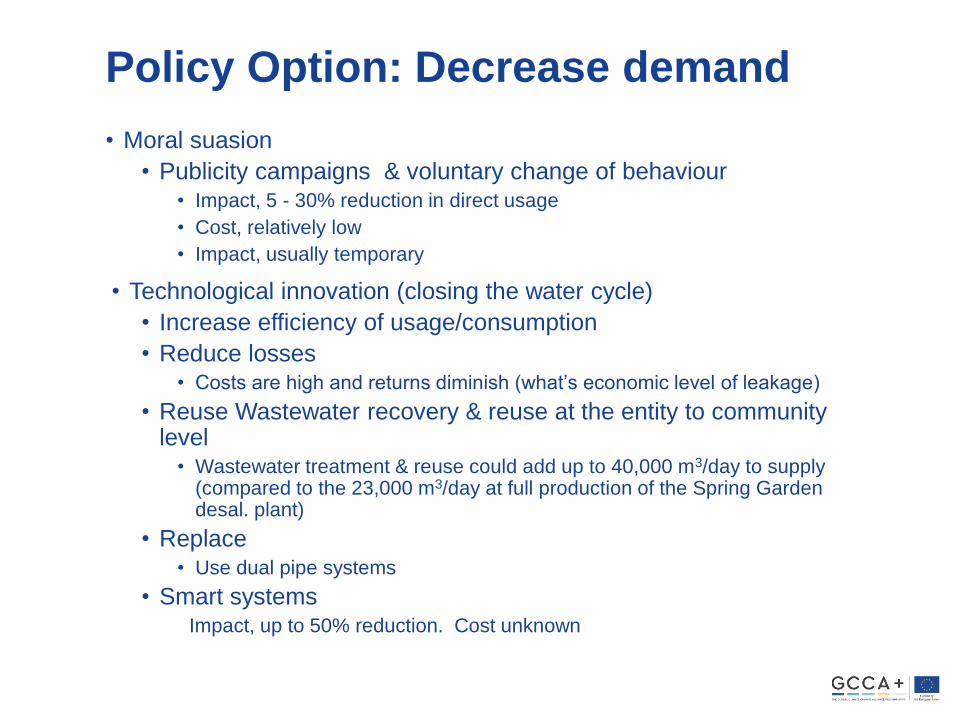
Policy Option: Decrease demand
• Moral suasion
• Publicity campaigns & voluntary change of behaviour• Impact, 5 - 30% reduction in direct usage
• Cost, relatively low
• Impact, usually temporary
• Technological innovation (closing the water cycle)
• Increase efficiency of usage/consumption
• Reduce losses• Costs are high and returns diminish (what’s economic level of leakage)
• Reuse Wastewater recovery & reuse at the entity to community level
• Wastewater treatment & reuse could add up to 40,000 m3/day to supply (compared to the 23,000 m3/day at full production of the Spring Garden desal. plant)
• Replace• Use dual pipe systems
• Smart systemsImpact, up to 50% reduction. Cost unknown
Policy Option: Decrease demand
• Use of economic incentives (+ ve & - ve)• Provision of subsidies to change usage patterns
• Innovative tariff structures• Time adjusted tariffs
• Scarcity adjusted tariffs
• Cap and trade schemes
• Imposition of bans and restrictions – with associated penalties
• Impact depends on the elasticity of demand• Domestic demand is relatively inelastic
Lessons Learnt
• We have only just begun to scratch the surface in using modelling to inform long term water resource planning and development
• We need to better account for socio-economic trends and technological developments
• Need to develop better hydrological models that couple surface and groundwater and, groundwater-seawater interface
• Need for capacity building in water resources modelling
Conclusions
Groundwater Modelling
• Much more needs to be done to improve the modelling
Water Demand Modelling
• A more systematic approach to data collection and analysis is required for water demand forecasting
1.5°C versus 2.0°C
• The relative difference in impact on groundwater resources appears small BUT overall the impact is extremely significant
• Socio-economic changes are likely to be more significant with respect to water demand, more so than climate change
This work has not considered the impact of Climate Variability on availability


![ZR Climate Change Presentation [Kompatibilitätsmodus] · climatic weather input data ... RCP 2.6 & RCP 4.5 . Results ... ZR_Climate_Change_Presentation [Kompatibilitätsmodus] Author:](https://static.documents.pub/doc/80x56/5b16ea857f8b9a057f8b534f/zr-climate-change-presentation-kompatibilitaetsmodus-climatic-weather-input.jpg)


