The causal impact of school breakfast clubs on academic attainment Evaluating the Magic Breakfast intervention Claire Crawford 1, 2 Ellen Greaves 1, 3 Christine Farquharson 1 1 Institute for Fiscal Studies 2 University of Warwick 3 University of Bristol 10 April 2017
Transcript
The causal impact of school breakfast clubs onacademic attainment
Evaluating the Magic Breakfast intervention
Claire Crawford 1,2 Ellen Greaves 1,3 Christine Farquharson 1
1Institute for Fiscal Studies
2University of Warwick
3University of Bristol
10 April 2017
Motivation
I 62% of UK school staff witness children arriving hungry atschool on a weekly basis (Association for Public ServiceExcellence, 2014)
I Unhealthy or absent breakfasts associated with cognitive,behavioural, and health problems in children
I Policymakers seek to address this through school nutritionprogrammes
I Welsh school breakfast programme (mandated 2013)I England’s School Food Plan (2013)
Research Questions
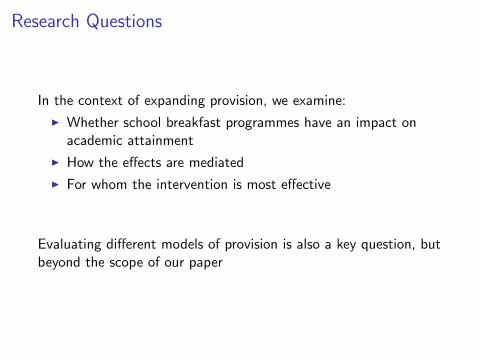
In the context of expanding provision, we examine:
I Whether school breakfast programmes have an impact onacademic attainment
I How the effects are mediated
I For whom the intervention is most effective
Evaluating different models of provision is also a key question, butbeyond the scope of our paper
This paper
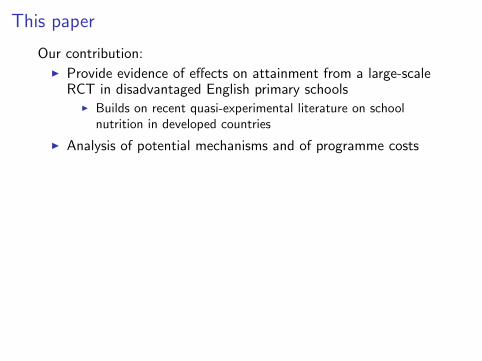
Our contribution:I Provide evidence of effects on attainment from a large-scale
RCT in disadvantaged English primary schoolsI Builds on recent quasi-experimental literature on school
nutrition in developed countries
I Analysis of potential mechanisms and of programme costs
Key results:
I Breakfast club provision increases academic attainment byaround 0.13 standard deviations (∼2 months’ progress)
I Gains are driven by better behaviour and concentration, andpossibly improved health
I Highly cost-effective - £24.01 per eligible pupil per year
I Evidence of spillovers between groups and peer effects inlearning
This paper
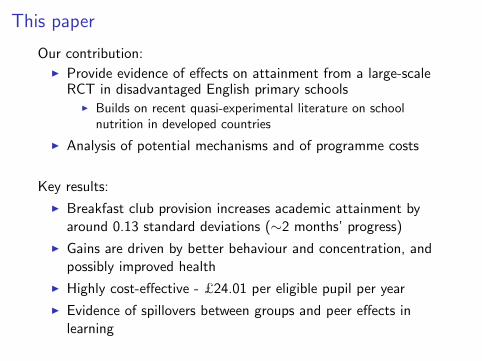
Our contribution:I Provide evidence of effects on attainment from a large-scale
RCT in disadvantaged English primary schoolsI Builds on recent quasi-experimental literature on school
nutrition in developed countries
I Analysis of potential mechanisms and of programme costs
Key results:
I Breakfast club provision increases academic attainment byaround 0.13 standard deviations (∼2 months’ progress)
I Gains are driven by better behaviour and concentration, andpossibly improved health
I Highly cost-effective - £24.01 per eligible pupil per year
I Evidence of spillovers between groups and peer effects inlearning
Outline
1. Existing evidence
2. Intervention and methodology
3. Results
4. Cost
5. Conclusion
Nutrition and Human Capital
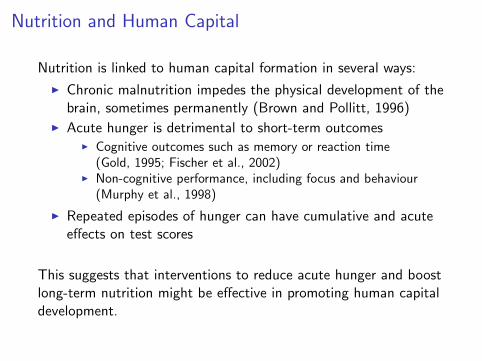
Nutrition is linked to human capital formation in several ways:
I Chronic malnutrition impedes the physical development of thebrain, sometimes permanently (Brown and Pollitt, 1996)
I Acute hunger is detrimental to short-term outcomesI Cognitive outcomes such as memory or reaction time
(Gold, 1995; Fischer et al., 2002)I Non-cognitive performance, including focus and behaviour
(Murphy et al., 1998)
I Repeated episodes of hunger can have cumulative and acuteeffects on test scores
This suggests that interventions to reduce acute hunger and boostlong-term nutrition might be effective in promoting human capitaldevelopment.
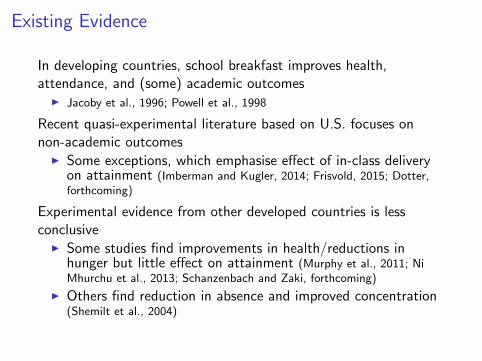
Existing Evidence
In developing countries, school breakfast improves health,attendance, and (some) academic outcomes
I Jacoby et al., 1996; Powell et al., 1998
Recent quasi-experimental literature based on U.S. focuses onnon-academic outcomes
I Some exceptions, which emphasise effect of in-class deliveryon attainment (Imberman and Kugler, 2014; Frisvold, 2015; Dotter,forthcoming)
Experimental evidence from other developed countries is lessconclusive
I Some studies find improvements in health/reductions inhunger but little effect on attainment (Murphy et al., 2011; NiMhurchu et al., 2013; Schanzenbach and Zaki, forthcoming)
I Others find reduction in absence and improved concentration(Shemilt et al., 2004)
Model
Model attainment of pupil i with classroom peers i in year t:Yit = f (Yi ,t−1,Qit ,Ei t ,Eit , Lit)
where Yi ,t−1 is prior attainment; Qit is teacher effectiveness;Eit and Ei t are the efforts of the pupil and her classroom peers;and Lit is the pupil’s learning time.
The inputs for Yit also depend on the pupil’s health (Hit), theattendance of her peers (Li t), and a fixed component of teacherquality Q i .
Lit = g(Li t ,Hit)Eit = h(Ei t ,Ei ,Hit)Qit = q(Ei t ,Q i , Li t)
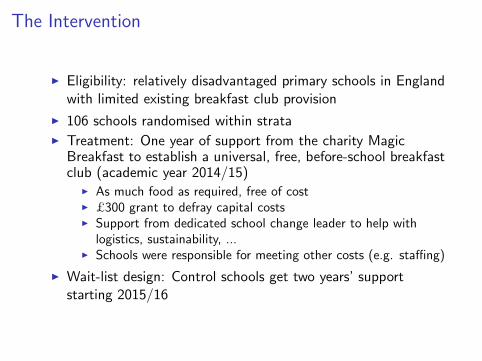
The Intervention
I Eligibility: relatively disadvantaged primary schools in Englandwith limited existing breakfast club provision
I 106 schools randomised within strataI Treatment: One year of support from the charity Magic
Breakfast to establish a universal, free, before-school breakfastclub (academic year 2014/15)
I As much food as required, free of costI £300 grant to defray capital costsI Support from dedicated school change leader to help with
logistics, sustainability, ...I Schools were responsible for meeting other costs (e.g. staffing)
I Wait-list design: Control schools get two years’ supportstarting 2015/16
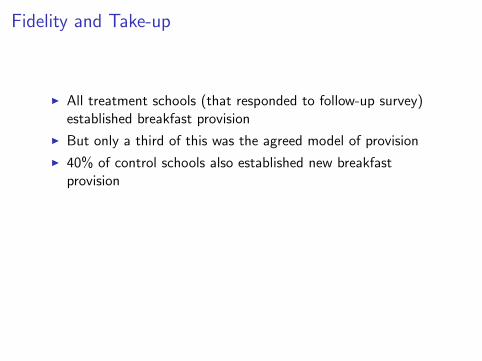
Fidelity and Take-up
I All treatment schools (that responded to follow-up survey)established breakfast provision
I But only a third of this was the agreed model of provision
I 40% of control schools also established new breakfastprovision
Pupil take-up is on the low end of estimates in the literature:
I Average take-up is just 13%
I Three-quarters of schools serve fewer than 50 students
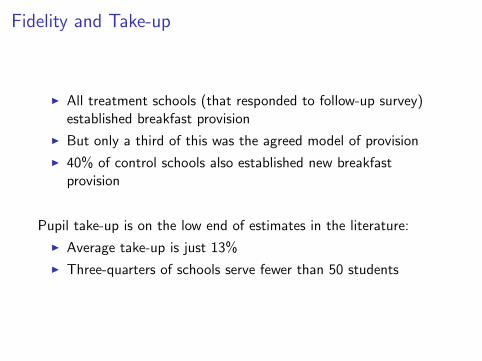
Data and Methodology
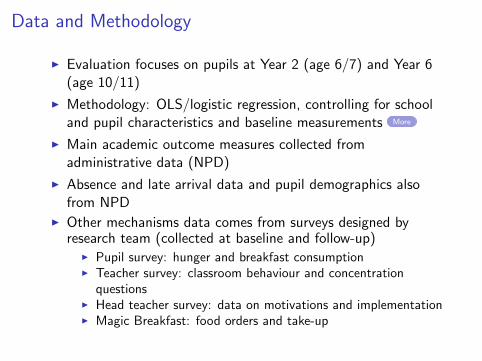
I Evaluation focuses on pupils at Year 2 (age 6/7) and Year 6(age 10/11)
I Methodology: OLS/logistic regression, controlling for schooland pupil characteristics and baseline measurements More
I Main academic outcome measures collected fromadministrative data (NPD)
I Absence and late arrival data and pupil demographics alsofrom NPD
I Other mechanisms data comes from surveys designed byresearch team (collected at baseline and follow-up)
I Pupil survey: hunger and breakfast consumptionI Teacher survey: classroom behaviour and concentration
questionsI Head teacher survey: data on motivations and implementationI Magic Breakfast: food orders and take-up
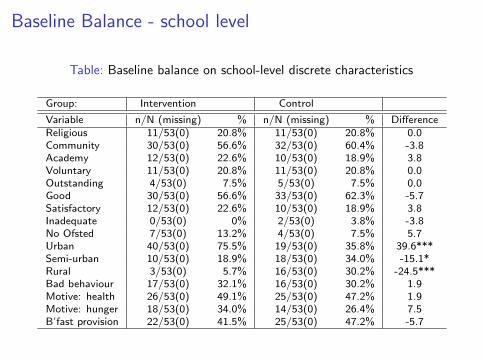
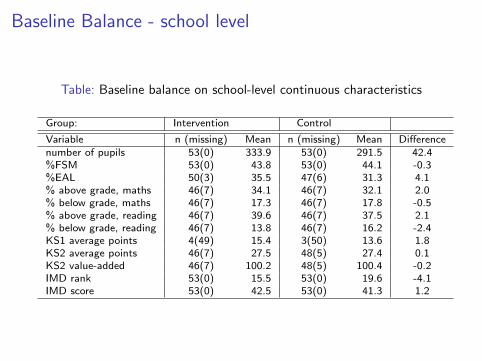
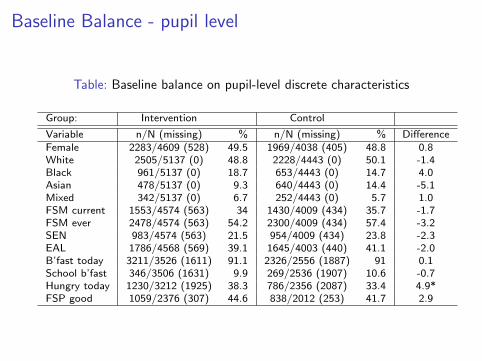
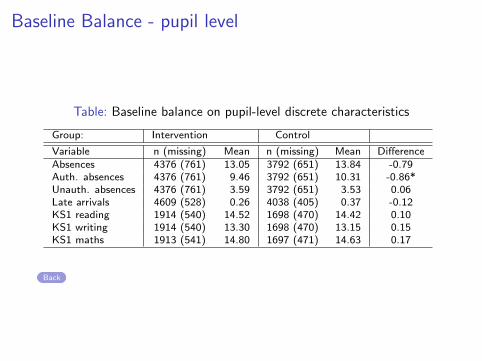
Evaluation Sample
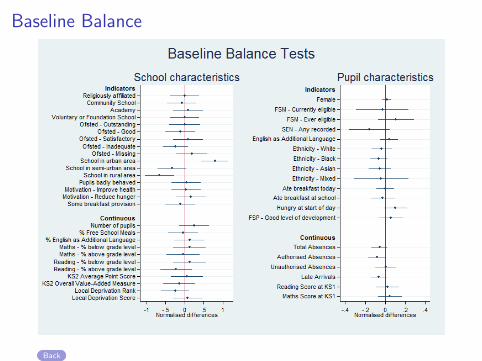
I By design, schools are more disadvantaged than the averageEnglish school
I 82% of participating schools in bottom 30% of neighbourhoods
I Well-balanced on observables, but treatment schools...I are significantly more urbanI have a significantly higher proportion of students reporting
hunger at baselineI have significantly fewer authorised absences in 2013/14
Balance
Academic Outcomes
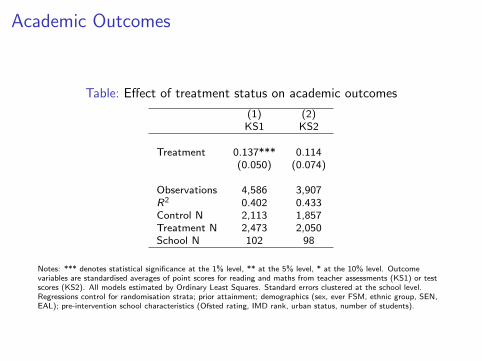
Table: Effect of treatment status on academic outcomes
(1) (2)KS1 KS2
Treatment 0.137*** 0.114(0.050) (0.074)
Observations 4,586 3,907R2 0.402 0.433Control N 2,113 1,857Treatment N 2,473 2,050School N 102 98
Notes: *** denotes statistical significance at the 1% level, ** at the 5% level, * at the 10% level. Outcomevariables are standardised averages of point scores for reading and maths from teacher assessments (KS1) or testscores (KS2). All models estimated by Ordinary Least Squares. Standard errors clustered at the school level.Regressions control for randomisation strata; prior attainment; demographics (sex, ever FSM, ethnic group, SEN,EAL); pre-intervention school characteristics (Ofsted rating, IMD rank, urban status, number of students).
Potential Mechanisms
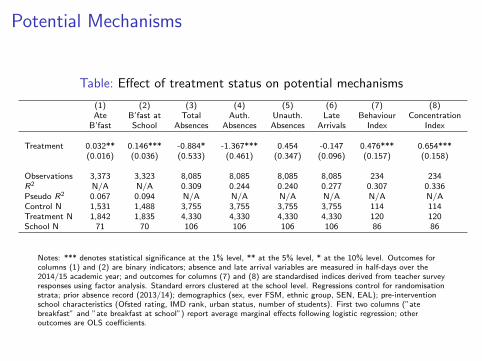
Table: Effect of treatment status on potential mechanisms
(1) (2) (3) (4) (5) (6) (7) (8)Ate B’fast at Total Auth. Unauth. Late Behaviour Concentration
B’fast School Absences Absences Absences Arrivals Index Index
Notes: *** denotes statistical significance at the 1% level, ** at the 5% level, * at the 10% level. Outcomes forcolumns (1) and (2) are binary indicators; absence and late arrival variables are measured in half-days over the2014/15 academic year; and outcomes for columns (7) and (8) are standardised indices derived from teacher surveyresponses using factor analysis. Standard errors clustered at the school level. Regressions control for randomisationstrata; prior absence record (2013/14); demographics (sex, ever FSM, ethnic group, SEN, EAL); pre-interventionschool characteristics (Ofsted rating, IMD rank, urban status, number of students). First two columns (”atebreakfast” and ”ate breakfast at school”) report average marginal effects following logistic regression; otheroutcomes are OLS coefficients.
Subgroup Analysis
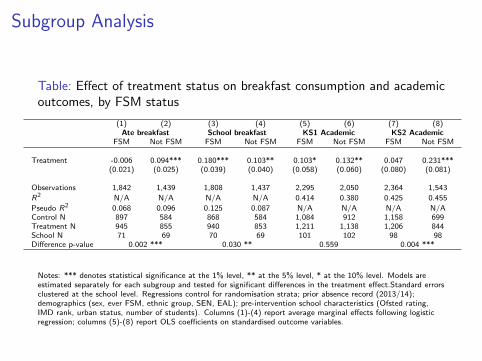
Table: Effect of treatment status on breakfast consumption and academicoutcomes, by FSM status
Notes: *** denotes statistical significance at the 1% level, ** at the 5% level, * at the 10% level. Models areestimated separately for each subgroup and tested for significant differences in the treatment effect.Standard errorsclustered at the school level. Regressions control for randomisation strata; prior absence record (2013/14);demographics (sex, ever FSM, ethnic group, SEN, EAL); pre-intervention school characteristics (Ofsted rating,IMD rank, urban status, number of students). Columns (1)-(4) report average marginal effects following logisticregression; columns (5)-(8) report OLS coefficients on standardised outcome variables.
Cost per Pupil
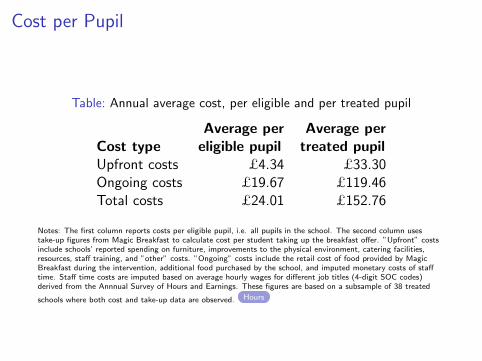
Table: Annual average cost, per eligible and per treated pupil
Average per Average perCost type eligible pupil treated pupilUpfront costs £4.34 £33.30Ongoing costs £19.67 £119.46Total costs £24.01 £152.76
Notes: The first column reports costs per eligible pupil, i.e. all pupils in the school. The second column usestake-up figures from Magic Breakfast to calculate cost per student taking up the breakfast offer. ”Upfront” costsinclude schools’ reported spending on furniture, improvements to the physical environment, catering facilities,resources, staff training, and ”other” costs. ”Ongoing” costs include the retail cost of food provided by MagicBreakfast during the intervention, additional food purchased by the school, and imputed monetary costs of stafftime. Staff time costs are imputed based on average hourly wages for different job titles (4-digit SOC codes)derived from the Annnual Survey of Hours and Earnings. These figures are based on a subsample of 38 treated
schools where both cost and take-up data are observed. Hours
Conclusion
I Breakfast club provision in disadvantaged schools has apositive impact on pupil attainment (equivalent to about 2months’ progress)
I Distribution of the academic gains is uneven:I Larger at KS1 than KS2I Larger for non-FSM students
I Multiple mechanisms mediating this, but the most importantappears to be behaviour and concentration
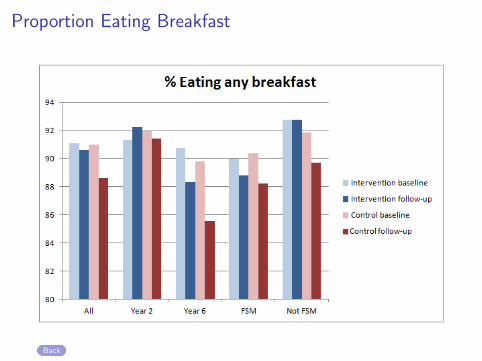
I Limited effect on overall breakfast consumption - suggeststhat the content/context of school breakfast are important
I Cost-effective intervention requiring just £24.01 and 3.1 hoursper eligible pupil per year
I Given proven benefits and substantial policy interest, furtherresearch required to investigate optimal model of delivery inEngland
Appendix
Methodology
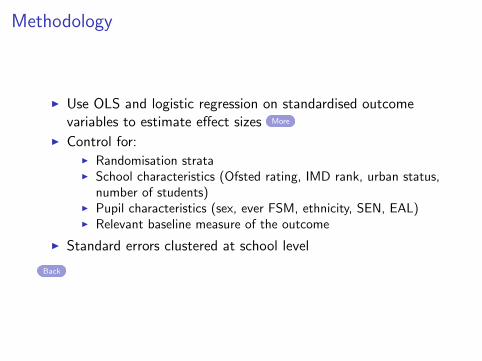
I Use OLS and logistic regression on standardised outcomevariables to estimate effect sizes More
I Control for:I Randomisation strataI School characteristics (Ofsted rating, IMD rank, urban status,
number of students)I Pupil characteristics (sex, ever FSM, ethnicity, SEN, EAL)I Relevant baseline measure of the outcome
I Standard errors clustered at school level
Back
Methodology
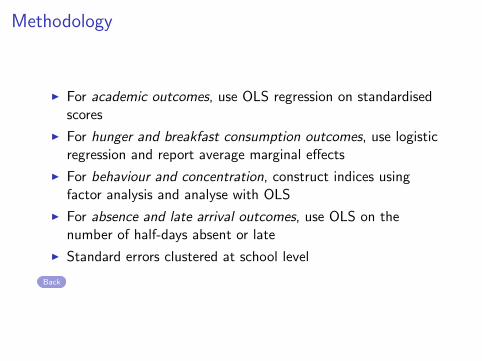
I For academic outcomes, use OLS regression on standardisedscores
I For hunger and breakfast consumption outcomes, use logisticregression and report average marginal effects
I For behaviour and concentration, construct indices usingfactor analysis and analyse with OLS
I For absence and late arrival outcomes, use OLS on thenumber of half-days absent or late
I Standard errors clustered at school level
Back
Baseline Balance
Back
Baseline Balance - school level
Table: Baseline balance on school-level discrete characteristics
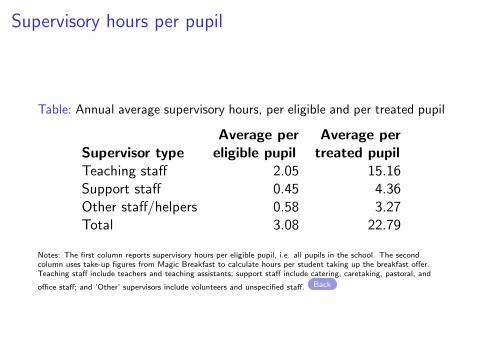
Table: Annual average supervisory hours, per eligible and per treated pupil
Average per Average perSupervisor type eligible pupil treated pupilTeaching staff 2.05 15.16Support staff 0.45 4.36Other staff/helpers 0.58 3.27Total 3.08 22.79
Notes: The first column reports supervisory hours per eligible pupil, i.e. all pupils in the school. The secondcolumn uses take-up figures from Magic Breakfast to calculate hours per student taking up the breakfast offer.Teaching staff include teachers and teaching assistants; support staff include catering, caretaking, pastoral, and
office staff; and ’Other’ supervisors include volunteers and unspecified staff. Back


![Bayesian Causal Inference - uni-muenchen.de...from causal inference have been attracting much interest recently. [HHH18] propose that causal [HHH18] propose that causal inference stands](https://static.documents.pub/doc/80x56/5ec457b21b32702dbe2c9d4c/bayesian-causal-inference-uni-from-causal-inference-have-been-attracting.jpg)


