Working Papers R & D CIMSO The Centre for Integrated Manufacturing and Service Operations DESIGN OF CLOSED LOOP SUPPLY CHAINS: A PRODUCTION AND RETURN NETWORK FOR REFRIGERATORS by H. KRIKKE* J. BLOEMHOF-RUWAARD** and L. VAN WASSENHOVE† 2001/67/TM/CIMSO 19 * Rotterdam School of Management/Fac. Bedrijfskunde, P.O. Box 1738, 3000 DR, Rotterdam, The Netherlands. ** Rotterdam School of Management/Fac. Bedrijfskunde, P.O. Box 1738, 3000 DR, Rotterdam, The Netherlands. † The Henry Ford Chaired Professor of Manufacturing, Professor of Operations Management, and Director of the Research Centre for Integrated Manufacturing and Service Operations at INSEAD, Boulevard de Constance, 77305 Fontainebleau Cedex, France. A working paper in the INSEAD Working Paper Series is intended as a means whereby a faculty researcher's thoughts and findings may be communicated to interested readers. The paper should be considered preliminary in nature and may require revision. Printed at INSEAD, Fontainebleau, France. Kindly do not reproduce or circulate without permission.
Transcript
Working Papers
R & D CIMSO
The Centre for Integrated Manufacturing and Service Operations
DESIGN OF CLOSED LOOP SUPPLY CHAINS:
A PRODUCTION AND RETURN NETWORK FOR REFRIGERATORS
by
H. KRIKKE* J. BLOEMHOF-RUWAARD**
and L. VAN WASSENHOVE†
2001/67/TM/CIMSO 19
* Rotterdam School of Management/Fac. Bedrijfskunde, P.O. Box 1738, 3000 DR, Rotterdam,
The Netherlands. ** Rotterdam School of Management/Fac. Bedrijfskunde, P.O. Box 1738, 3000 DR, Rotterdam,
The Netherlands. † The Henry Ford Chaired Professor of Manufacturing, Professor of Operations Management,
and Director of the Research Centre for Integrated Manufacturing and Service Operations atINSEAD, Boulevard de Constance, 77305 Fontainebleau Cedex, France.
A working paper in the INSEAD Working Paper Series is intended as a means whereby a faculty researcher's thoughts and findings may be communicated to interested readers. The paper should beconsidered preliminary in nature and may require revision. Printed at INSEAD, Fontainebleau, France. Kindly do not reproduce or circulate without permission.
Design of closed loop supply chains: a production and return network for refrigerators
Harold Krikke1, Jacqueline Bloemhof-Ruwaard1 Luk N. Van Wassenhove2
1 Rotterdam School of Management/Fac. Bedrijfskunde, P.O. Box 1738, 3000
Abstract Increased concern for the environment has lead to new techniques to design products and supply chains that are both economically and ecologically feasible. This paper deals with the product – and corresponding supply chain design for a refrigerator. Literature study shows that there are many models to support product design and logistics separately, but not in an integrated way. In our research we develop quantitative modelling to support an optimal design structure of a product, i.e. modularity, repairability, recyclability, as well as the optimal locations and goods flows allocation in the logistics system. Environmental impacts are measured by energy and waste. Economic costs are modelled as linear functions of volumes with a fixed set-up component for facilities. We apply this model using real life R&D data of a Japanese consumer electronics company. The model is run for different scenarios using different parameter settings such as centralised versus decentralised logistics, alternative product designs, varying return quality and quantity, and potential environmental legislation based on producer responsibility. Keywords: supply chain management, product design, network design, facility location, environment
2
1. Introduction There are many reasons for the growing interest in reverse logistics. One of the most prominent is the growing concern for the environment. In Europe, EU regulation enhances producer responsibility or product stewardship for several branches of industry. This makes Original Equipment Manufacturers (OEMs) formally responsible for the set-up of a takeback and recovery system for products discarded by the last user. Producer responsibility is supplemented by measures such as increased disposal tariffs, disposal bans, restrictions on waste transportation, waste prevention, and emission control. In California (USA), laws have been introduced to reduce air pollution. By 2003, 10% of the cars driving in the Los Angeles area must be electrically powered [1]. Next to legislation, consumers’ demand for clean manufacturing and recycling is increasing. Consumers expect to be able to trade in an old product when they buy a new one. Consequently, retailers expect OEMs to set up a proper reverse logistics system and returned products are expected to be processed and recovered in an environmentally responsible way. Another reason is cost. A well managed reverse logistics program can provide important cost savings in procurement, disposal, inventory carrying and transportation. In this context, looking at the entire supply chain is the best starting point for solutions. Supply Chain Management aims at the integration of traditional ‘forward’ supply chain processes, avoiding local optimisation by emphasising integrality. However, too often reverse logistics is dealt with from an end-of-pipe point of view. In our opinion, reverse supply chains should be part of supply chain integration, because it can contribute to lower overall costs and reduce the environmental impact of the entire supply chain. Moreover product leasing and sales via the internet lead to increased returns and hence to the need of an integrated reverse logistics concept. Traditionally, supply chain processes encompass material supply, production, distribution and consumption. Reverse processes are defined according to ([22] Fleischmann et al., 1999). • Collection refers to all activities rendering used products available and physically moving them to
some point for further treatment. Collection may include purchasing, transportation, and storage activities.
• Inspection / separation denotes all operations determining whether a given product is in fact re-usable and in which way. Thus, inspection and separation results in splitting the flow of used products according to distinct re-use (and disposal) options. Inspection and separation may encompass disassembly, shredding, testing, sorting, and storage steps.
• Re-processing means the actual transformation of a used product into a usable product/component/material again. This transformation may take different forms including recycling, repair, and remanufacturing. In addition, activities such as cleaning, replacement, and re-assembly may be involved.
• Disposal is required for products that cannot be re-used for technical or cost reasons. This applies, e.g., to products rejected at the separation level due to excessive repair requirements but also to products without satisfactory market potential, e.g., due to obsolescence. Disposal may include transportation, landfilling, and incineration steps.
• Re-distribution refers to directing re-usable products to a potential market and to physically moving them to future users. This may include sales , transportation, and storage activities.
Forward and return processes of the supply chain are represented in Figure 1. Optimisation of closed loop supply chains occurs on costs and environmental impact. Supply chain costs are directly linked to supply chain processes, for which a range of costing models is available in the literature. In order to measure the supply chain environmental effects, we use the observation that the supply chain is linked to the environmental chain. All supply chain activities (including the reverse chain) generate emissions and waste which, via diverse processes in the environmental chain eventually have a (negative) impact on our natural resources. In turn, these natural resources are necessary inputs for the supply chain. This is also reflected in Figure 1.
3
The inclusion of environmental criteria clearly adds complexity to the objective function. For example, centralising production facilities may lower overall supply chain costs (in case economies of scale are stronger than the increase in transportation costs), and lead to a worse supply chain environmental impact (more CO2 emissions due to increased transportation). On the other hand, setting up reverse logistics systems may lower disposal costs and reduce waste. The precise measuring of environmental impact will be dealt with in Section 2. primary emissions
resources waste
Figure 1: Closed loop supply chain and environmental chain linked, analogous to ([31] Bloemhof-Ruwaard, 1995) Looking at decision support models available in the literature, we see on the one hand cost models which have location-allocation decision variables and on the other hand environmental (Life Cycle Assessment or analogous) models aiming at product design improvements. Since the design of closed loop supply chains involves trade-offs between supply chain costs and supply chain environmental impact we include both the location-allocation decision for all supply chain processes as well as product design options as decision variables in our model. Another important feature, often mentioned in the literature, is feasibility for recovery (options). This depends on product design aspects such as material composition and ease of disassembly, but also on return quality. Hence recovery feasibility influences costs and environmental impact of the reverse supply chain. The same goes for rate of return, i.e., the quantities of cores collected after use. Finally, environmental legislation has a strong impact on the design of the supply chain. In this paper we limit ourselves to producer responsibility, which imposes collection and recovery targets for discarded products. These are considered as ‘external’ influences hence as parameters. In conclusion, the design of closed loop supply chains requires decisions on (1) location-allocation, where allocation includes the assignment of recovery options and (2) product design. Optimisation is performed with respect to environmental impact (to be specified later on) and cost for all forward and reverse supply chain processes. The aim of the paper is twofold: • To develop a double integrated modelling framework, based on Mixed Integer Linear
Programming, for supply chain design with multiple product design options and multiple product recovery options with varying feasibility. Double integrated refers to the inclusion of forward - and reverse supply chain as well as to multiple objective optimisation of supply chain cost and supply chain environmental impact.
• To provide an illustrative case study, analysing mutual interaction between product design and network design as well as their relative importance in specific situations and to test the robustness of solutions found for varying recovery feasibility, rate of return and recovery targets imposed by
supply
production
distribution
consumer
collection
inspection& separation
reprocessing
re-distribution
disposal
effects water, air, soil pollution
dispersion transformation
alternative market
4
environmental legislation. The case considers a refrigerator of a Japanese manufacturer, extensively described in ([23] Umeda, 1999). We aim to derive intuitive rules of thumb for business managers to support the above design choices. These rules of thumb should be further validated and extended by additional case studies, preferably based on the same modelling framework.
A literature review is presented in Section 2. Section 3 discusses our case. The design problem is supported by Mixed Integer Linear Programming (MILP) in Section 4. Results are presented in Section 5. In Section 6, we discuss generalisations of our model to other problem situations, draw conclusions and present issues for further research. 2 Literature Traditionally, OR-tools help in making good trade-offs in supply chain optimisation on costs. However, environmental impact is becoming increasingly important. This is due, in part, to stakeholders demanding environmental improvements and proof that these have been made ([26] Azzone et al, 1996). Unfortunately, the intrinsic complexity associated with environmental issues means it is difficult to understand all feasible actions available to a firm for reducing its impact on the environment. Life Cycle Assessment (LCA) is regarded as one of the most important environmental management tools today. So far, supply chain models and LCA seem to live in separate worlds. In this overview, we discuss reverse supply chain cost models , closed loop (forward and reverse) supply chain cost models and LCA oriented models. We do not discuss general location-allocation models, since they are not directly applicable to our problem and because the number of models is simply too big. For a review, we refer to ([2] Domschke and Krispin, 1997). Table 1 gives an overview of the most important models and shows none of the models has all the modelling features we are looking for. Below, we summarise the major findings of our literature study, detailed abstracts can be found in Appendix 1. Table 1: Overview of model characteristics (1) type of optimisation (2) type of supply chain (3) decision variables reverse supply chain cost models [17] Spengler et al., 1997 Costs reverse, open loop location-allocation [4] Ossenbruggen and Ossenbruggen, 1992
Costs reverse, open loop Allocation
[5] Pugh, 1993 Costs reverse, open loop Allocation [8] Barros et al., 1998 Costs reverse, open loop location-allocation [7] Gottinger, 1988 Costs reverse, open loop location-allocation [9] Krikke et al., 1998 Costs reverse, closed loop location-allocation [10] Krikke et al., 1999 costs reverse, open loop location-allocation [11] Louwers et al., 1997 costs reverse, open loop location-allocation [12] Ammons et al., 1997 costs reverse, open loop location-allocation [6] Marks, 1969 costs reverse, open loop location-allocation [15] Jaramayan et al., 1997 costs reverse, open and closed loop location-allocation closed loop supply chain cost models
[14] Berger and Debaille, 1997 costs forward and reverse, closed loop location-allocation [16] Kroon and Vrijens, 1995 costs forward and reverse, closed loop location-allocation [13] Thierry, 1997 costs forward and reverse, closed loop Allocation LCA oriented models [21] Sasse et al., 1999 multiobjective with simple
LCA (energy and waste) reverse, open loop location-allocation
[30] Berger et al., 1998 flexible, cost and environmental
reverse, open loop location-allocation
[3] Caruso et al., 1993 multiobjective with environmental indicators
reverse, open loop location-allocation
[18] Bloemhof-Ruwaard, 1996 LCA forward and reverse, closed loop allocation and product mix [20] Daniel et al., 1999 LCA reverse, open loop product design [19] Guelorget et al., 1993 LCA forward and reverse, open loop product design
In reverse supply chain cost models only the reverse chain is considered. The problem is generally represented as a directed graph, where the sources identified are collection sites, the sinks are either disposal sites or reuse locations and the arcs are transportation links. Sets of feasible locations for
5
different types of facilities are given and an optimal choice must be made. The collected items can be processed via various routings in the graph. Optimisation occurs on supply chain costs, generally fixed and variable costs for facilities and variable costs for intermediate transportation. Mixed Integer Linear Programming (MILP) is the most commonly used technique. Sometimes, locations are imposed, resulting in Linear Programming problems (LP). From a mathematical point of view, the models are pretty standard. Some papers describe nice branch and bound and heuristic algorithms (e.g. [6] Marks, 1969) and ([8] Barros et al., 1998) and some model extensions like economies of scale with concave cost functions ([7] Gottinger, 1988, [17] Spengler, 1997) and multi-period variants, e.g. ([5] Pugh, 1993). Closed loop supply chain cost models are similar to reverse supply chain cost models, but simultaneously optimise the forward and reverse network. Locations may serve both as sink and source and nodes and transportation links may serve both as part of the forward and reverse network, increasing efficiency but also system complexity. As a result, the structure and formulation of these models is generally somewhat more intricate, but mathematically the same remarks apply as for the reverse supply chain cost models. ([13] Thierry, 1997) and ([14] Berger and Debaillie, 1997) present a model to extend an existing network to remanufacturing. Besides location-allocation, the amount of reuse in the original supply chain is optimised. ([16] Kroon and Vrijens, 1995) present a model for the set up of a logistics depot system and placement of reusable containers. Besides location-allocation, the number of containers per location is balanced over time. Life cycle assessment (LCA) aims to evaluate the environmental burden associated with a product, process or activity by identifying and quantifying energy and materials used and wastes released to the environment; to assess the impact of energy and materials used and wastes released to the environment and to identify and evaluate opportunities to affect environmental improvements ([25] SETAC, 1993). LCA can be defined as an input-output analysis of resources or materials and energy requirements in each phase of the life cycle of a product. By definition, LCA only considers environmental issues. In reality, economic and technical issues cannot be ignored in any decision. Therefore, LCA should be seen in a broader context, as a tool that provides information on the product’s environmental impacts for decision making ([24] Mietinen and Hamalainen, 1997). Life Cycle Analysis models for production, use and disposal of products have been used since the late 1960s. Well-known examples are the life cycle studies on cotton diapers versus paper diapers and porcelain tea sets versus plastic cups ([32] [33] Guinée, 1993a and 1993b). LCA has also been applied to waste management, proving that some waste management options, although optimal from an economic view, harm the environment rather than support sustainability ([34] Rose, 1994). According to ([26] Azzone et al., 1996) indicators can be divided into qualitative and quantitative economic indicators and quantitative non-economic indicators. For a company’s effect on the ‘state of the environment’ they suggest non-economic quantitative indicators focusing on the measurement of physical data, i.e. emissions, waste, energy and transportation. In this paper, we use residual waste and energy use for measuring the supply chain environmental impact, see ([23] Umeda et al., 1999), ([29], Emblemsvag and Bras, 1999) and ([21], Sasse et al., 1999). Although we acknowledge that a full LCA gives a more comprehensive ‘picture’ of the environmental impact, we argue that energy and waste provide a good approximation, which, due to lower data requirements, is more practical, especially because it has to be combined with cost optimisation. 3 Case: a closed loop supply chain design for a refrigerator In this section we describe the case that serves as a basis for the remainder of this paper. Model building and results are dealt with in section 4 and 5 respectively. First, we give an abstract of the original case description. Subsequently, we adapt the case for our purposes. For convenience, we make some changes to the problem structure and assumptions and add logistics data (the changes are explained in detail in ([36], Krikke et al., 2001)). In ([23] Umeda et. al, 1999) it is argued that new products must be developed on a post mass production paradigm (PMPP). Due to new environmental legislation, lease contracts and service level agreements, OEMs have increased responsibility for after sales functions such as maintenance and recovery. This will lead to a totally new way of doing business based on life cycle management. The aim is to minimise costs, energy use and residual waste. As part of this, product design needs to
6
consider the full product life cycle, including forward and reverse supply chain processes. In the end of life stage, there are several options to recover or dispose of the used product on the product, module and component level. In a petri net based simulator two categories of variables are optimised, namely the process parameters, for example maintenance fees (i.e., repair costs) or recovery options used and product parameters, in particular the modular structure of the product design. Genetic algorithms are used to solve the problem. The simulator is applied to a refrigerator case. The case study was carried out by the team of Tokyo University, who obtained R&D data from a large Japanese OEM of consumer electronics. Product and process parameters are optimised for five product designs: traditional, recycling, maintenance, reuse and PMPP. Each design is built up of modules, components and materials (in decreasing order of hierarchy). The designs are equal in terms of quality and functionality and are all built up of exactly the same 25 components. Each component is made of one kind of material, either aluminum, plastics, copper or ferro metals. Because the products have different modular structures, they have different costs and environmental impact functions, in particular for reverse supply chain processes. Also, feasibility for various recovery and disposal processes varies strongly per design and on the product, module and component level. For example, some components are reusable as part of a module, but not reusable ‘as such’. This is expressed in the cost and environmental functions, but also in feasibility coefficients (see Section 4). Figure 2 represents the modular structures of the three product designs. Overall, the PMPP design appears to yield the best results. In this paper, we only use the reuse, maintenance and PMPP design, since only for these three the disassembly structures were given in ([23] Umeda et al., 1999). (a) reuse type (b) maintenance type (c) PMPP Figure 2: disassembly structures of the three alternative product designs In the original study, the supply chain network is assumed to be fixed. In the current paper, we optimise the supply chain network, assuming the product design parameters are given. We have added logistics data, i.e., a distance matrix and supply chain cost functions. These data were partly taken from ([28] Fleischmann et al., 1999) who describe a European production and return network, and partly generated randomly. Our logistics data set comprises locations in Europe and Japan, and we assume that the Japanese manufacturer wishes to sell and recover the refrigerators in Europe, but may (partly) supply from Japan. All data can be found in ([36], Krikke et al., 2001). We study a single period, deterministic situation. Demand is known at the level of 10 domestic agents, which are spread over Europe. We forecast that in this period 1000 products are sold per agent, that a fraction of these is returned in varying quality (hence varying recovery feasibility) and that reuse is applied in the original supply chain or not at all. All domestic agents will take any of the three types of refrigerators (these are considered identical in terms of quality). Mixed strategies are allowed, i.e., we
20
5 2 2 2 2 2 2 13 23 2 2 10 6
product module component
7
may serve different agents with different product designs. Rate of return is initially set at 100%, recovery feasibility differs per component and per module, and is randomly distributed in a range of 20 to 100%. The sources of the system are the supplier locations s, from where materials m are supplied to the first process (p1, component manufacturing). Here, components a are made out of raw materials. Ten suppliers for all materials are available in Japan and Europe. After component manufacturing, modules (p3) and products (p4) are assembled. Modules t are assembled from components only, products from components and/or modules, depending on the product design o. Components, modules and final products are stored at the warehouse (p2). The final products are sold to the market agents c. Agents c are the only nodes in the system serving as sink and source. All products are returned after use within the planning period. They can be repaired (p5) and delivered at the warehouse for resale. They can also be disassembled (p6) after which modules are inspected (p7) and rebuild (p8). In the rebuild process, non-reusable components in the modules are replaced. Rebuilt modules are sent to the warehouse. Modules can also be further disassembled, after which components are inspected and sent to the warehouse (for direct reuse), disposed of thermally or ‘normal’ (sink d) or recycled at a material level (p9). Note that a single common type of facilities is used for inspection and disassembly of products and modules. Materials recycled by p9 re-enter the supply chain via component manufacturing (p1). In total, twenty potential facility locations are available. Transportation between Europe and Japan is done by ship. Transportation within Europe is done by truck. The modes have different cost and environmental functions. There are 10 disposal sites, of which five are energy recovery installations. The supply chain is represented in Figure 3. Note that the system is consumer driven and all forward processes are ‘pulled’ by consumer demand. The reverse chain is ‘pushed’ by the discarding of products by that same consumer. product flow (o) module flow (t) component flow (a) material flow (m) Figure 3: Closed loop supply chain for the refrigerator case We assume that a closed loop supply chain for Europe must be set up from scratch, where some suppliers might be located in Japan. Figure 4 represents facility locations for all supply chain processes. Decisions will be taken on: • Network structure: number, capacities and locations for supply chain process facilities combined
with allocation of goods flows in the system. Goods flows represent intermediate flows between facilities, inbound supply flows, outbound market deliveries, inbound return flows and outbound disposal/thermal disposal flows. Inbound and outbound flows relate to supply points (i.e., suppliers of raw materials), market locations and disposal/thermal disposal locations. Allocation implicitly means choosing recovery options (product repair, module rebuild etc.).
use (c)
p4 product assembly
p2: warehousing product
p3: module assembly
p1: component manufacturing
material supply (s)
p5: repair p6: disassembly
p7: inspection
p8: rebuild
disposal (d)
thermal recycling (d)
p9: material recycling
p2: warehousing components
p2: ware-housing modules
8
• Product design: there is a choice from three product designs, with each their own costs and environmental impact functions. It is allowed to apply multiple design types.
∗ Figure 4: Locations in Europe We measure three optimisation criteria as follows. Costs include all fixed and variable costs related to the instalment and operations of the processes as well as the disposal sinks and supplies from the sources. As we explained, supply chain environmental impact is measured by energy and waste and not by a full LCA. Energy is a linear function of the supply chain processes p1..p9, transportation, material supply and disposal. Here, thermal disposal has negative energy use due to energy recovery. Finally, waste represents all goods flows disposed of in the system, including thermal disposal. We remind the reader that supply chain costs, supply chain environmental impact functions and recovery feasibility are different for the alternative product designs due to different modularity. The variances in parameter values and opposing behaviour of objective (sub-) functions makes this a difficult and unpredictable optimisation problem. We consider a single period situation and assume a steady state, i.e., this period is representative for a longer period of time and therefore we can determine the system’s optimality based on a single period. There is only one re-loop in the period considered. Thus, the sequence is sell, use, return, recovery/disposal. This is a fixed sequence in so far that returns must be available in advance of (re)-manufacturing activities in order to enable reuse. From a modelling point of view, extension to a multiperiod model is not very difficult. Next, we present a Mixed Integer Linear Programming model to support optimisation.
4 A mathematical model for the refrigerator case The model for this case turns out to be quite tedious. In order to facilitate exposition, we point out the model’s conceptual structure and give the full formulation in Appendix 2. Designing an ‘optimal’ supply chain involves a trade-off between supply chain costs, energy use and residual waste (all minimisation objectives). Of course, optimality is somewhat subjective here and depends on the views of the decision-maker. Therefore, the model must be able to assign weights to the various objectives. The objective function optimises deviational variables for each optimisation criterion. These non-negative variables express the deficit of an objective (sub)function value with respect to a pre-set target value. For example, if the system disposes 10% of all materials used and the legislative target were ‘dispose of at most 5%’, the value of the deviational variable would be 0.1-0.05=+0.05. The same is done for costs and energy. Target values may be based on legislation, expert opinion or business logistics strategy and are expressed in the deviational equations. The deviational variables can be scaled if necessary. Weights ‘g’ are added to evaluate solutions where different priorities are given to different optimisation criteria. This method allows us to compare the system’s performance on different, basically incomparable criteria. For the balance equations, we introduce the coefficients of type ‘w’, ‘u’ and ‘r’. Goods flows in the system undergo identity changes (from material to components to modules to products and vice versa), which is represented by ‘w’ coefficients in the forward and ‘r’ coefficients in the reverse chain. In the forward supply chain the ‘w’ values represent ‘go-into’ coefficients for manufacturing and assembly processes. For example, if assembling module t requires 4 components a, wat=4. Similarly, if wto=1, then one module t is needed to produce one product of design o and so on. In the reverse chain, the ‘r’ values represent the ‘release’ from disassembly and material recycling. In our case study, the ‘r’ values are the inverse of the ‘w’ values. The reverse chain additionally requires ‘u’ values, expressing the feasibility of returns for recovery as well as a coefficient for rate of return. Feasibility for recovery options depends on material composition and return quality. For example, if ‘u’=0.5 for the recovery option ‘recycling’, then 50% of the return flow collected is potentially recyclable. Finally, a rate of return parameter σ reflects the fraction of the products sold that is actually collected after use. Recall that the forward chain is pulled by consumer demand, the reverse chain is pushed by consumer disposal. This is reflected in the balance equations: a pull ‘w’ through the forward supply chain goes back to material supply. The reverse chain is pushed by ‘r’ values and constrained by ‘u’ values until the point of recovery or disposal. In the formal model formulation, all ‘w’, ‘r’, and ‘u’ have indices, identifying specific goods flows. Goods flows in the system are defined by: m for materials, a for components, t for modules and o for product designs. Thus, the structure of the model is: MIN gcost*Zcost + genergy*Zenergy + gwaste*Zwaste subject to deviational equations • � (volumes transported*distance*transport unit costs) + � (volumes processed*unit processing
costs) + � (facility investment costs * facilities opened) – Zcost = TARGETcost • (distance*transport unit energy use) + � (volumes*processing unit energy use) – Zenergy =
balance equations forward chain (pull) per demand location:
• market demand volume = � outbound product flows from warehouse(s) to demand location
10
per facility assembling/manufacturing goods flows (change of goods flow identity): • � volumes processed = � outbound flows • per inbound flow: inbound flow = � volumes processed * ‘winbound flow’ Example: 10 products produced requires inbound flows of 20 components (w=2) and 5 packages (w=0.5). Note that part of the inbound flows may come from recovery facilities, thus connecting forward and reverse supply chain.
per warehousing facility transferring goods flows (no identity change):
balance equations reverse chain (push) per demand location
• � products once sold * rate of return σ = � products returned • � products once sold * ‘udisassy’ ≥ � products disassembled • � products once sold * ‘urepair’ ≥ � products repaired Note that feasibility does not mean that process is actually applied, therefore >= constraint.
per inspection facility (no identity changes of goods flows)
• � inbound flows from disassembly = � flows processed • � flows processed * ‘unext process’ ≥ outbound flow to next process For example: of all modules tested, only 50% may be feasible for rebuild so no more than 50% can be transferred to a facility for the process p8 (rebuild). Note that feasibility does not mean that process is actually applied, therefore >= constraint. ‘Next process’ can be warehouse (direct reuse), further disassembly, module rebuild, recycling or (thermal) disposal. • � flows processed = � outbound flows
per disassembly and recycling facility (change of goods flows identity) • � inbound flows = � flows processed • per outbound flow: � flows processed * ‘r flow’ = outbound flow Example: 10 products are processed by disassembly facility and 50 modules come out (r=5)
per repair and rebuild facility (no identity changes)
other • constraints on nodes and arcs (e.g. a limited set of facility locations allowed) • logical constraints (e.g. continuous or boolean variables, all variables >=0)
Note: since all ‘z’ values are assumed to be non-negative, the targets must be set such that the objective (sub)functions values are always larger than the target. A safe way to do so is set the targets to zero. However, it may be worthwhile to set the targets equal to relevant benchmarks, such as for example legislative recycling targets. Alternatively, one can allow for negative deviations, but only penalise non-negative values in the objective function (this requires a small adaptation of the model). We feel that using deviational variables to pre-set target values resembles daily practice of setting business targets. These objectives can be assigned different weights to explore the extremes of the spectrum of solutions. We do not impose a strict hierarchy on objectives, as in e.g. goal programming, but use multiple criteria optimisation, where a balance can be found between conflicting objectives. Moreover, goal programming approaches are LP, not allowing for explicit optimisation of location choices (booleans).
11
5 Results We split this section into three major parts: optimisation (5.1), sensitivity analysis (5.2) and discussion (5.3). In the first part, solutions are optimised, and optimal values for decision variables determined. We manipulate the set of feasible locations thus imposing different network (location-allocation) structures and we compare the product designs. These scenarios are optimised with the MILP-model of Appendix 2. We ask ourselves the following questions: • What’s the difference between having a centralised or a decentralised system? What difference
does it make to organise supply at a regional level (i.e., within Europe) or at a global level (i.e., supply from Japan)?
• What is the impact of different product designs? Can we indicate under which circumstances product design dominates location-allocation decisions and vice versa?
• Do product and supply chain network have to be designed in concert or can they be handled independently? This relates to the question whether optimality of location-allocation choices relates to the choice of product design and the other way around. For example, a product design more feasible for reuse may require the instalment of repair facilities rather than recycling facilities.
• For what values of the weights do the environmental issues start to come into the picture (as opposed to pure cost drivers)? That would allow one to understand under which conditions these environmental drivers will press the solution to different corners of the spectrum.
In the second part we do a sensitivity analysis. Two solutions are selected, based on results of the first part and we fix the boolean variables in the MILP-model to obtain an LP model. The robustness of these solutions is tested to parameter settings reflecting recovery targets, rate of return and recovery feasibility. Research questions are: • What is the impact of return quality and hence return recovery feasibility on the system? How
does the structure of the solution change, i.e. what types of changes are driven by recovery feasibility? How robust is the solution: is this a linear effect or a S-curve type of effect? Should one try to stimulate responsible behaviour of consumers in order to collect returned items of good quality? Similar questions apply to rate of return.
• What is the impact of EU-legislation? The European Union aims for the introduction of producer responsibility by imposing take back and recovery targets on OEMs. Are these targets effective: do they actually contribute to the sustainability of (closed loop) supply chains? Which legislative recovery targets are counterproductive and should be re-negotiated? Are there alternatives in terms of legislation?
In the third part, we analyse the most important trends in the results and based on that derive some rules of thumb to support the design of closed loop supply chains. 5.1 Optimisation Results are represented per scenario in separate paragraphs. The first scenario covers a comparison of a centralised and decentralised network. A second scenario compares results for alternative product designs. For each scenario we start with equal weights for supply chain costs, energy use and waste. By increasing the weights for supply chain costs, energy use and waste (3 cases each), we obtain a total of 10 different cases per scenario (see Table 2):
12
Table 2: Cases for each scenario 1. base case all weights are 10 2. cost case weight costs in interval [100-1000], other weights 10 3. cost case weight costs in interval [1000-100.000], other weights 10 4. cost case weight costs in interval [100.000-1.000.000], other weights 10 5. energy case weight energy use in interval [100-1000], other weights 10 6. energy case weight energy use in interval [1000-100.000], other weights 10 7. energy case weight energy use in interval [100.000-1.000.000], other weights 10 8. waste case weight waste in interval [100-1000], other weights 10 9. waste case weight waste in interval [1000-100.000], other weights 10 10. waste case weight waste in interval [100.000-1.000.000], other weights 10 The results for each of the three optimisation criteria are given per product (core). They are expressed in 100 EURO per product, in GwH (Gigawatt Hours) per product and in waste percentage. Optimisations were done using Cplex and runs were all done within 5 seconds run time. Within the intervals, weights were slowly increased by trial and error to determine where ‘jumps’ in the objective (sub-)functions occur in each interval. Some tests were automatically solved by the heuristic built in Cplex. In all cases, the gap to the best lower bound was less than 0.5%. In subsection 5.1.1 we compare different supply chain network structures (centralised/decentralised) with free product design with mixed strategies allowed. It appears that a centralised network is the best choice, reason why we continue in 5.1.2 with a centralised network comparing results for the three alternative product designs. Here, we conclude that PMPP is the best design. In 5.1.3 we develop two management solutions based on a centralised supply chain network with product PMPP. The first is called the efficient solution, allowing for module/component reuse and disposal only, the second is called the robust solution, in which also facilities for material recycling and product repair are installed. In Section 5.2, these solutions are tested in a sensitivity analysis. 5.1.1 Comparing centralised versus decentralised supply chain network We recall that all processes must be installed at some location in Europe, with potential use of Japanse suppliers. We compare a strongly centralised network with a strongly decentralised network. In the centralised network, the set of feasible locations for all processes is [Dublin, Lyon, Dresden]. These locations have been selected for the central location in Europe and/or for their low cost. Note that it is necessary to open more than 3 facilities, but they share locations. For the decentralised network, the set of feasible locations is strongly extended and randomised per facility. A constraint is added that the maximal distance between a domestic agent and a warehouse is at most 750 km to guarantee JIT delivery. This means that warehousing and as a consequence some other processes are decentralised. In fact, five warehouses are opened. Figure 5 gives the results.
13
Figure 5: Comparison decentralised and centralised supply chain networks
Cost per product
0
10
20
30
40
50
60
base
case
cost+
cost+
+
cost+
++
energ
y+
energ
y++
energ
y+++
waste+
waste+
+
waste+
++
weights assigned
100
EUR
O
centr.decentr.
Energy use per product
0
10
20
30
40
50
60
70
base
case
cost+
cost+
+
cost+
++
energ
y+
energ
y++
energ
y+++
waste+
waste+
+
waste+
++
weights assigned
Gw
H centr.decentr.
Waste
0
5
10
15
20
25
30
base
case
cost+
cost+
+
cost+
++
energ
y+
energ
y++
energ
y+++
waste+
waste+
+
waste+
++
weights assigned
% d
ispo
sed
of
centr.decentr.
14
The most important observations are: �� A centralised supply chain network is far more cost efficient than a decentralised supply chain
network, whilst differences in waste and energy are small. Dresden is the favoured location. The differences in costs can be explained by economies of scale, resulting in lower fixed costs per unit. The amount of transportation and processing in both networks is approximately the same, although collection distances are larger in the centralised network, the amount of intermediate transportation is smaller. Thus, linear costs and (linear) energy use are almost equal in both networks. Recovery options chosen also do not vary a lot with the network structure hence the amount of waste in both networks is also comparable.
�� Of all recovery options, most beneficial are reuse of components and modules, due to their relatively low cost and low energy use but moreover because they avoid material supply and component manufacturing. These forward supply chain processes contribute to a large extent to the total system’s cost and energy use. Thermal disposal is the best alternative for non-reusables, although it adds to waste it reduces total energy use. Material recycling is applied on a limited scale, it reduces waste, avoids material supply but does not contribute to the avoidance of component manufacturing. Product repair is only interesting when a high weight is assigned to minimisation of energy use. It is too costly compared to the other recovery options.
�� Supply from Japan is costly and energy consuming and should be avoided. �� Energy and waste are the strongest conflicting objectives. If waste goes up, incineration with
energy recovery goes up and hence system energy use goes down. But it is possible to find low cost solutions with energy and waste scores that are close to their overall minimum. However, achieving optimality in the environmental indicators results in high costs.
Note: at first sight, costs are much higher than for existing refrigerators, at least 1200 EURO per product. The explanation for this is fourfold. First, the prices are based on Japanese product data. The price level in Japan is higher than in Europe. Second, current cost prices do not incorporate the full life cycle. Costs for disposal are usually charged by authorities such as municipalities and so on. Third, half the costs are ‘fixed’ and sales volumes are only 1000 pieces per domestic agent. In case the sales would be 10.000 per agent, costs would drop to approximately 250 EURO per product (assuming there are no capacity constraints). Thus, economies of scale are strong. Fourth, in the sensitivity analysis we will see that in case recovery feasibility and rate of return are both 100%, costs will drop to about 550 EURO per product. 5.1.2 Comparison of three alternative product designs with centralised supply chain network. Here we compare results for each product design, given a centralised network (in Dresden). This is because we know from the previous paragraph that a centralised network is approximately 40% cheaper than a decentralised network. The results are summarised in Figure 6. The most important results are: �� Design PMPP is favoured. We can always find a case for design PMPP that is dominant over
design ‘Reuse’ and ‘Maintenance’ on at least two of the three optimisation criteria. We see that energy and waste behave differently. For PMPP, this opposing behaviour is less extreme than for the other two product designs.
�� Differences in costs between the designs are moderate, differences in energy and waste can be substantial.
In the remainder of this analysis we fix the product design to design PMPP to proceed with sensitivity analysis.
15
Figure 6: Comparison product designs 5.1.3. Management solutions: select optimal network structures and optimal product design Here, we select two candidate management solutions for possible implementation. It is clear that design PMPP is favourable, it provides the most flexibility and therefore it is not only efficient but very likely also most robust. Also, it is clear that a centralised network structure in Dresden is the most cost efficient whilst equally environmentally friendly as the decentralised network. Repair and recycling are hardly applied. Thus, the efficient management solution is:
Cost per product
05
10152025
base
case
cost+
cost+
+
cost+
++
energ
y+
energ
y++
energ
y+++
waste+
waste+
+
waste+
++
weights assigned
100
EUR
O PMPPMaintReuse
Energy use per product
010203040506070
base
case
cost+
cost+
+
cost+
++
energ
y+
energ
y++
energ
y+++
waste+
waste+
+
waste+
++
weights assigned
Gw
H
PMPPMaintReuse
Waste
05
10152025303540
base
case
cost+
cost+
+
cost+
++
energ
y+
energ
y++
energ
y+++
waste+
waste+
+
waste+
++
weights assigned
% d
ispo
sed
of
PMPPMaintReuse
16
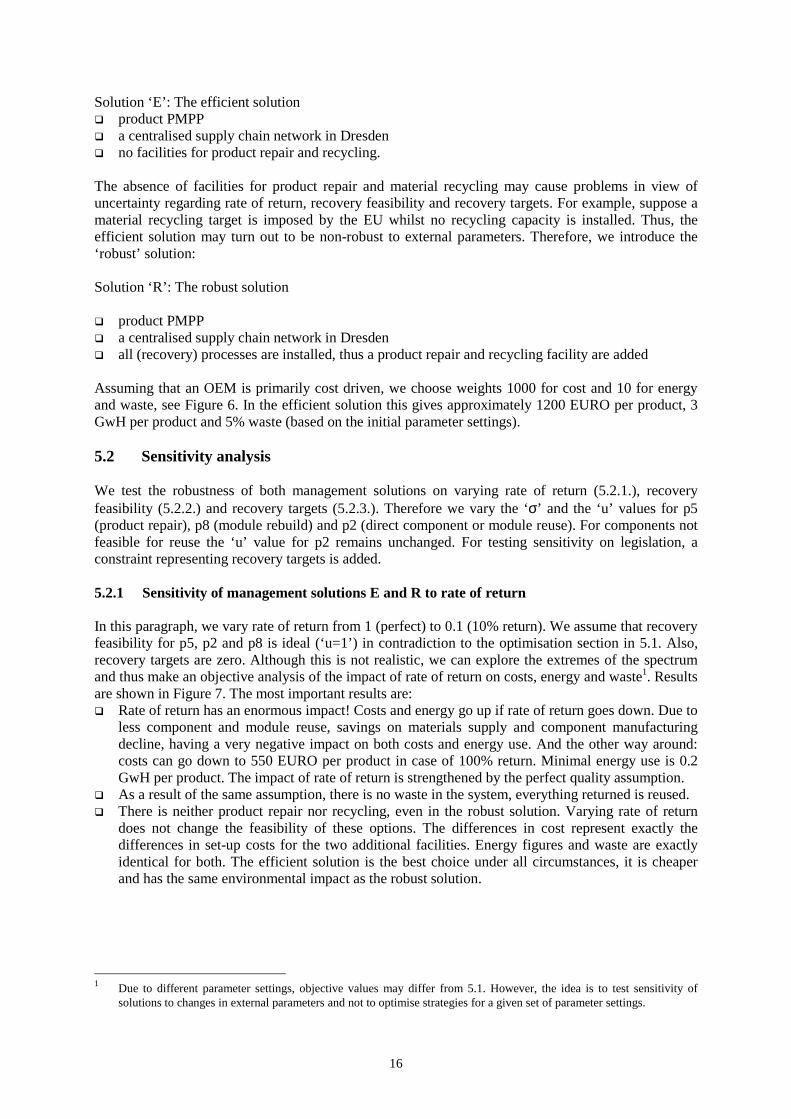
Solution ‘E’: The efficient solution �� product PMPP �� a centralised supply chain network in Dresden �� no facilities for product repair and recycling. The absence of facilities for product repair and material recycling may cause problems in view of uncertainty regarding rate of return, recovery feasibility and recovery targets. For example, suppose a material recycling target is imposed by the EU whilst no recycling capacity is installed. Thus, the efficient solution may turn out to be non-robust to external parameters. Therefore, we introduce the ‘robust’ solution: Solution ‘R’: The robust solution �� product PMPP �� a centralised supply chain network in Dresden �� all (recovery) processes are installed, thus a product repair and recycling facility are added Assuming that an OEM is primarily cost driven, we choose weights 1000 for cost and 10 for energy and waste, see Figure 6. In the efficient solution this gives approximately 1200 EURO per product, 3 GwH per product and 5% waste (based on the initial parameter settings). 5.2 Sensitivity analysis We test the robustness of both management solutions on varying rate of return (5.2.1.), recovery feasibility (5.2.2.) and recovery targets (5.2.3.). Therefore we vary the ‘σ’ and the ‘u’ values for p5 (product repair), p8 (module rebuild) and p2 (direct component or module reuse). For components not feasible for reuse the ‘u’ value for p2 remains unchanged. For testing sensitivity on legislation, a constraint representing recovery targets is added. 5.2.1 Sensitivity of management solutions E and R to rate of return In this paragraph, we vary rate of return from 1 (perfect) to 0.1 (10% return). We assume that recovery feasibility for p5, p2 and p8 is ideal (‘u=1’) in contradiction to the optimisation section in 5.1. Also, recovery targets are zero. Although this is not realistic, we can explore the extremes of the spectrum and thus make an objective analysis of the impact of rate of return on costs, energy and waste1. Results are shown in Figure 7. The most important results are: �� Rate of return has an enormous impact! Costs and energy go up if rate of return goes down. Due to
less component and module reuse, savings on materials supply and component manufacturing decline, having a very negative impact on both costs and energy use. And the other way around: costs can go down to 550 EURO per product in case of 100% return. Minimal energy use is 0.2 GwH per product. The impact of rate of return is strengthened by the perfect quality assumption.
�� As a result of the same assumption, there is no waste in the system, everything returned is reused. �� There is neither product repair nor recycling, even in the robust solution. Varying rate of return
does not change the feasibility of these options. The differences in cost represent exactly the differences in set-up costs for the two additional facilities. Energy figures and waste are exactly identical for both. The efficient solution is the best choice under all circumstances, it is cheaper and has the same environmental impact as the robust solution.
1 Due to different parameter settings, objective values may differ from 5.1. However, the idea is to test sensitivity of
solutions to changes in external parameters and not to optimise strategies for a given set of parameter settings.
17
Figure 7: Impact of rate of return on cost and energy use 5.2.2 Robustness of management solutions E and R to recovery feasibility We vary the recovery feasibility, i.e., the feasibility for repair (p5), rebuild (p8) and direct reuse (p2) on a product, module and component level from 1.0 to 0.1. For simplicity, we assign one identical value to all three processes at all levels, whilst in Subsection 5.1. we had differentiated values between 0.2 and 1.0. We assume perfect rate of return (σ=1) and zero legislative targets. We set feasibility for disassembly to 1 (to avoid infeasibility for the ‘E’ solution in some scenarios) while the settings for material recycling remain unchanged compared to section 5.1. Results are represented in Figure 8.
Cost per product
02468
101214161820
1 0,9 0,8 0,7 0,6 0,5 0,4 0,3 0,2 0,1
rate of return
100
EUR
O
ER
Energy use per product
0
10
20
30
40
50
60
70
1 0,9 0,8 0,7 0,6 0,5 0,4 0,3 0,2 0,1
rate of return
Gw
H ER
18
Figure 8: Impact of recovery feasibility
Cost per product
02468
101214161820
1 0,9 0,8 0,7 0,6 0,5 0,4 0,3 0,2 0,1
recovery feasibility factor
100
EUR
O
ER
Energy use per product
0
10
20
30
40
50
60
70
1 0,9 0,8 0,7 0,6 0,5 0,4 0,3 0,2 0,1
recovery feasibility factor
Gw
H ER
Waste
0102030405060708090
100
1 0,9 0,8 0,7 0,6 0,5 0,4 0,3 0,2 0,1
recovery feasibility factor
% d
ispo
sed
of
ER
19
The most important results are: �� As with rate of return, the impact of recovery feasibility is enormous. As recovery feasibility goes
down, again costs and energy use go up as a result of increased raw material supply and component manufacturing, and the other way around. This effect is smoothed for the robust solution, because of the application of material recycling. This can be explained by the fact that material recycling is a substitute for module and component reuse in case of limited recovery feasibility, but not in case of low rate of return. For this reason material recycling is of use here, in contradiction to the previous paragraph.
�� Due to increased recycling, there is less waste and energy use in the robust solution for low recovery feasibility. For waste, we see a S-shaped curve. The volume of waste goes up when feasibility goes down until at some point cost and energy pressures enforce material recycling. As a result, the amount of recycling in the robust solution increases, thus smoothing the increase in costs and energy use. In the efficient solution this is obviously not possible. We can see that in the ‘E’ solution in particular energy use boosts!
�� For low recovery feasibility the robust solution outperforms the efficient solution on cost thanks to the recycling facility, for high recovery feasibility it is the other way around. The environmental indicators are equal for low feasibility and better for the robust solution for high feasibility. Given the intrinsic uncertainty of recovery feasibility, a manager would have difficulty determining an ‘optimal’ solution.
�� Minimal costs found are again 550 EURO (for u=1). Minimal energy use is again approximately 0.2 GwH per product.
�� Again, product repair is not applied, i.e., this facility is opened for no use at all. The importance of rate of return and recovery feasibility connects to the finding of section 5.1 that reuse at the module and component level are preferable, because they avoid the application of the supply chain processes material supply and component manufacturing. These forward processes add to a large extent to the system’s cost and environmental impact. In other words: avoiding forward supply chain processes by closing the loops at the highest feasible level (in this case module and component level) results in efficient and sustainable supply chains. We refer to this as the closed loop effect. 5.2.3 Robustness of management solutions E and R to recovery targets We add a constraint representing potential EU legislation on White and Brown goods. In The Netherlands, new legislation imposing producer responsibility has been enacted since January 1999. Through this, OEMs/importers are formally responsible for setting up a collection and recovery system for consumer electronics, which meets certain pre-set collection and recovery targets. We assume that a 50% rate of return is given and sufficient in view of collection targets. Also we assume 50% recovery feasibility as given (this means that 25% of original sales can be recovered). Recovery targets generally aim at maximising module, component and material reuse, and the EU draft of the Waste act on Electrical and Electronical Equipment (WEEE) imposes a 70% target on the collected return flow (measured in kg). We note that Japanese legislation is to a large extent similar to proposed EU-legislation. More information can be found in [35]. There has been a lot of discussion on the EU draft on WEEE since the early nineties. Moreover, there are many differences between EU member states. In the Dutch system, seen by some as a template for the EU, recovery targets are differentiated over different categories of consumer electronics and vary between 45% and 73%. Other member states have higher targets or none at all. In other words: much uncertainty exists with respect to legislation and therefore it is worthwhile to conduct a sensitivity analysis. Results can be found in Figure 9.
20
Figure 9: Impact of recovery targets
Cost per product
0
2
4
6
8
10
12
14
16
0 0,1 0,2 0,3 0,4 0,5 0,6 0,7 0,8 0,9
recovery target
100
EUR
O
ER
Energy use per product
0
5
10
15
20
25
30
35
40
45
0 0,1 0,2 0,3 0,4 0,5 0,6 0,7 0,8 0,9
recovery target
Gw
H ER
Waste
0
10
20
30
40
50
60
0 0,1 0,2 0,3 0,4 0,5 0,6 0,7 0,8 0,9
recovery target
% d
ispo
sed
of
ER
21
The most important results are: �� Solutions are stable until the recovery target constraint starts to ‘hurt’, i.e., when the waste
percentage is ‘1-recovery target’. This starts at 50% for the E solution and 70% for the R solution. Increasing recovery targets leads to reduced waste but also to increased costs and increased energy use. So the effectiveness of legislation is ambivalent, in particular for the ‘E’ solution. This can be explained as follows. It appears that reducing waste leads to increased reuse on the module and component level in the efficient solution. For a subset of the modules and components this is costly and energy consuming, hence system’s costs and energy use are increased. At the component level, recycling into materials serves as an alternative in the ‘R” solution (modules need first to be disassembled into components before being recycled). Obviously, for a subset of the modules and components this option is favourable. Moreover, reduction of waste means reduction of thermal disposal hence increase of total system energy use. A minimum of approximately 20% material recycling is required to achieve the recovery targets and at the same time smooth cost and energy increases. The robust solution outperforms the efficient solution thanks to the recycling facility!
�� There is no application of product repair in both solutions, it is too expensive compared to gains in energy use and waste.
Note: at first sight it may be surprising that with 50% recovery feasibility (for modules and components) and 20% material recycling, 90% recovery can be achieved. However, note that for modules 50% recovery feasibility independently applies to both direct reuse (p2) and rebuild (p8) so in fact 100% of the modules can theoretically be reused. So the upper bound is 100% recovery, however sometimes at high cost or bad environmental impact. 5.3 Discussion Now, let us return to the questions posed at the start of Section 5. We can give the following answers �� A centralised supply chain network by far outperforms a decentralised supply chain network in
terms of costs. Differences in energy use and waste are rather small. Supply chains should be organised on a European level, i.e., no supply from Japan.
�� Product design has a moderate impact on supply chain costs and a major impact on waste and energy use. Overall, it appears that design PMPP is dominant over the other designs. Product design PMPP enables solutions with most synergy between supply chain costs, energy use and waste, whereas the other two have more contradicting functions on the three optimisation criteria.
�� Both network design and product design are less important than recovery feasibility and rate of return. Optimal recovery feasibility and maximal rate of return lead to objective function values one can only dream of, whilst in case of e.g. 10% rate of return and 10% return feasibility (hence 1% reusability of original sales) results are pretty bad. No S-shaped curves were found, except for waste as a function of recovery feasibility.
�� Energy and waste are the most conflicting objectives over a wide range, due to the fact that thermal disposal increases waste, but reduces energy use. It also appears that low cost solutions have nearly optimal environmental impact, however that small improvements in energy and waste are often costly.
�� Recovery targets based on proposed EU-legislation have an ambivalent impact, they reduce waste but increase energy use and costs.
�� Compound effects: although there is variance in the number and locations of facilities opened, there is no clear relationship between the structure of the network and product design. The only sensible thing one can say is that facilities for installed reverse supply chain processes, should be in concert with the recovery options to be applied after return, which in turn partly depends on product design.
�� Reuse at a component/module level is the most beneficial recovery option. When recovery feasibility goes down, material recycling and thermal disposal are the second best choices. Product repair does not come into the picture in this case.
22
�� Under realistic assumptions, the robust solution with nine facilities outperforms a so-called efficient solution (with seven facilities) due to its flexibility in applying various recovery options. However, the repair facility is not being used.
�� Optimal management tactics in this case would be: a centralised supply chain network in Dresden without a repair facility combined with the PMPP product design, with maximal incentives for consumers to return 100% of the products in optimal condition.
�� One should notice that this data set is based on R&D for future products and not on historic data on products that have been sold in the past. Thus, it is difficult to have a benchmark. (Umeda et. al, 1999) do describe a ‘traditional’ design as a reference model, however do not provide all data that we need for our model.
�� The commercial feasibility of our approach has not been discussed, but is important. Closed loop supply chains require complete control over the product life cycle and new product concepts. The leasing and early take back of products might prove to be critical to the success of closed loop supply chains.
6. Conclusions and outlook We remind the reader that we had two purposes in mind in this paper. First, we wanted to develop a double integrated modelling framework for designing closed loop supply chains. Second, we wanted carry out a representative case study using this framework and derive generic rules of thumb for management support. Below we discuss both in reversed order. 6.1. Lessons learned from the case For our case study, we draw the following conclusions: �� System optimality depends on two major effects. On the one hand it depends on efficient set up of
facilities and goods flows (including product design and allocation of recovery options), but even more important is the avoidance of raw material supply and component manufacturing by reusing as much as possible: the closed loop effect. As a result, recovery feasibility and rate of return are far more important than product design and location-allocation.
�� Supply chain network structure has most impact on costs, product design on energy and waste. Product design, using modularity as the main instrument, can reduce opposing behaviour of costs, energy use and waste functions. For both it goes that flexibility and robustness to external factors enhance the overall systems’ performance (this sounds pretty trivial but proves to be essential).
�� EU legislation and management solutions should enhance a high rate of return and high recovery feasibility in order to maximise component and module reuse next to setting recovery targets.
�� To some extent, results can be manipulated as one wishes. Objective functions are very capricious. We see how strong the impact is of parameter settings and very likely this also goes for modelling assumptions, e.g. regarding linearity of functions. In our opinion this is typical for LCA related research. On the one hand, this may be a disappointment. On the other hand it opens opportunities for decision support tools.
�� As a consequence, no generic rules of thumb can be distilled, it will depend strongly on the product and model/data at hand. More cases are needed. However, the authors do think that the modelling approach presented in this paper is applicable to other cases. This is discussed in the next subsection.
6.2 Generalisation of the model In this subsection we discuss how (the concept of) the model developed for the refrigerator case can be used in other cases as well. First, we discuss generic features of the model, which enable modification for specific situations. Second, we discuss extensions of the model, which are partly trivial extensions or extensions described in the literature and partly new extensions which can be seen as areas for further research.
23
Generic features of our case model • Definition of processes. We have defined our processes along the supply chain such that the
interfaces between processes are clear. In this, the successor relations ‘w’ and ‘r’ are critical since the identity changes (from material to component, component to module and product and reverse) are modelled quite naturally. If necessary, subprocesses or additional disassembly levels can be built in where interfaces between the subprocesses as well as between the subprocesses and the other supply chain processes are modelled in a similar way. For example, production may be split into pre-assembly and final assembly. In our case the input of pre-assembly and the output final assembly would be identical to the input/output of ‘product assembly’, while new successor relationships define the mutual interface of the subprocesses mentioned. Also, alternative processes can be defined, such as done for recovery in this case where the choice between e.g. repair and disassembly is subject to optimisation.
• Multicriteria/soft constraints approach. In one of the scenarios, we added legislative recovery targets for recycling. Due to our multicriteria-soft constraints approach we can add any optimisation criterion we like in a similar way as was done for the recovery targets. We might even include a full LCA: instead of using energy and waste as environmental indicators, a full LCA (generally including 7 or 8 indicators) can be included as long as the scores on the indicators are directly linked to the instalment of processes and the volumes of flows in the system. However, it remains difficult to retrieve all relevant data or the costs of data retrieval may not be worthwhile. Performance criteria can also be added to the model. For example, if we wish to include lead time, then cost functions must be replaced by time functions hence the distance matrix may have to become a time matrix.
• Scope. We have modelled the forward and return flows in an integral way, including the mutual interaction between forward and return flows. The push-pull nature of the integrated supply chain, with a normal BOM and reverse BOM is generally modelled by the ‘w’ and ‘r’ parameters. If applicable, the reverse BOM may not be the inverse of the normal BOM, but modified by setting the ‘r’ values differently.
• Decision variables. Here, decision variables are the general location-allocation variables as well as product design choices. From a modelling point a view, it is relatively simple to add for example the processing technology of processes installed, where some technologies may be more environment friendly and others are more economical. Transportation frequency may be added as a decision variable for each transport flow, where increased frequency incurs additional cost and energy use.
Known extensions The following extensions have been researched extensively and given the body of knowledge may be considered relatively trivial or at least known. • Concave cost functions. Economies of scale can be modelled by concave cost functions. For
example, in ([7] Gottinger, 1988) and ([17] Spengler et al., 1997) this is solved by defining multiple capacity levels for each process, where each capacity level incurs a certain fixed cost (increasing with capacity installed) and linear processing cost (unit cost decrease with capacity installed). This way, a piecewise linear cost function is obtained, which is a reasonable approximation of a concave cost function.
• Capacity constraints. Both facilities and transportation links may be subjected to minimal throughput or maximal capacity constraints. This extension is in our view trivial from a modelling point of view. However, it does provide additional opportunities for developing efficient algorithms.
• Re-design situations. Often, a supply chain network is not build from scratch, but an existing network has to be redesigned. This may involve reduced investment costs for some locations, fixed (given) locations for certain facilities or close down costs for others. This has been studied by e.g. ([7] Gottinger, 1988).
24
Future research: weaknesses of the model To the best of our knowledge, no studies have been done on the subjects discussed below and cannot be handled by our model as well. We regard these as important areas for further research. • Actors interests. Both objective function elements and constraints can be totalled over the system
or specified per actor. Sets of processes Ph for an actor h can be formulated, and a deviational variable zh
x is minimised on target Thx for any optimisation criterion x for each actor h. For
example, suppose that the forward chain is managed by the OEM (h1) and the reverse supply chain by some third party service provider (h2). We define P1 as the set of all forward processes and P2 as the set of all reverse processes, where warehousing belongs to both sets. Now, we define T1
x and T2x where x can be supply chain costs, supply chain environmental impact or performance.
Multiple x are possible. • Multi-period life cycle effects. In a multiperiod model, different products have different moments
(periods) of sales and return. The effects of economic life cycles, both in sales, returns and spare parts demand can be included. In this paper, we made some rather unrealistic assumptions regarding the sequence of events. For instance, the inclusion of having multiple recovery loops of the product and/or its released components can have unexpected effects, in a combined location-allocation-product design model. The single-period assumption with fixed sequence of events is a severe limitation.
• Modular product- and process design. In a multiproduct model it is of particular interest to see whether modularization of both products (building different products from standard modules) and processes (using universal processes or not?) actually leads to advantages such as economies of scale and increased availability.
Acknowledgements We would like to thank our colleague Prof. Umeda of Tokyo University for giving us the paper and underlying data of the original case study as well as responding to our questions by email. Anybody who can provide us with interesting case- or modelling studies in this field is kindly invited to contact us. This research has been supported by the European Commission as part of the TMR project REVLOG, ERB 4061 PL 97-650. In this project, researchers from Erasmus University, Eindhoven University of Technology, University of Magdeburg, University of Piraes, University of Thessaloniki and INSEAD work together. References [1] www.calepa.ca.gov/publications/{regpacks/Default.htm}{factsheets/1997/levfs.htm} [2] Domschke, W. and G. Krispin, “Location and layout planning, a survey”, OR-spektrum, 19, pp. 181-194, 1997. [3] Caruso, C., A. Colorni and M. Paruccini, “The regional urban solid waste management system: a modelling
approach”, European Journal of Operational Research, 70, pp. 16-30, 1993. [4] Ossenbruggen, P.J. and P.M. Ossenbruggen, “SWAP, a computer package for solid waste management”,
Computers, Environment and Urban Systems, 16, pp. 83-99, 1992. [5] Pugh, M.P., “The use of mathematical models in evaluating resource recovery options”, Resources, Conservation
and Recycling, 8, pp. 91-101, 1993. [6] Marks, D.H., Facility location and routing models on solid waste collection systems, Ph.D. thesis, Johns Hopkins
University, Baltimore (USA), 1969. [7] Gottinger, H.W., “A computational model for solid waste management with application”, European Journal of
Operational Research, 35, pp. 350-364, 1988. [8] Barros, L., R. Dekker and V. Scholten, “A two-level network for recycling sand: a case study”, European Journal
of Operational Research, 110, pp 199-214, 1998. [9] Krikke, H.R., A. van Harten and P.C. Schuur, “Business case Oce: reverse logistic network re-design for copiers",
OR-Spektrum, 21-3, pp.381-409, 1999. [10] Krikke, H.R., E.J. Kooi and P.C. Schuur “Network Design in Reverse Logistics: A Quantitative Model”, Lecture
Notes in Economics and Mathematical Systems, Springer Verlag Berlin, 1999. [11] Louwers D., Kip B.J., Peters E., Souren F., Flapper S.D.P., “A Facility Location-allocation Model for Re-using
carpet materials”, Computers and Industrial Engineering, 36(4), pp. 1-15, 1999.
25
[12] Ammons J.C., Realff M.J., Newton D., “Reverse Production System Design and Operation for Carpet Recycling”. Working Paper, Georgia Institute of Technology, Atlanta, Georgia, 1997.
[13] Thierry, M., An analysis of the impact of product recovery management on manufacturing companies, Ph.D. thesis, Erasmus University Rotterdam (NL), 1997.
[14] Berger T. and Debaillie B, “Location of disassembly centres for re-use to extend an existing distribution network”. Unpublished Masters thesis, University of Leuven, Belgium, 1997 (in Dutch).
[15] Jayaraman V, Guide, V.D.R. Jr., Srivastava R., “A Closed-loop Logistics Model for Remanufacturing”, Journal of the Operational Research Society, 50, pp. 497-508, 1999.
[16] Kroon L and G. Vrijens, “Returnable containers: an example of reverse logistics”, International Journal of Physical Distribution & Logistics Management, 25(2), pp. 56-68, 1995.
[17] Spengler, Th., H. Püchert, T. Penkuhn and O. Rentz, “Environmental integrated production and recycling management”, European Journal of Operational Research, 97, pp. 308-326, 1997.
[18] Bloemhof-Ruwaard, J.M., L.N. Van Wassenhove, H.L. Gabel and P.M. Weaver, “An environmental life cycle optimization model for the European pulp and paper industry”, Omega, International Journal of Management Science, 24 (6), pp. 615-629, 1996.
[19] Guelorget, Y., V. Jullien and P.M. Weaver, “A life cycle analysis of automobile tires in France”. INSEAD working paper, 93/67 EPS, 1993.
[20] Daniel, S.E., Voutsinas, T.G., and Pappis, C.P., “Implementation of Life Cycle Analysis in the starter batteries’ Reverse Chain”. Working Paper University of Piraes, 1999.
[21] Sasse, H., U. Karl and O. Renz, “Cost efficient and ecological design of cross-company recycling systems applied to sewage sludge re-integration”. Proceedings of DSI conference, pp. 1418-1420,Athens, July 3-4, edit. D.K. Despotis and C. Zouponidis, 1999.
[22] Fleischmann, M., H.R. Krikke, R.Dekker and S.D.P. Flapper, “A Characterisation of Logistics Networks for Product Recovery”, Omega, the international journal of Management Science, 28-6 , pp. 653-666, 2000.
[23] Umeda, Y., A. Nonomura and T. Tomiyama, “A study on Life Cycle Design for the Post Mass Production Paradigm”. Working paper Tokyio Metropolitan University, 1999.
[24] Miettinen, P. and R.P. Hamalainen, “How to benefit from decision analysis in environmental life cycle assessment (LCA)”, European Journal of Operational Research, 102, pp 279-294, 1997.
[25] SETAC, “Guidelines for Life Cycle Assessment: A ‘code of practice’ ”, Brussels, 1993. [26] Azzone, G., G. Noci, R. Manzini, and R. Welford, “Defining environmental performance indicators: an integrated
framework”, Business Strategy and the Environment, 5, pp. 69-80, 1996. [27] Thierry, M., M. Salomon, J. van Nunen and L. van Wassenhove, “Strategic issues in product recovery management”,
California Management Review, 37-2, pp. 114-135, 1995. [28] Fleischmann, M., P. Beullens, J.M. Bloemhof-Ruwaard and L.N. van Wassenhove, “The impact of product recovery on
logistics network design”. Working paper, Erasmus University, distance matrix obtained with ANWB reisplanner, Rotterdam, 2000, to appear in Production and Operations Management.
[29] Emblemsvag J. and B. Bras, “Integrating economic and environmental performance measurements using activity based LCA”. CIRP-Proceedings, 6th international seminar on Life Cycle Engineering, June 21-23, pp. 11-20, edit. J.Jeswiet, T.N.Moore, P.H.Oosthuizen, Ontario, Canada, 1999.
[30] Berger, C., F. Chauny, A. Langevin, R.Loulou, C.Riopel, G.Savard and J.P. Waaub, “EUGENE: an optimisation based DSS for long term integrated Regional Solid Waste Management Planning”. Presented at the international workshop Systems Engineering Models for Waste Management, Goteborg, Sweden, February 25-26, 1998.
[31] Bloemhof-Ruwaard, J.B., P.van Beek, L.Hordijk and L.M. van Wassenhove, “Interactions between Operations Research and Environmental Management”, European Journal of Operational Research, 85, pp. 229-243, 1995.
[32] Guinée, J.B., Udo de Haes, H.A., Huppes, G., “Quantitative life cycle assessment of products –1: Goal definition and inventory”, Journal of Cleaner Production, 1 (1), pp. 3-13, 1993(a).
[33] Guinée, J.B., Heijungs, R., Udo de Haes, H.A., Huppes, G., “Quantitative life cycle assessment of products –2: Classification, valuation and improvement analysis”, Journal of Cleaner Production, 1 (2), pp. 81-91, 1993(b)
[34] Rose, J., “Waste management and life-cycle analysis”, Environmental Management and Health, 5 (1), pp. 5-6, 1994.
[35] www.itri.co.uk/WEEE2.htm [36] “Dataset of the refrigerator case”, Krikke H.R., J.M. Bloemhof-Ruwaard, L.N. Van Wassenhove, Working paper
Appendix 1: Abstracts of literature studied A1.1 Reverse logistics models ([4] Ossenbruggen and Ossenbruggen, 1992) describe a computer package for solid waste management (SWAP) based on LP-modelling. The model describes a waste management district as a network, where nodes represent waste sources, intermediary (capacitated) processing facilities and destinations (sinks) on given locations. Sources, sinks and intermediary stations can be of multiple (technology) types. Decision variables are the amount of waste to be processed by each facility and the magnitude of flows between the facilities. Implicitly, the recovery options are determined, where a flow can be split into sub-streams for different options. Constraints follow from technically allowed processing sequences and capacity limitations. The algorithm finds a cost optimal solution, where the cost function only includes variable costs per waste unit, e.g. kg. These unit costs incorporate tipping fees, shipping costs and revenues from reuse. ([5] Pugh, 1993), describes the HARBINGER model, which gives decision support in the long term waste management planning of a city or county. The waste management system involves collection, transportation, treatment and disposal or reuse of a communities waste stream. These systems tend to be very complicated, which explains the need for mathematical analysis. The heart of HARBINGER lies in the multi-period allocation sub-model, which determines the cost-optimal assignment of waste flows from the sources to treatment and disposal facilities on given locations, within constraints set by the user (e.g. for capacity). Optimisation occurs on least cost. Other sub-models of HARBINGER are used to specify the input for the allocation sub-model and for post-optimality analysis. In a study of ([6] Marks, 1969), the problem of selecting transfer stations is considered. Waste is generated at discrete sources and from there routed via intermediary transfer stations to discrete sinks, representing the disposal locations. The sinks have a demand that varies between a lower and upper bound reflecting minimal throughput requirements and maximum capacities of these disposal locations. At the intermediary transfer stations activities like transfer, packing and sorting can take place. The transfer stations can be located at a number of locations, where capacities are restricted. Each opened location has a fixed cost and linear processing cost. Also transportation cost between sources, intermediary transfer stations and sinks are linear. A Branch & Bound algorithm, using an out-of-kilter algorithm at the nodes, is developed to find the solution with the least overall cost. ([7] Gottinger, 1988) develops a similar, but more extensive regional management model. The model is concerned with the number, location and capacity (expansion) of both intermediary transfer stations and the ultimate disposal locations (sinks) as well as the routing from discrete waste sources through the system to the sinks. There is one type of transfer station and one type of disposal facility. For both types of facilities a set of potential and existing locations is given. The concave cost functions are approximated by linear segments, whereby one segment is represented by a pseudo-facility. Each pseudo-facility has a fixed cost and linear processing cost, in compliance with the cost function of the corresponding real life facility, within the capacity range covered by the pseudo-facility. Only one pseudo-facility per location can be opened. Existing locations have a restricted (current) capacity, potential new locations have infinite capacity. In addition, source locations and magnitude of waste flows generated and (linear) transportation costs are given. The aim is to minimise overall cost. A B&B procedure, very similar to the one of ([6] Marks, 1969), is used for optimisation. Some variations of the model are described, for which special purpose algorithms are developed. The general model is applied in a case study for the Munich Metropolitan Area. ([8] Barros et al., 1997) present a model to determine an optimal network for the recycling of sand. In this real life case, sieved sand is coming from construction works, which represent the sources. The sand is delivered at a regional depot, where it is sorted in three quality classes. The first two classes, clean and half clean sand, are stored at the regional depot in order to be reused. The dirty sand is cleaned at a treatment facility, where it is also subsequently stored as clean sand. Both the clean and the half clean sand can be reused in new projects, which represent the sinks. Both supply and demand are fixed for the respectively three and two qualities of sand. It has to be determined at which locations regional - and treatment centres must be opened, where locations can be picked from a pregiven set of potential locations. Also the capacities of the facilities and the routing through the system have to be determined, where capacities of both facilities are restricted. Opening a facility incurs a fixed and
27
variable linear processing cost, transportation costs are also linear. The model used is a multi-level capacitated warehouse location model, for which heuristic algorithms are developed. ([9] Krikke et al., 1998) presents a MILP-model for a multi-echelon reverse logistic network design for durable consumer products. This model is applied in a business case study carried out at Océ, a copier manufacturer in The Netherlands. The study focuses on installing a remanufacturing process for a certain type of copy machines. In remanufacturing used machines are disassembled to a fixed level, after which suspicious or bad parts are removed additionally. Subsequently, repaired or totally new components (with improved functionality) are added. Thus, an entirely new type of machine is manufactured. The reverse chain consists of three main recovery processes: (i) dismantling, in which return products are disassembled to a prefixed level, (ii) preparation, in which critical parts are inspected and, if necessary, replaced and (iii) re-assembly, where the remaining carcass of the returned machine is actually remanufactured into a new machine by adding repaired and new components. In addition, there are a number of supportive processes, such as central stock keeping, sub-assembly production, and material recycling. While the supplying processes and dismantling are fixed, locations and good flows must be optimized for the processes (ii) preparation and (iii) re-assembly. The model is solved to minimizing operational costs. In ([10] Krikke et al, 1999), a MILP-model is developed for the set-up of a single product multi-echelon reverse logistic network with given and balanced supply and demand. The heart of the model lies in the concept of the processing route. A processing route is a physical implementation (or path) of processes needed to realise a recovery or disposal option. A set of feasible processing routes is generated for each reuse, recycling and disposal option. If a processing route is used then variable costs are incurred, i.e., processing costs of every facility in the processing route and transportation costs between the facilities. A facility must be opened, if at least one processing route is chosen that uses this particular facility. This incurs a certain fixed cost, which are added to the variable costs. In addition to the processing routes, we need entry routes and delivery routes. An entry route is the connection between a supply point and the first facility of a processing route. Using entry routes incurs variable transportation costs. Analogously, the customer is supplied with recovered products, components or materials via the delivery route. The (variable) ‘delivery costs’ are also equivalent to the transportation costs between the last facility on the processing route and the customer location. In the optimisation, an optimal configuration of entry, processing and delivery routes is determined, using a MILP-solver (LINGO). The models is applied in an automotive case. ([11] Louwers et al., 1997) consider the design of a recycling network for carpet waste. High disposal volumes (1.6 million tons of carpet waste landfilled in Europe in 1996) and increasingly restrictive environmental regulation on the one hand, and a potential of valuable material resources (e.g. nylon fibers) on the other hand has lead the European carpet industry to setting up a joint recycling network together with some chemical companies. Through this network carpet waste is to be collected from former users and preprocessed to allow for material recovery. Since the content of carpet waste originating from various sources (e.g., households, office buildings, carpet retailers, aircraft and automotive industry) varies considerably identification and sorting is required. Moreover the sorted waste is to be shredded and pelletized for ease of transportation and handling. These preprocessing steps will be carried out in regional recovery centers from where the homogenized material mix is transported to chemical companies for further processing. Goal of the study is to determine appropriate locations and capacities for the regional recovery centers taking into account investment, processing and transportation costs. The authors propose a continuous location model. Using a linear approximation of the share of fixed costs per volume processed, all costs are considered volume dependent. The resulting nonlinear model is solved to optimality using standard software. Carpet recycling is also addressed in a case study by ([12] Ammons et al., 1997). The volume of 5 billion pounds of used carpet material landfilled per year makes recycling an economically attractive option in the USA. While the entire carpet recycling chain involves several parties leadership is taken by a chemical company producing, a.o., nylon fibers. A logistics network is investigated including collection of used carpet from carpet dealerships, processing of collected carpet separating nylon fluff, other re-usable materials and a remainder to be landfilled, and end-markets for recycled materials. Currently, the system is operational with a single processing plant. For alternative configurations the optimal number and location of both collection sites and processing plants are to be determined while delivery sites for recovered materials are assumed to be known. Moreover, the amount of carpet
28
collected from each site is to be determined. Facility capacity limits are the only restrictions in view of the vast volume currently landfilled. The authors propose a multi-level capacitated facility location MILP model to address this problem. ([15] Jayaraman et al. (1997) analyse the logistics network of an electronic equipment remanufacturing company in the USA. The company’s activities encompass collection of used products from customers, remanufacturing of collected cores, and distribution of remanufactured products. Customers delivering discarded products and demanding remanufactured products do not necessarily coincide. Moreover, return supply is limited. In this network an optimal number and locations of remanufacturing facilities and the number of cores collected are to be determined considering investment, transportation, processing, and storage costs. The authors present a multi-product capacitated warehouse location MILP that is solved to optimality for different supply and demand scenarios. ([17] Spengler et al., 1997) develop a MILP-model for the recycling of industrial by-products in German steel industry. The model is based on the multi-level warehouse location problem and modified for this case study. It has to be determined which locations will be opened and how flows are routed from the sources through the intermediary facilities to the sinks. The model is multi-stage and multi-product, while it is allowed to transfer sub-streams of interim products from one intermediary facility to another in various ways, before delivering it at a sink. A sink can be either a reuse or a disposal location. Facilities can be installed at a set of potential locations and at different capacity levels, with corresponding fixed and variable processing cost. The type of processes to be installed at the intermediary facilities also have to be determined. Maximum facility capacities are restricted and transportation costs between locations are linear. While the amounts of waste generated at the sources are fixed, the demand at the sinks is flexible within a range. This range is set by the minimal required throughput and the maximum capacity of the sink. A1.2 Integral logistic cost models ([13] Thierry, 1997) describes the underlying LP-model of a Decision Support System REVLOG, which supports the design of a network for both forward and return flows. Given the locations of warehouses and (re-) manufacturing plants, good flows are optimised. Trade-offs are made with respect to the amount of new production versus remanufacturing, the amount of remanufacturing versus disposal, local versus central testing and direct distribution versus distribution via intermediary warehouses. All facilities are capacitated, transportation links are not. The aim is to maximise net profits, i.e., the net difference between sales from new and remanufactured products minus the variable processing and transportation costs. Supply and market demand are given, but not all market demand needs to be met. If applicable, lost sales are accounted for. A similar situation is addressed by ([14] Berger and Debaillie, 1997). They propose a conceptual model for extending an existing production/distribution network with disassembly centers to allow for recovery of used products. Responsibility for product recovery lies at the original product manufacturer (OEM) who incurs all costs. The model is illustrated in an artificial case of a computer manufacturer. The existing distribution network encompasses plants, distribution centers and customers. In the extended network used products need to be collected from the customers. Collected products are to be inspected in a disassembly center dividing them into three streams: high quality products can be repaired and shipped to a distribution center for re-sale; products containing re-usable parts may be disassembled and shipped to a plant to be re-used in the production process; all other products are to be disposed of. Each plant and distribution center can only use a limited amount of recovered products. While all facilities in the original network are fixed the number, locations, and capacities of disassembly centers are to be determined. In a variant of this model the recovery network is extended with another level by separating inspection and disassembly/repair. After inspection rejected products are disposed as before while recoverable products are shipped to a repair/disassembly center before entering a distribution center or a plant. The authors propose multi-level capacitated MILPs to address these problems. ([16] Kroon and Vrijens, 1995) consider the design of a logistics system for reusable transportation packages. More specifically, a closed-loop deposit based system is considered for collapsible plastic containers that can be rented as secondary packaging material. The system involves five (groups of)
29
actors: a central agency owning a pool of reusable containers; a logistics service provider being responsible for storing, delivering, and collecting the empty containers; senders and recipients of full containers; carriers transporting full containers from sender to recipient. The study focuses on the role of the logistics service provider. In addition to determining the number of containers required to run the system and an appropriate fee per shipment a major question is where to locate depots for empty containers. At these depots containers are stored and maintained, shipped to a sender upon request, and eventually collected from the recipient. Note that transportation of empty containers is carried out independently of the full shipment from sender to recipient, which may be realized by a different carrier. The expected volume and geographical distribution of demand is estimated on the basis of historical data concerning the number of shipments between given parties. Uncertainty is covered via scenario analysis. An additional requirement is balancing the number of containers at the depots. Since the total number of containers shipped from a depot during a planning period should equal the number of containers received containers may be relocated among the depots. The decision problem is modeled as a MILP that is closely related with a classical uncapacitated warehouse location model. A1.3 LCA oriented models A first attempt to combine Life Cycle Analysis with logistic optimisation is described in ([18] Bloemhof et al., 1996) who study the design of a production network for the pulp and paper industry. The production network contains the processes of pulp production, paper production, paper consumption, waste paper collection, recycled pulp production and the distribution of pulp, paper and waste paper. Life cycle assessment is used to obtain an environmental performance indicator for each process. These indicators are used as inputs for a linear programming network flow model to find optimal designs of the pulp and paper network with the lowest environmental impacts. ([20] Daniel et al, 1999) study a Life Cycle Assessment for the reverse supply chain of lead-acid batteries in relation to the collection (after use), recycling (of lead) and redistribution through the supply chain of new products. Starter batteries in cars have a service life of about three years. They are the main source of lead scrap. About 90% of the lead content of these batteries can be recovered and reused as raw material in a commercial scale for the production of new products. However, recycling of lead gives rise to environmental problems associated with its collection, processing and recycling. For the exploitation of used batteries a reverse chain is developed including all stages of the reverse flow of batteries, from the end of their life cycle till the production and sale of materials produced during the recycling procedure. ([19] Guelorget et al., 1993) presents a life-cycle assessment of automobile tires in France. The disposal of used tires represents a serious problem. Current disposal practices represent the loss of potentially useful materials, and recoverable energy as well as a threat to the environment and human health. Landfill bans fail to tackle the root causes of the problem and increase the proportion of tires disposed of under uncontrolled conditions. Using the life cycle assessment, different disposal alternatives are reviewed such as incinerating used tires, agricultural reuse of tires, and material recovery. ([3] Caruso et al., 1993) consider an Urban Solid Waste Management System (USWMS). They develop a location-allocation model to find the number and locations of the processing plants, given the locations of the waste generators and landfills. For each processing plant, the technology -incineration, composting or recycling-, the amount of waste processed as well as the allocation of service users (waste sources) and landfills (waste sinks) are determined. No more than one facility may be located in one geographic zone and there are maximum capacities for all facilities and landfills. The model is single period and has a multi-criteria objective function, with components for economic cost, waste of resources and ecological impact. Efficient heuristics are developed to solve the problem. The model was applied in a case study for the region of Lombardy (Italy). ([21] Sasse et. al, 1999) present a model that optimises the logistic network for sewage sludge recycling system. This model optimises a multi-criteria objective function including both economical and ecological cost functions, such as energy use. Sludge is supplied from sources. If feasible, it can be shipped directly to sinks for reuse. If necessary, the sludge is cleaned by (one or more) treatment processes, before being shipped to the sinks. Optimal locations are chosen for treatment centers (from a set of feasible locations) and good flows in the system are optimised. Installing a treatment center incurs fixed costs and processing costs are linear with the volume. Transportation costs are also linear.
30
This result in a two-criteria MILP-model, which is applied in a case problem for the German Federal State of Baden-Wurttemberg. ([30] Berger et al, 1998) present a model called EUGENE which is developed to support regional decision makers in the setup of a solid waste management system. Given parameters involve the sources of waste supply, the volumes generated, the various types of waste distinguised for collection (separation at the source) plus allowed waste type combinations in collection, a set of potential locations for processing facilities and landfills, a set of existing and new technologies for processes and landfills, location and volume of reuse markets (energy, recyclables etc.) and a distance matrix. The model is multiperiod. Decision variables are a collection scheme, capacities per time period for each process and landfill per type of technology installed, the volumes processed by and transported between facilities and allocation of sources and sinks. EUGENE is a general model which can be modified for specific problems. For example, its objective function can be economical or ecological. The model has been used to support the optimisation of the solid waste system for the City of Montreal.
31
Appendix 2: Mathematical model Index sets: O = set of possible product designs, O=(o1..o3) A = set of components, A=(a1..a25) T = set of modules, T=(t1..t13) M = set of materials, M=(m1..m4) S = set of supply points of raw materials (fixed), S=(s1..s10) C = set of customer locations primary markets (fixed with returns), C=(c1..c10) D = set of disposal and thermal recycling locations (fixed without returns), D=(d1..d10) P = set of supply chain process (forward or return) process to be assigned to location f, P=(p1..p9) F = set of facility locations, F=(f1..f20) (P,F) = set of facilities, i.e., processes p∈ P assigned to location f∈ F E = set of environmental indicator (energy and waste), E=(e=e1,e2) Parameters: F(p) = set of feasible locations f for p wma
= amount in kg of material m used for constructing 1 kg of component a by p, i.e., material input for component manufacturing w1
at = amount in kg. of component a supplied for constructing 1 kg of module t in assembly
w2at
= amount in kg. of component a supplied for constructing 1 kg of module t in rebuilt wao = amount in kg. of component a in kg (directly) used for the assembly of 1 kg. product with design o wto = amount in kg. of module t used for the assembly of 1 kg. of product with design o ucp = amount in kg. of products discarded by consumer c and feasiable for process p divided into total amount used in kg. ut
p = amount in kg. of modules t feasible for p after inspecting 1 kg. of modules rot = amount in kg. of module t released from disassembling product o rta = amount in kg. of component a released from module t after disassembling 1 kg. of module t roa = amount in kg. of component a directly released after disassembling 1 kg. of product o ua
d = amount in kg. of component a feasible for disposal/thermal recycling at location d after inspection of 1 kg. of a ua
p = amount in kg. of component a feasible for p (material recycling or warehousing) after inspection of 1 kg. of a. ram = amount in kg. of material m resulting from recycling 1 kg. of component a Vc = demand finished product at customer location c Vd = maximal volume external secondary market d ze = deviation variable for environmental indicator e zcost = deviation variable costs gcost = weight assigned to zcost ge = weight assigned to ze Tcost = target value total costs (max) Te = target value performance for indicator e (min/max) cm
sf = costs of supplying 1 kg. material m from supply point s to facility location f cff’ = costs of transporting 1 kg. of product, module, component or material from location f to location f’ cfc = costs of transporting 1 kg. of product, module, component or material from location f to customer c ca
fd = costs of transporting 1 kg. of component a from location f to disposal/thermal recycling location d (this includes costs for processing, which are also linear) ca
pf = costs of processing 1 kg. of component a by process p at location f ct
pf = costs of processing 1 kg. of module t by process p at location f co
pf = costs of processing 1 kg. of product by process p for design o FIXpf = annualised setup plus fixed processing costs for installing process p at location f c(e1)m
sf = energy use of supplying 1 kg. material m from supply point s to facility location f c(e1)ff’ = energy use of transporting 1 kg. of product, module, component or material from location f to location f’ c(e1)fc = energy use of transporting 1 kg. of product, module, component or material from location f to customer c
32
c(e1)fd = energy use of transporting 1 kg. of product, module, component or material from location f to disposal location d (includes processing) c(e1)a
pf = energy use of processing 1 kg. of component a by process p at location f c(e1)t
pf = energy use of processing 1 kg. of module t by process p at location f c(e1)o
pf = energy use of processing 1 kg. of product by process p with design o β = a very large number σ = rate of return εx = scaling factor for deviation variable zx Decision variables: Xm
spf = material flow m for the construction of component a from s to (p,f) Xm
pfp’f’ = material flow m from (p,f) to (p’,f’) Xa
pfp’f’ = component flow a from (p,f) to (p’,f’) Xt
pfp’f’ = module flow t from (p,f) to (p’,f’) Xo
pfp’f’ = product flow of type o from (p,f) to (p’,f’) Xo
pfc = product flow of type o from (p,f) to customer c Xo
cpf = product flow of type o from customer c to (p,f) Xa
pfd = component flow from (p,f) to disposal/thermal recycling locations d Xo
pf = product flow processed at (p,f) Xa
pf = component flow a processed at (p,f) Xt
pf = module flow t processed at (p,f) ypf = boolean, 1 indicates assignment of process p to location f else 0 Now, the problem studied can be formulated in (simplified) mathematical terms in the following way. Within the (single) planning period considered, Vc refridgerators can be sold at each market c, from where each agent serves customers in the area. To this end, refridgerators have to be manufactured from materials m, components a and modules t, where the product structure depends on the product design o. Raw materials are supplied from supplier locations s (sources), subsequently the components, modules and finally products can be manufactured in the supply chain by processes p. Products are used and discarded at markets c (which serve both as sinks and as a source) returned to the logistic network where several recovery processes p can be applied. Return flows that are not recovered end up at some sink d, either landfill or thermal recycling. Supply chain processes p can be installed at locations f, together they serve as nodes (p,f) in the network. For each process p, locations f can be chosen from a set F(p). Network design choices involve location choices ypf and good flows ‘X’, where location choices incur a fixed cost FIXpf and variable processing costs. Transportation costs for good flows are linear. Energy use (e1) is linear to volumes. Residual waste (e2) is the total volume of all components disposed of to sinks d. It is optimised on total economic costs, the use of energy e1 and residual waste e2. In a multicriteria model, relative devitions zx to a priori set target values Tx, (x=total costs, e1,e2) are minimised, where different weigths can be assigned to the three criteria. Objective function MIN gcost*zcost + �e ge*ze (1) s.t. Logical constraints (variable transportation costs) � � � �m s p f Xm
spf*cmsf + � � � � �a p f 'p 'f Xa
pfp’f’*cff’ + �� � � �t p f 'p 'f Xtpfp’f’*cff’ +
� � � �� p f 'p 'fo Xopfp’f’*cff’ + � � �� p f co Xo
pfc*cfc + � � �� c p fo Xocpf*cfc +
� � � �a p f d Xapfd*ca
fd + � � � � �m p f 'p 'f Xmpfp’f’*cff’ +
(variable+fixed processing costs)
� � �a p f Xapf*ca
pf +�� �t p f Xtpf*ct
pf + � �� p fo Xopf*co
pf +� �p f ypf*FIXpf - εcost*zcost = Tcost (2) (energy use for transportation)
� � � �m s p f Xmspf *c(e1)m
sf + � � � � �a p f 'p 'f Xapfp’f’*c(e1)ff’ + �� � � �t p f 'p 'f Xt
pfp’f’*c(e1)ff’ +
� � � �� p f 'p 'fo Xopfp’f’*c(e1)ff’ + � � �� p f co Xo
pfc*c(e1)fc + � � �� c p fo Xocpf*c(e1)fc +
� � � �a p f d Xapfd*c(e1)a
fd + � � � � �m p f 'p 'f Xmpfp’f’*c(e1)ff’ +
33
(energy use for processing) � � �a p f Xa
pf*c(e1)apf +�� �t p f Xt
pf*c(e1)tpf + �� � op f Xo
pf*c(e1)ocf - εe1*ze1 = Te1 (3)
(residual waste stream, including thermal recycling)
� � � �a p f d Xapfd – εe2*ze2 = Te2 (4)
ypf = 0,1 ∀ p∀ f∈ F(p) (5) �o Xo
pf + �a Xapf +�t Xt
pf ≤ ypf*β ∀ p∀ f (6) Xm
spf, Xmpfp’f’, Xa
pfp’f’, Xtpfp’f’, Xo
pfp’f’, Xopfc, Xo
cpf, Xapfd, Xo
pf, Xapf, Xt
pf >=0 for all parameter values (7) Balance equations forward (pull or downstream): Vc = �o � f Xo
pfc ∀ c p=p2 {inbound products to market from warehouse} (8)
Xopf = �c Xo
pfc ∀ o ∀ f∈ F(p) p=p2 {outbound products from warehouse to market} (9) Xo
pfp’f’ ∀ a ∀ f∈ F(p) p=p1, p’=p2 {outbound components from manufacturing} (21)
�a Xapf*wma =�s Xm
spf + � 'f Xmp’f’pf ∀ f∈ F(p) ∀ m p=p1, p’=p9 {inbound materials to manufacturing} (22)
Balance equations reverse(push or upstream): � 'f Xo
p’f’c *ucp ≥� f Xocpf ∀ o∀ c ∀ p=p5,p6 p’=2 {return feasibility for repair/disassembly} (23)
� 'f Xop’f’c*σ = � �6p,5p f Xo
cpf ∀ o ∀ c p’=p2 {all products sold times return rate are returned} (24)
Xopf = �c Xo
cpf ∀ o ∀ f p=p5, p6 {inbound products for repair/disassy} (25)
Xopf = � 'f Xo
pfp’f’ ∀ f ∀ o p=p5 p’=p2 {outbound products after repair} (26)
�o Xopf*rot = � 'f Xt
pfp’f’ ∀ t ∀ f p=p6 p’=p7 {outbound modules after disassy} (27)
Xtpf = � 'f Xt
p’f’pf ∀ t ∀ f p=p7 p’=p6 {inbound modules for inspection} (28)
Xtpf*ut
p’ ≥ � 'f Xtpfp’f’ ∀ t ∀ f p=p7 ∀ p’=p6, p2, p8 {feasibility of outbound modules after inspection
for various further processing options} {29} Xt
pf = � �'p 'fXt
pfp’f’ ∀ t ∀ f p=p7 ∀ p’=p6, p2, p8 {no more modules than available can be processed} {29a} Xt
pf = � 'f Xtp’f’pf ∀ t∀ f p=p8 p’=p7{inbound modules for rebuilt} (30)
�t Xtpf*w2
at = � 'f Xap’f’pf ∀ a ∀ f p=p8 p’=p2 {inbound components for rebuilt} (31)
Xtpf = � 'f Xt
pfp’f’ ∀ t ∀ f p=p8 p’=p2 {outbound modules after rebuilt} (32)
Xtpf = � 'f Xt
p’f’pf ∀ t ∀ f p=p6 p’=p7 {inbound modules for disassy} (33)
�o Xopf*roa +�t Xt
pf* rta = � 'f Xapfp’f’ ∀ a ∀ f p=p6 p’=p7 {outbound components after disassy} (34)
Xapf = � 'f Xa
p’f’pf ∀ a ∀ f p=p7 p’=p6 {inbound components for inspection} (35)
Xapf*ua
p’ ≥ � 'fXa
pfp’f’ ∀ a ∀ f p=p7 ∀ p’=p2,p9 {outbound components for closed loop
applications:material recycling and warehouse (reuse as is)} (36)
34
Xapf*ua
d ≥ Xapfd ∀ a ∀ f ∀ d p=p7 {outbound components after inspection for out of loop
applications: thermal recycling and disposal} (37) Xa
pf = �d Xapfd+ � � ='f 9p,2p'p Xa
pfp’f’ ∀ a ∀ f p=p7{outbound components after inspection can only be submitted to one option} (37a) � �a f Xa
pfd ≤ Vd ∀ d p=p7 {inbound components for out of loop applications} (38)
Xapf = � 'f Xa
p’f’pf ∀ a ∀ f p=p9 p’=p7 {inbound components for recycling}(39)
�a Xapf*ram = � 'f Xm
pfp’f’ ∀ m ∀ f p=p9 p’=p1 {outbound materials for (re-)manufacturing}(40) Explanation: (1) states the objective function. Equations (2)-(4) define the deviation variables optimised in (1). Equations (5)-(6) specify requirements for the boolean variables that get value 1 in case a facility is opened and a value 0 if not. Here a facility is opened if the good flows totalised over a, t and o are positive. Equation (7) specifies non negativity requirements for all good flows. Equation (8)-(22) make sure that for each facility in the forward chain input and output are balanced. Note that in (8) customer demand triggers warehousing and from there all other processes are ‘pulled’ via (9) to (22) up to the start at material supply. Equations (23)-(40) make sure that for all reverse facilities input and output are balanced. The return flow is triggered by (23) and (24), from where all reverse processes are ‘pushed’ via (25)-(40) until the point of reuse. Special equations are (10) (16) (19) (20) (22) (23) (24) (26) (29) (31) (32) (36) and (40) because here foreward and reverse flows are linked. In time, the balance equations are ‘activated’ sequentially; first (8) and (9) (sales), then (23)-(40) (returns) and finally (10)-(22) (manufacturing). Of course, this is not relevant for the algorithm, but it is relevant in view of the assumptions made in the problem definition.