The Cereals Sector in Bosnia and Herzegovina Preparation of IPARD Sector Analyses in Bosnia and Herzegovina 2012 FAO Regional Ofϐice for Europe and Central Asia This project is funded by the European Union
Transcript
The Cereals Sector in Bosnia and Herzegovina
Preparation of IPARD Sector Analyses in Bosnia and Herzegovina
2012
FAO Regional Of ice for Europe and Central Asia
Please address comments and inquiries to:
Regional Offi ce for Europe and Central Asia Food and Agriculture Organiza on of the United Na ons (FAO)
Benczúr u. 34, 1068 Budapest, HungaryTelephone: (+36) 1 461 2000Fax: (+36) 1 351 7029Email: [email protected]: www.fao.org/europe/en
Electronic Version of the report: www.fao.org/europe....
FAO Regional Offi ce for Europe and Central Asia
31 August 2012
The
Cere
als S
ecto
r in
Bosn
ia a
nd H
erze
govi
na
This project is funded by the European Union
The Cereals Sector in Bosnia and Herzegovina
Prepara on of IPARD Sector Analyses in Bosnia and Herzegovina
GCP/BIH/007/ECContract number: 2010/256–560
Regional Offi ce for Europe and Central Asia Food and Agriculture Organiza on
of the United Na ons
This publica on has been produced with the assistance of the European Union. The contents of this publica on are the sole responsibility of the Regional Offi ce for Europe and Central Asia of the Food and Agriculture
Organiza on of the United Na ons and can in no way be taken to refl ect the views of the European Union.
The designa ons employed and the presenta on of material in this publica on do not imply the expression of any opinion whatsoever on the part of the Food and Agriculture Organiza on of the United Na ons (FAO) concerning the legal or development status of any country, territory, city or area or of its authori es, or concerning the delimita on of its fron ers or boundaries. The men on of specifi c companies or products of manufacturers, whether or not these have been patented, does not imply that these have been endorsed or recommended by FAO in preference to others of a similar nature that are not men oned.
All rights reserved. FAO encourages reproduc on and dissemina on of material in this publica on. Non-commercial uses will be authorized free of charge. Reproduc on for resale or other commercial purposes, including educa onal purposes, may incur fees. Applica ons for permission to reproduce or disseminate FAO copyright materials and all other queries on rights and licences, should be addressed by e-mail to [email protected] or to the Chief, Publishing Policy and Support Branch, Offi ce of Knowledge Exchange, Research and Extension, FAO,Viale delle Terme di Caracalla, 00153 Rome, Italy.
Analiza sektora proizvodnje žitarica čini jednu od pet studija sektora u 2011. godini i predstavlja osnovu za razvoj Pred-pristupnog instrumenta EU-e za ruralni razvoj (IPARD).
Glavni cilj izvještaja je da da sveobuhvatnu analizu stanja u zemljoradničkom sektoru u BiH, fokus izvještaja je sektor žitarica sa sa naglaskom na dvije osnovne žitarice : pšenicu i kukuruz, ali je takođe obraćena pažnja na : ječam, raž i zob. Prema tome, ovaj izvještaj doprinosi analizi unutrašnjih jakih i slabih strana kao i vanjskih mogućnos i prijetnji za ovaj sektor. U svjetlu potreba o problema u sektoru i predstojećih izazova, procijenjene su potrebe ulaganja i formulisane prepuruke u smislu poli ka. Na ovaj način izvještaj doprinosi formulaciji jednog broja mogućih intervencija u odnosu na poli ku u sektoru poljoprivrede i ruralnog razvoja u skladu s potrebama razvoja ovog sektora.
Metodologija
Ova studija daje pregled proizvodnje i prerade žitarica u BiH. Analiza je bazirana na sljedećim ak vnos ma:
Istraživanje i sta s ka
Proučavanje pisanih materijala
Studija je počela pregledom postojećih izvještaja o poljoprivrednom sektoru u BiH uz poseban osvrt na uzgoj žitarica. Vidi poglavlje o korištenoj literaturi i web stranicama.
Sta s ka
Ova studija se velikim dijelom oslanja na ustanovljene podatke, zbog čega je glavni izvor bilo Ministarstvo vanjske trgovine i ekonomskih odnosa, Sektor poljoprivrede, prehrane, šumarstva i ruralnog razvoja (MoFTER/ SAFFRD), Ministarstvo poljoprivrede, vodoprivrede i šumarstva FBiH, Ministarstvo poljorpivrede, šumarstva i vodoprivrede RS, Odjel za poljoprivredu, vodoprivredu, šumarstvo i veterinarstvo
Distrikta Brčko, Poljoprivredni fakultet u Banjoj Luci i Sarajevu, Agencija za sta s ku BiH i drugi.
Nedostatak detaljnih informacija o izvedbi bio je i još je uvijek ozbiljna prepreka za efek van razvoj i provedbu poli ke sektora uzgoja žitarica.
Ankete
Učešće u terenskim anketama o mesu i mliječnim proizvodima dalo je korisne rezultate, jer mnogi poljoprivrednici koji uzgajaju žitarice rade to da bi hranili svoje živo nje. Ti poljoprivrednici žele da im uzgoj živo nja bude unosan, i oni mogu indirektno da uvid u proizvodnju žitarica.
Utvrđen je konzistentan nedostatak pouzdanih informacija, naročito o tehničkom i fi nansijskom aspektu rada poljoprivrednika. Studija se bavila ovim nedostatkom kroz manje terenske ankete. Ukupno je ispitano preko 130 poljoprivrednih dobara sa oko 2.500 ha obradive zemlje i pašnjaka, a rezulta su integrisani u studiju o ovom sektoru; svrha je takođe bila da se dobije realna slika zemljoradničkog sektora – pored postojećih sta s čkih podataka i službenih izvještaja. Nadalje, korištene su procjene eksperata gdje god je to bilo potrebno.
Analiza slučaja
Poljoprivredni fakulte u Banjoj Luci i Sarajevu uradili su analizu nekoliko pažljivo odabranih slučajeva; analize slučaja su uključile detaljan opis karakteris ka proizvoda (nivo tehnologije, oprema, umijeće, standardi kvaliteta, smetnje i slabe strane u lancu vrijednos ) različi h proizvođača (naturalnih proizvođača, holdinga i velikih korporacija) i prerađivača (malih i velikih) uz poš vanje standarda EU.
Konsultacije sa ključnim akterima
Obavljeni su razgovori sa ključnim akterima, a to su između ostalih sljedeće ins tucije: Ministarstvo vanjske trgovine i ekonomskih odnosa, Sektor poljoprivrede, prehrane, šumarstva i ruralnog razvoja,
Ministarstvo poljoprivrede, vodoprivrede i šumarstva FBiH
Ministarstvo poljoprivrede, šumarstva i vodoprivrede RS, Odjel za poljoprivredu, vodoprivredu, šumarstvo i veterinarstvo Distrikta Brčko Poljoprivredni fakultet u Banjoj Luci Poljoprivredni fakultet u Sarajevu Agencija za sta s ku BiH Poljoprivredni ins tut u Banjoj Luci Federalni zavod, propagandni materijal za sjeme i bilje /eng. Federal Ins tute Seed and Plant Propaga on Material/ Ostali
Vrijedno je pomena da su na samom početku dogovoreni sastanci sa zvaničnim kontakt osobama u dva en tetska ministarstva u Banjoj Luci i Sarajevu i Odjelu za poljoprivredu, vodoprivredu, šumarstvo i veterinarstvo Distrikta Brčko da bi se saznalo više o ekonomskoj situaciji poljoprivrednika i prerađivača. Takođe je dat uvid u poli čku situaciju u BiH koja je prilično kompleksna.
Radionice
Značajan naglasak je stavljen na pribavljanje mišljenja velikog broja aktera. Stoga, organizovane su če ri radionice u Banjoj Luci i Sarajevu, neposredni sastanci sa ins tucijama, proizvođačima i prerađivačima. Tim studije se sastao sa ukupno 100 poljoprivrednika, prerađivača, ins tucija i drugim akterima. Prve dvije SWOT (Snage, Slabos , Mogućnos i Prijetnje) radionice organizovane su u Banjoj Luci i Sarajevu u junu 2011. godine, gdje se diskutovalo o širim javnim i drugim aspek ma ratarskog sektora. Drugi krug radionica održan je na is m lokacijama u oktobru 2011. godine, a cilj je bio da se predoče zaključci analiza sektora i preliminarne preporuke za moguće intervencije u pogledu poli ke, a istovremeno da se od aktera dobiju pouzdane povratne informacije o m zaključcima i preporukama; smatralo se veoma bitnim da akteri dobiju priliku da daju svoje komentare, a to su uveliko i radili; na primjer, eliminacijom sufi nansijske pomoći za obnovljivu energiju kao što je biogorivo i biogas.
Druge provedene ak vnos
Terenske posjete odabranim lokacijama na kojima će provedene mjere ima veliki u caj
U septembru 2011. godine obavljena je terenska posjeta najvažnijim područjima u BiH, od Banja Luke do Brčkog i Bijeljine.
Kontak sa drugim donatorima i NVO-a da bi se saznalo više („naučene lekcije”)
USAID & SIDA; Projekat unapređenja poljoprivrednih tržišta (FARMA), g. Bruce BROWER, CoP UGRIZ, Udruženja gradana za razvoj ruralne informa cke zajednice u BiH AgrIng.ba, g. Besim Tabaković, dipl.ing.
Generalni nalazi za razvoj sektora žitarica
Proizvođači žitarica
Proizvođači žitarica u Bosni i Hercegovini su poljoprivrednici, to su generalno mali poljoprivrednici i donekle poljoprivredne zadruge ili preduzeća.
Mala poljoprivredna dobra – uz izuzetak intenzivne proizvodnje povrća i voća – su uvijek miješana poljoprivredna dobra jer površina u akrima ne dozvoljava dovoljan profi t i prema tome, zemljoradnici su primorani na uzgoj stoke da bi povećali vrijednost svojih proizvoda. Mnoga od ovih poljoprivrednih dobara služe samo u naturalne i polunaturalne svrhe, a na kraju višak proizvodnje šalju na tržište. Prema tome, oni često ne uzgajaju kukuruz i pšenicu za tržište, nego za krmu za stoku kao i za ljudsku ishranu. Na primjer, od 70.000 poljoprivrednih dobara u RS-oj, 70% (= 49.000) je uključeno u proizvodnju žitarica, a njih 30% (= oko 15.000) proizvodi za tržište; ovo obuhvata do 20% svih poljoprivrednih dobara.
Struktura proizvodnje
Anketa koja je urađena u okviru ove analize pokazuje da prosječni zemljoradnici uzgoje 2.88 ha ozime pšenice, 0.59 ha ječma, 0.64 ha tri cale (što je hibrid pšenice (Tri cum) i
raži (Secale), 4.03 ha kukuruza, 1.27 ha soje i 0.04 ha suncokreta. Zanimljiv je podatak da je tri cale popularniji od pšenice. Konačno, samo 16 zemljoradnika proizvodi silažu kukuruza i oni imaju između 230 ha i 1 ha silaže, dok neki imaju između 230 i 15 ha, a druga grupa između 7 ha i 1 ha; ovo pokazuje da silaža kukuruza još uvijek nije rasprostranjena, dijelom zato što ne znaju kako, a dijelom zbog nedostatka teških traktora za kompresuju silosa, i organizovane radne snage da bi se izgradili lanci silosa; za to je potrebno nekoliko traktora i prikolica, jer kvalitet velikim dijelom zavisi od brzine prilikom silaže.
U Bosni i Hercegovini postoji nekoliko poljoprivrednih dobara koja se isključivo bave ratarstvom; glavni razlog bi mogao bi to da veći poljoprivrednici, koji mogu ostvari efi kasnu proizvodnju, su takođe boga ji poljoprivrednici koji mogu priuš dodatna ulaganja u stočnu proizvodnju.
Glavni razlozi zašto poljoprivrednici uzgajaju pšenicu su da se omogući rotacija usjeva i stoga izbjegnu monokulture kukuruza da se izbjegne gomilanje posla da se dobije slama za živo nje i stajsko gnojivo da se dobije materijal za proizvodnju brašna; u prošlos pšenica je davana mlinovima, a poljoprivrednici su primali odgovarajuću količinu brašna; u današnje vrijeme pšenica se obično prodaje mlinovima, a brašno se kupuje tamo; neki poljoprivrednici sami proizvode svoje brašno na poljoprivrednim dobrima da bi se smanjili troškovi jer se uzgoj kukuruza smatra unosnim i neophodnim, dok se pšenica uzgaja da bi se „nešto” žnjelo uz male troškove; ovo dobro odražava rasprostranjeno shvatanje „poljoprivrede malih ulaganja”
Glavni razlozi zašto poljoprivrednici uzgajaju kukuruz su da bi povećali profi t poljoprivrednog dobra, jer je kukuruz daleko unosniji od pšenice
da bi proizveli krmu za upotrebu na dobru; ovo je slučaj kod naturalnih poljoprivrednika sa ½ ha kukuruza kao i kod velikih poljoprivrednika; svi poljoprivrednici imaju živo nje, mali ih imaju zato što je to dio njihove ishrane, a veliki zato što se tako mogu bolje nosi s fl uktuacijama na tržištu bilo da prodaju žitarice ili da tove živo nje m žitaricama pošto je kukuruz veoma popularna biljka u svim nerazvijenim, brdovi m zemljama, jer se on može koris na poljoprivrednom dobru bez dalje prerade osim mljevenja za ljudsku ishranu i ishranu stoke mali zemljoposjednici beru kukuruz uglavnom ručno, dok se pšenica ne bere ručno
Poljoprivrednici drže stoku i tove više živo nja kada su žitarice je ine; ako su cijene pšenice i kukuruza na tržištu dobre, poljoprivrednici smanjuju broj živo nja koje uzgajaju i prodaju više žitarica. Ove fl uktuacije bi se mogle smanji povećanom nabavkom koncentrata stočne hrane čime bi se takođe mogla poveća produk vnost uzgoja stoke i rezul ra većim prihodima za poljoprivrednike.
Vrijednos proizvodnje
U BiH ukupna zasijana površina u 2009. godini bila je 528.028 ha, dok je površina zasijana žitaricama bila 311.538 ha ili oko 59%. Površina zasijana kukuruzom bila je 189.615 ha, odnosno 60,86% zasijane površine, a žetva je iznosila 965.552 t, što odgovara 5,09 t/ha. Površina u akrima zasijana pšenicom bila je 67.747 ha, što je jednako 21,75% zasijane površine a žetva je iznosila 255.899 t, što čini 3,78 t/ha.
U RS ukupna zasijana površina u 2009. godini bila je 323.000 ha, dok je površina zasijana žitaricama bila 215.892 ha ili 66.84%. Površina zasijana kukuruzom bila je 135.000 ha, odnosno 62,53% zasijane površine, a žetva je iznosila 696.000 t, što odgovara 5,16 t/ha. Površina u akrima zasijana pšenicom bila je 45.000 ha, što je jednako 20,84% zasijane površine, a žetva je iznosila 166.000 t, što čini 3,69 t/ha.
U FBiH ukupna zasijana površina u 2009. godini bila je 192.000 ha, dok je površina zasijana žitaricama bila 85.000 ha ili 44,27%. Površina zasijana kukuruzom bila je 48.685 ha, odnosno 57,28% zasijane površine, a žetva je iznosila 239.605 t, što odgovara 4,92 t/ha. Površina u akrima zasijana pšenicom bila je 19.011 ha, što je jednako 22,37% zasijane površine, a žetva je iznosila 74.992 t, što čini 3,94 t/ha.
Među m, neki domaći stručnjaci tvrde da se u Federaciji pšenica uzgaja na jedva više od 10.000 hektara: „Zvanični podaci o proizvodnji pšenice, naročito u FBiH, su prilično nedosljedni i prema riječima generalnog direktora Žitozajednice (Alija ŠABANOVIĆ ) and direktora Direkcije za robne reserve (Tončo BAVRKA) ne odražavaju svarno stanje, jer je ukupni godišnji urod znatno manji. Naime, zvanični sta s čki podaci govore da je u 2009. godini u Federaciji BiH ubrano oko 75.000 tona pšenice sa ukupne površine od 19.000 ha. Prema riječima gore navedenih direktora, ukupna proizvodnja pšenice u FBiH kreće se između 5.000 i 10.000 tona maksimalno, a ovaj nivo proizvodnje potvrđuje količina uvezene pšenice, s jedne strane, i kupovina pšenice iz domaćeg uzgoja – koja u FBiH ne premašuje 5.000 tona (dok u Republici Srpskoj kupljene količine se kreću između 30.000 i 40.000 tona) sa druge strane. Pored toga, informacije o pods cajima za proizvodnju pšenice u Federaciji BiH za 2009. godinu dokazuju da su proizvedene količine mnogo manje od zvaničnih. Budući da je ukupni pods caj dodijeljen Federaciji BiH u 2009. godini iznosio 1,73 miliona KM, a pods caj po kilogramu je bio 0,12 KM, može se zaključi da je ukupna podržana proizvodnja iznosila 14.400 tona. Na osnovu ove informacije i pretpostavke da skoro 90% proizvođača imaju pravo na takve pods caje, može se reći da je ukupna proizvodnja u Federaciji BiH u 2009. godini iznosila oko 16.000 tona ubranih sa ukupne površine od 4.000 ha.”
U Distriktu Brčko ukupna zasijana površina u 2009. godini bila je 13.028 ha, dok su žitarice
zasijane na 10.646 ha ili 81,72%. Površina zasijana kukuruzom bila je 5.930 ha, što je jednako 55,70% zasijane površine, a žetva je iznosila 29.947 t, što odgovara 5,05 t/ha. Površina u akrima zasijana pšenicom bila je 3.736 ha, što je jednako 35,09% zasijane površine, a žetva je iznosila 14.907 t, što čini 3,99 t/ha.
Prema sta s čkim podacima u RS i FBiH, osim žitarica takođe su zastupljeni usjevi stočne hrane a ovdje i zeleni kukuruz za krmu; površina zlenog kukuruza u RS bila je 4.453 ha, a u FBiH 16.717 ha, proizvodnja 128.848 t, odnosno 340.081 t, a prosječan urod po hektaru bio je 28,34 t odnosno 20,34 t. Podaci za Distrikt Brčko nisu dostupni.
Sve gore navedene cifre su zasnovane na sta s čkim godišnjacima; među m jedan privatni prodavač sjemena je rekao da je 90% kukuruza i 70% pšenice zasijano na sjeveru Bosne i Hercegovine, uz rijeku Savu, jer je ostatak Bosne brdovit i nepogodan za uzgoj žitarica; nadalje, prema njegovoj procjeni, površina u akrima zasijana kukuruzom je 120.000 ha, a pšenicom 50.000 ha. Jedan drugi prodavač sjemena je napomenuo da je površina pod kukuruzom oko 150,000 ha, a pod pšenicom 60.000 ha. Ovo bi bilo znatno manje od ukupnih cifara u Bosni i Hercegovini; odnosno 257.362 ha za pšenicu i kukuruz bez usjeva stočne hrane.
Procjene prodavača sjemena su možda realnije po pitanju hibridnog kukuruza, jer ova sjemena moraju kupova poljoprivrednici, dok poljoprivrednici mogu i često koriste pšenicu koja se čuva na poljoprivrednom dobru za sijanje, jer biološki nije potrebno kupova ser fi cirana sjemena.
Prilikom posjeta terenu, u cijeloj zemlji se mogu vidje male parcele (manje od 1 ha) zasijane kukuruzom; manji zemljoradnici često ručno obrađuju ove male površine. Klimatski uslovi za uzgoj pšenice i kukuruza su različi ; dok kukuruzu odgovaraju suha i topla ljeta, pšenici ne odgovara suviše suha klima, jer suha klima tokom cvjetanja znatno smanjuje urod. Prema tome, 90% kukuruza
je zasijano u sjevernoistočnom dijelu Bosne i Hercegovine, dok je 30% pšenice pronađeno u drugim dijelovima osim sjvernoistočnog dijela, na primjer, oko Odžaka, Orašja, Bihaća, Cazina, Livna i jugoistočnog Mostara.
Uopšteno govoreći, teško je dobi tačne podatke jer su precizni podaci dostupni samo ako se poljoprivrednici prijavljuju za subvencije; ali mnogi poljoprivrednici su suviše mali ili se plaše procedura registracije, tako da nisu svi poljoprivrednici koji uzgajaju pšenicu registrovani i to umanjuje dostupnost tačnih podataka.
Zaključak o proizvodnji je da je površina pod kukuruzom negdje ispod 189.615 ha, jer stručnjaci vjeruju da je to vjerovatnije između 120.000 i 150.000 ha. Po pitanju pšenice, stručnjaci misle da bi proizvodnja mogla bi 50.000 ha umjesto zvanično prijavljenih 67.747 ha.
Profi tabilnost pšenice i kukuruza
Upitnici sa farmi i studije slučaja koje su provedene kao dio analize ovog sektora pokazuju da proizvodnja pšenice u prosjeku za 2011 godinu ima prinos od 578 KM po hektaru uključujući po caje, dok kukuruz u prosjeku daje 944 KM po hektaru. Više je ekonomski ispla vo za farmere da uzgajaju kukuruz nego pšenicu, ovo takođe pokazuje važnost kukuruza u BiH u odnosu na pšenicu i druge žitarice. Ovi rezulta su u skladu sa procjenom pilot projekta Farm Accountancy Data Network (FADN) , koje su takođe indicirale da profi tabilnost ječma, raži i zobi je niža nego profi tabilnost kukuruza.
Central European Free Trade Agreement (CEFTA) i EU
Članstvo u CEFTA-i (od 2007.) je u suš ni integrisalo sve prethodne bilateralne i mul lateralne sporazume o slobodnoj trgovini koji su tada bili na snazi, a koje su potpisale sve zemlje regiona. Ovo članstvo je pružilo BiH važne trgovinske povlas ce i disciplinu (uključujući liberalizaciju trgovine, smanjenje izvoznih subvencija, smanjenje ili ukidanje tarifa ili drugih trgovinskih
prepreka za domaće proizvode, primjenu međunarodno usaglašenih pravila vezanih za veterinu, propisa o zdravlju bilja vezano za međunarodnu trgovinu hranom i poljoprivrednom robom itd.). Sve ovo je u skladu sa trgovinskim sporazumima sa EU koji su bitan dio EU/BiH Sporazuma o stabilizaciji i pridruživanju. CEFTA je u potpunos u skladu sa obavezama i prednos ma koje BiH ima zbog članstva u WTO za koji se i prijavila.
Što se če odnosa sa EU, is se mogu podijeli na dva odvojena perioda. Prvi period je trajao od 2000. do 2007. godine kada je BiH uživala povlašten tretman u vezi sa izvozom poljoprivrednih proizvoda na EU tržište. To je značilo da je svake godine EU izdavala posebne uredbe u kojim je iden fi kovala pove, količinu i vrijednost robe koja je
imala prednost za uvoz iz BiH. Jedini uslov je bio da BiH obezbijedi odgovarajući dokaz kvalitete i sigurnos proizvoda. Nažalost, BiH proizvođači nisu mogli zadovolji ove standarde tako da je veći dio izvozne kvote koju je utvrdila EU ostala neiskorištena.
Drugi period je počeo 2007. godine kada je BiH potpisala Sporazum o stabilizaciji i pridruživanju sa EU. Ovaj Sporazum (u dijelu o trgovini) ins tucionalizuje pravila trgovanja između BiH i EU; među m, is još nije ra fi kovala EU zbog predmeta Sejdić/Finci. BiH je dobila priliku da izvozi većinu poljoprivrednih proizvoda na EU tržište bez ikakvih carinskih dažbina ili drugih pristojbi. Za određeni (manji) broj proizvoda EU je rezervisala nivo zaš te putem carinskih dažbina i drugih kvota. S druge strane, BiH se obavezala da će postepeno ukinu carine i druge pristojbe na poljoprivredne proizvode koje dolaze iz EU. Za neke proizvode pristojbe su odmah ukinute dok je za druge ovaj proces podijeljen na faze, te će BiH do 2013. godine u potpunos liberalizova trgovinsko partnerstvo sa EU.
Priroda drugih promjena carinskih tarifa je bila viša u smislu harmonizacije sa obavezama koje proizilaze iz usvojenih međunarodnih propisa i sporazuma, koje iz tog razloga nemaju značajan u caj na zaš tu lokalne
proizvodnje. Veliki spoljnotrgovinski defi cit BiH vezan za poljoprivredne i prehrambene proizvode jasno govori da spoljnotrgovinska poli ka nije pravilno iskorištena.
INDUSTRIJA PRERADE
Ovo poglavlje se isključivo bavi malim i srednjim preduzećima za preradu koja imaju manje od 750 uposlenika ili obrt manji od 200 miliona eura, jednostavno zato što nema takvih preduzeća– uz izuzetak grupe MIMS (vidi ispod).
Industrija primarne prerade
U vrijeme Jugostavije bilo je 18 velikih državnih mlinova za brašno (usmjereni na pšenicu) i mlinova za stočnu hranu (usmjereni na kukuruz) u Bosni i Hercegovini koji su bili jednako korišteni na cijeloj teritoriji i rela vno moderno opremljeni jer su korištene tehnologije zapadne Evrope. Danas, najveći dobavljači mašina i opreme za mljevenje u BiH i druge zemlje bivše Jugoslavije su Švicarska, Italija i Češka (Buhler, GBS, Prokop, Ocrim i drugi). Tokom posljednjih nekoliko godina, turski proizvođači su takođe igrali važnu ulogu u dobavljanju mašina za mljevenje. Izgledi za ulazak u tržište EU navelo je proizvođače brašna da uvedu nove proizvodne tehnike za proizvodnju hidro-termalno prerađenog brašna, brzokuhajuće prekrupe i stabilizovanih pšeničnih klica, kao i da poboljšaju kvalitet domaćeg brašna.
U Jugoslaviji, ukupni kapacite za skladištenje i preradu bili su oko 455.000 tona pšenice. Broj velikih mlinova se smanjio. Nakon 1995. godine, ukupan broj mlinova se povećao zbog mnogo novoizgrađenih malih privatnih mlinova, tako da ima ukupno 80 mlinova u BiH. Mnogi mlinovi su namijenjeni za proizvodnju brašna, a otpaci i nusproizvodi se koriste za ishranu živo nja; samo 20 mlinova je isključivo namijenjeno za proizvodnju krme.
Kapacite i stvarna izvedba
Trenutno ukupni kapacite se procjenjuju na 650.000 tona godišnje. Pošto je svjetski prosjek upotrebe pšenice po glavi 135 kg u razvijenim zemljama, Bosni i Hercegovini bi
trebalo 513.000.000 tona godišnje za njenih 3,8 miliona stanovnika.
Prema podacima iz Federalnog Ministarstva poljoprivrede, proizvodnja hrane u nekim sektorima je mnogo veća nego što je to prijavljeno. Detaljna analiza materijala je pokazala da proizvođači nerado dostavljaju podatke koji prikazuju stvarnu proizvodnju. Prema procjenama, stvarna proizvodnja mliječnih proizvoda, proizvoda od brašna i drugih je veća nego što je to prijavljeno.
Veoma često postojeći kapacite nemaju mnogo zajedničkog sa stvarnom izvedbom, naročito kada su mlinovi u državnom vlasništvu ili su bili u državnom vlasništvu; na primjer, tokom 2005. godine iskorišteno je manje od jedne trećine ukupnih kapaciteta mlinova u FBiH. Do sada je najznačajniji mlin KLAS, koji preradi 400 t po radnom danu. Ovaj mlin zaista radi punim kapacitetom. On godišnje da oko 120.000 tona i pokriva oko 20% od ukupnih tržišnih potreba BiH. KLAS zapravo ne namjerava da poveća proizvodnju, a tehnologija koju koris da ra iz 2003. godine; KLAS je dio jedine jake kompanije u Bosni i Hercegovini, grupe MIMS, koja je danas jedna od najvećih privatnih kompanija u BiH, koja zapošljava preko 5.000 ljudi. Grupa MIMS je osnovana prije oko 10 godina kao kompanija za proizvodnju hrane, građevinskog materijala i kućanskih aparata na veliko. Danas ona ima mnogo kompanija članica kao što je Merkur (prodaja na malo), KLAS i Sprind (mlin i pekara, a u 2009. godini svaka je ostvarila promet od oko 57 miliona eura), pivare Sarajevo i Tuzla, i Vegafruit.
Industrija sekundarne prerade
Industrija sekundarne prerade uključuje industriju pečenja hljeba i pivare.
Pekarska industrija u RS ima oko 36 registrovanih preduzeća. Kapacite za skladištenje i mljevenje zrna kreću se do 50.000 tona. Kvalitet tehnologijskih mogućnos mlinova i skladišta znatno variraju. Nekadašnja velika državna preduzeća i sadašnje dioničke kompanije imaju savremenu opremu za razliku od privatnih malih mlinova sa jednostavnijom
tehnologijom i veoma upitnom proizvodnjom. Na osnovu podataka Zavoda za sta s ku Republike Srpske, tokom poslednjih 15 godina zabilježeno je da uvoz pšenice čini 80% a domaća pšenica 20% ukupno prerađene pšenice. Pored ovoga, postoje podaci o vanjskoj trgovini, na osnovu kojih se može zaključi da najviše vanjske trgovine ide na uvoz pšenice. Značajni ekonomski subjek bave se proizvodnjom živo njske hrane, sa rela vno stabilnom proizvodnjom od 25.000 tona godišnje.
Vodeće pivare su Bihaćka pivovara u Bihaću, Sarajevska pivara u Sarajevu i Pivara Tuzla u Tuzli, sve se nalaze u FBiH, kao i Banjalučka pivara u Banjoj Luci u RS.
U pivarskoj industriji kukuruz se nekad koris kao djelimična zamjena za ječmeni slad, jer je kukuruz je iniji od slada i ne kvari ukus. Među m, to pivu daje svjetliju boju. Kukurz se može dodava pivu u obliku brašna, zrnaca ili pahuljica. Postoji mnogo različi h razloga za korištenje kukuruza: cijena, dostupnost i u caj na konačni proizvod su glavni razlozi. U mnogim državama slad je dostupan u ograničenoj mjeri, i onda se zamjenjuje i to vjerovatno kukuruzom; u Evropi se uglavnom koriste zrna kukuruza, dok se u Aziji koris riža.
Kvalitet proizvoda i zahtjevi za kvalitetom
Izvještaji i mišljenja partnera su obično podijeljena po pitanju kvaliteta žitarica domaće proizvodnje. Jedan je napomenuo da je kvalitet objek vno izjednačen, bez znatnih odstupanja iz godine u godinu, i da poljoprivrednici inače ispunjavaju potrebne standarde kvaliteta. Samo tokom izuzetno vlažnih godina ili sušnih godina, kvalitet i kvan tet nisu u skladu sa zahtjevima.
Drugi, naročito mlinari, kažu da kvalitet žitarica domaće proizvodnje ne odgovara zahtjevima tržišta. Naročito od 2002. godine kada je zabilježen nagli pad kvaliteta. Da bi pekarska industrija pos gla potreban kvalitet, mlinovi u BiH moraju miješa pšenicu; omjer miješanja domaće i uvezene pšenice je 10 – 20% domaće sa 80 – 90% uvezene pšenice!
Nadalje, u prvom krugu radionica spomenuto je da su prerađivači često nailazili na žitarice pune fi tokemikalija, očigledno zbog nedostatka inspekcija.
Svi mlinari koje smo posje li rekli su da je kvalitet domaće pšenice suviše nizak, tako da oni moraju uvozi pšenicu boljeg kvaliteta radi miješanja. Drugi su rekli da bi oni kupavali više domaće pšenice ako bi se na neki način podržao uvoz pšenice boljeg kvaliteta.
Među m, nameće se i problem da kvalitet uvezenih žitarica varira iz godine u godinu, i od mlina do mlina. Ovaj problem je posljedica nedostatka odgovarajućih zakonskih propisa (i njihovo provođenje) u polju mlinarsko-pekarske industrije, ali i u odnosu na pekare i proizvođače tjestenine. U FBiH su usvojeni neki propisi u mlinarskoj industriji u odnosu na tehničko-tehnološku opremu i potrebu za osobljem da bi kompanija funkcionisala. Manji mlinovi i pekare koriste ovu situaciju i kupuju pšenicu i prerađuju je u brašno odmah, bez prethodne laboratorijske analize ili završnih priprema (pranje, odvajanje nepotrebnih tvari). Pekarski proizvodi sumnjivog kvaliteta koji se nude potrošačima u Bosni i Hercegovini su rezultat takve prakse.
POLITIKA VLADE za SEKTOR
Relevantne ins tucije koje upravljaju poljoprivredom i agroprerađivačkom industrijom u Bosni i Hercegovini su:
Ministarstvo vanjske trgovine i ekonomskih odnosa
S obzirom da BiH i dalje nema Ministarstvo poljoprivrede na državnom nivou, međunarodne obaveze vezane za poljoprivredu uglavnom provodi Ministarstvo vanjske trgovine i ekonomskih odnosa koji stoga ima Sektor za poljoprivredu, prehranu, šumarstvo i ruralni razvoj.
Uprava za zaš tu zdravlja bilja
Uprava za zaš tu zdravlja bilja je upravna organizacija unutar Ministarstva vanjske trgovine i ekonomskih odnosa osnovana je u maju 2005.godine. Već više godina
organizacija ima manjak uposlenika i nije pos gla mnogo u sastavljanju sekundarne legisla ve i prilagođavanju iste sa međunarodnim standardima i standardima EU; BiH je potencijalna kandidatkinja za EU. BiH je odobrila Međunarodnu konvenciju o zaš bilja (IPPC) 2003. godine ali i dalje nije u mogućnos da ispuni njene uslove. Evropska Unija pomaže Bosni i Hercegovini da prevaziđe neke od prepreka u cilju poboljšanja njenih nacionalnih fi tosanitarnih usluga i da uskladi njenu poli ku sa legisla vom EU i međunarodnim obavezama i standardima vezanim za ovo područje. Projekat uključuje zdravlje bilja, proizvode za zaš tu bilja kao i sjemenje i biljne materijale. Između ostalog, pomoć je usmjerena ka sastavljanju, usvajanju i provođenju propisa EU, jačanje ispekcija i širenje laboratorijskih kapaciteta kao i podizanje svijes odgovornih o boljim sistemima funkcioniranja.
Agencija za sigurnost hrane
Agencija za sigurnost hrane BiH osnovana je 2006. godine i predstavlja nezavisnu administra vnu organizaciju čije obaveze i zadaci su određeni Zakonom o sigurnos hrane iz 2004. Agencija za sigurnost hrane je stacionirana u Mostaru i obavlja različite naučne ak vnos (npr. sakuplja i analizira podatke o hrani i hrani za živo nje), analizira rizike, dostavlja naučna stanovišta državi i provodi međunarodne konvencije i ugovore vezane za sigurnost stočne hrane. Agencija takođe pokreće, sastavlja i organizuje provođenje odredbi za hranu i stočnu hranu i u kontaktu je sa komisijom „Codex Alimentarius“. Dodatni zadaci su kontrola inspektora za sigurnost hrane na en tetskom nivou, prijedlog Vijeću ministara da zvanične laboratorije za sigurnost hrane postanu „priručne laboratorije“, nastanak registra poslovnih upravitelja, podizanje svijes potrošača i drugi.
En tetska ministarstva poljoprivrede i Odjel u Distriktu Brčko
Dok RS ima samo jedno Ministarstvo poljoprivrede koje upravlja en tetskom
poli kom i subvencijama, FBiH ima ne samo jedno en tetsko Ministarstvo poljoprivrede, nego i 10 kantona sa svojim organima koji dijele nadležnos sa en tetom. Izmijenjeni Zakon o novčanoj podršci poljoprivredi i ruralnom razvoju Federacije defi niše vrste po caja između kantona i Federacije. Ipak, s obzirom da nema strategije za ruralni razvoj, subvencije za proizvode imaju veću fi nansijsku pomoć nego mjere za ruralni razvoj.
Ne postoji jasna poli ka za subvencije s obzirom da su tu uključene područne premije, podrška za proizvode i doprinosi od gnojiva. Subvencije nisu u skladu sa poli kom EU za poljoprivredu koja preferira područne premije. Budžet za poljoprivredu i ruralni razvoj je u en te ma i dalje nizak. Nedostatak efi kasne administracije sputava poljoprivrednike i agroprerađivačku industriju u cijeloj zemlji. Takođe, s obzirom da ne postoji Ministarstvo poljoprivrede na državnom nivou, situacija je jako nepredvidiva i nepovoljna.
Poli ka trgovine
Izvoz poljoprivredno-prehrambenih proizvoda je iznosio 200 miliona eura tokom 2008. godine, a 70% izvoza je bilo u zemlje zapadnog Balkana. Izvoz poljoprivrednih proizvoda je premašio iznos od 1.3 milijarde eura tokom 2008. godine, čiji je rezultat bio veoma nega van neto trgovinski bilans poljoprivredno-prehrambenim proizvodima od više od 1 milijarde eura, što će reći da je BiH veliki neto uvoznik hrane. Uvozne dažbine za većinu prehrambenih proizvoda su približne nuli, a malo uvoznih dažbina koje su na snazi će se još više smanji u sklopu Sporazuma o stabilizaciji i pridruživanju i Centralnoevropskog ugovora o slobodnoj trgovini (CEFTA).
Prva zajednička ak vnost na nivou države vezana za spoljnotrgovinsku poli ku (u odgovornos Ministarstva vanjske trgovine i ekonomskih odnosa) je započeta 1998. godine kada su usvojene prve BiH carinske tarife i kada su usvojeni relevantni zakoni o spoljnoj poli ci. Ovaj zakon je obezbijedio carinsku zaš tu za poljoprivredne proizvode
putem če ri ad valorem carinske stope koje iznose 0%, 5%, 10% i 15%. Nekad kasnije, kao posljedica pri saka, takse za neke poljoprivredne proizvode su dodate ad valorem pristojbama. Među m, uloga taksi je izgubljena zbog transformacije is h u fi ksne iznose kao rezultat međunarodnih pri saka (WTO - Svjetske trgovinske organizacije i Evropske unije).
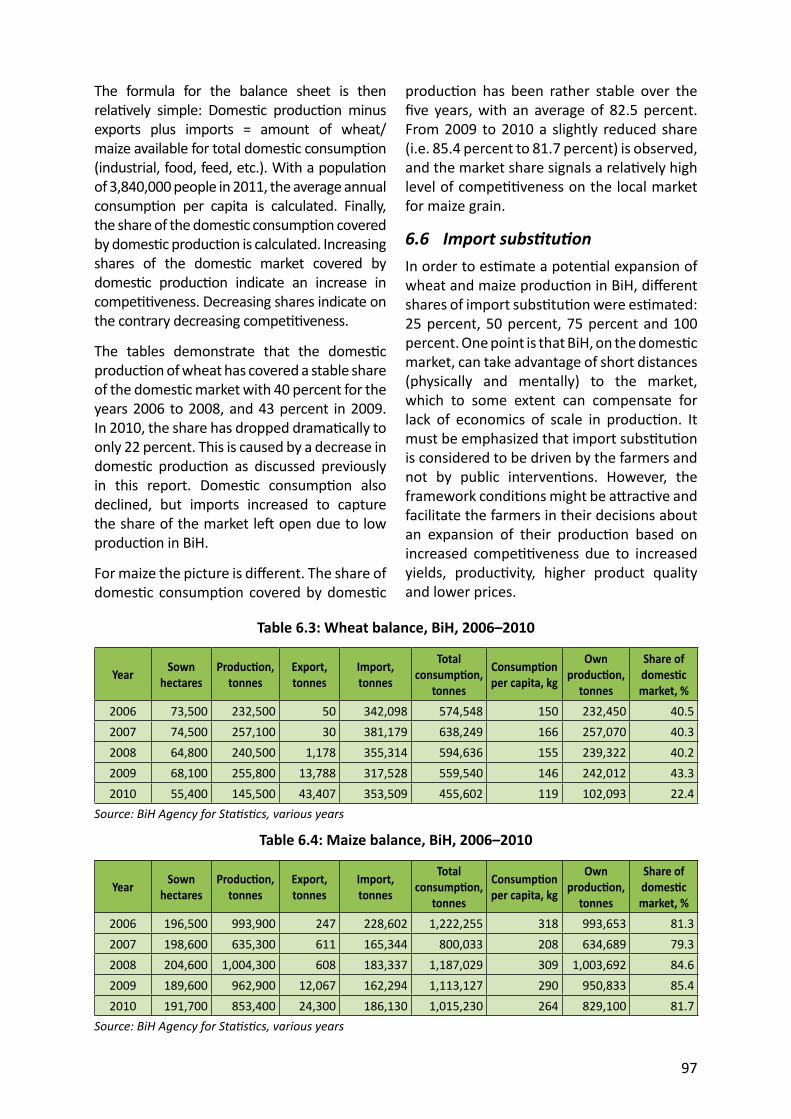
Bilans trgovine žitaricama
Tokom godina Bosna i Hercegovina nikad nije bila proizvodila dovoljno poljoprivrednih proizvoda za vlas te potrebe (sa izuzetkom šljiva). Velike količine poljoprivredno-prehrambenih proizvoda (npr. hrana, prehrambeni proizvodi, pića, primarna poljoprivredna roba i njene prerađevine) su se uvozili i još uvijek predstavljaju težak teret za trgovinsku bilansu. Tokom 2006. godine razlika između poljoprivrednog i prehrambenog uvoza i izvoza je iznosila oko 1.700 miliona KM, što je jednako 870 miliona eura.
Godine 2010. vrijednost izvoza poljoprivrednih proizvoda je dos gla 250 miliona eura dok je vrijednost uvoza poljoprivrednih proizvoda iznosila 1.485 miliona eura.
Oba proizvoda pokazuju da je došlo do smanjenja u količini, kukuruz je u 2010. dos gao tek 68% količine uvoza od prije 5 godina dok je pšenica dos gla tek 73%; među m, troškovi uvezene pšenice se nisu smanjili!
Iznosi uvoza – izvoza jasno pokazuju da BiH ne može proizves dovoljno pšenice a donekle ni dovoljno kukuruza. Kako je prosječna potrošnja pšenice po glavi stanovnika 135 kg u razvijenim zemljama, Bosna i Hercegovina će treba 623,992 tona godišnje za 4,622,163 stanovnika (procjene od jula 2011.).
Postoji nekoliko nejasnoća; prvo, nije sigurno da li svi stanovnici žive u Bosni i Hercegovini jer je vjerovatnije da većina radi u inostranstvu, iz kog razloga ne konzumiraju žitarice u svojoj zemlji. Zvanične cifre govore da se potroši 566.000 tona što bi odgovaralo broju od 4,2
miliona žitelja; drugo, Bosanci jedu više hljeba od ostalih naroda. I treće je da stručnjaci govore o značajnom „sivom“ uvozu što je možda i tačno, posebno ako pretpostavimo da su brojke domaće proizvodnje previsoke (kao što je prethodno objašnjeno).
Robne rezerve
Bosna i Hercegovina nema jasnu strategiju za rezerve žitarica. Nakon šokantne zabrane izvoza pšenice iz Srbije i Hrvatske 2008. godine, Vlada BiH vodi više računa o rezervama pšenice jer svake godina je velika potražnja za uvoz. Trenutno se vodi nekoliko rasprava o važnos strateških rezervi i dobre „pšenice“. Nažalost, BiH ne razdvaja važnost trajnih rezervi koje se mogu koris u slučajevima nepogoda i važnost komercijalnih rezervi koje se mogu koris t na tržištu.
Situacija je detaljno izanalizirana u nedavnoj studiji FAO koju je napisao A.CERNE: „Policy op ons and recommenda ons for food commodity reserve in BiH“ (Poli čke opcije i preporuke za robne rezerve hrane u BiH). Zaključak ove studije je da je svrha robnih rezervi da omogući osnovne prehrambene proizvode za stanovništvo u kriznim vremenima. Takođe, bitno je osigura robne rezerve kroz partnerstvo između javnih i privatnih sfera jer nije prihvatljivo da nacionalne robne rezerve imaju ulogu najvećeg trgovca u zemlji. I na kraju, stvaranje i održavanje robnih rezervi ne bi trebalo da u če na trenutne zalihe na tržištu da ne bi narušile funkcionisanje tržišta.
Nažalost, ono što se ustvari dešava jeste da vlada manipuliše tržišnom cijenom, a s druge strane ne obezbjeđuje dovoljno sredstava u budžetu da kupi velike količine pšenice za rezervu; en tetski budže su zapravo između 2 i 4 miliona KM godišnje. Da bi se održale rezerve od 50.000 tona, vlas bi trebale obezbijedi oko 10 miliona eura.
Bitno je spomenu i da EU ne traži da država ima robne rezerve ali to traži NATO. EU učestvuje na tržištu tako što određuje minimalnu cijenu, tj. cijenu posredovanja za pšenicu koja je zapravo 101,31 eura po toni.
Minimalna cijena u BiH je dva puta veća nego ta cijena koja će bi obavezna kada BiH pristupi EU.
Usklađenost sa EU standardima
U kontekstu pri ska da se integrišu zahtjevi i standardi EU u poljoprivredi, poli čki instrument „međusobne usaglašenos “ se sve više koris kako bi se poboljšali okolišni u caji poljoprivrednog upravljanja. Međusobno usaglašavanje u okviru Zajedničke poljoprivredne poli ke (CAP) uspostavlja okolišne i druge standarde koje poljoprivrednici moraju ispoštova kako bi primili subvencije. Sve zemlje članice EU uspostavljaju poljoprivredne standarde u vezi sa 18 EU propisa i direk va, defi nisanim Dobrim poljoprivrednim i okolišnim uslovima (GAEC) i usklađenost sa m standardima na poljoprivrednim dobrima po primitku CAP subvencija.
Kao potencijalni kandidat Bosna i Hercegovina će mora usvoji h 18 propisa i direk va EU. Sljedeći paragrafi se bave propisima i direk vama koje će bi od važnos za biljnu proizvodnju.
BiH pokušava da harmonizuje fi tosanitarne usluge i poli ku sa EU zakonima, međunarodnim obavezama i standardima u tom području; to uključuje zdravlje biljaka, proizvoda za zaš tu biljaka i sjemena i biljnog materijala. Poseban naglasak je na izradi nacrta, usvajanju i sprovođenju pravila usklađenih sa EU standardima, jačanjem inspekcijskih usluga i kapaciteta laboratorija, podizanje svijes rukovodilaca o radu poboljšanog sistema. Čak je i EU istakla u zadnjem izvještaju da je pos gnut određeni napredak u fi tosanitarnom sektoru poput usvajanja zakona vezanih za osnivanje fi tosanitarnog registra i biljnih pasoša, mjera za kontrolu štetnih orgnizama u biljkama, biljnim proizvodima u određenim ustanovama a usvojeni su i pravilnici vezani za fi to-farmaceutske proizvode.
Da sažmemo, BiH vlas imaju nekoliko zadataka pred sobom kako bi obimnu legisla vu prilagodili standardima EU, dok se
odobreni zakoni nakon toga trebaju proves . Trenutni status ne predstavlja veliku prepreku bosanskim proizvođačima žitarica jer izvoz žitarica nije značajan.
Inves cije
Analiza prethodnih i planiranih inves cija u sektor je zasnovana na studijama slučaja i upitniku kako i na intervjuu sa zainteresovanim stranama i izjavama eksperata.
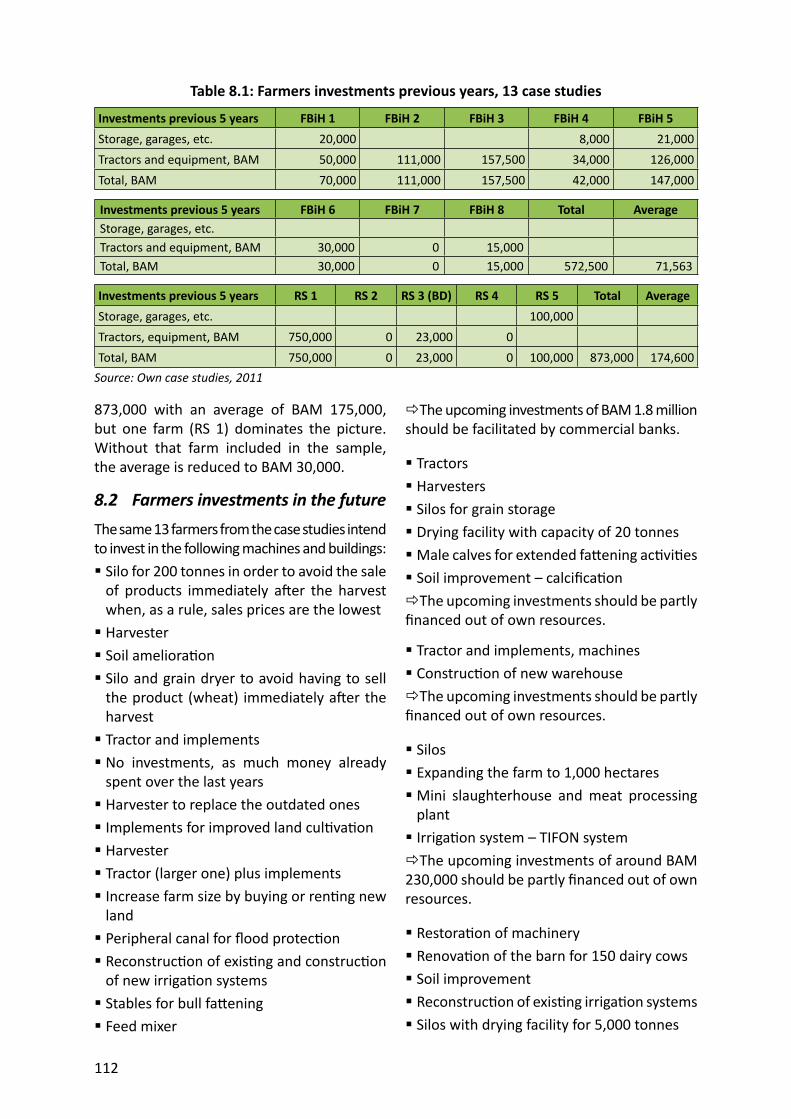
Osam studija slučaja na farmama u FBiH je inves ralo u granici od BAM 575,000 tokom zadnjih pet godina. Prosječna inves cija je BAM 71,500 po farmi. U RS, pet studija slučaja je predstavilo ukupnu inves ciju od BAM 873,000 sa prosjekom od BAM 175,000, ali jedna farma je računala i glavnu dobit. Bez toga, te farme, prosjek se smanjuje na BAM 30,000.
Farme bez silosa na farmi, planiraju inves ciju u silos u cilju izbjegavanja prodaje žitarica po smanjenoj cijeni,tj. prodaje na njivi odmah nakon žetve. Važnost povećanja skladišnih kapaciteta na farmama je potvrđeno tokom posjeta farmama kao i tokom posjete sajmu INTERAGRO Bijeljina u Septembru 2011. Prosječna inves cija u studijama slučaja je procijenjena na BAM 100,000 po farmi uključujući inves cije u skladišta, kombajne, traktore i ostalu opremu na farmi.
Upitnik na farmi je potvrdio inves cione planove. U prosjeku anke rani farmeri će uloži BAM 32,600 u dolazećem periodu u mašineriju za proizvodnju pšenice i kukuruza kao prioritet. Ovo potvrđuje potrebu za obnovom tehneloškog nivoa na farmama u BiH.
Inves cije u primarnu proizvodnju će bi zahtjevne u rasponu od BAM 40 to 50 miliona. Posebno manji tek uspostavljeni mlinovi sa kapacitetom do 10,000 tona godišnje nisu uložili u dovoljne skladišne kapacitete, uključujući silose, i oni planiraju da povećaju skladišne kapacitete. Proizvođači će takođe ulaga u linije za pakovanje brašna i to u pakete od 5, 10 i 25 kg. Još jedno pitanje koje brine mllinare je ulaganju u laboratorijsku opremu.
POTREBA ZA OBUKOM
Nivo znanja kod proizvođača, naročito onih malih, je rela vno nizak. Proizvodnja na malim poljoprivrednim dobrima se zasniva na tradicionalnoj i ektenzivnoj proizvodnji, uz minimalne troškove i inves cije. Interes ovih proizvođača da steknu novo znanje je minimalna i tek nekolicina njih je u redovnom kontaktu sa dodatnom uslugom; njihov glavni izvor informacija su mediji, susjedi i veterinari koji njihovoj stoci pružaju usluge vještačke oplodnje i zdravstvene njege.
Znanje proizvođača na srednjim i velikim poljoprivrednim dobrima (i među nekolicinom velikih korpora vnih poljoprivrednih dobara) je na znatno većem nivou, i njihova proizvodnja je polu-intenzivna ili intenzivna. Ova poljoprivredna dobra su više uložila u unapređenje i kvalitet proizvodnje.
Analiza ratarskog sektora u Bosni i Hercegovini pokazuje da Bosna i Hercegovina ima niz prilika, na primjer povećanje ukupnih prinosa pšenice i kukuruza takođe povećanjem područja i prinosa po hektaru, poboljšanjem kvaliteta kako bi bila u skladu sa uslovima prerađivačke industrije i kako bi se zadovoljili kriteriji EU i sve jača konkurencija u okviru liberalnijeg tržišta. Seminari prilagođeni ovim potrebama bi pomogli da se otklone ovi nedostaci. S obzirom da se svaka zainteresovana strana u ratarskom sektoru mora suoči sa različi m uslovima, potrebe za obukom se moraju grupisa na sljedeći način: Potrebe za obukom za proizvođače, tj. poljoprivrednike, Potrebe za obukom za prerađivače; odnosno mlinove za brašno i stočnu hranu, industriju proizvodnje hljeba, kolača i piva Potrebe za obukom za javnu upravu .
SWOT analiza
Ova SWOT analiza se zasniva na činjeničnoj procjeni poljoprivrednog sektora, pri čemu je kao krajnji cilj u obzir uzeta priprema ovog sektora za učešće na tržištu EU. U ovoj studiji se takođe analiziraju radnje koje bi
u budućnos trebalo poduze kako bi se proizvodnja žitarica učinila profi tabilnijom, te koje su to inves cije za koje je neophodno izdvoji fi nansijsku podršku, naročito u smislu nošenja sa postojećim pri skom konkurencije.
Dugoročno gledajući, izdvajanja EU po gospodarstvu bi mogla bi na istom nivou za sve zemlje članice; trenutno je iznos potpore za pšenicu i kukuruz po hektaru 2,055 HRK (oko 275 EUR) u Hrvatskoj (koja još nije članica EU), ali su poli čari već počeli da obavještavaju poljoprivrednike da će iznos ove premije po hektaru poras na 380 EUR, što još uvijek nije potvrđeno iz EU; nadalje, zemlje poput Poljske, ali isto tako i Rumunija i Bugarska, koje imaju ratarske usjeve veće od 1,000 ha postavit će određene standarde u odnosu na koje će se vrši nadmetanje. U budućnos jedina razlika u ponudi za Bosnu i Hercegovinu može bi ta da će poras troškovi prevoza za žitarice koje se uvoze.
Uprkos činjenici da putevi i željeznice postaju kvalitetniji, glavna prednost lokalnih proizvođača žitarica je da mogu snabdje svoja udaljena okolna područja. Ako se ovo ne pokaže kao ispravna alterna va onda proizvodnja za upotrebu na gazdinstvu, naročito za ishranu živo nja, predstavlja posljednju mogućnost.
Nadalje, poljoprivrednici vjeruju da lokalni usjevi ne zaostaju za drugim u smislu traženog kvaliteta, te da lokalna prerađivačka industrija nema razloga da ih ne kupuje, naročito zbog toga što je količina koju nude domaći proizvođači rela vno mala. S druge strane, iz prerađivačke industrije je više puta naglašeno da domaći usjevi nemaju traženi kvalitet i jednostavno ne mogu bi korišteni kao sirovinski material za dalju preradu.
Druga tačka je bila vezana za ulogu države u jačanju i davanju potpore ovom sektoru. Učesnici debate smatraju da je ovo osjetljiv sektor (potreba za usjevima i npr. paradajz nije sav is ), te da bi se podrška države trebala prilagodi sektoru. Ta podrška mora bi adekvatna kako bi se osigurao dovoljan
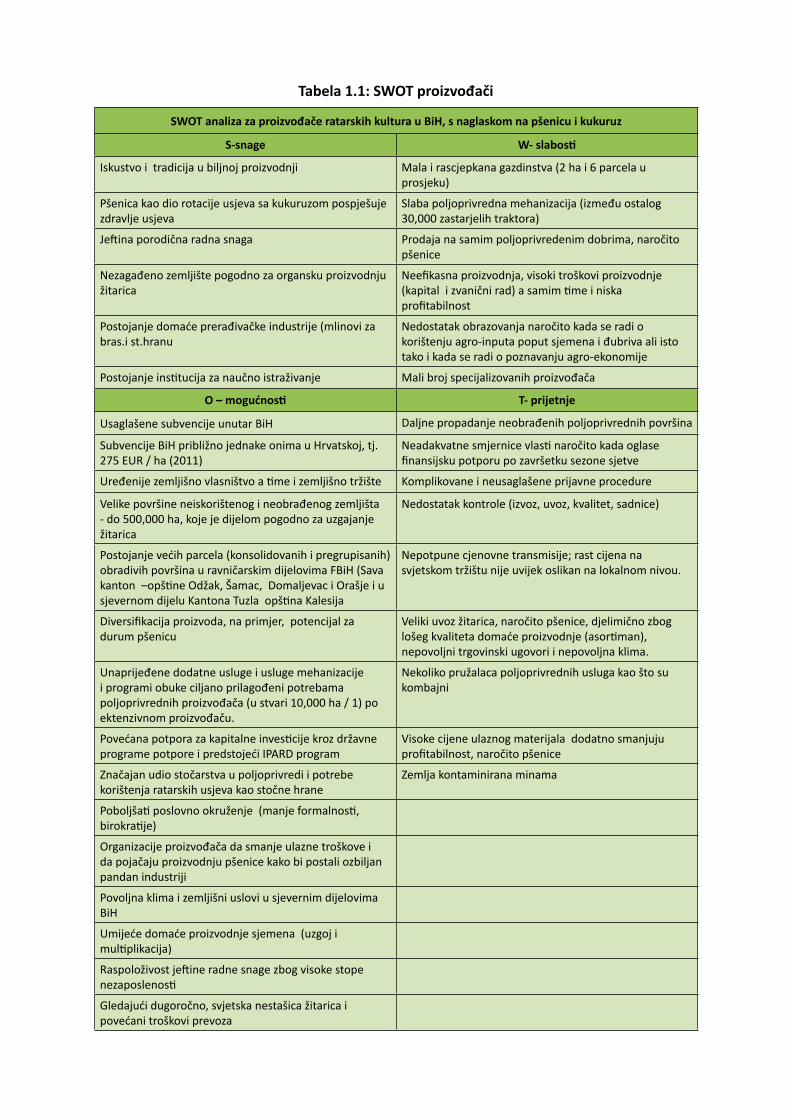
Tabela 1.1: SWOT proizvođači
SWOT analiza za proizvođače ratarskih kultura u BiH, s naglaskom na pšenicu i kukuruz
S-snage W- slabos
Iskustvo i tradicija u biljnoj proizvodnji Mala i rascjepkana gazdinstva (2 ha i 6 parcela u prosjeku)
Pšenica kao dio rotacije usjeva sa kukuruzom pospješuje zdravlje usjeva
Postojanje većih parcela (konsolidovanih i pregrupisanih) obradivih površina u ravničarskim dijelovima FBiH (Sava kanton –opš ne Odžak, Šamac, Domaljevac i Orašje i u sjevernom dijelu Kantona Tuzla opš na Kalesija
Nepotpune cjenovne transmisije; rast cijena na svjetskom tržištu nije uvijek oslikan na lokalnom nivou.
Diversifi kacija proizvoda, na primjer, potencijal za durum pšenicu
Veliki uvoz žitarica, naročito pšenice, djelimično zbog lošeg kvaliteta domaće proizvodnje (asor man), nepovoljni trgovinski ugovori i nepovoljna klima.
Unaprijeđene dodatne usluge i usluge mehanizacije i programi obuke ciljano prilagođeni potrebama poljoprivrednih proizvođača (u stvari 10,000 ha / 1) po ektenzivnom proizvođaču.
Nekoliko pružalaca poljoprivrednih usluga kao što su kombajni
Povećana potpora za kapitalne inves cije kroz državne programe potpore i predstojeći IPARD program
Visoke cijene ulaznog materijala dodatno smanjuju profi tabilnost, naročito pšenice
Značajan udio stočarstva u poljoprivredi i potrebe korištenja ratarskih usjeva kao stočne hrane
Organizacije proizvođača da smanje ulazne troškove i da pojačaju proizvodnju pšenice kako bi postali ozbiljan pandan industriji
Povoljna klima i zemljišni uslovi u sjevernim dijelovima BiH
Umijeće domaće proizvodnje sjemena (uzgoj i mul plikacija)
Raspoloživost je ine radne snage zbog visoke stope nezaposlenos
Gledajući dugoročno, svjetska nestašica žitarica i povećani troškovi prevoza
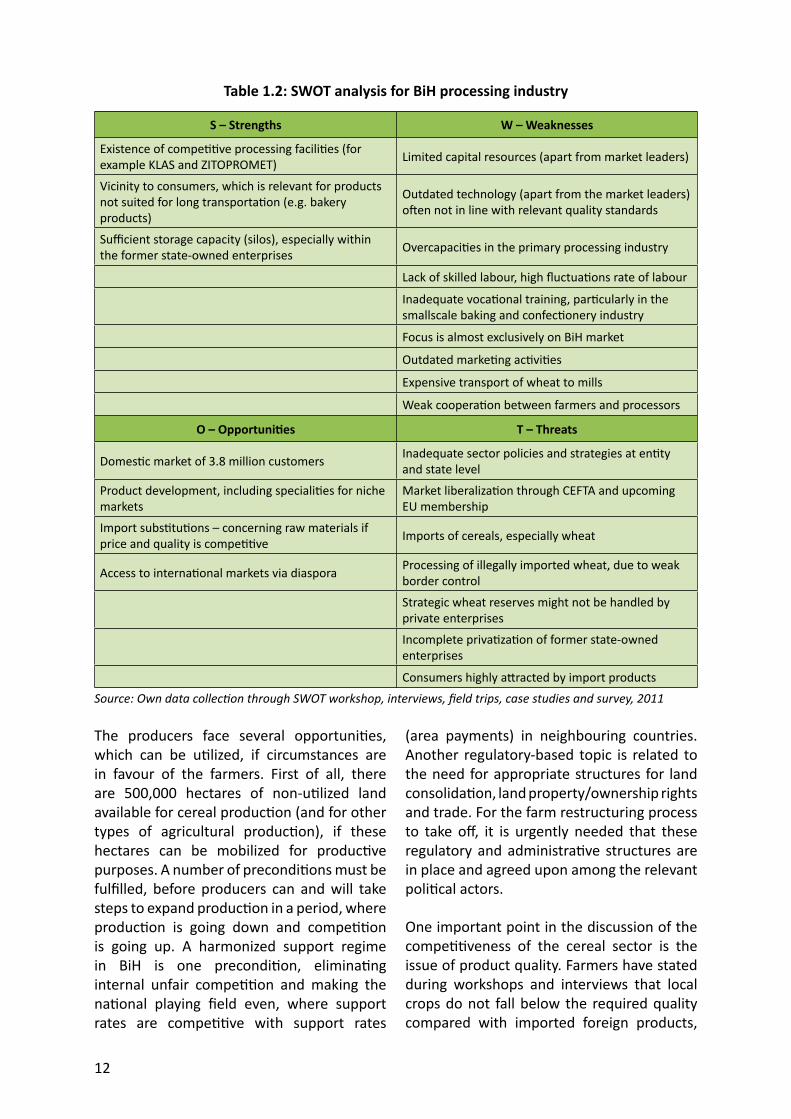
SWOT analiza za prerađivačku industriju
S – Snage W – Slabos
Postojanje konkurentnih objekata za preradu (npr. KLAS i ZITOPROMET) Ograničeni izvori kapitala (izuzev lidera na tržištu)
Blizina potrošačima, veoma bitno za proizvode koji ne trpe dug transport (npr. pekarski proizvodi)
Zastarjela tehnologija (izuzev tržišnih lidera) koja nije u skladu sa relevantnim standardima kvaliteta
Dovoljni skladišni kapacite (silosi), naročito u okviru bivših državnih preduzeća
Višak kapacitata u prim. prerađivačkoj industriji, 5 mlinova poput KLAS-ovih mogu zadovolji potr. u praksi ima oko 60 mlinova za brašno plus 20 čis h mlinova za stočnu hranu
Nedostatak stručne radne snage plus visoke fl uktuacije
Neodgovarajuća stručna obuka (pekari, mlinari)
Naglasak gotovo isključivo na BiH tržištu
Zastarjele marke nške ak vnos
Skup transport pšenice do mlinova
Nedostatak saradnje između poljoprivrednika i prerađivača
O – Mogućnos T – Prijetnje
Domaće tržište od 4.6. miliona potrošača Neadakvatne poli ke i strategije Ministartva poljoprivrede
Razvoj proizvoda uključujući posebnos za usko-spec. tržišta
Liberalizacija tržišta kroz CEFTA-u, WTO (u toku) i dolazeće članstvo u EU
Uvozne sups tucije - vezano za sirovine ukoliko su cijena i kvaltet konkurentni Veliki uvoz žitarica, naročito pšenice
Pristup međunarodnim tržiš ma preko dijaspore Prerada nezakonito unvezene pšenice zbog slabe kontrole granica
Privatna preduzeća možda ne mogu upravlja strateškim rez. pšenice
Nepotpuna priva zacija bivših državnih preduzeća
Potrošače značajno privlače uvezeni proizvodi
Nedostatak akreditovanih ins tucija za kvalitet kontrole
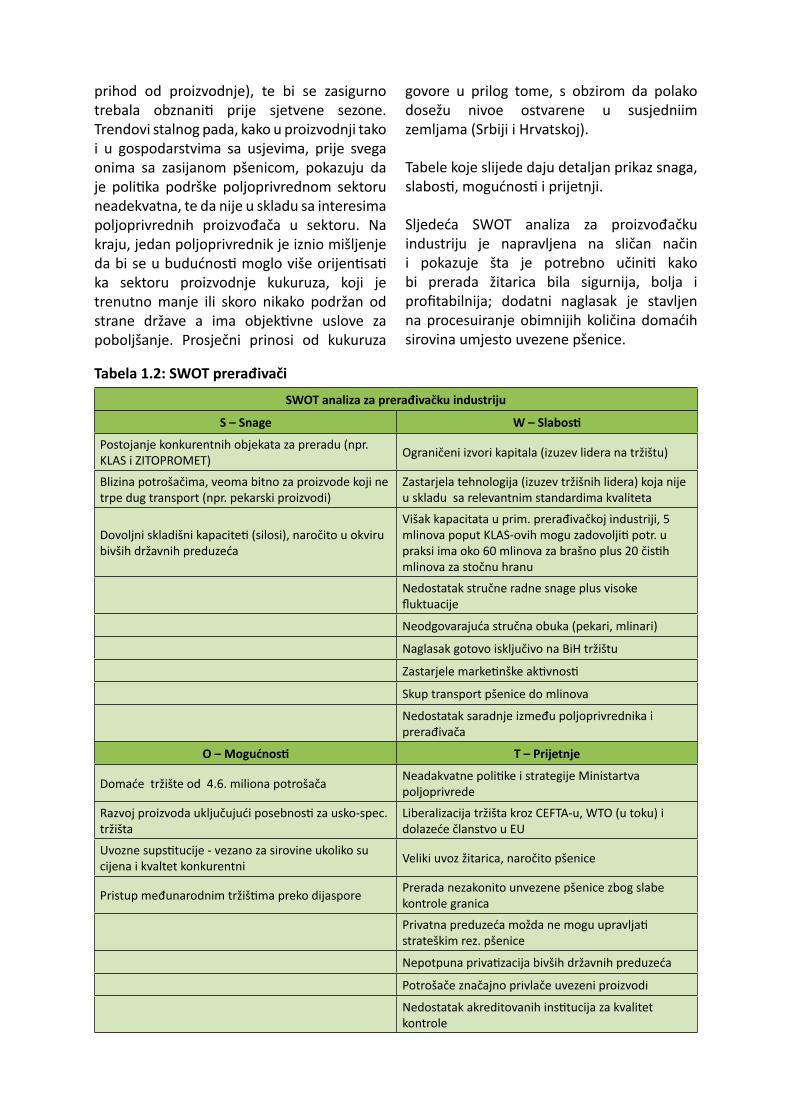
Tabela 1.2: SWOT prerađivači
prihod od proizvodnje), te bi se zasigurno trebala obznani prije sjetvene sezone. Trendovi stalnog pada, kako u proizvodnji tako i u gospodarstvima sa usjevima, prije svega onima sa zasijanom pšenicom, pokazuju da je poli ka podrške poljoprivrednom sektoru neadekvatna, te da nije u skladu sa interesima poljoprivrednih proizvođača u sektoru. Na kraju, jedan poljoprivrednik je iznio mišljenje da bi se u budućnos moglo više orijen sa ka sektoru proizvodnje kukuruza, koji je trenutno manje ili skoro nikako podržan od strane države a ima objek vne uslove za poboljšanje. Prosječni prinosi od kukuruza
govore u prilog tome, s obzirom da polako dosežu nivoe ostvarene u susjedniim zemljama (Srbiji i Hrvatskoj).
Tabele koje slijede daju detaljan prikaz snaga, slabos , mogućnos i prijetnji.
Sljedeća SWOT analiza za proizvođačku industriju je napravljena na sličan način i pokazuje šta je potrebno učini kako bi prerada žitarica bila sigurnija, bolja i profi tabilnija; dodatni naglasak je stavljen na procesuiranje obimnijih količina domaćih sirovina umjesto uvezene pšenice.
Izvor: Samostalno prikupljeni podaci u sklopu SWOT radionica, razgovora, terenskih posjeta analiza slučaja i ankete, 2011.god.
Prikazane SWOT analize su detaljno obrazložene u sklopu razgovora sa ključnim učesnicima u cilju prepoznavanja važnih izazova i potreba u lancima nabavke koji su specifični za ovaj sektor. SWOT analize mogu sada poslužiti kao ulazne informacije za Ministarstvo vanjske trgovine i ekonomskih odnosa pri izradi programa.
Na osnovu goreprikazanih SWOT tabela preporuke za strategije mogu biti da proizvodnja žitarica odgovara samo za poljoprivredna dobra sa više od 20 ha usjeva u ravnicama sa povoljnom klimom. Danas BiH ima samo nekolicinu poljoprivrednih dobara ove veličine a za proširenje poljoprivrednih dobara neophodno je poboljšanje zemljišnog tržišta. Poljoprivrednicima se mora omogućiti pristup ulaznim materijalima po povoljnim cijenama, što djelimično zavisi od poreza koji su veći nego u susjednoj Srbiji. Takođe se moraju poboljšati dodatne usluge. Što se tiče investicija neophodna je moderna poljoprivredna tehnologija i povoljnije cijene za domaće proizvođače što je jedino moguće postići ako poljoprivrednici imaju sušare i silose tako da ne moraju vršiti prodaju direktno sa polja nakon žetve.
Preporuka intervencije
Preporuke koje slijede su date u cilju postizanje veće profitabilnosti u proizvodnji pšenice i kukuruza u Bosni i Hercegovnini. Za budući razvoj proizvodnog sektora je bitno da se osiguraju strukturalne promjene, naročito u smislu uspostavljanja specijalizovanih ratarskih poljoprivrednih dobara, kroz programe potpore koji će biti usmjereni na ekonomski isplative poljoprivredne strukture uključujući uspostavljanje grupa proizvođača.
Ukupna efikasnost proizvodnje i konkurentnosti se mora povećati upotrebom sertificiranog sjemena i uvođenjem modernih proizvodnih tehnika i tehnologija. Takođe se mora značajno povećati cjelokupna usaglašenost proizvodnje i prerade sa
državnim i standardima EU vezano za sigurnost hrane i zaštitu okoline.
Naročito je u proizvodnom sektoru potrebna tehnička pomoć i obuka kako bi se podigao nivo razumijevanja i kapaciteta vezano za moderne proizvodne tehnike i tehnologije i ispunjenje domaćih i standarda EU.
Uzimajući u obzir cjelokupnu situaciju u sektoru, buduće intervencije trebaju biti orijentisane na:
Vlada Bosne i Hercegovine, En te i Brčko Distrikt
Usaglasi sve subvencije za proizvođače i prerađivače na nivou RS, FBiH i Distrikta Brčko Uves minimalnu cijenu u skladu sa EU interventnom cijenom koja je u stvari 101,31 EUR / t Da poljoprivrednicima potporu samo u vidu premije po hektaru (plaćanja), što bi se onda brzo moglo podijeli na pšenicu i kukuruz kako bi se promovisala pšenica; nakon pristupa radiće se o istoj premiji; nadalje, premije po hektaru bi se trebale najavi prije nego se usjevi posiju kako bi se proizvođačima dala neka sigurnost u smislu planiranja; sada zapravo poljoprivrednici moraju sami da odluče a ne znaju koliki će bi iznos potpore, što nije dobar znak za planiranje. Premije po hektaru će takođe doći do proizvođača koji ne prodaju registrovanim trgovcima ili prerađivačima kao što je sada slučaj; zapravo oko 70% proizvedenih žitarica se ne subvencioniraju jer se koriste na gazdinstvu Unaprijedi poljoprivredne strukture omogućujući zemljišnom tržištu (ubrzavajući zemljišnu konsolidaciju boljim zemljišnim knjigama i katastrima) da bude funkcionalno, te kao takvo pomogne komercijalnim poljoprivrednicima da brže napreduju i razmisle o potpori za iznajmljivanje zemljišta, uključujući premije za iznajmljenu zemlju Iznajmi svu državnu zemlju koja se ne koris u sklopu javne prodaje/ otvorenog tenderskog nadmetanja; onaj koji ponudi
najveći iznos, dobiće zemlju uz potpisivanje ugovora o iznajmljivanju Unaprijedi dodatne usluge i s m u vezi izdvoji više sredstava u budžetu Omogući usluge mehanizacije uspostavljanjem grupe proizvođača (zakonska legisla va i ciljani program potpore u skladu sa IPARD-om) Oživi domaće zavode za istraživanje i razvoj i centre za uzgoj žita Podstaknu javno-privatno partnerstvo da bolje poveže postojeće tehnologije, znanje i iskustvo (tzv. know-how) državnih ins tuta za istraživanje sa tržištem Upisa više sor sjemena u državnu listu kako bi se omogućio veći izbor, a istovremeno se zadovoljila potražnja i potrebe prerađivača Pomoći oko specijalizovanih usluga poput poslovnog plana i proizvodnog razvoja, arhitektonskih planova za objekte, so ware, obuka, Ažurira pravni okvir i poboljša provedbu zakona Redovno izvještava o tržišnim cijenama (Tržišni informacioni sistem dostupan poljoprivrednicima) jer što je tržište transparentnije to će bi bolje za poljoprivrednike Unaprijedi i uspostavi dodatne stručne škole za poljoprivredu i takođe bolju obuku za uposlenike prerađivačke industrije Unaprijedi ruralnu infrastrukturu poput putne i komunikacione (čak i ako to nije poseban preduslov za ratarske usjeve) Pojednostavi postupak prijave za kredit
Proizvođači
Poveća ukupnu konkurentnost, uvodeći nove sorte sjemena, tehnike proizvodnje i žetve Unaprijedi opremu i mehanizaciju za rad sa žitaricama na gazdinstvu (kombajni, sijačice, štrcaljke, plugovi, prikolice …) ali takođe i opremu za čišćenje zemljišta (na privremeno napuštenim obradivim površinama)
Izgradi i namjes objekte za skladištenje (silosi, uključujući sušilice), spremišta za mašine i teretne mostove, promovišući kad god je moguće kolek vno vlasništvo i upravljanje, uključujući elemente sistema priznanica za uskladištene žitarice Poveća veličinu poljoprivrednog dobra
Prerađivači
Razmisli o ugovornoj proizvodnji tako da poljoprivrednici unaprijed znaju kakav će se kvalitet traži u industriji Unaprijedi labaratorijske usluge unutar fi rmi ali takođe i u okviru BiH
Glavni nalazi za IPARD
Ovdje bi trebalo napomenu da bi obuka mogla bi sponzorisana u sklopu IPARD-a, ali za potvrdu te mogućnos potrebno je izvrši detaljnije dodatno istraživanje.
Imajući u vidi budući IPARD, preduslov će za podnositelja zahtjeva bi da je registrovani poljoprivrednik; u stvari postoji oko 100.000 poljoprivrednika upisanih u registar. Pretpostavka je da će IPARD privući više podnosilaca zahtjeva, te bi u skladu s m moglo bi 150.000 registrovanih poljoprivrednika.
Da bi se dobilo sufi nansiranje u iznosu od 50%, inves cija mora bi opravdana poslovnim planom (inves cioni plan), a korisnik mora unaprijed fi nansira inves ciju.
Procjenjuje se da je BDP Bosne i Herzegovine 6.600 USD / po stanovniku 2010. godine; to odgovara iznosu od 5.080 EUR. Ako pretpostavimo da je dobit po hektaru pšenice 150 EUR godišnje, poljoprivrednik bi trebao da zasije 33 ha pšenice da bi se uklopio u BDP; ako pretpostavimo da je profi t po hektaru kukuruza 450 EUR godišnje, poljoprivrednik bi trebao obradi 11 ha.
Ukupna površina oranica je 1.009.474 ha i ako pretpostavimo da će bi poljoprivredna dobra sa samo 15 ha, BiH bi imala 67.000 poljoprivrednih dobara; pretpostavimo da danas BiH ima manje od polovine pomenutog broja i ako još pretpostavimo da neće svaki
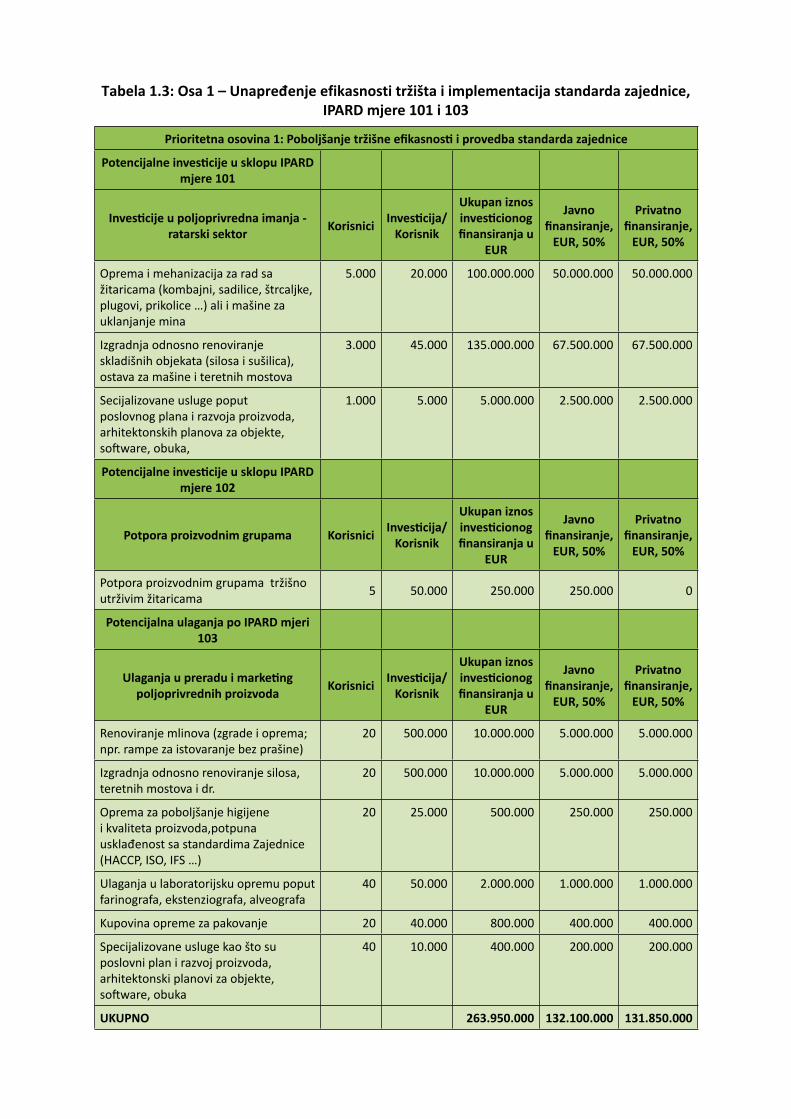
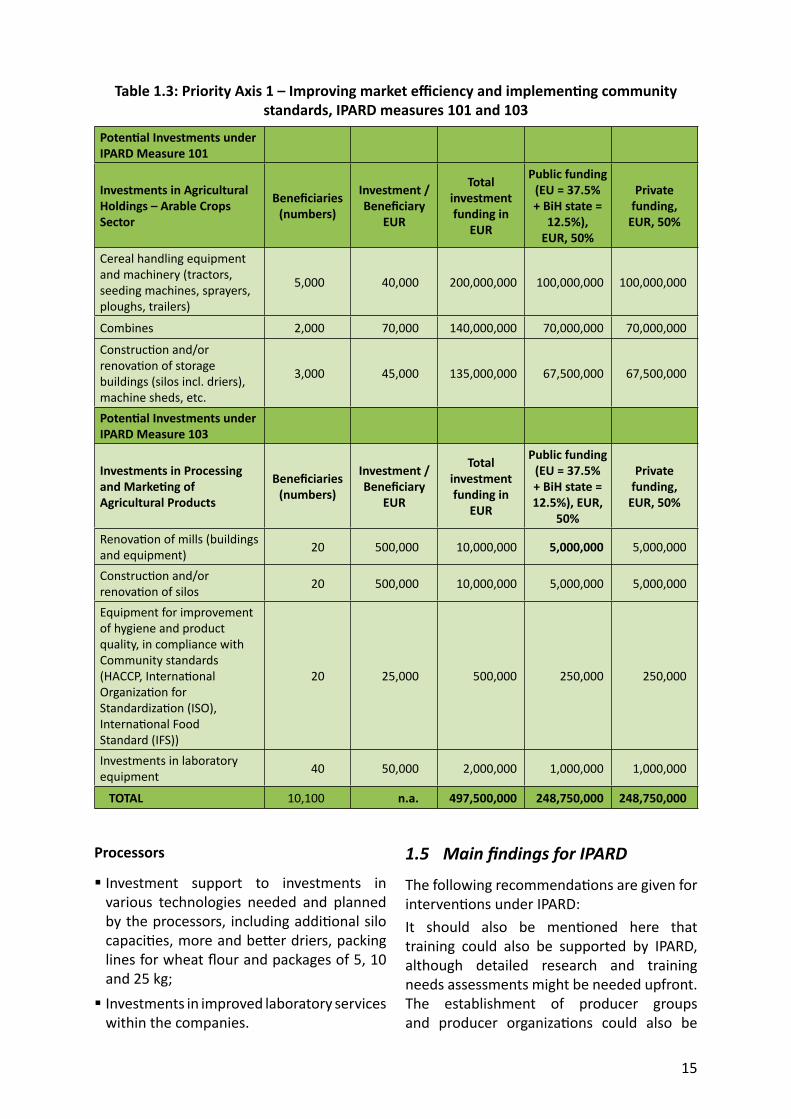
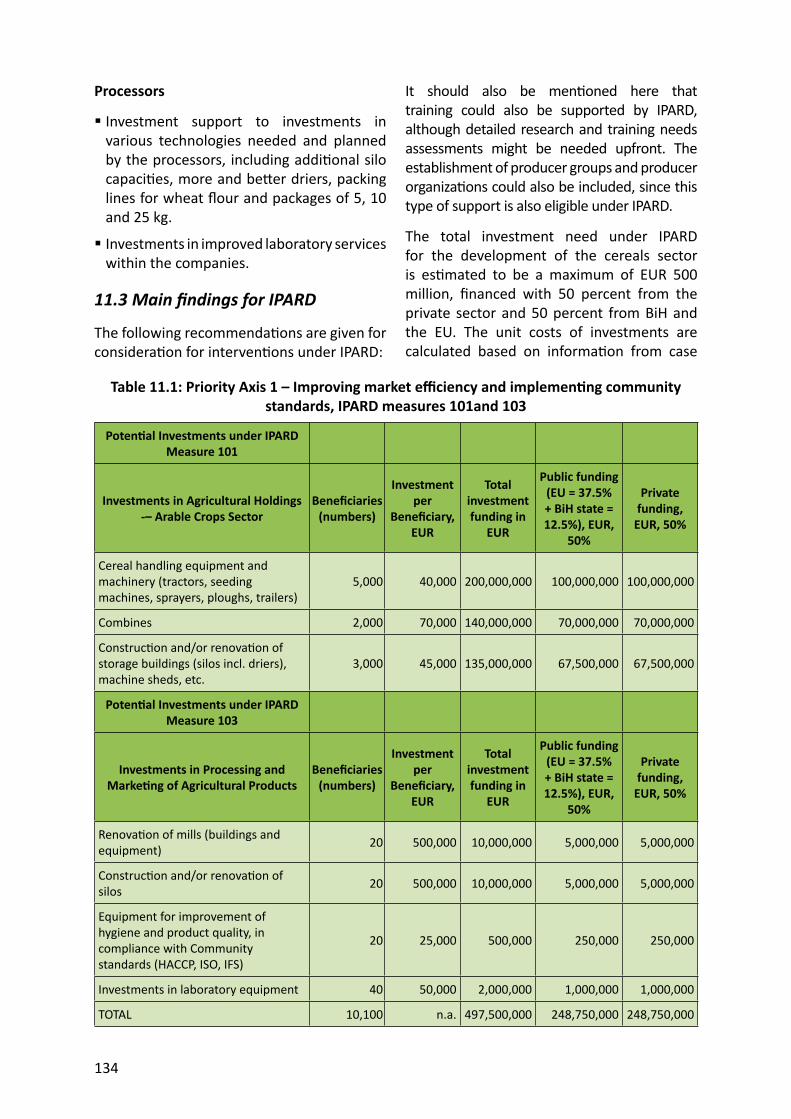
Tabela 1.3: Osa 1 – Unapređenje efikasnosti tržišta i implementacija standarda zajednice, IPARD mjere 101 i 103
Prioritetna osovina 1: Poboljšanje tržišne efi kasnos i provedba standarda zajednice
Ulaganja u preradu i marke ng poljoprivrednih proizvoda Korisnici Inves cija/
Korisnik
Ukupan iznos inves cionog fi nansiranja u
EUR
Javno fi nansiranje,
EUR, 50%
Privatno fi nansiranje,
EUR, 50%
Renoviranje mlinova (zgrade i oprema; npr. rampe za istovaranje bez prašine)
20 500.000 10.000.000 5.000.000 5.000.000
Izgradnja odnosno renoviranje silosa, teretnih mostova i dr.
20 500.000 10.000.000 5.000.000 5.000.000
Oprema za poboljšanje higijene i kvaliteta proizvoda,potpuna usklađenost sa standardima Zajednice (HACCP, ISO, IFS …)
20 25.000 500.000 250.000 250.000
Ulaganja u laboratorijsku opremu poput farinografa, ekstenziografa, alveografa
40 50.000 2.000.000 1.000.000 1.000.000
Kupovina opreme za pakovanje 20 40.000 800.000 400.000 400.000
Specijalizovane usluge kao što su poslovni plan i razvoj proizvoda, arhitektonski planovi za objekte, so ware, obuka
40 10.000 400.000 200.000 200.000
UKUPNO 263.950.000 132.100.000 131.850.000
poljoprivrednik podnije zahtjev za potporu, autor izračunava da će prema postojećoj strukturi bi do 20.000 potencijalnih podnosilaca zahtjeva za dolazeću potporu u sklopu IPARD-a.
Potencijalna ciljana grupa: 20.000 Prosječni iznos inves cionog projekta : 10.000 EUR Inves cijski budžet: 200 miliona EUR (50% od države BiH: 100 miliona EUR!)
Predloženi okviri projekata za proizvođače Maksimalni i minimalni iznos po dozvoljenom inves cionom projektu: Minimum 5.000 EURMaksimum 50.000 EUR
Predloženi okviri projekata za prerađivače Maksimalni i minimalni iznos po dozvoljenom inves cionom projektu: Minimum 10.000 EURMaksimum 500.000 EUR
i
Table of Contents
ABBREVIATIONS AND ACRONYMS v
INTRODUCTION vii
1. EXECUTIVE SUMMARY 1
1.1 O 11.2 M 1
1.2.1 Desk research and sta s cs 11.2.2 Surveys 11.2.3 Case studies 11.2.4 Consulta ons with key stakeholders 21.2.5 Workshops 21.2.6 Field visits to selected sites where measures will impact strongly 3
1.3 G 31.3.1 Producers of cereals 31.3.2 Processing industry 51.3.3 Current state and en ty/district policies 71.3.4 Trade policy 71.3.5 Compliance with EU standards 91.3.6 Investments 91.3.7 Training needs 101.3.8 Strengths, Weaknesses, Opportuni es and Threats (SWOT) analysis 10
1.4 R 131.5 M IPARD 15
2. BACKGROUND AND CONTEXT FOR THE SECTOR ANALYSES IN BIH 17
2.1 G B H 172.2 C 18
2.2.1 Prepara on for EU accession 182.2.2 Sector context 192.2.3 Objec ves of the report 19
2.3 METHODOLOGY 202.3.1 Desk research and sta s cs 202.3.2 Surveys 202.3.3 Case studies 212.3.4 Consulta ons with key stakeholders 212.3.5 Workshops 212.3.6 Other ac vi es implemented 22
2.4 K B H 222.4.1 General economic indicators for BiH 222.4.2 Agricultural indicators 23
2.5 K 27
3. CEREALS PRODUCTION IN BIH 29
3.1 T 293.2 V 35
ii
3.3 D 363.4 A 38
3.4.1 Farm survey among cereals producers 383.4.2 Case studies 42
3.5 A 463.5.1 Seed 473.5.2 Fer lizers and agrochemicals 49
3.6 F 503.7 O - 523.8 P 523.9 T B H EU CEFTA
(C E F T A ) 563.9.1 CEFTA 563.9.2 EU comparison 623.9.3 Synthesis of CEFTA and EU comparison 63
3.10 S 63
4. THE PROCESSING INDUSTRY 67
4.1 P 674.1.1 Capaci es and actual performance 67
4.2 B - 704.3 Q 724.4 S 73
5. GOVERNMENT POLICY FOR THE SECTOR 75
5.1 O 755.1.1 Ministry of Foreign Trade and Economic Rela ons 755.1.2 The Plant Protec on Agency 755.1.3 Food Safety Agency 775.1.4 En es Ministries of Agriculture and the Department in Brčko District 79
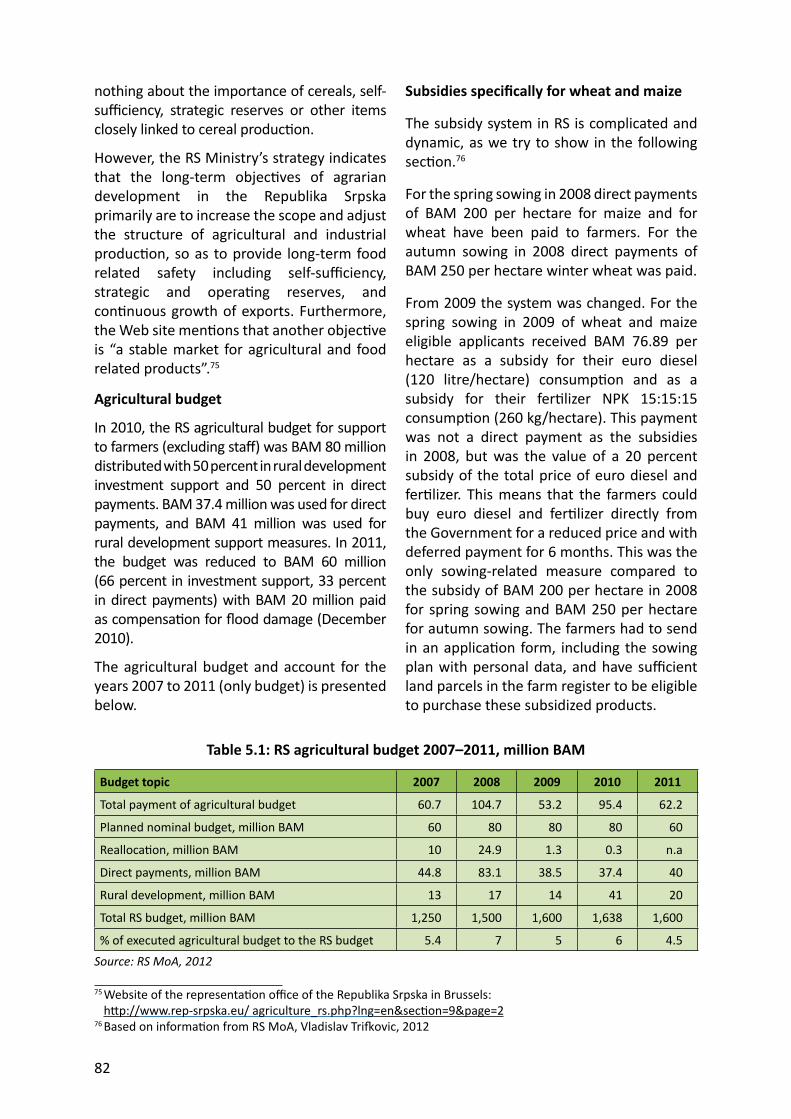
5.2 A 805.2.1 Federa on of BiH 805.2.2 Republika Srpska 815.2.3 Brčko District 83
5.3 T (VAT) 845.4 S 845.5 L 855.6 C 855.7 C L A I P 875.8 S 89
6. MARKET AND TRADE 91
6.1 W 916.1.1 Wheat supply chain: From farmers to mills and secondary processing 91
6.2 M 926.2.1 Maize supply chain: From farmers to breweries 92
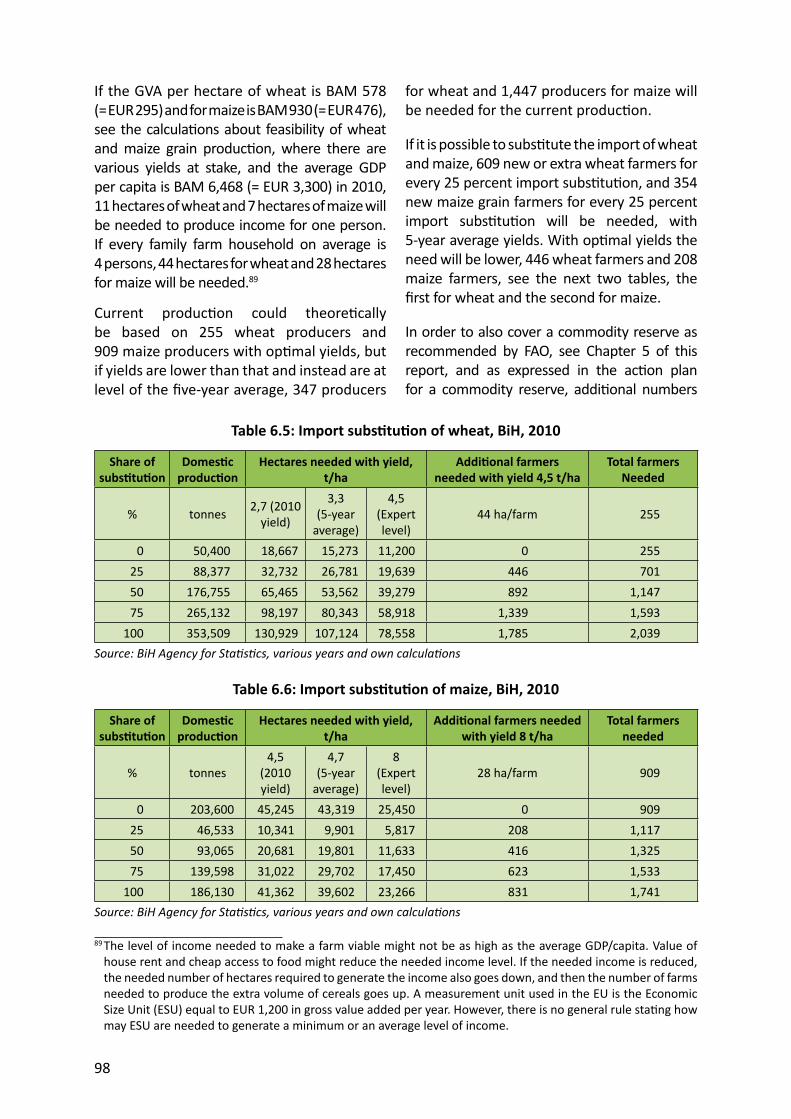
6.3 T 926.4 T 936.5 B 966.6 I 97
iii
6.7 S 996.8 T 1006.9 S 102
7. LEVEL OF ATTAINMENT OF RELEVANT EU STANDARDS 105
7.1 P 1057.2 R 1077.3 C EU 1087.4 S 109
8. PAST TRENDS AND FUTURE DEVELOPMENTS IN TERMS OF INVESTMENT 111
8.1 P 1118.2 F 1128.3 P ’ 1148.4 S 114
9. IDENTIFYING POTENTIAL AND NEEDS IN THE SECTOR 117
9.1 SWOT 117
10. IDENTIFICATION OF TRAINING NEEDS IN THE SECTOR 123
10.1 T 12310.2 T ’ 12310.3 T 123
11. OUTCOME: CONCLUSIONS AND RECOMMENDATIONS 125
11.1 G 12511.1.1 Producers of cereals 12511.1.2 Processing industry 12711.1.3 Current state and en ty/district policies 12911.1.4 Trade policy 12911.1.5 Compliance with EU standards 13111.1.6 Investments 13111.1.7 Training needs 132
11.2 R 13211.3 M IPARD 134
ANNEX 1: LITERATURE AND WEBSITES CONSULTED 137
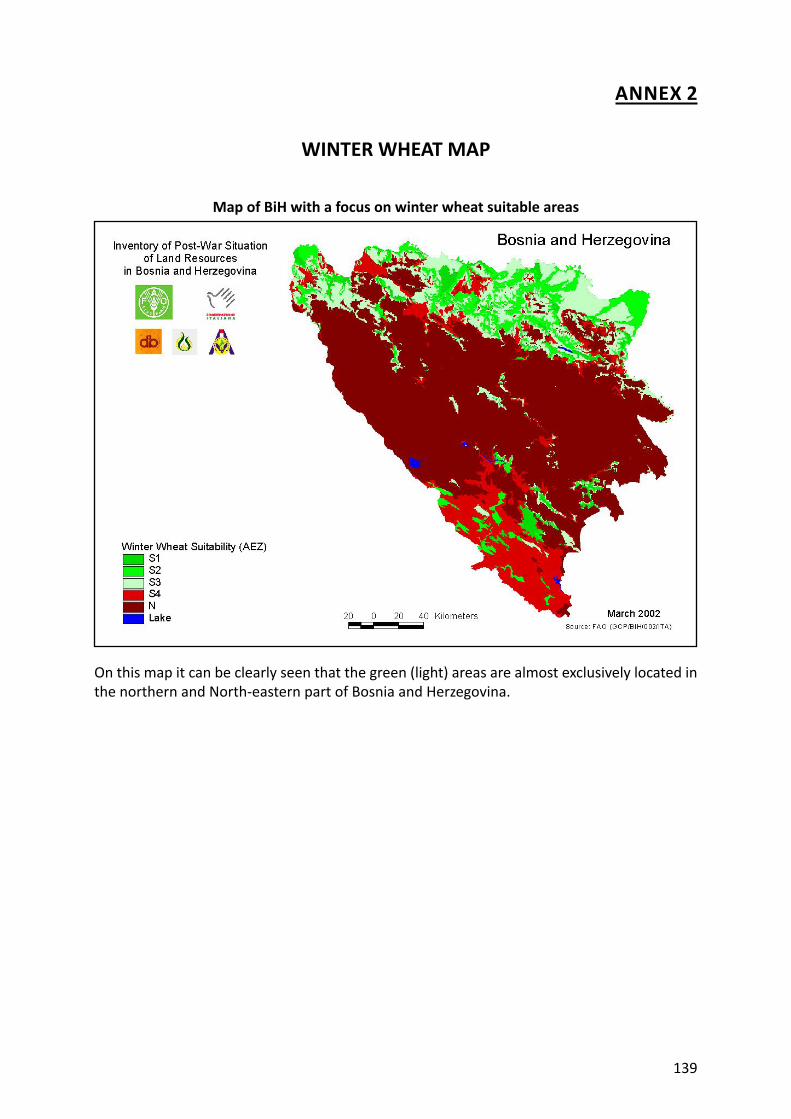
ANNEX 2: WINTER WHEAT MAP 139
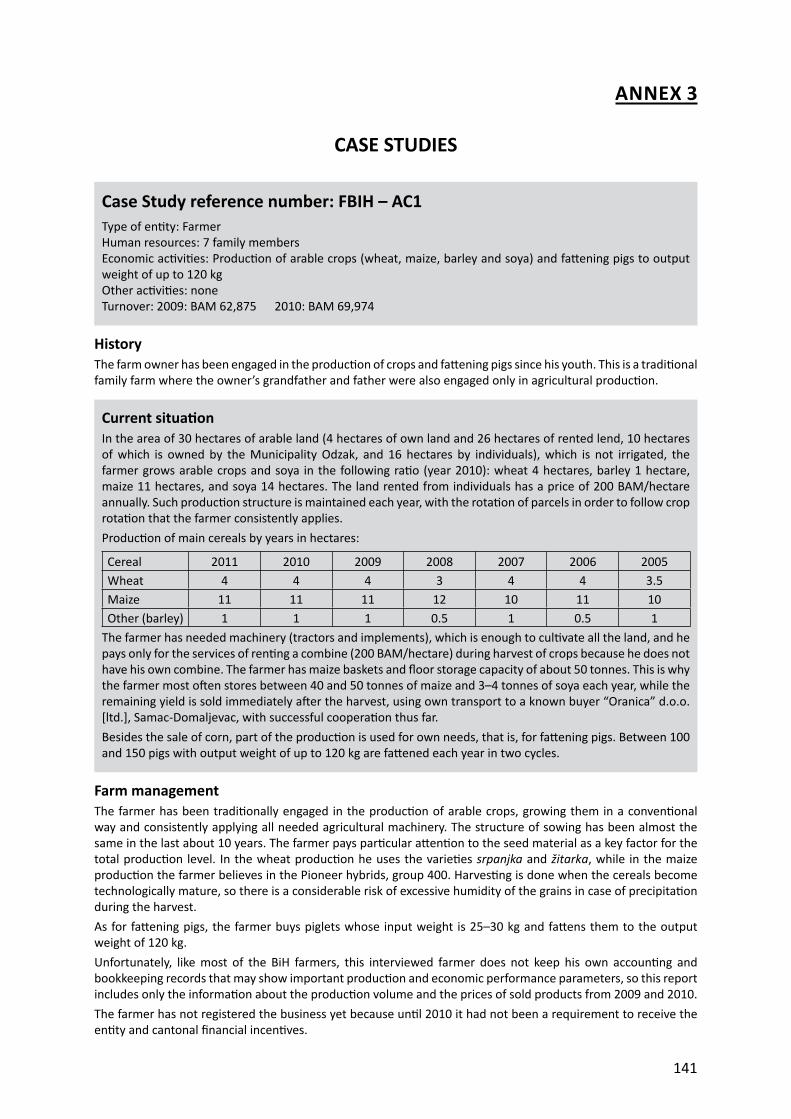
ANNEX 3: CASE STUDIES 141C S : FBIH – AC1 141C S : FBIH – AC2 144C S : FBIH – AC3 147C S : FBIH – AC4 150C S : FBIH – AC5 153C S : FBIH–AC6 156C S : FBIH – AC7 159C S : FBIH – AC8 161C S : RS - 1 164C S : RS – 2 167C S : RS – 3 170
iv
C S : RS – 4 173C S : RS – 5 176
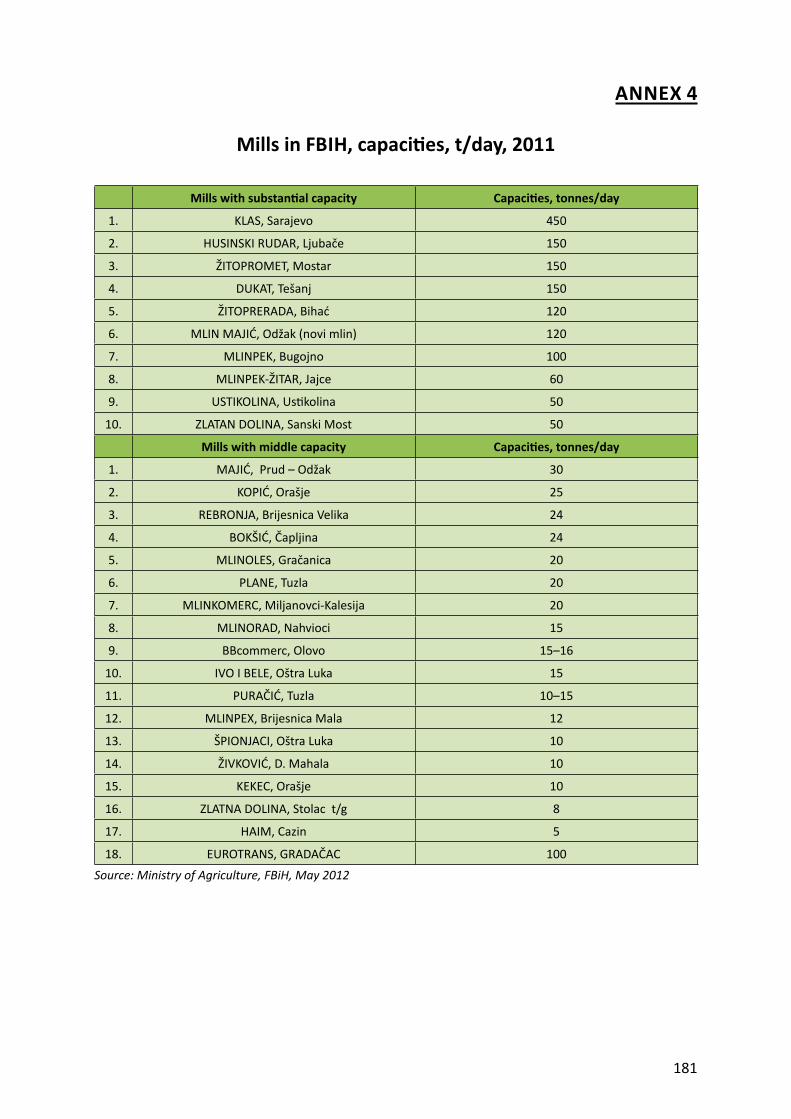
ANNEX 4: MILLS IN FBIH, CAPACITIES, T/DAY, 2011 181
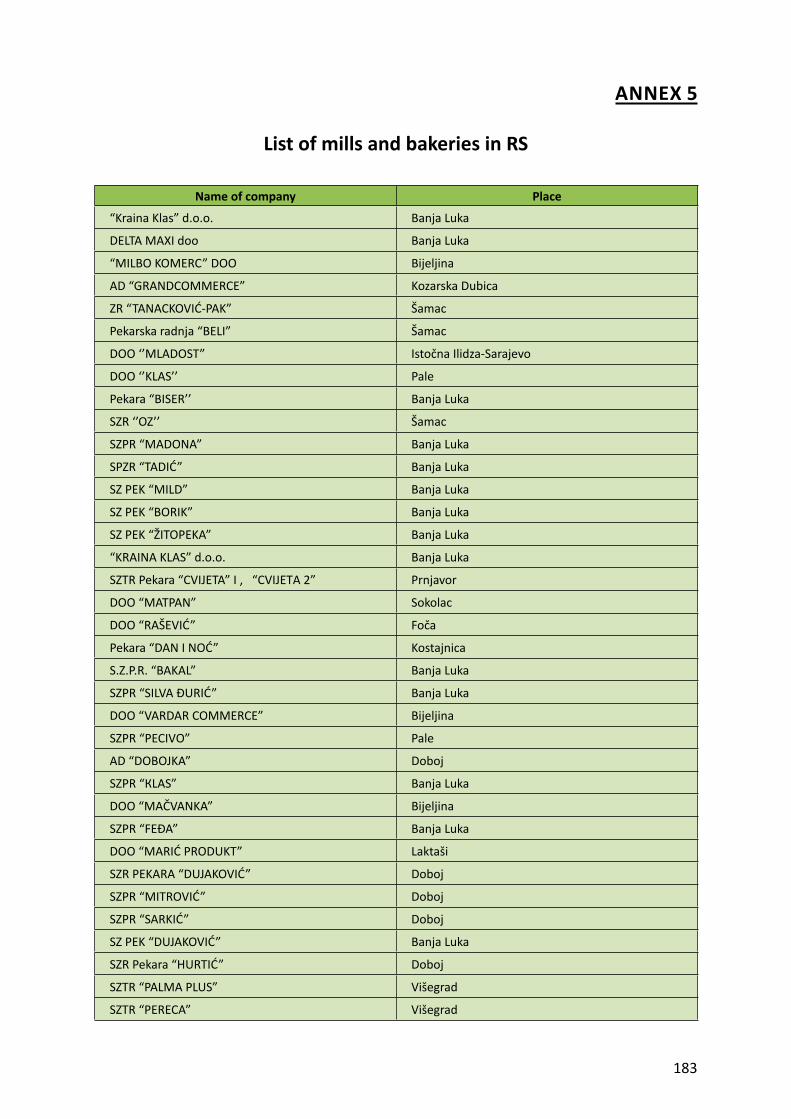
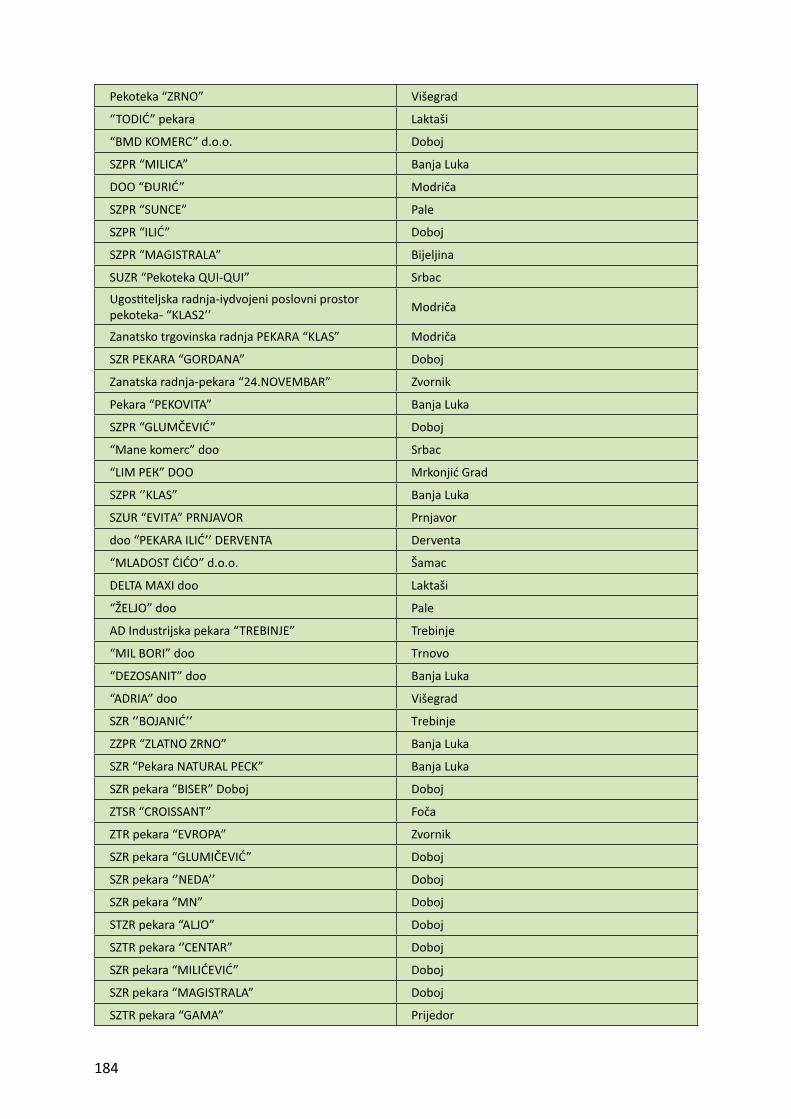
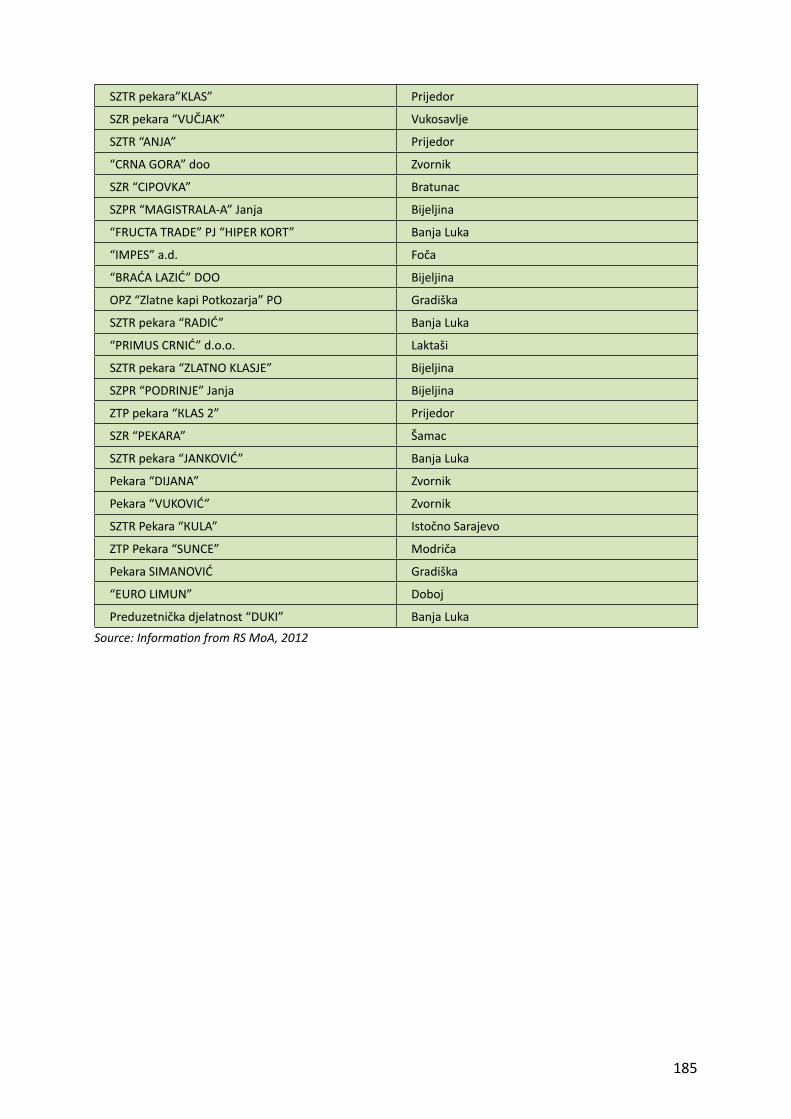
ANNEX 5: LIST OF MILLS AND BAKERIES IN RS 183
ANNEX 6: LIST OF MILLS AND BAKERIES IN BD 187
ANNEX 7: LIST OF FODDER MILLS 189
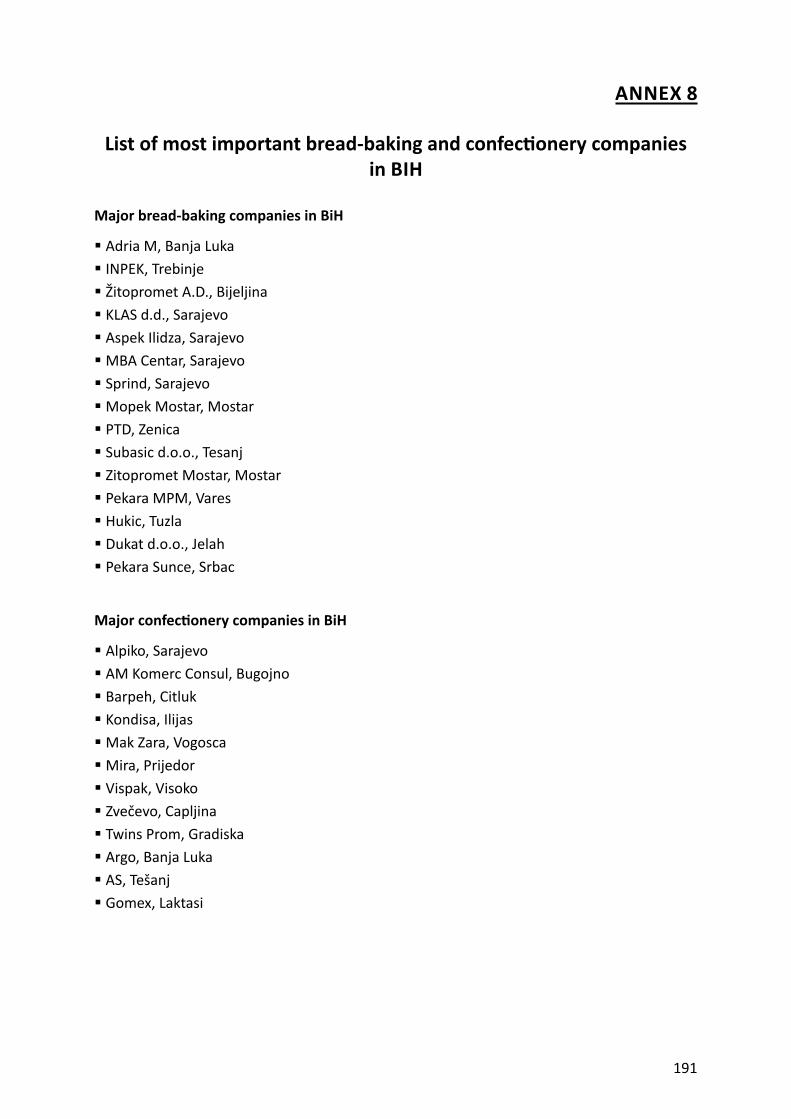
ANNEX 8: LIST OF MOST IMPORTANT BREAD BAKING AND CONFECTIONERY COMPANIES IN BIH 191
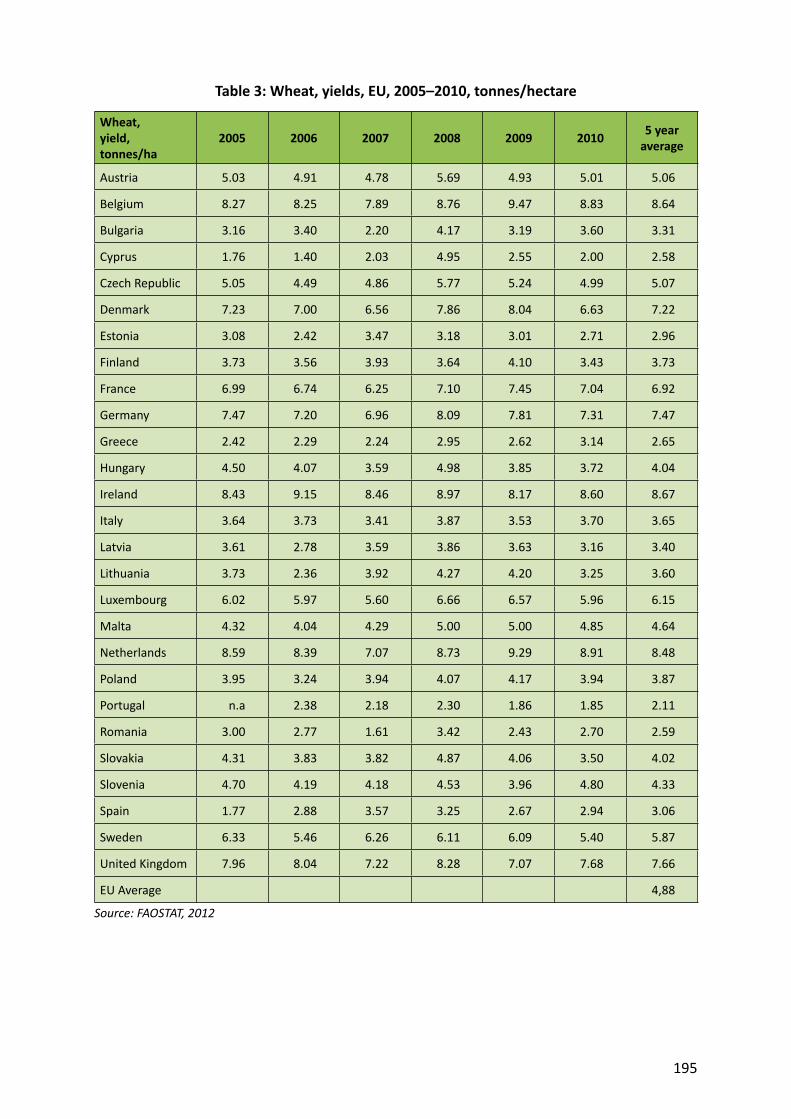
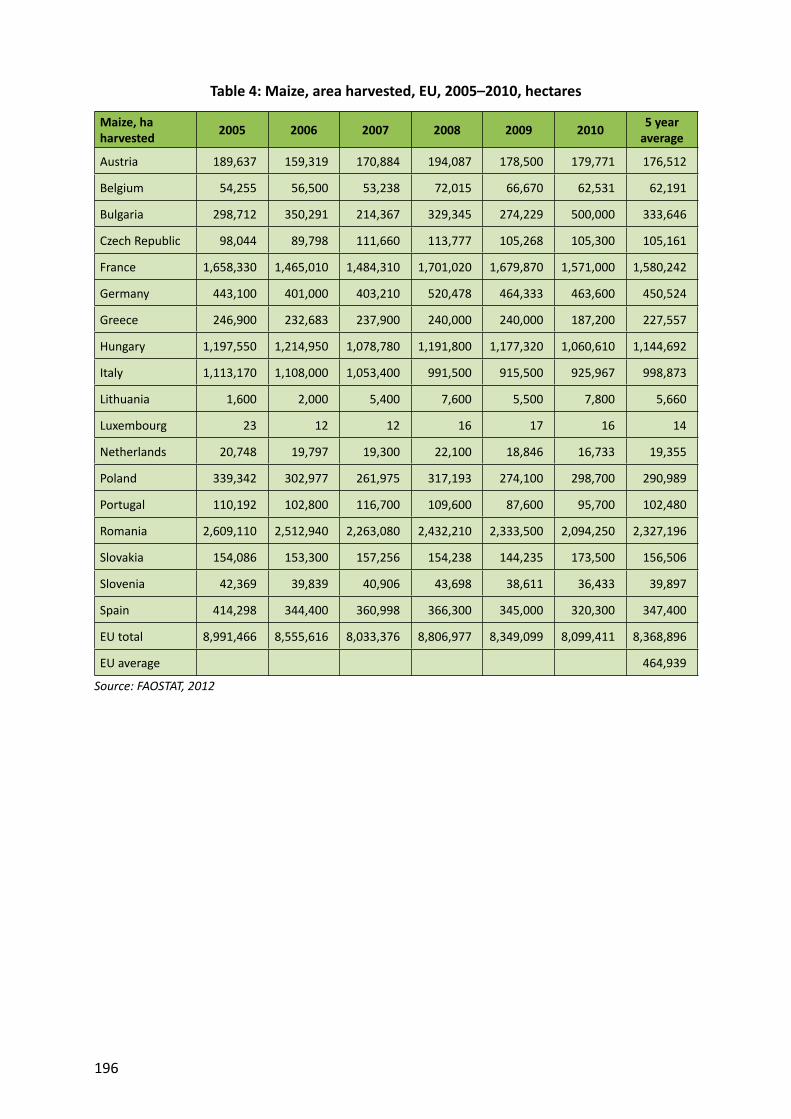
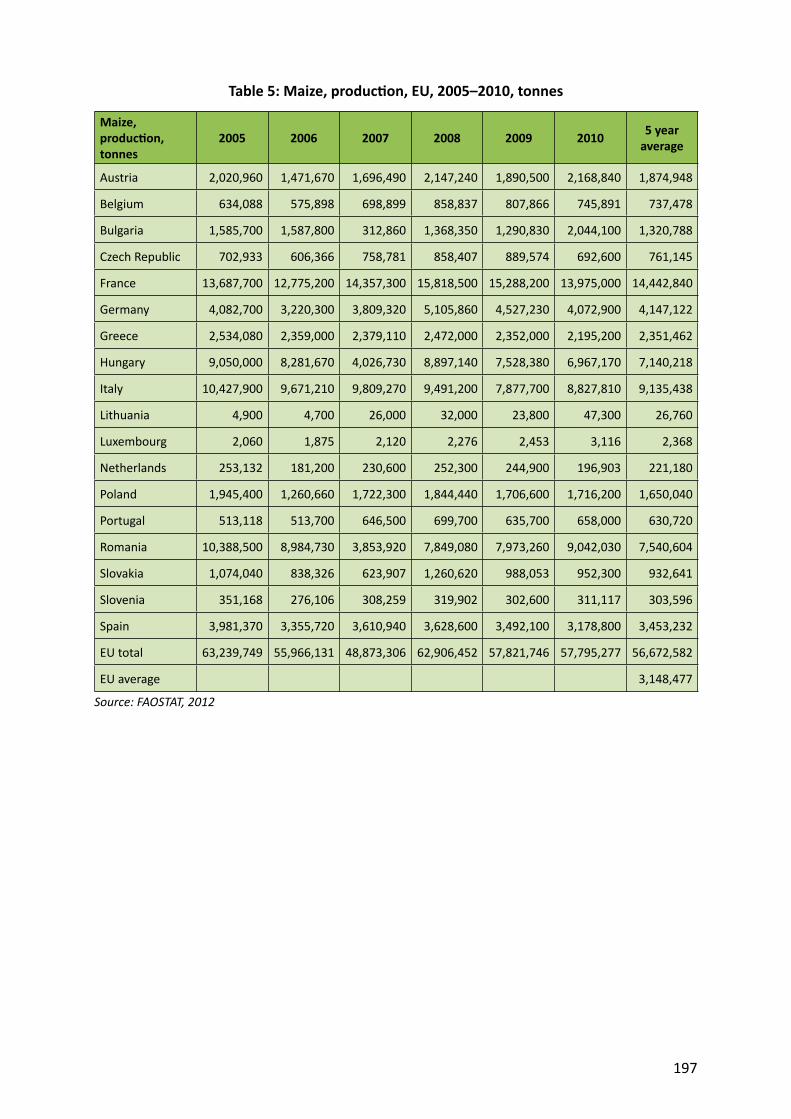
ANNEX 9: EU COMPARISON FOR WHEAT AND MAIZE PRODUCTION 193
v
Abbrevia ons and Acronyms
BAM BiH currency; 1 EUR = 1.9558 BAMBD Brčko DistrictBHAS Bosnia and Herzegovina Agency for Sta s csBHMAC Bosnia and Herzegovina Mine Ac on CentreBiH Bosnia and HerzegovinaCAP Common Agriculture Policy CEFTA Central European Free Trade AgreementEU European UnionEUR EuroFADN Farm Accountancy Data NetworkFAO Food and Agriculture Organiza on of the United Na onsFBiH Federa on of Bosnia and Herzegovina FSA Food Safety Agency GAECs Good Agricultural and Environmental Condi onsGAEP Good Agricultural and Environmental Prac ceGAP Good Agricultural Prac ceGDP Gross Domes c ProductGoBiH Government of BiHGVA Gross Value AddedHa HectareHACCP Hazard Analysis Cri cal Control PointsIDB Investment Development BankIFAD Interna onal Fund for Agricultural DevelopmentIFS Interna onal Food StandardIPARD Instrument for Pre-Accession Assistance for Rural DevelopmentIPHC Interna onal Plant Health Conven onISO Interna onal Organiza on for Standardiza onKg KilogramMoFTER Ministry of Foreign Trade and Economic Rela onsNGO Non-Governmental Organiza onNVA Net Value AddedPPP Power Point Presenta onPHPA Plant Health Protec on Administra onRASFF Rapid Alert System for Food and FeedRS Republika SrpskaSAFFRD Sector for Agriculture, Food, Forestry and Rural DevelopmentSAPARD Special Accession Programme for Agriculture and Rural DevelopmentSESMARD Support for Establishment of the State Ministry of Agriculture and Rural
DevelopmentSIDA Swedish Interna onal Development Coopera on AgencySWOT Strengths, Weaknesses, Opportuni es and Threats (analysis)UNDP United Na ons Development ProgrammeUPOV Interna onal Union for the Protec on of New Varie es of PlantsVAT Value Added TaxWB World BankWTO World Trade Organiza on
vi
Currency Equivalents
Exchange rates
USD for 1 EUR2005- 2009 1.3483
BAM for 1 USD2012 1.58557
BAM for 1 EURSince 2002 – 1.95583
European Central Bank: h p://www.ecb.int/
vii
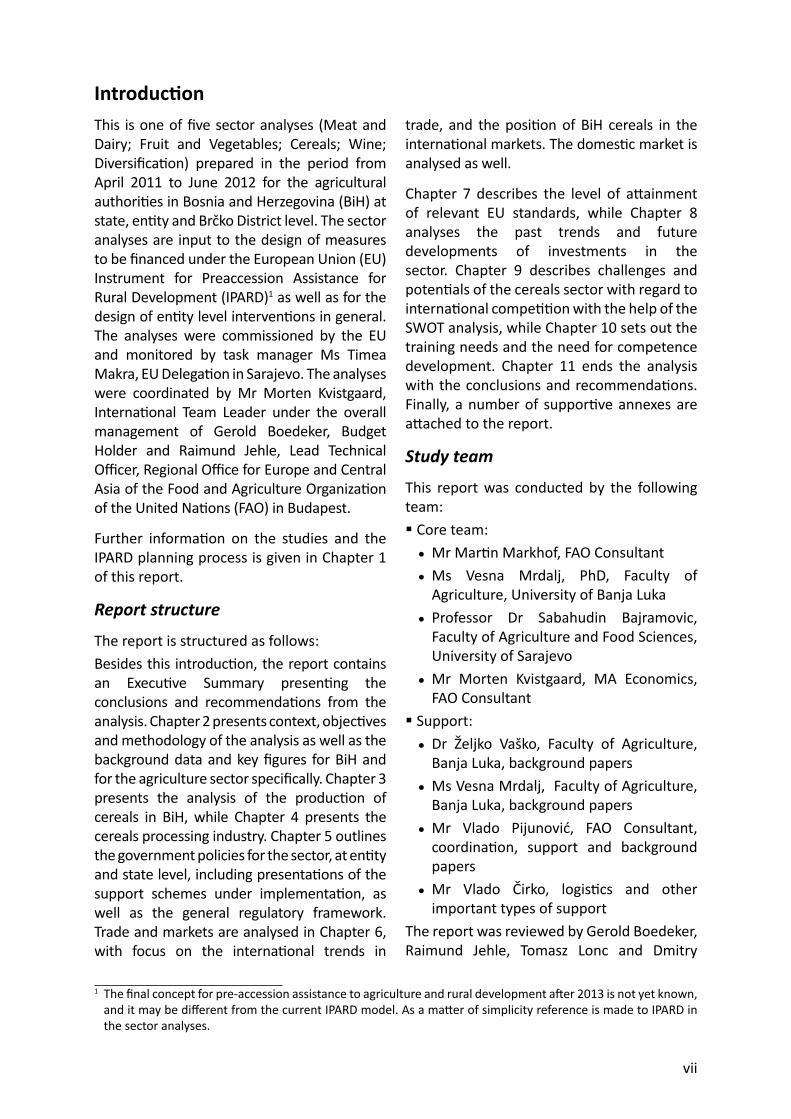
Introduc onThis is one of fi ve sector analyses (Meat and Dairy; Fruit and Vegetables; Cereals; Wine; Diversifi ca on) prepared in the period from April 2011 to June 2012 for the agricultural authori es in Bosnia and Herzegovina (BiH) at state, en ty and Brčko District level. The sector analyses are input to the design of measures to be fi nanced under the European Union (EU) Instrument for Preaccession Assistance for Rural Development (IPARD)1 as well as for the design of en ty level interven ons in general. The analyses were commissioned by the EU and monitored by task manager Ms Timea Makra, EU Delega on in Sarajevo. The analyses were coordinated by Mr Morten Kvistgaard, Interna onal Team Leader under the overall management of Gerold Boedeker, Budget Holder and Raimund Jehle, Lead Technical Offi cer, Regional Offi ce for Europe and Central Asia of the Food and Agriculture Organiza on of the United Na ons (FAO) in Budapest.
Further informa on on the studies and the IPARD planning process is given in Chapter 1 of this report.
Report structure
The report is structured as follows:Besides this introduc on, the report contains an Execu ve Summary presen ng the conclusions and recommenda ons from the analysis. Chapter 2 presents context, objec ves and methodology of the analysis as well as the background data and key fi gures for BiH and for the agriculture sector specifi cally. Chapter 3 presents the analysis of the produc on of cereals in BiH, while Chapter 4 presents the cereals processing industry. Chapter 5 outlines the government policies for the sector, at en ty and state level, including presenta ons of the support schemes under implementa on, as well as the general regulatory framework. Trade and markets are analysed in Chapter 6, with focus on the interna onal trends in
trade, and the posi on of BiH cereals in the interna onal markets. The domes c market is analysed as well.
Chapter 7 describes the level of a ainment of relevant EU standards, while Chapter 8 analyses the past trends and future developments of investments in the sector. Chapter 9 describes challenges and poten als of the cereals sector with regard to interna onal compe on with the help of the SWOT analysis, while Chapter 10 sets out the training needs and the need for competence development. Chapter 11 ends the analysis with the conclusions and recommenda ons. Finally, a number of suppor ve annexes are a ached to the report.
Study team
This report was conducted by the following team: Core team:• Mr Mar n Markhof, FAO Consultant• Ms Vesna Mrdalj, PhD, Faculty of
Agriculture, University of Banja Luka• Professor Dr Sabahudin Bajramovic,
Faculty of Agriculture and Food Sciences, University of Sarajevo
• Mr Morten Kvistgaard, MA Economics, FAO Consultant
Support:• Dr Željko Vaško, Faculty of Agriculture,
Banja Luka, background papers• Ms Vesna Mrdalj, Faculty of Agriculture,
Banja Luka, background papers• Mr Vlado Pijunović, FAO Consultant,
coordina on, support and background papers
• Mr Vlado Čirko, logis cs and other important types of support
The report was reviewed by Gerold Boedeker, Raimund Jehle, Tomasz Lonc and Dmitry
1 The fi nal concept for pre-accession assistance to agriculture and rural development a er 2013 is not yet known, and it may be diff erent from the current IPARD model. As a ma er of simplicity reference is made to IPARD in the sector analyses.
viii
Zvyagintsev, (all FAO). Valuable support regarding language edi ng was provided by Tom Hunter and Valerie Guidi.
Acknowledgements
The FAO team would like to extend its sincere thanks for the assistance and close collabora on in the implementa on of the project to the following organiza ons and individuals:
BiH Ministry of Foreign Trade and Economic Rela ons (MoFTER):• Mr Dušan Nešković, Assistant Minister• Ms Melisa Ljuša, Expert Advisor, Policy
Analysis, and key daily contact• Ms Jelena Prorok, Expert Advisor
Federa on of BiH (FBiH), Ministry of Agriculture, Water Management and Forestry Republika Srpska (RS), Ministry of Agriculture, Forestry and Water Management Brčko District (BD) Department for Agriculture, Water Management and Forestry BiH, Agency for Sta s cs FBiH, Federal Offi ce of Sta s cs RS, Ins tute of Sta s cs EU-funded project “Strengthening and harmoniza on of the BiH agriculture and rural sectors informa on systems (AIS)” led by Mr Colin Sco Several key interviewees represen ng the cereals sector
1
1. Execu ve Summary
2 The fi nal concept for pre-accession assistance to agriculture and rural development a er 2013 is not yet known, and it may be diff erent from the current IPARD model. As a ma er of simplicity reference is made to IPARD throughout the sector analyses.
RS Ministry of Agriculture, Forestry and Water Management; The Department for Agriculture, Water Management and Forestry, Brčko District; Faculty of Agriculture, University of Banja Luka Faculty of Agriculture and Food Sciences, University of Sarajevo; BiH Agency for Sta s cs; Eurostat FAOSTAT United Na ons trade sta s cs
1.2.2 SurveysData collec on was also eff ected as part of the survey conducted for the prepara on of the sector analysis for the meat and dairy sector. The purpose of this was to provide a realis c picture of the cereals sector to supplement exis ng sta s cs and offi cial reports. A number of ques ons related to crop produc on, costs and mechaniza on were put to 121 farmers iden fi ed for the meat and dairy sector survey and covering more than 2,500 ha of arable land and pastures. Of the 121 farmers, 46 farmers produced wheat and/or maize, and an addi onal 33 produced barley. These farmers focus their produc on on keeping animals and could provide good insights into cereal produc on.
1.2.3 Case studies
The Faculty of Agriculture at the University of Banja Luka and the Faculty of Agriculture and Food Sciences at the University of Sarajevo have made a total of 13 carefully selected case studies based on personal expert interviews. Eight of these were in FBiH and fi ve were in RS and BD. These case studies include detailed descrip ons of produc on characteris cs regarding technology levels, facili es, know-how, quality standards, bo lenecks and weak
1.1 Objec ves of the report
The cereals sector analysis is one of fi ve sector studies prepared from April 2011 to June 2012 as a basis for the design of the EU Instrument for Pre-accession Assistance in Rural Development (IPARD).2
The main objec ve of the report is to provide an analysis of the current state of the cereals sector in BiH, focusing on the two main cereals: wheat and maize, but also addressing to some extent other cereals: barley, oats and rye. The report contributes to the analysis of the internal strengths and weaknesses as well as of the external opportuni es and threats to the sector. In light of the needs and problems of the sector and the challenges ahead, investment needs are es mated and policy recommenda ons are formulated. In this way, the report contributes to the formula on of a number of possible policy interven ons for the agriculture and rural development policy in line with the needs for the development of the sector.
1.2 Methodology
This study provides an overview of cereal produc on and processing in BiH. The analysis is based on the following ac vi es:
1.2.1 Desk research and sta s cs
The study started by reviewing exis ng reports on the BiH agricultural sector with a focus on the cereals sector. This study relies to some extent on established data, for which the main sources were:
The Ministry of Foreign Trade and Economic Rela ons of Bosnia and Herzegovina, Sector for Agriculture, Food, Forestry and Rural Development (MoFTER/SAFFRD); FBiH Ministry of Agriculture, Water Management and Forestry;
2
points in the value chain of various types of producers (semi-subsistence producers, commercial holdings and large-scale corporate producers) with a en on to compliance to EU standards. Each of the case studies is reported and a ached as Annex 3 to this report.
1.2.4 Consulta ons with key stakeholders
Discussions with key stakeholders were carried out with, among others, the following ins tu ons: Ministry of Foreign Trade and Economic Rela ons, Sector for Agriculture, Food, Forestry and Rural Development (MoFTER/SAFFRD), FBiH Ministry of Agriculture, Water Management and Forestry (FBiH MoA),3
RS Ministry of Agriculture, Forestry and Water Management (RS MoA), Department for Agriculture, Water Management, Forestry and Veterinary from the Brčko District Agricultural Faculty in Banja Luka Agricultural Faculty in Sarajevo Agency for Sta s cs of BiH Agricultural Ins tute in Banja Luka Federal Ins tute for Seed and Plant Propaga on Material
It should be noted that mee ngs with the offi cial focal points at the two En ty Ministries in Banja Luka4 and Sarajevo5 and the Department for Agriculture, Water Management, Forestry and Veterinary from the Brčko District6 were arranged at the very beginning and at the end of the analysis.
1.2.5 WorkshopsConsiderable emphasis was placed on obtaining the opinion of a wide range of
stakeholders. To this end, four workshops were organized, two each in Banja Luka and Sarajevo. The fi rst two SWOT workshops were held in Banja Luka (30 May 2011) and Sarajevo (31 May 2011). The agenda was to discuss the diff erent aspects of the cereals sector with a broader public, to discuss the current state of the sector regarding produc on and trade, and to discuss the internal strengths and weaknesses as well as the external threats and opportuni es for the sector. In Banja Luka, 35 par cipants contributed to the discussion, and of these 20 represented the sector as producers or processors. In Sarajevo, 26 par cipants were present and among them 15 were producers and processors from the sector. The results from the workshops are u lized in the SWOT sec on, later in this report.
A second round of two verifi ca on workshops took place at the same premises on 20 October 2011 in Banja Luka and 21 October in Sarajevo. 24 par cipants in Banja Luka and 23 in Sarajevo a ended the workshops. Again, the producers and the processors were well represented. The aim of the workshops was to present the conclusions from the sector analysis and the preliminary recommenda ons for possible policy interven ons, and to receive qualifi ed feedback from the stakeholders about these conclusions and recommenda ons. It was considered essen al to ensure that stakeholders have the chance to comment.
Stakeholders raised ques ons about the reliability of offi cial data refl ec ng the real picture of cereals produc on in BiH, resul ng in discussions about how the offi cial data should be used. The decision by the expert team was to report offi cial sta s cs and to comment on them, based on the assessments
3 To make the reading of the text easier we use the FBiH MoA for FBiH Ministry of Agriculture, Water Management and Forestry and RS MoA for RS Ministry of Agriculture, Forestry and Water Management.
4 RS Ministry of Agriculture, Forestry and Water Management; Mr Zoran KOVACEVIC, Assistant Minister of Agriculture, 9 June 2011.
5 FBiH Ministry of Agriculture, Water Management and Forestry; Mr Hanefi ja TOPUZ, B.Se.Agr., Head of Department for Agricultural Policy, 8 June 2011
6 Brčko District of BH Government, Department for Agriculture, Water Management, Forestry and Veterinary, Mr Dr.sc. Ferhat CEJVANOVIC, 21 September 2011
3
provided by other stakeholders. This approach was later agreed with representa ves from en ty ministries and MoFTER.
The workshop also agreed upon the conclusions from the SWOT analysis as well as the proposed ac ons for interven ons in the sector.
1.2.6 Field visits to selected sites where measures will impact strongly
The sector expert and the na onal coordinator undertook a fi eld trip in September 2011 to the most important areas in BiH, from Banja Luka to Brčko and Bijeljina. During this fi eld trip fi ve farmers and fi ve processors were visited and interviews conducted along the lines of the template for the case studies. Direct mee ngs with ins tu ons, producers and processors were also arranged. In total the study team met over 100 farmers, processors, ins tu ons and other stakeholders.
1.3 General fi ndings for cereals sector development
1.3.1 Producers of cereals
The most suitable areas of Bosnia and Herzegovina to grow cereals are located along the country’s northern border close to the Sava and Drina, where the arable land is fl at; farms are larger and have the poten al for expanding the area further. For historic reasons the average farm in BiH is very small and fragmented and to enable a maximum return of the investments, farmers (with the excep on of vegetable and fruit farmers) also keep animals for which fodder is needed. Although the majority of farms are mixed farms, there are a small number of specialized cereal producers.
Produc on structure
Cereals are produced in BiH on most types of farms: subsistence and semi-subsistence farms, commercial family farms and corporate farms. The precise number of farms with cereals is not known from offi cial sta s cs. The scale of produc on varies considerably from only 1 ha per farm
to hundreds of hectares per farm, but the most frequent type of farm only has a few (2–5) hectares distributed on several (6–8) parcels. However, the farm survey conducted as a part of this sector analysis showed that the median number of hectares for wheat and maize producers in FBiH was 3.6 hectares and 6 hectares respec vely, while the median in RS/BD for the same two crops was 2.5 hectares and 5 hectares respec vely. If these medians are used together with the offi cial data for sown areas with wheat and maize, the number of farms producing wheat and maize can be es mated.
In FBiH 18,100 hectares were sown with wheat and 48,100 hectares with maize. This gives 5,030 farms producing wheat and 8,020 farms producing maize, and a total for FBiH of 13,050 farms. In RS and BD, 33,600 hectares was sown with wheat in RS and 3,700 hectares in BD. Maize was sown on 138,400 hectares in RS and 5,200 hectares in BD. This gives a total of 14,920 wheat farms and 28,770 maize farms. The total for RS and BD was about 43,700 farms producing the two cereal crops. In BiH the total number of wheat farmers is es mated to be 20,000, while there are 37,000 farms producing maize.
Volume of produc on
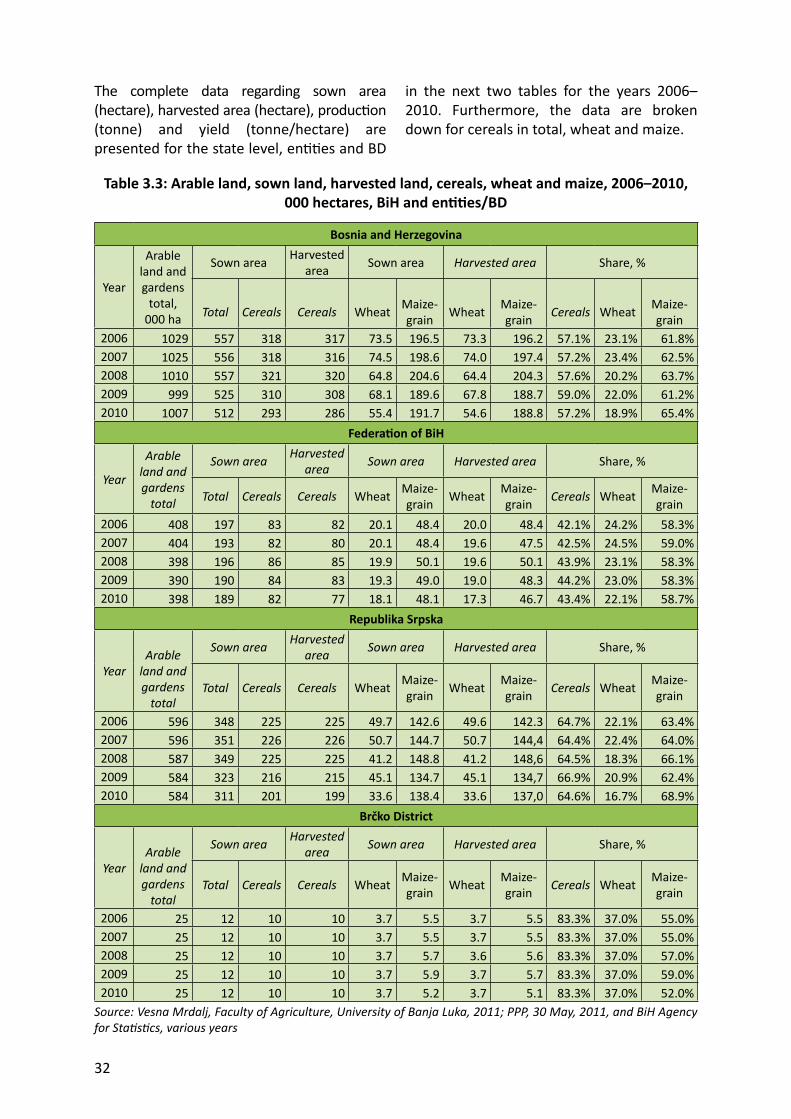
At the BiH level, the number of hectares sown with cereals decreased by 8 percent from 318,000 hectares in 2006 to 293,000 hectares in 2010. The number of hectares has been constant in FBiH with a fi ve-year average of 83,400 hectares, while RS has experienced a reduc on of 12 percent from 225,000 hectares in 2006 to 199,000 hectares in 2010. The situa on is BD has been constant at 10,000 hectares.
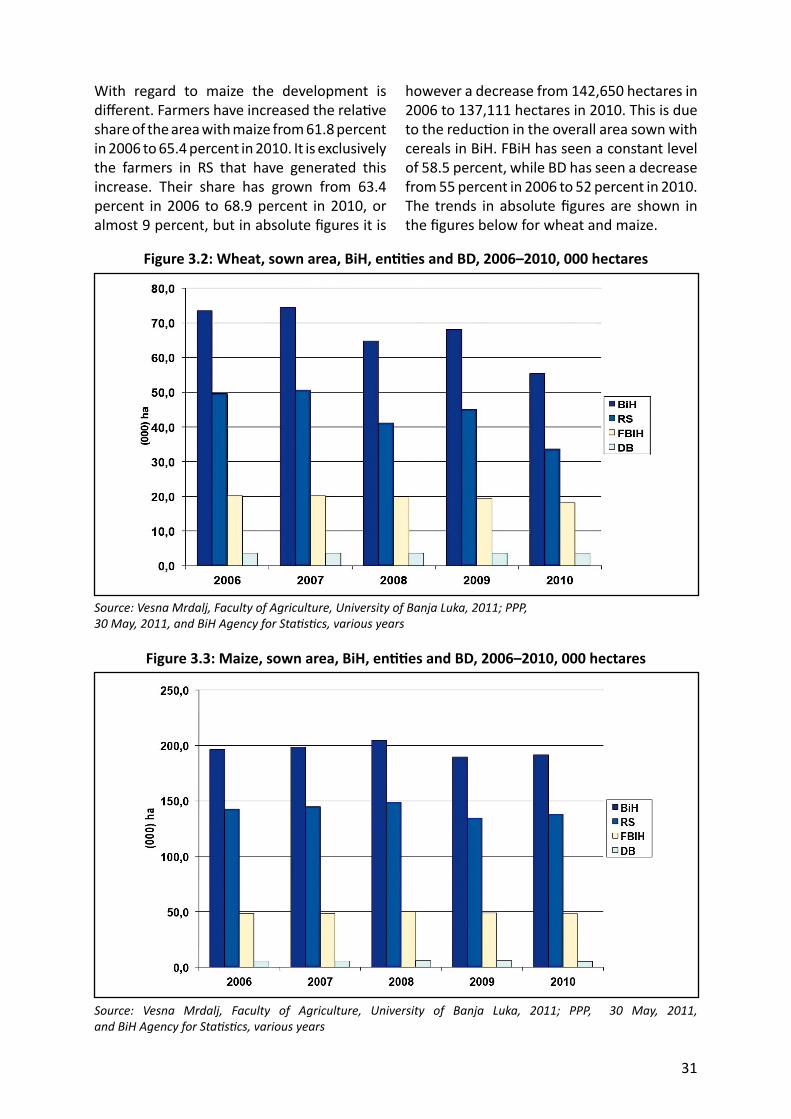
The area under wheat in RS decreased by 32 percent from 49,700 hectares in 2006 to 33,600 hectares in 2010. FBiH has also seen a decrease of 10 percent from 20,100 hectares to 18,100 hectares. At BiH level the total reduc on of area under wheat was 25 percent. For maize grain the area sown in FBiH went down from 48,400 hectares to 48,100
4
(-0.6 percent), in RS from 142,600 hectares to 138,400 hectares (-3 percent) and in BD from 5,500 to 5,200 hectares (-5 percent).
The yield measured in tonne per hectare fl uctuates for both wheat and for maize. For BiH the average fi ve-year yield for wheat was 3.3 tonne/ha and 4.7 tonne/ha for maize. The fi ve-year average for wheat in FBiH is 3.5 tonne/ha, due to a poor year in 2010. For maize the fi ve-year average is 4.5 tonne/ha in FBiH. In RS, the fi ve-year average for wheat is 3.3 tonne/ha with a poor year in 2010. For maize the fi ve-year average in RS is 4.6 tonne/ha, which also was the yield in 2010, but the average is reduced due to a very poor yield in 2007 with only 3 tonne/ha, just two-thirds of the average. In BD 2010 was also poor with yields of wheat of 2.8 tonne/ha and of maize of 4.5 tonne/ha. Both results are below the respec ve fi ve-year averages of 3.6 tonne/ha for wheat and 4.6 tonne/ha for maize.
The total area harvested with barley, oats and rye was 31,500 hectares in 2010. It was a reduc on from 39,400 hectares in 2009, or 20 percent down. Of the three small cereals, barley is by far the most important with a fi ve-year average of 65,500 tonnes of produc on, while the produc on of oats is 35,000 tonnes and rye 10,000 tonnes on average. Also for these three cereals the yields were low in 2010, and this is refl ected in a rela vely low produc on in 2010 compared to the previous years. Rye produc on went down by 38 percent, barley by 35 percent and oats by 43 percent.
Value of produc on
The value of wheat in BiH declined from BAM 71 million in 2009 to BAM 45 million in 2010. The RS is par cularly hard hit with a reduc on from BAM 46 million to BAM 26 million, or a decrease of 42 percent, but also FBiH and BD are suff ering from lower produc on and yields.
With regard to maize, the total value in BiH was BAM 259 million in 2010, which is a small increase from 2009, when the value was BAM 235 million. FBiH, RS and BD have all experienced an increase in the value,
primarily due to higher prices in 2010, and in spite of lower yields and a reduc on in the sown and harvested areas.
In total the value of the two most important cereals (wheat and maize) was BAM 305 million for BiH in 2010, distributed as follows: BAM 77.6 million in FBiH, BAM 217 million in RS and BAM 10.3 million in BD. The total value of the fi ve main cereals (wheat, maize, rye, barley and oats) in BiH in 2010 was BAM 332 million, with a fi ve-year average of BAM 338 million.
Maize grain had the highest rela ve importance of all the cereals in 2010 with 78 percent of total cereals produc on; wheat in the same year had the lowest share with only 14 percent. The total value of the three smaller cereals was only 8 percent in 2010.
The value of the produc on of the fi ve main cereals was 1.4 percent of total Gross Domes c Product (GDP) in 2010 (BAM 24,484 million) The fi ve main cereals contributed 14.3 percent of agricultural GDP in 2009 (BAM 1,817 million)
Profi tability of wheat and maize produc on
The farm surveys and case studies, which were conducted as part of this sector analysis, show that wheat produc on on average in 2011 generated a Gross Value Added (GVA) of BAM 578 per hectare including subsidies, while maize produc on on average generated a GVA of BAM 933 per hectare. It is more economically a rac ve for farmers to produce maize instead of wheat, and this is also refl ected in the importance of maize as a crop in BiH compared to wheat and other cereals. These results are in line with pilot Farm Accountancy Data Network (FADN) es mates, which also indicate that the profi tability of barley, oats and rye is lower than the profi tability of maize.
Central European Free Trade Agreement (CEFTA) and EU comparison
With an average yield of wheat of 3,317 kg/ha, BiH is lagging behind Albania (3,625 kg/ha),
5
Kosovo (3,735 kg/ha), Serbia (3,605 kg/ha) and Croa a (4,681 kg/ha), while the BiH yield is higher than in Montenegro, Republic of Moldova and The Former Yugoslav Republic of Macedonia. The wheat yields vary from year to year depending on clima c condi ons, and in BiH ranged from 2,662 kg/ha (2010) to 3,775 kg/ha (2009). The fi ve-year average wheat yield for the period from 2006 to 2010 in the EU was 4,880 kg/ha, equal to 147 percent of the yield in BiH. However, the varia on among EU member countries is large: From 8,670 kg/ha in Ireland, Belgium and the Netherlands down to 2,110 kg/ha in Portugal and 2,590 kg/ha in Romania, equal to 78 percent of the BiH average.
With regard to average yields of maize, BiH with 4,655 kg/ha in the period 2005–2010 was lagging behind Albania (5,276 kg/ha), Serbia (5,032 kg/ha) and Croa a (6,802 kg/ha), but yields were higher than in Kosovo, Montenegro and the Republic of Moldova (2,747 kg/ha). As in all other CEFTA countries, the average yields of maize vary from year to year and in BiH ranged from 3,218 kg/ha (2007) to 5,134 kg/ha (2005). The fi ve-year average yield for maize for the period from 2006 to 2010 in the EU was 7,720 kg/ha, equal to 166 percent of the yield in BiH. However, the varia on among EU member countries was also large for maize produc on: From 11,860 kg/ha in Belgium and the Netherlands down to 3,250 kg/ha in Romania and 3,790 kg/ha in Bulgaria, equal to 70 percent of the BiH average.
There are several reasons for the lower yield per hectare in BiH compared to most CEFTA and EU countries. One of the most important is the small scale and fragmenta on of farms giving only limited scope for moderniza on of equipment. This leads to low produc vity as well.
Furthermore, stakeholders in the sector in BiH point to the low quality of seeds as another major factor. Inputs are generally used in small quan es, which also puts limita ons on yields, even though the use per ha of fer lizers and pes cides has been increasing recently.
Finally, the level of educa on and training related to modern high-yield produc on methods among farmers is low. Here it is also relevant to refer to the status of the extension services in BiH. Experiences from many other countries, both in the region and in the EU show that good extension services are of paramount importance in the moderniza on of agriculture, par cularly in countries where the share of small-scale farms is rela vely high, as in BiH. Extension services in BiH, as in many transi on countries, are the weakest link in the chain, par cularly in FBIH, and most farmers lack educa on, training, informa on and advice. Therefore, farmers tend to have a limited understanding of agricultural economics, of how to op mize their factor inputstrategy, the use of cer fi ed quality seeds, etc. In addi on, fer lizers and agro-chemicals are not used according to professional standards and good agricultural and environmental prac ce.
1.3.2 Processing industry
Processing of cereals includes primary processing of cereals into fl our of diff erent types and secondary processing into fresh bread and various types of baked products, cakes, etc.
Volume of primary processing
The produc on of fl our in BiH is taking place in 10 major mills in FBiH excluding a large number of small-scale mills and in 36 mills of various capaci es in RS/BD.
In FBiH wheat is by far the most important grain used in processing accoun ng for 99.6 percent of the fl our produc on in 2010 (138,144 tonnes) and 99.7 percent in 2011 (124,876 tonnes). However the overall produc on of fl our declined in 2011. The annual capacity in the sector is 533,000 tonnes, and the u liza on of capacity in the FBiH primary processing sector in 2011 was 23.5 percent.
As was the situa on in FBiH, wheat fl our in RS was the major product with 90,816 tonnes in 2009, or 94 percent of total produc on of
6
fl our of 96,438 tonnes. The capacity u liza on was es mated to be 30 percent, and the full capacity of the RS mills was 320,000 tonnes.
The total capacity of the FBiH and RS mills was es mated to be 854,000 tonnes, and the u liza on rate was 26 percent.
The produc on of 222,000 tonnes of various products, with wheat fl our as the major product, requires 296,000 tonnes of cereals, if the u liza on rate (1 kg cereals produces 0.75 kg fl our) is 75 percent. 66,000 ha to 70,000 ha, depending on the average yield, would be required to produce this amount of wheat. However, many mills rely on imported cereals, in par cular from Hungary, because the processing industry considers imported wheat to be of be er quality. In addi on, imported wheat can be bought at lower prices (BAM 230 per tonne for imported wheat in 2010 compared to BAM 330 per tonne in BiH), posing a major challenge for BiH farmers to compete with the imported wheat, both in terms of price and in terms of quality.
Value of the produc on of milled cereal products
In order to es mate the value of the produc on of milled cereal products, the average price for wheat fl our on the domes c market in 2010 was used (BAM 530 per tonne), because no produc on sta s cs broken down by type of product were available. In total 230,000 tonnes of milled cereals were produced with 125,500 tonnes in FBiH and 96,500 tonnes in RS. An addi onal 8,000 tonnes were produced in BD. The total produc on of milled cereals in BiH was valued at 122 BAM million in 2010 distributed between en es and BD as follows: FBiH: BAM 66.5 million; RS: BAM 55.1 million and BD: BAM 4.2 million
Secondary processing
The secondary processing industry in BiH consists of 15 major bread-baking companies and 12 major confec onery companies and several smaller companies.
The most important product category under secondary processing in FBiH was “fresh wheat
bread” with almost 18,000 tonnes produced in 2011, down by 16 percent from 2010. The second largest product category was “sweet cookies (sweet biscuits)” with 4,700 tonnes in 2011, which was twice the produc on of 2010, and the category including “all types of pastries” with 3,276 tonnes. Besides sweet cookies, the “rising stars” in FBiH secondary produc on are the categories “confec onery and daily cakes” up by 212 percent, “fresh rye bread” up by 138 percent, and “toast breads” up by 136 percent, but these categories are s ll rela vely small.
Unfortunately there is no informa on with regard to the value of the produc on available, but it is clear that the value added of the main product category – fresh wheat bread – is lower than what can be expected from other more processed categories, such as sweet cookies and other products. The increase in these categories might therefore also represent a rela vely strong increase in the value of the produc on, since the weight of fresh wheat bread is diminishing. This tendency is posi ve from an economic point of view.
In RS it was also wheat bread which was domina ng produc on in the secondary processing industry with a produc on of 10,526 tonnes in 2009. This fi gure represents a decline in produc on from 2006, when produc on was 13,461 tonnes of bread. This is a reduc on of 23 percent.
As in FBiH, in RS there was an increase in the share of products with an expected higher value added on the expense of wheat bread.
Product quality
Many millers and other stakeholders interviewed, stated that the quality of locally produced cereals does not meet market requirements regarding moisture, hectolitre weight and maximum amount of foreign materials (admixtures) as well as other quality requirements. To deliver the quality demanded by the bread-baking industry, mills in BiH have to blend wheat. All millers met during site visits men oned that the quality of local wheat is too low and as a result they have
7
to import be er quality wheat for blending purposes. The blending ra o between local to imported wheat is 10–20 percent local and 80–90 percent imported wheat.
It was also men oned by a few processors that o en they are confronted with domes c (not imported) cereals with some content of agrochemicals. Lack of appropriate control by inspectors on the farms was inferred as the reason.
However, the situa on is blurred in the sector: In 2009 and 2010 the quality of wheat was good and corresponded in general to the men oned requirements of processors, but there were also some millers who claimed that the moisture content was too high.
1.3.3 Current state and en ty/district policies
At state level, as well as at en ty and district level, policies are being prepared along the lines of EU regula ons. Ins tu ons relevant for the cereals sector, such as the Food Safety Agency and the Plant Health Protec on Agency are preparing for EU candidate status and are aligning their organiza on, their ac vi es and their regula ons to EU requirements.
However, the autonomy of the en es and BD creates many varia ons in the prac cal implementa on of the policies within the framework of agricultural and rural development strategies and ac on plans.
With regard to cereals, there is no harmonized policy across the en es and BD for providing subsidies, and there are currently, among others, a mixture of area payments of diff erent magnitudes and for diff erent crops, product support and in-kind contribu ons of blue diesel and fer lizers. The subsidies are not aligned with the EU agricultural policy measures, which favour area payments on the one hand and moderniza on support on the other.
The budget for agriculture and rural development in the en es remains low and tends to be oriented towards Common Agricultural Policy (CAP) pillar 1 support and
not CAP pillar 2 support. The lack of an effi cient administra on at all levels is impeding the compe veness of farmers and the agri-processing industry throughout the country. Also due to the lack of harmoniza on and coordina on between en ty and district ministries, the environment for the farmers in the country lacks transparency and creates diff erent condi ons for produc on from one area to another. There is a clear need for harmoniza on and alignment of subsidies and enforcement of legisla on across the diff erent en ty and district borders. This is the case not only for cereals produc on but for agriculture in general.
1.3.4 Trade policy
BiH is following its path towards EU candidate status, and by 2013 BiH will have a fully liberal trade partnership with the EU, under the circumstances that BiH fulfi ls the requirements, and that the companies wishing to export to the EU comply with the requirements in the Acquis.
Trade balance in cereals
The total trade defi cit in cereals in 2010 was BAM 166.2 million, due to imports of BAM 194.3 million and exports of BAM 28.1 million. It was a minor increase from 2009, but the level was s ll lower than in the years 2007 and 2008, when the defi cit was just below BAM 200 million. Exports were increasing and showed their highest level in 2010 with BAM 28.1 million.
For wheat and maize there was a very small export boom in 2009 and 2010, but the mainstream tendency was for import of both cereals. The trade defi cit was BAM 100 million for wheat in 2010 and BAM 53.5 million for maize.
The total import of cereals from CEFTA countries in 2010 was BAM 102.3 million, while exports to the CEFTA countries were as low as BAM 3.8 million. The trade defi cit was BAM 98.4 million in 2010. There has been a slow increase over the last two years, but s ll not at the level of 2007, when the defi cit was BAM 147 million.
8
Import prices
The import price of wheat in 2011 was on average BAM 330 per tonne, but the import price from Hungary was only BAM 231 per tonne (domes c price was BAM 330 per tonne), while the modest exports of wheat were sold at BAM 568 per tonne in 2011. Hungary is Bosnia and Herzegovina’s most important trading partner in terms of cereals, closely followed by Serbia and Croa a. During the period 2005–2009 wheat imports from Hungary were always more than 50 percent of total wheat imports (with the excep on of 2007). In 2008, out of the total of 326,800 tonnes of imported wheat, 274,200 tonnes or (84 percent) was imported from Hungary.
Produc on balances
The domes c produc on of wheat has covered a stable share of the domes c market with 40 percent for the years 2006 to 2008, and 43 percent in 2009. In 2010 the share dropped drama cally to only 22 percent. This was due to a decrease in domes c produc on caused by weather and fl ooding problems. Domes c consump on also fell, but imports increased to capture the share of the market le open due to the low produc on in BiH.
For maize the picture is diff erent. The share of domes c consump on sa sfi ed by domes c produc on has been rather stable over the fi ve years, with an average of 82.5 percent. From 2009 to 2010 a slightly reduced share from 85.4 percent to 81.7 percent was observed, but it is not a drama c reduc on, and the market share signals a rela vely high level of compe veness at the local market for maize grain.
Import subs tu on
Current produc on of wheat and maize in BiH can theore cally be based on 255 wheat producers and 909 maize producers with op mal yields genera ng a four family
member income at the average BiH level per capita (EUR 3,300 per capita). These farms will need 27 hectares for maize and 44 hectares for wheat produc on. If the reference income level is reduced, the number of new farms will increase since the number of hectares needed to generate the relevant income level will go down.
If the current import of wheat and maize can be subs tuted by more compe ve domes c producers BiH will need 609 new or extra wheat farmers for every 25 percent of import subs tu on, and 354 new maize grain farmers for every 25 percent of import subs tu on. An import subs tu on strategy enhancing the framework condi ons for the sector could benefi t the farmers considerably.
Commodity reserve
In order to cover also a commodity reserve as expressed in the ac on plan for a commodity reserve under nego a on in BiH, addi onal numbers of hectares are required. The need will be in the range of 100,000 tonnes of wheat and 10,000 tonnes of maize according to the ac on plan. This amount of wheat produced with 4.5 tonnes/ha requires 22,222 ha. If it is furthermore assumed that the required number of hectares for a viable farm7 is es mated to be 44 ha, addi onal produc on from 505 farmers is required to contribute to the reserve stocks of wheat. With regard to maize, 45 farms with 1,250 hectares with an 8 tonnes per hectare yield are needed.
Trade with processed products
With respect to exports of milled products, the general picture was an increase in exports from 2007 to 2011 in the range of BAM 3.6 million or 123 percent. In the same period imports have however also increased, and the trade defi cit has as a consequence increased with BAM 29 million or 39 percent. The increase in imports was not as large as the
7 The calcula on of the “viable farm” is based on the average GDP per capita. In the absence of any reliable informa on to calculate average income in rural areas it was felt that this is the best proxy for an economically a rac ve income for farmers which would be an incen ve to stay in full- me farming rather than pursuing other rural off -farm incomes or moving to the ci es.
9
increase in exports, but the point of departure for exports is rela vely modest compared to the import level.
The price per tonne of wheat fl our exported during the whole period covered is higher than the import price per tonne. In 2011, the export price per tonne was 49 percent higher than the import price, and during the period the average diff erence was 86 percent in favour of the export price. In 2011, the export price was BAM 973 per tonne and the import price was BAM 654 per tonne, the diff erence therefore being BAM 318 per tonne.
The situa on for processed products such as sweet biscuits, waffl es, etc. is more blurred than that for milled cereal products. Exports here are also fl uctua ng with an increasing tendency in 2011, where the level of exports was BAM 27.6 million. This was an increase of 14 percent, which was far below the increase in exports of the milled products. The trade defi cit is also increasing for these products, with BAM 10 million or 23 percent in the period from 2007 to 2011. For these products the increase in imports was greater than the increase in exports, leading to an increase in the gap over me.
1.3.5 Compliance with EU standards
BiH authori es at all levels are facing several tasks in order to fi nalize the adapta on of exis ng legisla on to EU standards and in par cular to enforce approved legisla on. However, the actual status is not a substan al obstacle to BiH cereals farmers, as cereal exports are not signifi cant.
Produc on of cereals on farms in BiH is typically conven onal, in the sense that tradi onal produc on principles are used. Cer fi ca on systems, such as cer fi ca on for Global Good Agricultural Prac ce (GAP) standards and Quality Management Systems of safe food produc on, quality management and environmental protec on are not used. The arguments of farmers are that there is currently no need for applying any standard, since the produc on is directed towards the domes c market, and in BiH it is not a
market requirement. As a consequence the produc on does not typically follow the formal principles of good agricultural prac ce, and the farmers do typically not meet the agri-environmental and quality standards of the produc on and of the products.
However, among farmers there is a growing understanding of the need to improve the standards of produc on and management. Furthermore, the farmers are willing to take these steps the day they are forced to take them. That day may come sooner than they expect, if the EU nego a ons move along faster than what has been seen in previous years. If this happens, the IPARD programme, with its support to increased compe veness and moderniza on of produc on standards in line with the acquis, will be very relevant.
Hazard Analysis Cri cal Control Points (HACCP) for BiH mills is not mandatory yet. Overall it is not surprising that just a few agro-processing companies have EU approval for exports (EU export cer fi cates). Due to non-compliance with EU standards and regula ons, the exis ng export markets for cereals and fl our are primarily CEFTA countries and Turkey.
1.3.6 Investments
The analysis of previous and planned investments in the sector is based on case studies and surveys as well as on stakeholder interviews and expert statements.
The eight case study farms in FBiH have invested in the range of BAM 575,000 over the last fi ve years. The average investment is BAM 71,500 per farm. In RS, the fi ve case study farms represent a total investment of BAM 873,000 with an average of BAM 175,000, but one farm counts for the main share. Without that par cular farm included in the sample, the average is reduced to BAM 30,000.
The farms without on-farm silos, plan in the future to invest in silos to avoid having to sell at low prices immediately a er the harvest. The increasing importance of on-farm storage
10
facili es was confi rmed during fi eld visits and the visit to the INTERAGRO Bijeljina Fair in September 2011. The average investment among the case study farms is es mated to be BAM 100,000 per farm including investments in storage, combines, tractors and other farm equipment.
The farm survey confi rms the investment plans. On average the surveyed farmers will invest BAM 32,600 in the coming years as a priority for machinery to wheat and/or maize produc on. This confi rms the need to upgrade the technological level of the farmers in BiH. Other investments might add to this fi gure.
The investments in the primary processing sector will also be demanding and of the scale of BAM 40 to 50 million. Especially the smaller newly established mills with up to 10,000 tonnes annual capacity have not invested in suffi cient storage facili es, including silos, and they plan to increase their storage facili es. Besides addi onal silo capaci es, more and be er driers are needed. Manufacturers also want to invest in packing lines for wheat fl our and packages of 5, 10 and 25 kg. The more concerned millers also see a permanent need to invest in laboratory equipment.
The reac ons to the announced possible IPARD programme, with co-fi nancing support to farmers and millers, during fi eld visits and workshops were very posi ve from those producers that are already doing well, but were rather reluctant from those who are performing less well. The expected requirement of a 50 percent private co-fi nancing makes the expecta ons somehow modest among the processors of this last group.
1.3.7 Training needs
Based on this analysis, the cereals sector in Bosnia and Herzegovina is facing a number of opportuni es such as increasing total produc on of wheat and maize, partly by increasing the area under cul va on and partly the yield per hectare. Furthermore, improvement of quality to be in line with the processing industry’s requirements and with EU requirements will also increase compe veness within a more liberalized
market. Tailor-made training courses could facilitate these opportuni es.
In order to focus the training eff ort, it must primarily be training related to the EU acquis topics, which should come fi rst. Here training of farmers/producers in Good Agricultural and Environmental Prac ce (GAEP), and of staff in the primary and secondary processing industry regarding HACCP and other quality control topics related to food safety, the environment and hygiene should have priority.
1.3.8 Strengths, Weaknesses, Opportuni es and Threats (SWOT) analysis
This SWOT analysis is based on the analysis of the current state of the cereals sector in BiH and provides input to the strategy formula on process. The SWOT tables give a comprehensive picture of the strengths, weaknesses, opportuni es and threats for the producers and processors of cereals. The topics presented refl ect the input from the par cipants in the SWOT workshops, even though some topics were excluded due to lack of relevance and factual support.
With regard to the cereal producers, their main strengths are related to their produc on of cereals primarily as animal feed. Furthermore, they also o en have access to rela vely cheap labour from family members. All family farms visited in the case studies rely on family members as labour force in the produc on of cereals. Due to a rela vely low but increasing use of fer lizers and pes cides, the land is generally in environmentally good condi on and is to some extent suitable for niche products and for organic produc on. Close access to processors is another posi ve condi on for the farmers.
On the other hand, the producers are suff ering from small-scale and fragmented farming making it diffi cult to take advantage of economics of scale in produc on and of new expensive machines. This is refl ected in the low degree of mechaniza on, low produc vity and low profi tability, which is typical for the small-scale family farms domina ng the landscape with their mixed produc on.
11
Table 1.1: SWOT analysis for BiH cereals producers
S – Strengths W – Weaknesses
Experience and tradi on in crop produc on, where wheat as part of crop rota on with maize improves plant health
Small and fragmented holdings (2 hectares and 6 parcels on average)
Cheap family workforce Poor farm mechaniza on
Unpolluted land suitable for organic produc on of cereals Lack of on-farm storage facili es, especially for wheat
Existence of a local processing industry (fl our and feed mills)
Ineffi cient produc on and high produc on costs (capital and hired labour) and therefore limited profi tability
Existence of scien fi c research ins tu onsLack of educa on (especially related to the use of agroinputs like seeds and fer lizers), but also with regard to agricultural economics
Small number of specialized producers
O – Opportuni es T – Threats
Harmonized subsidies within BiH Con nued degrada on of non-cul vated agricultural land
BiH subsidies close to Croa an level; i.e. EUR 275 per hectare (2011) equal to BAM 550 per hectare
Limited guidance by the authori es, especially when announcing the level of fi nancial support and minimum prices only a er the start of the sowing season
Improved regula on of land ownership and land market
Complicated and not harmonized applica on procedures for farmers
Large fallow and non-cul vated areas – up to 500,000 hectares, which partly fi ts for cereals
Lack of enforcement of authority control (export, import, quality, seedlings)
Existence of larger tracts (consolidated and regrouped) of arable land in the lowlands in the FBiH (Sava canton – municipali es Odzak, Samac Domaljevac and Orasje and in north part of Tuzla canton – Kalesija municipality)
Incomplete price transmission; rising world market prices not always refl ected at local price level
Diversifi ca on of products, for example poten al for durum wheat on specifi c areas and organic produc on on others
Large imports of cereals, especially wheat, partly due to low quality of local produc on (assortment), unfavourable trade agreements and unfavourable climate
Improved extension and machinery services and tailormade training programmes for producers (actually 10,000 hectares per 1 advisor)
Few agricultural service providers
Increased support for capital investments through na onal support programmes and the upcoming IPARD programme
High prices of inputs further reducing the profi tability, especially of wheat
Considerable share of ca le breeding in the agriculture sector and the need for arable crops for animal feed
Land to some extent contaminated with mines
Favourable climate and land condi ons in the northern parts of BiH
Know-how of local seed produc on (breeding and mul plica on)
In the long run: worldwide shortage of cereals and increased transport costs
Source: Own data collec on through SWOT workshop, interviews, fi eld trips, case studies and survey, 2011
12
The producers face several opportuni es, which can be u lized, if circumstances are in favour of the farmers. First of all, there are 500,000 hectares of non-u lized land available for cereal produc on (and for other types of agricultural produc on), if these hectares can be mobilized for produc ve purposes. A number of precondi ons must be fulfi lled, before producers can and will take steps to expand produc on in a period, where produc on is going down and compe on is going up. A harmonized support regime in BiH is one precondi on, elimina ng internal unfair compe on and making the na onal playing fi eld even, where support rates are compe ve with support rates
Table 1.2: SWOT analysis for BiH processing industry
S – Strengths W – Weaknesses
Existence of compe ve processing facili es (for example KLAS and ZITOPROMET) Limited capital resources (apart from market leaders)
Vicinity to consumers, which is relevant for products not suited for long transporta on (e.g. bakery products)
Outdated technology (apart from the market leaders) o en not in line with relevant quality standards
Suffi cient storage capacity (silos), especially within the former state-owned enterprises Overcapaci es in the primary processing industry
Lack of skilled labour, high fl uctua ons rate of labour
Inadequate voca onal training, par cularly in the smallscale baking and confec onery industry
Focus is almost exclusively on BiH market
Outdated marke ng ac vi es
Expensive transport of wheat to mills
Weak coopera on between farmers and processors
O – Opportuni es T – Threats
Domes c market of 3.8 million customers Inadequate sector policies and strategies at en ty and state level
Product development, including speciali es for niche markets
Market liberaliza on through CEFTA and upcoming EU membership
Import subs tu ons – concerning raw materials if price and quality is compe ve Imports of cereals, especially wheat
Access to interna onal markets via diaspora Processing of illegally imported wheat, due to weak border control
Strategic wheat reserves might not be handled by private enterprises
Incomplete priva za on of former state-owned enterprises
Consumers highly a racted by import productsSource: Own data collec on through SWOT workshop, interviews, fi eld trips, case studies and survey, 2011
(area payments) in neighbouring countries. Another regulatory-based topic is related to the need for appropriate structures for land consolida on, land property/ownership rights and trade. For the farm restructuring process to take off , it is urgently needed that these regulatory and administra ve structures are in place and agreed upon among the relevant poli cal actors.
One important point in the discussion of the compe veness of the cereal sector is the issue of product quality. Farmers have stated during workshops and interviews that local crops do not fall below the required quality compared with imported foreign products,
13
and that the local processing industry has no reason not to buy them, par cularly since local producers off er rela vely small quan es. On the other hand, representa ves from the processing industry pointed out several mes at workshops and during interviews that local crops are not of the required quality and simply cannot be used as a raw material for further processing.
Based on the SWOT tables above, one strategy could focus on improved framework condi ons facilita ng import subs tu on, and here one recommenda on could be that cereal produc on is only suitable for farms with more than 25 hectares of maize and 45 hectares of wheat. Farms of this size will be able to produce suffi cient amounts of cereals to generate an average income for a family of four persons. These types of viable and compe ve farms will be the only farms being eligible under IPARD. Today BiH has few farms of this size and to enlarge farms the land market must be improved. Furthermore, inputs must be made available to farmers at compe ve prices.
For processors, the upgrading of technologies and qualifi ca ons of the labour force is needed, par cularly for the smaller mills and for the secondary processing fi rms. The mills will need these investments in order to be compe ve on price with the cheaper imported fl our. Be er organiza on of coopera on between producers and processors is needed to achieve the required product quality of all products along the value chain from seed via harvested cereals to fl our and processed products.
1.4 Recommenda ons for interven ons
The following recommenda ons could contribute to make wheat and maize produc on more profi table in Bosnia and Herzegovina. An overall strategy for the development of the cereal sector in BiH can focus on import subs tu on as the primary market incen ves. Import subs tu on has a poten al to be achieved, if the compe veness of the producers is enhanced, and if the
regulatory environment is harmonized and able to facilitate the strengthening of the compe veness of the farmers, but an import subs tu on strategy is only feasible if the compe veness of the BiH cereals sector is increased with higher yields, higher produc vity and be er quality for price at the same level as the main compe tors.
It is important to facilitate the structural changes of the sector. These changes should address the major problems leading to the rela vely low compe veness of the sector as it is today. These diffi cul es are low yields, low produc vity and low quality.
Land consolida on is required and must be facilitated by the needed regulatory framework in order to make the land market work. Only in this way will it be possible for farmers to expand their land and increase the economies of scale of produc on.
Larger areas for cereals produc on and development of specialized cereal farms makes it possible to invest in be er and more produc ve technologies in the produc on of cereals. Support programmes focused on economically viable farms, where investment support is targe ng produc vity as well as product quality, supplemented with support to competence build-up of the farmers and the processors is one side of the overall strategy. A harmonized regulatory environment including homogeneous support rates per hectare and per crop, enforced regula on and control, appropriate extension services and linkages to the research and development sector is the other.
Furthermore, the overall effi ciency of produc on and compe veness has to be increased through the use of cer fi ed seeds. Also, overall compliance with na onal and EU food safety and environmental protec on standards has to be improved considerably.
Technical assistance and training is needed – especially in the produc on sector − to increase awareness and capacity regarding modern produc on techniques and technologies and a ainment of na onal and EU standards.
14
Taking into considera on the overall situa on in the sector and the analysis of the current situa on presented in this report, it is recommended that future interven ons be oriented towards the following topics:
State/en ty/BD level
Harmonizing all subsidies for producers and processors between RS, FBiH and the BD, including cantons and municipali es. Harmoniza on will contribute to crea ng a homogeneous market without distor ons of the compe ve environment; Harmonizing farm registers and agricultural informa on systems will improve the sta s cal data and make it possible for the authori es to take decisions against an updated background, and will contribute to the professionalism of the sector, linking support and subsidies to registra on of the farmers in the farm registers; Introducing a minimum price in line with the EU interven on price, which is EUR 101,31 per tonne in 2011 in order to contribute to the balancing of the compe on between BiH producers and their interna onal colleagues; Suppor ng farmers with per hectare payments. Hectare payments should be announced before the crop is sown to give the producers some planning security. Hectare payments would also reach producers who do not sell to registered traders or processors, as is the case now. Around 70 percent of cereals that are produced are not subsidized as they are produced on land not registered in the farm registers; Improving farm structures by enabling a land market by speeding up land consolida on. A func onal land market will help commercial farmers to expand their farms faster and consider support to land ren ng systems, including payments given to rented land; Improving extension services and providing an increased budget, par cularly in FBiH, where the need for a stronger organiza on of the extension service is needed.
Coopera on with the na onal research and development ins tutes can be enhanced through be er mutual coopera on between the two links in the chain. Competence build-up of the extension services could focus on good agricultural and environmental prac ce, op mal resource u liza on and energy effi ciency in produc on. They can also facilitate specialized services like business plans and product development, architectural building plans, so ware and training;
Encouraging public-private partnerships to link the exis ng know-how of the governmental research ins tutes be er with the market; Registering more cereal varie es in the na onal List of Varie es to have a broader choice, also refl ec ng the demand and needs from the processing side; Enforcing the implementa on of laws, such as controls at all levels; Repor ng regularly about market prices (Market Informa on System accessible to farmers) as the more transparent the market is, the be er it will be for the farmers.
Producers
Increasing overall compe veness by providing fi nancial support for the introduc on of new seeds and investments in produc on and harves ng techniques; Improving on farm cereal handling equipment and machinery (combines, seed machinery, sprayers, ploughs and trailers) but also equipment for land clearance (of temporarily abandoned arable land) through fi nancial support to the investments in these technologies and through support via the extension service to the u liza on of the technologies; Providing support to the investments in the construc on and refurbishment of storage buildings (silos including driers), machine sheds and weight-bridges, where possible promo ng collec ve ownership and management, including elements of a grain warehouses receipts system.
15
Table 1.3: Priority Axis 1 – Improving market effi ciency and implemen ng community standards, IPARD measures 101 and 103
Poten al Investments under IPARD Measure 101
Investments in Agricultural Holdings – Arable Crops Sector
Construc on and/or renova on of storage buildings (silos incl. driers), machine sheds, etc.
3,000 45,000 135,000,000 67,500,000 67,500,000
Poten al Investments under IPARD Measure 103
Investments in Processing and Marke ng of Agricultural Products
Benefi ciaries(numbers)
Investment /Benefi ciary
EUR
Total investment funding in
EUR
Public funding (EU = 37.5% + BiH state = 12.5%), EUR,
50%
Private funding,
EUR, 50%
Renova on of mills (buildings and equipment) 20 500,000 10,000,000 5,000,000 5,000,000
Construc on and/or renova on of silos 20 500,000 10,000,000 5,000,000 5,000,000
Equipment for improvement of hygiene and product quality, in compliance with Community standards (HACCP, Interna onal Organiza on for Standardiza on (ISO), Interna onal Food Standard (IFS))
20 25,000 500,000 250,000 250,000
Investments in laboratory equipment 40 50,000 2,000,000 1,000,000 1,000,000
TOTAL 10,100 n.a. 497,500,000 248,750,000 248,750,000
Processors
Investment support to investments in various technologies needed and planned by the processors, including addi onal silo capaci es, more and be er driers, packing lines for wheat fl our and packages of 5, 10 and 25 kg; Investments in improved laboratory services within the companies.
1.5 Main fi ndings for IPARD
The following recommenda ons are given for interven ons under IPARD:It should also be men oned here that training could also be supported by IPARD, although detailed research and training needs assessments might be needed upfront. The establishment of producer groups and producer organiza ons could also be
16
included, since this type of support is also eligible under IPARD.
The total investment under IPARD for the development of the cereals sector is es mated to be a maximum of EUR 500 million, fi nanced with 50 percent from the private sector and 50 percent from BiH and the EU. The unit costs of investments are calculated based on informa on from case studies, survey data, expert data and market prices collected.
Assuming that only viable farms proving to be feasible in the short term will be eligible, the number of poten al benefi ciaries for measure 101 will be 5,000–10,000 farms, while there will be only 100 poten al benefi ciaries under measure 103 for processing.
Poten al target group, farmers: 10,000 Average investment project: EUR 50,000 Poten al target group, processors: 100
Average investment project: EUR 500,000 for technologies and EUR 50,000 for laboratory equipment
Investment budget: EUR 500 million (50 percent from the private sector, 50 percent from BiH (12.5 percent) and the EU (37.5 percent)
Proposed size of projects for producers
The maximum and minimum limits of total value of eligible investments per project are:
Minimum EUR 10,000 Maximum EUR 100,000
Proposed size of projects for processors
The maximum and minimum limits of total value of eligible investments per project are:
Minimum EUR 25,000 Maximum EUR 500,000
17
2. Background and Context for the Sector Analyses in BIH
Figure 2.1: Map of BiH ci es
Fact box 1
• Popula on: 3.839.737 (BHAS*, 2011)• GDP per capita: Euro 3,300 (2010)
• Capital: Sarajevo• Major languages: Bosnian, Croa an and Serbian
* Bosnia and Herzegovina Agency for Sta s cs
2.1 General informa on about BiH
Bosnia and Herzegovina (BiH), one of the federal republics that cons tuted the former Socialist Federal Republic of Yugoslavia, is located in the western part of the Balkan Peninsula and covers an area of 51,129 km2. In 1990, Bosnia and Herzegovina held its fi rst democra c mul party elec ons and in early 1992 it became an independent country.
FBiH has borders with Serbia to the East, Montenegro to the South East, Croa a to the North and West, and a 20 kilometre coastline on the Adria c Sea. Its landscape varies from high al tude central mountains to arable land in the north and Mediterranean vineyards in the south, with most of the major towns being located in valleys. Clima cally, Bosnian summers last from May to September and are warm and humid, whilst winters tend to be foggy and snowy and last from November to February. Autumn and spring are usually short.
Within Bosnia and Herzegovina’s recognized borders, the country is divided into two en es and Brčko District (BD). The Federa on of Bosnia and Herzegovina (FBiH) covers about 50 percent of the territory and the Republic of Srpska covers about 49 percent of the territory. Brčko District covers the remaining one percent of the total territory.
The current administra ve divisions (Figure 2.2) are based on the lines drawn up as part of the Dayton Peace Agreement in 1995. The Federa on of Bosnia and Herzegovina, Republika Srpska and Brčko District all have their own cons tu ons. The total BiH popula on is es mated at 4 million, although a precise fi gure is not available, since a popula on census has not been conducted recently (the most recent census was in 1991). The FBiH is decentralized. It is divided into 10 Cantons (each with its own government) and 79 municipali es. The Government of FBiH shares and delegates some of its competencies with the Cantonal
18
administra ons. Both the government and the Cantons have the right to determine policy and to adopt laws that pertain to any of their competencies. Where competencies are further delegated to the municipali es (the lowest administra ve level), their ac vi es are fi nanced and supervised by the Cantons.
The Republika Srpska is centralized and has no Cantons. It shares and delegates some of its competencies directly with 61 municipali es and two ci es. The Brčko District (comprising the en re territory of the former Brčko municipality) is a self-governing administra on under the direct jurisdic on of BiH.
2.2 Context and objec ve of the sector analyses
2.2.1 Prepara on for EU accession
Bosnia and Herzegovina (BiH) is a poten al candidate country for EU accession following the Thessaloniki European Council of June 2003. In June 2008, the EU and Bosnia and Herzegovina signed the Stabiliza on and Associa on
Figure 2.2: Administra ve division of Bosnia and Herzegovina
Agreement (SAA). An Interim Agreement on Trade and Trade-related issues entered into force on 1 July 2008 and the Council adopted a new European partnership with Bosnia and Herzegovina on 18 February 2008.8
Bosnia and Herzegovina has benefi ted from EU autonomous trade measures since 2000. A er the Interim Agreement came into force on 1 July 2008, EU access to products from Bosnia and Herzegovina has expanded, and EU exports to the country have been granted trade preferences.
BiH and the EC signed the Financing Agreement for the Instrument for Pre-accession Assistance (IPA) 2007 Na onal Programme on 31 July 2008, which was a major milestone on Bosnia and Herzegovina’s road to Europe. The total fi nancial alloca ons within the IPA are EUR 11.47 billion (current prices) for the 2007–2013 period.
As a pre-candidate country, Bosnia and Herzegovina cannot yet take full advantage of IPA support. Prepara ons are being made and should be accomplished by the me BiH
8 See EU Delega on Web site for Bosnia and Herzegovina: h p://www.delBIH.ec.europa.eu/
This territorial and administra ve division is shown in the following map:
19
becomes an EU candidate country, and when the implementa on of the IPARD supports for agricultural and rural development is ini ated.
2.2.2 Sector context
In order for Bosnia and Herzegovina to benefi t from the pre-accession assistance under the IPARD, it must: Achieve candidate country status Have an IPARD Programme adopted by the European Commission Conclude the Framework and Sectoral Agreements Establish IPARD opera onal structure and receive na onal accredita on Receive accredita on and conferral of management decisions from the Commission Conclude a Mul -annual Financing Agreement
The IPA Implemen ng Regula on (718/2007) (Ar cle 184, Paragraph “2.b”) indicates that the IPARD Programme should be based on an analysis of the current situa on in rural areas and on in-depth analysis of the sectors concerned.9 Among other things the IPARD programme should include a quan fi ed descrip on of the current situa on, showing dispari es, shortcomings and poten al for development. The programme should also include quan fi ed objec ves. The analyses of the situa on and priori za on of the areas for poten al interven on should be made with the help of independent exper se.
Bearing this in mind, the main objec ve of the sector analyses is to provide a solid input to the prepara on of the IPARD Programme and to provide the grounds for jus fi ed and appropriate targe ng of the measures included in the IPARD Programme. Therefore, the sector studies are not a part of the IPARD Programme as such, but rather cons tute a basic input to the programming process.
Furthermore, it should be emphasized that the na onal authori es may use the sector studies as inputs for the prepara on of any
interven on targe ng the agricultural and rural sectors. As such, the sector studies do not exclusively contribute to the prepara on of the IPARD Programme.
IPARD support will, if so decided, address the weaker links in the produc on and supply chains. The objec ves of the IPARD interven on are to contribute towards upgrading to EU standards, strengthening overall compe veness and performance as well as fostering the sustainable development of the sector in the context of EU accession. In this respect, the sector analyses were carried out on the most demanding sectors in terms of the costs of mee ng the standards, for which the highest poten al and added-value of the interven on is an cipated.
The agricultural sector analyses carried out in Bosnia and Herzegovina have been selected based on a consulta on process with local authori es and are based on EU standard relevance as well as economic relevance. Analyses have been prepared for: Meat (including rendering) and Dairy Fruits and Vegetables Cereals (wheat and maize) Wine Diversifi ca on
The sector analyses provide a comprehensive analysis of the current state of the sectors. They iden fy the weaknesses and sector concerns to be addressed by the IPARD interven on and by other state, en ty and district level interven ons. Where appropriate the sector analyses take into account specifi c regional development needs.
2.2.3 Objec ves of the report
The cereal sector analysis is one of fi ve sector studies prepared in 2011 as a basis for the design of the EU Instrument for Pre-accession Assistance for Rural Development (IPARD).
The main objec ve of the report is to provide an analysis of the current state of the cereals
9 The fi nal concept for pre-accession assistance to agriculture and rural development a er 2013 is not yet known, and it may be diff erent from the current IPARD model, and the new regula on might diff er from the current IPA Implemen ng Regula on (718/2007). As a ma er of simplicity reference is made to IPARD in the sector analyses.
20
sector in BiH, focusing on the two main cereals: wheat and maize, but also addressing to some extent other cereals, such as barley. Therefore the report contributes to the analysis of the internal strengths and weaknesses as well as on the external opportuni es and threats to the sector. In light of the needs and problems of the sector and the challenges ahead, investment needs are es mated and policy recommenda ons are formulated. In this way, the report contributes to the formula on of a number of possible policy interven ons for the agriculture and rural development policy in line with the needs for the development of the sector.
The objec ves of the sector analysis are to provide:
Background and key fi gures for the cereals sector
Structural characteris cs of the sector: Producers/farmers and processing industry
Government policy for the sector at state and en ty/district level
Market and trade
Level of a ainment of relevant EU standards
Past trends and future developments in terms of investment
Iden fying the needs and poten al of the sector
Iden fying training needs in the sector
Outcome: As an outcome, the analysis of the cereals sector provides:
• A transparent overview of the sector containing a quan ta ve and qualita ve descrip on of the current situa on.
• A detailed analysis of the greatest poten al and obstacles (weakest links in the supply and value chains) to realize this poten al in produc on and marke ng, for the measures iden fi ed in the current (2012) IPARD regula on.
• Recommenda ons for targe ng the specifi c investments (segment/area/ benefi ciary), primarily focusing on the weakest links in the supply chain.
2.3 METHODOLOGY
2.3.1 Desk research and sta s cs
The study started by reviewing exis ng reports on the BiH agricultural sector with a focus on the cereals sector (see Chapter Literature and Web sites Consulted).
This study relies heavily on established datasets, for which the main sources were:
The Ministry of Foreign Trade and Economic Rela ons of Bosnia and Herzegovina, Sector for Agriculture, Food, Forestry and Rural Development (MoFTER/SAFFRD); FBiH Ministry of Agriculture, Water Management and Forestry; RS Ministry of Agriculture, Forestry and Water Management; The Department for Agriculture, Water Management and Forestry, Brčko District; Faculty of Agriculture, University of Banja Luka; Faculty of Agriculture and Food Sciences, University of Sarajevo; The Agency for Sta s cs of BiH; Eurostat FAO United Na ons trade sta s cs
2.3.2 Surveys
Data collec on was also accomplished as part of the survey conducted for the prepara on of the sector analysis for the meat and dairy sector. The purpose of this was also to provide a realis c picture of the cereals sector to supplement exis ng sta s cs and offi cial reports. A number of ques ons related to crop produc on, costs and mechaniza on were asked to 121 farmers iden fi ed for the meat and dairy sector survey and covering more than 2,500 ha of arable land and pastures. Out of these 121 farmers, 46 farmers did produce wheat and/or maize, and an addi onal 33 did produce barley. The fi eld survey provided useful results reported later in this report. These farmers focus their produc on on keeping animals and could provide good
21
insights into cereal produc on. Experts have made es ma ons whenever needed.
2.3.3 Case studies
The Faculty of Agriculture of the University of Banja Luka and the Faculty of Agriculture and Food Sciences of the University of Sarajevo have made a total of 13 carefully selected case studies based on personal expert interviews. Eight of these were in FBiH and 5 were in RS and BD. These case studies include detailed descrip ons of produc on characteris cs regarding technology levels, facili es, know-how, quality standards, bo lenecks and weak points in the value chain of various types of producers (semi-subsistence producers, commercial holdings and large-scale corporate producers) with a en on to compliance with EU standards.
Each of the case studies is reported and is a ached as Annex 3 to this report.
2.3.4 Consulta ons with key stakeholders
Discussions with key stakeholders were carried out with, among others, the following ins tu ons: Ministry of Foreign Trade and Economic Rela ons, Sector for Agriculture, Food, Forestry and Rural Development (MoFTER/SAFFRD), FBiH Ministry of Agriculture, Water Management and Forestry (FBiH MoA),10
RS Ministry of Agriculture, Forestry and Water Management (RS MoA), Department for Agriculture, Water Management and Forestry from the Brčko District Agricultural Faculty in Banja Luka Agricultural Faculty in Sarajevo
Agency for Sta s cs of BiH Agricultural Ins tute in Banja Luka Federal Ins tute for Seed and Plant Propaga on Material
It should be noted that mee ngs with the offi cial focal points at the two En ty Ministries in Banja Luka11 and Sarajevo12 and the Department for Agriculture, Water Management, Forestry and Veterinary from the Brčko District13 were arranged at the very beginning. These mee ngs were aimed at gaining some insights into the rather complex poli cal situa on in BiH.
2.3.5 Workshops
Considerable emphasis was placed on obtaining the opinion of a wide range of stakeholders. To this end, four workshops were organized, two each in Banja Luka and Sarajevo. Direct mee ngs with ins tu ons, producers and processors were also arranged. In total, the study team met over 100 farmers, processors, ins tu ons and other stakeholders. The fi rst two SWOT workshops were held in Banja Luka (30 May 2011) and Sarajevo (31 May 2011). The agenda was to discuss the diff erent aspects of the cereals sector with a broader public, to discuss the current state of the sector regarding produc on and trade, and to discuss the internal strengths and weaknesses as well as the external threats and opportuni es for the sector. In Banja Luka, 35 par cipants contributed to the discussions, and of these 20 represented the sector as producers or processors. In Sarajevo, 26 par cipants were present and among them 15 were producers and processors from the sector. The results from the workshops are u lized in the SWOT sec on later in this report.
A second round of two verifi ca on workshops took place at the same premises on
10 To make the reading of the text easier the following names are used: FBiH MoA for FBiH Ministry of Agriculture, Water Management and Forestry and RS MoA for RS Ministry of Agriculture, Forestry and Water Management.
11 RS Ministry of Agriculture, Forestry and Water Management; Mr Zoran KOVACEVIC, Assistant Minister of Agriculture, 9 June 2011
12 FBiH Ministry of Agriculture, Water Management and Forestry; Mr Hanefi ja TOPUZ, B.Se. Agr., Head of Department for Agricultural Policy, 8 June 2011
13 Brčko District of BH Government, Department for Agriculture, Water Management, Forestry and Veterinary, Mr Dr.sc. Ferhat CEJVANOVIC, 21 September 2011
22
20 October 2011 in Banja Luka and 21 October 2011 in Sarajevo. 24 par cipants in Banja Luka and 23 in Sarajevo a ended the workshops. Again producers and processors were well represented. The aim of the workshops was to present the conclusions from the sector analysis and the preliminary recommenda ons for possible policy interven ons, and to receive qualifi ed feedback from the stakeholders about these conclusions and recommenda ons. It was considered essen al to ensure that stakeholders have the chance to comment, and on the whole they par cipated ac vely.
Stakeholders raised ques ons about the reliability of offi cial data refl ec ng the real picture of cereals produc on in BiH, and it provided for some discussions. The decision by the expert team was to report offi cial sta s cs and to comment on them, based on the assessments provided by other stakeholders. This approach was later agreed with representa ves from en ty ministries and MoFTER.
The workshop also agreed on the conclusions from the SWOT analysis as well as the proposed ac ons for interven ons in the sector.
2.3.6 Other ac vi es implemented
Field visits to selected sites where measures will impact strongly
The sector expert and the na onal coordinator undertook a fi eld trip in September 2011 to the most important areas in BiH, from Banja Luka to Brčko and Bijeljina. During this fi eld trip fi ve farmers and fi ve processors were visited and interviews conducted along the lines of the template for the case studies.
Contacts with other donors and non-governmental organiza ons (NGOs)
Finally, interviews were held with donors and NGOs. The interviews had only an informa ve and illustra ve purpose and did not as such refl ect a scien fi c selec on of donors and NGOs among all these types of ins tu ons. The donors and NGOs were:
USAID and the Swedish Interna onal Development Coopera on Agency (SIDA); Fostering Agricultural Markets Ac vity (FARMA), Mr Bruce BROWER, CoP. Urduzenja Gradana za Razvoj Ruraine Informa cke Zajednice u BiH (UGRRIZ), (Associa on of ci zens for development of the rural informa on community in BiH) Agr. Ing.ba, Mr Besim TABAKOVIC, dipl. ing.
2.4 Key fi gures on the BiH economy
2.4.1 Ge neral economic indicators for BiH
This sec on of the report provides basic economic informa on about the development of the BiH economy to be used as reference data in the specifi c sector analysis. The development from 2004 to 2010 in Gross Domes c Product (GDP) is presented in the table below. The economy demonstrates very posi ve performance from 2004 to 2008 with an average yearly growth of 13 percent (in current prices), un l the interna onal fi nancial crises changed the scene drama cally. The year 2009 was one of decline, while 2010 brought the economy back on a posi ve track at the same level as in 2008.
The contribu on of each en ty to state level GDP is quite stable over the period, even though an increase in the share of RS is observed from 32 percent in 2004 to 34 percent in 2009. FBiH and BD have both experienced a decrease in their contribu on to the overall economy from 2004 to 2009.
Table 2.1: Development of GDP in BiH from 2004 to 2010
Item 2004 2005 2006 2007 2008 2009 2010
GDP BiH, million BAM 15,946 17,157 19,272 21,778 24,718 24,004 24,484
GDP BiH, million EUR 8,136 8,754 9,833 11,111 12,611 12,247 12,678
GDP BiH per capita,BAM 4,150 4,464 5,015 5,668 6,433 6,246 6,371
Popula on, BiH, million 3.842 3.843 3.843 3.842 3.842 3.843 3.843Source: Agency for Sta s cs, BIH, own calcula ons, exchange rate BAM to EUR = 1.9558 all years.
23
2.4.2 Agricultural indicators
A key constraint to improvement of the agriculture sector management in BiH is the lack of accurate, reliable and mely informa on. Despite substan al EU and interna onal donor assistance with ini a ves such as a pilot Farm Accountancy Data Network (FADN) and a Pilot Agricultural Census, current informa on collec on, colla on and dissemina on is s ll o en undertaken in a rather ad hoc manner. Exis ng published sector informa on is rela vely limited and the informa on made available is o en considered to be of a rela vely poor quality, lacking sta s cal rigour or relevance to the emerging market economy. With those caveats made, below is a summary of the situa on in BiH agriculture based on available sta s cs.
Agricultural land in Bosnia and Herzegovina
BiH has a total area of 51,209 km2, of which lakes and rivers cover 12 km2 and land 51,197 km2.14 Of the total land area, plains cover 5 percent, hills 24 percent, mountains 42 percent and karsts 29 percent. Forests
The following table gives a breakdown of Gross Domes c Product by en ty:
Table 2.2: Gross Domes c Product by en ty, 2004–2009 million BAM and percent
Item 2004 2005 2006 2007 2008 2009
GDP FBiH, million BAM 10,350 10,945 12,261 13,879 15,647 15,231
GDP RS, million BAM 5,116 5,763 6,544 7,351 8,489 8,233
GDP BD, million BAM 480 449 467 548 581 550
FBiH share of total GDP 64.9% 63.8% 63.6% 63.7% 63.3% 63.5%
RS share of total GDP 32.1% 33.6% 34.0% 33.8% 34.3% 34.3%
BD share of Total GDP 3.0% 2.6% 2.4% 2.5% 2.4% 2.3%
Source: Agency for Sta s cs, BIH
and woodlands cover about 50 percent of BiH territory, and agricultural land totals 2.5 million ha or 0.7 ha per capita.15
Land cover in BiH is heterogeneous. About 86 percent are automorphic soils, and the remaining 14 percent hydromorphic soils. A large area of Bosnia is exposed to water erosion, par cularly its central and southern part.
As with other data for BiH, data on agricultural land are not always consistent. Depending on the source, this fi gure varies and diff ers considerably, for example Jaksic.16 According to offi cial sta s cs, agricultural land in BiH occupies 2.163 million hectares, 42.2 percent of its territory. This fi gure is a fi ve-year average farm size in the Republic of Srpska, the Federa on of BiH and Brčko District, according to data of the en ty and state agencies for sta s cs, which is shown in the detailed table that follows.
BiH has 2.16 million hectares of agricultural land. In this structure a li le less than a half is arable land and gardens (1.023 million hectares or 47.3 percent of total agricultural land). The
14 A report of the Agriculture Sector in Bosnia and Herzegovina 2007, Ministry of Foreign Trade and Economic Rela ons. 2008. p. 6
15 Ac on Plan for Environmental Protec on BiH (Na onal Environmental Ac on Plan of Bosnia and Herzegovina), Ministry of Urbanism, Housing and Services, Civil Engineering and Ecology and the Federa on Ministry of Spa al Planning and Environment. 2003. p. 10
16 Jakšić Duško, Postdejtonska stvarnost i perspek va, Atlan k, Banja Luka. 1997. p. 95
24
other half of the agricultural land used for livestock produc on is meadows (445,000 ha, 20.6 percent) and pastures (593,000 ha, 27.4 percent). The fruit orchards and vineyards (3,500 ha) cover 98,000 hectares (4.5 percent of total agricultural land).Although both en es occupy roughly the same area, Republika Srpska has a higher
Table 2.3: Agricultural areas in BiH, 2005–2009
Total BiH 2005 2006 2007 2008 2009 Av. 2005–2009
Arable land and gardens, 000 ha 1,034 1,034 1,025 1,016 1,005 1,023Orchards and vineyards, 000 ha 95 96 95 84 97 93Meadows, 000 ha 452 452 440 442 438 445Total arable land (‘000 ha) 1,585 1,586 1,563 1,547 1,544 1,565Pastures, 000 ha 586 585 592 590 611 593Wetlands, reeds and fi shponds, 000 ha 5 6 6 4 3 5Total agricultural land, 000 ha 2,176 2,177 2,161 2,141 2,160 2,163
Federa on of BiH 2005 2006 2007 2008 2009 Av. 2005-2009
Arable land and gardens, 000 ha 411 409 400 400 391 402Orchards and vineyards, 000 ha 42 43 43 43 43 43Meadows, 000 ha 262 263 257 264 254 260Total arable land, 000 ha 719 719 703 712 692 709Pastures, 000 ha 419 418 427 441 442 429Wetlands, reeds and fi shponds, 000 ha 2 2 2 2 2 2Total agricultural land, 000 ha 1,140 1,139 1,132 1,155 1,137 1,141
Republika Srpska 2005 2006 2007 2008 2009 Av. 2005-2009
Arable land and gardens, 000 ha 593 596 596 587 584 591Orchards and vineyards, 000 ha 50 50 49 48 51 49Meadows (‘000 ha) 189 188 182 177 183 184Total arable land, 000 ha 832 834 827 802 818 823Pastures, 000 ha 166 166 164 148 168 162Wetlands, reeds and fi shponds, 000 ha 3 4 4 2 1 3Total agricultural land, 000 ha 1,001 1004 995 952 988 988
Brčko District 2005 2006 2007 2008 2009 Av. 2005-2009
Arable land and gardens, 000 ha 30 29 29 29 30 29Orchards and vineyards, 000 ha 3 3 3 3 3 3Meadows, 000 ha 1 1 1 1 1 1Total arable land, 000 ha 34 33 33 33 34 33Pastures, 000 ha 1 1 1 1 1 1Wetlands, reeds and fi shponds, 000 ha 0 0 0 0 0 0Total agricultural land, 000 ha 35 34 34 34 35 34
Source: Agency for Sta s cs BiH, FBiH, RS and BD
share of total arable land (58 percent), and the Federa on of BiH more of the total meadows (59 percent) and pastures (72 percent). This is the consequence of the natural geography of each en ty, and as a result there is signifi cant produc on of crops in RS, whilst in the Federa on greater importance is given to livestock.
25
Agricultural land use
Most of the agricultural land in BiH is used for the produc on of grain (58 percent; 319,000 ha), where this produc on is more signifi cant in RS (65 percent) than in FBiH (43 percent). One quarter (26 percent; 142,000 ha) of the area is under forage crops, and 15 percent (82,000 ha) under vegetables. Areas under industrial crops are constantly being reduced, and by 2009 had fallen to 7,000 ha in the whole of BiH (1.7 percent of agricultural land). The detailed structure of agricultural land use is show in the following table:
Close to half of the arable land in BiH is not cul vated (450,000–480,000 hectares). There are many contribu ng factors, including the presence of mines,17 the absence of economic incen ves of producers to be involved in agricultural produc on, the ageing of rural households, and the number of proper es s ll remaining vacant a er the war.
Household and farm structure
During the period of the Socialist Federal Republic of Yugoslavia the size of private
Figure 2.3: Structure of agricultural land of BiH (average 2005–2009)
farms was limited to 10 ha on fl at and hilly land, whilst in mountain regions farmers were allowed to own up to about 30 ha. Moreover, private proper es and farms were not much favoured by the government during that me, and full a en on was paid only to state
farms, which accounted for about 5 percent of all agricultural land.18
In 2006, it was es mated that there were over 500,000 agricultural holdings in BiH. More than 50 percent of these agricultural holdings are es mated to be less than 2 ha, and over 80 percent are less than 5 ha. These small farms are o en further divided into 7–9 small parcels crea ng major problems for produc vity and overall effi ciency. Although the size of land areas actually cul vated by individual farms may be larger, the extent of land fragmenta on restricts the adop on of more modern agricultural systems.
Recent surveys prepared as a part of the pilot FADN and the sector analyses indicate that subsistence and semi-subsistence farms, which consume the majority of their produc on and produce only li le marketable surplus, remain
17 According to the BiH Mine Ac on Strategy (2009–2019), the Council of Ministers BiH, 2008, pg. 6, BiH at the end of 2008, had suspected 1,573 km2 (mined) areas, which is slightly more than 3 percent of the territory. According to the Managing Director of the Bosnia and Herzegovina Mine Ac on Center (BHMAC), the suspected area is today (June 2012) 1,544 km2 , equal to 3.04 percent of the territory, see Atlan c Ini a ve Newsle er, June 2012. The capacity of demining is 35–40 km2 per year from 2012 to 2019, if fully opera onal. Recent data from EUD indicate a suspected area of 1,442 km2 equal to 2.81 percent of the BiH territory.
18 Čustović Hamid and Ljuša Melisa. Par cipatory Land Use Development in Bosnia and Herzegovina. p. 1
26
Table 2.4: Structure of use of agricultural land in Bosnia and Herzegovina, ‘000 ha and percent
the dominant form of farm structure in BiH. However, in recent years, there is increasing evidence of more farmers producing for the market. Most commercially oriented farms tend to be larger, though they are o en restricted in their development due to their status as par ally priva zed en es, which limits their access to and use of modern management and investment capital; consequently many have leased parts of their lands to smaller private farmers. Overall, the need for consolida on of fragmented farm holdings into more viable economic units is recognized as one of the most pressing agricultural policy issues in BiH today.
The general problem of inadequate and uncoordinated data extends also to cadastral and land ownership data, much of which has not been updated since the war and therefore does not refl ect the current situa on. There is as yet no comprehensive farm or sta s cal register, so no offi cial data are available on the numbers of landowners or agricultural households. In the immediate post-war period there was evidence that the number of landowners was growing and the average size of holdings contrac ng, in marked contrast to the pa erns shown in almost every country of Europe;19 as the economy returns to a more normal condi on, a progressive migra on to the towns (shown consistently in Yugoslavia throughout its existence) may be expected to resume.
Table 2.5: Agricultural GDP, 2004–2009
Item 2004 2005 2006 2007 2008 2009
BiH GDP of agriculture and related services, million BAM of which: 1,425 1,524 1,664 1,784 1,895 1,817
Agriculture, share of total GDP, % 8.9 8.8 8.6 8.2 7.7 7.6
Previous year = 100 107.6 107 109.2 107.2 106.2 95.9Source: Agency for Sta s cs BiH, Agency for Sta s cs RS (Sta s cal Yearbook 2010, Agency for Sta s cs FBiH, own research, exchange rate BAM to EUR = 1.9558 all years. Data for 2010 not available
Agricultural GDP
The recent development of agricultural GDP is presented in the following table:The share of agriculture in overall GDP has decreased steadily from 2004 to 2009, and is rela vely low compared with other coun es in the region. In 2004, FBiH generated 43 percent of agricultural GDP, RS 49 percent and BD the remaining 8 percent. In 2009, FBiH generated 43.5 percent, RS 50.7 percent and BD 5.8 percent, represen ng a rela vely stable distribu on. The value of wine produc on is presented in the fi nal table of this sec on, and it is compared with BiH GDP and agricultural GDP of BiH in 2010.
2.5 Key defi ni ons
Primary and secondary processing industry:
The mills for fl our and feed products are defi ned as primary processing industries, whereas the secondary processing industry includes bakeries and breweries, as these produce fi nal products.
Small and medium-sized enterprises:According to the Commission Recommenda on 2003/361/EC small and medium-sized enterprises are characterized as having between 10 and 250 employees and by an annual turnover and/or annual balance sheet of more than EUR 2 million but not exceeding EUR 50 million.
19 Čustović Hamid and Ljuša Melisa. Par cipatory Land Use Development in Bosnia and Herzegovina. p. 3
28
29
3. Cereals produc on in BIH
Table 3.1: Total sown area, 000 ha, and area sown with cereals as percent, 2006–2010
Area 2006 2007 2008 2009 2010BiH, total sown area, 000 ha 557 556 557 525 512% with cereals 57.1 57.2 57.6 59.0 57.2FBiH, total sown area, 000 ha 197 193 196 190 189% with cereals 42.1 42.5 43.9 44.2 43.4RS, total sown area, 000 ha 348 351 349 323 311% with cereals 64.7 64.4 64.5 66.9 64.6BD, total sown area, 000 ha 10 10 10 10 10% with cereals 83.3 83.3 83.3 83.3 83.3
Source: Vesna Mrdalj, Faculty of Agriculture, University of Banja Luka, 2011; Power Point Presenta on, 30 May, 2011, and BiH Agency for Sta s cs, various years
This sec on of the report provides actual informa on about the produc on of cereals in BiH. As was explained in Chapters 1 and 2, focus is on wheat and maize, but some data will also be provided regarding other smaller (in volume and value) cereals in the country. These are rye, barley and oats. 90 percent of maize is planted in the north-eastern part of Bosnia and Herzegovina, whereas 30 percent of the wheat is found in other areas apart from the northeastern part, for example around Ozak, Oracje, Bihac, Cazin, and Livno.
3.1 Trends in produc on of cereals
The following table provides an overview of the development of the area sown with cereals in BiH, en es and in BD for the period 2006 to 2010.
The situa on is rela vely stable, although the area with sown crops in BiH has diminished from 2008 with 557,000 ha through 525,000 hectares in 2009 to 512,000 hectares in 2010. The 2011 fi gures (not included in the table) show an increase to the 2009 level of 527,000 hectares. The share of the area sown with cereals has been constant during this period. At BiH level, the share is 57.2 percent in 2010 and 57.5 percent in 2011.
For FBiH there has been a slight decrease in the total sown area from the 2006 level of 197,000 ha to the level in 2010 of 189,000 hectares, while the share with cereals has been rather stable with 43.4 percent in
2010. FBiH is the part of the country with the smallest rela ve share sown with cereals of the total area, equal to two-thirds of the area in RS, and half the share of the area in BD.
In RS a decrease in the total sown area from around 350,000 hectares in the years 2006, 2007 and 2008 is observed, a slight decrease in 2009 to 323,000 hectares and a further decrease in 2010 to 311,000 hectares. The reduc on was 11 percent from 2006 to 2010. As the area with cereals has followed this downward trend the share remained constant.
In BD the situa on is stable with regard to the sown area and the area with cereals: 12,000 hectares are sown every year in the period, and cereals cons tute 83.3 percent of this area. The tendencies are illustrated in the fi gure below.
The absolute and rela ve importance of the areas with cereals is presented in the table 3.2, where a breakdown for wheat and maize is also presented.
At the level of BiH a modest reduc on in the number of hectares with cereals can be noted, down from 318,000 hectares in 2006 to 293,000 hectares in 2010, which is a reduc on of 8 percent. The number of hectares has been constant in FBiH with a fi ve-year average of 83,400 hectares, while RS has experienced a reduc on from 225,000 hectares in 2006 to 199,000 hectares in 2010. This reduc on covers the reduc on at state
30
level, but is of course more important for RS in rela ve terms. The reduc on represents a decrease of the area with cereals of 12 percent. In BD the situa on is constant, as inferred above.The table presents a breakdown of the main cereals wheat and maize. The share with
Figure 3.1: Total area sown with cereals, 000 hectares, 2006–2010
225 226 225 216201
10 10 10 10 100
50
100
150
200
250
300
350
2006 2007 2008 2009 2010
(000
ha) BiH
RS FBIH DB
Source: Vesna Mrdalj, Faculty of Agriculture, University of Banja Luka, 2011; PPP, 30 May, 2011; and BiH Agency for Sta s cs, various years
Table 3.2: Land sown with all cereals, wheat and maize, 000 hectares, percent, BiH, en es and BD, 2006–2010
2006 2007 2008 2009 2010
Cereals, all
BIH, 000 ha 318 318 321 310 293
FBiH, 000 ha 83 82 86 84 82
RS, 000 ha 225 226 225 215 199
BD, 000 ha 10 10 10 10 10
Wheat
BIH, % 23.1 23.4 20.2 22.0 18,.
FBiH, % 24.2 24.5 23.1 23.0 22.1
RS, % 22.1 22.4 18.3 20.9 16.7
DB, % 37.0 37.0 37.0 37.0 37.0
Maize
BIH, % 61.8 62.5 63.7 61.2 65.4
FBiH, % 58.3 59.0 58.3 58.3 58.7
RS, % 63.4 64.0 66.1 62.4 68.9
DB, % 55.0 55.0 57.0 59.0 52.0Source: Vesna Mrdalj, Faculty of Agriculture, University of Banja Luka, 2011; PPP, 30 May, 2011; and BiH Agency for Sta s cs, various years
wheat is diminishing in RS, par cularly from 22.1 percent in 2006 to 16.7 percent in 2010. This is a reduc on of almost 25 percent. FBiH has also experienced a decrease but not that large, only 9 percent. At BiH level the total reduc on is 19 percent due to the impact of the share of wheat in RS.
31
With regard to maize the development is diff erent. Farmers have increased the rela ve share of the area with maize from 61.8 percent in 2006 to 65.4 percent in 2010. It is exclusively the farmers in RS that have generated this increase. Their share has grown from 63.4 percent in 2006 to 68.9 percent in 2010, or almost 9 percent, but in absolute fi gures it is
however a decrease from 142,650 hectares in 2006 to 137,111 hectares in 2010. This is due to the reduc on in the overall area sown with cereals in BiH. FBiH has seen a constant level of 58.5 percent, while BD has seen a decrease from 55 percent in 2006 to 52 percent in 2010. The trends in absolute fi gures are shown in the fi gures below for wheat and maize.
Figure 3.2: Wheat, sown area, BiH, en es and BD, 2006–2010, 000 hectares
Source: Vesna Mrdalj, Faculty of Agriculture, University of Banja Luka, 2011; PPP, 30 May, 2011, and BiH Agency for Sta s cs, various years
Figure 3.3: Maize, sown area, BiH, en es and BD, 2006–2010, 000 hectares
Source: Vesna Mrdalj, Faculty of Agriculture, University of Banja Luka, 2011; PPP, 30 May, 2011, and BiH Agency for Sta s cs, various years
32
The complete data regarding sown area (hectare), harvested area (hectare), produc on (tonne) and yield (tonne/hectare) are presented for the state level, en es and BD
in the next two tables for the years 2006–2010. Furthermore, the data are broken down for cereals in total, wheat and maize.
Table 3.3: Arable land, sown land, harvested land, cereals, wheat and maize, 2006–2010, 000 hectares, BiH and en es/BD
Bosnia and Herzegovina
Year
Arable land and gardens
total, 000 ha
Sown area Harvested area Sown area Harvested area Share, %
Total Cereals Cereals Wheat Maize-grain Wheat Maize-
Source: Vesna Mrdalj, Faculty of Agriculture, University of Banja Luka, 2011; PPP, 30 May, 2011, and BiH Agency for Sta s cs, various years
The yield measured in tonnes per hectare fl uctuates for both wheat and maize in all geographical areas. The fi ve-year average for wheat in FBiH is 3.5 tonnes/hectare, due to a poor year in 2010, which followed four years with increasing yields from 3.3 tonnes/hectare in 2006 to 3.9 tonnes/hectare in 2009. For maize the fi ve-year average is 4.5 tonnes/hectare in FBiH.
In RS we fi nd a fi ve-year average for wheat of 3.3 tonnes/hectare and also here with a poor year in 2010. For maize, the fi ve-year average is 4.6 tonnes/hectare, which also was
the yield in 2010, but the average is pulled down due to a very poor yield in 2007 with only 3 tonnes/hectare, just two-thirds of the average.
In BD, 2010 yields are low with 2.8 tonnes/hectare for wheat and 4.5 tonnes/hectare for maize. Both results are below the respec ve fi ve-year averages of 3.6 tonnes/hectare for wheat and 4.6 tonnes/hectare for maize.
There are no updated fi gures with regard to the numbers of farmers producing wheat and maize in BiH. However, the farm survey
34
conducted in the sector analysis shows that the median number of hectares for wheat and maize producers in FBiH is 3.6 hectares and 6 hectares, while the median in RS/BD for the same two crops is 2.5 hectares and 5 hectares. If these medians are used together with the data for sown areas with wheat and maize presented in Table 3.3, the number of farms producing wheat and maize can be es mated.
In FBiH, 18,100 hectares are sown with wheat and 48,100 hectares with maize on 5,030 farms producing wheat and 8,020 farms producing maize, or a total of 13,050 farms in FBiH.
33,600 hectares are sown with wheat in RS and 3,700 hectare in BD. With regard to maize, 138,400 hectares are sown in RS and 5,200 hectares in BD. In terms of number of farms there are 14,920 wheat farms and 28,770 maize farms. The total for RS and BD is 43,700 farms producing the two cereals. In BiH the total number of wheat farmers is es mated to be 20,000, while there are 37,000 farms
Table 3.5: Produc on of Rye, Barley and Oats, BiH, 2006–2010, sown and harvested, hectares
producing maize. Although wheat and maize are the two most important cereals measured in volume and value, some produc on of other cereals also takes place. These include rye, barley and oats. The table below presents the produc on of these three cereals for the period 2006–2010 distributed by sown area, harvested area, produc on and yield per hectare.20
The total area harvested with these three cereals was 31,500 hectares in 2010, a reduc on from 39,400 hectares in 2009, or by 20 percent.
Of the three small cereals, barley is by far the most important with a fi ve-year average from 2006 to 2010 of 65,500 tonnes of produc on, while the produc on of oats is 35,000 tonnes and rye 10,000 tonnes on average. The yields for these three cereals were also low in 2010 as shown by the rela vely low produc on in 2010 compared to the previous years. Produc on (tonnes) of rye is down by 38 percent, barley by 35 percent and oats by 43 percent in 2010 compared to 2009.
20 Data has only been available at state level (BiH-level), so no breakdown by en ty and district level has been made.
35
3.2 Value of cereals produc on
The physical produc on presented in the tables and fi gures above is converted into the value of produc on of wheat and maize measured in BAM in the next tables based on the offi cial prices as presented in Table 3.8 below. The breakdown of data is made based on area (state, en es and BD) and the same years as above: 2006 to 2010.
Table 3.7: Prices, selected cereals, 2006–2010, BiH, BAM /tonne
BiH Agency for Sta s cs, various years, RS Agency for sta s cs, various years
The prices from Table 3.8 are used in the calcula on of the value of the cereals in Table 3.9 next pages.
A er a four-year period with rela vely large varia ons up and down in the value of produc on of wheat, we saw in 2010 a drama c reduc on of 36 percent. This was due to a reduc on in the sown area and in the yield per hectare. The price was also low
36
in 2009 following the high price year of 2008, and this has probably infl uenced the decisions to sow wheat in 2010. As a consequence, the value of wheat goes down from BAM 71 million in 2009 to BAM 45 million in 2010. In par cular, RS is hard hit with a reduc on from BAM 46 million to BAM 26 million, or a decrease of 42 percent, but also FBiH and BD suff ered from lower produc on and yields.
With regard to maize, the total value was BAM 259 million in 2010, which was a small increase from 2009, when the value was BAM 235 million. FBiH, RS and BD have all experienced an increase in the value, primarily due to higher prices in 2010, and in spite of lower yields and a reduc on in the sown and harvested areas.
In total, the value of the two most important cereals is BAM 305 million for BiH in 2010: BAM 77.6 million for FBiH, BAM 217 million for RS and BAM 10.3 million for BD.
Below wheat and maize values are presented together with values for rye, barley and oats at BiH level. The total value of these fi ve cereals in 2010 was BAM 332 million with a fi ve-year average of BAM 338 million.
The rela ve importance of maize grain is the most substan al of all the cereals and in 2010
was the highest with 78 percent of produc on, when wheat in the same year faced its lowest share with only 14 percent of produc on. The total value of the three smaller cereals was only 8 percent of produc on in 2010.
The total GDP of BiH was BAM 24,484 million in 2010, see Chapter 2. The value of cereals produc on is 1.4 percent of total GDP. The agricultural GDP was BAM 1,817 million in 2009, and the fi ve main cereals contributed 14.3 percent to this value.21
With regard to sta s cs for cereals, RS and FBiH data also shows fodder crops and green maize for fodder. The area planted with green maize was 4,453 hectares in RS and 16,717 hectares in FBiH, Produc on was 128,848 tonnes and 340,081 tonnes respec vely and the average yields were 28.34 tonnes per hectare and 20.34 tonnes per hectare respec vely. No fi gures are available for the BD in this regard.
3.3 Data reliability
The presenta on of produc on volumes and hence the es ma ons of the value of produc on is based on offi cial sta s cs provided by the BiH Agency for Sta s cs and sta s cal departments for en es and BD.
Table 3.9: Value of cereals produc on, BiH, 2006–2010, BAM
% of total 1.3 4.4 3.2 21.4 69.8 1002007 3,204,271 22,840,641 16,981,704 84,256,812 253,116,226 380,399,654
% of total 0.8 6.0 4.5 22.2 66.5 1002008 4,991,661 29,534,626 28,067,084 115,637,210 244,838,297 423,068,878
% of total 1.2 7.0 6.6 27.3 57.9 1002009 4,711,296 20,437,575 16,593,230 70,562,430 234,745,391 347,049,921
% of total 1.4 5.9 4.8 20.4 67.6 1002010 3,065,741 15,864,352 8,299,136 45,421,506 259,407,998 332,058,733
% of total 0.9 4.8 2.5 13.7 78.1 1005-year
average 2,903,898 15,421,336 8,882,917 48,168,984 262,825,012 338,202,147
% of total 0.9 4.6 2.6 14.3 77.7 100Source: BiH Agency for Sta s cs, various years, RS Agency for Sta s cs
21 Other small cereals such as buckwheat are not included and cereals exclusively grown for fodder are not included either.
37
According to informa on from the BiH Agency for Sta s cs data are collected as follows:
“Sources and collec on methods: Data on the sown area are aggregated from the regular sta s cal surveys conducted by the Sta s cal Ins tutes at the level of En es and Brčko District. The data on Individual Producers Farms are es mated. These es ma ons were made by the experts from the fi eld of agriculture at the Municipality level.”22
It is obvious that data collec on is based on es ma ons undertaken by individual experts at local level and aggregated to higher levels in the BiH Agency for Sta s cs. Ministry staff at en ty level ar culated concerns regarding this approach due to the subjec vity-oriented character of this, and have ques oned the offi cial sta s cs, at en ty and district level as well as at BiH level. It is the assessment made by these experts that the fi gures for sown and harvested area probably are too high leading to an overes ma on of the produc on value. This picture is seen in other sectors and in other countries as well.
This is cross-checked in various ways. Sector experts interviewed during the prepara on of this report state that the produc on in 2009 was between 5,000 and 10,000 tonnes, far below the offi cial fi gures. A private seed dealer stated that 90 percent of maize and 70 percent of wheat acreage is located in the north of Bosnia and Herzegovina next to the river Sava. This is because the rest of BiH is made up of hilly regions and is unsuitable for growing cereals. The same dealer es mated the maize acreage to be 120,000 hectares and the wheat acreage to be 50,000 hectares.23 Another seed dealer men oned that there are around 150,000 hectares of maize and 60,000 hectares of wheat.24 This is considerably less than the total offi cial fi gures for Bosnia and Herzegovina.
It is however ques onable, if individual experts, even with experience from the fi eld, are reliable, and statements from these experts can be considered unreliable, since they are based on subjec ve assessments.
Another approach is to take as a point of departure the subsidies paid to wheat producers. The offi cial sta s cs are fi ve mes higher than what sector experts and data regarding the subsidies indicate. One reason is that offi cial produc on fi gures include data from farmers who are not registered in the farm registers or in the VAT system and not supported with subsidies of any kind. They represent a subsistence and semi-subsistence type of producer not par cipa ng in the white market economy, but included in the offi cial sta s cs due to the way data are collected by the local level agricultural experts in municipali es and cantons.
In order to avoid too much confusion between data sources it was agreed with ministry representa ves from state and en ty level to use the offi cial sta s cs as the reference data, even though en ty level representa ves doubt that the offi cial data are correct.
Eff orts are being made at state level with the Automa c Iden fi ca on System (AIS)-project funded by the EU in order to improve the agricultural informa on system, and farm registers are under development at en ty level and in BD. The number of farmers registered at the farm registers is increasing year by year and these registers will eventually record all professional full me farmers in the country, since registra on in this register and in the VAT system will be a precondi on for having access to subsidies. A farm register and a parallel registra on of the farmers in the VAT system will provide the authori es with the databases for mapping and monitoring the precise agricultural produc on, the areas and their u liza on with various types of agricultural
22 See any document from the BiH Agency for Sta s cs, where this statement is inserted as a standard methodological comment.
23 Pioneer sjeme d.o.o., Marko JUKIC, Field Sales Opera on Manager Cro and BiH, 15 September 201124 ZP/Zemun Polje – Maize Research Ins tute, Mr Dragisa LOGANCIC, INTERAGRO Fair Banja Luka, 22 September 2011
38
produc on and the structure of farms (size measured in hectares and fragmenta on measured in number of parcels). This informa on is urgently needed, since no agricultural census has been prepared on a full scale since 1991, and no reliable data are available on farm structure today.
3.4 Agricultural holdings in cereals produc on
As inferred in Chapter 2, in Bosnia and Herzegovina there are more than 500,000 agricultural holdings, 50 percent of which are smaller than 2 hectares and 80 percent of which are smaller than 5 hectares. Approximately 4 percent of holdings are larger than 10 hectares.25 However, there is no comprehensive reliable new data available regarding the number of cereal producers and their distribu on with size categories measured in area.
Producers of cereals in Bosnia and Herzegovina are generally small-scale farmers with mixed produc on and to a limited extent, agricultural coopera ves and enterprises.
Small farms – with the excep on of intensive vegetable and orchard produc on − are always mixed farms (livestock and plant produc on) as their small size does not allow them to make large profi ts from individual produc on. Many of these farms are subsistence or semisubsistence farms, which bring surplus produc on to the market, if anything is available. Therefore, they o en do not grow maize and wheat for the market but for fodder purposes and also for own human consump on.
To make the situa on for smallholders even more diffi cult, the average sized farm (2 hectares) is subdivided into six to eight plots.26 The average farm in Bosnia and Herzegovina is
smaller than in Croa a, The Former Yugoslav Republic of Macedonia, Serbia and even Montenegro and only slightly larger than in Albania.27
A few larger agricultural coopera ves operate in BiH and due to the topography they are more common in RS than in FBiH. In RS, less than 4 percent of the sown land is managed by agricultural enterprises and coopera ves. The remaining 96 percent is private family farms.28 Most of the agricultural coopera ves emerged from former state-owned coopera ves but have since been priva zed.
3.4.1 Farm survey among cereals producers
Commercial farmers rent land but as there are no offi cial fi gures about opera onal farm size, the analysis carried out a survey to obtain more realis c informa on. The farm survey included 133 farmers (two-thirds from RS and BD and one-third from FBiH) with an average farm size of 30 hectares, ranging from 0.1 hectare up to 475 hectares. The area owned by the farmers is on average 7.75 ha or 25 percent of the total farmed area; rented area is therefore consequently 23 hectares. The average farm has slightly more than 19 hectares of arable area and more than 9 hectares of meadows and pastures.
Furthermore, the survey shows that average farmers cul vated 2.88 hectares of winter wheat, 0.59 hectares of barley, 0.64 hectares of tri cale, 4.03 hectares of maize, 1.27 hectares of soya and 0.04 hectares of sunfl ower. The fact that tri cale is more popular than wheat is due to the fact that tri cale is used for feed. Only 16 farmers produce maize silage, having between 230 hectares and 1 hectare of silage, whereas some have between 230 and 15 hectares and the other group between
25 European Union Support for Establishment of the State Ministry of Agriculture and Rural Development (SESMARD) Working document: BiH Strategic Plan for Harmoniza on of Agriculture, Food and Rural Development (2008–2010). 2008. p 36
26The World Bank: Agricultural Sector Policy Note for Bosnia and Herzegovina, 2010. p 2. However the cul vated land by farm might be higher as very o en there are no formal rental agreements in place.
27 The World Bank: Agricultural Sector Policy Note for Bosnia and Herzegovina, 2010. p 1428 Sta s cal Yearbook Republika Srpska 2010. p 150
39
7 hectares and 1 hectare. This shows that maize silage is not yet widespread, partly due to a lack of know-how and partly due to a lack of heavy machinery for compressing the silo. With regard to the cereals, the data for wheat, maize and barley is extracted from the number of farmers in the survey. A total of 46 farmers produce wheat and/or maize. If a farmer is producing both wheat and maize, he/she is registered twice in the table below. Therefore the total is 66 and not 46 farms, since 20 farms produce both cereals. Their distribu on on en ty level is presented in the next table.
29 33 farms in the survey produce barley on a total of 62.6 ha. The average area with barley is 1.9 ha. 11 farms produce tri cale on a total of 67.2 ha with an average of 6.1 ha per farm.
Table 3.10: Number of farms with wheat and maize in FBiH and RS/BD
Table 3.11: Survey results for wheat produc on (area, tonnes and yield)
FBiH wheat RS/BD wheatNumber of sown
ha per farmWheat
produc on Yield Number of sown ha per farm
Wheat produc on Yield
3.6 ha 16,200 kg 4,500 kg/ha 1.0 ha 5,000 kg 5,000 kg/ha7.0 ha 31,500 kg 4,500 kg/ha 1.0 ha 6,000 kg 6,000 kg/ha3.0 ha 10,500 kg 3,500 kg/ha 1.0 ha 6,000 kg 6,000 kg/ha1.0 ha 6,000 kg 6,000 kg/ha 2.5 ha 12,500 kg 5,000 kg/ha
28.0 ha 112,000 kg 4,000 kg/ha 5.0 ha 22,500 kg 4,500 kg/ha0.6 ha 0 kg 5 kg/ha 3.0 ha 12,000 kg 4,000 kg/ha
16.0 ha 104,000 kg 6,500 kg/ha 1.7 ha 5,100 kg 3,000 kg/ha120.0 ha 720,000 kg 6,000 kg/ha 3.5 ha 14,000 kg 4,000 kg/ha
5.3 ha 19,610 kg 3,700 kg/ha 1.1 ha 5,800 kg 5,300 kg/ha20.0 ha 100,000 kg 5,000 kg/ha 1.5 ha 7,500 kg 5,000 kg/ha
1.0 ha 3,500 kg 3,500 kg/ha 4.0 ha 20,000 kg 5,000 kg/ha3.0 ha 13,500 kg 4,500 kg/ha 3.0 ha 15,000 kg 5,000 kg/ha2.0 ha 6,000 kg 3,000 kg/ha 20.0 ha 100,000 kg 5,000 kg/ha2.0 ha 11,000 kg 5,500 kg/ha5.0 ha 31,500 kg 6,300 kg/ha
10.0 ha 50,000 kg 5,000 kg/ha
227.5 ha in total 1,235,310 kg in total n.a. 48.3 ha in total 231,400 kg
The surveyed farms cover 382.4 hectares in total for maize for FBiH and RS/BD and 276.8 hectares in total for wheat.29
Survey results for wheat produc on
The results from our survey regarding wheat produc on are presented in the next two tables. The fi rst of these shows the number of sown hectares per farm, the produc on measured in kilograms and the yield (kg/hectare), for farms in FBiH and in RS/BD.
In FBiH, the average area sown with wheat is 14.2 hectares/farm, but the median is
40
only 3.6 hectares/farm, since one farm has a rela vely large area sown with wheat (120 hectares). The average yield is 4,573 kg/hectare, which is considerably more than the fi ve-year average for FBiH of 3,500 kg/hectare. The varia on is from 3,000 kg/hectare at the low end up to 6,500 kg/hectare at the top. There is a tendency in the fi gures that larger areas produce higher yields, but there are also examples of small areas with high yields, so the results are ambivalent in this regard.
The farms in the RS/BD survey sample have an average of 3.7 hectares sown with wheat and a median of 2.5 hectares/farm, with one farm sowing 20 hectares. The average yield is 4,788 kg/hectare, also more than the fi ve-
Table 3.12: Value of wheat produc on, FBiH and RS/BD, sales types, 2010
FBiH RS/BDContract sales
value Free sales value Value kept on farm
Contract sales value Free sales value Value kept on
Average value per farm23,690 BAM 34,094 BAM 9,831 BAM 5,600 BAM 8,986 BAM 2,985 BAM
2 8 9 1 8 5408,608 BAM
total sales1,796 BAM
per ha21,596 BAM /
farm92,412 BAM
total sales value1,912.1 BAM
per ha6,601 BAM /
farmSource: Own survey, 2011
year average of RS of 3,300 kg/hectare. Also here the varia on is large, from 3,000 kg/hectare to 6,000 kg/hectare, but the typical result is approximately 5,000 kg/hectare.
Even though many of the farms in the survey have rela vely few hectares with wheat, their produc on and the yield per hectare is far above the average of FBIH and RS respec vely.
The value of the produc on as reported from the survey is presented in the table below. Farm income from wheat produc on is divided between value from contract sales, value from free sales on the market, and value of the share of the produc on kept on the farm for own purposes, either as fodder or for human consump on.
30 Data not recorded in the case study.
41
Contract based sales are not typical. Only 3 farmers out of 33 sell wheat based on contracts. 16 farms sell the produc on on the market, and 14 keep the produc on on the farm. The value per hectare is quite similar between FBiH (1,800 BAM/hectare) and RS/BD (1,900 BAM/hectare). Most farms do either one or the other and only a few use more than one channel for value genera on.
Survey results for maize produc on
Reported here are the results from the survey regarding maize produc on. It will be done in the same way as for wheat above.
Produc on volume
In FBiH, the average sown area with maize among the survey farms is 15.4 hectares/farm, with a median of 6 hectares/farm. 113,578 kilograms of maize grain is produced per farm, with an average yield of 7,388 kg/hectare. This is again a rela vely high yield compared with the fi veyear average in FBiH, which is 4,500 kg/hectare. The varia on in yield is from 5,000 kg/
Table 3.13: Maize produc on, FBiH, survey results
FBiH MaizeNumber of sown ha
per farmMaize cob produc on
Maize grain produc on Yield cob Yield
1.1 ha 0 kg 7,700 kg 0 kg/ha 7,000 kg/ha2.0 ha 0 kg 16,000 kg 0 kg/ha 8,000 kg/ha
18.0 ha 0 kg 90,000 kg 0 kg/ha 5,000 kg/ha6.0 ha 0 kg 0 kg 0 kg/ha 8,800 kg/ha
70.0 ha 0 kg 59,500 kg 0 kg/ha 8,500 kg/ha5.0 ha 0 kg 40,000 kg 0 kg/ha 8,000 kg/ha
10.0 ha 130,000 kg 0 kg 13,000 kg/ha 0 kg/ha10.0 ha 160,000 kg 0 kg 16,000 kg/ha 0 kg/ha
3.5 ha 0 kg 31,500 kg 0 kg/ha 9,000 kg/ha15.0 ha 180,000 kg 0 kg 12,000 kg/ha 0 kg/ha
5.0 ha 0 kg 35,000 kg 0 kg/ha 7,000 kg/ha3.0 ha 41,000 kg 0 kg 14,000 kg/ha 0 kg/ha5.0 ha 0 kg 42,500 kg 0 kg/ha 8,500 kg/ha
70.0 ha 0 kg 700,000 kg 0 kg/ha 10,000 kg/ha7.0 ha 84,000 kg 0 kg 12,000 kg/ha 0 kg/ha
230.6 ha/farm 1,022,200 kg n.a15.4 ha/farm 113,578 kg/farm 7,388 kg/ha
Source: Own survey, 2011
hectare to an impressive 10,000 kg/hectare produced by the far largest of the farms with 70 hectares for maize grain produc on. As with wheat, there is no signifi cant rela onship between the number of hectares and the yield. Also small-scale producers (i.e. 2 hectares to 5 hectares) generate high yields between 8,000 and 9,000 kg/hectare.
In RS/BD, the average area sown with maize among the survey farms is 6.9 hectares/farm, with a median of 5 hectares/farm. Almost 60,000 kg of maize grain is produced per farm, with an average yield of 8,600 kg/hectare. This is also a rela vely high yield compared with the fi ve-year average in RS, which is 4,600 kg/hectare. The varia on in yield is from 5,000 kg/hectare to 10,000 kg/hectare produced by a rela vely small farm with only 6 hectares of maize grain produc on. As with maize produc on, in FBiH there is no signifi cant rela onship between the number of hectares and the yield. Also small-scale producers with 2 hectares to 5 hectares generate high yields between 8,000 and 9,000 kg/hectare.
42
Produc on value
The value of the maize grain produc on among the survey farms in FBiH and in RS/BD is presented in the next table, and again the value is divided between three types of value genera on channels: contract sales, free market sales and produc on kept at the farm.
The largest share of the produc on is not sold on the market. 32 out of 41 surveyed farms use their produc on for seed and own food and feed consump on. This amounts to BAM 706,000 in FBiH and BAM 379,000 in RS/BD, while only 7 (5 in RS and 2 in FBiH) sell their maize grain on the market for a total value of BAM 24,000 in FBiH and BAM 86,000 in RS/
Table 3.14: Maize produc on, RS/BD, survey results
RS/BD MaizeNumber of sown
ha per farmMaize cob produc on
Maize grain produc on Yield cob Yield
6.0 ha 0 kg 25,000 kg 0 kg/ha 4,000 kg/ha3.5 ha 27,000 kg 0 kg 9,000 kg/ha 0 kg/ha1.5 ha 9,000 kg 0 kg 6,000 kg/ha 0 kg/ha4.5 ha 26,000 kg 0 kg 6,000 kg/ha 0 kg/ha1.0 ha 0 kg 6,000 kg 0 kg/ha 6,000 kg/ha4.0 ha 0 kg 24,000 kg 0 kg/ha 6,000 kg/ha4.0 ha 0 kg 24,000 kg 0 kg/ha 6,000 kg/ha
14.0 ha 0 kg 105,000 kg 0 kg/ha 7,500 kg/ha13.0 ha 0 kg 104,000 kg 0 kg/ha 8,000 kg/ha
9.0 ha 0 kg 45,000 kg 0 kg/ha 5,000 kg/ha15.0 ha 175,500 kg 135,000 kg 11,700 kg/ha 9,000 kg/ha20.0 ha 202,000 kg 140,000 kg 10,100 kg/ha 7,000 kg/ha
5.0 ha 39,000 kg 30,000 kg 7,000 kg/ha 6,000 kg/ha1.5 ha 9,750 kg 7,500 kg 6,500 kg/ha 5,000 kg/ha5.0 ha 40,000 kg 28,000 kg 8,000 kg/ha 5,600 kg/ha1.5 ha 13,500 kg 10,500 kg 9,000 kg/ha 7,000 kg/ha8.0 ha 0 kg 72,000 kg 0 kg/ha 9,000 kg/ha0.0 ha 0 kg 0 kg 0 kg/ha 0 kg/ha3.3 ha 0 kg 19,500 kg 0 kg/ha 6,000 kg/ha2.0 ha 20,000 kg 18,000 kg 10,000 kg/ha 9,000 kg/ha5.0 ha 60,000 kg 50,000 kg 12,000 kg/ha 10,000 kg/ha3.0 ha 0 kg 24,000 kg 0 kg/ha 8,000 kg/ha
22.0 ha 220,000 kg 200,000 kg 11,000 kg/ha 9,090 kg/ha
151.8 ha in total 1,067,500 kg total produc on n.a.
6.9 ha/farm 59,306 kg/farm 8,594 kg/haSource: Own survey, 2011
BD. Only 2 farms engage in contract farming but for very small values of grain, less than BAM 10,000 in total.
3.4.2 Case studiesThe accomplished case studies provide a large pool of valuable informa on, which is refl ected in the tables below, and reported in Annex 3. The tables are structured case study by case study, presen ng the eight cases from FBiH fi rst, supplemented with a calcula on of relevant totals and average values. Next the fi ve cases from RS/BD are presented in the same way. Each case is broken down by type of cereals, and as will be seen, wheat and maize dominate, and only a couple of farmers
43
Table 3.15: Value of maize produc on, FBiH and RS/BD, sales types, 2010
FBiH RS/BDContract sales
value Free sales value Value kept on farm
Contract sales value Free sales value Value kept on
Average value per farm0 11,873 BAM 54,294 BAM 4,803 BAM 17,150 BAM 19,966 BAM0 2 13 2 5 19
729,570 BAM total produc on 3,164 BAM /ha 48,638 BAM /
farm474,706 BAM
total value 3,127 BAM /ha 18,258 BAM /farm
Source: Own survey, 2011
31 No informa on was recorded for this case study32 No informa on was recorded for this case study
produce other cereals, which is in line with the general sta s cs.
Among the eight case study farms in FBiH, the average area grown with wheat is 11.8 hectares or a total of 94.7 hectares for all eight farms. The average yield is 3.9 tonnes/hectare, and the average produc on is 46.6 tonnes per farm. Sales prices are on average BAM 320
per tonne. The average income per hectare including subsidies is BAM 1,683.
For maize the total area was 93.5 hectares with an average of 11.7 hectares, almost the same average as for wheat. The yield is on average 7.8 tonnes/hectare sold at an average price of BAM 300 per tonne. This price generates an average income of BAM 2,289 per hectare.
44
Table 3.16: Results from the case studies, FBiH 1, 2010
Total income, BAM 25,850 48,856.5 108,945 2,363 12,232.2
Income per ha, BAM 2,350 3,257.1 2,421 2,363 2,038.7
Barley
Barley, ha 1 0 0 0 5
Barley yield (t/ha) 5.3 0 0 0 5.32
Barley produc on, tonnes 5.3 0 0 0 26.6
Sales price, BAM /kg 0.3 0 0 0 0.27
Output value, BAM 1,590 0 0 0 7,182
Output value, BAM /ha 1,590 0 0 0 1,436.4
Subsidies, BAM 0 0 0 0 0
Total income, BAM 1,590 0 0 0 7.182
Income per ha, BAM 1,590 0 0 0 1.436.4
Labour input 8 5 6 5 4Source: Own farm survey, 2011
Among the eight farmers, two produce barley and one produces oats. The total area of these two cereals is 6 hectares and 2 hectares respec vely. Barley generates an average income per hectare of BAM 1,513, while oats generate an average income of BAM 1,140 per hectare. Both these cereals generate lower income per hectare than wheat (subsidized) and maize.
In RS, the total area with wheat for the fi ve case farms is 1,378 hectares with an average of 275.6 hectares. In par cular, it is two farms (RS 1 and RS 2) that contribute to this result with 319 hectares and 934 hectares respec vely. The average yield is 3.2 tonnes/hectare, and both the two large farms produce lower yields than the average. The average income per hectare is BAM 1,292.
45
Table 3.17: Results from the case studies, FBiH 2, 2011
Total income, BAM 690,920 1,364,000 29,708 14,700 519,350 2,618,678 523,736
Income per ha, BAM 1,909 2,480 2,122 1,225 3,995 n.a. 2,346
Labour input 32 200 4 8 12 256 51Source: Own farm survey, 2011
The maize produc on is presented here as follows. In total 1,068 hectares are used for maize produc on with an average of 213.6 hectares. Again the farms RS 1 and RS 2 dominate the picture with 363 hectares and 550 hectares of maize respec vely. The yield on average is 6.6 tonnes/hectare and the generated income is BAM 2,346 per hectare.
None of the farms in the case study sample in RS produce other cereals than wheat and maize.
Based on interviews with farmers, the following arguments for the produc on of the two cereals have been collected.
The main reasons that farmers grow wheat are: To enable crop rota on thus avoiding maize monocultures To avoid labour peaks For straw for animals and manure
For fl our produc on. In the past wheat was given to mills and the farmers received a corresponding amount of fl our. Nowadays wheat is usually sold to the mills, and fl our is a erwards purchased from the mills, although some farmers produce their own fl our on farm.
The main reasons that farmers grow maize are: To produce fodder for on-farm consump on. This is true for both large and small farms. Because maize is a very popular plant in hilly countries, as it can be used on the farm for human and livestock consump on with minimal processing. Smallholders can harvest maize partly by hand
3.5 Agricultural inputs
This sec on of the report presents data regarding the costs of various types of agricultural input to cereals produc on.
47
3.5.1 Seed
Seed quality is determined in the regula on together with the required standards for the chemical and physical characteris cs of seed. These standards are aligned with EU standards, but control and inspec ons may not yet be fully in place.
There is considerable use of uncer fi ed wheat seeds and farm-saved wheat seeds, which can give rise to disease problems, loss of gene c quality, lower yields and other problems. Offi cial control over the use of uncer fi ed seed is apparently poor, par cularly among small private farms. However, farmers who apply for subsidies and sell their products to mills have to prove that they use cer fi ed seeds.33 This requirement was introduced recently in both FBiH and RS.
Seed varie es have to be registered on the List of Varie es. A successful two-year test period in BiH enables the seed companies to register their varie es on this list and a erwards the seed variety can be imported and put on the market. During the workshops organized as part of this sector analysis, stakeholders men oned that the most suitable varie es were not always listed. Also, the capacity of government ins tu ons to research and develop as well as monitor and cer fy seed produc on appears to be very limited. Eventually, a public-private partnership might be able to link the exis ng know-how of the ins tutes more with the market, and steps to develop such partnerships are observed in the fi eld.
Maize
All the large interna onal seed companies (Dekalb, KWS, LG, NK, Pioneer, Syngenta and others) are present in Bosnia and Herzegovina. However, due to price and locally adopted varie es, the Serbian and Croa an seed companies play a major role in the market, especially AS (Agro Sava Breeding company, part of the Serbian company CHEMICAL AGROSAVA), NS (Novi Sad, Serbia), ZP (Maize Research Ins tute, Zemun Polje, Serbia), BC (BC Ins tute for Breeding and Produc on of Field Crops, Zagreb, Croa a), OS (Agricultural Ins tute Osijek, Croa a) and others.34
Maize seed is sold in sacks of 25,000 kernels. The retail price varies from BAM 65 to BAM 80. Farmers plant between 65,000 and 85,000 kernels per hectare and their costs are between EUR 94 and EUR 123 per hectare.35 Corresponding prices in Hungary are: EUR 100 for 65,000 kernels and EUR 130 for 85,000 kernels.36 Costs collected by university experts and en ty ministry staff show varia ons from BAM 100 (EUR 50) in the FBiH to BAM 160 (EUR 80) in RS to BAM 260 (EUR 130) in BD per hectare. These prices are generally lower than indicated by the interviews. According to the results from the survey, the average cost for seeds is 129 BAM equal to EUR 65 per hectare; see the table below. This is rela vely less than stated by the seed dealers and university experts. However, the cost varies from BAM 2.5 per kg to BAM 10 per kg, so there will always be a large varia on in the costs. Only 2 out of 38 maize producers in the
Table 3.19: Seed costs for maize produc on, BAM per ha and per farm, survey results, 2011
Farms, number Ha sown with maize, total Seed, kg used Seed value,
total, BAMSeed value per
ha, BAMSeed value per
farm, BAM
38 397 7,893 456,118 129 1,352Source: Own survey, 2011
33 European Union SESMARD Working document: BiH Strategic Plan for Harmoniza on of Agriculture, Food and Rural Development (2008–2010). 2008. p 64
34 Interviews with farmers and stakeholders, 201135 Interviews with seed dealers in the market, 201136 h p://www.bazismag.hu/fi les/download_fi les/25/MGhibridekhivatalosvegfelhasznaloiarai2011kukNF.pdf
48
survey do not buy seed at the market but use their own seed.
As maize is a profi table crop, farmers are looking for the most adequate varie es. In order to a ract clients all the companies arrange strip-tests along the main roads where farmers can stop by and see the diff erent varie es in prac ce.
Almost no non-hybrid maize is used in BiH and farm saved maize is used as a fodder plant only in a very limited way.
Wheat
The situa on for wheat is quite diff erent, as it is not as profi table as maize. Farmers do not have to purchase new seeds every year, as wheat can be mul plied on the farm (in contrast to hybrid maize). This is done frequently and the insuffi cient use of cer fi ed seed,37 especially among smallholders who do not bring their wheat to the market as they use it on the farm, results in poor yields and poor quality. It has been reported by stakeholders that since 2002 the quality of the wheat delivered to mills has declined sharply.38
Seed wheat is sold at BAM 0.63 per kg.39 Farmers need between 200 and 250 kg per hectare, some mes even more. The high input of seeds compared to other countries might be due to the low seed quality.
According to the project survey, 29 wheat farmers buy seed at an average price of BAM 0.79 per kg, and they use 240 kg/hectare.
Seed as a produc on factor
The general conclusion from the case studies is that the farmers pay specifi c a en on to the seed material as a key factor for the op miza on of the produc on.
The farmers use seed material from various sources, also from abroad including Italy and France. In wheat produc on the farmers use the varie es Srpanjka, Zitarka, Super Zitarka and Pobeda, Novosadska S–rana, Novosadska S–40 and Marija, while in maize produc on they use Pioneer hybrids, group 400, KWS hybrids (Klimt variety, 20 kernels in a row), the hybrid NS 640, Novi Sad hybrid – group 500 and Osijek hybrid – 592 and 596.
Some farmers report lack of informa on about new varie es and hybrids, and this is also the case for informa on about innova ons in technologies for the produc on of the two crops.
A few farmers seem to be more oriented towards innova on than others. Some of them follow the appearance of new varie es and hybrids on the market, and also the innova ons in machinery and technology related to produc on of the two crops. One farmer also has experimental parcels, where he tests growing of new varie es and hybrids, their produc vity, resistance to diseases and adaptability to the clima c and soil condi ons of the area.
Also farmers interviewed outside the case studies are interested in par cipa ng in
Table 3.20: Seed costs for wheat produc on, BAM per ha and per farm, survey results, 2011
Farms, number Ha sown with maize, total Seed, kg used Seed value,
total, BAMSeed value per
ha, BAMSeed value per
farm, BAM
29 276 66,236 52,258 189 1,802Source: Own survey, 2011
37 Central and Eastern European Countries (CEEC) AGRI POLICY: Agro economic policy analysis of the new member states, the candidate states and the countries of the western Balkans. Instrument Specifi c Support Ac on. Thema c Priority Scien fi c Support to Policies. D12-2 Second 6-monthly report. Monitoring of agricultural policy, market and trade developments in Bosnia and Herzegovina, 2006; p 7
38 Workshop in Banja Luka, 20 October 201139 The price range is wide. Between 0.63–0.93 BAM and even up to 1.2 BAM, according to informa on from
stakeholders
49
experimental trials with new varie es.40 However, all varie es must be registered in the na onal List of Varie es. It is clear that state or en ty level ins tu ons should conduct trials and recommend to the farmers which varie es to use, when the new varie es are included on the List of Varie es. Trials conducted by individual farmers can only lead to commercial use of the varie es, if the relevant authori es are involved and the new varie es included in the na onal List of Varie es. Anything else will be illegal.
One farm among the case studies is involved in a programme of seed produc on in coopera on with university ins tutes in Novi Sad and in Belgrade. For each year, the farmer signs a contract for the implementa on of seed produc on for wheat and maize. The farm also produces its own seeds for wheat, barley and soybeans, which are marketed as commercial seeds, while listed companies own the produc on of maize seed.
3.5.2 Fer lizers and agrochemicals
There are no actual accurate offi cial fi gures available regarding fer lizer use in Bosnia and Herzegovina. However, it is likely that the high level of fer lizer applica on in the late 1980s will never again be reached as in fact there was a great wastage of fer lizers due to ineffi ciency and lack of accountability. The predominant nitrogen fer lizers, as in Western Europe, are ammonium nitrate and calcium ammonium nitrate. The consump on of phosphate has fallen even more than that of nitrogen. However present levels are too low to be sustainable.41
Wheat yields in neighbouring Serbia are similar to those in BiH. During the 1980s yields were as high as fi ve tonnes per hectare, but in the last decade the wheat yield has
40 Mr Miroslav COSIC from MLIN COSIC in Brčko District informed the author that he imports Austrian and Hungarian varie es for own farm and interested neighbours; 21 September 2011.
41 Isherwood, K.F. Agricultural Sciences – Vol. II. Fer lizer Use in Central and Eastern Europe: Types and Amounts. p 1 ff
42 Leibniz Ins tute of Agricultural Development in Central and Eastern Europe (IAMO). Studies on the Agricultural and Food Sector in Central and Eastern Europe. Volume 57. 2010. p 198
43 h p://www.na onmaster.com/country/au-austria/agr-agriculture
only exceeded four tonnes per hectare on two occasions. Besides uncer fi ed seed, the poor yields are caused by the limited use of fer lizers (one-third of the op mum amount).42
According to data, an average of 64.3 kg of fer lizer was used on each hectare in BiH in 2000. Hungary used on average 98.2 kg and Austria 151.7 kg per hectare for the same year.43 According to the project survey results 270 kg NPK fer lizer was used per hectare for wheat produc on and 359 kg NPK per hectare for maize produc on in 2010. These fi gures indicate a drama c increase in the use of fer lizer in BiH wheat and maize produc on since 2000.
In 2009 and 2010, RS supported farmers with in-kind contribu ons of fer lizers, see details for the support in Chapter 5 of this report. Offi cials jus fi ed this approach, as there is a fer lizer oligopoly (2–3 importers) in BiH, which imports fer lizers from the two neighbouring producers in Serbia and Croa a.
Also, the use of agrochemicals is limited as farmers try to reduce costs wherever possible. Besides pes cides, BiH farmers apply herbicides on 60 percent of the total area under wheat (mostly Secator and Lintur/lontrel). Fungicides and insec cides are very rarely used (the main fungicide in use is Duet ultra and the main insec cide is Carate and Decis).
The survey provides us with data on the use and the costs of fer lizer and pes cides for the two main cereals.
With regard to maize, the farmers use fer lizers for BAM 615 per hectare on average with NPK fer lizer as the main type of product used, and they use pes cides for BAM 205 per hectare on average. Most farmers use only one pes cide.
50
With regard to wheat, the average cost per hectare for fer lizer is BAM 497 per hectare and for pes cides it is as low as BAM 47 per hectare. Again the main fer lizer is NPK and the farmers typically use only one pes cide.
3.6 Farm mechaniza onThe World Bank es mated that due to the war (1992–1995) 80 percent of agricultural machinery stock was lost.44 An analysis of physical capital thirteen years later showed that individual farms were rela vely well equipped in terms of mechanized equipment, especially tractors. There are around 30,000 tractors in opera on in BiH many purchased a er the war and many as secondhand equipment. However, the machinery is today generally too old, par ally depleted and dysfunc onal, and tractor-trailers and other
Table 3.21: Fer lizer and pes cide costs, maize grain produc on, per hectare and per farm, survey results, 2011
Farms, number
Total sown area, ha
Fer lizer value –
NPK, BAM
Fer lizer value –
UREA, BAM
Fer lizer value –
KAN, BAM
Total costs, BAM
Costs per ha, BAM
Costs per farm, BAM
38 397 135,933 51,682 56,728 244,343 615 6,430
Pes cide value –
Pes cide 1, BAM
Pes cide value –
Pes cide 2, BAM
Pes cide value –
Pes cide 3, BAM
Total costs, BAM
Costs per ha, BAM
Costs per farm, BAM
65,483 14,340 990 81,457 205 2,144Source: Own farm survey, 2011
Table 3.22: Fer lizer and pes cide costs, wheat produc on, per hectare and per farm, survey results, 2011
specialized implements (combine harvesters, drilling machines, etc.) as well as covered places to store the equipment are lacking. The state of agricultural machinery is a major cause for the low produc vity and poor compe veness of agriculture in RS.45
The situa on is similar in the other parts of BiH, since agricultural mechaniza on is not well developed as family farms are small and fragmented into several plots. Also, equipment from previous state farms does not fi t the size of the plots. For these reasons, farm mechaniza on is outdated. One specifi c observa on is that large numbers of old IMT tractor-pulled single-row maize-harvesters are s ll in use.
From the project farm survey new informa on about the age of the main types of equipment
44 CEEC AGRI POLICY: Agro economic policy analysis of the new member states, the candidate states and the countries of the western Balkans. Task 4–1; Specifi ca on for the second rural vitality report, Second report for BiH. 2006. p 4
45 Republika Srpska: Rural Development Strategy 2009–2015; p 115
51
has been collected. The table below presents the results regarding the age of tractors, combine harvesters and maize harvesters.
In the survey farmers have been asked how many tractors they have that are less than 5 years old, between 5 and 15 years old, and older than 15 years. In order to es mate the age of the equipment it is assumed that each piece of equipment less than 5 years old is 2.5 years old, that equipment between 5 and 15 years old is 10 years old and that equipment older than 15 years is, as a minimum, 15 years old.
The average age of 130 tractors in the popula on is 7.3 years (24 tractors on average 2.5 years old; 50 tractors on average 10 years old and 56 tractors minimum 15 years old).
In the same way the average age of the 18 combines is es mated to be 11.1 years. Finally, the average age of the 13 maize harvesters in the popula on of maize producers is 10.0 years old.
Based on informa on from the case studies, farmers purchased the following types of equipment over the past ten years:46
Combina on seed harrows Disk harrows Grain/maize drilling machines Harvesters (for wheat and maize)
46 See also Chapter 7 on previous and future investments
Table 3.23: Mechaniza on age, survey results, selected machines
Due to a lack of own mechaniza on, contract costs for harves ng are a serious expenditure for the farmers. According to the project survey, the harves ng costs per hectare for these farmers that have no equipment themselves are BAM 208 for maize growers and BAM 130 for wheat growers. See the table below.
In this connec on, it was men oned by stakeholders that a part of the wheat yield is lost due to the grain sha ering because of bad ming of the harvest. Owners of combines
prefer larger, more accessible and fl at areas for grain produc on. A er these areas are harvested, they move to other areas, and provide services for farmers without their own equipment. Farmers with up to 30 hectares and with their own combine harvesters off er
52
the use of their machinery to the smaller farmers in the neighbourhood. The farmers with contract harves ng tend therefore to have later harvests than farmers with their own equipment, and this causes reduced yields. The average losses are es mated by experts to be 3 percent for wheat and 5 percent for maize due to these reasons.
The number of service providers, such as machinery rings, is limited and EU-funded projects have not been very successful. Se ng up management capaci es to develop and run “machinery rings” was par cularly unsuccessful, and despite the delivery of machinery to associa ons of farmers, commercial sustainability was never achieved.
Specialized companies for land clearance would face a huge demand as arable land is o en not in use (unsown) and bushes do not allow for cul va on. Also, in most cases farmers do not have tractors with 280–360 horsepower, which is the minimum requirement for the use of stone crushers, stump grinders and other mul func onal machinery.
3.7 On-farm storage facili es and transporta on
Due to limited space and limited fi nances, farms usually have no storage facili es for mercan le wheat. According to the case studies, farmers keep a few tonnes (typically 4 to 5 tonnes) for onfarm consump on and as a reserve.
Limited on-farm storage facili es do not as such represent a technical storage problem for the farmer, but rather a problem related to the ming of the sale. Having no storage facili es means that farmers are forced to sell their products directly from the fi eld at harvest me, when most farmers are selling, and
the prices are low. Be er and larger storage facili es will make it possible for farmers to sell their products when the supply is lower than immediately a er harvest, and when the prices are more a rac ve in the market.
The transport of cereals, like most other products in Bosnia and Herzegovina is mostly oriented to road transport. Therefore, trucks but also tractors with trailers are the main transport means for transpor ng cereals. This, of course, increases costs and consequently increases mill, bakery and confec onery prices. According to es ma ons made by the Grain Associa on of Federa on of Bosnia and Herzegovina, transport costs are between EUR 20 and EUR 40 per tonne of transported grain from the farm to the primary processors (mills) and further on to the secondary processors.47
3.8 Profi tability of wheat and maize
In this sec on the report will try to provide an es mate of the average profi tability of produc on of wheat and maize in BiH. Three sources of informa on are used.
Gross margin calcula ons were collected by university and ministerial staff in order to present a best prac ce example of the gross margins of wheat and maize. The examples are presented for the two en es and for BD. Next, the gross margins are es mated based on data collected among the 66 farmers producing wheat and maize and covered by the project farm survey. Finally, data from the 13 detailed expert interviews made for the case studies is used.
Based on these three sources, an average is calculated, and in this way the report endeavours to provide an updated picture of the profi tability of the produc on of wheat and maize in BiH. For the FBiH the following calcula ons were collected.48
47 Further analyses of the transporta on sector might be considered.48 Data collected by Professor S. Bajramovic, Sarajevo University, 2012.
53
Table 3.25: Calcula on wheat (FBiH, 2011)
CALCULATION WHEAT (1 hectare)Item KG BAM/Unit BAMWheat yield 4,500 0.45 2,025.00Straw yield 2,250 0.05 112.50Subsidies (1 hectare) 550.00 550.00Produc on value 2,687.50Variable costsSeed 250 0.97 242.50Fer lizer 683.00Agrochemicals/plant protec on 122.00Machinery including harvester 1,110.00TOTAL 2,407.50Gross margin (Gross Value Added (GVA)) 280.00
Source: Expert (university and ministry) calcula ons, 2012
Table 3.26: Calcula on maize (FBiH, 2011)
CALCULATION MAIZE (1 hectare)Item KG BAM/Unit BAMMaize yield 8,000 0.35 2,800.00Straw yield 0 0.00 0.00Subsidies 0.00Produc on value 2,800.00Variable costsSeed 200.00Fer lizer 900.00Agrochemicals/plant protec on 180.00Machinery including harvester 1,200.00TOTAL 2,480.00Gross margin (GVA) 320.00
Source: Expert (university and ministry) calcula ons, 2012
Table 3.27: Calcula on wheat (RS, 2011)
CALCULATION WHEAT (1 hectare)Item KG BAM/Unit BAMWheat yield 5,000 0.39 1,950.00Straw yield 2,500 0.03 75.00Subsidies 250.00Produc on value 2,275.00Variable costsSeed 280 0.90 252.00Fer lizer 495.00Agrochemicals/plant protec on 150.00Machinery including harvester 820.00TOTAL 1,717.00Gross margin (GVA) 558.00
Source: Expert (university and ministry) calcula ons, 2012
54
A detailed calcula on from Brčko District, Department for Agriculture, Water Management,
49 Brčko District of BH Government, Department for Agriculture, Water Management, Forestry and Veterinary: Analiza učinaka – efekata plasiranih pods cajnih sredstva - povratne informacije (izvještaji) - katalog kalkulacija poljoprivrede. 2009. Pages 11 and 19.
Table 3.28: Calcula on maize (RS, 2011)CALCULATION MAIZE (1 hectare)
Item KG BAM/Unit BAMMaize yield 8,000 0.35 2,800.00Straw yield 0 0.00 0.00Subsidies 0.00Produc on value 2,800.00Variable costsSeed 160.00Fer lizer 765.00Agrochemicals/plant protec on 157.00Machinery including harvester 736.00TOTAL 1,818.00Gross margin (GVA) 982.00
Source: Expert (university and ministry) calcula ons, 2012
Item KG BAM/Unit BAMMaize yield 8,000 0.35 2,800.00Straw yield 0 0.00 0.00Subsidies 250.00Produc on value 3,050.00Variable costsSeed 2.20 125 275.00Fer lizer 474.00Agrochemicals/plant protec on 70.00Machinery including harvesters 1,200.00TOTAL 2,019.00Gross margin (GVA) 1,031.00
Source: Expert (university and ministry) calcula ons, 2012
Forestry and Veterinary from 200949 was provided and was updated by university experts:
55
Next, the survey results are presented below.Table 3.31: GVA for wheat and maize produc on in BiH, 2011, based on survey results
Wheat per hectare Maize grain per hectare
Sales value, BAM 1,851 Sales value, BAM 3,033
Subsidies, BAM 300 Subsidies, BAM 0
Income, BAM 2,151 Income, BAM 3,033
Fer lizers, BAM 497 Fer lizers, BAM 615
Pes cides, BAM 48 Pes cides, BAM 205
Seeds, BAM 189 Seeds, BAM 129
Harves ng, BAM 130 Harves ng, BAM 208
Total variable costs, BAM 864 Total variable costs, BAM 1,157
GVA, BAM 1,287 GVA, BAM 1,876Source: Own farm survey, 2011
Table 3.32: GVA/hectare, BAM, case studies, 2011
Cases GVA/hectare, BAM, 2010
Wheat Maize
FBiH 5 50 200
RS 5 40 1,436
RS 4 649 -856
RS 3 281 506
RS 2 1,265 1,034
RS 1 589 402
Total 2,874 2,722
Average 479 454
Subsidies 300 0Source: Expert interviews in case studies, 2011
Table 3.33: GVA/hectare, BAM, BiH synthesis, 2011
Cases GVA/hectare, BAM, 2011
Wheat Maize
FBiH 280 320
RS 543 982
BD 302 1,031
Survey results 1,287 1,876
Case studies 479 454
Average 578 933Source: Own calcula on based on expert data, survey data and data from case studies, 2011
The farm survey covers 29 wheat producers with a total of 276 hectares of wheat, and 38 producers of maize with a total of 397 hectares of maize.Lastly, the results from the 6 case studies are presented. Unfortunately,
7 out of 8 case study farms in FBiH did not record their variable costs, so no informa on could be collected for the gross margin calcula ons. That results in 6 case farms, of which 5 are in RS/BD and one is in FBiH.
Based on these three sources, the report has prepared the synthesis calcula on of GVA (Gross margin) for wheat and maize, and these es ma ons are presented in the next table.
56
The conclusion about the feasibility of wheat and maize produc on is summarized below. The survey results collected by RS extension service staff in RS and BD and by a junior researcher from the Faculty of Agriculture and Food Sciences, University of Sarajevo, in FBiH as a part of the data collec on for the Meat and Dairy sector analysis, show be er economic results for the farmers than the data collected by university/ministry experts and the data collected from case studies through detailed university expert interviews with farmers. From a methodological point of view, the results from the case studies provide the most robust results, also quite close to the results provided from university and ministerial staff . However, the average shows that wheat produc on generates BAM 578 per hectare including subsidies, while maize grain produc on generates BAM 933 per hectare. It is more economically a rac ve for farmers to produce maize instead of wheat, and this is also refl ected in the weight of maize as a crop in BiH compared to wheat and other cereals.
These results are also comparable with the results from the Pilot FADN survey,50 covering 20 farms with a total of 81.1 hectares for maize and 16 farms with a total of 60.1 hectares for wheat. The results of the Pilot FADN survey show an average GVA of 1,900 BAM /hectare for maize and 1,248 BAM/hectare for wheat without harves ng costs, which are typically 1,000 BAM in case the farmer has no equipment for harves ng himself. The FADN results confi rm the profi tability of maize compared to wheat, and the level of the GVA es mated in this report, see Table 3.34 above.
3.9 The comparison of cereals produc on in BiH and the EU and CEFTA (Central European Free Trade Agreement) countries
Benchmark data for CEFTA and EU countries are provided in this sec on. Priority is given to CEFTA data in agreement with MoFTER and en ty ministry representa ves in the descrip on.
3.9.1 CEFTA
The produc on of wheat and maize is compared with produc on of the same cereals in CEFTA countries in the sec on below. The idea is to see the BiH produc on in comparison with CEFTA produc on and to provide explana ons on varia ons in performance, if relevant.Bosnia and Herzegovina contributes modestly to the total harvested area under cereals in CEFTA countries. With an average of 310,000 hectares (period 2005–2010) BiH contributes with 7.4 percent, which is higher than Albania, The Former Yugoslav Republic of Macedonia, Kosovo and Montenegro, but signifi cantly less than Croa a, Republic of Moldova and Serbia in par cular. Unlike most CEFTA countries, Bosnia and Herzegovina, together with the Former Yugoslav Republic of Macedonia, is characterized by a trend of reducing the total area sown under wheat. With 321,000 hectares in 2005, harvested area in 2010 was reduced by 11 percent and amounted to 286,000 hectares.With regard to wheat produc on and the sown area under this crop, the contribu on of BiH in the total CEFTA countries area is even less, and expressed as a six-year average (2005–2010) BIH contributes with a modest 68,600 hectares, only 5.1 percent. Generally, the trend is for a reduced area in almost all CEFTA agreement countries, except for Croa a, but in BiH and in TFYR Macedonia, the downward trend is accentuated. BiH reduc on in 2010 compared to 2005 is 33 percent, in TFYR Macedonia the reduc on is 26.7 percent.With regard to the harvested areas under maize, Bosnia and Herzegovina contributed with an average of 194,200 hectares to the total CEFTA countries harvested areas under this crop, which amounts to 8.6 percent. These areas are signifi cantly higher than those in Albania, TFYR Macedonia, Kosovo and Montenegro, but signifi cantly less than in Croa a, Republic of Moldova and Serbia in par cular. As with most countries of the CEFTA Agreement, Bosnia and Herzegovina is characterized by stability in maize harvested areas measured.
50 Reports from the Pilot FADN survey prepared under the European Union Funded Project – Strengthening and Harmoniza on of the BiH Agriculture and Rural Sectors Informa on Systems. 15 November 2011.
57
Table 3.34: Harvested area of cereal crops of CEFTA countries; in 000 hectares, 2005–2010
Crop/year BiH Albania Croa a TFYRM Kosovo Rep. Of Moldova
Source: World Bank Sta s cs (2010): AgriPolicy Sta s cs/Candidate Countries/Data (by country), h p://europartnersearch.net/agripolicy/sta s cs/candidates, Na onal sta s cal offi ces (bureaux), FAOSTAT and for the Republic of Moldova edi on, Republic of Moldova in fi gures (2008, 2011).
Figure 3.4: Average harvested area of cereal crops by CEFTA countries for the period 2005–2010 (in 000 hectares)
Source: World Bank Sta s cs (2010): AgriPolicy Sta s cs/Candidate Countries/Data (by country), h p://europartnersearch.net/agripolicy/sta s cs/candidates, Na onal sta s cal offi ces (bureaux), FAOSTAT and for the Republic of Moldova edi on, Republic of Moldova in fi gures (2008, 2011).
58
Figure 3.5: Average harvested area of wheat by CEFTA countries for the period 2005–2010 (in 000 hectares)
Figure 3.6: Average harvested area of maize by CEFTA countries for the period 2005–2010 (in 000 hectares)
Source: World Bank Sta s cs (2010): AgriPolicy Sta s cs/Candidate Countries/Data (by country), h p://europartnersearch.net/agripolicy/sta s cs/candidates, Na onal sta s cal offi ces (bureaux), FAOSTAT and for the Republic of Moldova edi on, Republic of Moldova in fi gures (2008, 2011).
Figure 3.7: Average total grain produc on by CEFTA countries for the period 2005–2010 (in 000 tonnes)
Source: World Bank Sta s cs (2010): AgriPolicy Sta s cs/Candidate Countries/Data (by country), h p://europartnersearch.net/agripolicy/sta s cs/candidates, Na onal sta s cal offi ces (bureaux), FAOSTAT and for the Republic of Moldova edi on, Republic of Moldova in fi gures (2008, 2011).
59
Table 3.35 presents the total produc on of cereals by CEFTA countries and the two most important cereal crops – wheat and maize. On average (period 2005–2010) BiH with 1,256,200 tonnes of grain contributed to the overall produc on of the CEFTA countries by 7.5 percent. This produc on is signifi cantly higher than in Albania, TFYR Macedonia, Kosovo and Montenegro, but much smaller in comparison to neighbouring Croa a and Serbia, and Republic of Moldova. This posi on of the BIH produc on of all grain among the CEFTA countries is primarily due to rela vely high produc on of maize, not wheat. Specifi cally, looking at the average amount of wheat produced as one of the most important strategic crops, BiH is at the very bo om among
the CEFTA countries. With an average annual produc on of wheat of 227,700 tonnes, BiH is just in front of Montenegro, while all other CEFTA countries less (Albania, TFYR Macedonia, and Kosovo) or more (Croa a, Republic of Moldova, Serbia) a er BiH.
When it comes to maize produc on, BiH is in a much be er posi on in rela on to the CEFTA countries, with an average annual produc on of 904,300 tonnes (8.4 percent of total CEFTA produc on). It is signifi cantly ahead of Montenegro, Albania, TFYR Macedonia and Kosovo, but behind the Republic of Moldova and signifi cantly behind Serbia and Croa a (see Table 3.35 and Figure 3.9).
Table 3.35: Total cereal produc on of CEFTA countries; in 000 tonnes; Period 2005–2010
Crop/year BiH Albania Croa a TFYRM Kosovo Rep. of Moldova
Source: World Bank Sta s cs (2010): AgriPolicy Sta s cs/Candidate Countries/Data (by country), h p://europartnersearch.net/agripolicy/sta s cs/candidates, Na onal sta s cal offi ces (bureaux), FAOSTAT and for Republic of Moldova edi on, Republic of Moldova in fi gures (2008, 2011).
60
Figure 3.8: Average total wheat produc on by CEFTA countries for the period 20052010 (in 000 tonnes)
Figure 3.9: Average total corn produc on by CEFTA countries for the period 20052010 (in 000 tonnes)
Source: World Bank Sta s cs (2010): AgriPolicy Sta s cs/Candidate Countries/Data (by country), h p://europartnersearch.net/agripolicy/sta s cs/candidates, Na onal sta s cal offi ces (bureaux), FAOSTAT and for the Republic of Moldova edi on, Republic of Moldova in fi gures (2008, 2011).
Figure 3.10: Average cereals yield by CEFTA countries for period 2005–2010(in kg/hectare)
Source: World Bank Sta s cs (2010): AgriPolicy Sta s cs/Candidate Countries/Data (by country), h p://europartnersearch.net/agripolicy/sta s cs/candidates, Na onal sta s cal offi ces (bureaux), FAOSTAT and for Republic of Moldova edi on, Republic of Moldova in fi gures (2008, 2011).
61
Finally, when it comes to the actual average yield of all cereals and especially wheat and maize, Bosnia and Herzegovina is at the average level achieved by the CEFTA countries as a whole, as can be seen from the following Table 3.36 and Figures 3.10; 3.11 and 3.12.
With an average yield of all cereals of 4,049 kg/hectare, BiH is immediately a er Serbia (4,417 kg/hectare) and Croa a (5,589 kg/hectare), and in front of other CEFTA countries. As with all other CEFTA countries, the average yields vary from year to year depending primarily on clima c condi ons during the year,
Table 3.36: Average grain yield of CEFTA countries; in kg/hectare; Period 2005–2010
Crop/year BiH Albania Croa a TFYRM Kosovo Rep. of Moldova
Source: World Bank Sta s cs (2010): AgriPolicy Sta s cs/Candidate Countries/Data (by country), h p://europartnersearch.net/agripolicy/sta s cs/candidates, Na onal sta s cal offi ces (bureaux), FAOSTAT and for Republic of Moldova edi on, Republic of Moldova in fi gures (2008, 2011).
and in BiH ranges from 3,147 kg/hectare (2007) to 4,503 kg/hectare (2009).
With an average yield of wheat of 3,317 kg/hectare, BiH is behind Albania (3,625 kg/hectare), Kosovo (3,735 kg/hectare), Serbia (3,605 kg/hectare) and Croa a (4,681 kg/hectare), and in front of Montenegro, Republic of Moldova and TFYR Macedonia. The produc on of wheat yields varies from year to year depending on clima c condi ons during the year, and in BiH it ranges from 2,662 kg/hectare (2010) to 3,775 kg/hectare (2009).
62
Finally, when it comes to the average yields of maize, BiH with 4,655 kg/hectare in the period 2005–2010 is a er Albania (5,276 kg/hectare), Serbia (5,032 kg/hectare) and Croa a (6,802 kg/hectare), and in front of Kosovo, Montenegro and Republic of Moldova in par cular (2,747 kg/hectare). As with all other CEFTA countries, the average yields of corn vary from year to year and in BiH it ranges from 3,218 kg/hectare (2007) to 5,134 kg/hectare (2005).
3.9.2 EU comparison
Wheat
Wheat is produced in all 27 EU member countries. The fi ve-year average of number
Figure 3.11: Average wheat yield by CEFTA countries for the period 20052010 (in kg/hectare)
Figure 3.12: Average maize yield by CEFTA countries for the period 20052010 (in kg/hectare)
Source: World Bank Sta s cs (2010): AgriPolicy Sta s cs/Candidate Countries/Data (by country), h p://europartnersearch.net/agripolicy/sta s cs/candidates, Na onal sta s cal offi ces (bureaux), FAOSTAT and for Republic of Moldova edi on, Republic of Moldova in fi gures (2008, 2011).
of hectares harvested is 25.6 million for the period 2006–2010, see Annex 8 for detailed data. France is the biggest producer measured in terms of number of hectares harvested with 5.3 million hectares. The average in EU is 950,000 hectares. From these hectares, the fi ve-year average of produc on is 134 million tonnes, with an EU country average of 5 million tonnes. France is also the largest producer with 37 million tonnes.
The most important benchmark fi gure in this context is the yield in EU countries. The EU fi veyear average for wheat yield is 4.88 tonnes/hectare, but there are signifi cant varia ons across the countries. At the top the EU has
63
Ireland and Belgium with 8.67 and 8.64 tonnes/hectare and the Netherlands with 8.48 tonnes/hectare. These are the only three countries out of the 27 countries with higher yields than 8 tonnes/hectare. France is the largest producer measured in terms of harvested hectares and tonnes produc on, but the average yield in France is 6.92 tonnes/hectare.
At the bo om among the EU countries are Portugal with 2.11 tonnes/hectare, Romania with 2.59 tonnes/hectare, and Cyprus and Greece with 2.58 and 2.65 tonnes/hectare.
BiH has an average yield of 3.3 tonnes/hectare, which is at the level of the yield in Bulgaria, and is 67 percent of the EU average.
Maize
With regard to maize, the EU annual average for the fi ve-year period 2006–2010 is 8.4 million hectares, and an average among the 18 countries producing maize of 465,000 hectares, see Annex 8 for details. The top three countries are Romania with 2.3 million hectares or 27 percent of the area with maize harvested in the EU, France with 1.6 million hectares and Hungary with 1.1 million hectares. Italy is just outside the top three with 994,000 hectares. In terms of produc on, the total is 56.7 million tonnes, with an average of 3.1 million tonnes among the 18 maize producing countries. France is producing the largest volume with 14.4 million tonnes equal to 25 percent of the total EU produc on. Italy produces 9.1 million tonnes, while Romania and Hungary produce 7.5 and 7.1 million tonnes respec vely.
The yields vary also for maize, as they do for wheat. The EU average is 7.72 tonnes/hectare. The top fi ve countries are Belgium and the Netherlands with 11.86 and 11.46 tonnes/hectare, Austria with 11.58 tonnes/hectare and the south European countries Greece and Italy with 10.39 tonnes/hectare and 9.94 tonnes/hectare.
The countries with the lowest yields are Romania with 3.25 tonnes/hectare and Bulgaria with 3.79 tonnes/hectare. The BiH average is 4.7 tonnes/hectare equal to 61 percent of
the EU average, but s ll only 39 percent of the highest yields achieved in Belgium. The average in Slovenia is 7.63 tonnes/hectare.
3.9.3 Synthesis of CEFTA and EU comparison
There are several reasons for the lower yields per hectare in BiH compared to most CEFTA and EU countries. Among the most important is the small scale and fragmented farms leaving no or only limited fi nancial room for a high degree of moderniza on of equipment. This also leads to low produc vity.
Furthermore, stakeholders in the sector in BiH point to the low quality of seeds as another important factor. The input factors are also generally used in low volumes, which also put limita ons on the yields, even though the use of fer lizers and pes cides is increasing in later years.
Finally, the level of educa on and training among farmers is considered to be too low for modern high-yield produc on. Here it is also relevant to refer to the status of the extension services in BiH. Experiences from many other countries, both in the region and in the EU show that good extension services are of paramount importance in the moderniza on of agriculture, par cularly in countries where the share of small-scale farms is rela vely high, as in BiH.
3.10 Summary
Produc on structure
Cereals are produced in BiH on diff erent types of farms. The precise number of farms with cereals is not known. The scale of produc on varies considerably from only one hectare per farm to hundreds of hectares per farm, but the most frequent type of farms only have a few hectares distributed on several parcels. However, the farm survey conducted in the sector analysis shows that the median number of hectares for wheat and maize producers in FBiH is 3.6 hectares and 6 hectares, while the median in RS/BD for the same two crops is 2.5 hectares and 5 hectares. If these medians are combined with the data for sown areas
64
with wheat and maize, the number of farms producing wheat and maize can be es mated. In FBiH, 5,030 farms produce wheat and 8,020 farms produce maize. In RS and BD there is an es ma on of 14,920 wheat farms and 28,770 maize farms. In BiH, the total number of wheat farmers is then es mated to be 20,000, while there are 37,000 farms producing maize.
Volume of produc on
At the level of BiH the number of hectares sown with cereals has diminished by 8 percent from 318,000 hectares in 2006 to 293,000 hectares in 2010. The number of hectares has been constant in FBiH with a fi ve-year average of 83,400 hectares, while RS has experienced a reduc on of 12 percent from 225,000 hectares in 2006 to 199,000 hectares in 2010. In BD the situa on is constant with 10,000 hectares.
The share with wheat has gone down in RS by 32 percent from 49,700 to 33,600 hectares. FBiH has also seen a decrease, but only of 10 percent from 20,100 to 18,100 hectares. At BiH level the total reduc on is 25 percent. For maize grain the area sown in FBiH went down from 48,400 to 48,100 (-0.6 percent), in RS from 142,600 hectares to 138,400 hectares (-3 percent) and in BD from 5,500 to 5,200 hectares (-5 percent).
The yield measured in tonnes per hectare fl uctuates for both wheat and for maize. The fi ve-year average for wheat in FBiH is 3.5 tonnes/hectare. For maize the fi ve-year average is 4.5 tonnes/hectare in FBiH. In RS the fi ve-year average for wheat is 3.3 tonnes/hectare and also here with a poor year in 2010. For maize, the fi ve-year average is 4.6 tonnes/hectare, which also was the yield in 2010, but the average is pulled down due to a very poor yield in 2007 with only 3 tonnes/hectare, just two-thirds of the average. In BD 2010 was also poor with yields of wheat of 2.8 tonnes/hectare and of maize of 4.5 tonnes/hectare. Both results are below the respec ve fi ve-year averages of 3.6 tonnes/hectare for wheat and 4.6 tonnes/hectare for maize.
The total area harvested with barley, oats and rye was 31,500 hectares in 2010. It is a reduc on from 39,400 hectares in 2009, or 20 percent down. Of the three small cereals, barley is far the most important with a fi ve-year average of 65,500 tonnes of produc on, while the produc on of oats is 35,000 tonnes and rye 10,000 tonnes on average. The yields for these three cereals were low in 2010, and this is refl ected in a rela vely low produc on in 2010 compared to the previous year. The produc on of rye went down by 38 percent, the produc on of barley went down by 35 percent and the produc on of oats by 43 percent.
Value of produc on
The value of wheat went down from BAM 71 million in 2009 to BAM 45 million in 2010. In par cular RS was hard hit with a reduc on from BAM 46 million to BAM 26 million, or a decrease of 42 percent, but also FBiH and BD are suff ering from lower produc on and yields.
With regard to maize, the total value was BAM 259 million in 2010, which was a small increase from 2009, when the value was BAM 235 million. FBiH, RS and BD have all experienced an increase in the value, primarily due to higher prices in 2010, and in spite of lower yields and a reduc on in the sown and harvested areas.
In total the value of wheat and maize is BAM 305 million for BiH in 2010, distributed as follows: BAM 77.6 million in FBiH, BAM 217 million in RS and BAM 10.3 million in BD.
The total value of the fi ve main cereals (wheat, maize, rye, barley and oats) in 2010 was BAM 332 million with a fi ve-year average of BAM 338 million.
With regard to rela ve importance, maize grain is the most signifi cant of all cereals and tops in 2010 with 78 percent of produc on, when wheat in the same year faced its lowest share with only 14 percent of produc on. The total value of the three smaller cereals is only 8 percent of produc on in 2010.
65
The total GDP of BiH was BAM 24,484 million in 2010. The value of cereals produc on was 1.4 percent of total GDP. The agricultural GDP was BAM 1,817 million in 2009, and the fi ve main cereals contributed with 14.3 percent of agricultural GDP.
Profi tability of wheat and maize produc on
The project farm survey and case studies undertaken show that wheat produc on generates earnings BAM 578 per hectare including subsidies, while maize grain produc on generates BAM 933 per hectare. Obviously, it is more economically a rac ve for farmers to produce maize instead of wheat, and this is also refl ected in the weight of maize in total cereals produc on in BiH compared to wheat and other cereals.
CEFTA and EU comparison
BiH presents lower yields than many EU and CEFTA countries, and also yields below the averages. The reasons for the lower yield per hectare in BiH compared to most CEFTA and
EU countries are diverse. Among the most important are the small scale and fragmented farms giving only limited fi nancial room for moderniza on of equipment. This also leads to low produc vity.
Furthermore, stakeholders in the sector in BiH point to the low quality of seeds as another important factor. The input factors are also generally used in low volumes, which also put limita ons on the yields, even though the use per hectare of fer lizers and pes cides has been increasing in later years.
Finally, the level of educa on and training among farmers is low for modern high yield produc on. Here it is also relevant to refer to the rela vely weak extension services in BiH, par cularly in FBiH. Experiences from many other countries, both in the region and in the EU show that good extension services are of paramount importance in the moderniza on of agriculture, par cularly in countries where the share of small-scale farms is rela vely large, as in BiH.
66
67
4. THE PROCESSING INDUSTRY
This chapter deals exclusively with small and medium-sized processing enterprises with less than 750 employees or a turnover lower than EUR 200 million. There are no enterprises that exceed these parameters (with the excep on of the MIMS group (see below)). Focus is primarily on the primary processing in the milling industry, while secondary processing is only included to a certain extent.
4.1 Primary processing industry
During the period of former Yugoslavia there were 18 large-scale state fl our (focused on wheat) and feed mills (focused on maize) in Bosnia and Herzegovina that were equally spread throughout the whole territory. They were rela vely well equipped as modern Western European technologies were used. The total installed capaci es for storage and processing was around 455,000 tonnes of wheat in BiH.
Since that me the number of large-scale mills has decreased, but a er 1995 the total number of mills increased due to many new small private mills being founded. Now there are a total of 80 mills in BiH. Most of the mills are intended for fl our produc on and the waste and byproducts are used for animal feed. Only 20 mills are exclusively designed for fodder produc on.51
Today, the largest suppliers of milling machinery and equipment to BiH and other former Yugoslav countries are the Swiss, Italian and Czech Republic manufacturers (Buhler, GBS, Prokop, Ocrim and others). Over the last few years, Turkish manufacturers have also gained a substan al role in supplying milling machinery. The prospects of entering EU markets have prompted fl our producers to introduce new produc on techniques to
produce hydro-thermally processed fl our, fast-cooking groats and stabilized wheat embryos, and to improve the quality of local fl our.52
4.1.1 Capaci es and actual performance
In 2008, the capacity of the primary processing industry was es mated to be 650,000 tonnes of wheat annually,53 but no offi cial updated full picture can be prepared since data regarding capaci es and values of produc on is either not collected by the authori es or is classifi ed as confi den al. Based on the worldwide annual average wheat consump on per head of 135 kg in developed countries, Bosnia and Herzegovina would need 513,000 tonnes annually for its 3.8 million inhabitants in order to meet domes c demand. The capacity in the country should then be appropriate to cover the needs. However, very o en, installed capaci es do not have much in common with actual performance.
By far the most important mill is KLAS which processes 400–450 tonnes per working day when running at full capacity. Yearly processing totals around 120,000 tonnes (with 300 working days per year) and covers around 20 percent of the BiH market demands. KLAS has no plans to increase produc on and the milling technology dates back to 2003. KLAS is part of the only strong local holding in Bosnia and Herzegovina, the MIMS Group, which is now one of the largest privately owned companies in BiH, employing over 5,000 people. The MIMS Group was founded about ten years ago as a wholesale company for food products, construc on material and household items. It now has a variety of company members such as Merkur (retail), KLAS and Sprind (mill and bakery, each having around EUR 57 million turnover in 2009), Sarajevo and Tuzla Breweries, and Vegafruit.54
51 European Union SESMARD Working document: BiH Strategic Plan for Harmoniza on of Agriculture, Food and Rural Development (2008–2010). 2008. p 64
52 European Bank for Reconstruc on and Development (EBRD), FAO: Agribusiness Handbook, Wheat Flour. 2009. p 4553 European Union SESMARD Working document: BiH Strategic Plan for Harmoniza on of Agriculture, Food and
Rural Development (2008–2010). 2008. p 6454 GFA Consul ng Group GmbH: Food Industry Study in Southeast Europe. Final. December 2010. p 26 ff
68
Besides the two large mills, there are also some medium-size processing plants (Zitopromet, Mostar; Dukat, Tesanj; Mlin Majic, Odzak; Mlinpek, Bugojno and Jaice; Eurotrans, Gradacac; BN-Dukat, Brodac; Djuric, Modrica; Zitoprerada, Omarska; Jelena, Kozarska Dubica, with installed capaci es of 15,000–30,000 tonnes per year. However, they o en run below full capacity. Finally, there are many small mills that process around 1,000 tonnes per year. As the milling business depends heavily on economies of scale,55 many small mills will go out of business, when the owners re re, or when the mills cannot aff ord to invest in modern technology and standards. 92 percent of the former mill “Husinski rudari”, re-named “Mlin i Pekara” in Ljubace is now owned by KLAS and is only used as a storage facility. Zitoprerada in Bihac stopped opera ons recently due to bankruptcy and Zlatan Dolina in Sanski Most is also out of business. Among the medium-size mills, BB-commerc in Olovo also went bankrupt.
In FBiH, the Ministry of Agriculture has provided the expert team with the data for mills and their present capacity, see Annex 4.
The total capacity of the FBiH mills is 1,778 tonnes/24-hours opera on, where the 10 bigger mills with more than 50 tonnes have 1,400 tonnes in capacity in total, and the 13 smaller mills with less than 50 tonnes capacity per day only 378 tonnes.
If it is es mated that the mills can operate 300 days per year, the total capacity of the FBiH mills is 533,000 tonnes.
Table 4.1: Flour produc on, FBiH, 2010 and 2011, tonnes
Name of product 2010 2011 Index 2011/2010Wheat fl our 138,144 124,876 0.90Flour, maize 119 0 0.00Flour, rye 51 23 0.44Flour, other cereals 386 381 0.99TOTAL 138,700 125,280 0.90
Source: Ministry of Agriculture, FBiH, May 2012
55 For example the largest Austrian milling group processes 1,300 tonnes annually per 1 employee.56 Source: Vesna Mrdalj, Faculty of Agriculture, University of Banja Luka, 2011; PPP, 30 May 2011.
The produc on of fl our in the FBiH mills is presented in the next table for the years 2010 and 2011.
Produc on is going down for all four types of products, mostly for fl our from maize, which has ended, and the least for fl our from cereals other than wheat, maize and rye, where produc on was almost the same in 2011 as in 2010. Wheat is by far the most important product covering 99.6 percent of the produc on of fl our in 2010 (138,144 tonnes) and 99.7 percent in 2011 (124,876 tonnes).
If it is assumed that the annual capacity es mated above is correct (533,000 tonnes), the u liza on of capacity in the FBiH primary processing sector in 2011 was as low as 23.5 percent.
A list of mills and bakeries in RS is provided by the RS Ministry of Agriculture, Forestry and Water Management (MoA) and inserted as Annex 5.
Informa on regarding the capaci es of the RS mills is not provided by the RS MoA, but a university expert56 es mates that the capacity u liza on was 30 percent in 2010. Based on this informa on the capacity can be calculated using the data in the next table, where the produc on of grain mill products for the period 2006 to 2009 is presented.
As was the situa on in FBiH, wheat fl our in RS is the domina ng product with 90,816 tonnes in 2009, or 94 percent of total produc on of 96,438 tonnes. If the capacity u liza on is es mated to be 30 percent, the full capacity of the RS mills is 320,000 tonnes.
69
The total capacity of the FBiH and RS mills is thus es mated to be 854,000 tonnes, and the u liza on rate is 26 percent.
The produc on of 222,000 tonnes of various products, with wheat fl our as the domina ng product, requires 296,000 tonnes of cereals, if the u liza on rate (1 kg cereals gives 0.75 kg fl our) is 75 percent. It could service an area of 66,000 to 70,000 hectares, depending on the average yield, to produce this amount of wheat. However, many mills rely on imported cereals, par cularly from Hungary, due to what the processing industry considers as wheat of be er quali es and lower prices. This represents a substan al challenge for the BiH farmers to compete with the imported wheat, both in terms of price and in terms of quality.
From Department of Agriculture in BD a list of names of mills ion BD was provided, but no other data. The list is inserted as Annex 6.57
Value of the produc on of milled cereal products
In order to es mate the value of the produc on of milled cereal products, the average price for wheat fl our on the domes c market in
Figure 4.1: The produc on of grain mill products in RS, 2006–2009, tonnes
wheat fluor maize fluor groats of wheat and other cereals
cereals and grain mill product
Source: Vesna Mrdalj, Faculty of Agriculture, University of Banja Luka, 2011; PPP, 30 May 2011, and RS and BiH Agency for Sta s cs, various years.
2010 was used (BAM 530 per tonne), since no produc on sta s cs, broken down by types of products, have been available from ministries or sta s cal offi ces.
In 2010, a total 230,000 tonnes were produced (125,500 tonnes in FBIH, 96,500 tonnes in RS and 8,000 tonnes in BD). The total produc on of milled produc on in BiH is valued at BAM 122 million distributed between en es and BD as follows: In FBiH it is BAM 66.5 million In RS it is BAM 55.1 million In BD it is BAM 4.2 million
Cereals storage
Cereals storage capaci es in Bosnia and Herzegovina are based on exis ng mills. Capaci es are very diff erent and vary from several thousand tonnes to 65,000 tonnes, which is the capacity of the wheat silos of KLAS without including the storage capacity of the recently purchased former mill “Mlin i Pekara” in Ljubace. Informa on obtained from the Grain Associa on of FBiH reveals that the quality of storage facili es and their technical and technological characteris cs vary. Formerly state
57 Comments from stakeholders have indicated that the capacity of the processing industry is bigger than presented in this report, but data was not provided to document this. However, bigger capaci es only mean that the capacity u liza on rate is even smaller than presented in this report.
70
owned mills have sa sfactory storage condi ons, but the majority of small private mills, which were built on the basis of old fashioned technical-technological equipment, do not.
However, BiH has prepared regula ons on the minimum technical, technological and sanitary standards that every single mill, bakery or pastry factory has to meet, regardless of ownership or capacity. Many of the small mills do not meet the basic technical requirements defi ned by the Rulebook on Minimal Requirements.58 The Rulebook exists, but the inspec on services do not func on properly yet.
The fi nancial and sanitary controls of raw materials and commodi es are not comprehensive,59 and any standardized recording of business ac vi es is usually not in accordance with bookkeeping regula ons. Due to these circumstances in the sector, a signifi cant black market in grain and fl our exists according to informa on from stakeholders in the sector. Under these condi ons, contrary to transparent market-oriented mechanisms, the profi ts that can be made from milling and baking are such that the number of mills and bakeries (especially the small ones) may con nue to increase contrary to the usual concentra on and centraliza on process being an integral part of the structural development under free market forces.60
Furthermore, fl our made from other cereals is also consumed, maize being the most popular. The consump on of maize and maize fl our is tradi onally high in Bosnia and Herzegovina (and also in the Former Yugoslav Republic of Macedonia). In 2007, consump on was about 83 kg per capita per year (383,640 tonnes annually). About 5,000 tonnes of maize fl our are imported per year.
58 The Rulebook on Minimal Technical-Technological and Personnel Requirements for Processing Grain at Mills (Offi cial Gaze e of FBiH, No. 81/06); Federa on of BiH.
59 Interviews with stakeholders 2011 and 2012.60 CEEC AGRI POLICY: Agro economic policy analysis of the new member states, the candidate states and the
countries of the western Balkans. Instrument Specifi c Support Ac on. Thema c Priority Scien fi c Support to Policies. D12–2 Second 6-monthly report. Monitoring of agricultural policy, market and trade developments in Bosnia and Herzegovina. 2006. p8
61 See Bajramovic, S., Dzomba, E. & Becirovic, E.: Feasibility study – Factory of premixes and safe animal feed in Bosnia and Herzegovina. July 2010.
Besides some demand for maize fl our, there is no other great industrial demand for maize. Maize is usually processed into starch and the capaci es needed for these starch processing plants are substan al (examples can be found in Hungary). A waste product of starch produc on is the maize germ which can be processed into edible oil. There are no maize starch factories in BiH and neither are there any oil mills for maize. However, maize grits are used by fodder mills and also by breweries.
Fodder mills61
Animal feed mills have been set up in areas where livestock are kept in abundance. There are more feed mills in RS than in FBiH and the sector is rela vely fragmented in terms of capacity. The analysed feed mills have an annual output of between a few hundred tonnes and up to 20,000 tonnes. Many of them are running at low capacity. A consolida on process is envisaged in the years to come for the fodder mills as for the sector in general, and the support from IPARD might push this process further, since only viable mills demonstra ng the feasibility of the investments in the moderniza on of exis ng capaci es will be eligible for support, see Annex 7 for a list of fodder mills.
4.2 Bread-baking and confec onery industry
The most important companies in the sector are listed in Annex 8.
Data regarding value and volume of produc on of the secondary cereals processing industry has been requested from the FBiH MoA, and the table below providing informa on of produc on volume for the years 2010 and 2011 is what the ministry has been able to provide.
71
The most important product category is fresh wheat bread with almost 18,000 tonnes produced in 2011, down by 16 percent from 2010. The second largest product category is sweet cookies (sweet biscuits) with 4,700 tonnes in 2011, which is double that of 2010, and the category including all types of pastries with 3,276 tonnes. Besides sweet cookies, the “rising stars” in BiH secondary produc on is the category confec onery and daily cakes up by 212 percent, and fresh rye bread up by 138 percent and toast breads up by 136 percent, but these categories are s ll rela vely small.
Unfortunately, there is no informa on about the value of the produc on available, but it is clear that the value added of the main product category – fresh wheat bread – is lower than what can be expected from other more processed categories, such as sweet cookies and other products. The increase in these categories might therefore also
Table 4.2: FBiH, Bakery products, cakes and cookies, kg
Name of product 2010 2011 Index 2011/ 2010Fresh bread, wheat 21,148,694 17,836,184 0.84Fresh bread, rye, including mixed 407,595 563,850 1.38Fresh bread, maize 41,051 35,163 0.86Fresh bread, special (enriched with mineral salt, vitamins and other addi ves) 1,073,375 919,631 0.86
Other kinds of bread 696,073 959,872 1.38All kinds of pastries 3.388.194 3,275,739 0.97Breadcrumbs 50,110 56,740 1.13Other bakery products, fresh, frozen and baked 44,483 46,697 1.05Mixes and pasta for bread, cakes, pastry, and rest of bakery products 74,650 89,243 1.20
Confec onery, daily cakes 492,062 1,042,350 2.12Toast, toast-bread and similar toast products 67,000 91,000 1.36Gingerbread and similar 31,807 0 0.00Waffl e products with chocolate 864,601 379,858 0.44Sweet cookies with cacao 172,384 4,782 0.03Sweet cookies 2,364,410 4,706,412 1.99Waffl es and wafers 92,000 104,000 1.13Cookies 1,202,350 1,281,860 1.07
Source. FBIH MoA. 2012
represent a rela vely strong increase in the value of the produc on, since the weight of fresh wheat bread is reducing. This tendency is posi ve from an economic point of view.
In the bread-baking industry in RS, there are 36 registered companies, and their produc on measured in terms of tonnes is presented in the fi gure and the table below for the years 20062009. These data have been collected through other sources; see the table, since no data were available regarding processing values and volumes in the RS MoA.
In RS it is also wheat bread which is domina ng the produc on in the secondary processing industry with the produc on of 10,526 tonnes in 2009. This fi gure represents a decline in the produc on from 2006, when the produc on was 13,461 tonnes. This is a reduc on of 23 percent, strongest from 2008 to 2009. The other product categories vary in tendencies, and no single one of them
72
shows strong increases, as was seen for some product categories in FBiH. The categories “other kinds of bread”, “all kinds of baked goods” and “other bakery products” are all up from the 2006 level, but they do not count much in the overall picture.
As in FBiH, RS illustrates an increase in the share of products with an expected higher value added on the expense of wheat bread. Also here in RS it is posi ve.
4.3 Quality of the products and quality requirements
Stakeholders’ opinions are very divided regarding the quality of domes cally produced cereals. One men oned that the quality is reasonably uniform, without signifi cant devia ons from year to year and that farmers normally meet the required quality standards. Only in the cases of extremely wet years or in drought years do the quality and quan ty not meet requirements.
Others, especially the millers, state that the quality of locally produced cereals does not meet market requirements, especially since 2002 when a sharp decline in quality was discovered. To deliver the quality demanded
Figure 4.2: The produc on of bakery products and pasta in RS, 2006–2009, tonnes
Source: Vesna Mrdalj, Faculty of Agriculture, University of Banja Luka, 2011; PPP, 30 May 2011, and RS and BiH Agency for Sta s cs, various years. No data for pasta, unfi lled and uncooked in 2006.
by the bread-baking industry, mills in BiH have to blend wheat. The blending ra o between local to imported wheat is 10–20 percent local and 80–90 percent imported.
During the fi rst round of workshops it was men oned that processors are o en confronted with domes c (not imported) cereals with some content of agrochemicals, due to a lack of inspec ons of the farmers.
The minimum standard requirements for quality of wheat (harvested in 2010) bought by KLAS are as follows: Maximum moisture: 13.5 percent Minimum hectolitre weight: 76 kg per hl Maximum amount of foreign materials (admixtures): 8 percent (including dirt of foreign materials, max. 2 percent, damaged grain, broken grain, overheated grains, sprouted grains and grains smaller than 2 mm)
Other quality parameters are enforced as well, for example with regard to protein content, baking quality, etc.
In 2009 and 2010, the quality of wheat was good and corresponded to the above-men oned requirements of buyers, including KLAS. But there were also some millers
73
who claimed that the moisture content was too high. All millers met during site visits men oned that the quality of local wheat is too low, meaning that they have to import be er quality wheat for blending purposes.
However, another problem seems to be that the quality of imported cereals also varies from year to year and from mill to mill. This problem is the consequence of the lack of enforcement of relevant legisla on surrounding the milling and bakery industry and pasta factories. Small mills and bakeries have taken advantage of this situa on and buy wheat and process it into fl our straightaway without prior laboratory analysis or fi nishing (washing, separa on of admixtures). The result of this prac ce is that some bakery products off ered to consumers in Bosnia and Herzegovina are of dubious quality.62 This par cular problem in the secondary industry has not been confi rmed through the interviews in this analysis.
4.4 Summary
Processing of cereals, include primary processing of cereals into fl our and secondary processing into fresh bread and various types of baked products, cakes, etc.
Volume of primary processing
The produc on of fl our in BiH is taking place in 10 major mills in FBiH excluding a large number of small-scale mills and in 36 mills of various capaci es in RS/BD.
In FBiH, wheat is far the most important product covering 99.6 percent of the produc on in 2010 (138,144 tonnes) and 99.7 percent in 2011 (124,876 tonnes). However the overall produc on was diminishing in 2011, mostly for fl our from maize, which has ended, and the least for fl our from other cereals than wheat, maize and rye, where the produc on is almost the same in 2011 as in 2010.
The annual capacity in the sector is 533,000 tonnes, and the u liza on of capacity in the FBiH primary processing sector in 2011 was 23.5 percent.
As was the situa on in FBiH, wheat fl our in RS is the domina ng product with 90,816 tonnes in 2009, or 94 percent of total produc on of 96,438 tonnes. The capacity u liza on is es mated to be 30 percent, and the full capacity of the RS mills is 320,000 tonnes.
The total capacity of the FBiH and RS mills is es mated to be 854,000 tonnes, and the u liza on rate is 26 percent.
The produc on of 222,000 tonnes of various products, with wheat fl our as the domina ng product, requires 296,000 tonnes of cereals, if the u liza on rate (1 kg cereals gives 0.75 kg fl our) is 75 percent. It could benefi t farmers with 66,000 to 70,000 hectares, depending on the average yield, to produce this amount of wheat. However, many mills rely on imported cereals, par cularly from Hungary, due to what the processing industry considers as wheat of be er quality and lower price. This represents a substan al challenge for the BiH farmers to compete with the imported wheat, both in terms of price and in terms of quality.
Value of the produc on of milled cereal products
In order to es mate the value of the produc on of milled cereal products, the average price for wheat fl our on the domes c market in 2010 is used (BAM 530 per tonne), since no produc on sta s cs, broken down by types of products, have been available from ministries or sta s cal departments.
In total 230,000 tonnes of milled cereals are produced, with 125,500 tonnes in FBiH and 96,500 tonnes in RS. An addi onal 8,000 tonnes are produced in BD. The total produc on of
62 CEEC AGRI POLICY: Agro economic policy analysis of the new member states, the candidate states and the countries of the western Balkans. Instrument Specifi c Support Ac on. Thema c Priority Scien fi c Support to Policies. D12–2 Second 6-monthly report. Monitoring of agricultural policy, market and trade developments in Bosnia and Herzegovina. 2006. p 9 ff .
74
milled produc on in BiH is valued at BAM 122 million distributed between en es and BD as follows: FBiH – BAM 66.5 million, RS – BAM 55.1 million and BD – BAM 4.2 million
Secondary processing
The secondary processing industry in BiH is made up of 15 major bread-baking companies and 12 major confec onery companies. Besides that there are several smaller companies.
The most important product category under secondary processing in FBiH is “fresh wheat bread” with almost 18,000 tonnes produced in 2011, down by 16 percent from 2010. The second largest product category is “sweet cookies (sweet biscuits)” with 4,700 tonnes in 2011, which is a doubling from 2010, and the category including “all types of pastries” with 3,276 tonnes. Besides sweet cookies, the rising stars in FBiH secondary produc on is the category “confec onery and daily cakes” up by 212 percent, “fresh rye bread” up by 138 percent and “toast breads” up by 136 percent, but these categories are s ll rela vely small.
Unfortunately, there is no informa on about the value of the produc on available, but it is clear that the value added of the main product category – fresh wheat bread – is lower than what can be expected from other more processed categories, such as sweet cookies and other products. The increase in these categories might therefore also represent a rela vely strong increase in the value of the produc on, since the weight of fresh wheat bread is reducing. This tendency is posi ve from an economic point of view.
In RS it is also wheat bread, which is domina ng produc on in the secondary processing industry with the produc on of 10,526 tonnes in 2009. This fi gure represents a decline in produc on from 2006, when the produc on was 13,461 tonnes. This is a reduc on of 23 percent, the largest reduc on being from 2008 to 2009. The other product categories vary in tendencies and no one of them represents strong increases, as was the case for some product categories in FBiH.
As in FBiH, in RS there is an increase in the share of products with an expected higher value added on the expense of wheat bread. Also here in RS it is posi ve.
Product quality
Many millers and other stakeholders interviewed stated that the quality of locally produced cereals does not meet market requirements with regard to moisture, hectolitre weight and maximum amount of foreign materials (admixtures). All millers met during site visits men oned that the quality of local wheat is too low, meaning that they have to import be er quality wheat for blending purposes. To deliver the quality demanded by the bread-baking industry, mills in BiH have to blend wheat. The blending ra o between local to imported wheat is 10–20 percent local and 80–90 percent imported wheat.
In 2009 and 2010, the quality of wheat generally was good and corresponded to the men oned requirements of the millers, but there were also some millers who claimed that the moisture content was too high.
75
5. GOVERNMENT POLICY FOR THE SECTOR5.1 Overview of primary relevant
competent ins tu ons
A brief descrip on of the main authori es in charge of agriculture and the agro-processing industry related to cereals in Bosnia and Herzegovina is summarized below.
5.1.1 Ministry of Foreign Trade and Economic Rela ons
BiH has un l now no Ministry of Agriculture at state level. The EU has recommended the establishment of a na onal level agricultural ministry, which would guarantee that Bosnia and Herzegovina has one competent authority for agriculture and food, when EU accession nego a ons begin. The Third European Partnership from February 2008 states a short-term priority in agriculture and fi shery is the following: “To strengthen the administra ve capacity at na onal level in terms of agriculture, food and rural development, in order to eff ec vely coordinate implementa on of the policy of market development and rural development throughout the country. Work towards the establishment of the Ministry of Agriculture, Food and Rural Development at the state level with suffi cient resources to carry out its tasks.”
The interna onal agricultural responsibili es are mainly implemented in the Sector for Agriculture, Food, Forestry and Rural Development of MoFTER.63
5.1.2 The Plant Protec on Agency64
The BiH Plant Health Protec on Administra on (PHPA) was established under the 2004 Decision of the Council of Ministers (“Offi cial Gaze e of BiH” No. 23/04), and has its seat in Sarajevo. It is an administra ve organiza on within the Ministry of Foreign Trade and Economic Rela ons.
The Administra on is a na onal authority for plant health protec on, competent for coordina on and communica on on issues pertaining to plant protec on, and the provisions ensuing from the Interna onal Plant Protec on Conven on (Offi cial Gaze e of BiH No. 8/2003) ra fi ed by BiH in 2003, as well as from the na onal legisla on: Law on Plant Health Protec on (Offi cial Gaze e of BiH, No. 23/03) governing plant health protec on, preven on of introduc on and spreading of harmful organisms, and taking ac ons against harmful organisms by introducing measures for the protec on of plants, plant products and other regulated ar cles in the area of Bosnia and Herzegovina, and other issues of relevance for plant health protec on. Law on Phyto-pharmaceu cal Products (Offi cial Gaze e of BiH, 49/2004) governing the registra on, trade and supervision of ac ve substances, and other issues related to phytopharmaceu cal products. Law on Seed and Plan ng Materials of Agricultural Plants (Offi cial Gaze e of BiH, No. 3/05) which s pulates the requirements for produc on, prepara on for placement on the market, importa on and placement on the market of seeds and vegeta ve plan ng material, and other issues relevant for this area. Law on Protec on of New Varie es (Offi cial Gaze e of BiH, No. 46/04), which governs the procedures regarding protec on of new plant varie es, and the procedures for obtaining and protec ng plant breeders’ rights. Law on Mineral Fer lizers (Offi cial Gaze e of BiH, No. 46/04), which s pulates the requirements for the composi on, quality and labelling of mineral fer lizers placed on the market, as well as their use.
63 The specifi c du es are well known and are not presented here, but can be found at the following Web site h p://www.mvteo.gov.ba/Default.aspx?template_id=26&pageIndex=1
64 Based on informa on provided by the PHPA, 2012
76
The BiH Plant Health Protec on Administra on has numerous du es and responsibili es ensuing from the Interna onal Plant Protec on Conven on, Law on Plant Health Protec on (Offi cial Gaze e of BiH, No. 23/03), Law on Phyto-pharmaceu cal Products, which is to a great extent harmonized with the Direc ve 91/414/EEC (Offi cial Gaze e of BiH, No. 46/04), Law on Seed and Plan ng Materials of Agricultural Plants (Offi cial Gaze e of BiH, No. 3/05), Law on Protec on of New Varie es (Offi cial Gaze e of BiH, No. 46/04) and the Law on Mineral Fer lizers (Offi cial Gaze e of BiH, No. 46/04).
The protec on of plants from harmful organisms is required for many reasons, primarily in order to prevent yield decrease and to increase agricultural protec on. The competences and du es of the BiH Plant Health Protec on Administra on are clearly defi ned under the Decision on its establishment, the Interna onal Conven on and the provisions of applicable laws.
Department for Plant Health Protec on
The Plant Health Protec on Department has the following du es:
Coordinate and cooperate with the en es and Brčko District in policy-making in the fi eld of plant health; Dra legal regula ons and carry out other administra ve du es in the area of plant health, and a end to their implementa on; Monitor harmful organisms on a regular basis and dra reports pursuant to the law; Analyse and evaluate plant health in order to assess the emergence and spreading of harmful organisms in the country and abroad; Coordinate with competent en ty authori es in rela on to du es and authoriza ons in the fi eld of plant health as s pulated by the law; Establish and keep registers, records and lists pursuant to the law; Dra and monitor special programmes related to measures on the preven on of introduc on and spreading of harmful organisms, and provide for the implementa on of these programmes;
Propose and monitor measures of preven on, suppression and elimina on of harmful organisms; Ensure the implementa on of phyto-sanitary measures; Administer and implement public no ces for the assignment of public competences pursuant to the law, issue decisions on authoriza ons of the ins tu ons and supervise the work of competent ins tu ons pursuant to the law; Dra reports, analyses, informa on and other materials for the offi cial authori es and interna onal organiza ons for plant protec on and plant produc on;a end to the implementa on of uniform procedures pursuant to regula ons and interna onal requirements; Cooperate with other offi cial authori es and organiza ons in the country and abroad in the fi eld of plant health; Represent BiH before interna onal authori es and organiza ons in the fi eld of plant health; Other du es related to plant health pursuant to regula ons and upon the orders of the Managing Director.
Department for Phyto-pharmaceu cal Products and Mineral Fer lizers
The Department for Phyto-pharmaceu cal Products and Mineral Fer lizers has the following du es: Coordinate and cooperate with the en es and Brčko District in rela on to the du es and responsibili es in the fi eld of phyto-pharmaceu cal products and mineral fer lizers s pulated by laws; Dra law and regula on proposals and carry out other administra ve du es in the fi eld of phyto-pharmaceu cal products and mineral fer lizers, and a end to their implementa on; Coordinate ac vi es in the prepara on of document evalua on, and conduct the procedure of registra on of phyto-pharmaceu cal products and issuance of permits;
77
Establish and keep registers, records and lists pursuant to the law; Administer and implement public no ces for the assignment of public competences pursuant to the law, issue decisions on authoriza ons of ins tu ons and supervise the work of competent ins tu ons pursuant to the law; Monitor the market situa on, that is, the use of phyto-pharmaceu cal products, and cooperate in the prepara on of measures; Pass the programme related to the proper use of phyto-pharmaceu cal products, and cooperate in applica on of the principle of good agricultural prac ce and integral plant protec on; Dra reports, analyses, informa on and other materials for the offi cial authori es and interna onal organiza ons; Cooperate with other offi cial authori es and organiza ons in the country and abroad in the fi eld of phyto-pharmaceu cal products and mineral fer lizers; Represent BiH before interna onal authori es and organiza ons in the fi eld of phytopharmaceu cal products and mineral fer lizers; Other du es related to phyto-pharmaceu cal products and mineral fer lizers pursuant to regula ons and upon the orders of the Managing Director.
Department for Seed and Plan ng Materials of Agricultural Plants and the Protec on of Varie es
Dra legal regula ons in the fi eld of seed and plan ng material produc on, in coopera on with competent authori es of the en es and Brčko District of BiH, Prescribe requirements for the produc on and prepara on for placement on markets, Prescribe requirements for the importa on and placement on the market of the seed and plan ng materials of agricultural plants (grain, industrial plants, fodder plants, vegetable crops, medicinal plants, aroma c
and pot herbs, fruit, vineyard, hops, and hor cultural plants), Prescribe requirements for the entry of suppliers in the central register of suppliers, Prescribe in detail the content and the keeping of the register of suppliers, as well as other records and keeping the register of varie es, Prescribe in detail the procedure for entering varie es in the register of varie es, Prescribe the seed categories and detailed requirements in terms of the purity of varie es or species, and the minimal quality requirements when certain varie es of seeds and plan ng materials are not included in the s pulated categories, Undertake other du es in the area of seed and plan ng materials produc on pursuant to the Law on Seed and Plan ng Materials of Agricultural Plants of Bosnia and Herzegovina (Offi cial Gaze e of BiH, No. 03/05), Dra legal regula ons on the protec on of new plant varie es and on plant breeders’ rights, in coopera on with competent authori es of en es and Brčko District of BiH, Prescribe in detail the requirements for alloca ng the plant breeders’ rights. Prescribe in detail the content and keeping of the register of new plant varie es and the plant breeders’ rights.
5.1.3 Food Safety Agency
The Food Safety Agency (FSA) of Bosnia and Herzegovina is an independent administra ve organiza on established under the Decision of the Council of Ministers of BiH dated 8 March 2005 (Offi cial Gaze e of BiH No. 22/05) at the proposal of the Ministry of Foreign Trade and Economy of BiH, pursuant to the BiH Law on Food.65
The Food Safety Agency of Bosnia and Herzegovina (hereina er: the Agency) is an independent administra ve organiza on, the authority for food safety and quality,
65 Based on informa on provided by the FSA, 2012
78
applica on of interna onal conven ons and interna onal trea es in the area of food and feed safety, which are binding for Bosnia and Herzegovina. Pursuant to the Law on Food (“Offi cial Gaze e of BiH”, No.50/04 (hereina er: the Law), the Agency is in charge of risk analysis (assessment, management and no fi ca on of risk), ini a ng, preparing, developing and proposing food regula ons, as well as other tasks in its sphere of ac vity, and pursuant to the provisions of the Law the Agency performs the following ac vi es:
The Agency is obligated to provide scien fi c advices, as well as scien fi c and technical help to the legisla on and policy of Bosnia and Herzegovina in all areas that directly or indirectly aff ect food and feed safety. It provides independent data on all issues within these areas and forwards data on risks.
The Agency is the contact point for ac vi es of the Codex Alimentarius Commission.
The Agency is obliged to contribute to the high level of animal protec on and people’s health and, therefore, to take care of the welfare of animals, health of plants and the environment on the territory of Bosnia and Herzegovina.
The Agency is obliged to collect and analyse data in order to provide for characteriza on and monitoring of risks that directly or indirectly aff ect food and feed safety.
The Agency’s tasks also include providing: Scien fi c advice, and scien fi c and technical help related to human food under the legisla on of Bosnia and Herzegovina, as well as providing communica on assistance in rela on to food issues within the health protec on programme in Bosnia and Herzegovina, Scien fi c opinion about other issues related to the health and welfare of animals and plants, Scien fi c opinion about products, including food and feed in rela on to gene cally modifi ed organisms.
The Agency is obliged to provide its scien fi c opinion that would serve as a basis for the development and adop on of measures of
the Council of Ministers within the sphere of ac vity of the Agency.
The Agency is obliged to perform its tasks in the circumstances allowing it to be the point of reference owing to its independence, scien fi c and technical quality of opinions it provides, informa on it forwards, transparency of its procedures and work methods, and the focus it places on tasks it is entrusted with.
The Agency is obliged to closely cooperate with competent authori es, which must ensure fulfi lment of the Agency’s tasks within their competencies.
The Agency and the competent authori es cooperate to improve eff ec ve rela ons between the risk assessment, risk management and risk announcement func ons.
In addi on to the foregoing, the Law defi nes the Agency’s tasks, as follows: Provide competent authori es with the best scien fi c opinion in all cases defi ned by law and on all issues within its sphere of ac vity, Improve and coordinate the development of unique risk assessment methodologies within its sphere of ac vity, Ini ate, prepare and organize development of implementa on regula ons from this Law, Provide competent authori es with scien fi c and technical support within its sphere of ac vity and, when requested, in the interpreta on and analysis of risk assessment opinions, Make available scien fi c studies within its ac vi es, Request, collect, compare, analyse and summarize scien fi c and technical data within its sphere of ac vity, Undertake measures to determine and characterize risks occurring in its sphere of ac vity, Establish the network system of organiza ons opera ng within its sphere of ac vity and undertake responsibility for their ac ons, Provide scien fi c and technical help in the procedures of crisis management conducted
79
by competent authori es in rela on to food and feed safety, Ensure that public bodies and interested par es urgently receive reliable, objec ve and comprehensive data within the Agency’s sphere of ac vity, Independently present its own conclusions and orienta on in the issues within its competence.
The Rulebook66 on Internal Systema za on of the Food Safety Agency of BiH defi nes the following departments and offi ces: Offi ce of the Director Common Services Sector Risk Analysis Sector• Food Safety Department • Declara on – Labelling Department• Pathogenic Microorganisms Department • Chemical Substances Department • Safety Produc on Department• Department for Coopera on with the
Codex Alimentarius Commission • Department for Development and
Coopera on with Laboratories • Beverages and Water Department Crisis and Urgent Cases Management Sector• Department for Coopera on with
Interna onal Project Organiza ons Sector of Offi cial Control, Traceability, Risk Management and Risk Informa on
As inferred, the FSA performs a range of scien fi c ac vi es (e.g. gathering and analysing data on food and feed and risk analysis), provides scien fi c opinions to government, and implements interna onal conven ons and trea es in the domain of feedstuff safety. Addi onal tasks include the control of food safety inspectors at en ty level, proposing to the Council of Ministers which food safety offi cial laboratories should be nominated “Reference Laboratories”, the development of a register of business operators and improving consumers’ awareness and others. The FSA follows the structure of similar ins tu ons in other EU countries.
The establishment of the FSA has made it possible to update and adjust food laws in Bosnia and Herzegovina so that they are in line with EU standards, thereby safeguarding the well-being of ci zens. Already, the Food Safety Agency par cipates in the Rapid Alert System for Food and Feed (RASFF), which enables swi communica on between par cipants on quickly evolving situa ons.
The need to keep up with the trends of other states (especially EU member states) is clearly an impera ve for the FSA, given the interdependence of the markets in Bosnia and Herzegovina and the need for rapid ac on in cases of contaminated food, or other global crises. Un l now, MoFTER has taken the lead on a number of issues regarding food safety. However, the responsibility for food safety remains shared between the na onal and en ty-level authori es, crea ng diffi cul es in responding immediately to rising food concerns and amending regula ons.
5.1.4 En es Ministries of Agriculture and the Department in Brčko District
Whereas RS has just one En ty MoA, which is in charge of en ty policy and subsidies, FBiH has one en ty MoA and below this 10 canton authori es, which share competencies on subsidies with the en ty level. The amended Law on fi nancial support to agriculture and rural development of the Federa on defi nes the types of incen ves between Canton and the Federa on. However, product subsidies feature more prominently in the fi nancial support structure than rural development measures.
There is no harmonized policy across the en es and BD for providing subsidies, and they are currently, among others, a mixture of area payments of diff erent sizes and for diff erent crops, product support and in-kind contribu on of blue diesel and fer lizers. The subsidies are not aligned with the EU agricultural policy measures, which favour area
66 Rulebook is a concept used in BiH administra on for by-laws.
80
payments.67 The budget for agriculture and rural development in the en es remains low. The lack of an effi cient administra on is impeding the compe veness of farmers and the agri-processing industry throughout the country. Also due to the lack of a Ministry of Agriculture at state level, the situa on is ineffi cient.
5.2 Agricultural policies for cereals including the processing sector68
The Republika Srpska has a strategy for agricultural development in place for the period up to 2015 and the Brčko District has developed the Strategy for Development of Agriculture, Food and Rural Development (2009–2013). However, the Brčko Strategy was never approved. FBiH is working with the Mid-term Strategy for Agriculture Sector Development (2006–2010), which was updated un l 2012 through an ac on plan, and offi cially extended for two years. The RS rural development strategy and ac on plan and the FBiH harmoniza on programme for agriculture, food and rural development have not yet been harmonized with the State-level framework. An overall lack of implemen ng legisla on and of enforcement is impeding the coordina on of harmonized strategies and development in this area.69
Despite various approved and non-approved strategy documents, the GoBiH has always emphasized the importance of increased wheat produc on. However, these documents have not set out the economic case, and the costs and benefi ts, of producing more cereals. There are important diff erences between the en es on how to support the produc on of cereals, as will be spelled out later in this sec on of the report. The FBiH support for the produc on of cereals by area payments has increased the area sown with cereal. RS aims to increase yields through inkind support to fer lizers and blue diesel (input factor support) without necessarily increasing the sown area.
5.2.1 Federa on of BiHFBiH’s opera onal programme for agriculture, food and rural development is currently under revision. It will include ac vi es related to establishment of a Payment Agency and prepara ons for the management and implementa on of an IPARD programme. More generally, the strategy highlights the sustainable development in agriculture and the food processing industry, as well as profi tability and compe veness. In addi on, the FBIH Government sees the provision of a suffi cient quan ty of good quality food to consumers at reasonable prices as a priority.
Agricultural budget
Looking at the 2002–2010 period, total budgetary support for the agricultural sector, including rural development, increased from BAM 11 million in 2002 to BAM 82 million in 2010.
The most substan al part was the market price support, and in 2010 the absolute fi gures were the highest ever with BAM 4.44 million under market support measures, and BAM 52.48 million under direct support measures. Payments on the basis of output were BAM 24.08 million and payments per head of animals or per hectare were BAM 27.98 million. The support of inputs was small with BAM 429,000 and other direct payments were only BAM 229,000.
The situa on under rural development support is slightly diff erent. Axis 1 referring to the EU regula on 1698/2005 – improving the compe veness of the agricultural and forestry sector – had a budget of BAM 16.67 million in 2010, Axis 2 (improving the environment and the countryside) of BAM 421,000, Axis 3 (diversifi ca on of the rural economy) of BAM 3.02 million and others of BAM 21,000. The total rural development budget was BAM 20.13 million in 2010.In 2008 it was BAM 29.87 million and in 2009 it
67 European Commission: Bosnia and Herzegovina 2011 Progress Report, Working Paper October 2011. p 68 The individual en ty strategies and programmes for agricultural and rural development are reviewed in more
detail in other sector reports prepared under this assignment; see for example the sector report on the Meat and Dairy sector and the report on Fruit and Vegetables. 43
69 European Commission: Bosnia and Herzegovina 2011 Progress Report, Working Paper October 2011. p 43
81
was BAM 24.27 million. The budget was over the years reduced in favour of direct support, which is not in line with EU policies.
The last item in the budget is general services in agriculture. This has been more or less stable over the last four years and in 2010 it was BAM 4.36 million.70
It must be pointed out that the BAM 55 million allocated for agriculture in the 2011 budget also includes around BAM 20 million to be used for services and commitments from the previous period, which means that the remaining budget of BAM 35 million is considerably reduced and shows some parallels to the situa on in RS, see below.
Subsidies specifi cally for wheat and maize
Of the BAM 55 millions in the budget for 2011, BAM 1.75 million was used to support the cereal sector. In the past, and un l 2010, the support system was based on a premium per kilogram of wheat produced. FBiH at en ty level (BAM 0.10 per kg) and at canton level (BAM 0.02 per kg) together BAM 0.12 per kg were paid to farmers for mercan le wheat in 2010 and BAM 0.10 in the period from 2007 to 2009, if a minimum of 1 hectare was sown or the minimal produc on was 4 tonnes.
Since 2011, the system has been changed towards a per hectare premium. The FBiH now supports wheat produc on with BAM 500 per hectare. To obtain this support the farmer must sow a minimum of one hectare of wheat and must use cer fi ed seeds. This is demanded in order to increase yields through appropriate use of high quality cer fi ed seeds. Finally, the farmer has to show an invoice proving that the wheat was sold to an authorized trader or buyer.
FBiH does not subsidize maize produc on at en ty level. However farmers can obtain subsidies for growing maize at the cantonal
level. This cantonal support was BAM 2.38 million in 2008, BAM 0.28 million in 2009 and BAM 0.67 million in 2010.
Besides the hectare premium for wheat there is also a support scheme in place called “guaranteed price for mercan le wheat”. This guaranteed minimum price at farm level was BAM 0.40 per kg in 2009, BAM 0.35 per kg in 2010 and BAM 0.43 per kg in 2011.
Finally, the Commodity Reserve also provides support. If agricultural producers in FBiH submi ed trade (purchase) applica ons to the Federal Commodity Reserves Directorate before the date on which the Decision was adopted, following the agreement on co-fi nancing of autumn sowing of the 2011 wheat harvest, the Federal Commodity Reserves Directorate will purchase all contracted quan es of wheat, as long as the wheat corresponds to the standard quality71 and is produced with a yield of up to 4.5 tonnes per hectare. The purpose of this support is to protect producers from unfavourable market trends72 and to keep a safety net under the farmers in case of falling prices.
In FBiH, unlike in RS, there is no input support in kind for fer lizer or blue diesel. However, there are on-going discussions to amend the Law on Excise Du es in Bosnia and Herzegovina for the purpose of introducing the so-called blue diesel (dyed fuel) for farmers.73 This kind of support would be in line with the World Trade Organiza on (WTO), as it does not have a great infl uence on the prices of agricultural products.
5.2.2 Republika Srpska
Besides saying that rural areas have the basic func on of producing food to sa sfy the nutri onal needs of the popula on,74 the RS strategy for agricultural development men ons
70 All fi gures from the federal and cantonal ministries of agriculture, water management and forestry. 71 Standard quality of mercan le wheat is the same as in former Yugoslavia and includes three issues: moisture
maximum 14 percent, test weight minimum 76 kg/hl and admixture (foreign materials) maximum 2 percent. 2011.72 Federal Ministry of Agriculture, Water Management and Forestry, website h p://www.fmpvs.gov.ba73 Federal Ministry of Agriculture, Water Management and Forestry, website h p://www.fmpvs.gov.ba74 Republika Srpska: Rural Development Strategy 2009–2015. p 98
82
nothing about the importance of cereals, self-suffi ciency, strategic reserves or other items closely linked to cereal produc on.
However, the RS Ministry’s strategy indicates that the long-term objec ves of agrarian development in the Republika Srpska primarily are to increase the scope and adjust the structure of agricultural and industrial produc on, so as to provide long-term food related safety including self-suffi ciency, strategic and opera ng reserves, and con nuous growth of exports. Furthermore, the Web site men ons that another objec ve is “a stable market for agricultural and food related products”.75
Agricultural budget
In 2010, the RS agricultural budget for support to farmers (excluding staff ) was BAM 80 million distributed with 50 percent in rural development investment support and 50 percent in direct payments. BAM 37.4 million was used for direct payments, and BAM 41 million was used for rural development support measures. In 2011, the budget was reduced to BAM 60 million (66 percent in investment support, 33 percent in direct payments) with BAM 20 million paid as compensa on for fl ood damage (December 2010).
The agricultural budget and account for the years 2007 to 2011 (only budget) is presented below.
Subsidies specifi cally for wheat and maize
The subsidy system in RS is complicated and dynamic, as we try to show in the following sec on.76
For the spring sowing in 2008 direct payments of BAM 200 per hectare for maize and for wheat have been paid to farmers. For the autumn sowing in 2008 direct payments of BAM 250 per hectare winter wheat was paid.
From 2009 the system was changed. For the spring sowing in 2009 of wheat and maize eligible applicants received BAM 76.89 per hectare as a subsidy for their euro diesel (120 litre/hectare) consump on and as a subsidy for their fer lizer NPK 15:15:15 consump on (260 kg/hectare). This payment was not a direct payment as the subsidies in 2008, but was the value of a 20 percent subsidy of the total price of euro diesel and fer lizer. This means that the farmers could buy euro diesel and fer lizer directly from the Government for a reduced price and with deferred payment for 6 months. This was the only sowing-related measure compared to the subsidy of BAM 200 per hectare in 2008 for spring sowing and BAM 250 per hectare for autumn sowing. The farmers had to send in an applica on form, including the sowing plan with personal data, and have suffi cient land parcels in the farm register to be eligible to purchase these subsidized products.
Table 5.1: RS agricultural budget 2007–2011, million BAM
Budget topic 2007 2008 2009 2010 2011
Total payment of agricultural budget 60.7 104.7 53.2 95.4 62.2
Planned nominal budget, million BAM 60 80 80 80 60
Realloca on, million BAM 10 24.9 1.3 0.3 n.a
Direct payments, million BAM 44.8 83.1 38.5 37.4 40
Rural development, million BAM 13 17 14 41 20
Total RS budget, million BAM 1,250 1,500 1,600 1,638 1,600
% of executed agricultural budget to the RS budget 5.4 7 5 6 4.5 Source: RS MoA, 2012
75 Website of the representa on offi ce of the Republika Srpska in Brussels: h p://www.rep-srpska.eu/ agriculture_rs.php?lng=en&sec on=9&page=2
76 Based on informa on from RS MoA, Vladislav Tri ovic, 2012
83
For the year 2010, the support was paid for the autumn sowing 2009 of winter wheat with BAM 235 per hectare through distribu on of subsidized euro diesel (100 litre/hectare) and KAN fer lizer (100 kg/hectare), and for the 2010 spring sowing of maize with BAM 455 per hectare through distribu on of subsidized euro diesel (100 litre/hectare), KAN (100 kg/hectare) and NPK 15:15:15 fer lizer (250 kg/hectare). These amounts of subsidies were the fi nancial eff ect of subsidized prices of euro diesel and the fer lizer, because the Government of RS decided to write-off 100 percent of the prices of the input. In the fi rst place it was decided that subven on in 2010, as it was in 2009, should be 20 percent of the total prices for distributed raw materials. At the end of 2010, a er the serious fl oods in June and in December of 2010, the government of RS decided to write-off all debt of all farmers for the subsidized raw materials.
In this way the December fl ood had consequences for support payments, since the budget for support payments for 2011 was reduced by 50 percent, and the money was reallocated to emergency aid in the form of write-off s of farmers’ debt for purchase of input from the Government. The budget for support payments (total agrarian budget) was reduced by BAM 20 million (EUR 10 million).
For the spring sowing 2011 of wheat and maize farmers again received cheaper diesel and fer lizer, and the fi nancial result was a nominal subsidy of BAM 57.50 per hectare of subsidized prices of euro diesel and fer lizer: 100 litres of euro diesel and 250 kg NPK 15:15:15/hectare, with a 25 percent subven on of the total costs. A er a long
drought in 2011 the Government decided at the end of year to increase subsidies from 25 percent to 40 percent. This resulted in subsidies of BAM 93.00 per hectare.
For the autumn sowing of wheat, the ministry again implemented direct payment support per hectare of BAM 250, with a minimum sowing area of 2.00 hectares of wheat. This measure is in line with the new “Programme of improvement of mercan le wheat produc on in RS 2011-2016”.
The system does not seem to be very transparent for the farmers, and it lacks con nuity, which is essen al for long-term planning. The fl uctua ons in the real support per hectare makes it diffi cult to plan the produc on. Furthermore, this type of in-kind support requires big administra ve control costs since each farm must be checked on the spot as to whether agroinputs have been applied according to regula ons, and if a minimum yield could be obtained so that the in-kind support is jus fi ed. An area based payment system, as the one implemented in 2008, seems to be a be er, simpler and more transparent solu on, in line with the area payment in the EU.
5.2.3 Brčko District
The Strategy for Development of Agriculture, Food and Rural Development (2009–2013) men ons several strategic and opera onal goals such as intensifying crop produc on and suppor ng revitaliza on of the food processing industry. However, due to suffi cient cereal produc on in the BD, a special emphasis on wheat and maize is not considered necessary.
Table 5.2: Subsidies for improvement of agriculture in District Brčko 2002–201077
EUR 1,022,583 766,937 1,124,842 2,045,167 2,045,167 2,359,612 2,556,459 3,315,727 2,556,459Source: Government of BD, Exchange rate: 1,95583
77 The table as well as other tables refl ects the informa on and the me series provided by the en ty and district authori es.
84
Agricultural budget
Being much smaller than the other two en es means that the BD has a small budget for subsidies for improving agriculture. The overall budget increased by 150 percent between 2002 and 2010, from BAM 2 million to BAM 5 million. In 2009 it was BAM 6.49 million, but it was again reduced in 2010.78
TSubsidies specifi cally for wheat and maizeBD represents con nuity in its support to wheat and maize produc on. Since 2007 and un l 2011 the subsidy per hectare to wheat has been BAM 300 per hectare, and support to maize has been BAM 250 per hectare. The fi gures are presented in the table below.
Finally, it should be men oned that a commodity reserve with a minimum price is not in place in BD.
5.3 Taxes (VAT)
Revenues in BiH directly or indirectly linked to agriculture can be grouped as (i) sales taxes, (ii) special taxes (excises) on tobacco, coff ee, alcohol, non-alcoholic beverages and beer, (iii) fees and charges – for water, forest or land use and for quality control.79
The Value Added Tax (VAT) rate in Bosnia and Herzegovina is 17 percent and applies to most goods and services. The Indirect Taxa on Authority is in charge of the calcula on and collec on of VAT. VAT is levied at the state level and is applicable to goods and services provided for considera on. Registra on is compulsory – also for farmers – if the annual
Table 5.3: Subsidies to wheat and maize per hectare, 2007–2011, BD
value of produc on sold exceeds BAM 50,000. A company may register voluntarily if the threshold is not met. Once entering into the VAT system, a taxpayer cannot opt out for fi ve years.80 A farmer producing more than 100 tonnes for the market, which involves around 25 hectares of wheat, has to register for VAT.
5.4 Support from the extension service
In FBiH, extension services are provided by the Cantonal Extension Services and those Ins tutes that have a role in extension service provision (38 posi ons in total), but the commitment of most Cantons was limited and no central services were established to support the system.81 Discussions are on-going to introduce an advisory service at en ty level. This would give the FBiH MoA the opportunity to signifi cantly infl uence the quality and direc on of advisory services to farmers.
Extension services are provided in Republika Srpska by the Agency for Extension and Advisory Services (38 posi ons, no informa on on vacancies). In Brčko District, the Department of Agriculture and Rural Development (DARD) has three advisors. Agricultural extension services were established at en ty level in RS in 2000 and in the Brčko District in 2002 with the support of an EU project. In RS the established system remains opera onal and includes municipal based advisers in most areas, supported by a central support unit with specialist adviser capacity, based in Banja Luka. Generally, the service appears to be well appreciated and
78 Government of BD79 European Union Func onal Review of the Agricultural Sector in BiH. October 2004. p 9980 h p://www.taxrates.cc/html/bosnia-herzegovina-tax-rates.html81 European Union SESMARD Bosnia and Herzegovina – Agriculture Report 2007. p 42
85
used, although it remains poorly equipped, under-funded and generally under-staff ed.
No informa on is available on the numbers of private companies providing farmers with extension advice either as ‘free’ advice linked to purchase of agricultural inputs or as a paid commercial service. In addi on to government-funded extension services, BiH universi es and other ter ary and secondary ins tutes make signifi cant contribu ons to direct educa on and training (extension services) for farmers, either on their own ini a ve or on the basis of engagement by producers’ associa ons, coopera ves, and municipali es, interna onal governmental and non-governmental organiza ons. In addi on, interna onal ins tu ons and organiza ons play a very important, if not the most important, role in transfer of knowledge, techniques and skills to farmers as well as in technical support in BiH through implementa on of various projects in the sphere of agricultural produc on development. For example, during the last three and a half years, the USAID LAMP project trained over 20,000 people, mainly in dairy and fruit and vegetable produc on, with over 275 experts from ins tu ons like the government extension services, veterinary ins tutes and chambers of commerce being trained to give further training. The World Bank, the Interna onal Fund for Agricultural Development (IFAD), Italy, Norway, Switzerland and Sweden supported several projects with important outputs of training and extension.
Although impressive numbers of people have been trained as a result of these projects, the absence of an offi cial strategy does not allow building on these new capaci es to favour further skills and knowledge transfer. Systema c collec on of informa on will enable gaps to be iden fi ed and will maximize possibili es for making use of less expensive local consultants and experts able to cover new subjects or geographic gaps. This ac vity will also help generate more interest amongst donors who are increasingly under pressure to demonstrate the sustainability of their projects.
5.5 Land property and reforms
The war from 1992 to 1995 forced many people to migrate, either within the country or to other countries and in many cases people did not return to their farms and therefore gave up farming. Furthermore, not all did return to farming, as they did not have enough money to invest in restar ng agricultural ac vi es. An important issue is that heavy equipment to clear land for agricultural purposes is not available, and due to these farmers willing to increase the size of their farms is blocked, as the available land cannot be cul vated with the exis ng agricultural equipment.
However the most urgent problem seems to be that, especially due to the war, land tles and the cadastre are not up to date and
many ownership structures are unclear. The lack of legal security is a major problem for the func oning of the land market in terms of selling and ren ng agricultural land, and due to lack of adequate regula on on how to rent out land with temporarily unclear ownership, the consolida on of the land market is very slow.
During the fi eld visits it was learned that land lease prices are around BAM 100 per hectare and in more favourable areas like Bijeljina up to BAM 300 per hectare. However, in the North-east of Bosnia and Herzegovina some farmers are providing land for free to their neighbours to work, simply to keep it in good shape. Also, the Government provides concessions for agricultural land, mainly from former state coopera ves.
The need for consolida on of fragmented farm holdings into more viable economic units is recognized as one of the most pressing agricultural policy issues in BiH today. The EU points out that land registra on systems are not harmonized and that land management requires strengthening, and this is ongoing.82
5.6 Commodity reserve and its purpose
Since the shock in 2008, when Serbia and Croa a banned wheat exports due to the
82 European Commission: Bosnia and Herzegovina 2011 Progress Report. Working Paper October 2011. p 44
86
fl uctua ons in world market prices, the Government of BiH has been concerned with wheat reserves, as every year there is a huge import demand, see next chapter of this report on trade. Several discussions about the importance of a strategic commodity reserve including wheat have been held in the country, although without a clear diff eren a on between the importance of the permanent reserve, which would be used to supply the needs of the popula on in emergencies, and commercial reserves to be used to intervene in markets, if needed.
The situa on is analysed in detail in the recent FAO study “Policy op ons and recommenda ons for food commodity reserves in BiH” by A. Cerne (2011).
Eff orts to have a commodity reserve in FBiH and in RS have been made, while there is no commodity reserve in the district of Brčko.
In FBiH we fi nd a divided responsibility for the commodity reserves between the federal level and the canton. The objec ve of the commodity reserves is to make food available for people also in case of disasters, etc. No interven ons in market imbalance situa ons are legal according to the design of the system in FBiH. In general the FBiH purchases cereals for a minimum price through tender procurement procedures, where contractors can provide off ers for volumes of cereals to the given minimum price. If market prices fall below, the market prices are used. In 2010, BAM 4 million was budgeted for commodity reserves, and of these resources
Table 5.4: Needed reserves of cereals, es ma ons, kg
Area PersonsDaily consumed quan ty Reserves needed
Source: BiH Ac on Plan for Food Security. FAO. 2011.
BAM 2 million was used for purchasing new products and goods.
In RS there is a well-ar culated strategy for commodity reserves implemented by the State Material Reserves of RS. The authori es can intervene in the market in the case of disaster, war and the like, but also in the case of imbalances in the market, which cannot be managed by tradi onal policy instruments. RS has an amount of BAM 9 million in product reserves, and an annual budget of BAM 2 million for all commodi es.
The conclusion of the FAO Government study is that the purpose of a commodity reserve is to provide basic food products to the popula on in mes of crisis. The crea on and maintenance of commodity reserves should not aff ect the current market supply and thereby distort the free func oning of the market.83
In the table below, the es mates of a needed commodity reserve for selected cereal products to cover the consump on for a period of 60 days is presented. The es mates are based on the assump on of a daily consump on per capita of 0.4 kg wheat, fl our and pasta and 0.04 kg of maize (edible) for the popula on in BiH, also distributed in en es and BD.
The es mated total reserve should be in the range of 100,000 tonnes of wheat, and 10,000 tonnes of maize. Actually, the budget of the two en es is between BAM 2 and 4 million annually.84 To keep a reserve of 100,000 tonnes of wheat, the authori es
83 Cerne, A. FAO TCCT Consultant: Policy op ons and recommenda ons for food commodity reserves in BiH. 2011. p 384 Bajramovic, S. FAO consultant: The legisla on concerning food security policy in BiH. 2011. p 2ff
87
must provide fi nancing of around EUR 20 million with a minimum price of EUR 200 per tonne (BAM 400 per tonne).
The ac on plan is currently submi ed to en es and BD for comments and it is expected that it will be approved later in 2012.
Finally, it should be men oned that the EU does not require that a commodity reserve be maintained. On the other hand, the EU intervenes in the market by se ng a minimum price (interven on price) for wheat, which is EUR 101.31 per tonne. The minimum price within BiH is around twice as high as the EU interven on price, which will be binding when and if BiH joins the EU.
5.7 Credit Lines for Agricultural Investment Projects
Market fl uctua ons, not only due to unpredictable world market prices, but also due to changes in local support policy as described previously in this report, make it diffi cult for farmers to calculate agricultural investments precisely. It is therefore risky for farmers to fi nance investments with credit, which has to be paid back in due me.
Eff ec ve interest rates on short-term loans range from 8 percent in FBiH to 9.5 percent in RS. For physical en es the rates are higher than for the economy. Natural persons pay average eff ec ve interest rates on short-term loans of 12.6 to 13.7 percent, and on long-term loans of 9.5 to 10.5 percent.
Banks do not favour agricultural producers for loans, because the banks s ll consider them to be high-risk borrowers. Therefore, interest rates on agricultural loans to individual farmers are higher than for other users, although the required guarantees are the same, if not even more rigorous. Proper es in rural areas (agricultural land and buildings) are generally not accepted as collateral, and the alterna ves are the natural person’s guarantees (guarantors) that agricultural producers fi nd it diffi cult to come up with. As a result, farmers get most of their loans from microcredit organiza ons. The excep ons are the projects
from the World Bank and IFAD, which provide funds under favourable condi ons.
Examples of typical bank loans available to farmers and small and medium-sized enterprises (SMEs) are:
NLB Tuzlanska Banka approves loans (including to farmers) up to BAM 50,000 on sevenyear terms and with an eff ec ve interest rate of 12.29 percent; Nova Bank AD Banja Luka approved short-term loans to individual farmers for the procurement of raw materials, agricultural equipment and spare parts. Loans are up to BAM 10,000. The repayment period is up to 12 months and the eff ec ve interest rate is 13.17 percent. Guarantors are also required (one for loans of up to BAM 5,000, and two for loans of between BAM 5,000 and 10,000). Long-term loans are only available for borrowers in Herzegovina for a period of 10 years and at an eff ec ve interest rate of 11.85 percent. Loan amounts depend on credit worthiness of the borrower; BOR bank in FBiH off ers loans for export-oriented programmes and the agro processing industry from BAM 50,000 to BAM 1 million, with a repayment period of eight years, a grace period (for agriculture) of up to three years and an eff ec ve interest rate of 6.96 percent; Bobar Bank Bijeljina off ers a specifi c type of loan to farmers for buying tractors, in coopera on with suppliers. The repayment period is up to 36 months, benefi ciaries must contribute 40 percent of the costs and the eff ec ve interest rate is 12.7 percent. The same bank approves short-term loans (12 months) of up to BAM 500,000 to agricultural enterprises at 12.07 percent eff ec ve interest rate (EIR) and loans for company purchases of agricultural machinery for a period of fi ve years at EIR 9.94 percent. Loan amounts depend on the needs and the credit worthiness of the borrower; Bosnia Bank Interna onal Sarajevo provides long-term loans for agriculture for physical en es (for the purchase of land or agricultural machinery and construc on or renova on of
88
buildings for agricultural purposes) with loan terms of up to 10 years. Loan amounts depend on the credit worthiness of the borrower and interest rates are unspecifi ed; ProCredit Bank approves loans of up to BAM 50,000 to farmers. For working capital the terms are up to 24 months, and for fi xed assets for up to 84 months.
Generally speaking, most of the banks have no tailor-made off ers related to agricultural produc on.
Investment Development Bank of RS and Development Bank of FBiH
The MoA of FBiH has established a favourable credit line to fi nance agricultural long-term investment projects through the Development Bank of FBiH. The scope of investments in agriculture includes crop and vegetable produc on, livestock (ca le, sheep, pig, poultry, beekeeping and fi sh farming), and mul -annual planta ons, the installa on of glasshouses and greenhouses as well as the construc on of facili es in the food industry (packing, grading and sor ng facili es, fi nishing and processing of fruits and vegetables, and milk, and cooling storages for fruits and vegetables). The investment schemes foresee that 25 percent of the investment is ensured by grant funds from the MoA, 25 percent of the investment is ensured by the investor and 50 percent is provided by the Development Bank loan. The loan repayment period is set at 13 months to 10 years, depending on the type of investment undertaken, with a grace period of up to 36 months also depending on the type of investment undertaken (but mainly for orchards and vineyards). Development Bank credit lines are distributed through 18 commercial banks in FBiH to all types of entrepreneurs (legal or natural persons), including farmers.
The Development Bank has a credit line to encourage new employment and within this framework it approves loans for up to seven years with grace periods of up to 2 years and 3.28 to 3.36 percent eff ec ve interest rates. The maximum loan amount is BAM 10,000
per newly employed worker in agriculture produc on. (However, in prac ce investments are o en made to reduce labour costs rather than to create jobs.)
The Investment Development Bank (IDB) of the Republika Srpska prac cally operates as a fund because it does not distribute loans directly to customers. Loans are provided through banks and microcredit organiza ons (MCOs) with which it has signed agreements (almost all banks and MCOs based in RS). The IDB has nine credit lines of which two are exclusively intended for agriculture; namely, a credit line for micro business in agriculture and a credit line for agriculture. The unique condi ons of lending (which must be accepted by all intermediaries who use the funds of IDB) for micro business in agriculture are:
Benefi ciaries: persons registered in the Farm Registry; Purpose: procurement of fi xed and current assets; Loan amount: BAM 5,000–50,000; Repayment period: up to 10 years; Grace period: up to 36 months; Interest rate: the basic interest rate is 5.9 percent (for underdeveloped municipali es 5.4 percent, and for members of a cluster 5.6 percent).
The unique condi ons of lending (which must be accepted by all intermediaries who use the funds of IDB) for agriculture are: Benefi ciaries: legal en es and entrepreneurs engaged in produc on or processing of agriculture or aquaculture; Purpose: procurement of fi xed and current assets and refi nancing of exis ng obliga ons; Loan amount: BAM 30,000–5,000,000 for fi xed assets and BAM 10,000–2,000,000 for current assets for legal en es. BAM 5,000–500,000 for fi xed assets and BAM 5,000–100,000 for current assets for entrepreneurs (natural persons); Repayment period: up to 15 years for fi xed assets and up to 5 years for current assets;
89
Grace period: up to 36 months for fi xed assets and 12 months for current assets; Interest rate: the basic interest rate is 5.1 percent (for underdeveloped municipali es 4.6 percent, and for members of clusters 4.8 percent).
Although the disbursement of credits for agriculture have been below what was planned, they have s ll been quite signifi cant with BAM 66 million over the last three years.
Leasing
In Bosnia and Herzegovina, leasing services are provided in accordance with the laws on lease of the FBiH and the RS. Of all the companies providing these services, eight were registered in FBiH, with 28 branch offi ces in the territory of the Federa on BiH and 7 subsidiaries in the territory of the RS. An established leasing company based in the RS has been liquidated.
The nega ve eff ects of the global economic and fi nancial crisis halted the growth of leasing companies that experienced the peak of their ac vi es in the period 2006–2008. During 2009 there was a signifi cant drop in claims for lease, while during 2010 there was a slight recovery.
In 2009, the leasing sector in BiH had a loss of BAM 102 million, which was more than the capital of the sector, although largely infl uenced by the nega ve performance of the largest leasing company. Total write-off s based on lease were BAM 158 million only in that year. The total assets of leasing companies in BiH in 2010 were in FBiH BAM 1.1 billion, and in RS BAM 80 million. The number of ac ve contracts was 5,566, and the volume of leasing receivables approved in 2010, BAM 245 million. The leasing market is dominated by leasing of cars and terrain vehicles (52 percent) and machinery and equipment (33 percent). Real estate accounts for about 15 percent. Physical persons use the services of leasing for about 10 percent, and legal en es for about 90 percent. The average weighted interest rates, depending on the subject of leasing, have usually ranged from 10–12 percent in 2010.
Services and fi nancial and opera ng leases are much more important for companies from the sectors of primary agricultural produc on and food industries, and minor for farmers, entrepreneurs with the status of physical en es. In general leasing of agricultural machinery is not yet common, even if some dealers of agricultural equipment, as at the INTERAGRO Bijeljina Fair in September 2011, off ered their tractors on a zero percent leasing base.
5.8 Summary
At state as well as at en ty and district level policies are being prepared along the lines of EU regula on. Ins tu ons relevant for the cereals sector, such as the Food Safety Agency and the Plant Health Protec on Agency are preparing for EU candidate status and are aligning their organiza on, their ac vi es and their regula ons to EU requirements.
However, it is also clear that the en es and BD create many varia ons in the prac cal implementa on of the policies.
Regarding cereals, there is no harmonized policy across the en es and BD for providing subsidies, and they are currently, among others, a mixture of area payments of diff erent sizes and for diff erent crops, product support and in-kind contribu on of blue diesel and fer lizers. The subsidies are not aligned with EU agricultural policy measures, which favour area payments.
The budget for agriculture and rural development in the en es remains low. The lack of an effi cient administra on is impeding the compe veness of farmers and the agri-processing industry throughout the country. Also due to the lack of a Ministry of Agriculture at state level, the environment for the farmers in the country lacks transparency and creates diff erent condi ons for produc on from one area to another. There is a need for harmoniza on and alignment of subsidies and enforcement of legisla on across the diff erent en ty and district borders. This is the case not only for cereals produc on, but also for agriculture in general.
90
91
6. MARKET AND TRADE
This chapter of the report provides informa on about the trends in cereals trade in BiH, including data on exports and imports of cereals, milled products and secondary processed products.
6.1 Wheat
The only wheat produced in Bosnia and Herzegovina is so wheat (Tri cum aes vum), which is mainly winter wheat. Summer wheat is usually grown just in case the drilling of winter wheat was not possible, or if there was a winter killing. However, for summer wheat, there are unexploited areas in the high-land area, if the market is suffi ciently a rac ve.
6.1.1 Wheat supply chain: From farmers to mills and secondary processing
The wheat supply chain is built on farmers, traders and elevators, millers, bakers/processors, retailers and consumers. Wheat is produced mainly for human consump on with only small quan es of poorer quality wheat marketed as feedstock.85
Farmers
Farmers in BiH are mainly smallholders with mixed farms and many of them plan ng with limited inputs use (see also Chapter 2). The larger farmers who grow mercan le wheat have 15 hectares of land or more planted with wheat and yield considerably more than the BiH average of 3.69 tonnes per hectare. Farmers try to sell their surplus to the elevators although they o en fail due to the poor quality of the product. In such cases they then use it as fodder on the farm.
Furthermore, there are s ll many families in rural Bosnia and Herzegovina who bake their own bread, and most farmers keep a few tonnes of wheat on their farms.
Elevators
The elevators serve two primary purposes. First, they provide a mechanism for accumula ng and combining the produc on of several individual wheat producers. Second, this link provides storage because wheat is a seasonal commodity. In essence, the elevators’ func on is solely logis cal. As a result, this ac vity is par cularly infl uenced by transporta on. Elevators also provide numerous addi onal services including cleaning (removing non-wheat ma er), inspec on (iden fying and measuring various quality a ributes), and blending (combining por ons of wheat of various quali es in order to a ain a certain specifi ca on of certain quality a ributes).
In the past, Bosnia and Herzegovina had several large fl our and feed mills which also acted as elevators as they were obliged to maintain certain storage capaci es. Some of these mills are s ll in the process of priva za on while others have folded because they cannot aff ord to refurbish their premises. Finally, some are used solely as elevators due to their storage capaci es; for example, the former mill “Husinski rudari” renamed “Mlin i Pekara” in Ljubace is now owned by KLAS and used only as a storage place.
Milling
The second link in the wheat supply chain is milling. The by-products are usually used as livestock feed, pet food, and in industrial applica ons. The milling sector is described in more detail in Chapter 4.
Baking
The baking and confec onery industry is the milling industry’s most important client. The wholesale baking industry is composed of manufacturers of bread, cakes, and related products, as well as cookie and cracker
85 Barber, J. & Titus, M.J. Structure of the United States Wheat Supply Chain. Upper Great Plains Transporta on Ins tute (UGPTI) Staff Paper No. 131. 1995. p 1ff
92
manufacturers. The bread and cake segment of the bakery industry consumes the largest amount of fl our. See Chapter 4 for details.
6.2 Maize
Maize is the most important crop in Bosnia and Herzegovina due to its mul ple use and is largely used for on-farm consump on as fodder. When maize is harvested the remainder of the plant is o en used as fodder instead of straw. Besides modern harves ng technology, smallholders also harvest maize using outdated machines and some mes even by hand.
Maize is harvested for its grains and as corn-cob-mix. Green maize is used for silage, a rela vely new technique to conserve the whole plant. The produc on of silage is not yet widespread, partly due to a lack of harves ng equipment. Small-scale farmers do not have the heavy tractors needed for packing the crop and pressing out the air.
6.2.1 Maize supply chain: From farmers to breweries
This supply chain also starts with the farmer and o en goes to elevators and the milling industry and to the feed mills, and the produc on of ca le feed for animal consump on. However, breweries some mes purchase directly from larger farmers. The most substan al part of the farm produc on never leaves the farm in the form of maize but rather in the form of fa ened animals.
6.3 Trade and trade policy
The fi rst joint state-level ac vity related to foreign trade policy under the responsibility of the Ministry of Foreign Trade and Economic Rela ons took place in 1998, when the fi rst BiH customs tariff s were adopted, and suppor ng laws on foreign trade policy were passed. With this legal solu on, customs protec on for agricultural products was provided through four ad valorem duty rates amoun ng to 0 percent, 5 percent, 10 percent and 15 percent. At some later stage, as a consequence of interest pressure, levies for some agricultural products were
added to the ad valorem charges. However, the role of the levy was lost due to its transforma on into fi xed amounts as a result of interna onal pressures (WTO and EU).
The ad valorem du es and fi xed-tariff levies have formed a complex duty for agricultural products, thus making them the best protected within the na onal customs tariff . Yet even duty charges determined in such a manner were s ll much lower than in neighbouring countries and the EU. All this resulted in a disadvantageous posi on for BiH in further nego a ons on the liberaliza on of trade, as they served as a basis for the calcula on of agreed-upon reduc ons.
Membership of CEFTA (2007) essen ally integrated all previous bilateral and mul lateral agreements on free trade eff ec ve at that me, signed by the countries of the region.
This membership provided BiH with important trade concessions and discipline (including trade liberaliza on, a decrease of export subsidies, a decrease or abroga on of tariff s or other trade barriers for domes c products, applica on of interna onally harmonized veterinary regula ons and plant health regula ons with regard to the interna onal trade of food and agricultural commodi es). This is en rely in accordance with trade agreements with the EU, which are an important part of the EU/BiH agreement on stabiliza on and accession. CEFTA is completely compa ble with commitments and advantages derived from WTO membership, for which BiH has offi cially applied.
The rela ons with the EU can be divided in two separate periods. The fi rst period lasted from 2000 to 2007, when BiH enjoyed preferen al treatment in the export of agricultural products to the EU market. This meant that every year the EU issued a special regula on iden fying types, quan es and values of the preferences for import from BiH. The sole condi on was that BiH was to provide appropriate proof of the quality and safety of the products. Unfortunately, BiH producers were not able to meet these requirements, so the majority of the export quota established by the EU remained unu lized.
93
The second period began in 2007, when BiH signed the Stabiliza on and Accession Agreement with the EU. This Agreement (in its sec on on trade) ins tu onalizes the rules of trade between BiH and the EU. However, the EU Council has s ll not ra fi ed it. Accordingly, BiH has been given the possibility to export the majority of agricultural products to the EU market without any custom du es or other charges. For a (small) number of products, the EU reserved a protec on level through customs du es or quotas. On the other hand, BiH has commi ed itself to gradually abolishing customs du es and other charges on agricultural products that come from the EU. For some products, the charges were li ed immediately, while for others, they are being phased out. By 2013, BiH will have a fully liberal trade partnership with the EU, under the condi ons that BiH fulfi ls the requirements.
Other changes to customs tariff s were more in line with the harmoniza on of commitments deriving from the adopted interna onal regula ons and agreements; therefore, they had no signifi cant impact on the protec on
of local produc on. The large foreign trade defi cit that BiH has in agricultural and food products indicates that it has been diffi cult for BiH producers to take advantage of the foreign trade policy and the policy has not been properly u lized.
6.4 Trade balance of cereals86
Over the years covered by this analysis Bosnia and Herzegovina has not been self-suffi cient in agricultural produc on (with the excep on of plums). Therefore large quan es of agro-food produce have been imported and are a burden for the trade balance. In 2006, the gap between agricultural and food imports and exports was about BAM 1,700 million, equivalent to EUR 870 million. In 2010, the value of agricultural exports reached EUR 250 million, whereas the value of agricultural imports amounted to EUR 1,485 million equal to a defi cit of EUR 1,235 million.87 This is an increase in the defi cit of 42 percent or more than 10 percent per year.
The trade balance of cereals, import and export by value (BAM) is described and
Figure 6.1: Total trade of cereals, BiH, 2006–2010, 000 BAM
-300,000
-200,000
-100,000
0
100,000
200,000
300,000
2006 2007 2008 2009 2010
( x 1
000)
KM
importexportbalance
Source: Vesna Mrdalj, Faculty of Agriculture, University of Banja Luka, 2011; PPP, 30 May 2011, and RS and BiH Agency for Sta s cs, various years
86 Bajramovic, S. FAO consultant: The status and constraints of the agricultural sector in BiH and the country food security situa on. 201. p 18ff
87 h p://www.fao.org/countries/55528/en/bih/
94
presented in fi gures below. The total trade defi cit in cereals in 2010 was BAM 166.2 million, due to imports of BAM 194.3 million and exports of BAM 28.1 million. It is a minor increase from 2009, but the level is s ll lower than in the years 2007 and 2008, where the defi cit was below BAM 200 million. Exports are increasing and show their highest level in 2010 with BAM 28.1 million.
Figure 6.2: Import and export of cereals between BiH and the EU, 2006–2010, 000 BAM
Source: Vesna Mrdalj, Faculty of Agriculture, University of Banja Luka, 2011; PPP, 30 May 2011, and RS and BiH Agency for Sta s cs, various years
Figure 6.3: Wheat trade, BiH, 2006–2010, 000 BAM
-200,000
-150,000
-100,000
-50,000
0
50,000
100,000
150,000
200,000
2006 2007 2008 2009 2010
(x 1
000)
KM import
exportbalance
Source: Vesna Mrdalj, Faculty of Agriculture, University of Banja Luka, 2011; PPP, 30 May 2011, and RS and BiH Agency for Sta s cs, various years
The trade in cereals with the EU is almost exclusively characterized by imports with exports being only BAM 0.4 million in 2010. Imports fluctuate substantially, and the level in 2010 was BAM 88.4 million for imports. In 2008, the import level was more than BAM 150 million, while the average for the period is BAM 86 million for all five years, but only BAM 69 million,
95
if the year 2008 is subtracted from the calculation.
In 2009 and 2010 wheat and maize exports were low. The trade defi cit was BAM 100 million for wheat in 2010 and BAM 50 million for maize.
According to the fi gure below, the total import of cereals from CEFTA countries
Figure 6.4: Maize trade, BiH, 2006–2010, 000 BAM
-600,000
-400,000
-200,000
0
200,000
400,000
600,000
2006 2007 2008 2009 2010(000
) KM import
exportbalance
Source: Vesna Mrdalj, Faculty of Agriculture, University of Banja Luka, 2011; PPP, 30 May 2011, and RS and BiH Agency for Sta s cs, various years
Source: Vesna Mrdalj, Faculty of Agriculture, University of Banja Luka, 2011; PPP, 30 May 2011, and RS and BiH Agency for Sta s cs, various years
in 2010 was BAM 102.3 million, while exports to the CEFTA countries was as low as BAM 3.8 million. The trade defi cit was BAM 98.4 million in 2010. There has been a slow increase in the trade defi cit over the last two years, but the trade defi cit is s ll not at the 2007 level, where the defi cit was BAM 147 million.
96
Maize exports in 2011 were at the level of BAM 4.2 million, while imports were BAM 75.5 million with Serbia the main source of imports.
In 2011 wheat exports declined to BAM 1.03 million and imports increased to BAM 166.2 million.
The import price per tonne of wheat in 2011 was on average BAM 330 per tonne, but the import price from Hungary was only BAM 231 per tonne, while the small exports of wheat were sold at BAM 568 per tonne in 2011.
Hungary is Bosnia and Herzegovina’s most important trading partner in terms of wheat, closely followed by Serbia and Croa a. During the period 2005–2009 wheat imports from
Table 6.2: Import Export Wheat (2005–2010), 000 BAM and tonnes
Source: COMTRADE: h p://comtrade.un.org/db/default.aspx. Average yearly exchange rates between US$ and EUR (EUR per US$) are used as follows: 2011 = 0.748; 2010 = 0.785; 2009 = 0.748; 2008 = 0.711; 2007 = 0.760; 2006 = 0.829; 2005 = 0.804; 2004 = 0.804; 2003 = 0.884, and the exchange rate from EUR to BAM was BAM 1.9558 per EUR. Source: European Central Bank: h p://www.ECB.int
Table 6.1: Import Export Maize (2005–2010) 000 BAM and tonnes
Source: COMTRADE: h p://comtrade.un.org/db/default.aspx Average yearly exchange rates between US$ and EUR (EUR per US$) are used as follows: 2011 = 0.748; 2010 = 0.785; 2009 = 0.748; 2008 = 0.711; 2007 = 0.760; 2006 = 0.829; 2005 = 0.804; 2004 = 0.804; 2003 = 0.884, and the exchange rate from EUR to BAM was BAM 1.9558 per EUR. Source: European Central Bank: h p://www.ECB.int
Hungary were always more than 50 percent of total wheat imports (with the excep on of 2007). In 2008, out of the total of 326,800 tonnes of imported wheat, 274,200 tonnes or (84 percent) was imported from Hungary.
6.5 Balance sheets for wheat and maize
Tables 6.4 and 6.5 present the balance sheets prepared for wheat and maize at BiH level for the years 2006 to 2010. The balance sheets are prepared without considera on of ex ante stock at the beginning of the year and ex post stock by the end of the year. The assump on is then that the stocks (reserves) are constant.88
88 Data from MoFTER shows that the stocks are around 25,000 tonnes per year (2009).
97
The formula for the balance sheet is then rela vely simple: Domes c produc on minus exports plus imports = amount of wheat/maize available for total domes c consump on (industrial, food, feed, etc.). With a popula on of 3,840,000 people in 2011, the average annual consump on per capita is calculated. Finally, the share of the domes c consump on covered by domes c produc on is calculated. Increasing shares of the domes c market covered by domes c produc on indicate an increase in compe veness. Decreasing shares indicate on the contrary decreasing compe veness.
The tables demonstrate that the domes c produc on of wheat has covered a stable share of the domes c market with 40 percent for the years 2006 to 2008, and 43 percent in 2009. In 2010, the share has dropped drama cally to only 22 percent. This is caused by a decrease in domes c produc on as discussed previously in this report. Domes c consump on also declined, but imports increased to capture the share of the market le open due to low produc on in BiH.
For maize the picture is diff erent. The share of domes c consump on covered by domes c
produc on has been rather stable over the fi ve years, with an average of 82.5 percent. From 2009 to 2010 a slightly reduced share (i.e. 85.4 percent to 81.7 percent) is observed, and the market share signals a rela vely high level of compe veness on the local market for maize grain.
6.6 Import subs tu onIn order to es mate a poten al expansion of wheat and maize produc on in BiH, diff erent shares of import subs tu on were es mated: 25 percent, 50 percent, 75 percent and 100 percent. One point is that BiH, on the domes c market, can take advantage of short distances (physically and mentally) to the market, which to some extent can compensate for lack of economics of scale in produc on. It must be emphasized that import subs tu on is considered to be driven by the farmers and not by public interven ons. However, the framework condi ons might be a rac ve and facilitate the farmers in their decisions about an expansion of their produc on based on increased compe veness due to increased yields, produc vity, higher product quality and lower prices.
98
If the GVA per hectare of wheat is BAM 578 (= EUR 295) and for maize is BAM 930 (= EUR 476), see the calcula ons about feasibility of wheat and maize grain produc on, where there are various yields at stake, and the average GDP per capita is BAM 6,468 (= EUR 3,300) in 2010, 11 hectares of wheat and 7 hectares of maize will be needed to produce income for one person. If every family farm household on average is 4 persons, 44 hectares for wheat and 28 hectares for maize will be needed.89
Current produc on could theore cally be based on 255 wheat producers and 909 maize producers with op mal yields, but if yields are lower than that and instead are at level of the fi ve-year average, 347 producers
89 The level of income needed to make a farm viable might not be as high as the average GDP/capita. Value of house rent and cheap access to food might reduce the needed income level. If the needed income is reduced, the needed number of hectares required to generate the income also goes down, and then the number of farms needed to produce the extra volume of cereals goes up. A measurement unit used in the EU is the Economic Size Unit (ESU) equal to EUR 1,200 in gross value added per year. However, there is no general rule sta ng how may ESU are needed to generate a minimum or an average level of income.
for wheat and 1,447 producers for maize will be needed for the current produc on.
If it is possible to subs tute the import of wheat and maize, 609 new or extra wheat farmers for every 25 percent import subs tu on, and 354 new maize grain farmers for every 25 percent import subs tu on will be needed, with 5-year average yields. With op mal yields the need will be lower, 446 wheat farmers and 208 maize farmers, see the next two tables, the fi rst for wheat and the second for maize.
In order to also cover a commodity reserve as recommended by FAO, see Chapter 5 of this report, and as expressed in the ac on plan for a commodity reserve, addi onal numbers
100 186,130 41,362 39,602 23,266 831 1,741Source: BiH Agency for Sta s cs, various years and own calcula ons
99
of hectares are required. The need will be in the range of 100,000 tonnes of wheat and considerably less for maize according to the ac on plan, and this amount of wheat produced with 4.5 tonnes/hectare requires 22,222 hectares. If it is furthermore assumed that the required number of hectares for a viable farm is the same as an cipated in the previous calcula ons and es mated to be 44 hectares, addi onal produc on from 505 farmers is required to contribute to the reserve stocks.
The precondi ons for being able to fulfi l the objec ves of an import subs tu on strategy, no ma er whether it is 25 percent or 75 percent of the current import, combined with the build up of a commodity reserve, are many.
First of all, it is important that economies of scale are achieved in cereal produc on. This will require more land for larger farms, which again will require a well func oning land market, supported by appropriate land consolida on and re-parcelling projects, supported by state, en ty and donor resources. All legal problems related to ownership, ren ng or/and trading with land, cadastral issues etc. must be solved.
Secondly, the larger farms will have the size to benefi t from new and larger machinery, including tractors, combines and maize harvesters, etc. Investment support for investments in new and modern technology may contribute to accelerate the renewal of the machinery park, which is needed.
In addi on, be er yields are required. Here we need to invest public and private resources in improved seed quality, and to make sure that high quality cer fi ed seeds are used in the produc on.
The agronomical produc on of the cereals must be op mized, taking new knowledge about good agricultural and environmental prac ce into considera on, ensuring an op mal use of fer lizers, pes cides and irriga on. This requires training of farmers and their employees, and this again calls upon a stronger extension service, where the relevant competences and the relevant pedagogical principles are available
for dissemina on of the required knowledge to the farmers.
Storage facili es, including silos, dryers, etc. must be in place in the right quality at the right places ensuring that the cereals are stored under the best circumstances, contribu ng to op mal quality in the post-harvest management.
Finally, the organiza on of sales and the marke ng must be enhanced, for example in producer organiza ons in order to increase bargaining power in the trade situa on with the buyer and contractors. The point of departure is diffi cult since the a tude among the millers and processing companies is that BiH cereals are of inferior quality compared to the quality of imported cereals. As a consequence, the blending of the batches in a rela onship of 10–20 percent domes c cereals and 80–90 percent foreign cereals is observed. To change this, domes c producers must be able to deliver the required quality at a compe ve price.
A prerequisite for this is a suffi cient profi tability of the produc on of cereals. Here the stability of subsidies and of price regimes is of paramount importance, since these factors can reduce risks and uncertainty, and make the farmers concentrate on the risks and challenges associated with the produc on itself and the new investments.
The subsidies needed will be of the scale of BAM 500 per hectare, and with a 50 percent import subs tu on and a commodity reserve, the area with wheat would be 325,000 hectares, and the subsidy demand would be BAM 162 million annually, compared with BAM 25 million in 2011 based on the current subsidy/hectare of BAM 500 per hectare in the FBiH level of 2011.
6.7 Seed imports
Bosnia and Herzegovina imports BAM 2.5 million worth of wheat seeds and BAM 10 million of maize seeds (hybrids) annually. This is a consequence of the non-existent seed industry in the country. Besides some agricultural research ins tutes, which are
100
more involved in breeding than mul plica on and marke ng, most seeds are imported.
However, seed experts like Mr Mario Beus from FBiH Ministry of Agriculture, Water Management and Forestry emphasize the poten al for mul plica on in the country.90
Since low seed quality in general is considered to be one of the reasons for lower yields in BiH than in other CEFTA countries, it is important to take the ini a ves, which will strengthen na onal seed mul plica on in the public and/or in the private sector. This is an issue for further and more detailed technical research than to be covered in this general analysis.
6.8 Trade with milled and processed products
As described above, the import quan es of cereals are substan al, while exports are very small. The situa on in the trade with secondary processed products is similar, although not as unilateral, as was the case with cereals. Here we describe the trade in milled products, and later we will give some examples of trade in secondary processed product categories.
The table below presents the data for the export and import of milled cereal products from 2007 to 2011.
With regard to exports, the table shows some fl uctua ons, but the general picture is an increase in exports from 2007 to 2011 in the range of BAM 3.2 million or nothing less
Table 6.7: Trade with milled cereals products, 2007–2011, BAM
Source: COMTRADE: h p://comtrade.un.org/db/default.aspx. Average yearly exchange rates between US$ and EUR (EUR per US$) are used as follows: 2011 = 0.748; 2010 = 0.785; 2009 = 0.748; 2008 = 0.711; 2007 = 0.760; 2006 = 0.829; 2005 = 0.804; 2004 = 0.804; 2003 = 0.884, and the exchange rate from EUR to BAM was BAM 1.9558 per EUR. Source: European Central Bank: h p://www.ECB.int
than 110 percent. In the same period imports have however also increased, and the defi cit has, as a consequence, increased from BAM 102.6 million in 2007 to BAM 135.5 million in 2011. This is an increase of BAM 33 million or 32 percent. The increase in import is not as large as the increase in export, but the point of departure for exports is rela vely modest compared to the import level.
It is also worth men oning that the price per tonne of wheat fl our exported during the whole period covered is higher than the import price per tonne. In 2011, the export price per tonne was 49 percent higher than the import price, and in the period the average diff erence was 86 percent in favour of the export price. In 2011, the export price was BAM 973 per tonne, the import price was BAM 654 per tonne and the diff erence therefore was BAM 318 per tonne.
The picture for processed products such as sweet biscuits, waffl es, etc. is more blurred than the one for milled cereal products. Exports here are also fl uctua ng with an increasing tendency in 2011, where the level of export is BAM 26.4 million. This is BAM 2 million more than in 2007 equal to an increase of 8 percent, which is far below the increase in exports of milled products. The defi cit is increasing also for these products, with BAM 7.4 million or 17 percent in the period from 2007 to 2011. For these products the increase in imports is larger than the increase in exports, leading to an increase in the gap over me.
90 Interview on Monday 26 September 2011 in Sarajevo
101
Croa a is far the most important country for exports of sweet biscuits, and the exports have been increasing from 2007, where the export value was BAM 9 million, to 2011 where it was BAM 11.7 million. The increase is 30 percent. The export share to Croa a is 75 percent out of BAM 15.5 million of total exports.
For Serbia, the exports diminished from BAM 2.7 million in 2007 to only BAM 0.5 million in 2011. This is a reduc on of 81 percent, and Serbia is today the least important of the countries where BiH has exports of sweet biscuits.
With regard to the import of sweet biscuits, the main impor ng countries are presented below. Here Serbia is back on the stage with the largest import share to BiH: BAM 25.6 million in 2007 increasing to BAM 28.3 million in 2011. The increase is
Source: COMTRADE: h p://comtrade.un.org/db/default.aspx. Average yearly exchange rates between US$ and EUR (EUR per US$) are used as follows: 2011 = 0.748; 2010 = 0.785; 2009 = 0.748; 2008 = 0.711; 2007 = 0.760; 2006 = 0.829; 2005 = 0.804; 2004 = 0.804; 2003 = 0.884, and the exchange rate from EUR to BAM was BAM 1.9558 per EUR. Source: European Central Bank: h p://www.ECB.int
The main trade partners for sweet biscuits are iden fi ed below.
Table 6.9: Export of sweet biscuits, main trade partners/countries, 2007–2011, BAM
Source: COMTRADE: h p://comtrade.un.org/db/default.aspx. Average yearly exchange rates between US$ and EUR (EUR per US$) are used as follows: 2011 = 0.748; 2010 = 0.785; 2009 = 0.748; 2008 = 0.711; 2007 = 0.760; 2006 = 0.829; 2005 = 0.804; 2004 = 0.804; 2003 = 0.884, and the exchange rate from EUR to BAM was BAM 1.9558 per EUR. Source: European Central Bank: h p://www.ECB.int
11 percent and the share of the total import in 2011 is 70 percent.
The Former Yugoslav Republic of Macedonia is the other country with a remarkable performance. The imports were almost BAM 3.2 million in 2007, and have increased to BAM 6.8 million in 2011, equal to an increase of 113 percent. The other countries have been rela vely stable in their imports to BiH with this product category: Croa a has increased exports to BiH by 19 percent, and Montenegro has seen a decrease in exports to BiH of 52 percent, but for Montenegro it was from a low level.
As a fi nal example, the trade with pasta is included. Here a small trade is observed, but again the increase in import is the domina ng trend, with an increase of 30 percent from 2007 to 2011, while exports fell by 50 percent. The result was an increase in the defi cit of 86 percent.
102
6.9 Summary of trade
Trade policy
BiH is following the path towards EU candidate status, and by 2013, BiH will have a fully liberal trade partnership with the EU, if BiH fulfi ls the requirements, and if the companies wishing to export to the EU fulfi l the requirements in the Acquis.
Trade balance in cereals
The total trade defi cit in cereals in 2010 was BAM 166.2 million, due to imports of BAM 194.3 million and exports of BAM 28.1 million. It is a minor increase from 2009, but the level is s ll lower than in the years 2007 and 2008, where the defi cit was below BAM 200 million. Exports are increasing and show their highest level in 2010 with BAM 28.1 million.
The total import of cereals from CEFTA countries in 2010 was BAM 102.3 million, while
Table 6.10: Import of sweet biscuits, main trade partners/countries, 2007–2011, BAM
Source: COMTRADE: h p://comtrade.un.org/db/default.aspx. Average yearly exchange rates between US$ and EUR (EUR per US$) are used as follows: 2011 = 0.748; 2010 = 0.785; 2009 = 0.748; 2008 = 0.711; 2007 = 0.760; 2006 = 0.829; 2005 = 0.804; 2004 = 0.804; 2003 = 0.884, and the exchange rate from EUR to BAM was BAM 1.9558 per EUR. Source: European Central Bank: h p://www.ECB.int
Table 6.11: Trade with pasta, couscous, 2007–2011, BAM
Period Export value Import value Balance2007 390,622 964,501 -573,8792008 414,091 957,087 -542,9962009 384,837 669,334 -284,4962010 404,477 1,270,098 -865,6212011 194,893 1,259,885 -1,064,992
Source: COMTRADE: h p://comtrade.un.org/db/default.aspx. Average yearly exchange rates between US$ and EUR (EUR per US$) are used as follows: 2011 = 0.748; 2010 = 0.785; 2009 = 0.748; 2008 = 0.711; 2007 = 0.760; 2006 = 0.829; 2005 = 0.804; 2004 = 0.804; 2003 = 0.884, and the exchange rate from EUR to BAM was BAM 1.9558 per EUR. Source: European Central Bank: h p://www.ECB.int
the exports to the CEFTA countries was as low as BAM 3.8 million. The trade defi cit was then BAM 98.4 million in 2010. There has been a slow increase over the last two years, but s ll not at the level of 2007, where the defi cit was BAM 147 million.
Import prices
The import price per tonne of wheat was in 2011 on average BAM 330 per tonne, but the import price from Hungary was only BAM 231 per tonne, while the small export of wheat sold was BAM 568 per tonne in 2011. Hungary is Bosnia and Herzegovina’s most important trading partner in terms of cereals, closely followed by Serbia and Croa a. During the period 2005–2009 wheat imports from Hungary were always more than 50 percent of total wheat imports (with the excep on of 2007). In 2008, out of the total of 326,800 tonnes of imported wheat, 274,200 tonnes or (84 percent) was imported from Hungary.
103
Produc on balances
The domes c produc on of wheat has covered a stable share of the domes c market with 40 percent for the years 2006 to 2008, and 43 percent in 2009. In 2010, the share dropped drama cally to only 22 percent. This was caused by a decrease in domes c produc on. Domes c consump on also fell, but imports increased to capture the share of the market le open due to low produc on in BiH.
For maize the situa on is diff erent. The share of the domes c consump on covered by the BiH produc on has been stable over the fi ve years, with an average of 82.5 percent. From 2009 to 2010 we have seen a slight reduced share from 85.4 percent to 81.7 percent, and the market share signals a rela vely high level of compe veness at the local market for maize grain.
Import subs tu on
Current produc on could theore cally be based on 255 wheat producers and 909 maize producers with op mal yields. If BiH is able to subs tute the import of wheat and maize, BiH will need 609 new wheat farmers for every 25 percent of import subs tu on, and 354 new maize grain farmers for every 25 percent of import subs tu on. If fi ve-year average yields are used to calculate the needed number of farmers, the fi gure will increase, since the fi veyear average is lower than the op mal yields. If a larger import subs tu on is achieved the number of addi onal farmers will also increase.
Commodity reserve
In order to also cover a commodity reserve, as recommended by FAO, and as expressed in the ac on plan for a commodity reserve, addi onal numbers of hectares are required. The need will be in the range of 100,000
tonnes of wheat and 10,000 tonnes of maize according to the ac on plan, and this amount of wheat produced with 4.5 tonnes/hectare requires 22,222 hectares, and 1,250 hectares for maize produc on with 8 tonnes/hectare on average yield.
Trade with processed products
Regarding exports of milled products the general tendency is an increase in exports from 2007 to 2011 in the range of BAM 3.6 million or 123 percent. In the same period imports have however also increased, and the defi cit has, as a consequence, increased by BAM 29 million or 39 percent. The increase in imports is not as large as the increase in exports, but the point of departure for exports is rela vely modest compared to the import level.
The price per tonne of wheat fl our exported during the whole period covered is higher than the import price per tonne. In 2011, the export price per tonne is 49 percent higher than the import price, and in the period the average diff erence is 86 percent in favour of the export price. In 2011, the export price was BAM 973 per tonne, the import price was BAM 654 per tonne and the diff erence therefore BAM 318 per tonne.
The trend for processed products such as sweet biscuits, waffl es, etc. is more blurred than that for milled cereal products. Exports here also are fl uctua ng with an increasing tendency in 2011, where the level of export is BAM 27.6 million. This is an increase of 14 percent, which is far below the increase in exports of milled products. The defi cit is also increasing for these products, with BAM 10 million or 23 percent in the period from 2007 to 2011. For these products the increase in imports is higher than the increase in exports, leading to an increase in the gap over me.
104
105
7. LEVEL OF ATTAINMENT OF RELEVANT EU STANDARDS
7.1 Produc on of cereals
In the context of pressure to integrate EU requirements and standards into agriculture, the policy instrument “cross-compliance” is increasingly being used to improve the environmental impacts of farm management. Cross-compliance in the Common Agricultural Policy (CAP) sets environmental and other standards that farmers must adhere to in order to receive subsidies. All EU Member States set farming standards in rela on to 18 EU regula ons and direc ves, defi ned Good Agricultural and Environmental Condi ons (GAECs) and ensure compliance with these standards on farms in receipt of CAP subsidies.
As a poten al candidate country, Bosnia and Herzegovina will also have to adopt these 18 EU regula ons and direc ves. The following paragraphs highlight the regula ons and direc ves that will be relevant for plant produc on.
As listed in Council Regula on (EC) No 1782/2003 of 29 September 2003, there are eight regula ons and direc ves and from them the fi rst fi ve are relevant for plant produc on under environment: Council Direc ve 79/409/EEC of 2 April 1979 on the conserva on of wild birds (OJ L 103, 25.4.1979, p 1) Council Direc ve 80/68/EEC of 17 December 1979 on the protec on of groundwater against pollu on caused by certain dangerous substances (OJ L 20, 26.1.1980, p 43) Council Direc ve 86/278/EEC of 12 June 1986 on the protec on of the environment, and in par cular of the soil, when sewage sludge is used in agriculture (OJ L 181, 4.7.1986, p 6) Council Direc ve 91/676/EEC of 12 December 1991 concerning the protec on of waters against pollu on caused by nitrates from agricultural sources (OJ L 375, 31.12.1991, p. 1) Council Direc ve 92/43/EEC of 21 May 1992 on the conserva on of natural habitats and of wild fl ora and fauna (OJ L 206, 22.7.1992, p 7)
The group B contains seven regula ons and direc ves and from them only the fi rst one is relevant for plant produc on under plant health: Council Direc ve 91/414/EEC of 15 July 1991 concerning the placing of plant protec on products on the market (OJ L 230, 19.8.1991, p 1)
Furthermore, BiH is actually harmonizing its phytosanitary service and policy with EU legisla on, interna onal obliga ons and standards in this area. According to the relevant competent authority this process is about to be completed. This includes plant health, plant protec on products, and seeds and vegeta ve materials. The special emphasis is on dra ing, adop on and enforcement of EU compliant regula ons, strengthening of the inspec on service and laboratory capaci es, and raising awareness of operators of the improved system func oning. In the last progress report the EU pointed out that there was some progress in the phytosanitary sector as implemen ng legisla on on the establishment of a phytosanitary register and plant passports, measures for control of harmful organisms in plants, plant products and regulated facili es and phyto-pharmaceu cals have been adopted.
The ins tu on in charge of plant health issues is the Plant Health Protec on Administra on (PHPA), see also Chapter 5.
Detailed regula ons are s ll to be adopted and enforced. In the mean me, the en es are enforcing diff erent regula ons, issuing diff erent export cer fi cates, and un l recently their lists of approved varie es were diff erent, which was confusing for importers. This confusion ended when the na onal variety list was adopted in 2010. The border inspec on is the responsibility of the en es, and some mes importers have to choose between two border phytosanitary inspec on posts at the same crossing (e.g. at the Samac border crossing). These border inspec on posts (BIPs) apply diff erent procedures and diff erent fees. The PHPA
106
stressed the importance of establishment of various phyto-registers, a plant passport system, a chain of command, and the division of responsibili es in the sector.
At the third mee ng of the Provisional Subcommi ee for Agriculture and Fishery, held in March 2011, the European Commission highlighted this problem. All government levels in BiH were called to quickly clarify and explain the competences in the area of food safety, protec on of plant health and veterinary, and to increase administra ve capaci es of all relevant administra ons and ins tutes. This is crucial for the export of BiH agricultural products to the EU, especially a er the accession of the Republic of Croa a to the EU. The EU Delega on encouraged BiH to establish clear competences and chains of command and to harmonize procedures, including, inter alia, this area. The EU delega on repeated that the development of a well-func oning inspec on system and inspec on network, including the func oning of laboratories and similar ins tutes with well-trained people, are crucial.
In BiH, various ins tu ons share the responsibility for plant health, although there is s ll an overall lack of coordina on. The Phytosanitary Departments of en es and BD maintain lists of approved seed varie es and they cer fy exported products. En ty Ministries of Health are responsible for public health and they have food tes ng laboratories, while the en ty Ministries of Trade are responsible for en ty-level food quality control, consumer protec on, and labelling. En ty and Brčko Inspectorates are responsible for inland and border inspec ons (except for border veterinary inspec on) of various foods. They include veterinary, agricultural, sanitary and market/quality inspec on departments. The procedures for food control and inspec on vary between the en es and are inconsistently implemented throughout the country.91
The PHPA has started ac vi es on establishing phytosanitary inspec ons. Ins tutes for
accredita on and standardiza on recently started working in the food sector. The Ins tute for Accredita on has accredited some food tes ng and cer fying laboratories but it applies mainly to BiH and is not recognized interna onally because this Ins tute does not par cipate in all interna onal and regional accredita on organiza ons such as the Interna onal Accredita on Forum (IAF), and the European Commi ee for Standardiza on (CEN). The EU also requires that BiH strengthen its phytosanitary laboratories. The EU also requires that BiH increase the awareness of farmers, distributors, importers and exporters of the requirements according to na onal and interna onal standards.
Plant protec on products are regulated by the Law on Phyto-pharmaceu cal Products (PPP). This foresees almost every requirement for establishing the system that regulates the marke ng of PPP. The law is in good agreement with the EU Dir. 91/414. Nevertheless, due to the enactment of a new Regula on (1107/2009) which repeals the Direc ve, some adjustments are needed.
Even though this law foresees the approval of ac ve substances following the EU offi cial system (the ac ve substances allowed by the EU and listed in Annex I are already allowed in BiH), the process of authorizing products has s ll not been implemented. This also applies to products not registered in the EU or imported from Third Countries. The two en es are using diff erent systems for approval and registra on of pes cides, neither of which is harmonized with the EU rules. The Law on Phyto-pharmaceu cal Products foresees the Commission being in charge of the evalua ng dossiers and of the authoriza on process, although this Commission has not yet been established. This is a key aspect for the func oning of the system and also in the project ac vi es. A document with general outlines and proposals to set up a system for PPP registra on and to establish a Commission for PPP evalua on that involves all of the administra ve ins tu ons (PHPA,
91 Based on interviews with stakeholders 2011 and 2012.
107
Ministries of both En es, Department of BD), as well as ins tu ons/members with technical exper se, was dra ed and submi ed for discussion to the par es together with a dra proposal for a rule book defi ning the func oning of the Commission. However, technical training on phyto-pharmaceu cal products has been off ered to commission members, but has not yet started. It is foreseen that a number of related workshops will start as of January 2012.
The lack of a unifi ed na onal list of approved pes cides for agriculture also has nega ve consequences for the harmonized regula on of import and export of plant products (in terms of pes cide residues). There is currently no offi cial monitoring of residue levels on plant materials as which laboratories should be recognized to carry out such a role has not yet been defi ned. This is an aspect of the inspec on system that is common to food and veterinary controls. Considering the requirements deriving from diff erent EU legal provisions (e.g. Reg. 882/2004), the accredita on of the laboratories for offi cial control, and the level of complexity that such analyses present, it would be most feasible to u lize the laboratories that are currently used for all offi cial controls over food and veterinary sectors for residue analyses of the phytosanitary system. An exhaus ve assessment of the capaci es of the various laboratories in BiH (public and private) has been carried out within the framework of the IPA project “Support to implementa on and enforcement of BiH Food Legisla on”. The result has been that out of the 49 laboratories evaluated, very few have the necessary experience in analysing plant–derived materials, while the majority perform analyses of food and veterinary products.
In summary, BiH authori es are facing several tasks in order to fi nalize the adapta on of exis ng legisla on to EU standards and to enforce approved legisla on. The actual status is not a great obstacle to BiH cereals farmers, as cereal exports are not signifi cant.
7.2 Regula on related to cereals processing
Even though the Food Safety Agency was established in 2006, the EU has s ll recommended the establishment of a state level agricultural ministry, which would guarantee that Bosnia and Herzegovina has one competent food authority when EU accession nego a ons begin. Un l now only limited progress has been made on this issue. Besides the organiza onal structure, BiH must move forward to adopt EU standards and regula ons in the processing sector.
The General Food Law Regula on EC/178/2002 lays down the general principles for food law in the EU and defi nes responsibili es for authori es and operators within the framework of food and feed safety. Operators are primarily responsible for the safety of the products they bring to the market.92
The general objec ves of the EU law are to ensure a high level of protec on of human life and health, taking into accounts the protec on of animal health and welfare, and plant health and the environment. This integrated “farm to fork” approach is now considered a general principle for EU food safety policy. This food law establishes the rights of consumers to safe food and to accurate and honest informa on. The EU food law aims to harmonize exis ng na onal requirements in order to ensure the free movement of food and feed in the EU.
In the EU, as in Bosnia and Herzegovina, consumers have increasingly high expecta ons about the safety of their food and a growing interest in how it is produced. According to the European fl our milling associa on some of the procedures men oned below, are carried out by millers with the objec ve of improving food safety: Purchasing wheat only from crop assured sources; i.e. where farmers have adopted best prac ce in growing their wheat and rye, keep records of how the crop is grown
92 h p://www.fl ourmillers.eu
108
and have these prac ces independently audited by a third party; Ensuring that any wheat delivered has been stored and transported in accordance with industry guides of good prac ce; Checking every delivery of wheat for any food safety hazards and rejec ng wheat which is not fi t for purpose; Applying the HACCP (Hazard Analysis Cri cal Control Points) systems through the milling process with industry monitoring of residues of pes cides and other possible agricultural contaminants; Monitoring microbiological risks; Maintaining high standards of hygiene in the mills, based on the Regula on (EC) No 852/2004 on the Hygiene of Foodstuff s.
As wheat and maize are grown in open fi elds, care has to be taken to ensure that no contaminants can come through to aff ect the fl our. Therefore the supply chain has to adopt a rigorous hazard control (HACCP) system, which focuses on the wheat. Logically, if there is no problem with the wheat then any problems with the fl our will also be avoided.
The situa on regarding food safety in Bosnia and Herzegovina is characterized by some progress. However, implemen ng legisla on on certain food products, materials coming into contact with food, ionizing radia on and quick-frozen foodstuff s have been adopted. State level legisla on was transposed with diff ering provisions at en ty and Brčko District levels. The na onal food laboratory plan remains to be drawn up and reference laboratories have yet to be designated. Responsibili es in the fi eld of food safety remain fragmented and the capacity to implement offi cial controls, including laboratory capacity, remains weak.
However, legisla on and inspec on ac vi es are not performed uniformly across the en es, in the Brčko District and at border inspec on points. There are inadequate human resources − at all levels − to implement
the legal provisions, and reference laboratories for monitoring residues were not designated.
HACCP for Bosnian mills is not yet mandatory. Overall it is not surprising that just a few agroprocessing companies have EU approval for exports (EU export cer fi cates). The EU summarizes the situa on in its last progress report as follows: “Overall, prepara ons in the fi elds of agriculture and rural development, food safety, veterinary and phytosanitary policy and fi sheries remain at an early stage. No comprehensive strategy exists for aligning with the acquis on agriculture and rural development. State level capacity for policy making and coordina on is weak. Development of a func oning system to implement the food safety acquis remains a priority to increase trade in agricultural products”.93
Due to non-compliance with EU standards and regula ons, the exis ng export markets for cereals and fl our are primarily CEFTA countries and Turkey.
7.3 Compliance with EU standards among the cereals farmers
The situa on among cereals producers regarding compliance with EU standards is summarized below based on informa on collected through the 13 case studies. Here the farmers were asked about their posi on regarding EU standards linked to their produc on.
Produc on of cereals on the surveyed case study farms is exclusively conven onal, in the sense that tradi onal produc on principles are used. None of the 13 farms did apply any type of cer fi ca on system, such as cer fi ca on for Global GAP standards and no farms were cer fi ed according to the Quality Management System of safe food produc on, quality management and environmental protec on.
The arguments were the same from one farmer to another. There is currently no need for applying any standard, since the produc on is directed towards the domes c market, and
93 European Commission: Bosnia and Herzegovina 2011 Progress Report. Working Paper. October 2011. p 44
109
here it is not a market requirement. If there is no demand for cer fi cates of quality and any other characteris cs of produc on and of the products, there is no reason to pay for and to apply any standard in cereals produc on. As a consequence, the produc on does not typically follow the formal principles of good agricultural prac ce, and the farmers do typically not meet the agrienvironmental and quality standards of the products.
However, a few of the farmers did actually look at the situa on with a cri cal eye. Bearing in mind the strategic orienta on of BiH of entering the EU, this current non-compliant produc on prac ce in their opinion will not last long for many of the farms and businesses, because EU direc ves and regula ons will be applied in domes c legisla on. Specifi cally they expect that those farms and fi rms wishing to sell their products also on the domes c market will have to meet the requirements of certain na onal and EU standards in order to be able to sell them. It is therefore a priority for this group of farmers to make the investments, which will make their farms aligned with the relevant standards in produc on and management.
In order to realize this, training and management of farms and companies in the requirements of interna onal standards, good agricultural and environmental prac ce and condi ons, HACCP etc. was requested. Also fi nancial support from the relevant ministries in co-fi nancing the costs of introducing quality systems in the enterprises and farms was on the wish list.
Based on these observa ons and the parallel observa ons about the cri cal comments from the milling industry with regard to the quality of products from the BiH cereal producers, there is among the farmers a growing understanding about the need to improve the standards of produc on and management. Furthermore, the farmers are willing to take these steps the day they are forced to take them. That day may come sooner than they expect, if the EU nego a ons move along faster than what has been seen in the previous years. If this
happens, the IPARD programme with its support to increased compe veness and moderniza on of produc on standards in line with the acquis will be very relevant.
7.4 Summary
In summary, BiH authori es are facing several tasks in order to fi nalize the adapta on of exis ng legisla on to EU standards and to enforce approved legisla on. However, the actual status is not a major obstacle to BiH cereals farmers, as cereal exports are not signifi cant.
Produc on of cereals on farms in BiH is typically conven onal, in the sense that tradi onal produc on principles are used. Cer fi ca on systems, such as cer fi ca on for Global GAP standards and Quality Management System of safe food produc on, quality management and environmental protec on are not used. The arguments are that there currently is no need for applying any standard, since produc on is directed towards the domes c market, and here it is not a market requirement. As a consequence, the produc on does not typically follow the formal principles of good agricultural prac ce, and the farmers typically do not meet the agrienvironmental and quality standards of the products.
However, there is among farmers a growing understanding about the need to improve the standards of produc on and management. Furthermore, the farmers are willing to take these steps the day they are forced to take them. The IPARD programme with its support to increased compe veness and moderniza on of produc on standards in line with the acquis will be very relevant.
HACCP for BiH mills is not yet mandatory. Overall it is not surprising that just a few agroprocessing companies have EU approval for exports (EU export cer fi cates). Due to noncompliance with EU standards and enforcement of regula ons, the exis ng export markets for cereals and fl our are primarily CEFTA countries and Turkey.
110
111
8. PAST TRENDS AND FUTURE DEVELOPMENTS IN TERMS OF INVESTMENT
It is an important objec ve of this sector analysis to provide informa on about the past and the future investments in the cereals sector. The results of the data collec on and analyses regarding investments are presented in this chapter focusing on the investment needs in cereals produc on.
8.1 Past trends in farmers investments
Since independence in 1992 and a er the end of the war in 1995, BiH agricultural policy at state and en ty/district level has not as such been oriented par cularly towards cereal produc on and processing. As in all countries, farms in Bosnia and Herzegovina have either become more professional, started to expand, or they have remained small and subsistence based and have tried to get by with as li le investments as possible. The widespread commercial strategy is to avoid spending money. The subsistence farmers’ investments are focused on repair work to keep their small farms running. There have been, and are, no funds available for addi onal, more future oriented investments.
The other group are the commercial farms with more than 20 hectares of land, partly owned and the rest rented. These farmers are mo vated and have some of the funds to invest in improved produc on facili es. These farmers will probably apply for support under the IPARD measures, whenever they become available, if experiences from other candidate countries also hold in BiH. The trend has been to acquire larger companies, and this trend will con nue, with investments in ver cal integra on; from growing cereals towards fodder produc on for self use (own feed mills) towards animal fa ening.
The primary processing sector shows a similar set-up. Some old mills will con nue to run for as long as it is profi table with minimum repair work, and others have invested a lot
and will con nue to invest. Finally, there is a group of mills that process up to 10,000 tonnes annually, which are doing fi ne but might not survive the selec on process based on economies of scale, unless they fi nd niche markets.
Whether or not processors apply for IPARD measures depends on their fi nancial standing. If they can aff ord to pre-fi nance the investments, and if they are willing to do so, they might apply. Otherwise fi nancial engineering mechanisms might be brought into play in order to ensure the implementa on of the needed investments. Financial engineering instruments can include state guarantees, advance payments, interest subsidies, etc.
Besides the 30,000 tractors currently in opera on on BiH farms, which can be seen as represen ng past investments, li le is reported offi cially about actual agricultural equipment in use, and how farmers plan on inves ng in machinery in the future. Li le is known either about how they will invest in premises and farm enlargement.
Based on the 13 case studies presented previously in this report and a ached in Annex 3, some conclusions on past and future investments can be drawn, as farmers were asked about their previous and upcoming investments.
The small insight into cereal farmers’ equipment presented in Annex 3 clearly indicates that these farmers have been inves ng, not only in new machinery, but rather in second-hand equipment, o en imported from nearby EU Member States. The informa on is summarized in the following tables.
The eight farms used as case studies in FBiH have invested in the range of BAM 575,000 over the last 5 years. The average investment is BAM 71,500 per farm. In RS, the 5 case study farms represent a total investment of BAM
112
873,000 with an average of BAM 175,000, but one farm (RS 1) dominates the picture. Without that farm included in the sample, the average is reduced to BAM 30,000.
8.2 Farmers investments in the futureThe same 13 farmers from the case studies intend to invest in the following machines and buildings: Silo for 200 tonnes in order to avoid the sale of products immediately a er the harvest when, as a rule, sales prices are the lowest Harvester Soil ameliora on Silo and grain dryer to avoid having to sell the product (wheat) immediately a er the harvest Tractor and implements No investments, as much money already spent over the last years Harvester to replace the outdated ones Implements for improved land cul va on Harvester Tractor (larger one) plus implements Increase farm size by buying or ren ng new land Peripheral canal for fl ood protec on Reconstruc on of exis ng and construc on of new irriga on systems Stables for bull fa ening Feed mixer
Table 8.1: Farmers investments previous years, 13 case studies
The upcoming investments of BAM 1.8 million should be facilitated by commercial banks.
Tractors Harvesters Silos for grain storage Drying facility with capacity of 20 tonnes Male calves for extended fa ening ac vi es Soil improvement – calcifi ca on The upcoming investments should be partly fi nanced out of own resources.
Tractor and implements, machines Construc on of new warehouse The upcoming investments should be partly fi nanced out of own resources.
Silos Expanding the farm to 1,000 hectares Mini slaughterhouse and meat processing plant Irriga on system – TIFON systemThe upcoming investments of around BAM 230,000 should be partly fi nanced out of own resources.
Restora on of machinery Renova on of the barn for 150 dairy cows Soil improvement Reconstruc on of exis ng irriga on systems Silos with drying facility for 5,000 tonnes
113
The farms without on-farm silos will invest in silos, so they do not have to sell at low prices immediately a er the harvest. Grain stored on farms for seed or livestock feed is an important part of farm income, and therefore wheat has to be kept dry, cool and free from insect a ack. Storing maize on farms is much easier than storing wheat and is usually done in the tradi onal wooden stores, which enable a constant fl ow of air for drying. One farmer will increase his farm and just one will not invest, because he has already invested a lot in the past.
The increasing importance of on-farm storage facili es was already detected during fi eld visits (and the visit to the INTERAGRO Bijeljina Fair in September 2011). Some modern farm equipment was seen during the fi eld trips but compared to Bulgaria or Romania the agricultural equipment is very old and
defi nitely not state-of-the-art. Of course Bulgarian and Romanian farmers benefi ted widely from the Special Accession Programme for Agriculture and Rural Development (SAPARD) support, and before they received this support system farm mechaniza on was rather poor also in these countries.
The planned investments are summarized in the Table 8.2, and the investment costs es mated based on data collected from university experts and from actors in the fi eld.
One farmer, case RS 1, plans to invest a considerable amount in a new animal house, and if this investment is eliminated from the sample, the average related to cereals is down to BAM 100,000.
Data from the farm survey among 130 farms support this pa ern, and they report a priority to invest as follows:
The es mated cost prices of the various types of equipment is indicated here as minimum prices:94 Tractor price: BAM 50,000; Combine: BAM 125,000; Maize harvester: BAM 50,000.
The total investments will be around BAM 1.5 million, and on average the surveyed farmers will invest BAM 32,600 in the coming years as a priority for machinery to wheat and/or maize produc on. This confi rms the need to upgrade the technological level of the farmers in BiH. Other investments might add further to this fi gure.
8.3 Primary processor’s investments in the past and future
No data is available on what processors have invested in, or on how much they have invested. However, in personal mee ngs with representa ves from the primary processing sector it was learned that millers have invested considerably amounts. For example, KLAS improved its en re technology in 2003, and they are not planning any major investments in the near future, except in dust-free loading facili es for trucks, which are an EU requirement and would improve the working condi ons and the environment. The mill is located in Sarajevo.
Some other mills, especially the smaller newly established ones, with up to 10,000 tonnes annual capacity, have not invested in suffi cient silos, and now they want to increase their storage facili es to store what is needed annually immediately a er the harvest, as prices are low at this me. Besides addi onal silo capaci es, more and be er driers are needed. Manufacturers also want to invest in packing lines for wheat fl our and packages of 5, 10 and 25 kg.
The more concerned millers also see a permanent need to invest in laboratory equipment.
The reac ons to the announced IPARD programme, with co-fi nancing support to farmers and millers, during fi eld visits and
workshops were very posi ve from those producers who are already doing well, and it was rather reluctant from those who are performing less well. The expected requirement of a 50 percent private co-fi nancing makes the expecta ons somehow modest among the processors of this last group.
As seen from the case studies and the interviews, most producers do not trust banks and s ll perceive signifi cant limita ons for the use of credits in agriculture. The more collateral a client, farmer or miller, has, the more bankable he is. However, large companies have access to other fi nances like equity capital from investors or foreign business partners.
A more predictable fi nancial support policy of the authori es at all levels would defi nitely help farmers and processors, as they could provide more realis c fi ve-year forecasts and planning, as long as they have experience and knowledge in preparing business plans.
8.4 Summary
The analysis of previous and planned investments in the sector is based on case studies and surveys as well as on stakeholder interviews and expert statements.
The eight case farms in FBiH have invested in the range of BAM 575,000 over the last 5 years. The average investment is BAM 71,500 per farm. In RS, the 5 case farms represent a total investment of BAM 873,000 with an average of BAM 175,000, but one farm dominates the picture. Without that farm included in the sample, the average is reduced to BAM 30,000.
The farms without on-farm silos plan in the future to invest in silos, so they do not have to sell at low prices immediately a er the harvest. The increasing importance of on-farm storage facili es was confi rmed during fi eld visits and the visit to the INTERAGRO Bijeljina Fair in September 2011. The average
94 Data and prices collected by university expert, 2012
115
investments among the case farms are es mated to be BAM 100,000 per farm, including investments in storage, combines, tractors and other farm equipment.
The farm survey confi rms the investment plans. On average the surveyed farmers will invest BAM 32,600 in the coming years as a priority for machinery to wheat and/or maize produc on. This confi rms the need to upgrade the technological level of the farmers in BiH. Other investments might add to this fi gure.
The investments in the primary processing sector will also be demanding. Especially the smaller newly established mills with up to 10,000 tonnes annual capacity have not invested in suffi cient silos, and now they want to increase their storage facili es to store what is needed annually immediately a er the harvest. Besides addi onal silo capaci es, more and be er driers are
needed. Manufacturers also want to invest in packing lines for wheat fl our and packages of 5, 10 and 25 kg. The more concerned millers also see a permanent need to invest in laboratory equipment. The number of processors expected to be viable in the future is minimum 20, and the total investment needs for these processors is es mated to be between EUR 20 million and EUR 25 million in total over the next fi ve-year period.
The reac ons to the announced possible IPARD programme, with co-fi nancing support to farmers and millers, during fi eld visits and workshops were very posi ve from those producers that are already doing well, and it was rather reluctant from those who are performing less well. The expected requirement of a 50 percent private co-fi nancing makes the expecta ons somehow modest among the processors of this last group.
116
117
9. IDENTIFYING POTENTIAL AND NEEDS IN THE SECTOR
There are several internal strengths and weaknesses in the cereals sector and also external opportuni es and threats for producers and processors. With these in mind, this chapter intends to iden fy poten als and needs in the sector and to iden fy the kind of policy interven ons needed to u lize internal strengths and to take advantage of external opportuni es. This SWOT analysis is based on two workshops for relevant stakeholders held in Banja Luka and in Sarajevo at the end of May 2011, many farm visits and case studies, several mee ngs with processors and input from experts in the sector. The results of the SWOT analysis were verifi ed in two workshops held in October 2011, also in Banja Luka and in Sarajevo.
9.1 SWOT analysis
This SWOT analysis is based on the analysis of the current state of the cereals sector in BiH and takes into account the EU accession and the ul mate goal of preparing the sector for par cipa on in the compe on on the EU market. This SWOT analysis provides input to what to do poli cally at state and or en ty/district level to make cereal produc on profi table and to resist the pressure from compe on.
However, the Table 9.1 give a more comprehensive picture of the strengths, weaknesses, opportuni es and threats for the producers of cereals, and it must be emphasized that not all topics included in the tables are documented through sta s cal analyses and data collec on. In this way the topics presented also refl ect the input from par cipants in the SWOT workshops, even though some topics were excluded from the presenta on below due to obvious lack of relevance and factual support.
The following SWOT analysis (Table 9.2) for the processing industry was set up in a similar way and shows what is to be done at the poli cal level to make cereal processing safer, more produc ve and more profi table. Addi onally, a focus was set on processing of more local raw material instead of imported wheat.
These specifi c SWOT analyses have been elaborated in close coopera on with the stakeholders in order to iden fy important challenges and needs of the sector regarding specifi c supply chains. The SWOT analyses might serve as an input to the programming process for MoFTER, as well as for the Federal Ministry of Agriculture, Water Management and Forestry, RS Ministry of Agriculture, Forestry and Water Management and BD Department of Agriculture, Forestry and Water Management.
Regarding the cereal producers, their main strengths are related to their tradi on for producing cereals primarily as feed for their animals. Furthermore, they also o en have access to rela vely cheap labour from family members. All family farms visited during the case studies rely on family members as labour force in the produc on of cereals. Due to a rela vely low but increasing use of fer lizers and pes cides, the land is generally in environmentally good condi on and is to some extent suitable for niche products and for organic produc on. Close access to processors is another posi ve condi on for the farmers.
On the other hand, the producers are suff ering from small-scale and fragmented farming making it diffi cult to take advantage of economics of scale in produc on and of new expensive machines. This is refl ected in the low degree of mechaniza on, low produc vity and low profi tability, which is typical for the small-scale family farms domina ng the landscape with their mixed produc on. According to the case studies and survey results, the extensive produc on is typically based on low input of produc on factors (technology, fer lizer, pes cides, and management) and the moderniza on of the farms with modern prac ces based on knowledge, training and extension is needed. Access to capital is a precondi on, but is diffi cult to obtain and this is a problem for these family farms. For the large-scale
118
Table 9.1: SWOT analysis for BiH cereals producers
S – Strengths W – Weaknesses
Experience and tradi on in the crop produc on, where wheat as part of the crop rota on with maize improves plant health
Small and fragmented holdings (2 hectares and 6 parcels on average)
Cheap family work force Poor farm mechaniza on
Unpolluted land suitable for organic produc on of cereals Lack of on-farm storage facili es, especially for wheat
Existence of a local processing industry (fl our and feed mills)
Ineffi cient produc on and high produc on costs (capital and hired labour) and therefore limited profi tability
Existence of scien fi c research ins tu onsLack of educa on (especially related to the use of agroinputs like seeds and fer lizers, but also with regard to agricultural economics)
Small number of specialized producers
O – Opportuni es T – Threats
Harmonized subsidies within BiH Con nued degrada on of non-cul vated agricultural land
BiH subsidies close to Croa an level; i.e. EUR 275 per hectare (2011) equal to BAM 550 per hectare
Limited guidance by the authori es, especially when announcing the level of fi nancial support and minimum prices only a er the start of the sowing season
Improved regula on of land ownership and land market
Complicated and not harmonized applica on procedures for farmers
Large fallow and non-cul vated areas – up to 500,000 hectares, which partly fi ts for cereals
Lack of enforcement of authority control (export, import, quality, seedlings)
Existence of larger tracts (consolidated and regrouped) of arable land in the lowlands in the FBiH (Sava canton – municipali es Odzak, Samac Domaljevac and Orasje and in north part of Tuzla canton – Kalesija municipality)
Incomplete price transmission; rising world market prices not always refl ected at local price level
Diversifi ca on of products, for example poten al for durum wheat on specifi c areas and organic produc on on others
Large imports of cereals, especially wheat, partly due to low quality of local produc on (assortment), unfavourable trade agreements and unfavourable climate
Improved extension and machinery services and tailormade training programmes for producers (actually 10,000 hectares per 1 advisor)
Few agricultural service providers
Increased support for capital investments through na onal support programmes and the upcoming IPARD programme
High prices of inputs further reducing the profi tability, especially of wheat
Considerable share of ca le breeding in agriculture and the need for arable crops for animal feed Land to some extent contaminated with mines
Favourable climate and land condi ons in the northern parts of BiH
Know-how of local seed produc on (breeding and mul plica on)
In the long run: Worldwide shortage of cereals and increased transport costs
Source: Own data collec on through SWOT workshop, interviews, fi eld trips, case studies and survey, 2011
119
producers (family farms as well as corporate farms), where hired labour is essen al, the increasing price of labour is pu ng pressure on their costs and on the need for further mechaniza on and specializa on. Lack of capital and expensive access to fi nancing of the expansion and the moderniza on of produc on are other barriers for the development of the sector.
The producers face several opportuni es, which can be u lized, if the circumstances are in favour of the farmers. First of all, there are 500,000 hectares of non-u lized land available for cereal produc on (and for other types of
Table 9.2: SWOT analysis for BiH processing industry
S – Strengths W – Weaknesses
Existence of compe ve processing facili es (for example KLAS and ZITOPROMET) Limited capital resources (apart from market leaders)
Vicinity to consumers, which is relevant for products not suited for long transporta on (e.g. bakery products)
Outdated technology (apart from the market leaders) o en not in line with relevant quality standards
Suffi cient storage capacity (silos), especially within the former state-owned enterprises Overcapaci es in the primary processing industry
Lack of skilled labour, high fl uctua on rate of labour
Inadequate voca onal training, par cularly in the smallscale baking and confec onery industry
Focus is almost exclusively on BiH market
Outdated marke ng ac vi es
Expensive transport of wheat to mills
Weak coopera on between farmers and processors
O – Opportuni es T – Threats
Domes c market of 3.8 million customers Inadequate sector policies and strategies at en ty and state level
Product development, including speciali es for niche markets
Market liberaliza on through CEFTA and upcoming EU membership
Import subs tu ons – concerning raw material if price and quality is compe ve Imports of cereals, especially wheat
Access to interna onal markets via diaspora Processing of illegally imported wheat, due to weak border control
Strategic wheat reserves might not be handled by private enterprises
Incomplete priva za on of former state-owned enterprises
Consumers highly a racted by imported products
Source: Own data collec on through SWOT workshop, interviews, fi eld trips, case studies and survey, 2011
agricultural produc on), if these hectares can be mobilized for produc ve purposes. A number of precondi ons must be fulfi lled, before the producers can and will take steps to expand produc on in a period where produc on is going down and compe on is going up. A harmonized support regime in BiH is one precondi on, elimina ng internal unfair compe on and making the na onal playing fi eld even, where support rates are compe ve with support rates (area payments) in neighbouring countries. In the long run, EU area payments might be the same for all Member States. In Croa a (an EU Member State from July 2013) subsidies per
120
hectare are EUR 275 (BAM 550) for wheat and maize, but poli cians have already informed farmers that the hectare premium will go up to EUR 380 (BAM 750), although this has not yet been confi rmed by the European Union. Another regulatory-based topic is related to the need for appropriate structures for land consolida on, land property/ownership rights and trade. For the farm restructuring process to take off , it is urgently needed that these regulatory and administra ve structures are in place and agreed upon among the relevant poli cal actors.
If these basic precondi ons are fulfi lled, there are many other opportuni es which can be u lized.
Another point related to the opportuni es for the sector concerns the role of en ty and BD governments in strengthening and suppor ng the sector. The sector is, by almost all stakeholders, considered to be a so-called sensi ve sector. This calls for a commodity reserve based on determined prices. The prices must be adequate to allow suffi cient revenues from produc on, and should defi nitely be made available for the farmers before the deadlines for sowing.
The trends of decline over the last years, both in terms of produc on and the areas sown, especially with wheat, indicate that the en ty and district and canton agricultural support policy is inadequate and is not in line with the interests of agricultural producers in the sector. More support may be provided to maize producers in the future, as the en ty and district ministries currently do not support this (or at least very li le), although it has objec ve condi ons for improvement. Data for average maize yields is suppor ve for this, as they are slowly reaching the levels achieved in neighbouring countries such as Serbia and Croa a.
One important point in the discussion of the compe veness of the cereal sector is the issue of product quality. Farmers have stated during workshops and interviews that local crops do not fall behind the required quality
compared with imported foreign products, and that the local processing industry does not have reasons not to buy them, par cularly because local producers off er rela vely small quan es. On the other hand, representa ves from the processing industry pointed out several mes at workshops and during interviews that local crops are not of the required quality and simply cannot be used as a raw material for further processing.
In the future the only diff erence in the compe ve opportunity for Bosnia and Herzegovina might be that imported cereals will face higher transport costs. Despite the fact that highways and railways are improving, the main advantage of local cereal producers is that they can supply their local neighbourhood.
Based on the SWOT tables above, one strategy could focus on import subs tu on, and here one recommenda on could be that cereal produc on is only suitable for farms in fl at areas with more than 25 hectares of maize and 45 hectares of wheat. Farms of this size will be able to produce suffi cient amounts of cereals to generate an average income for a family of four persons. These types of viable and compe ve farms will be the only farms being eligible under IPARD. Today BiH has few farms of this size and to enlarge farms the land market must be improved. Furthermore, inputs must be made available to farmers at compe ve prices. This depends partly on taxes, which are higher in BiH than in neighbouring Serbia. The extension services also have to be improved. In terms of investments, modern farm technology is required as is a be er farm gate price for producers, which is only achievable if farmers have dryers and silos so that they do not have to sell directly from the fi eld a er harves ng.
For processors the upgrading of technologies and qualifi ca ons of the labour force is needed, par cularly for the smaller mills and for the secondary processing fi rms. The mills will need these investments in order to be compe ve on price with the cheaper imported fl our. Be er organiza on of the coopera on between producers and
121
processors is needed to achieve the required product quality of all products along the value chain, from seed via harvested cereals to fl our and processed products.
The most important constraints for the expansion of cereals produc on are
Farm structure (small farms and fragmented parcels) Low level of input use (especially lack of irriga on) Low quality of seeds Lack of educa on of farmers in general and in rela on to the applica on of good agricultural and environmental prac ces
The current measures of support in both en es and in BD are not coordinated crea ng diff erent compe ve condi ons from one area to another Level of administra ve prices is determined too late and on ad hoc basis Support for funding the costs of standardiza on of produc on are lacking Support for funding the costs of construc on of adequate storage facili es for storing agricultural products (silos) are lacking The regula ve framework suppor ng the land market is needed for enlargement of the average farm and the increase of arable land
122
123
10. IDENTIFICATION OF TRAINING NEEDS IN THE SECTOR
Produc on of cereals in BiH on small farms is based on tradi onal and extensive produc on techniques with minimal expenses and investments. These types of producers are not especially interested in acquiring new knowledge, and only a few of them are in regular contact with the extension service, where it exists. Their main sources of informa on are the media, their neighbours and the veterinarians who provide their herds with ar fi cial insemina on and health care. Small-scale producers tend to have a rela vely low level of knowledge regarding modern cereals produc on.
The knowledge of producers on medium and large family farms including the few large-scale corporate farms is at a signifi cantly higher level, and their produc on is semi-intensive or even intensive for the largest producers. These farms have invested more in upgrading the level and quality of their produc on, and they have be er trained staff , and are in less need of training and educa on as are the small-scale producers.
Based on this analysis the cereals sector in Bosnia and Herzegovina is facing a number of opportuni es such as increasing total produc on of wheat and maize, partly by increasing the areas and partly the yield per hectare. Furthermore, improvement of quality to be in line with the processing industry’s requirements and with EU requirements will also increase compe veness within a more liberalized market. Tailor-made training courses could facilitate these opportuni es. As each stakeholder in the cereals sector has to face diff erent requirements, training needs might be grouped as follows: Training needs for producers; i.e. farmers, Training needs for processors; i.e. fl our and feed mills, bread-baking industry, confec oners and breweries, Training needs for the public administra on.
10.1 Training needs for producers
This target group is made up mainly of farmers in the northern part of BiH, who have the poten al to produce cereals in a commercially viable way. Based on today’s knowledge, the public extension service as well as private experts and input suppliers for seeds, machinery, fer lizers and also traders and buyers, as they need a certain product quality, should off er the following courses to farmers: Plant produc on with a focus on wheat and, to a lesser extent, maize; applica on of agrochemicals, silage prepara on techniques Phytosanitary and food safety issues Introduc on of new produc on techniques and technologies Overall Good Agricultural and Environmental Prac ces Making use of market informa on systems General agricultural economics, especially in the area of farm management95
10.2 Training needs for processors’ staff
Courses should be off ered to employees of mills, bakeries and breweries in the following fi elds: Management (wri ng business plans, fi nancing, accoun ng, human resources development) Product development In-company training on new technology, food safety and EU standards (HACCP and others)
10.3 Training needs for the public administra on
A modern public administra on requires adequate skills to perform the daily tasks. Capacitybuilding ac vi es will most likely focus on two diff erent skills; namely, managerial and technical. Civil servants should be put in a posi on to understand how a commercial
95 Bajramovic, S., FAO consultant: The status and constraints of the agricultural sector in BiH and the country food security situa on. 2011. p 11
124
company func ons. Simply by understanding farmers and processors, the staff of MoFTER/SAFFRD, en ty ministries, BD departments, research ins tutes and other subordinated ins tu ons will be in a posi on to provide advice and support to the private sector accordingly also in respect to the expected upcoming IPARD applica ons. The required two groups of skills can be defi ned as “How to do it” (management skills) and “What to do” (technical skills).
Management skills
Strategic planning and policy implementa on Understanding of commercial and business environments Strengthening analy cal capaci es Accoun ng, macro economics, budge ng, microfi nance Marke ng and sales techniques for selected groups of staff , for example in research ins tutes Project management Public rela ons (including dissemina on of informa on about IPARD) Language skills, especially English language skills Computer training
Technical skills
Crop produc on with an emphasis on cereals, including wheat
Land resources management Soil management (including crop rota on) Agricultural water management, irriga on EU guidelines and standards from farm to fork IPARD applica on procedures (design and evalua on of investment projects, applica on forms) Training in the prac ces of general food safety and HACCP applica on plus traceability in the food chain Laboratory requirements and techniques in the cereal sector General business training to include such topics as overall cost control and analysis, cost price calcula ons, selling price se ng and nego a on techniques, the importance of the market chain, etc. Informa on technology and communica on Management informa on system (MIS)
It must be emphasized that it is easy to prepare a very long list of training needs. However, in order to focus the eff ort, it must primarily be training related to EU acquis topics, which should come fi rst. Here training of farmers/producers in Good Agricultural and Environmental Prac ce (GAEP) and of staff in the primary and secondary processing industry regarding HACCP and other quality control topics related to food safety, environment and hygiene should be a priority.
125
11. OUTCOME: CONCLUSIONS AND RECOMMENDATIONSBased on the analysis of the constraints in the cereals sector the following conclusions and recommenda on for the sector are summarized below.
11.1 General fi ndings and recommenda on for cereals sector development
11.1.1 Producers of cereals
The most suitable areas of Bosnia and Herzegovina to grow cereals are located along the country’s northern border close to the Sava and Drina, where the arable land is fl at; farms are larger and have the poten al for expanding the area further. For historic reasons the average farm in BiH is very small and fragmented and to enable a maximum return, farmers (with the excep on of vegetable and fruit farmers) also keep animals for which fodder is needed. Although the majority of farms are mixed farms, there are a small number of specialized cereal producers. In general the majority of farms are not yet compe ve under the framework of EU membership.
Produc on structure
Cereals are produced in BiH on most types of farms: subsistence and semi-subsistence farms, commercial family farms and corporate farms. The precise number of farms with cereals is not known. The scale of produc on varies considerably from only 1 hectare per farm to hundreds of hectares per farm, but the most frequent type of farms only have a few (2–3) hectares distributed on several (6–8) plots and parcels. However, the farm survey conducted in the sector analysis shows that the median number of hectares for wheat and maize producers in FBiH is 3.6 hectares and 6 hectares, while the median in RS/BD for the same two crops is 2.5 hectares and 5 hectares. If these medians are used together with the data for sown areas with wheat and maize presented in Table 3.3, the number of farms producing wheat and maize can be es mated.
In FBiH 18,100 hectares is sown with wheat and 48,100 hectares with maize. This amounts to 5,030 farms producing wheat and 8,020 farms producing maize, and a total for FBiH of 13,050 farms. In RS and BD the area sown with wheat is 33,600 hectares in RS and 3,700 hectares in BD. With regard to maize 138,400 hectares is sown in RS and 5,200 hectares in BD. This gives a total of 14,920 wheat farms and 28,770 maize farms. The total for RS and BD is 43,700 farms producing the two cereals. In BiH the total number of wheat farmers is then es mated to be 20,000, while there are 37,000 farms producing maize.
Volume of produc on
At the BiH level, the number of hectares sown with cereals declined by 8 percent from 318,000 hectares in 2006 to 293,000 hectares in 2010. The number of hectares has been constant in FBiH with a fi ve-year average of 83,400 hectares, while RS has experienced a reduc on of 12 percent from 225,000 hectares in 2006 to 199,000 hectares in 2010. In BD the situa on is constant with 10,000 hectares.
The share with wheat declined by 32 percent in RS from 49,700 in 2006 to 33,600 hectares in 2010. FBiH has also seen a decrease, but to a lesser extent (10 percent, from 20,100 hectares to 18,100 hectares. At BiH level the total reduc on is 25 percent. For maize grain, the area sown in FBiH went down from 48,400 hectares to 48,100 (-0.6 percent), in RS from 142,600 hectares to 138,400 hectares (-3 percent) and in BD from 5,500 to 5,200 hectares (-5 percent).
The yield measured in tonnes per hectare fl uctuates for both wheat and for maize. The fi ve-year average for wheat in FBiH is 3.5 tonnes/hectare, due to a poor year in 2010. For maize the fi veyear average is 4.5 tonnes/hectare in FBiH. In RS, the fi ve-year average for wheat is 3.3 tonnes/hectare and also here with a poor year in 2010. For maize, the fi ve-
126
year average is 4.6 tonnes/hectare, which also was the yield in 2010, but the average is pulled down due to a very poor yield in 2007 with only 3 tonnes/hectare, just two-thirds of the average. In BD, 2010 was also poor with yields of wheat of 2.8 tonnes/hectare and of maize of 4.5 tonnes/hectare. Both results are below the respec ve fi ve-year averages of 3.6 tonnes/hectare for wheat and 4.6 tonnes/hectare for maize.
The total area harvested with barley, oats and rye was 31,500 hectares in 2010. This is a reduc on from 39,400 hectares in 2009, or 20 percent down. Of the three small cereals, barley is far the most important with a fi ve-year average of 65,500 tonnes of produc on, while the produc on of oats is 35,000 tonnes and rye 10,000 tonnes on average. The yields for these three cereals are also low in 2010, and this is refl ected in a rela vely low produc on in 2010 compared to the previous year. Rye is down by 38 percent, barley by 35 percent and oats by 43 percent.
Value of produc on
The value of wheat in BiH went down from BAM 71 million in 2009 to BAM 45 million in 2010. In par cular RS was hard hit with a reduc on from BAM 46 million to BAM 26 million, or a decrease of 42 percent, but also FBiH and BD are suff ering from lower produc on and yields.
With regard to maize, the total value in BiH was BAM 259 million in 2010, which was a small increase from 2009, when the value was BAM 235 million. FBiH, RS and BD have all experienced an increase in the value, primarily due to higher prices in 2010, and in spite of lower yields and a reduc on in the sown and harvested areas.
In total the value of the two most important cereals is BAM 305 million for BiH in 2010, distributed with BAM 77.6 million in FBiH, BAM 217 million in RS and BAM 10.3 million in BD.
The total value of the fi ve main cereals (wheat, maize, rye, barley and oats) in BiH in
2010 was BAM 332 million with a fi ve-year average of BAM 338 million.
The rela ve importance of maize grain is the highest and it tops in 2010 with 78 percent, when wheat in the same year had the lowest share with only 14 percent. The total value of the three smaller cereals is only 8 percent in 2010. The value of the fi ve main cereals produc on is 1.4 percent of total GDP (BAM 24,484 million in 2010). The fi ve main cereals contribute with 14.3 percent of agricultural GDP (BAM 1,817 million in 2009).
Profi tability of wheat and maize produc on
The project farm survey and case studies undertaken in the sector analysis show that wheat produc on generates a GVA of BAM 578 per hectare including subsidies, while maize grain produc on generates a GVA of BAM 933 per hectare. It is more economically a rac ve for farmers to produce maize instead of wheat, and this is also refl ected in the weight of maize as a crop in BiH compared to wheat and other cereals. These results are in line with pilot FADN es mates, which also indicate that the profi tability of barley, oats and rye is lower than the profi tability of maize grain.
CEFTA and EU comparison
With an average yield of wheat of 3,317 kg/hectare, BiH is lagging behind Albania (3,625 kg/hectare), Kosovo (3,735 kg/hectare), Serbia (3,605 kg/hectare) and Croa a (4,681 kg/hectare), and the yield is higher than in Montenegro, the Republic of Moldova and TFYR Macedonia. The wheat yields vary from year to year depending on clima c condi ons during the year, and in BiH are ranging from 2,662 kg/hectare (2010) to 3,775 kg/hectare (2009). The fi ve-year average yield for the period from 2006 to 2010 in the EU is 4,880 kg/hectare, equal to 147 percent of the yield in BiH. However, the varia on among EU member countries is substan al: From 8,670 kg/hectare in Ireland, Belgium and the Netherlands down to 2,110 kg/hectare in Portugal and 2,590 kg/hectare in Romania, equal to 78 percent of the BiH average.
127
With regard to the average yields of maize, BiH with 4,655 kg/hectare in the period 2005–2010 is lagging behind Albania (5,276 kg/hectare), Serbia (5,032 kg/hectare) and Croa a (6,802 kg/hectare), but yields are higher than in Kosovo, Montenegro and the Republic of Moldova (2,747kg/hectare). As with all other CEFTA countries, the average yields of maize vary from year to year and in BiH ranged from 3,218 kg/hectare (2007) to 5,134 kg/hectare (2005). The fi ve-year average yield for maize for the period from 2006 to 2010 in the EU was 7,720 kg/hectare, equal to 166 percent of the yield in BiH. However, the varia on among EU member countries is also substan al for maize produc on: from 11,860 kg/hectare in Belgium and the Netherlands down to 3,250 kg/hectare in Romania and 3,790 kg/hectare in Bulgaria, equal to 70 percent of the BiH average.
There are several reasons for the lower yield per hectare in BiH compared to most CEFTA and EU countries. Among the most important is the small-scale and fragmented farm giving only limited scope for moderniza on of the equipment. This also leads to low produc vity. Furthermore, stakeholders in the sector in BiH point to the low quality of seeds as another important factor. Inputs are mostly used in small a quan ty, which also puts limita ons on yields, even though the use per hectare of fer lizers and pes cides has been increasing recently. Finally, the level of educa on and training with regard to modern high-yield produc on methods among farmers is low. Here it is also relevant to refer to the status of the extension services in BiH. Experiences from many other countries, both in the region and in the EU show that good extension services are of paramount importance in the moderniza on of agriculture, par cularly in countries where the share of small-scale farms is rela vely large, as in BiH. Extension services in BiH, as in many transi on countries, are the weakest link in the chain, par cularly in FBiH, and most farmers lack educa on, training, informa on and advice. Therefore, farmers tend to have a limited understanding of agricultural economics, of
how to op mize their factor input-strategy, the use of cer fi ed quality seeds, etc. Also, fer lizers and agro-chemicals are not used according to professional standards and good agricultural and environmental prac ce.
11.1.2 Processing industry
Processing of cereals includes primary processing of cereals into fl our of diff erent types and secondary processing into fresh bread and various types of baked products, cakes, etc.
Volume of primary processing
The produc on of fl our in BiH is taking place in 10 major mills in FBiH excluding a large number of small-scale mills and in 36 mills of various capaci es in RS/BD.
In FBiH, wheat is far the most important product covering 99.6 percent of the produc on in 2010 (138,144 tonnes) and 99.7 percent in 2011 (124,876 tonnes). However, the overall produc on diminished in 2011. The annual capacity in the sector is 533,000 tonnes, and the u liza on of capacity in the FBiH primary processing sector in 2011 was 23.5 percent.
As was the situa on in FBiH, wheat fl our in RS is the domina ng product with 90,816 tonnes in 2009, or 94 percent of total produc on of 96,438 tonnes. The capacity u liza on is es mated to be 30 percent, and the full capacity of the RS mills is 320,000 tonnes.
The total capacity of the FBiH and RS mills is es mated to be 854,000 tonnes, and the u liza on rate is 26 percent.
The produc on of 222,000 tonnes of various products, with wheat fl our as the domina ng product, requires 296,000 tonnes of cereals, if the u liza on rate (1 kg cereals gives 0.75 kg fl our) is 75 percent. It could benefi t farmers with 66,000 to 70,000 hectares, depending on the average yield, to produce this amount of wheat. However, many mills rely on imported cereals, par cularly from Hungary, due to what the processing industry considers as wheat of be er quality and
128
lower price (BAM 230 per tonne in 2010). This represents a substan al challenge for the BiH farmers to compete with the imported wheat, both in terms of price and in terms of quality.
Value of the produc on of milled cereal products
In order to es mate the value of the produc on of milled cereal products, the average price for wheat fl our on the domes c market in 2010 is used (BAM 530 per tonne), since no produc on sta s cs, broken down by types of products, have been available from ministries or sta s cal departments.
In total 230,000 tonnes of milled cereals are produced with 125,500 tonnes in FBiH and 96,500 tonnes in RS. An addi onal 8,000 tonnes are produced in BD. The total produc on of milled produc on in BiH is then valued at BAM 122 million distributed between en es and BD as follows: In FBiH it is BAM 66.5 million In RS it is BAM 55.1 million In BD it is BAM 4.2 million
Secondary processing
The secondary processing industry in BiH contains 15 major bread-baking companies and 12 major confec onery companies. Beside that there are several smaller companies.
The most important product category under secondary processing in FBiH is “fresh wheat bread” with almost 18,000 tonnes produced in 2011, down by 16 percent from 2010. The second largest product category is “sweet cookies (sweet biscuits)” with 4,700 tonnes in 2011, which is a doubling from 2010, and the category including “all types of pastries” with 3,276 tonnes. Besides sweet cookies, the rising stars in FBiH secondary produc on are the categories “confec onery and daily cakes” up by 212 percent, “fresh rye bread” up by 138 percent, and “toast breads” up by 136 percent , but these categories are s ll rela vely small.
Unfortunately there is no informa on about the value of the produc on available, but
it is clear that the value added of the main product category – fresh wheat bread – is lower than what can be expected from other more processed categories, such as sweet cookies and other products. The increase in these categories might therefore also represent a rela vely strong increase in the value of the produc on, since the weight of fresh wheat bread is reducing. This tendency is posi ve from an economic point of view.
In RS, it is also wheat bread which is domina ng produc on in the secondary processing industry with a produc on of 10,526 tonnes in 2009. This fi gure represents a decline in produc on from 2006, when the produc on was 13,461 tonnes. This is a reduc on of 23 percent, strongest from 2008 to 2009. The other product categories vary in tendencies, and no one of them represents strong increases, as was the case for some product categories in FBiH. As in FBiH, there is in RS an increase in the share of products with an expected higher value added on the expense of wheat bread. Also here in RS it is posi ve.
Product quality
Many millers and other stakeholders interviewed state that the quality of locally produced cereals does not meet market requirements with regard to moisture, hectolitre weight and maximum amount of foreign materials (admixtures). To deliver the quality demanded by the bread-baking industry, mills in BiH have to blend wheat. All millers met during site visits men oned that the quality of local wheat is too low, and that they have to import be er quality wheat for blending purposes. The blending ra o between local to imported wheat is 10–20 percent local and 80–90 percent imported wheat. It was also men oned by a few processors that they o en are confronted with domes c (not imported) cereals with some content of agrochemicals.
However, the picture is blurred, and in 2009 and 2010 the quality of wheat was good and corresponded to the men oned
129
requirements of processors, but there were also some millers who claimed that the moisture content was too high.
11.1.3 Current state and en ty/district policies
At state level, as well as at en ty and district level, policies are being prepared along the lines of EU regula on. Ins tu ons relevant for the cereals sector, such as the Food Safety Agency and the Plant Health Protec on Agency are preparing for EU candidate status and are aligning their organiza on, their ac vi es and their regula ons to EU requirements.
However, it is also clear that the autonomy of the en es and BD creates many varia ons in the prac cal implementa on of the policies within the framework of agricultural and rural development strategies and ac on plans.
With regard to cereals, there is no harmonized policy across the en es and BD for providing subsidies, and they are currently, among others, a mixture of area payments of diff erent sizes and for diff erent crops, product support and in-kind contribu on of blue diesel and fer lizers. The subsidies are not aligned with the EU agricultural policy measures, which favour area payments.
The budget for agriculture and rural development in the en es remains low and tends to orient towards CAP pillar 1 support and not CAP pillar 2 supports. The lack of an effi cient administra on at all levels is impeding the compe veness of farmers and the agri-processing industry throughout the country. Also due to the lack of harmoniza on and coordina on between en es and districts, the environment for the farmers in the country lacks transparency and creates diff erent condi ons for produc on from one area to another. There is an outspoken need for harmoniza on and alignment of subsidies and enforcement of legisla on across the diff erent en ty and district borders. This is the case not only for cereals produc on but for agriculture in general.
11.1.4 Trade policy
BiH is following its path towards EU candidate status and by 2013 BiH will have a fully liberal trade partnership with the EU, under the circumstances that BiH fulfi ls the requirements, and that the companies wishing to export to the EU fulfi l the requirements in the Acquis.
Over the years covered by this analysis, Bosnia and Herzegovina has not been self suffi cient in agricultural produc on with the excep on of plums. Therefore large quan es of agro-food produce have been imported. In 2006, the gap between agricultural and food imports and exports was about BAM 1,700 million, equivalent to EUR 870 million. In 2010, the value of agricultural exports reached EUR 250 million, whereas the value of agricultural imports amounted to EUR 1,485 million equal to a defi cit of EUR 1,235 million. This is an increase in the defi cit of 42 percent, or more than 10 percent per year.
Trade balance in cereals
The total trade defi cit in cereals in 2010 was BAM 166.2 million, due to imports of BAM 194.3 million and exports of BAM 28.1 million. It is a minor increase from 2009, but the level is s ll lower than in the years 2007 and 2008. Exports are increasing and show their highest level in 2010 with BAM 28.1 million.
For wheat and maize there was a very small export take-off in 2009 and 2010, but the mainstream tendency is import of both cereals. The trade defi cit was BAM 100 million for wheat in 2010 and BAM 53.5 million for maize.
The total import of cereals from CEFTA countries in 2010 was BAM 102.3 million, while the exports to the CEFTA countries were as low as BAM 3.8 million. The trade defi cit was then BAM 98.4 million in 2010. There has been a slow increase over the last two years, but s ll not at the level of 2007, where the defi cit was BAM 147 million.
130
Import prices
The import price per tonne of wheat in 2011 was on average BAM 330 per tonne, but the import price from Hungary was only BAM 231 per tonne, while the small exports of wheat were sold for BAM 568 per tonne in 2011. Hungary is Bosnia and Herzegovina’s most important trading partner in terms of cereals, closely followed by Serbia and Croa a. During the period 2005–2009 wheat imports from Hungary were always more than 50 percent of total wheat imports (with the excep on of 2007). In 2008, out of the total of 326,800 tonnes of imported wheat, 274,200 tonnes or (84 percent) was imported from Hungary.
Produc on balances
The domes c produc on of wheat has covered a stable share of the domes c market with 40 percent for the years 2006 to 2008, and 43 percent in 2009. In 2010, the share dropped drama cally to only 22 percent. This was caused by a decrease in domes c produc on due to weather and fl ooding problems. Domes c consump on did also fall, but imports increased to capture the share of the market le open due to low produc on in BiH.
For maize the picture is diff erent. The share of domes c consump on covered by BiH produc on has been rather stable over the fi ve years, with an average of 82.5 percent. From 2009 to 2010, a slightly reduced share from 85.4 percent to 81.7 percent was observed, but it is not a drama c reduc on, and the market share signals a rela vely high level of compe veness at the local market for maize grain.
Import subs tu on
Current produc on of wheat and maize could theore cally be based on 255 wheat producers and 909 maize producers with op mal yields genera ng a four family member income at the average BiH level per capita (EUR 3,300 per capita).
If the current import of wheat and maize can be subs tuted, BiH will need 609 new or extra
wheat farmers for every 25 percent import subs tu on, and 354 new maize grain farmers for every 25 percent import subs tu on.
Commodity reserve
In order to also cover a commodity reserve as recommended by FAO and as expressed in the ac on plan for a commodity reserve, addi onal numbers of hectares are required. The need will be in the range of 100,000 tonnes of wheat and considerably less for maize according to the ac on plan. This amount of wheat produced with 4.5 tonnes/hectare requires 22,222 hectares. If it furthermore is assumed that the required number of hectares for a viable farm is es mated to be 44 hectares, addi onal produc on from 505 farmers is requested to contribute to the reserve stocks.
Trade with processed products
Regarding exports of milled products the general picture is an increase in the exports from 2007 to 2011 in the range of BAM 3.6 million or 123 percent. In the same period imports have however also increased, and the defi cit has, as a consequence, increased 39 percent. The increase in imports is not as substan al as the increase in exports, but the point of departure for exports is rela vely modest compared to the import level.
The price per tonne wheat fl our exported during the whole period covered is higher than the import price per tonne. In 2011, the export price per tonne was 49 percent higher than the import price, and in the period the average diff erence is 86 percent in favour of the export price. In 2011, the export price was BAM 973 per tonne, the import price was BAM 654 per tonne and the diff erence therefore was BAM 318 per tonne.
The picture for processed products such as sweet biscuits, waffl es, etc. is more blurred than that for milled cereal products. Exports here are also fl uctua ng with an increasing tendency in 2011, where the level of exports is BAM 27.6 million. This is an increase of 14 percent, which is far below the increase in exports of the milled products. The defi cit is
131
increasing also for these products, with BAM 10 million or 23 percent in the period from 2007 to 2011. For these products the increase in imports is larger than the increase in exports, leading to an increase in the gap over me.
11.1.5 Compliance with EU standardsBiH authori es at all levels are facing several tasks in order to fi nalize the adap on of exis ng legisla on to EU standards and par cularly to enforce approved legisla on. However, the actual status is not a great obstacle to BiH cereals farmers, as cereal exports are not signifi cant.
Produc on of cereals on farms in BiH is typically conven onal, in the sense that tradi onal produc on principles are used. Cer fi ca on systems, such as cer fi ca on for Global GAP standards and Quality Management System of safe food produc on, quality management and environmental protec on are not used. The arguments of farmers are that there currently is no need for applying any standard, since the produc on is directed towards the domes c market, and here it is not a market requirement. As a consequence, the produc on does not typically follow the formal principles of good agricultural prac ce, and the farmers do typically not meet the agri-environmental and quality standards of the products.
However, among farmers there is a growing understanding of the need to improve standards of produc on and management. Furthermore, the farmers are willing to take these steps the day they are forced to take them. That day may come sooner than they expect if the EU nego a ons move along faster than what has been seen in previous years. If this happens, the IPARD programme with its support to increased compe veness and moderniza on of the produc on standards in line with the acquis will be very relevant.
HACCP for BiH mills is not yet mandatory. Overall it is not surprising that just a few agroprocessing companies have EU approval for exports (EU export cer fi cates). Due to noncompliance with EU standards and regula ons, the exis ng export markets for cereals and fl our are primarily CEFTA countries and Turkey.
11.1.6 InvestmentsThe analysis of previous and planned investments in the sector is based on case studies and surveys as well as on stakeholder interviews and expert statements.
The eight case study farms in FBiH have invested in the range of BAM 575,000 over the last 5 years. The average investment was BAM 71,500 per farm. In RS, the fi ve case study farms represent a total investment of BAM 873,000 with an average of BAM 175,000, but one farm dominates the picture. Without that farm included in the sample, the average was reduced to BAM 30,000.
According to the data from the case studies, the farms without on-farm silos expect in the future to invest in silos. Investments in silos make storage possible, and the farmers will not have to sell at low prices immediately a er the harvest. The increasing importance of on-farm storage facili es was confi rmed during fi eld visits and the visit to the INTERAGRO Bijeljina Fair in September 2011. The average investments among the case study farms were es mated to be BAM 100,000 per farm including investments in storage, combines, tractors and other farm equipment.
The farm survey confi rms the investment plans. On average the surveyed farmers will invest BAM 32,600 in the coming years as a priority for machinery for wheat and/or maize produc on. This confi rms the need to upgrade the technological level of farmers in BiH. Other investments might add to this fi gure.
The investments in the primary processing sector will also be demanding, but not on the same scale as is the case for the primary producers. Especially the smaller newly established mills with up to 10,000 tonnes annual capacity have not invested in suffi cient silos, and now they expect to increase their storage facili es. Besides addi onal silo capaci es, more and be er driers are needed. Manufacturers also plan to invest in packing lines for wheat fl our and packages of 5, 10 and 25 kg. The more concerned
132
millers also see a permanent need to invest in laboratory equipment. The number of processors expected to be viable in the future is minimum 20, and the total investment needs for these processors is es mated to be between EUR 20 million and EUR 25 million in total over the next fi ve-year period.
The reac ons to the announced possible IPARD programme, with co-fi nancing support to farmers and millers, during fi eld visits and workshops were very posi ve from those producers that are already doing well, and were rather reluctant from those who are performing less well. The expected requirement of a 50 percent private co-fi nancing makes the expecta ons somehow modest among the processors of this last group.
11.1.7 Training needs
Based on this analysis, the cereals sector in Bosnia and Herzegovina is facing a number of opportuni es like increasing total produc on of wheat and maize, partly by increasing the areas and partly the yield per hectare. Furthermore, improvement of the quality to be in line with the processing industry’s requirements and with EU requirements will also increase compe veness within a more liberalized market. Tailor-made training courses could facilitate these opportuni es.
In order to focus the training eff ort, it must primarily be training related to EU acquis topics, which should come fi rst. Here training of farmers/producers in Good Agricultural and Environmental Prac ce (GAEP), and of staff in the primary and secondary processing industry regarding HACCP and other quality control topics related to food safety, environment and hygiene should have priority.
11.2 Recommenda ons for interven ons
The following recommenda ons could contribute to make wheat and maize produc on more profi table in Bosnia and Herzegovina. An overall strategy for the development of the cereal sector in
BiH can focus on import subs tu on as the primary market incen ves. Import subs tu on has a poten al to be achieved, if the compe veness of the producers is enhanced, and if the regulatory environment is harmonized and able to facilitate the strengthening of the compe veness of the farmers.
It is important to facilitate structural changes of the sector. These changes should address the main problems causing the rela vely low compe veness of the sector as it is today. These causes are low yields, low produc vity and low quality.
Land consolida on is needed and must be facilitated by the needed regulatory framework in order to make the land market work. Only in this way will it be possible for farmers to expand their land and to increase the economies of scale of produc on.
Larger areas for cereals produc on and development of specialized cereal farms makes it possible to invest in be er and more produc ve technologies in the produc on of cereals. Support programmes focused on economic viable farms, where investment support is targe ng produc vity as well as product quality supplemented with support to competence build-up of the farmers and the processors is one side of the overall strategy. A harmonized regulatory environment including homogeneous support rates per hectare and per crop, enforced regula on and control, appropriate extension services and linkages to the research and development sector is the other.
Furthermore, the overall effi ciency of produc on and compe veness has to be increased through the use of cer fi ed seeds. Also, overall compliance with na onal and EU food safety and environmental protec on standards has to be improved considerably.
Technical assistance and training is needed − especially in the produc on sector − to increase awareness and capacity regarding modern produc on techniques and technologies and a ainment of na onal and EU standards.
133
Taking into considera on the overall situa on in the sector and the analysis of the current situa on presented in this report, future interven ons are recommended to be oriented towards the following topics:
State/en ty/BD level
Harmonizing all subsidies for producers and processors between RS, FBiH and the BD, including cantons and municipali es. Harmoniza on will contribute to create a homogeneous market without distor ons of the compe ve environment; Harmonizing farm registers and agricultural informa on systems will improve the sta s cal data and make it possible for the authori es to take decisions against an updated background, and it will contribute to the professionalism of the sector, linking support and subsidies to registra on of the farmers in the farm registers; Introducing a minimum price in line with the EU interven on price, which was EUR 101,31 per tonne in 2011 in order to contribute to the balancing of compe on between BiH producers and their interna onal colleagues; Suppor ng farmers with per hectare payments. Hectare payments should be announced before the crop is sown to give the producers some planning security. Hectare payments would also reach producers who do not sell to registered traders or processors, as is the case now. Around 70 percent of cereals that are produced are not subsidized as they are not produced on registered land; Improving farm structures by enabling a land market and by speeding up land consolida on. A func onal land market will help commercial farmers to expand their farms faster and consider support to a land ren ng system, including payments given to rented land; Improving the extension services and providing more resources, in par cularly in FBiH, where the need for a stronger organiza on of the extension service is
needed. Coopera on with the na onal research and development ins tutes can be enhanced through a be er mutual coopera on between the two links in the chain. Competence build up of the extension services could focus on good agricultural and environmental prac ce, op mal resource u liza on and energy effi ciency in produc on. They can also facilitate specialized services like business plans and product development, architectural building plans, so ware and training; Encouraging public-private partnerships in seed development and other relevant areas to link the exis ng know-how of the governmental research ins tutes be er with the market; Registering more cereal varie es in the na onal List of Varie es to have a broader choice, also refl ec ng the demand and needs from the processing side; Enforcing the implementa on of laws, such as controls at all levels; Repor ng regularly about market prices (Market Informa on System accessible to farmers) as the more transparent the market is, the be er it will be for the farmers.
Producers
Increasing overall compe veness by providing fi nancial support to the introduc on of new seeds, investments in produc on and harves ng techniques; Improving on farm cereal handling equipment and machinery (combines, seed machinery, sprayers, ploughs and trailers) but also equipment for land clearance (of temporarily abandoned arable land) through fi nancial support to investments in these technologies and through support via the extension service to the u liza on of the technologies; Providing support to the investments in the construc on and refurbishment of storage buildings (silos including driers), machine sheds and weight-bridges, where possible promo ng collec ve ownership and management, including elements of a grains warehouses receipts system.
134
Processors
Investment support to investments in various technologies needed and planned by the processors, including addi onal silo capaci es, more and be er driers, packing lines for wheat fl our and packages of 5, 10 and 25 kg.
Investments in improved laboratory services within the companies.
11.3 Main fi ndings for IPARD
The following recommenda ons are given for considera on for interven ons under IPARD:
Table 11.1: Priority Axis 1 – Improving market effi ciency and implemen ng community standards, IPARD measures 101and 103
Poten al Investments under IPARD Measure 101
Investments in Agricultural Holdings -– Arable Crops Sector
Benefi ciaries(numbers)
Investment per
Benefi ciary, EUR
Total investment funding in
EUR
Public funding (EU = 37.5% + BiH state = 12.5%), EUR,
Construc on and/or renova on of storage buildings (silos incl. driers), machine sheds, etc.
3,000 45,000 135,000,000 67,500,000 67,500,000
Poten al Investments under IPARD Measure 103
Investments in Processing and Marke ng of Agricultural Products
Benefi ciaries(numbers)
Investment per
Benefi ciary, EUR
Total investment funding in
EUR
Public funding (EU = 37.5% + BiH state = 12.5%), EUR,
50%
Private funding,
EUR, 50%
Renova on of mills (buildings and equipment) 20 500,000 10,000,000 5,000,000 5,000,000
Construc on and/or renova on of silos 20 500,000 10,000,000 5,000,000 5,000,000
Equipment for improvement of hygiene and product quality, in compliance with Community standards (HACCP, ISO, IFS)
20 25,000 500,000 250,000 250,000
Investments in laboratory equipment 40 50,000 2,000,000 1,000,000 1,000,000
TOTAL 10,100 n.a. 497,500,000 248,750,000 248,750,000
It should also be men oned here that training could also be supported by IPARD, although detailed research and training needs assessments might be needed upfront. The establishment of producer groups and producer organiza ons could also be included, since this type of support is also eligible under IPARD.
The total investment need under IPARD for the development of the cereals sector is es mated to be a maximum of EUR 500 million, fi nanced with 50 percent from the private sector and 50 percent from BiH and the EU. The unit costs of investments are calculated based on informa on from case
135
studies, survey data, expert data and market prices collected.
Assuming that only viable farms, proving to be feasible in the short term, will be eligible, the number of poten al benefi ciaries for measure 101 will be around 5,000, represen ng 10,000 projects in the fi nancial table, while there will be only 100 poten al benefi ciaries under measure 103 for processing. Poten al target group, farmers: 5,000, projects 10,000 Average investment project: EUR 50,000 Poten al target group, processors: 100 Average investment project: EUR 500,000 for technologies and EUR 50,000 for laboratory equipment
Investment budget: EUR 500 million (50 percent by the private sector, 50 percent by BiH (12.5 percent) and the EU (37.5 percent)
Proposed size of projects for producers
The maximum and minimum limits of total value of eligible investments per project are:
Minimum EUR 10,000 Maximum EUR 100,000
Proposed size of projects for processors
The maximum and minimum limits of total value of eligible investments per project are:
Minimum EUR 25,000 Maximum EUR 500,000
136
137
ANNEX 1
LITERATURE AND WEBSITES CONSULTED
BAJRAMOVIC, S. Faculty of Agriculture and Food Sciences, University of Sarajevo; FAO workshop regarding arable crops sectors analysis. May 2011.
BAJRAMOVIC, S. FAO consultant. The status and constraints of the agricultural sector in BiH and the country food security situa on. 2011.
BAJRAMOVIC, S. FAO consultant. The legisla on concerning food security policy in Bosnia and Herzegovina. 2011.
BAJRAMOVIC, S., DZOMBA, E., & BECIROVIC, E. Feasibility study – Factory of premixes and safe animal feed in Bosnia and Herzegovina. July 2010.
BARBER, J. & TITUS, M.J. Structure of the United States Wheat Supply Chain. UGPTI Staff Paper No. 131. 1995.
BIANCALANI, R. FAO Chief Technical Adviser in Bosnia and Herzegovina. Bosnia and Herzegovina. 2002.
CEEC AGRI POLICY. Agro economic policy analysis of the new member states, the candidate states and the countries of the western Balkans. D12–2 Second 6-monthly report. Monitoring of agricultural policy, market and trade developments in Bosnia and Herzegovina. 2006.
CEEC AGRI POLICY. Agro economic policy analysis of the new member states, the candidate states and the countries of the western Balkans. Task 4–1; Specifi ca on for the second rural vitality report. Second report for BiH. 2006.
CERNE, A. FAO Technical Coopera on among Countries in Transi on (TCCT) Consultant. Policy op ons and recommenda ons for food commodity reserves in BiH. 2011.
DG–AGRI. Study on the State of Agriculture in Five Applicant Countries: Country Report, Bosnia and Herzegovina. 2006.
European Commission SESMARD (Support for Establishment of the State Ministry of Agriculture and Rural Development) Introductory Presenta on: Harmonizing BiH subsidies/Improving sector support. 28 May 2008.
European Commission. Bosnia and Herzegovina 2011 Progress Report. Working Paper October 2011.
European Commission, Agriculture and Rural Development. Agricultural Policy Perspec ves Briefs (No 1): The CAP in perspec ve: from market interven on to policy innova on. 2011.
European Union. Func onal Review of the Agricultural Sector in BiH. October 2004.
European Union SESMARD (Support for Establishment of the State Ministry of Agriculture and Rural Development) Bosnia and Herzegovina – Agriculture Report. 2007.
European Union SESMARD (Support for Establishment of the State Ministry of Agriculture and
138
Rural Development) Working document. BiH Strategic Plan for Harmoniza on of Agriculture, Food and Rural Development (2008–2010). 2008. p 61
European Union SESMARD Introductory Presenta on: Harmonizing BiH subsidies/Improving sector support. 28 May 2008
FBiH Ministry of Agriculture, Water Management and Forestry, Web site h p://www.fmpvs.gov.ba
RS Ministry of Agriculture, Forestry and Water Management, Web site h p://www.vladars.net
Brčko District, Department for Agriculture, Web site h p://www.brcko.org
GFA Consul ng Group GmbH. Food Industry Study in Southeast Europe. Final, December 2010.
IAMO/Leibniz Ins tute of Agricultural Development in Central and Eastern Europe. Studies on the Agricultural and Food Sector in Central and Eastern Europe. Vol 57. 2010.
KURBANOVA, J., LONC, T. & SZENTPALI, G. Overview on vulnerability to food security in Bosnia and Herzegovina. FAO REU. May 2011. p 6
Republika Srpska. Rural Development Strategy 2009–2015
Sta s cal Yearbooks 2009 from FBiH, RS and BD
The World Bank. Agricultural Sector Policy Note for Bosnia and Herzegovina. 2010. p 4
United States Department of Agriculture (USDA). Foreign Agricultural Service, STANOJCICEMINAGIC, S. EU Strengthens BiH Phytosanitary Service. 2011.
h p://www.brcko.org: Department of Agriculture
h p://www.fao.org/countries/55528/en/bih/
h p://www. ihvlada.gov.ba
h p://www.taxrates.cc/html/bosnia-herzegovina-tax-rates.html
h p://www.vladars.net: Ministry of Agriculture, Forestry and Water Management, RS
139
ANNEX 2
WINTER WHEAT MAP
Map of BiH with a focus on winter wheat suitable areas
On this map it can be clearly seen that the green (light) areas are almost exclusively located in the northern and North-eastern part of Bosnia and Herzegovina.
140
141
ANNEX 3
CASE STUDIES
Case Study reference number: FBIH – AC1Type of en ty: FarmerHuman resources: 7 family members Economic ac vi es: Produc on of arable crops (wheat, maize, barley and soya) and fa ening pigs to output weight of up to 120 kg Other ac vi es: noneTurnover: 2009: BAM 62,875 2010: BAM 69,974
HistoryThe farm owner has been engaged in the produc on of crops and fa ening pigs since his youth. This is a tradi onal family farm where the owner’s grandfather and father were also engaged only in agricultural produc on.
Current situa onIn the area of 30 hectares of arable land (4 hectares of own land and 26 hectares of rented lend, 10 hectares of which is owned by the Municipality Odzak, and 16 hectares by individuals), which is not irrigated, the farmer grows arable crops and soya in the following ra o (year 2010): wheat 4 hectares, barley 1 hectare, maize 11 hectares, and soya 14 hectares. The land rented from individuals has a price of 200 BAM/hectare annually. Such produc on structure is maintained each year, with the rota on of parcels in order to follow crop rota on that the farmer consistently applies.Produc on of main cereals by years in hectares:
The farmer has needed machinery (tractors and implements), which is enough to cul vate all the land, and he pays only for the services of ren ng a combine (200 BAM/hectare) during harvest of crops because he does not have his own combine. The farmer has maize baskets and fl oor storage capacity of about 50 tonnes. This is why the farmer most o en stores between 40 and 50 tonnes of maize and 3–4 tonnes of soya each year, while the remaining yield is sold immediately a er the harvest, using own transport to a known buyer “Oranica” d.o.o. [ltd.], Samac-Domaljevac, with successful coopera on thus far.Besides the sale of corn, part of the produc on is used for own needs, that is, for fa ening pigs. Between 100 and 150 pigs with output weight of up to 120 kg are fa ened each year in two cycles.
Farm managementThe farmer has been tradi onally engaged in the produc on of arable crops, growing them in a conven onal way and consistently applying all needed agricultural machinery. The structure of sowing has been almost the same in the last about 10 years. The farmer pays par cular a en on to the seed material as a key factor for the total produc on level. In the wheat produc on he uses the varie es srpanjka and žitarka, while in the maize produc on the farmer believes in the Pioneer hybrids, group 400. Harves ng is done when the cereals become technologically mature, so there is a considerable risk of excessive humidity of the grains in case of precipita on during the harvest.As for fa ening pigs, the farmer buys piglets whose input weight is 25–30 kg and fa ens them to the output weight of 120 kg.Unfortunately, like most of the BiH farmers, this interviewed farmer does not keep his own accoun ng and bookkeeping records that may show important produc on and economic performance parameters, so this report includes only the informa on about the produc on volume and the prices of sold products from 2009 and 2010. The farmer has not registered the business yet because un l 2010 it had not been a requirement to receive the en ty and cantonal fi nancial incen ves.
142
InvestmentsThe farmer has a storage building of 10 x 8 m in size and capacity of 50 tonnes, constructed for BAM 20,000, which was the farmer’s own investment. Besides, among the fi xed assets bought in the last fi ve years, a tractor with all needed implements should be singled out. A total value of purchase was BAM 50,000, which was also the farmer’s own investment.In the next period the farmer plans to have corn storage buildings (silos) constructed, then to purchase own combine harvester, and to enrich the land to improve chemical and physical proper es of soil and thus create condi ons for an increase in produc on. The main investment priority is the construc on of a silo whose capacity would be 200 tonnes in order to avoid the sale of products (corn) immediately a er the harvest when, as a rule, the selling prices are the lowest.
MarketFor own needs and with such storage capaci es, the farmer usually keeps 40 tonnes of maize and 10 tonnes of corn for animal feed, and some small quan es are stocked. Most of the corn produc on is sold immediately a er the harvest to an already known buyer, “Oranica” doo [ltd.]. The sale is not based on a signed contract but it takes places only on the basis of posi ve experiences. The payment is in cash, at most up to 50 days a er delivery. Unfortunately, a major problem in the Federa on of BiH is the failure of relevant ins tu ons (Federa on and cantonal ministries of agriculture) to provide informa on concerning the an cipated purchase prices and the amount of incen ves before sowing, so the producers always take some risk in the corn produc on.
Produc on and marke ng standardsProduc on of arable crops is exclusively conven onal. The farmer needs not cer fy the produc on because it is not a market requirement, and so he does not apply any standard in the corn produc on. The corn is sold in bulk, with the farmer’s own transport to the buyer. The quality and the humidity of the sold corn are prescribed.
Economic performanceThe producer was not able to present variable costs by individual arable crops. It should be pointed out that the average yields for all crops are excep onal, with the following ranges: wheat 4–5 t/hectare, maize (kernel) 8.59.5 t/hectare, barley 5–6 t/hectare, and soya about 3 t/hectare. In 2009 and 2010 the farmer received some fi nancial incen ves: 0.12 BAM/kg for wheat (0.10 BAM/kg – at the level of the Federa on of BiH, and 0.02 BAM/kg – Posavina Canton), and 600 BAM/hectare for soya. There were no incen ves for the maize produc on, and the farmer has not applied for the fi nancial incen ves for the barley produc on.
Total value 7,104 8,504 23,007 25,850 1,222 1,590 31,542 34,020
Total value / ha 1,776 2,129 2,092 2,350 1,222 1,590 2,253 2,430
Addi onal income from fa ening pigs: (150 pigs x 120 kg x 2.65 BAM) + (150 pigs x 50 BAM incen ve per head) = 55,200 BAM The costs of feed and buying piglets for BAM 18,900 (150 head x 28 kg x 4.50 BAM) should be deducted from the above sum.
143
Factors of successThe farmer gave three key factors for the success of his farm in the corn produc on: Use of quality seed material Mee ng of agricultural deadlines and consistent applica on of agricultural machinery Full engagement of all family members in the produc on, with needed enthusiasm and belief in success
Lessons learned for policy measuresA major problem faced by the farmers engaged in corn produc on is uncertainty of subsidized or minimum selling prices before sowing. Therefore there are o en protests and blockades of border crossings and major roads as farmers’ response to the prices off ered by relevant ins tu ons. The next problem is the lack of storage capaci es and the need to sell a considerable amount of produced goods immediately a er the harvest, when the prices are the lowest.The posi on of the farmers in the Federa on of BiH is unfavourable and not equal to the farmers in the Republic of Srpska and the region (Croa a and Serbia) because of lack of benefi ts (cash grants) concerning subsidized fuel (“blue diesel”) or mineral fer lizers. On the other hand, there is CEFTA and the trade without customs du es. The farmers are li le acquainted with the standards of both the produc on and storage, that is, keeping the products. This results from the current requirements of the local market that absorbs almost all produc on.
144
Case Study reference number: FBIH – AC2Type of en ty: FarmerHuman resources: 5 family members Economic ac vi es: Produc on of arable crops (wheat, maize and soya) Other ac vi es: noneTurnover: 2009: BAM 77,235 2010: BAM 124,550
HistoryThe farm owner has been engaged in arable crops produc on since his youth. This is a tradi onal family farm where the owner’s grandfather and father were also engaged in agricultural produc on only. The owner’s father began the business in the 1970s, star ng with 6 hectares of his own land. That situa on remained un l the war when produc on stopped and then resumed a er the war (1995–96). In 2000, the land was rented, so the produc on was increased with an addi onal 5 ha. Later the ren ng of the land and the increase in produc on con nued. An addi onal 10 ha were rented in 2003, then 2 ha in 2006, 13 ha in 2008, and another 24 ha in 2010, which makes a total of 54 hectares of rented land in 2011.
Current situa onOn 60 hectares of arable land (6 ha of own land, and 54 ha of rented land), which is not irrigated, the farmer grows the following corn crops in this ra o (year 2011): wheat 20 ha, maize 10 ha, and soya 20 ha. As the total amount of land used to be smaller, the produc on structure was somewhat diff erent. It should be pointed out that the amount of land under soya has been considerably increased in the past two years from 5 ha to 20 ha (2010), and then 25 ha (2011). The parcels for each crop are rotated each year in order to follow crops rota on, which the farmer consistently applies.Produc on of main cereals by years in hectares
Cereal 2011 2010 2009 2008 2007 2006 2005
Wheat 25 25 22 22 16 16 15
Maize 10 15 17 17 7 7 6
The farmer has needed machinery to do all farm jobs. He also uses his machinery in terms of providing services to other agricultural producers, charging the services as follows: ploughing 250 BAM/ha, lling 250 BAM/ha, sowing 70 BAM/ha, and harves ng 200 BAM/ha. Besides the sale of corn, some produced goods are used for own needs, that is, for the fa ening of 15 pigs the farmer keeps an average 10 tonnes of maize a year.
Farm managementThe farmer has been tradi onally engaged in the produc on of arable crops, growing them in a conven onal way and consistently applying all needed agricultural machinery. The farmer uses seed material from various sources, and he buys it most o en from Italy or France. Harves ng is done when the cereals become technologically mature, so there is a considerable risk of excessive humidity of the grains in case of precipita on during the harvest. There is no control of crops during the vegeta on, harvest and placement. The transport to silos is carried out immediately a er the harvest, so there is no previous storage.Unfortunately, like most BiH farmers, this interviewed farmer does not keep his own accoun ng and bookkeeping records that may show important produc on and economic performance parameters, so this report includes only the informa on about the produc on volume and the prices of sold products from 2009 and 2010. The farmer has a registered business, but he is s ll not included in the VAT system.
145
InvestmentsIn the past several years the farmer has bought various machines, among others: two-row corn picker (BAM 16,000) in 2005, a used tractor (BAM 15,000) in 2006, and implements (disk harrow, plough, sprinkler) for BAM 11,000 in 2007. In 2008, he bought another tractor (BAM 20,500) and a combine (BAM 25,000). During 2010 he bought two tractor trailers (BAM 20,000), and in 2011 a planter (BAM 3,500). His funding sources are own funds that come from the sale of products, earlier income or the sale of old equipment and machinery.In the next period the farmer plans to have a corn storage buildings (silos) and a grain dryer constructed. The main investment project is the construc on of the silos in order to avoid the product sale (corn) immediately a er the harvest, that is, to have an op on of ¨wai ng¨ for more favourable prices. Also, the construc on of the dryer would reduce the humidity of products to appropriate technological level, thus increasing the product price. Besides, the farmer is planning to buy a tractor and implements.
MarketUn l 2010 all wheat had been sold immediately a er the harvest to the purchase centre “Agroobeda” in Vidovnice (20 km from the farm, transport by tractor trailers), but in 2011 agreement on the sale of wheat was reached with the Federa on Directorate for Goods Reserves. Maize and soya are also sold immediately a er the harvest to “Koka Posavina” doo. [ltd.], the company located in the vicinity (5 km) of the farm. The sale is not based on a signed contract, but it takes place only on the basis of oral agreement and posi ve experiences. The payment is in cash, at most up to 60 days a er delivery. Unfortunately, a major problem in the Federa on of BiH is the failure of relevant ins tu ons (Federa on and cantonal ministries of agriculture) to provide informa on concerning the an cipated purchase prices and the amount of incen ves before sowing, so the producers always take some risk in the corn produc on. The farmer also complains about the impossibility to store his products in order to wait for be er prices because if he has not sold the products immediately a er the harvest, then he will lose the right to receive fi nancial incen ves.
Produc on and marke ng standardsProduc on of arable crops is exclusively conven onal. The farmer needs not cer fy the produc on because it is not a market requirement, and so he does not apply any standard in the corn produc on. The corn is sold in bulk, with the farmer’s transport by own tractor trailers to the buyer. The quality and the humidity of the sold corn are prescribed.
Economic performanceIn 2009 and 2010 the farmer has received some fi nancial incen ves: 0.12 BAM/kg for wheat (0.10 BAM/kg – at the level of the Federa on of BiH, and 0.02 BAM/kg – the Posavina Canton) and BAM 600/ha for soya. There were no incen ves for the maize produc on.
A considerable decrease in income from soya per hectare in 2010 compared to 2009 is no ceable. The decrease resulted from a fl ood that destroyed a lot of soya plants. The farmer was en tled to subsidies as compensa on for the damage; however, the subsidies have not been paid yet. Addi onal income is earned by providing machinery services. The farmer was not able to specify the amount of income because his service provision considerably varies during the years. Generally, it is about BAM 5,000 of the income earned in this way.
146
Factors of successThe farmer gave several key factors for the success of his farm in the corn produc on: Persistence, work and courage in terms of taking risks Experience and knowledge Possession of appropriate machinery Ren ng land Membership in an associa on of farmers
Lessons learned for policy measuresA major problem faced by the farmers engaged in corn produc on is uncertainty of subsidized or minimum selling prices before sowing. Therefore, there are o en protests and blockades of border crossings and major roads as farmers’ response to the prices off ered by relevant ins tu ons. The protests and road blocks are also planned for this year.The next problem is the lack of storage capaci es and the need to sell a considerable amount of produced goods immediately a er the harvest, when the prices are the lowest.Ren ng parcels is a complicated and large investment because of land fragmenta on and the need to make separate notary contracts with each owner. This is why the ren ng of several hectares o en results in several dozen individual notary contracts.The posi on of the farmers in the Federa on of BiH is unfavourable and not equal with the farmers in the Republic of Srpska and the region (Croa a and Serbia) because of lack of benefi ts (cash grants) concerning subsidized fuel (“blue diesel”) or mineral fer lizers. On the other hand, there is CEFTA and the trade without customs du es. The farmers are li le acquainted with the standards of both the produc on and storage, that is, keeping the products. This results from the current requirements of the local market that absorbs almost all produc on.
147
Case Study reference number: FBIH – AC3Type of en ty: FarmerHuman resources: 6 family members Economic ac vi es: Produc on of arable crops (wheat, corn) Other ac vi es: noneTurnover: 2009: BAM 130,310 2010: BAM 175,300
HistoryProduc on at the farm began in 1970 with an area of 7.5 ha, with two crops that are grown: wheat and maize. Besides, there used to be a farm building structure for keeping ca le, where 7–8 fa ening older bulls were kept. In 1972, the fi rst machinery for llage was purchased along with needed implements, and in 1978 the fi rst combine was bought. In later years produc on went on regularly within the exis ng capaci es, with regular replacement of out-dated machinery. That prac ce had con nued un l the beginning of the war in 1992, when the owner and his household members le the property and went abroad. A er the war, in 1996, he returned to his farm only to fi nd fully devastated agricultural buildings, machinery and also the family house. It took a great eff ort to renew produc on that year. Owing to the credit funds from the Federa on Ministry of Agriculture, Water Management and Forestry, a tractor with needed implements and a combine were bought. The produc on resumed on the men oned 7.5 ha of own land. As early as 1997 produc on expanded to 20 ha, that is, to the land of the neighbours and acquaintances who did not return but they permi ed the farmer to use their available land in order not to leave the land uncul vated and deserted. A er 1997, the cul vated area has been gradually increased by ren ng addi onal land up to today’s 85 ha.
Current situa onThe farmer has 85 ha of agricultural land in use (7.5 ha of own land and 82.5 ha of rented land, mostly owned by individuals), which is not irrigated and with the following corn crops cul vated in this ra o (year 2010): wheat 45 ha, maize 40 ha. The produc on structure that approximates 50:50 percent is maintained every year, with either crop in slightly higher percentage respec vely every year in order to keep the rule of crops rota on.Produc on of main cereals by years in hectares
The farmer has needed machinery (tractors and implements), which is enough to cul vate all the land, and a combine used for harves ng on all 85 ha, but he also rents the combine to other producers for 200 BAM/ha. The farmer’s storage capaci es of 12 tonnes are modest and mostly used to keep corn for own needs (of total produc on, the farmer sets aside 10-15 tonnes of corn for own needs each year). Because of such small storage capaci es, the remaining yield is immediately transported a er harvest (own transport) to a regular buyer, who permits the farmer to store the yield for a while (un l 1 August) with the right to take over his yield if there is a chance to get a be er price. A er 1 August, the farmer can either sell the produced quan es to the buyer at off ered prices or con nue to store his products for 30 BAM/tonne a month. Besides the corn produc on, the farmer keeps a lacta ng cow, 26 pigs and about 50 head of various poultry.
Farm managementThe farmer has been tradi onally engaged in the produc on of arable crops, growing them in a conven onal way and consistently applying all needed agricultural machinery. The farmer pays par cular a en on to the seed material as a key factor for the total produc on level. He also follows the appearance of new varie es and hybrids on the market, and also the innova ons in machinery and the technology concerning the produc on of the two crops. Besides the land sown with already known varie es and hybrids that have been proven during the years of produc on, the farmer also has experimental parcels where he tests growing of new varie es and hybrids, their produc vity, resistance to diseases and adaptability to the clima c and soil condi ons of the area. Harves ng is done when the cereals become technologically mature, so there is a considerable risk of excessive humidity of the grains in case of precipita on during the harvest.Being a large producer, the farmer is already in the VAT system that brings him certain benefi ts in terms of tax exemp ons in the purchase of some expendable material.
148
InvestmentsThe following farmer’s investments in fi xed assets in the last 10 years should be singled out: Construc on of a building for pigs in 2001 for BAM 12,000 Tractor for BAM 22,000, bought in 2004 Tractor for BAM 15,100 in 2006 Tractor for BAM 64,000 in 2009 In 2011, a tractor was bought for BAM 40,000 (used six years before purchase) Tractor implements bought in the last four years for a total sum of BAM 16,400
It needs to be noted that all fi xed assets have been bought with own funds and without any credit debts.Although it may be concluded that the farmer lacks storage capaci es, he does not plan any investments in that type of building because he believes that he can conduct business quite sa sfactorily under the circumstances. Also, because of more recent purchase of machinery, he does not plan to purchase more of it in the near future.
MarketThe largest part of corn produc on (with such storage capaci es, usually 10–15 tonnes of corn is kept as animal feed for own needs) is sold to already known buyers immediately a er the harvest. The sale is not based on any signed contract but it takes place solely on the basis of previous posi ve experiences. The producer points out that he can always ensure the placement of his goods and that no problems arise in the collec on of payments from the regular buyers. Unfortunately, a major problem in the Federa on of BiH is the failure of relevant ins tu ons (Federa on and cantonal ministries of agriculture) to provide informa on concerning the an cipated purchase prices and the amount of incen ves before sowing, so the producers always take some risk in the corn produc on.
Produc on and marke ng standardsProduc on of arable crops is exclusively conven onal. The farmer needs not cer fy the produc on because it is not a market requirement, and so he does not apply any standard in the corn produc on. The corn is sold in bulk, with the farmer’s own transport to the buyer. The quality and the humidity of the sold corn are prescribed.
Economic performanceThe producer was not able to present variable costs by individual arable crops. It should be pointed out that the average yields for all crops are excep onal, with the following ranges: wheat 4–4.5 tonnes/ha; maize (grain) 7.58.5 tonnes/ha. In 2009 and 2010 the farmer received some fi nancial incen ves: 0.12 BAM/kg for wheat (0.10 BAM/kg – at the level of the Federa on of BiH, and 0.02 BAM/kg – the Posavina Canton). There were no incen ves for the maize produc on.
Addi onal income from providing service of ren ng the combine: 100 ha X 200 BAM/ha = 20,000 BAM The costs of fuel, lubricants and amor za on should be deducted from the above sum.
149
Factors of successThe farmer gave several key factors for the success of his farm in the corn produc on: Use of quality seed material, Mee ng of agricultural deadlines and consistent applica on of agricultural machinery Full engagement of all family members in the produc on, with needed enthusiasm and belief in success Long tradi on of working in agriculture and a large experience Regular educa on in new technologies, varie es and hybrids (a ending seminars and adop ng innova ons) Timely learning of informa on from the market
Lessons learned for policy measuresA major problem faced by farmers engaged in corn produc on is uncertainty of subsidized or minimum selling prices before sowing. It needs to be noted that the farmers very o en do not know the selling price of cereals even when they deliver them over for sale. The price is determined later, so the producers o en fi nd themselves in such a situa on that they do not know whether they can cover their produc on costs un l the me of payment.The posi on of the farmers in the Federa on of BiH is unfavourable and not equal with the farmers in the Republic of Srpska and the region (Croa a and Serbia) because of lack of benefi ts (cash grants) concerning subsidized fuel (“blue diesel”) or mineral fer lizers. On the other hand, there is CEFTA and the trade without customs du es. The farmers are li le acquainted with the standards of both the produc on and storage, that is, keeping the products. This results from the current requirements of local market that absorbs almost all produc on.
150
Case Study reference number: FBIH – AC4Type of en ty: FarmerHuman resources: 5 family members and 1 seasonal workerEconomic ac vi es: Produc on of arable crops (wheat, maize, and soya) Other ac vi es: noneTurnover: 2009: BAM 49,825 2010: BAM 46,025
HistoryThe farmer began working in agriculture in 2000, on an area of 4.0 hectares, 2 hectares of which are his own land, and the remaining 2 ha are rented. As early as in 2001 he bought the fi rst combine harvester, which made the produc on more signifi cant. In 2002, the produc on was expanded to 10 ha of land and ever since the area has gradually been increased to today’s 23 ha of agricultural land in use.
Current situa onThe farmer has 23 ha of agricultural land in use (3 ha of own land and 20 ha of rented land), which is not irrigated and with the following corn crops cul vated in this ra o (year 2010): wheat 12 ha, maize 2 ha, and soya 8 ha. The approximate ra o of the produc on structure is maintained every year, with the propor onal increase of land under individual crops according to the increase of the farm. The table below shows that the two most important cereals in the produc on at the farm are wheat and maize.
Produc on of main cereals by years in hectares
Cereal 2011 2010 2009 2008 2007 2006 2005
Wheat 8 12 10 11 13 10 9
Maize 3 2 2 3 2 1 3
The farmer has needed machinery (tractors and implements), which is enough to cul vate all the land, and two combines used for harvest on available 23 ha, but he also rents the combines to other producers for 200 BAM/ha. The farmer does not have storage capaci es, so of the total corn produc on he keeps only 2–3 tonnes for own needs and stores it in paper bags. Because of lack of storage capaci es, the yield is immediately transported (own transport) to a regular buyer. This farmer makes most of his business with the coopera ve “Oranica” d.o.o. [ltd.], Samac-Domaljevac, with quite successful coopera on thus far.In 2011, a contract was signed with the Federa on Directorate for Goods Reserves, under which the Directorate provides the farmer with needed quan es of fuel and fer lizers, while in turn the farmer delivers goods in the value of received input. There is a problem of undetermined selling prices, so the farmer does not know how many goods he should deliver to the Directorate.Besides agricultural produc on, the farmer keeps 5 pigs and about 20 various head of poultry.
Farm managementThe farmer has been tradi onally engaged in the produc on of arable crops, growing them in a conven onal way and consistently applying all needed agricultural machinery. The farmer pays par cular a en on to the seed material as a key factor for the total produc on level. He also follows the appearance of new varie es and hybrids on the market, and also the innova ons in machinery and technology concerning the produc on of the two crops. Harves ng is undertaken when the cereals become technologically mature, so there is a considerable risk of excessive humidity of the grains in case of precipita on during the harvest.Unfortunately, like most of the BiH farmers, this interviewed farmer does not keep his own accoun ng and bookkeeping records that may show important produc on and economic performance parameters, so this report includes only the informa on about the produc on volume and the prices of sold products from 2009 and 2010.
151
InvestmentsThe following farmer’s investments in fi xed assets in the last 10 years should be singled out: Purchase of a used combine for BAM 12,000 in 2001 Rotary cul vator for BAM 5,000 in 2002 Combine (used) for BAM 16,000 in 2006 Tractor (used) for BAM 18,000 in 2008 0.8 ha of land was purchased for BAM 8,000 in 2008
It should be noted that all fi xed assets have been bought with own funds and without any credit debts.As for future investments, new combines should replace the out-dated ones, and the new machinery, with needed implements, should be bought. The new machinery would make the land cul va on quicker and more effi cient and also be rented to other producers at a certain price.
MarketAlmost all corn produc on (about 3 tonnes of corn is kept for own needs) is sold to already known buyers immediately a er the harvest. The sale is not based on any signed contract (except in 2011 when the contract was signed with the Federa on Directorate for Goods Reserves) but it takes place solely on the basis of previous posi ve experiences. Unfortunately, a major problem in the Federa on of BiH is the failure of relevant ins tu ons (Federa on and cantonal ministries of agriculture) to provide informa on concerning the an cipated purchase prices and the amount of incen ves before sowing, so the producers always take some risk in the corn produc on.
Produc on and marke ng standardsProduc on of arable crops is exclusively conven onal. The farmer needs not cer fy the produc on because it is not a market requirement, and so he does not apply any standard in the corn produc on. The corn is sold in bulk, with the farmer’s own transport to the buyer. The quality and the humidity of the sold corn are prescribed.
Economic performanceThe producer was not able to present variable costs by individual arable crops. It should be pointed out that the average yields for all crops are excep onal, approximately amoun ng to: wheat 4.5 tonnes/ha; maize (kernel) 8 tonnes/ha, and soya 3 tonnes/ha. In 2009 and 2010 the farmer received some fi nancial incen ves: 0.12 BAM/kg for wheat (0.10 BAM/kg – at the level of the Federa on of BiH, and 0.02 BAM/kg – the Posavina Canton) and 600 BAM/ha for soya. There were no incen ves for the maize produc on.
Wheat Maize Soya
2009 2010 2009 2010 2009 2010
Area (ha) 10 12 2 2 12 8
Average yield (tonnes/ha) 4.50 4.17 7.75 8.75 2.92 3.13
Total value 18,450 21,500 3,875 4,725 27,500 19,800
Total value/ha 1,845 1,792 1,938 2,363 2,292 2,475
Addi onal income from providing service of ren ng the combines: 20 ha x 200 BAM/ha = 4,000 BAM
The costs of fuel, lubricants and amor za on should be deducted from the above sum.
152
Factors of successThe farmer gave several key factors for the success of his farm in the corn produc on: Use of quality seed material Mee ng of agricultural deadlines and consistent applica on of agricultural machinery Full engagement of all family members in the produc on, with needed enthusiasm and belief in success Regular educa on in new technologies, varie es and hybrids (a ending seminars and adop ng innova ons) Membership in an associa on of agricultural producers, where the farmer is mely provided with key informa on about the market
Lessons learned for policy measuresA major problem faced by the farmers engaged in corn produc on is uncertainty of subsidized or minimum selling prices before sowing. It needs to be noted that the farmers very o en do not know selling price of cereals even when they deliver them over for sale. The price is determined later, so the producers o en fi nd themselves in such a situa on that they do not know whether they can cover their produc on costs un l the me of payment.The posi on of farmers in the Federa on of BiH is unfavourable and not equal with the farmers in the Republic of Srpska and the region (Croa a and Serbia) because of lack of benefi ts (cash grants) concerning subsidized fuel (“blue diesel”) or mineral fer lizers. On the other hand, there is CEFTA and the trade without customs du es. Farmers are li le acquainted with the standards of both produc on and storage, that is, keeping the products. This results from the current requirements of the local market that absorbs almost all produc on.
153
Case Study reference number: FBIH – AC5Type of en ty: FarmerHuman resources: 4 family members Economic ac vi es: Produc on of arable crops (wheat, maize, soya and barley) and fa ening pigs (3) of output weight up to 120 kg Other ac vi es: noneTurnover: 2009: BAM 37,842 2010: BAM 46.300
HistorySince his youth, the farm owner has been engaged in the arable crop produc on and the fa ening of a smaller number of pigs for family needs. This is a family farm where the owner’s father was also engaged in agricultural produc on (since 1976).
Current situa onIn the currently available area of 31 hectares (4 ha of own land, and 27 ha of rented land), which is not irrigated, the farmer grows cereals and soya in the following ra o (year 2011): wheat 10 ha, barley 5 ha, maize 8 ha, and soya 8 ha. He applies crop rota on.Produc on of main cereals by years in ha
The farmer has all needed machinery (combine, tractors and relevant implements, and trailers), which is enough to cul vate all the land. He has maize and wheat baskets whose total capacity is 20,000 kg, and improved smallcapacity storage buildings (sheds). Most of the yield is sold immediately a er the harvest, while the smaller part is stored. One part of corn and soya products is sold to an already known buyer, “Agroobeda Vidovice”, with successful coopera on thus far. Another part goes to the Directorate for Goods Reserves, while the third part is sold to smaller buyers upon agreement. The farmer transports the goods to the buyers.A smaller part of the produc on, about one tonne, is used for family needs and for the fa ening of three pigs.
Farm managementThe farmer has been tradi onally engaged in the produc on of arable crops, growing them in a conven onal way and applying all needed agricultural machinery. The structure of sowing has been almost the same over the last several years. The farmer pays par cular a en on to the seed material as a key factor for the total produc on level. Harves ng is done when the cereals become technologically mature, so there is some risk of excessive humidity of the grains in case of precipita on during the harvest.The farmer has a registered business, but he is not in the VAT system. He receives fi nancial incen ves from the FBiH authori es: wheat (0.12 BAM/kg), and soya (600 BAM/ha).
InvestmentsThe farmer has three garage buildings for the combine, tractors, implements and other equipment, as follows: garage 10 x 6 m, paid EUR 4,000, for combine; garage 8 x 6 m, paid EUR 3,000, for tractor; garage 5 x 4 m, paid EUR 2,000, for a smaller tractor. A total value of baskets and sheds used as temporary storage space is about EUR 1,500.The farmer has complete machinery: combine (EUR 25,000), tractor (EUR 10,000), smaller tractor (EUR 6,000), picker (EUR 18,000), grain/maize drills (EUR 3,000), soya drills (EUR 2.000), 2 combina on seed harrows (EUR 175), 2 llers (EUR 450), 3 ploughs (EUR 400), and a sprinkler (EUR 600).In the next period the farmer plans to buy a combine harvester, and a high-power tractor, including implements, and also to buy or rent new land for the purpose of produc on.
154
MarketMost of the yield is sold immediately a er the harvest to the known buyers, “Agroobeda Vidovice” and the Directorate for Goods Reserves. On average, 1 tonne of corn and soya is kept for own needs. The sale is based on the signed contract. The payment is in cash, at most up to 30 days a er the delivery. A major problem in the Federa on of BiH is the failure of relevant ins tu ons (Federa on and cantonal ministries of agriculture) to provide informa on concerning the an cipated purchase prices and the amount of incen ves before sowing, so the producers always take some risk in the corn produc on. This interviewed farmer claims that he would give up fi nancial incen ves if he knew the selling price for his products in advance.
Produc on and marke ng standardsProduc on of arable crops is exclusively conven onal. The farmer needs not cer fy the produc on because it is not a market requirement, and so he does not apply any standard in the corn produc on. The corn is sold in bulk, with the farmer’s own transport to the buyer. The quality and the humidity of the sold corn are prescribed.
Economic performanceThe producer was able to present variable costs by individual arable crops. It should be pointed out that the average yields are rela vely good, with the following ranges: wheat 3.5–4 tonnes/ha, maize (kernel) 7.0–8.0 t/ha, barley 5.0–5.5 t/ha, and soya about 2.2–3 t/ha. In 2009 and 2010 the farmer received some fi nancial incen ves, as follows: wheat 0.12 BAM/kg, and soya 600 BAM/ha. There were no incen ves for the maize produc on, and the farmer has not applied for the fi nancial incen ves for the barley produc on.
Factors of successAs for the success of his farm, the farmer has pointed out the necessary use of quality seed material, mee ng of deadlines for sowing, applica on of agricultural technology measures, possession of appropriate machinery, and fi nally, permanent engagement of the owner and his family both in the produc on and the product placement.
155
Lessons learned for policy measures
A major problem faced by the farmers engaged in corn produc on is uncertainty of subsidized or minimum selling prices before sowing. Therefore, out of despair, the farmers o en resort to blockades of border crossings and major roads as a response to the prices off ered by relevant ins tu ons. The next problem is the lack of storage capaci es and the need to sell a considerable amount of produced goods immediately a er the harvest, when the prices are the lowest.The posi on of the farmers in the Federa on of BiH is unfavourable and not equal to the farmers in the Republic of Srpska and the region (Croa a and Serbia) because of lack of benefi ts (cash grants) concerning subsidized fuel or mineral fer lizers. The farmers are li le acquainted with the standards of both the produc on and storage, that is, keeping the products. This results from the current requirements of the local market that absorbs almost all produc on.
156
Case Study reference number: FBIH–AC6Type of en ty: FarmerHuman resources: 5 family members staff Economic ac vi es: Produc on of arable crops (wheat, corn and oats), milk produc on, fa ening steers and machinery (tractor) services Other ac vi es: noneTurnover: 2009: 21,650 BAM 2010: 22,412 BAM
HistoryUn l the 1991 war, the father of the farm owner who inherited the farm had been engaged exclusively in fa ening of bullocks and heifers, with annual produc on between 180 and 200 head, while the produc on of animal feed and corn was intended only for the ca le fa ening. A modern building, the size of which is 27 x 14 m and with a grid fl oor, was constructed for this produc on. By the way, this is a tradi onal family farm where the owner’s grandfather and father were engaged in agricultural and ca le produc on only. The farmer con nued breeding the ca le a er the war (10–15 head) because of milk produc on and the fa ening of bullocks and heifers, but the ca le produc on kept decreasing over the last years because of poor market condi ons and problems with fi nancial incen ves for corn produc on, so in 2010 the farmer kept only 2 lacta ng cows and 2 heifers, and produced forage (clover-grass mixtures) and crops (wheat, maize and oats) on 6.3 ha of land.
Current situa onThe farmer has 2 ha of own land and 4.3 ha of rented arable land. In 2010, the structure of the sown areas was the following: wheat 0.9 ha; oats 2.0 ha; maize 1.9 ha, and clover-grass mixtures 1.5 ha. In 2009, the structure of sown crops was similar but somewhat modifi ed because of crops rota on (1.9 ha of wheat; 1 ha of oats; and 1.9 ha of maize). As for ca le produc on, the farmer kept two cows and produced 750–1,250 L of milk monthly, selling it to individuals in his local community. Produc on of milk was somewhat higher in 2009 (4 lacta ng cows), with the sale of milk to the dairy Imer from Gradacac. In 2009 and 2010, the farmer had two more fa ening bullocks/heifers. The farmer has reduced crop produc on even more in 2011 (total of 1.45 ha – wheat 0.15 ha; maize 0.30 ha, and oats on 1 ha of land), but he has started producing soya on 4 ha. The reason for this change is because of low, unknown and uncertain crop prices basically un l the harvest itself. On the other hand, there is a problem with receiving fi nancial incen ves because in order to verify the exis ng produc on (and thereby the right to incen ves), it is necessary, among other things, to have a land rental agreement, which is almost impossible because of unresolved property rights among the families who lease the land. Produc on of main cereals by years in ha:
Cereal 2011 2010 2009 2008 2007 2006 2005
Wheat 0.15 0.9 1.9 3.1 3.8 3.8 3.8
Maize 0.30 1.9 1.9 3.0 3.5 4.0 4.0
Oat 1.0 2.0 1.0 1.5 1.8 1.8 2.0
The farmer has a tractor and implements (only plow and trailer), which is suffi cient only for par al cul va on of the land he uses, so besides paying for the services of ren ng a combine (200 BAM/ha) during the crop harvest, he also pays for the service of sowing and land cul va on with disk harrows and rakes (150–200 BAM/ha). A source of income for the farmer is leasing own machinery to other farmers, so he cul vates 20 ha annually and earns BAM 4,000 (200 BAM/ha). The farmer has baskets for the storage of maize, and fl oor storage capacity of ca 25 tonnes. He keeps one part of the produc on to feed the ca le, while the rest (wheat) is sold at the market, most o en to the Federa on Directorate for Goods Reserves and to the mill Majic from Odzak.
157
Farm managementThe farmer has been tradi onally engaged in the produc on of arable crops, growing them in a conven onal way and consistently applying all needed agricultural machinery. As men oned earlier, the structure of sown arable crops is o en changed and depends on two groups of factors: the fi rst group concerns the posi on of ca le fa ening and produc on because of the farmer’s tradi on of this produc on, while the second group concerns the status of crops and their selling prices. The farmer pointed out that he pays par cular a en on to the seed material as a key factor for the total produc on level. Concerning the wheat produc on, the farmer uses the varie es Žitarka, Super žitarka, and Pobjeda, while in the maize produc on he relies on the KWS hybrids (Klimt variety, 20 kernels in a row), and the hybrid NS 640. Harves ng is done when the cereals become technologically mature, so there is a considerable risk of excessive moisture of the grains in case of precipita on during the harvest. In 2010, the wheat had the following quality proper es: 74 percent of hectolitre weight, 15 percent moisture of grain, and 3 percent of foreign ma er.As for the milk produc on, in 2010 the farmer produced 750–1,250 litres on average monthly (about 12,000 litres annually), and fa ened two heifers whose output weight was 420 kg.Unfortunately, like most of the BiH farmers, this interviewed farmer does not keep his own accoun ng and bookkeeping records that may show important produc on and economic performance parameters, so this report includes only the informa on about the produc on volume and the prices of sold products from 2009 and 2010. The farmer has s ll not registered his business (it was not required for receiving incen ves un l 2010). He is a member of the Farmers Associa on “Zito” (Corn) from Odzak, and the Farmers Union of the Posavina Canton.
InvestmentsThe farmer has two pre-war constructed buildings: a storage building, 5 x 4 m, with 25 tonnes of capacity, and a stable, 27 x 14 m, quite devastated during the war. A smaller part of the stable is redesigned (boxes for keeping bullocks/heifers) with the farmer’s own funds. In addi on, a tractor with a trailer and a plough should be singled out from the farmer’s investments in fi xed assets in the last fi ve years. The tractor was imported from Switzerland and cost EURO 15,000, including the men oned implements. This investment came from credit funds. In the next period the farmer plans to renovate the exis ng stable completely and to buy other implements he does not have: disk harrow, rake, ller, planter, sprinkler – atomizer, drill, and mower. The main investment priority is purchase of these needed implements.
MarketThe farmer retains the largest part of corn produc on because of his ca le (2 lacta ng cows and 2 fa ening bullocks/heifers, while he sells the rest – wheat fi rst of all – to the Federa on Directorate for Goods Reserves and the mill Majic from Odzak, where the corn is stored. The sale is made immediately a er the harvest and is not based on any signed contract but it takes place solely on the basis of previous posi ve experiences. The payment is in cash, at most up to 50 days a er delivery. Unfortunately, a major problem in the Federa on of BiH is the failure of relevant ins tu ons (Federa on and cantonal ministries of agriculture) to provide informa on concerning the an cipated purchase prices and the amount of incen ves before sowing, so the producers always take some risk in the corn produc on. The farmer par cularly pointed out this problem as a major reason for reducing areas sown with arable crops year a er year.
Produc on and marke ng standardsProduc on of arable crops is exclusively conven onal. The farmer needs not cer fy the produc on because it is not a market requirement, and so he does not apply any usual standard in the corn produc on. The corn is sold in bulk, with the farmer’s own transport to the buyer (mill Majic). The quality and the moisture of the sold corn are prescribed.
158
Economic performanceThis producer was not able to present variable costs by individual arable crops. It should be pointed out that the average yields for all cul vated crops are quite good, with the following ranges: wheat 3.5–4 tonnes/ha, maize (kernel) 7.0–7.5 t/ha, and oats 2.5–3.0 t/ha. In 2009 and 2010 the farmer received some fi nancial incen ves: 0.12 BAM/kg for wheat (0.10 BAM/kg – at the level of the Federa on of BiH, and 0.02 BAM/kg – the Posavina Canton). There were no incen ves for the maize produc on, and the farmer did not apply for incen ves for oat produc on.
Wheat Maize Oats
2009 2010 2009 2010 2009 2010
Surface (ha) 1.9 0.9 1.9 1.9 1.0 2.0
Average yield (tonnes/ha) 3.75 3.95 7.15 7.40 2.65 2.85
Produc on volume (tonnes) 7.125 3.555 13.585 14.06 2.65 5.70
Output value – BAM 2,138 1,138 3,396 4,218 928 2,280
Output value/ha 1,125 1,264 1,787 2,173 928 1,140
Subsidies – BAM 855 427 - - - -
Total value 2,993 1,565 3,396 4,218 928 2,280
Total value/ha 1,575 1,739 1,787 2,173 928 1,140
Other income: 2 bullocks/heifers x 400 kg x 3.95 BAM= 3,160 BAM 12,000 litres of milk x 0.85 BAM/litre = 10,200 BAM Leasing machinery: 20 ha x 200 BAM/ha = 4,000 BAM (The costs of fuel, lubricants and amor za on should be deducted from this sum.)
Factors of successThe farmer pointed out three key factors for the success of his farm in corn produc on: Use of quality seed material Mee ng agricultural deadlines and consistent applica on of agricultural machinery Full engagement of all family members in the produc on, with needed enthusiasm and belief in success
Lessons learned for policy measuresA major problem faced by the farmers engaged in corn produc on is uncertainty of subsidized or minimum selling prices before sowing. The farmer par cularly pointed out an administra ve problem regarding receiving fi nancial incen ves because in order to verify the exis ng produc on (and thereby the right to incen ves), it is necessary, among other things, to have a land rental agreement, which is almost impossible because of unresolved property rights among the families who lease the land. The next problem is the lack of storage capaci es and the need to sell a considerable amount of produced goods immediately a er the harvest, when the prices are the lowest.The farmers are li le acquainted with the standards of both the produc on and storage that is, keeping the products. This results from the current requirements of the local market that absorbs almost all produc on.
159
Case Study reference number: FBIH – AC7Type of en ty: FarmerHuman resources: 2 family members staff Economic ac vi es: Produc on of arable crops (wheat, corn) and livestock produc on Other ac vi es: noneTurnover: 2009: 3,602 BAM 2010: 3,624 BAM
HistoryFarmer has been involved with agriculture since the end of the war in 1996 cul va ng his own property of approximately 3 ha. On the greatest part of this land (2.3–2.8 ha) the farmer produces wheat and maize, and the remaining surfaces are used for vegetable produc on, but only for household needs. Wheat and maize are mainly produced in order to ensure animal food for fa ening of 4–5 steers, which is the annual farm produc on. The farmer purchased tractor and accessories in 1996 when he started to deal with agricultural produc on. The machinery was second-hand and has not been replaced since then.
Current situa onThe farmer owns 5.8 ha of land out of which he cul vates 3 ha. Only one ha of land is irrigated. The largest part of this land is used for cereals produc on, wheat and maize (grain) in the ra o 60:40 percent up to 70:30 percent in favour of wheat every year. In 2010 the sowing structure was 1.8 ha of wheat and 0.6 ha of maize. The produc on structure is similar every year but crop rota on is prac ced as much as the produc on structure allows. Produc on of cereals in ha by years:
The farmer possesses a tractor and accessories so that he can cul vate his land completely up to harvest. Then he rents a combine harvester and pays 200 BAM/ha for this service. The farmer has modest storage capaci es of approximately 5 tonnes and it is used to store cereals for his own needs (every year the farmer maintains the whole maize produc on and 2 tonnes of wheat). The rest of the wheat produc on is transported to the buyer – mill “Nežići” – right a er harves ng (by the farmer), unless addi onal drying is necessary. In addi on, the farmer at the moment has one cow, one bull and 50 diff erent poultry.
Firm managementThe farmer tradi onally deals with arable crops produc on in a conven onal manner with consecu ve applica on of all the necessary agro-techniques. But, the lack of informa on about new varie es and hybrids can easily be no ced, as well as innova ons in techniques and technologies of produc on for these two crops. Produc on is based on the use of tradi onal varie es characterized by lower quality and biological poten al rather than new ones, and therefore the farmer achieves lower yield per land unit. Cereals are harvested a er becoming technologically matured, so, there is a high risk of over-moisture of the grain in the case of precipita on during the harves ng.
InvestmentsBeing a small producer, this farmer had no investments in capital assets over the past fi ve years. The last investment was the only one, in 1966 when the farmer purchased tractors with necessary accessories. With regard to future investments, the farmer plans to orient himself to more serious steer fa ening (1520 steers annually with a selling weight of 400–500 kg) and for this purpose he will need fi nances for building facili es for livestock as well as for expanding storage facili es for cereals.In addi on, the farmer intend to purchase a small digger for channel digging in order to make water supply channels for his plots, and exis ng water accumula ons in the vicinity of the farm would serve as a water source for the purpose of stabile and intensive irriga on of the land. On the other hand such a machine could also serve as the source of addi onal income as it could be used to off er services to other farmers.
160
MarketThe en re produc on of maize and 2 tonnes of wheat are kept on the farm for the farmer’s own needs (livestock and poultry feeding) and 5–6 tonnes of wheat are sold to a familiar buyer– mill “Nežići”. The sale is not based on a contract (except in 2011) but exclusively on the basis of good previous experiences. Because the produc on volume intended for sale is rela vely small the farmer claims he can always ensure placement in the market for it and that he has no problems with ge ng paid as far as familiar buyers are concerned. The natural character of the sale and payment is interes ng. Namely, for the wheat delivered to mill “Nežići” the farmer does not get money but fl our. The exchange is done on the basis of ra o – 70 kg of fl our for 100 kg of wheat grain. Very rarely the farmer gets some share in the form of money.
Produc on and marke ng standardsArable crop produc on is exclusively conven onal. There is no need for farmers to get cer fi ed, as the market does not require it, so none of the standards common in arable crop produc on is applied. Wheat is sold unpacked by way of the farmer transpor ng it to the buyer by his own transport means. Wheat is sold on the basis of obeying criteria on wheat quality and moisture content.
Economic performanceThe farmer was not able to give data on variable costs by crops. The average achieved yields are rather good for wheat and slightly less good for maize and it varies 3–3.5 tonnes/ha for wheat and maize (grain) 5.0–5.5 t/ha. The farmer received no subsidies.
Wheat Maize
2009 2010 2009 2010
Surface (ha) 2.0 1.8 0.6 0.6
Average yield (tonne/ha) 3.45 3.39 4.7 5.3
Produc on volume (tonne) 6.9 6.1 2.8 3.2
Output value – BAM 2,622 2,440 980 1,184
Output value/ha 1,311 1,356 1,633 1,973
Subsidies – BAM - - - -
Total value 2,622 2,440 980 1,184
Total value/ha 1,311 1,356 1,633 1,973
Addi onal income: Milk: 1 cow x 3,200 litres x 0.84 BAM/kg = 2,688 BAM Meat: 1 calf = 135 kg x 6.20 BAM /kg = 837 BAM Meat: 1 bull = 450 kg x 3.75 BAM /kg = 1,688 BAM
Factors of successThe farmer pointed to the following as crucial factors for the success of his farm in cereals produc on: Obedience of agro-terms and use of agro-techniques, Hard work Experience acquired over me dealing with agriculture
Lessons learned for policy measuresOne of the greatest problems faced by cereals producers is price uncertainty; a protected or minimum purchase price is unknown before seeding. Very o en farmers do not know the price even at delivery me. The price is determined a erwards so the farmers o en do not know if they managed to cover produc on costs before they get paid.
161
Case Study reference number: FBIH – AC8Type of en ty: FarmerHuman resources: 6 family members staff Economic ac vi es: Produc on of arable crops (wheat, corn and soya) and livestock produc on Other ac vi es: noneTurnover: 2009: 34,879 2010: 31,034 BAM
HistoryThe farm has a tradi on in produc on ever since World War II. It was established by the father of the actual owner. He has been taking over the responsibili es for the farm gradually, so now he is the full leader of it. The beginning of agricultural produc on was based on the use of exclusively own land, the size of which was 5 ha. The size of the cul vated land has been increasing over me and currently it encompasses 20 ha. It can be said that over the last two decades the produc on structure has remained substan ally unchanged and produc on was taking place on the men oned 20 ha. The farmer possesses his own agricultural machinery for land cul va on. It is replaced a er the loss of its func onal value on a regular basis, but this replacement has slowed down slightly over the last years.
Current situa onThe farmer operates on 20 ha of agricultural land (5 ha owned, 15 ha rented) out of which only the 0.5 ha of land sown with vegetables is irrigated. The sowing structure in 2010 was: wheat 5 ha, maize 12 ha, soybean 2.5 ha and 0.5 ha vegetables for household needs. Such a structure is kept almost always, including crop rota on prac ce. As shown in the Table below two of the most important cereal crops are wheat and maize.
Cereal 2011 2010 2009 2008 2007 2006 2005
Wheat 5.5 5.0 5.7 4.5 4.5 4.8 4.7
Maize 11.8 12.0 11.5 12.5 12.3 11.9 12.2The farmer possesses suffi cient agricultural machinery (a powerful tractor and accessories) to cul vate all his own and the rented land as well as a combine used exclusively to harvest 19.5 ha of land under cereals. The farmer’s storage capacity is 60 tonnes and it is used to store cereals for own needs. All maize and soya produc on is maintained on the farm for animal feeding, and the wheat is transported to the buyer immediately a er harves ng. In the past, the farmer had a rather successful coopera on with Coope ra ve “Ratar”. In the last two years the farmer cooperates mostly with the Mill “Majić” and in 2011 he sold his wheat to Federal Commodi es Stocks.In 2011 a contract with Federal Commodi es Stocks was signed. According to this contract, the farmer was provided with fuel and fer lizers in the needed quan es and the farmer delivered commodi es in a value equivalent to the value of these inputs. The problem is that the price has not been determined yet, so the farmer s ll does not know what quan ty they are supposed to deliver.In addi on the farmer has six milking cows, four calves, two heifers and ten bulls, so this farm is a mixed animal-plant farm and the arable crops produc on func ons to ensure the animal feed.
Firm managementThe farmer tradi onally deals with arable crops produc on in a conven onal manner with consecu ve applica on of all the necessary agro-techniques. The farmer pays special a en on to seed as one of the key factors of produc on volume. He follows new varie es and hybrids on the market, as well as innova ons in techniques and technologies of produc on for these two crops. The farmer uses wheat varie es: Novosadska S–rana, Novosadska S-40 and Marija, maize hybrids Novi Sad hybrid – group 500 and Osijek hybrid – 592 and 596. Hybrid Lucija is used for soybean produc on. Cereals are harvested a er becoming technologically matured, so, there is a remarkable risk of over-moisture of the grain in the case of precipita on during harves ng. Unfortunately, like most of the farmers in the country, the farmer does not prac ce farm accoun ng and bookkeeping that could be used as a basis to determine the indicators of produc on and economic performances. That is why this case study includes only data on volume of produc on and selling prices in 2009 and 2010.
162
InvestmentsOver the last decade the following investments in assets can be pointed out: Purchase of second-hand tractor in 2000 – 7,000 BAM Purchase of second-hand tractor in 2002 – 10,000 BAM Combine harvester (second-hand) in 2005 – 15,000 BAM
Priori es for future inves ng are; replacement of the old combine and acquisi on of new machinery with accessories. In addi on, investment in a modern facility for livestock is planned and the needed amount is es mated to be approximately 50,000 BAM.The farmer also pointed out the need to build a drier for grains but he does not plan this investment at the moment due to a lack of funds. The no on that the actual price of drying one tonne of maize grain is 200–300 BAM led the farmer to this conclusion.
MarketAll maize and soya produc on is maintained on the farm for animal feeding, and the wheat is sold right a er the harvest to a familiar buyer. The sale is not based on a contract (except in 2011) but exclusively on the basis of good previous experiences. Unfortunately, one of the main problems is the lack of informa on from authorized ins tu ons (Federal and Cantonal ministries of agriculture) about selling prices and support before sowing, so producers always take certain risks in cereals produc on.
Produc on and marke ng standardsArable crop produc on is exclusively conven onal. There is no need for farmers to get cer fi ed, as the market does not require it, so none of the standards common in arable crop produc on is applied. Wheat is sold unpacked and the farmer transports it to the buyer by his own transport means. Wheat is sold on the basis of obeying criteria on wheat quality and moisture content.
Economic performanceThe producer was not able to give data on variable costs by crops. Pre y good average yields were achieved in all crops produc on (except wheat in 2010 when the yield was poor and amounted only to 2.95 tonnes/ha). Average yields were approximately: wheat up to 4.5 tonnes/ha, maize (grain) 7–7.5 tonnes/ha, soybean 3 tonnes/ha. In 2009 and 2010 the farmer received support (on en ty and cantonal level) in the amount of 0.12 BAM/kg of wheat. Maize produc on was not supported and the farmer did not apply for subsidies for soybean produc on.
Other addi onal incomes (livestock produc on): 4 calves x 120 kg x 6.0 BAM= 2,880 BAM 8 steer x 400 kg x 3.65 BAM/kg = 11,680 BAM 6 cows x 3.500 litres of milk x 0.85 BAM/l= 17,850 BAM
163
Factors of successThe farmer pointed out the following as crucial factors for the success of his farm in cereals produc on: Good choice of seed and adequate protec on in proper me Obedience of agro-terms and use of agro-techniques, Existence of Coopera ve “Žitopromet” Regular educa on in new technologies, varie es, hybrids, (a ending seminars and applying acquired knowledge and innova on)
Lessons learned for policy measuresOne of the greatest problems faced by cereals producers is price uncertainty, a protected or minimum purchase price is unknown before seeding. Very o en farmers do not know the price even at delivery me. The price is determined a erwards so the farmers o en do not know if they managed to cover produc on costs before they get paid. Farmers are in an uneven (unfavourable) posi on in comparison to other en es and countries in the region (Croa a and Serbia) as they have no regress for blue diesel and fer lizers. On the other hand, there is the CEFTA agreement and no custom du es are in force.Farmers know almost nothing about standards in produc on and storage. Such a situa on is the result of a lack of such requirements on the domes c market that absorbs almost the whole produc on volume.
164
Case Study reference number: RS - 1Type of Producer: Substan al corporate producer Human Resources: 32 permanent employees Economic ac vity: Cereals (main ac vity) Other ac vi es: Provision of warehousing and storage of products
Background of the agricultural farm The agricultural farm is located in the Republic of Srpska Posavina. In the past, the farm was a state enterprise, which had about 1,800 ha of arable land. Currently it has 902 ha of arable land, while the rest of the land is situated on the territory of another en ty (FBiH). The division of the company followed the moment of priva za on of the state capital. Un l 2001, the company had the status of a state enterprise, and a erwards it was priva zed.
The present situa on and management of agricultural farmsThe farm has a total of 902 ha of total arable land. The company management believes that its current available land is not suffi cient, in view of future plans, and investments in the produc on of fa ening animals. Arable land is under concession, with a period of use of 15 years, and the amount of the concession fee is defi ned at 3 percent of total revenues generated annually. In the plan ng structure, the most common crops are wheat and corn, while the remainder are tri cale, oats and oilseed rape. The company, in order to improve its produc on, is currently in a program of reconstruc on, which includes reconstruc on of exis ng, and construc on of new irriga on systems, landscaping and reconstruc on of exis ng (2) and the construc on of new facili es of barns for 200 heads/barn and construc on of a mixer for feeders. It has its own machinery to carry out all farming measures, as well as warehouse space with a capacity of 10,000 tonnes and dryers to dry product.The farm is managed by one manager – the director, a professional engineer of agronomy. The farm is included in the VAT system and entered in the Register of farms under the MoA, which makes it eligible to receive government subsidies. The structure of employees, in addi on to the director, is as follows: in administra on there are 3 persons in charge of administra ve and accoun ng tasks, while the direct labour workers are engaged in the implementa on of produc on tasks. In terms of the organiza onal structure of the enterprise, it is a simple organiza onal structure, which on the one hand makes it easy to control all the ac vi es of the company, as well as quick and effi cient decision-making in line with market changes, but also there is a large commitment by the manager. The director, along with the produc on managers, makes real annual opera ng plans of sowing as well as reports on the completed harvest. Due to the form of the ins tu onal organiza on of the company, a joint stock company, an annual assembly of shareholders is organized, where the results/performance indicators of the company are presented.
Investments In the previous period, a er priva za on, and the se lement of debts to workers, the company has invested heavily in agricultural equipment, as follows: (1) Procurement of tractors; (5 tractors, of which 2 are second hand John Deere), total funding 301,000 BAM (2 ) Procurement of modern harvester of cereal grain, the overall fi nancing 332,911 BAM(3) Procurement of corn sowing machine, (2 seeding machines), total fi nancing 30,000 BAM (4) Purchase of a ploughs; (4 ploughs, 4–fold), total fi nancial assets 50,000 BAM (5) Procurement of sowing machine for wheat, (3 meter opera on), total fi nancial assets 18,000 BAM (6) Procurement of sprinklers (2 sprayers volume 600 litres), total fi nancial assets 7,000 BAM(7) Procurement of harrows; (2 harrows), total funding 3,000 BAM (8) Procurement of driller for channels for drain water from the depression; total funds 7,000 BAM and other machinery, manure spreaders, mineral fer lizer spreaders, spreaders for calcium (capacity 5 tonnes).The reconstruc on of the exis ng facili es for the farm machinery is ongoing, barn facili es for ca le fa ening (2 buildings), and the building area of 50 m2 to accommodate the chemicals. For the purposes of draining excess water, the drainage channels have been reconstructed, while 600 ha of arable land is within a hydromeliora on system.
165
MarketsMain products: wheat and corn, farm sells on the local market or to domes c processors and marketers. The most important buyer of wheat is the domes c milling industry (mills in the area of Bijeljina and Prnjavor). With known buyers, the company rarely makes a true contract of sale. Transport of goods is organized solely by the customer: mills and traders. Given that the company has silos for storage, sales are not realized immediately a er harvest, but the goods are stored awai ng a good price. The company receives the prices and the necessary informa on through the Stock Exchange informa on centres in Serbia and Hungary. Specifi cally, the company has signed quarterly contracts with stock exchanges for market informa on about prices. For services on price informa on, the company pays between 180–200 BAM quarterly to stock exchanges. Sales of rapeseed are based on previously signed contracts, and major customers are “Bimal” Brčko and the company PINUS PRO doo Samac, which buys it and exports to Slovenia, where oilseed is processed and biodiesel produced.
Produc on, product management and standardsProduc on of cereals is conven onal. On average for the period 2005–2011, wheat was produced on an area of 310 ha and 290 ha of corn. During the period of 2007–2011, the produc on of rapeseed has been organized on about 125 ha. Yields of wheat for this period on average ranged between 3.2 tonnes/ha (2010) to 4.2 tonnes/ha (2009). Low yields from 2010 are the result of the occurrence of heavy fl oods, which are very common at the me of heavy rainfalls in this area. The mul -year average of wheat yield per unit area (2005–2011) ranged around 3.7tonnes/ha. Mul -year average of corn yields for the period 2005–2010 ranged from 6.5 tonnes/ha.
Table 1. Average yields of wheat and maizeCROPS 2011 2010 2009 2008 2007 2006 2005 Average 2005–2011wheat t/ha 3.9 3.0 4.4 4 3.9 3.5 3.5 3.7maize t/ha96 5.5 7 6 7 6.7 6.7 6.5
The plan is to introduce quality standards into the company and obtain cer fi cates, which would inter alia facilitate the improvement of business, allow higher profi ts, crea ng a be er basis for further development and be er posi oning of the company in the market generally.
Economic performances of produc on Wheat Maize
2009 2010 2009 2010Area(ha) 318.3 319 309 362Size of produc on (tonnes) 1,400 957 2,163 1,991Subsidies 79,900 94,221Value of produc on 511,000 466,550.19 515,230.84 690,919.65Total value of produc on 590,900 560,771.19 515,230.84 690,919.65Variable costs 423,198.73 372,982.99 453,603.41 545,578.49GVA 167,701.3 187,788.19 61,627.43 145,341.16
The value of the variable costs for wheat in the period 2010 included reimbursement for NPK 15:15:15 and diesel fuel, and corn in the period 2009–2010. Due to natural disasters (fl oods) in 2010, procurement of fuel and fer lizer (90 tonnes and 117.25 tonnes of NPK 15:15:15, 90 tonnes of KAN (27 percent)) in the amount of 252,165.42 BAM has been wri en off by the relevant ministry.
Planned, and at the same me, the priority investment is to build a peripheral canal to protect against fl ooding, construc on of farms for fa ening beef ca le, which involves the construc on of new barn facili es, a feed mixer and procurement of input materials for ca le, then the reconstruc on of exis ng and construc on of new irriga on systems. Planned resources for the realiza on of this investment amounted to 1.8 million BAM, and source of fi nancing would be the commercial banks. One of the important investments from next year (2012) onward represents the reconstruc on of exis ng irriga on systems in the RS, which will be implemented with the help of the respec ve Ministry and fi nancially supported by the World Bank.
96 Note: Maize, mul -year yield is calculated for the period 2005–2010.
166
Success FactorsThe key success factors in the business enterprise are the capability of the company to perform current produc on out of its own funds, providing its own par cipa on in the fi nancing of long-term development programmes, as well as the availability of qualifi ed personnel for current and long-term development
In addi on to agricultural produc on, part of the company’s revenue is achieved through the provision of warehousing and storage to other customers. Total produc on of the company, on an annual basis (all crops) is between 4,000 and 5,000 tonnes. Due to the existence of a storage capacity of 10,000 tonnes, the company gives the rest of the free storage space to poten al users of services for storage and maintenance of a certain amount of products and on that basis it gets a certain income. With poten al users of services for storage and maintenance of a certain amount of products, the company signs a contract, which specifi es the amount of compensa on for certain services that poten al users are required to cover (for the receipt of goods 2 BAM/tonne, for storage 3 BAM/tonne per month, and for the exit of goods 2 BAM/tonne). On top of these services 17 percent is added in tax.
167
Case Study reference number: RS – 2Type of Producer: Large corporate producer Human Resources: 200 permanent employees, and seed produc on employs 150 workers at peak season Economic ac vity: Cereals (main ac vity) Other Ac vi es: Animal produc on (milk produc on and ca le fa ening, produc on of piglets and fa ening pigs)
Background of the agricultural farmThe agricultural farm is located in Semberija in the Republic of Srpska. The farm was established in 1946. Un l 1992, in terms of ins tu onal organiza on, the company had diff erent organiza onal forms. Since 2009, it has been opera ng as a joint stock company. Since its beginning the company has been directed toward crop and livestock produc on. Besides the mercan le, the company has dealt with seed produc on, and this ac vity con nues today in coopera on with the Ins tute of Field and Vegetable Crops, Novi Sad (NS seeds) and Zemun polje, Belgrade. In livestock produc on, the company was known as a Producer of breeding materials, or in its composi on, it had a reproduc on centre for the produc on of female breeding material (heifers and gilts). Un l 1992, the company owned 6,000 ha of arable land, and today has only 43 percent of the said total surface area. The rest of the area is divided by the concessionaire, the area of 50–100 ha, and one part of the land is rented to individuals by the state and municipality.
The present situa on and management of farms The agricultural farm today has a total of 2,550 ha of total arable land. In addi on, the farm in its composi on has 68 ha, which is the built-urbanized land i.e. the buildings. The total arable area (2,550 ha) is under the concession. The period of use of the land under concession is 15 years, with the right for an extension for 7.5 years with an extension of the concession agreement. The amount of concession fees un l 2010 amounted to 95 BAM/ha and from 2011 onward, 2.5 percent of total revenue. On the farm, mercan le and seed produc on of major crops were also developed. The structure of the sown areas under concession is as follows: 750 ha of wheat barley, 120 ha 225 ha of oilseed rape 750 ha of corn 300 ha of soybeans 250 ha of sugar beet 80 ha of alfalfa (Lucerne)
Within the farm there are two farms, of which one is dairy cows Simmental and Black – White (280 head). In milk produc on, a by-product (calves) are intended for breeding (males), and females for breeding. The second farm is a pig farm and it is intended for the produc on of piglets. Currently the farm has about 170 breeding sows. The equipping of the farm with machinery can be said to be good. Due to their own equipment, there is no need to use services for the applica on of specifi c agricultural measures. It does not have storage facili es – silos, but for storing they use an old fl oor warehouse in which they keep soya, sunfl ower, corn and barley. The capacity of the fl oor warehouse is about 5,000 tonnes. Of the total available arable land (2,550 ha) the farm has the op on of irriga on on 750 ha, and currently is irrigated only 25 percent or 187.5 ha. The farm currently employs 200 workers. The company management structure consists of an Assembly and Management Board.T he farm is managed by a director/manager, a professional agricultural engineer. The Director of the Company, together with the managers of individual produc ons, make actual annual opera onal plans for plan ng and a er the comple on of the harvest, report on actual returns and realized process. The farm is in the VAT system and is entered in the Register of Agricultural farms in the relevant Ministry, which is en tled to receive state subsidies. Due to the form of the ins tu onal organiza on of the company, i.e. joint stock company, it organizes an annual mee ng of shareholders, where they present the results/performance indicators of the company.
168
Investments In the previous period, the farm has set aside signifi cant funds for the purchase of equipment and terminals to the value of 5,000,000 BAM and construc on of two barn buildings for dairy cows, including the necessary equipment for milking worth between 200,000 and 300,000 BAM. As sources of funds for these investments their own funds were used, as well as bank loans and government subsidies on the basis of the MoA Subsidy ByLaw. In the future, the farm plans signifi cant funding to direct towards restora on of machinery, adapta on of the barn for 150 dairy cows and to soil improvement. Given the type of soil, which is dominated (podzol)97 calcifi ca on of the land is necessary. Currently, 250 ha of land are planned to be calcifi ed. One of the most important investments, next year (2012) represents, as already stated, the reconstruc on of exis ng irriga on systems in the RS, which will be implemented by the relevant ministry, and fi nancially supported by the World Bank. Priority investment is the construc on of silos with a drying facility with a capacity of 5,000 tonnes.
Market A er the harvest, crops are stored in the fl oor warehouse, and then placed on the market. The company’s own products are sold in the local market. In terms of marketability of individual crops, wheat has the highest marketability, then soybeans and oilseed rape (100 percent). From other crops, the total produc on of maize and barley, part is le for ca le feeding, and the rest is put on the market. Transport of products to the end customer, if the outlet is far away, is done by trucks, and to closer customers (merchants and mills within Semberija) by own agricultural machinery (tractors).Flour mills within Semberija mainly buy wheat although a certain amount of wheat along with corn through the company “Agrogroup” from Brčko is exported to Turkey. For mercan le wheat and corn there are no contracted sales. Purchase of wheat is being implemented in accordance with the Decision of the Government of RS, which clearly defi nes the size of the protec ve price, which is the basis for collec on.98
For oilseeds (rapeseed and soybean), the farm has agreed to sell to the factory, “Bimal” from Brčko, the only producer of edible oil in BiH. The contract, signed by the farm with the processor on the purchase of soybeans and canola, can clearly defi ne the protec ve price, and at the me of sale, the market sales price. Selling of crops is done immediately following the harvest, and the payoff is within 30 days a er delivery. In 2010, the purchase price for rapeseed and soybean amounted to 580 BAM /tonne, and the 2011 buyer is willing to pay 760 BAM/ton, due to lack of supply of these products on the market. Since the farm, in addi on to the programme of mercan le produc on, is involved in a programme of seed produc on, seed produc on is made with the Crop Ins tute from Novi Sad and Zemun polje Belgrade. For each year, the farm signs a contract with these companies for the implementa on of seed produc on for each crop. Lately, the farm produced its own seeds of wheat, barley and soybeans, which are then marketed as commercial varie es, while the seed corn and sunfl ower varie es are owned by listed companies. For the purposes of seed produc on of maize and sunfl ower fi elds on the farm, they receive, from one of these houses, seed and advance payments for the provision of other necessary materials in seed produc on (fer lizer, crop protec on chemicals, etc.), while the rest of the money is paid out a er a good implementa on-specifi c delivery of seed produced.
Produc on, product management and standardsProduc on of cereals is conven onal. Table 1 shows the average yields for wheat and maize for the period 2007–2011.
Table 1 Average yields of wheat and corn for the period 2005–2011
Crops 2011 2010 2009 2008 2007 2006 2005
Wheat t/ha 3.8 2.3 4.7 4.9 4.2 3.1 3.5
Maize t/ha 6.2 9.1 4.5 2.6 4.8 5.2
The farm has not been cer fi ed to the standards in the processes of produc on management, within which are included guidelines for the implementa on of good agricultural prac ce (GAP).
97 Note: Podzol, acid soil, light, water, pure in phosporous, calcium and nitrogen. 98 Note: For example in 2011, the wheat collec on price was 0.38 BAM/kg. If a farmer wants to receive a subsidy
for wheat, he cannot sell below that price.
169
Economic performances of produc onEconomic performances of produc on show the review of main crops: wheat, maize, soybeans and oil rape.
Size of produc on (tonnes) 5,118 2,232 4,732 3,410 660 274 530 623
Value of produc on 1,433,040 602,640 1,419,600 1,364,000 508,200 147,960 265,000 361,340Subsidies 305,253.41 33,349Total value of produc on 1,738,293.4 602,640 1,419,600 1,364,000 508,200 147,960 265,000 394,689
In addi on to agricultural produc on, part of the company’s revenue generates through the sale of milk, pigs and fa ened pigs weighing between 110 and 120 kg. Total milk produc on annually is around 1.5 million litres. Milk belongs to the E class and is bought from Kozarska Dubica dairy. The purchase price of milk is 0.64 BAM/ l + 0.22 BAM / l milk of payments for E—class. Therefore, the annual revenue through the sale of farm milk is around 1.29 million BAM. The farm has 3,000 head of pigs per year, of which 60 percent of the piglets, and 40 percent of the pigs weighing between 110 and 120 kg. Revenue from the sales of piglets annually is 148,500 BAM, of fa ened pigs 386,400 BAM.
Defi ciencies and needs for investment, training and informa on to comply with the acquisGenerally speaking, one of the aspects of involvement in domes c agricultural produc on, i.e. produc on of cereals in world trade fl ows means the harmoniza on of the legal framework of regula ons, par cularly with the EU (acquis). Another important aspect is to apply the standards in the areas of forming the product itself, such as farms and enterprises. This company is not in the Quality Management System (does not apply, nor a cer fi ca on system of safe food produc on, quality management and environmental protec on). Given that the company is mainly oriented to product placement in the domes c market, it currently does not require that products have the cer fi cate on its quality. However, this prac ce, bearing in mind the strategic orienta on of the RS and BiH, which is entering the EU, for many farms, and businesses will not last long, because of the adop on of EU direc ves and regula ons, which will be applied in domes c legisla on.Specifi cally, this means that those who sell their products on the domes c market will have to meet the requirements of certain standards in order to be able to sell them. It is therefore a priority for investments, aligned with the standards imposed by the applica on primarily in the processes of produc on and management of the company. In order to realize this, it is necessary to introduce training and management of companies on the requirements of interna onal standards, par cularly support of the relevant ministry in (co) funding the costs of introducing quality systems in the enterprise. Furthermore, as another important priority for the development of grain markets in RS and BiH, the company men oned performance improvement of the exis ng market ins tu ons, specifi cally the Commodity Reserves in the RS. Also, to ensure a high income, the company has to work on changing the structure of plant produc on, the introduc on of modern technologies of produc on, repair and increasing the land area under irriga on.
Success FactorsThe key success factors in the business enterprise, according to the exis ng human resources, are rela vely stable produc on, good equipment with technical means, thanks to signifi cant investments in equipment i.e. agricultural mechaniza on in the previous period.
170
Case Study reference number: RS – 3Type of producer: Commercial producer Human Resources: 3 family members and 3 employees during the season (45 man days per season per year) Economic ac vity: Cereals and oilseeds (main ac vity) Other Ac vi es: Animal produc on and farm mechaniza on services
Background of the agricultural farmThe farm is located in Brčko District. Since 1985 the farm has been producing maize, wheat and soybeans. Ini ally the produc on of these crops was taking place on smaller areas of 2–3 ha, and then the area gradually increased. During the period 1995–1996, the farm began to deal with the fa ening of ca le and up un l today, in this regard, it maintains a constant volume of produc on.
The present situa on and management of the farmThe farm now has a total of 33 ha of arable farmland. Of the total arable land (33 ha), 12 ha belong to the farmer, and 21 are rented. An area of 30 ha is with fi eld crops, most of which is under wheat (15 ha), followed by maize (12 ha) and soybeans (3 ha). Sown crops are cul vated on areas, which are partly owned by the farm, and another part is rented. About 3 ha of arable land is planted with grass – clover mixtures, Smiljkita and Red Clover and are owned by the farm. Agricultural land of 21 hectares is rented from a private person and the Government of the District of Brčko. From the private person, the producer rents 13 ha and is paying a price of 200 BAM/ha. The Government of Brčko District has rented him 8 ha of land, for which the producer pays 80 BAM/ha. In addi on to crop produc on, the farm is also engaged in animal produc on. The structure of the livestock on the farm is: 2 dairy cows, 20 beef ca le, 7 breeding heifers, 7 sows, 35 piglets, 10 sheep, between 15 and 20 poultry, and a horse. Equipment of the farm i.e. the agricultural mechaniza on is sa sfactory. The age of the agricultural machinery is between 10 and 20 years. In addi on to revenues generated through the sale of agricultural and livestock products, an addi onal source of farm income is generated through the provision of machinery services. In addi on to barns (the barn for fa ening beef ca le is 60 m2), the farm owns a warehouse for the storage of maize, with a capacity of 15 tonnes, an animal feed mixer to prepare meals for feeding livestock, while for wheat the farm does not have adequate space for storage and maintenance. The owner manages the agricultural farm. The work on the farm is ac vely par cipated in by two family members, and at the me of seasonal work, the farmer hires addi onal manpower (3 seasonal workers). Seasonal labour is hired in the spring, summer and autumn. The farm is not in the VAT system, it is registered in the Government of the Brčko District, and thus it is en tled to receive subsidies. The producer is a member of the coopera ve ZZ “Poljokop” Brčko.The farm is an example of a “tradi onal family farm”, where the basic factor of produc on along with family labour, is the land. The main mo ve of the farm in dealing with agricultural produc on is the provision of income and security for their own families.
InvestmentsIn the period 2005–2010, the farm invested in the following capital investments: (1) Construc on of the facility for fa ening beef ca le, with a value of 15,000 BAM, (2) Construc on of buildings for accommoda on of dried fodder (hay) with a value of 5.500 BAM, (3) Procurement of implements (drills and ploughs),with a value of 1.500 BAM, (4) Procurement of new collectors for the hay, with a value of 1.300 BAM, (5) Purchase of second-hand agricultural machinery and implements (tractor pulling drill, plough-3 XS), with a
value of 21.500 BAM, (6) Purchase of new tanks for manure, with a value of 6.000 BAM The total funding for the construc on of buildings and purchase of agricultural mechaniza on was procured by the farmer from his own funds.
171
In the future, the farm intends to realize a number of investments, purchases of new farm machinery (tractors and harvesters), the extension of an exis ng warehouse for the storage of grain, or the construc on of silos with a drying facility with a capacity of 20 tonnes, the expansion of exis ng livestock through the purchase of male calves and soil improvement – calcifi ca on.99 These investments are arranged according to the following priori es: 1. Purchase of new farm machinery (tractors and harvesters) 2. Soil improvement – calcifi ca on 3. Purchase of male calves 4. Expansion of exis ng warehouse and construc on of silos with dryer and storage of grain, with a storage capacity of 20 tonnes. The farm intends to implement planned investments out of their own and borrowed funds.
Market Products that are marketed are: wheat, maize, soybeans and fa ened ca le. There is no previously signed contract between producers and buyers (the mill, “Pavlovic”) from Bijeljina, but the product sales are based on mutual agreement. Bearing in mind that out of the total produc on volume, about 5 tonnes of wheat is le on the farm, it appears that, on average about 88 percent of the total produc on is sold to the market. Since wheat is sold exclusively in the territory of the Republic of Srpska and in the mill industry in Semberija, the price at which the farmer sells wheat is determined by the prices fi xed by the Government of the Republic of Srpska. Wheat is sold immediately a er harvest. Maize is sold to domes c producers who are engaged in pig fa ening. In rela on to the total realized produc on of maize on the farm, about 60 percent of the maize is intended for the market. Payment to the producer follows immediately upon delivery. Sales of maize are undertaken directly “on the farm”.The producer has a contract for the sale of soybeans directly with the edible oil factory “Bimal” Brčko. The contract, just prior to entering into produc on (in March), clearly defi nes the purchase price (2011, 670 BAM/tonne). The buyer is also prepared, if the year is characterized by a low yield of soybean, to pay a higher price per unit to the producer. For example, in 2008 the protec on price from the contract, on the basis of which the collec on of soybeans should have been conducted was 490 BAM/tonne, but due to low yields, the purchase price amounted to 590 BAM/tonne. The contracted delivery date of goods is within 40 days, and the producer is paid for the goods a er 9–10 days. In addi on to the contracted sales, another aspect of the arrangement between the producer and Bimal is manifested through the lending for soybean produc on, or supplying the producers with the necessary inputs that the supplier returns through the delivered goods.100 Livestock products (fa ening ca le and pigs) are sold to private slaughterhouses in the DB and Bijeljina through traders. Annual sales are about 20 heads of beef ca le, of 550 kg weight and the market price is between 3 and 4 BAM/kg, and pigs, about 30 heads, weighing up to 30 kg at 3 to 3.5 BAM/kg.
Produc on, product management and standards Crop produc on is in a conven onal produc on system. In the period 2005–2011 a mul -year average of wheat yields have ranged around 3.9 tonnes/ha, maize 8.5 tonnes/ha and soybeans around 2.5 tonnes/ha. Un l 2009 the produc on of maize was based on the produc on of whole crop, and in the last three years exclusively on the grain.
Table 1: Areas and average yields of crops on the farm
99 Note: Calcifi ca on is a priority due to widespread podzola or pepeljuša. 100Note: out of total sold value of soya, the input costs are deducted.The remaining amount is the fi nal income of
the producer.
172
Harves ng of the crops is undertaken with their own agricultural machinery. Upon harves ng the crop from the fi eld, the products are transported, by their own tractor-trailer, to the storage space within the agricultural farm. One part of the crops (maize grain, wheat and soybeans) are stored a er harvest in the warehouse and le for feeding livestock on the farm, and the remainder is put on the market. For maize, in addi on to grain produc on, one part of the crops is used in the produc on of silage. In the milk-wax maturity stage of maize, the whole plant is used for silage making.
Economic performances of produc on
Wheat Maize Soya
2009 2010 2009 2010 2009 2010
Area (ha) 13 9 18 14 9 6
Size of produc on (tonnes) 45.5 36 144 112 22.5 15
on the market (tonnes) 40 31.7 86.4 67.2 22.5 15
Value of produc on 13.200 11.088 30.240 26.208 11.700 8.850
Subsidies for area BAM/ha 300 300 250 250 400 400
Total value of produc on 13.500 11.388 30.490 26.458 12.100 9.250
Overall agricultural produc on on the agricultural farm is inconsistent with the principles of “good agricultural prac ces”. The reason for the lack of a cer fi cate of Global GAP standards, as the producer says, is the high cost of introducing it. In addi on to agricultural produc on, the farm generates a por on of its revenue through the provision of machinery services. Revenues generated from the sowing, on an annual basis, are about 3,600 BAM (60 ha sown area/year x 60 BAM/ha), and from the harvest in the amount of 15,000 BAM (100 ha/year x 150 BAM/ha).
Defi ciencies and needs for investment, training and informa on to comply with the acquis:Given that the overall produc on is not consistent with the principles of applica on of good agricultural prac ce, one can conclude that the farmer does not meet the agri-environmental and quality standards of products. The producer reported a need for training and informa on rela ng to the applica on of good agricultural prac ces.
Success FactorsThe producer men oned several factors for the success in produc on: (1) Was able to place his products on the market and the high purchase price for certain products, notably
soybeans (2) The use of their own agricultural mechaniza on has a signifi cant impact on reducing produc on costs (3) Signifi cant support by the Government of the Brčko District in the form of subsidies for crop produc on (4) Financial poten al of agricultural producer to implement majority capital investments from his own funds
173
Case Study reference number: RS – 4Type of producer: Commercial producer of cereals.Human Resources: 7 family members and 3–4 workers per year during the harves ng seasonEconomic ac vity: Cereals and oilseeds (main ac vity). Other Ac vi es: Animal produc on and service provision of machinery
Background of the agricultural farmThe farm is located in the municipality of Srbac. In 1996 the farm began intensive agricultural produc on on an area of 70 ha, which was eventually reduced to 50 or 40 ha. The reason for reducing the produc on area was the inability to sell the product. As an illustra on of this, in 1997, the farm could not sell 100 tonnes of soya. Currently, the farm is engaged in crop and livestock produc on. As far as crop produc on is concerned, the most common produc on is of wheat, corn and soybeans. Livestock produc on is focused on producing pigs.
The present situa on and management of the agricultural farmThe farm, for the purpose of organizing agricultural produc on, has a total of 23 ha of arable land. Of the total 23 ha, 3 ha are owned by the farm, while 20 ha is rented. Land is rented from private persons and according to the loca on, rent ranges from 100–200 BAM/ ha. The en re cul vable area of 23 ha is under crop produc on, i.e. grain and soybeans. Crops are not under irriga on. As far as cereals are concerned cereals, the structure of sowing is dominated by wheat and corn, a very small area is under barley and oats. The structure of arable land use is dominated by soya, given the exis ng livestock produc on.The structure of the livestock farm has 10 breeding sows with 200 piglets annually, 2 dairy cows, mixed produc on (Simmental), 3 sheep and 50 poultry. Equipment on the farm i.e. agricultural mechaniza on is sa sfactory. The age of agricultural machinery is about 20 years. In addi on to revenues generated through the sale of agricultural and livestock products, as an addi onal source of farm income there is the provision of own machinery.In addi on to barns (barns for swine have an area of 100 m2), the farm owns so called “wooden storage barns” for storage of corn (up to 100 tonnes of the crop) and wheat (capacity 20–30 tonnes of grain). The farm does not have adequate space for storage and maintenance of products a er harvest. The agricultural farm is an ownermanaged farm. The work on the farm is ac vely par cipated in by almost all family members, and in the course of the year, at the me of seasonal work, the farm hires addi onal manpower (3–4 seasonal workers). The farm is not in the VAT system. It is entered into the Register of Agricultural Farms of the relevant Ministry, enabling it to obtain state aid/ subsidies, usually in the form of subsidized fer lizer and oil crop produc on. It is a member of the Associa on of Republic of Srpska farmers from Derventa. Like most farms in the Republic of Srpska, the main mo ve of the farm in dealing with agricultural produc on lies in providing an income and security for their families.
InvestmentsIn the period 2005–2010, the farm invested in construc on of a building for the pigs. Construc on of the barn began in 2007 and it was completed in 2008. The barn size is 10 m x 10m = 100m2, capacity 30–40 sows. One part of the space is designed to accommodate the off spring of 20 heads/box. The construc on and equipping of the space for the pigs cost 40,000 BAM, of which 50 percent are own, and the remaining 50 percent borrowed funds. The loan was provided through commercial banks for a period of 5 years. Given the average age of their own agricultural machinery (20 years), the future plans of the farm are to obtain a new tractor and implements machines. In addi on to procurement of farm mechaniza on, construc on of new warehouse space is planned. One of the problems that the farm faces is the problem of fragmenta on of land, and it is necessary to start enlargement of them.Given the current and future livestock produc on, the farm is planning to expand the space for the sows and build a new barn for bulls, with a capacity of up to 20 animals. Planned investments will be fi nanced from their own and borrowed funds.
174
MarketA er harves ng of crops, the products are stored in the so-called “wooden storage barns”. Of the total produc on of corn, about 70 percent is for the market, and 30 percent is used for feeding livestock. For wheat, a signifi cant por on of the produc on is for the market (80 percent), and the rest of it, the farm uses for feeding livestock. Produced soya, given the exis ng livestock produc on, is not sold but is used as input for feeding livestock. For wheat and corn there is no agreed sales. Wheat, immediately a er the harves ng of the crop is transported to the mills, and the producer receives the money immediately for the delivered goods. One part of wheat produc on is delivered to Commodity Reserves, for the approved subsidy of fer lizers and fuel. Price at which wheat is sold to mills is defi ned in accordance with legal regula ons, issued by the Government of the Republic of Srpska. Maize a er harves ng is not sold immediately, but stored un l April or May, when the supply of this product is small and the demand is high, and the producer has an opportunity to achieve higher selling prices and thus higher profi ts. Corn is sold indirectly, through traders
Produc on, product management and standardsFarming is on a conven onal produc on system. In 2011, the sowing areas were under corn and soybeans, while wheat was sown in autumn 2010 on 4 ha, and due to frequent rainfall it was ploughed and on the same area in spring 2011 corn was sown. There were low yields of corn in 2010 as a result of huge fl oods that gripped this region (October), which are generally very common in this area due to the closeness of the Vrbas and Sava Rivers Basin. Mul -year average yields (2005–2010) of wheat were about 3.8 tonnes/ha, maize 9,6 tonnes/ha and soybean 2.4 tonnes/ha. The structure of the wheat varie es is represented by domes c varie es of wheat, as well as varie es of seed producers in the region (mostly NS-seed). For plan ng corn, the producer uses only hybrid seed of NS-seed.Table 1: Areas and average yields on the farm
CROPS 2011 2010 2009 2008 2007 2006 2005 Average 2005–2010
Wheat (tonnes/ha 3.0 3.8 3.8 3.8 3.8 3.8 3.7
Maize (tonnes/ha) 5 10 10 11 11 11 9.6
Soya (tonnes/ha) 2 2.5 2.5 2.5 2.5 2.5 2.4
Harves ng of crops is undertaken by own agricultural mechaniza on. Upon harves ng the crops from the fi eld, the products are transported by own tractor-trailer to storage facili es (barns) within agricultural farm. As noted, agricultural produc on is according to a conven onal produc on system. Due to the closeness of the wetland complex of “Bardača”, which has been declared a “protected area”, the producer, in the near future, plans to switch from conven onal produc on systems and to accept and apply the principles of “good agricultural prac ces” and the introduc on of the standard of Global Gap.
Economic performances of produc onEconomic performance of the produc on is presented for the produc on of wheat and maize. Produc on values refer to the total sales volume of wheat and maize for the period 2009–2010. Bearing in mind that the marketability of wheat is 80 percent and 20 percent is intended for feeding livestock on the farm, it appears that in 2009 produc on value amounted to 5414,4 BAM (13.68 x 280 BAM/tonne, coun ng the premium for wheat sold at 50 BAM/tonne. In 2010 the amount of 5040 BAM (18.24 x 350 BAM/tonne). For the period of 2010, the total variable costs included subsidies for inputs (NPK 5:15:15, and KAN (27 percent)). Of the total amount of corn produced in the period 2009–2010, approximately 70 percent was placed on the market, hence the value of produc on in 2009 was 31,360 BAM (112 x 280 BAM/tonne) and 14,700 BAM (42 x 350 BAM/tonne) in 2010.
175
CROPS Wheat Maize2009 2010 2009 2010
Area (ha) 4.5 6 16 12Size of produc on (tonnes) 17.1 18 160 60Value of produc on BAM 3,830.4 5,040 31,360 14,700
Subsidies for wheat (BAM)Subsidies for sown area (BAM)
684900 0 0 0
Total value of produc on 5,414.4 5,040 31,360 14,700Variable costs101 3,290 3,354 12,553 8,629GVA 2,124.4 1,686 18,807 6,071
In addi on to agricultural produc on, one of the sources of income is generated through the provision of equipment. At the annual level, the farm’s own machinery, cul vates about 30 ha of land. Revenue from the cul va on is 6,000 BAM/year (30 ha/year x 200 BAM/h). In addi on to preparing the land, the farm generates revenue in sowing and spraying of crops to the value of 9,000 BAM. Thanks to owning their own machines for harves ng of maize (corn head) the corn harvester brings revenue in the amount of 17,000 BAM (85 ha/year x 200 BAM/h).
Defi ciencies and needs for investment, training and informa on to comply with the acquis:The producer men oned several shortcomings in alignment with the acquis: (1) Non compliance of crop produc on with the principles of “good agricultural prac ces” (2) Unregulated markets and the need to defi ne the legal framework, that will establish the specifi c mechanisms of control and order of the market(3) The problem of the func oning of market ins tu ons (RS Commodity Reserves).The producer reported a great need for training and informa on rela ng to the applica on of good agricultural prac ces, as well as support for funding the costs of standardiza on of produc on and construc on of adequate storage facili es for storing agricultural products (silos).
Factors of successFactors of success, or survival of the agricultural holdings are: The engagement of own labour in produc on Engagement of their own agricultural machinery, Reducing produc on costs
101Note: Variable costs for wheat in 2010 were calculated on the basis of subsidized mineral fer lizers and fuel (NPK 15:15:15 – 250 kg/ha and fuel 100 l/ha). Variable costs for maize for 2009 and 2010 were calculated on the basis of subsidized mineral fer lizers and fuel ( 250 kg/ha NPK 15:15:15 and fuel 120 l/ha).
176
Background of the agricultural farmThe farm is located in the municipality of Gradiska. The farm has been registered as a limited liability company since 1993, which in addi on to dealing with agriculture started dealing with trade, and since 2001 the only and exclusive produc on is agricultural produc on. The farm is of a combined type, and has agricultural and livestock produc on. Crop produc on, is dominated by grain produc on (wheat and corn) and oilseeds (rapeseed), and by livestock produc on, fa ening pigs and ca le.
Case Study reference number: RS – 5Type of Producer: Commercial producer Human Resources: 2 family members, 10 full- me employees and 2 seasonal workersEconomic ac vity: Cereals and oilseeds (main ac vity) Other Ac vi es: Animal produc on
The present situa on and management of agricultural farmThe farm has a total of 30 hectares of own land, of which 0.6 ha is forest land, 2.4 hectares is under oil crops, while the remaining 27 ha are cereals. Their own area under oilseeds and grains is under irriga on. Given the exis ng livestock produc on; fa ening of pigs and calves, in 2007 the farm took 229 ha of arable land under concession. The period of use of land under concession is up to 15 years, with the possibility of extension of the contract. The concession fee, which the producer pays is 83 BAM/ha. The concession structure of the arable land consists of 36 ha under oilseed rape; 70 ha wheat and 123 ha of maize. On the contrary of their own arable land, the land under concession is not currently covered with an irriga on systems. For the purposes of keeping and storage of crops, the farm has storage space – metal silos with a total capacity of 1,000 tonnes. In addi on to metal silos, the farm has a fl oor warehouse with a capacity of 500 tonnes and dryers for crop drying. Harves ng of the crops is done by their own machinery. The level of equipment of the farm with their own machinery is very sa sfactory. Own machinery is used for the purpose of performing all opera ons in the agro-technical produc on on the farm. In addi on, the farm provides services to other producers through the use of their equipment, and generates addi onal income. On average, the annual value of the machinery service is 40,000 BAM–50.000 BAM. Also, thanks to the exis ng dryer for drying crops, for the provision of drying services, the farm generates 60,000–70,000 BAM. On the agricultural farm there are barns for fa ening pigs and ca le. One barn is 900 m2 and is used for ca le with a capacity for 300 animals, while another barn of 1,200 m2 is for fa ening pigs, 1500 heads. The farm has space for storing raw materials, a fer lizer warehouse, an area of 150 m2, for seeds 194 m2 and for chemicals 25 m2. The farm i.e. enterprise is an owner-managed farm. The work on the farm ac vely involves 2 members of the family, and during the year, at the me of seasonal work, 2 addi onal seasonal workers are hired as farm labour force. There are 10 full- me employees on the farm. The farm is in the VAT system (17 percent). It is also in the Register of Agricultural Farms of the relevant Ministry, enabling it to obtain state aid/subsidies, usually in the form of subsidized fer lizer and oil crop produc on. The producer/owner of the company each makes a proper plan of produc on every year. For the purposes of concluding business contracts and the provision of certain services and regula ng other legal ac vi es of the enterprises, the owner of the company hires a legal consultant.
InvestmentsIn the period 2005–2010, the farm/company had a signifi cant capital investment in storage facili es for cereals (silos), the buildings for fa ening pigs (2) and heifers (1) and it invested in the construc on of the facility for the pigs, and agricultural equipment (seeding machines, ploughs, spreaders of mineral fer lizers, etc.). Total funding for listed investments is es mated at about 500,000 BAM and this funding was provided from its own resources. In the future, the farm/investment company plans to expand storage space, which is primarily dependent on obtaining addi onal arable land under concession. The aim of the agricultural farm is 1,000 ha of arable land under concession. The second planned investment is related to the construc on of a mini slaughterhouse and a meat processing plant, and crea ng their own product. Priority investment is the purchase of the farm irriga on system – TIFON system. For 100 ha under irriga on, from the start, the farm intends to allocate between 220,000 to 240,000 BAM. Planned investment will be carried out of their own and borrowed funds.
177
MarketA er harves ng, farming products are transported to the dryer (fl ow), where they are dried and then stored in silos. Except for soybeans, which are exclusively used for fa ening pigs and calves, other arable products, wheat and corn are sold on the market. In order to achieve be er sales prices for wheat and corn, crops do not fi nd their way to the market immediately a er harvest, but to the warehouse. Based on calcula ons of produc on, the price is formulated and the farmer waits for a favourable moment for the market. To illustrate this, in 2011, the producer sold 15 tonnes of wheat at 0.50 BAM/kg, although the purchase price of wheat stood at 0.38 BAM/kg. In the last two years, the produc on of wheat was exported to Turkey. In 2009, the export price of wheat was EUR 149/tonne and in 2010 it amounted to EUR 233/tonne. The producer has not made contracts to sell wheat and corn. Customers for wheat are traders and private farms. For wheat and corn, the producer has no problem with charging the goods supplied. Payment is made immediately.
Produc on, product management and standardsManufacturing, product management and standard farming takes place according to a conven onal system. Plan ng for the period 2005–2011 was dominated by corn and wheat, except for the 2006, when wheat was sown. Soybean plan ng in the structure of agricultural cultures represented the years 2011 and 2006: the average soybean yields were between 2.8 to 3 tonnes/ha. Average yields of perennial wheat amounted to 4.6 tonnes/ha and maize 7.2 tones/ha. The producer expects that the average yields of corn in 2011 were moving around 8tonnes/ha. Table 1: Areas and average yields on the farm
Harves ng of crops is done by the farmer’s own agricultural mechaniza on. Upon harves ng the crop from the fi eld, they are taken to storage facili es (silos) on the agricultural farm. Primary produc on is not standardized, and the introduc on of quality management, namely the adop on and applica on of principles of good agricultural prac ce itself is one of the priori es for future investment of the farm.
Economic performance of the produc onEconomic performance is shown for wheat and corn. The obtained value of produc on is related to the total sales volume of wheat and maize for the period 2009–2010. The value of the produc on of wheat and corn is for the period 2009–2010 calculated on the basis of the following prices: wheat 2009 (291.8 BAM/tonne) 2010 (456.3 BAM/tonne) and maize in 2009 (264.4 K/tonne). In 2010, the en re yield of corn was not sold as well as the previous one. Very small quan es are sold, 50 tonnes at 470 BAM/tonne (including VAT of 17 percent).
CROPS Wheat Maize2009 2010 2009 2010
Area (ha) 100 110 130 130Size of produc on (tonnes) 500 407 780 1,105Value of produc on BAM 146,000 185,592 205,920 27,500Wheat subsidies (BAM)Sown area subsidies (BAM)
20,000
Total value of produc on 166,000 185,592 205,920 27,500Variable costs102 129,900 114,164 121,820 138,762GVA 36,100 71,428 84,100 111,262
102Note: Variable costs for wheat in 2010 included subsidy (NPK 15:15:15 – 250 kg/ha and euro dizelom – 120 l/ha ).Variable costs for maze for 2009–2010 included subsidy (NPK 15:15:15 – 250 kg/ha and euro dizelom od 100 l/ha).
178
In addi on to agricultural produc on, one of the sources of income, is generated through the provision of machinery and drying services. At the annual level, farm income generated from providing services with their own machinery amounted to 40,000–50.000 BAM, and drying 60,000–70,000 BAM. In addi on, signifi cant addi onal income is generated through the sale of fa ened pigs and beef ca le. At the annual level, the farm produces about 4,000 pigs (3 rounds per year). The market price is formed primarily on the basis of supply and demand. During the year the farm produces between 250 and 300 beef ca le. Beef ca le price is dictated by supply and demand for the product on the market. Since the farm has a mixer for animal feed, a signifi cant por on of income is generated through the sale of animal feed. Annual produc on is around 500 tonnes.
Defi ciencies and needs for investment, training and informa on to comply with the acquis:The producer noted several shortcomings in alignment with the acquis: (1) Incompliance of crop produc on with the principles of “good agricultural prac ces” (2) Unregulated markets and the need to defi ne the legal framework, that will establish the specifi c mechanisms of control and arrangement of the market(3) Exis ng legal regula ons on subsidies in agriculture, the necessity for a clear defi ni on of subsidies for crop produc on (clearly defi ning the amount of subsidies per hectare of sown area) (4) And fi nally the problem of the func oning of market ins tu ons (Commodity Reserves RS). In par cular, it highlights the need for enlargement of the land and the increase of arable land. Increase of the cul vated area would signifi cantly aff ect the increase in livestock produc on. The producer reported a great need for training and informa on, and acquiring new skills, to enhance exis ng produc on on the farm and signifi cantly aff ect compe veness.
Success FactorsFactors of success of the agricultural farm/enterprises lie in the following: A safe product market, whereby the company, thanks to the available storage infrastructure (silos) can achieve signifi cantly high incomes Use of own agricultural mechaniza on Reducing produc on costs
Good organiza on and func oning of the en re produc on
Producers’ investments in the past include these investments (summary): Storage building of 10 x 8 m in size and capacity of 50 tonnes, constructed for BAM 20,000 Tractor for BAM 50,000 No credit Annual investment of BAM 7,000 Two-row maize picker for BAM 16,000 Second-hand tractor for BAM 15,000 Implements such as disk harrow, plough, sprinkler for BAM 11,000 Another tractor for BAM 20,500 Combine for BAM 25,000 Two tractor trailers for BAM 20,000 Planter for BAM 3,500 No credit Annual investment of BAM 11,000
Stable for pigs for BAM 12,000 Tractor for BAM 22,000 Tractor for BAM 15,100 Tractor for BAM 64,000 Tractor for BAM 40,000 Tractor implements for BAM 16,400 No credit Annual investment of BAM 17,000 Second-hand combine for BAM 12,000 Rotary cul vator for BAM 5,000 Second-hand combine for BAM 16,000 Second-hand tractor for BAM 18,000 0.8 ha of land was purchased for BAM 8,000 No credit Annual investment of BAM 5,000 plus one purchase
of land
179
Garage for combine of 10 x 6 m for BAM 8,000 Garage for tractor of 8 x 6 m for BAM 6,000 Garage for smaller tractor of 5 x 4 m for BAM 4,000 Sheds for BAM 3,000 Combine for BAM 50,000 Tractor for BAM 20,000 Smaller tractor for BAM 12,000 Picker for BAM 36,000 Grain and maize drilling machine for BAM 6,000 Soya drilling machine for BAM 4,000 Combina on seed harrows for BAM 350 Two llers for BAM 900 Three ploughs for BAM 800 Sprinkler for BAM 1,200 No credit Annual investment of BAM 15,000 Reconstruc on of exis ng facili es for farm machinery Barns for ca le fa ening (2 buildings) Storage room of 50m2
5 tractors for BAM 301,000 Harvester for BAM 333,000 2 maize sowing machines (2 seeders) for BAM 30,000 4 ploughs (4-fold) for BAM 50,000 Sowing machine for wheat (3 meter opera on) for BAM 18,000 2 sprinklers (sprayers with 600 litre volume each) for BAM 7,000 2 harrows for BAM 3,000 Driller for channels for drain water from the depression for BAM 7,000 Manure spreaders Mineral fer lizer spreaders
Spreaders for calcium (capacity 5 tonnes) Credits from commercial banks Annual investment of BAM 75,000 Barn for ca le fa ening for BAM 15,000 Fodder storage facili es for BAM 5,500 Driller for BAM 750 Ploughs for BAM 750 Hay collectors for BAM 1,300 Tractor pulled driller and plough-3 XS for BAM 21,500 Manure storage tanks for BAM 6,000 No credit Annual investment of BAM 5,200
Stables for pigs (100 m2, 30–40 sows) for BAM 40,000 Annual investment of BAM 4,000 Silos 2 stables for fa ening pigs Stable for heifers Seeders Ploughs Spreaders of mineral fer lizers and other equipment No credit Annual investment of BAM 50,000
Farm equipment and terminals Construc on of 2 barns for dairy cows plus milking equipment Credits from commercial banks and governmental subsidies Annual investment of BAM 75,000
180
181
ANNEX 4
Mills in FBIH, capaci es, t/day, 2011
Mills with substan al capacity Capaci es, tonnes/day
1. KLAS, Sarajevo 450
2. HUSINSKI RUDAR, Ljubače 150
3. ŽITOPROMET, Mostar 150
4. DUKAT, Tešanj 150
5. ŽITOPRERADA, Bihać 120
6. MLIN MAJIĆ, Odžak (novi mlin) 120
7. MLINPEK, Bugojno 100
8. MLINPEK-ŽITAR, Jajce 60
9. USTIKOLINA, Us kolina 50
10. ZLATAN DOLINA, Sanski Most 50
Mills with middle capacity Capaci es, tonnes/day
1. MAJIĆ, Prud – Odžak 30
2. KOPIĆ, Orašje 25
3. REBRONJA, Brijesnica Velika 24
4. BOKŠIĆ, Čapljina 24
5. MLINOLES, Gračanica 20
6. PLANE, Tuzla 20
7. MLINKOMERC, Miljanovci-Kalesija 20
8. MLINORAD, Nahvioci 15
9. BBcommerc, Olovo 15–16
10. IVO I BELE, Oštra Luka 15
11. PURAČIĆ, Tuzla 10–15
12. MLINPEX, Brijesnica Mala 12
13. ŠPIONJACI, Oštra Luka 10
14. ŽIVKOVIĆ, D. Mahala 10
15. KEKEC, Orašje 10
16. ZLATNA DOLINA, Stolac t/g 8
17. HAIM, Cazin 5
18. EUROTRANS, GRADAČAC 100Source: Ministry of Agriculture, FBiH, May 2012
182
183
ANNEX 5
List of mills and bakeries in RS
Name of company Place
“Kraina Klas” d.о.о. Banja Luka
DELTA MAXI doo Banja Luka
“MILBO KOMERC” DОО Bijeljina
AD “GRANDCOMMERCE” Kozarska Dubica
ZR “TANACKOVIĆ-PAK” Šamac
Pekarska radnja “BELI” Šamac
DOO ‘’MLADOST” Istočna Ilidza-Sarajevo
DOO ‘’KLAS’’ Pale
Pekara “BISER’’ Banja Luka
SZR ‘’OZ’’ Šamac
SZPR “МADONA” Banja Luka
SPZR “ТАDIĆ” Banja Luka
SZ PEK “МILD” Banja Luka
SZ PEK “BORIK” Banja Luka
SZ PEK “ŽITOPEKA” Banja Luka
“KRAINA KLAS” d.о.о. Banja Luka
SZTR Pekara “CVIJETA” I , “CVIJETА 2” Prnjavor
DОО “МATPAN” Sokolac
DОО “RAŠEVIĆ” Foča
Pekara “DAN I NOĆ” Kostajnica
S.Z.P.R. “BAKAL” Banja Luka
SZPR “SILVA ĐURIĆ” Banja Luka
DОО “VARDAR COMMERCE” Bijeljina
SZPR “PECIVО” Pale
AD “DOBOJKA” Doboj
SZPR “КLAS” Banja Luka
DОО “MAČVANKA” Bijeljina
SZPR “FEĐA” Banja Luka
DОО “MARIĆ PRODUKT” Laktaši
SZR PEKARA “DUJAKOVIĆ” Doboj
SZPR “MITROVIĆ” Doboj
SZPR “SARKIĆ” Doboj
SZ PEK “DUJAKOVIĆ” Banja Luka
SZR Pekara “HURTIĆ” Doboj
SZTR “PALMA PLUS” Višegrad
SZTR “PERECA” Višegrad
184
Pekoteka “ZRNO” Višegrad
“TODIĆ” pekara Laktaši
“BMD KOMERC” d.о.о. Doboj
SZPR “MILICА” Banja Luka
DОО “ĐURIĆ” Modriča
SZPR “SUNCE” Pale
SZPR “ILIĆ” Doboj
SZPR “МАGISTRALA” Bijeljina
SUZR “Pekoteka QUI-QUI” Srbac
Ugos teljska radnja-iydvojeni poslovni prostor pekoteka- “KLAS2’’ Modriča
Zanatsko trgovinska radnja PEKARA “KLAS” Modriča
SZR PEKARA “GORDANA” Doboj
Zanatska radnja-pekara “24.NOVEMBAR” Zvornik
Pekara “PEKOVITA” Banja Luka
SZPR “GLUMČEVIĆ” Doboj
“Mane komerc” dоо Srbac
“LIM PEК” DОО Mrkonjić Grad
SZPR ‘’KLAS” Banja Luka
SZUR “ЕVITА” PRNJAVOR Prnjavor
dоо “PEKARA ILIĆ’’ DERVENTA Derventa
“MLADOST ĆIĆO” d.о.о. Šamac
DELTA MAXI doo Laktaši
“ŽELJO” dоо Pale
AD Industrijska pekara “TREBINJE” Trebinje
“MIL BORI” dоо Тrnovo
“DEZOSANIТ” dоо Banja Luka
“ADRIА” dоо Višegrad
SZR ‘’BOJANIĆ’’ Тrebinje
ZZPR “ZLATNO ZRNO” Banja Luka
SZR “Pekara NATURAL PECK” Banja Luka
SZR pekara “BISER” Doboј Doboj
ZTSR “CROISSANT” Foča
ZTR pekara “EVROPA” Zvornik
SZR pekara “GLUMIČEVIĆ” Doboj
SZR pekara ‘’NEDA’’ Doboj
SZR pekara “МN” Doboj
STZR pekara “ALJO” Doboj
SZTR pekara ‘’CENTAR” Doboj
SZR pekara “MILIĆEVIĆ” Doboj
SZR pekara “MAGISTRALA” Doboj
SZTR pekara “GAMА” Prijedor
185
SZTR pekara”KLAS” Prijedor
SZR pekara “VUČJAK” Vukosavlje
SZTR “ANJA” Prijedor
“CRNA GORA” dоо Zvornik
SZR “CIPOVKA” Bratunac
SZPR “MAGISTRALА-А” Јаnja Bijeljina
“FRUCTA TRADE” PЈ “HIPER KORT” Banja Luka
“IMPES” а.d. Foča
“BRAĆA LAZIĆ” DОО Bijeljina
OPZ “Zlatne kapi Potkozarja” PО Gradiška
SZTR pekarа “RADIĆ” Banja Luka
“PRIMUS CRNIĆ” d.о.о. Laktaši
SZTR pekarа “ZLATNO KLASJE” Bijeljina
SZPR “PODRINJE” Јаnjа Bijeljina
ZTP pekara “КLAS 2” Prijedor
SZR “PEKARА” Šamac
SZTR pekara “ЈANKOVIĆ” Banja Luka
Pekara “DIJANA” Zvornik
Pekara “VUKOVIĆ” Zvornik
SZTR Pekara “КULA” Istočno Sarajevo
ZTP Pekara “SUNCE” Modriča
Pekara SIMANOVIĆ Gradiška
“EURO LIMUN” Doboj
Preduzetnička djelatnost “DUKI” Banja LukaSource: Informa on from RS MoA, 2012
186
187
ANNEX 6
List of mills and bakeries in BD
Name of company
Mlinoprodukt Cosic d.о.о.
MPP Klas
Mlin Vujicici
S.P.Stokic
S.P. Mlin Stevic
Pekara Danijel
Pekara Erle c
Pekara IN
Todex
Pekata HiT
Pekara Magistrala
Pekara Lid Pek
Pekara Smajic
Pekara Sloga
Pekara Benini
S.P. Sunce
S.P. Galaksija
Pekara Dan I Noc
Pekara Malahit Celic
Pekara Fa mi
Silos Promet
Pekara Mladost
Mlin Majic
Mlin Pavlovic
Zitoposavina Pelagicevo
Zitopromet s.p.
Source: Informa on from SBD Department of Agriculture, 2012