The changing graduate labour market:analysis using a new indicator of graduatejobsFrancis Green* and Golo Henseke
* Correspondence: [email protected] Centre, UCL Institute ofEducation, London, UK
Abstract
This paper examines differentiation in the recent evolving graduate labour market inBritain. Using a novel statistically derived indicator of graduate jobs, based on jobskill requirements in three-digit occupations obtained from the British Skills andEmployment Survey series, we analyse trends in the labour market between1997/2001 and 2006/2012. The indicator performs better than other indicators invalidation tests, could be applied flexibly in other contexts, and is available in theAdditional file 1. We find that the massive influx of graduates into the labour forcehas been absorbed with no increase in overeducation. However, the returns tograduation have become more dispersed, with those at the upper quartile of theresidual distribution increasing, while those at the lowest quartile have fallen. Thewage gap between matched and overeducated graduates increased by 11 logpoints. Using the British Household Panel Study, we find that the persistence ofovereducation status did not change but for non-employed male graduates movinginto employment, the chances of entering a graduate job decreased.
spectives (sometimes referred to as the “subjective” method) could be open to some
self-esteem bias. Green and James (2003) found evidence of some differences between
employees’ and their line managers’ reports, though they also found task items to be
reasonably reliable. Similar indicators were used following validation tests in the
OECD’s Survey of Adult Skills, the German National Educational Panel Study (Matthes
et al. 2014), or the World Bank’s STEP Skills Measurement Program (Pierre et al.
2014). As described in more detail below, we use skills requirement data in combin-
ation with the self-reported education requirement data, to derive an index of the latent
“graduate skills requirement”. This index captures the educational requirement that is
warranted by the high skills used in the job. The index is then aggregated from the in-
dividual level to that of the three-digit SOC code.
In addition to avoiding potential self-esteem biases in individuals’ responses about
the educational requirements of their jobs, our method avoids the use of hard-to-
replicate expert judgements and deploys an observer-neutral classification procedure
based on relatively simple statistical classification methods. Our method is also updat-
able, transferable to new or old occupation coding frames, and applicable across
countries.
3 Data and classification method3.1 Data
The primary requirement for classification is a set of data on skills use in all types of
jobs, alongside occupational coding. An efficient and reliable way to collect such
information is via a representative survey of the employed labour force. The Skills
and Employment Survey (SES) series comprise nationally representative sample surveys,
Green and Henseke IZA Journal of Labor Policy (2016) 5:14 Page 6 of 25
collected at intervals of 4–6 years, of employed individuals in Britain aged 20–60 years
old (although the 2006 and 2012 surveys additionally sampled those aged 61–65). For the
purposes of this paper, we use the surveys in 1997, 2001, 2006, and 2012, all of which col-
lected detailed information about skills requirements.5 By design, the surveys are repre-
sentative of filled jobs but not open vacancies.
In order to undertake some consistent dynamic analyses of graduate overeducation
over two separate intervals, we also make use of panel data for employed workers from
the British Household Panel Survey (BHPS) and its successor Understanding Society.
The BHPS was a long-running representative panel study of approximately 10,000
adults (aged 16+) in Britain with comprehensive annual information on socio-
economic circumstances between 1991 and 2008 (University of Essex 2010). Its succes-
sor, the United Kingdom Household Longitudinal Study (UKHLS), incorporated the
original BHPS sample since its second wave in 2009 (University of Essex 2014).
We also make use of the Quarterly Labour Force Survey (QLFS), to which the classi-
fier can be applied. The QLFS, which is the prime source of official employment and
unemployment data for the Office for National Statistics,6 has the advantage of cover-
ing a large sample, enabling descriptive analyses of occupations at a more disaggregated
level than with the other surveys used in this paper.
3.2 The graduate job classifier
Our classifier involves a three-step procedure. In the first step, individual-level job data
are used to compute a latent “Graduate Skills Requirement” (GSR) index. Second, we
average this univariate index across three-digit occupation groups. The third and final
step consists of using the averaged index to classify unit groups as graduate or non-
graduate occupations by k-medians clustering.
In step 1, following the principles outlined in Section 2, the GSR is derived as a latent
index (D*) determining the predicted probability that a tertiary education qualification
is required to do the job. We run a probit model of D* on multiple indicators of high-
skills use obtained from the task indicators and other variables in the data. The pre-
dicted values of the model recover the variation in D* that is due to differences in skills
requirements. The observed binary variable, D, is measured as follows. Workers are
asked which qualifications would be required by a current applicant to get the job they
are doing and, in a follow-up question, how far (on a four-point scale) they judge that
qualification to be necessary to do their job competently (with the emphases included
in the questions). This information is then coded with the value 1 if a worker reports
both, to the first question, that a qualification at level 4 in the national in the UK na-
tional qualifications framework (degree or equivalent) or above is required to get the
job and, to the second question, that it is deemed “essential” or “fairly necessary” for
doing it competently, and 0 otherwise.7
This approach is conceptually similar to methods applied in health economics to
purge self-reported health from reporting error (e.g. Jürges 2007). Here, the error that
is purged is random individual-level variation in reporting bias of educational require-
ments. However, not all subjective biases are definitely removed through this approach:
if for some reason respondents were to overstate the importance of some high-level
skill, the GSR would be correspondingly overstated. Thus, as with other task-based
Green and Henseke IZA Journal of Labor Policy (2016) 5:14 Page 7 of 25
analyses, the method assumes that the reliability of task-based reporting is of sufficient
quality. Comparability across countries, for example, could be limited if the “import-
ance” of certain tasks were reported in culturally affected ways.8
Predictors for the probit model of D* comprise multiple indicators of high-skills use:
i. A dummy variable indicating that computers are important and used at a high
level—either “complex” (e.g. for computer-aided design or statistical analysis pack-
ages) or “advanced” (e.g. using computer syntax).
ii. The SES series has collected consistent data on the importance in jobs of a large
range of generic tasks since 1997 (Green 2012). We deploy a subset of task scores
thought to be needed at a high level in graduate jobs: literacy skills (e.g. writing
long reports), professional communication skills (e.g. making speeches or
presentations), supervisor responsibilities, self-planning skills (that is, ability to au-
tonomously plan one’s work), and specialist knowledge. Each component is defined
as a binary variable which is 1 if the generic skill is required at a high level and 0
otherwise.
iii. In addition to high-level generic task requirements, graduate jobs are also charac-
terised by higher complexity and greater variety of work tasks; therefore, we have
added dummy variables indicating a high level of variety and a low level of
repetitiveness.
iv. A broad indication of a graduate skill level in some jobs is whether the job requires
jobholders to have had a long-lasting formal training for the type of work they do.
We thus include a binary measure of the prior training received for the type of
work on a worker’s current job. The dummy variable is 1 if a worker reports having
received over 2 years of training.
v. Finally, we also make use of the structure of the Standard Occupational
Classifications (SOC) itself. The SOC groups jobs in terms of required skill level,
field of knowledge, and type of work together into occupational groups, into four
levels of disaggregation with decreasing within-group heterogeneity, ranging from
major occupational group (one-digit) to unit group (four-digit) (Elias and McKnight
2001). We exploit this construction principle to calculate an index (DN) of the de-
gree requirement in jobs “similar” to the worker’s current position. Similar jobs are
defined by all observations within the same minor group (three-digit). Formally,
DNi ¼XK
k¼1Dk ið Þ
K ið Þ ;
where k(i) describes the set of K jobs that form the neighbourhood of job i and Dk(i)
represents whether a degree is required to perform job k in worker i’s neighbourhood.
We make no claim that these predictors exhaustively cover the range of skills that
could be required in graduate jobs. We have tested the sensitivity of our classification
to introducing further task-based covariates which might be held to be part of a gradu-
ate’s skills set, such as “instructing, training, or teaching people”: the additional tasks
proved to have no significant conditional association with the graduate skills require-
ment, and their inclusion made only small differences to the predicted latent skills
Green and Henseke IZA Journal of Labor Policy (2016) 5:14 Page 8 of 25
index. We also explored whether potential reporting differences by age and sex affected
the classification, and again, we found no evidence that these demographics mattered
over and above the included work tasks for the classification outcome. It is not asserted
that each of the above work tasks is always required in a graduate job. Nevertheless,
when combined, the variables contribute to a plausible and transparent classification.
Coefficient estimates of the model are given in the Additional file 1. From the estima-
tion results, we compute the latent index of Graduate Skills Requirements (GSR) as the
predicted probit value.
Next, in the second step, we average the GSR scores across each three three-digit
group. In a small number of cases (noted in the Additional file 1), to protect against
outliers (individuals with especially idiosyncratic task sets) and to help to minimise
noise due to reporting errors and occupation misclassification (e.g. Sullivan 2009), we
imputed the derived scores of three-digit occupations (minor groups) with less than ten
observations with average values from the two-digit level of the occupational classifica-
tion (sub-major group). Figure 1 presents the distributions of GSR scores within each
major occupation group, using the pooled 2006/2012 data and the SOC2000 occupa-
tion codes. The distributions of the average scores follow intuitively sensible patterns
across major groups: the scores are highest in major groups 1, 2, and 3 and lowest in
major groups at the bottom of the classification. The distribution (and subsequent clas-
sification) was not sensitive to whether or not we omitted the above imputation pro-
cedure for small-celled occupations. Considerable heterogeneity is evident, however,
within the major groups.
In the third and final step, we partition the occupations into a group of graduate and
non-graduate occupations. Simple clustering techniques are among the most widely
Threshold
-2-1
01
Gra
duat
e S
kills
Req
uire
men
t Ind
ex (
GS
R)
Manag
ers
Profe
ssion
als
Assoc
iate
prof
essio
nals
Admini
strat
ive/se
cret
arial
Skilled
trad
es
Perso
nal s
ervic
e
Sales/c
usto
mer
serv
ice
Mac
hine
oper
ative
s
Elemen
tary
Fig. 1 Graduate skills requirements (GSR) in major occupation groups. Note: The 25 and 75 % quartiles ofthe distribution determine a box’s edges. The median is represented by a line in the box. The length of thebox gives the interquartile range (IQR). The whiskers cover all values within 1.5 IQR above the 75 % or belowthe 25 % quartile
Green and Henseke IZA Journal of Labor Policy (2016) 5:14 Page 9 of 25
adopted methods to approach the classification problem (Everitt et al. 2011). Since the
goal is to derive two distinct non-overlapping groups of occupations, namely graduate
and non-graduate jobs, we apply k-medians clustering, which is a variant of the well-
established k-means clustering method. The latter is a conventional algorithm that as-
signs cases (in our case, three-digit occupations) to the nearest cluster such that the
squared distances from the cluster’s centre are minimised. The k-medians algorithm
uses the median instead of the mean as the centre of the derived clusters and is there-
fore better in dealing with outliers in the data.
For any occupational coding system that structures jobs by required skill levels, the
clustering process generates two occupational groups with distinct levels of GSR. All
occupations which score above (below) the calculated cut-point (−0.897 for SOC2000,
shown in Fig. 19) are labelled “graduate job” (“non-graduate job”). We term this new
classification “SOC(HE)_GH”. The full list of graduate and non-graduate occupations
in the first four major groups is given in the Additional file 1, Table A2. With occupa-
tions distributed across the whole range of skills scores, there is no sharp distinction
between graduate and non-graduate jobs at the margin, and a small number of occupa-
tions have GSR scores that are not significantly above (or below) the threshold; these
are shown shaded in grey.
3.3 Criterion validity
In addition to noting the plausible distribution across major groups, we examined the
criterion validity of the SOC(HE)_GH classifier formally against alternative indicators.
The comparators were five other classifiers based on the prevalence of graduates in the
job, major groups 1 and 2, major groups 1–3, the Gottschalk-Hansen method, and the
Elias/Purcell classifier SOC(HE)2010_EP. Since the conceptually best alternative
SOC(HE)2010_EP (see Section 2) is available only for SOC2010, we use SES 2012 for
these tests and, where the data allow, the four waves of the QLFS in 2013 and 2014
which are also coded in this way. We test predictions, not just within the whole sample
(where validity should be easily established) but also just within what we term the “risk
zone” of jobs in major occupational groups which are not all in one category, i.e. 1, 3,
and 4, where there is therefore a greater risk of misclassification. We investigated the
extent to which SOC(HE)_GH discriminates with respect to the expectation that grad-
uates should receive higher wages in graduate jobs than in non-graduate jobs.
The top panel of Table 1 reports wage regression results using a standard set of con-
trols. SOC(HE)_GH, shown in column 2, is first compared in column 3 with a “naïve”
classifier based on the number of graduates in each minor group. Minor groups in
which the modal worker had a level 4 education (tertiary) as compared to no education
or levels 1 to 3 were classified as graduate occupations. Column 4 is the “traditional
graduate jobs” classifier, defined as belonging to the first two major occupational
groups. The fifth column is more generous, allowing all major group 3 to be included
as graduate jobs. The sixth column deploys and shows the Gottschalk-Hansen classifier,
based on the pay premium for tertiary education within each three-digit occupation.
The results confirm that, for graduates, working in a graduate job is associated with a
large and statistically highly significant wage premium across all classifications. How-
ever, the point estimates and the accuracy of the estimations vary. The proportion of
Green and Henseke IZA Journal of Labor Policy (2016) 5:14 Page 10 of 25
the explained variance is lowest for the naïve and traditional classifications.
SOC(HE)2010_EP and the Gottschalk-Hansen classifier each do a better job than the
naïve and traditional—the explained variance is clearly higher, with the former perform-
ing better. However, the statistical indicator SOC(HE)2010_GH fares best with both
data sets.
As expected, restricting the estimation to graduates employed in the “risk zone” of
major groups 1, 3, and 4 lowers the model fit across all specifications; but even in this
narrower field, the wage premium of matched compared with mismatched graduates is
substantive and significant. The ranking across classification methods is similar to the
previous one: SOC(HE)2010_GH explains the highest fraction of inter-individual wage
differences.
Further criterion validity tests are presented in the Additional file 1, in respect of per-
ceptions of skill underutilisation and participation in skills development. Overall, we
found that SOC(HE)_GH meets the criterion validity tests well, in almost all cases bet-
ter than all the other classifiers, whether for the whole sample or for just the “risk
zone”.10
4 The growth of graduate jobs and graduate overeducation in BritainDespite a substantial research literature on overeducation and skills underutilisation,
relatively few studies have assessed trends over time (Green 2013, p. 131). Britain’s
graduate labour market is similar to many other countries’ modern labour markets,
which for the last two decades have been fed by ongoing rapid inflows of tertiary-
educated students. In Britain’s case, the major surge in participation began at the end
Table 1 Wage premium of matched compared with mismatched graduates, by classificationmethod
Note: OLS regression using calibrated survey weights with age, age squared, a gender dummy, and a full set of regionaldummies with London as reference category as control variables. In SES, regions refer to the place of residence, whereasregions in QLFS capture the place of work. QLFS sample restricted to interviews in person. Asymptotically robuststandard errors are shown in parentheses. All estimated wage premiums are statistically significant at least at the 5 %level. *p < .1; **p < .05; ***p < .01. Source: SES 2012, QLFS Q(1)2013-Q(4)2014
Green and Henseke IZA Journal of Labor Policy (2016) 5:14 Page 11 of 25
of the 1980s (see Fig. 2). Despite the imposition of fees in England and Wales in 1998
and some levelling off in the 2000s, the participation rate exceeded by far that of earlier
generations, with the consequence that the graduate stock continued to rise. Britain’s
younger adult population is somewhat distinctive, however, in having a relatively low
skills base and unequal skills base, according to the OECD’s Survey of Adult Skills
(OECD 2013; Green et al. 2015; Kuczera et al. 2016). On the demand side, Britain is
characterised by relatively flexible labour markets, including low levels of employment
protection and waning union influence, though with a full set of anti-discriminatory
regulations and a national minimum wage. It has been highly open to foreign investment
and has shown generally rising skill utilisation since the 1980s (Felstead et al. 2013).
It is in this context that we examine our research questions. Underpinning our ana-
lysis is an implicit dynamic model of supply and demand in the graduate and non-
graduate labour markets, with imperfect matching. This section examines the growth
of graduate jobs, juxtaposed against the growth of the stock of graduates. To provide
sufficient cases while allowing for the emergence of new graduate jobs, we pool SES
waves 1997 and 2001 to make one data point, and 2006 and 2012 for another, with an
age range 25–60. For each data point, we derive the appropriate classifier. We thus
present an aggregate picture of medium-run change over the period 1997/2001 to
2006/2012, encompassing the possibility of some occupations switching their classifica-
tion over the period as the required skills evolve.
Reflecting the rapid expansion of tertiary education, over the interval 1997/2001 to
2006/2012, the fraction of graduates in the labour force (columns 4 and 5 in Table 2)
rose substantially from 30 to 42 %. The changes were most pronounced among
employed women and in the age group 25–39 years. By 2006/2012, almost half (49 %)
of the employed younger labour force had a degree or an equivalent level of educational
attainment.
0
10
20
30
40
50
60
70
80
0
10
20
30
40
50
60
70
80
1971
1973
1975
1977
1979
1981
1983
1985
1987
1989
1991
1993
1995
1997
1999
2001
2003
2005
2007
2009
2011
2013
Pro
port
ion
in L
F w
ith T
ertia
ry E
duca
tion
(%)
Gro
ss E
nrol
men
t Rat
io T
ertia
ry E
duca
tion
(%)
Female (GER) Male (GER) Female (LF) Male (LF)
Fig. 2 Participation in tertiary education in Britain: gross enrolment ratio (GER) and proportion in the labourforce (LF). Note: The GER in tertiary education is defined as the total enrolment in tertiary educationprogrammes (ISCED 5 and 6), regardless of age, expressed as percentage of the total population in the5-year age group following on from secondary school leaving. Source: UNESCO, Eurostat
Green and Henseke IZA Journal of Labor Policy (2016) 5:14 Page 12 of 25
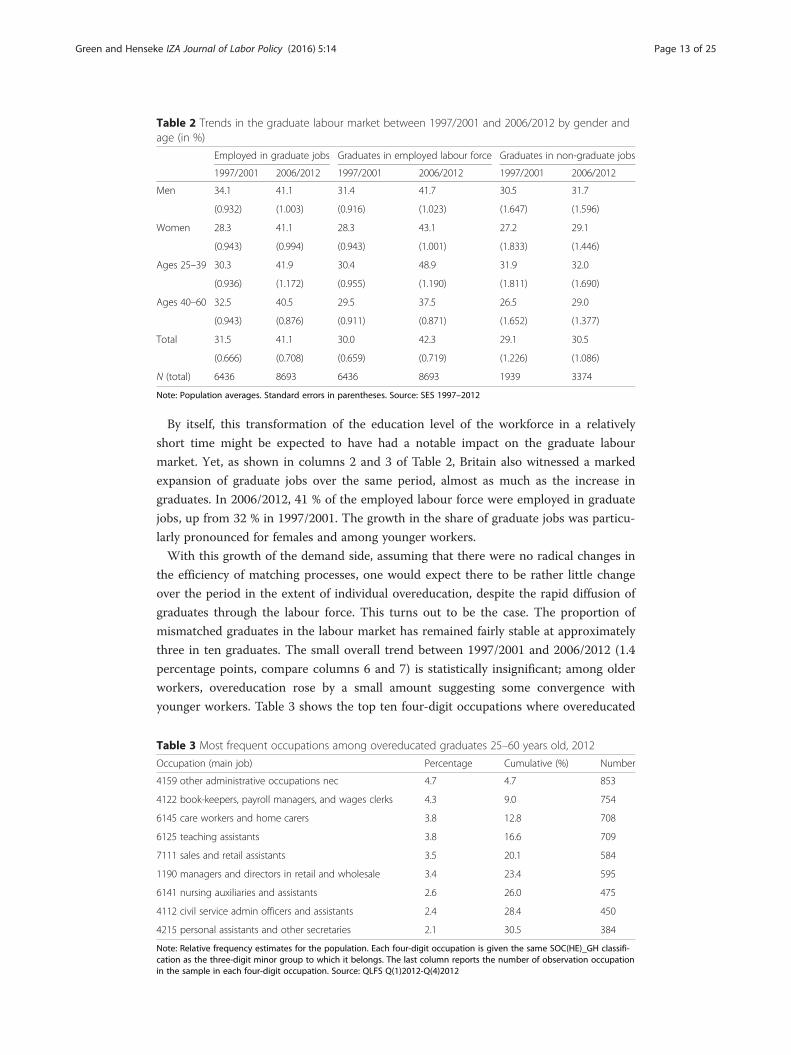
By itself, this transformation of the education level of the workforce in a relatively
short time might be expected to have had a notable impact on the graduate labour
market. Yet, as shown in columns 2 and 3 of Table 2, Britain also witnessed a marked
expansion of graduate jobs over the same period, almost as much as the increase in
graduates. In 2006/2012, 41 % of the employed labour force were employed in graduate
jobs, up from 32 % in 1997/2001. The growth in the share of graduate jobs was particu-
larly pronounced for females and among younger workers.
With this growth of the demand side, assuming that there were no radical changes in
the efficiency of matching processes, one would expect there to be rather little change
over the period in the extent of individual overeducation, despite the rapid diffusion of
graduates through the labour force. This turns out to be the case. The proportion of
mismatched graduates in the labour market has remained fairly stable at approximately
three in ten graduates. The small overall trend between 1997/2001 and 2006/2012 (1.4
percentage points, compare columns 6 and 7) is statistically insignificant; among older
workers, overeducation rose by a small amount suggesting some convergence with
younger workers. Table 3 shows the top ten four-digit occupations where overeducated
Table 2 Trends in the graduate labour market between 1997/2001 and 2006/2012 by gender andage (in %)
Employed in graduate jobs Graduates in employed labour force Graduates in non-graduate jobs
Note: Population averages. Standard errors in parentheses. Source: SES 1997–2012
Table 3 Most frequent occupations among overeducated graduates 25–60 years old, 2012
Occupation (main job) Percentage Cumulative (%) Number
4159 other administrative occupations nec 4.7 4.7 853
4122 book-keepers, payroll managers, and wages clerks 4.3 9.0 754
6145 care workers and home carers 3.8 12.8 708
6125 teaching assistants 3.8 16.6 709
7111 sales and retail assistants 3.5 20.1 584
1190 managers and directors in retail and wholesale 3.4 23.4 595
6141 nursing auxiliaries and assistants 2.6 26.0 475
4112 civil service admin officers and assistants 2.4 28.4 450
4215 personal assistants and other secretaries 2.1 30.5 384
Note: Relative frequency estimates for the population. Each four-digit occupation is given the same SOC(HE)_GH classifi-cation as the three-digit minor group to which it belongs. The last column reports the number of observation occupationin the sample in each four-digit occupation. Source: QLFS Q(1)2012-Q(4)2012
Green and Henseke IZA Journal of Labor Policy (2016) 5:14 Page 13 of 25
graduates were located in 2012: often in major group 4 occupations, such as “other ad-
ministrative occupations”. Sales and retail assistants also figure in the list; for those
under age 30, this is the commonest occupation (12 % of those overeducated).
If graduate jobs have grown substantially, what is the proximate source of this
growth? The growth of graduate jobs is potentially fuelled by two sources. First, there
is the employment expansion in core graduate jobs—those occupations that were and
have remained graduate-level occupations. While technological and organisational
changes are thought to be the primary source of the evolving demand for skill, it is typ-
ically held to be manifested in the asymmetric polarisation of employment. The overall
rise in skill demand is often assessed by this structural change alone. However, while it
seems likely that structural change in the employment share of occupations will be the
main proximate reason for increasing graduate jobs, graduate employment can also
grow as a result of occupational upskilling, reflected by a reclassification of some occu-
pations as graduate jobs which previously were non-graduate jobs. Only a few such
switchers can contribute strongly to the change in graduate jobs, and in Britain, up-
grading occurred with “Social Welfare Associate Professionals”, “Managers in Farming,
Horticulture, Forestry and Fishing”, and “Managers and Proprietors in Other Service
Industries”, while “Sports and Fitness Occupations” were downgraded.
To investigate the relative importance of these two processes, we carried out a stand-
ard decomposition. The change in the proportion of graduate jobs was decomposed
into a component that is due to upskilling of occupations and a second component that
is due to a change in the employment share of existing graduate jobs. Specifically,
Δgl ¼Xj
Δgjl1j þ l2j
2
!þXj
Δljg1j þ g2j
2
!
where Δgl is the growth in employment share of graduate jobs, gj is an indicator (0,1)
of whether occupation j is a graduate occupation, and lj is the employment share of oc-
cupation j in total employment.
The outcome of this exact decomposition is shown in Fig. 3. It shows that some 69 %
(=100 * 6.6/9.6) of the growth in total employment in graduate occupations can be
3.6%2.1% 2.4%
3.4% 3.0%
3.4%
10.3% 9.0%
4.5%6.6%
0.0%
2.0%
4.0%
6.0%
8.0%
10.0%
12.0%
14.0%
Men Women Age<40 Age>=40 ALL
Δ occupational upskilling Δ employment growth
Fig. 3 Decomposing the growing share of graduate jobs. Note: This is an exact decomposition of thechange in graduate employment into a component due to employment growth in existing graduateoccupations and a component arising from upskilling within occupations. Source: SES 1997–2012
Green and Henseke IZA Journal of Labor Policy (2016) 5:14 Page 14 of 25
attributed to expanding employment in the core graduate jobs, with the remaining
31 % due to the increasing number of graduate occupations over time. At least over
this period, then, the extent to which graduate employment rose would be underesti-
mated by almost a third if one looked only at the changing occupational composition
of employment.
It is of interest to examine the relative importance of the two components for the
jobs held by men and women and by younger and older workers. Recent research has
shown the importance of occupational upgrading for women in the recent British
labour market (Lindley 2015). Consistent with that study, we find that some 83 % of
the growing employment in graduate jobs for women is driven by employment expan-
sion in graduate jobs. Underpinning this expansion, prominent examples of fast-
growing occupations where females are concentrated are teaching professionals and
health associate professionals, which were, respectively, 88 and 65 % females in 1997–
2001. By contrast, men have experienced a notably lower level of occupational upgrad-
ing: for them, upgrading contributes only just under a half of the rise in graduate em-
ployment, the rest being due to upskilling within occupations.
Similarly, one might expect a different source pattern according to age group, since
for older workers it is generally more costly to move out of non-growing occupations,
given hiring practices (sometimes discriminatory, according to Riach and Rich 2010)
that could favour younger workers in the growing skilled occupations, and the import-
ance of occupation-specific and firm-specific skills for older workers (Autor and Dorn
2009). On the other hand, we have no particular priors about how the extent of within-
job upskilling varies with the age of the worker. As Fig. 3 shows, consistent with this
expectation, graduate employment growth is greater for those aged under 40. It also
turns out that upskilling and reclassification is a slightly more important driver for the
jobs held by older workers.
A note of caution is needed with these decompositions and the overall growth rate of
graduate jobs. Because of the fuzziness of any dichotomous graduate job classifier, the
number of occupations crossing the threshold is inevitably somewhat sensitive, both to
sampling variation and to choice of clustering technique. Yet we can be confident that,
if medium-term upskilling is measured solely through changes in the employment com-
position of occupations—the common method—it becomes subject to potentially sub-
stantial errors.
Equally, if one were to use one of the existing graduate job classifiers based on occu-
pation major groups, one would obtain a somewhat different picture of the graduate
labour market, even if the broad picture of growth in both graduate jobs and the share
of graduates remains the same. For example, with the traditional classifier (groups 1
and 2), among men, the proportion doing graduate jobs changed little (and not signifi-
cantly) from 33 to 35 %, and the proportion of male graduates who were overeducated
according to this definition rose significantly from 38 to 43 %.11 Such a difference from
our main findings of unchanged overeducation in Table 2 illustrates the importance of
the chosen indicator.
5 The changing wage differentials of matched and mismatched workersWhile graduate overeducation has not, as some feared, rapidly expanded in the decade
following 1997/2001, following the continued growth of graduate jobs, the polarising
Green and Henseke IZA Journal of Labor Policy (2016) 5:14 Page 15 of 25
structure of employment overall nevertheless gives possible cause to expect some in-
creasing differentiation. Moreover, the end of this period encompassed the disruptions
of the Great Recession from 2008. Those attaining graduate jobs might be expected to
have fared as well or better than before, given the maintained demand for high-skilled
jobs at the end of the period. However, the consequences of overeducation of graduates
could have deteriorated. In this section and the next, we study the outcomes. First, we
investigate whether the graduate pay premium has become more differentiated. What
has happened to the relative rewards of graduates? We examine this question, both
with conventional quantile regressions to capture differentiation according to the size
of the wage residual (sometimes taken as a signal of unobserved ability) and by investi-
gating changes in the penalty for graduates’ overeducation. Second, in the next section,
we examine changes in the extent to which overeducation persists.
Table 4 presents a quantile regression analysis of the premium for tertiary education,
relative to those at education level 2 (lower secondary). As can be seen, point estimates
of the median returns increased for men but barely at all for women. The returns rose
at the top quartile, significantly so for men. At the lowest quartile, however, returns fell
significantly for women, while remaining steady for men. The net effect is that, for both
sexes, there was a widening gap between the returns at the highest and lowest quartiles
of the residual distribution. In both cases, the change is statistically significant. The re-
sidual is typically attributed to unobserved factors that may include both ability and
match quality.
A process of differentiation can also be seen in the evolving penalty for overeduca-
tion. To study this, we utilised the SES data and SOC(HE)2000_GH to run Mincer-type
wage regressions among graduates for log hourly pay on an overeducation dummy, and
Table 4 Relative returns to tertiary education over lower secondary education at different quartilesof the log wage distribution
p25 p50 p75
All (N = 13,060)
P1 (1997/2001) 0.473*** 0.500*** 0.510***
(0.0202) (0.0186) (0.0195)
P2 (2006/2012) 0.420*** 0.538*** 0.586***
(0.0250) (0.0188) (0.0275)
Men (N = 6509)
P1 (1997/2001) 0.392*** 0.453*** 0.491***
(0.0308) (0.0236) (0.0290)
P2 (2006/2012) 0.407*** 0.531*** 0.541***
(0.0358) (0.0306) (0.0410)
Women (N = 6551)
P1 (1997/2001) 0.519*** 0.541*** 0.551***
(0.0249) (0.0254) (0.0309)
P2 (2006/2012) 0.417*** 0.547*** 0.583***
(0.0286) (0.0246) (0.0252)
Note: Reported figures are the marginal effects of tertiary education on log real hourly pay over lower secondaryeducation at the first, second, and third quartiles of the earnings distribution after controlling for age, age squared, sex(pooled model only), dummies for ethnicity (Asian, African, other, missing, and White as reference group), marital status,indicator for dependent children in the household, and a London dummy. Data from SES for the whole workforce in theage bracket 25–60. All models use survey weights. *p < .1; **p < .05; ***p < .01
Green and Henseke IZA Journal of Labor Policy (2016) 5:14 Page 16 of 25
period dummy to capture both trends and any interaction with overeducation, and a
set of common control variables (age, age squared, marital status, presence of
dependent children, region, survey year, and sex for the pooled model). The findings
are shown in Table 5.
Consistent with other studies, the log wage penalty of mismatched (i.e. overeducated)
graduates relative to matched graduates was significant and sizable, being 38 log points in
1997–2001. What we are primarily interested in, however, is how this penalty changed: by
2006–2012, it had risen to a hefty 49 log points. The final row summarises how the log
wage penalty changed between periods, both overall and separately by gender. As can be
seen from the first row, the penalty increased overall by 11 log points. The increase was
similar in magnitude for men and women, though not quite statistically significant for men:
it had risen by the end of the period to 45 log points for men and 52 log points for women.
One might ask how this 11-point rising penalty for overeducation is reflected in the
changing returns for matched and non-matched graduates (as compared with matched
non-graduates). To compute this, we also ran regressions comprising the full sample of
graduates and non-graduates. The analysis (not shown here) indicated that the pre-
mium for matched graduates over matched non-graduates increased significantly by 5
points, which might be argued to be consistent with the persistence of skill-biased
technological change over this period, while at the same time, there was a 6-point sig-
nificant fall in the premium for mismatched graduates. This pattern of change parallels
the changing quartile returns shown in the analysis of Table 4.
The caveat to these analyses, as for other studies in the literature, is that overeduca-
tion status may be endogenous, reflecting either heterogeneous skills among graduates
or other unobserved factors that also affect pay. Some studies have shown, for example,
that workers with lower skill levels—measured by an external indicator such as test per-
formance or math certification—experience a somewhat enhanced risk of being overed-
ucated (Green and McIntosh 2007; McGuinness and Bennett 2007; Chevalier and
Lindley 2009). These studies establish that overeducation may be partly a consequence
of low skill, but by no means entirely so. In our own conclusions about the changing
penalty, we are implicitly assuming that any endogeneity bias in the estimated overedu-
cation penalty did not substantively change between the two periods.12
Table 5 Change in log wage penalty for mismatched over matched graduates between 1997–2001 and 2006–2012
(1) (2) (3)
All Men Women
1997–2001 −0.375*** −0.353*** −0.406***
(0.0297) (0.0424) (0.0393)
2006–2012 −0.485*** −0.448*** −0.521***
(0.0269) (0.0436) (0.0289)
Change −0.110*** −0.095 −0.114**
(0.0401) (0.0609) (−0.0488)
N 4553 2266 2287
Notes: Estimation model: ln yið Þ ¼ α1⋅OEi þ α2⋅T þ α3 OEi⋅Tð Þ þ X ′iβ þ ei . y is real log hourly pay, OE is the dummy
for overeducation, T is a (0/1) time dummy capturing the two periods, and X comprises controls for age, age squared, sex(pooled model only), dummies for ethnicity (Asian, Black, other, missing, and White as reference group), marital status,indicator for dependent children in the household, and a London dummy. The interaction coefficient picks up thechange over time in the overeducation wage penalty. *p < .1; **p < .05; ***p < .01
Green and Henseke IZA Journal of Labor Policy (2016) 5:14 Page 17 of 25
Thus, the prevalence of overeducation might not have altered very much, as the pre-
vious analysis of Table 2 shows. Moreover, the wage premium for higher education,
where it secures a graduate job, has improved. As expected, however, consequent upon
the broader structural changes, the wage differences between matched and mismatched
graduates have become more marked. If one were to view the chances of being overed-
ucated, conditional on graduation, as to a considerable extent a matter of chance, then
the risks have also increased.
6 The persistence of skills mismatchWe now turn to the dynamics of graduate skills mismatch and ask whether the experi-
ence of overeducation in recent years has been subject to a substantial and changing
level of state dependency. Whether graduate overeducation is a matter of concern (pri-
vate or public) depends in part on its persistence. Thus, policy is unlikely to be called
on if in most cases overeducated graduates remain in this state only for short periods.
If, however, most become stuck in non-graduate jobs—perhaps due to lack of work-
place learning opportunities—the efficiency, welfare, and policy implications become
greater. Such concerns are augmented where non-employed graduates gaining employ-
ment transition to non-graduate jobs.
Unfortunately, previous studies in a range of countries have found that under-
utilisation of either qualifications or skills is persistent to a large extent, though
with some variation over the type of education and age group (Sloane et al. 1999;
Carroll and Tani 2013; Kiersztyn 2013; Mavromaras and McGuiness 2012). Some
specifically test and reject the “career mobility” interpretation of overeducation,
under which overeducation is expected to be temporary (Korpi and Tåhlin 2009;
Baert et al. 2013).
At the end of the 1990s, Britain’s mismatched graduates faced a steadily growing
economy and a buoyant labour market with falling unemployment. This outlook con-
trasts with that confronting graduates from 2006 to 2012, most of which was domi-
nated by the Great Recession. By that time, as seen in Table 2, the aggregate balance
between graduate jobs and the stock of graduates had slipped from slightly positive to
slightly negative territory. Moreover, economic stagnation and rising unemployment in-
dicate fewer new job openings, hence fewer opportunities for overeducated graduates
to progress to a graduate job, as well as fewer opportunities for those out of work to
find graduate jobs. We hypothesised, therefore, first that the state of graduate overedu-
cation would have become more difficult to escape from than it had been between
1997 and 2001 and second that for those graduates not in work, more would find
themselves transitioning into non-graduate jobs.
To investigate how persistent is graduate overeducation, we used ISCO(HE)88_GH
to describe graduates’ transitions between work statuses, using an unbalanced panel of
graduates in the BHPS/UKHLS in the age bracket 25 to 60 years during the years
1997–2001 and 2006–2012. We considered three states: non-employment, in work but
mismatched (overeducated), and in work in a graduate job. Table 6 presents year-on-
year transition matrices.13
It can be seen that, among men, just over 11 % of mismatched workers found a
matched job 1 year later over 1997–2001: a significant but small minority. Remarkably,
this figure had not changed by the second period. Similarly, persistence for female
Green and Henseke IZA Journal of Labor Policy (2016) 5:14 Page 18 of 25
graduates remained at above 80 %. Comparing the younger and older age groups, the
chances of escaping mismatch status were greater for the young (13 %) than for the old
(6 %), but again, these figures barely changed between the periods. Thus, our first hy-
pothesis is not confirmed: the escape velocity from mismatch status, already low in
1997–2001, did not decrease further by 2006–2012. Even though this period was domi-
nated by a major recession, there remained a sufficient turnover of graduate jobs to
offer some opportunities for graduates to move to better jobs.
Consistent with the second hypothesis, however, the table shows a deterioration in
the prospects for non-employed graduates. Especially for men, fewer moved into em-
ployment a year later and there was a substantive decline, from 25 to 16 %, in the pro-
portion of non-employed graduates who moved into graduate jobs. Since the decline in
transitions to non-graduate jobs was much smaller, it is apparent that relatively fewer
graduates gaining employment were moving into graduate jobs.
One might ask whether this decline is explained by compositional changes in the
characteristics of male workers between periods. Accordingly, we also estimated a
model of the transition controlling for demographic characteristics and for initial con-
ditions; the results are shown in Table 7. The findings suggest that part of the transition
into graduate jobs is indeed linked to demographic and other individual characteristics.
However, the fall between periods (shown in the third row) is significant, and its magni-
tude is even enhanced after controls and initial conditions are included in the model.
We conclude that there was a genuine decline in the ability of graduates, once out of
employment, to move into graduate jobs.
Table 6 Annual transitions between labour market states, 1997–2001 and 2006–2012 (in %)
Note: Transition matrix based on data from an unbalanced panel of economically active and inactive graduatesaged 25–60 years from BHPS waves 7–18 and UKHLS waves 2–4
Green and Henseke IZA Journal of Labor Policy (2016) 5:14 Page 19 of 25
7 ConclusionsUsing a new and validated method for classifying occupations into graduate jobs or
non-graduate jobs, this paper has investigated changes in the graduate labour market in
Britain between 1997/2001 and 2006/2012. In addition to the method and outcome in-
dicator of the classification process, the paper contributes novel evidence on a number
of fronts:
i. There was a very substantial growth, from 32 to 41 %, in the share of graduate jobs
in Britain. Overall, employment growth of existing graduate occupations (at the
minor group level) contributed most to the graduate job growth, the rest being due
to upskilling and consequent reclassification of a small number of jobs as graduate.
ii. While there was slightly greater growth in the supply of graduates, from 30 to 42 %
of the employed labour force, the overall prevalence of overeducated graduates was
stable at around 30 %. In particular, the massive influx of graduates into the labour
force in the age bracket 25–39 years was absorbed with no increase in
overeducation.
iii. The returns to graduation became more dispersed, with those at the upper quartile
of the residual distribution increasing, while those at the lowest quartile have fallen.
iv. Similarly, the premium for matched graduates increased, while that for mismatched
graduates decreased, with the result that the wage gap between matched and
mismatched graduates—the overeducation penalty—increased by 11 log points.
v. There has been no change in the degree of state dependence in overeducation
status after 1 year, which has remained high. However, for non-employed male
graduates moving into employment, the chances of entering a graduate job
decreased.
Both our new classifier of graduate jobs and the concept itself have some limitations
which we have noted. The indicator depends on the reliability of self-reported task
measures. The methodology can only be followed where suitable data sets with task
Table 7 Change in the probability for male graduates to move from non-employment to graduatework: marginal effects of non-employment in (t–1) on graduate work in t
t (1) (2) (3)
1997–2001 −0.521*** −0.486*** −0.166***
(0.0283) (0.0303) (0.0417)
2006–2012 −0.629*** −0.600*** −0.309***
(0.0219) (0.0242) (0.0405)
Difference −0.108*** −0.113*** −0.142***
(0.0358) (0.0383) (0.0522)
Demographics X X
Initial conditions X
N 6862 6862 6801
Note: Results from a multinomial probit model: P Jbstatð Þ ¼ α1 � lue þ α2 � period þ α3 lue � periodð Þ þ βX þ e.Marginal effects calculated for the transition from lagged non-employment to graduate work. Model (2) includes dummyfor ages >40, non-White ethnicity, married, children under 16 in the household, and residence in London or the South-East. Model (3) adds the initial value of the dependent variable and within-panel means of time-varying variables as wellas the initial values of time-varying values to the list of covariates to address the initial condition problem and correla-tions between observed and unobserved individual characteristics following Wooldridge (2005) and Rabe-Hesketh andSkrondal (2013). Standard errors in parentheses. *p < .1; **p < .05; ***p < .01
Green and Henseke IZA Journal of Labor Policy (2016) 5:14 Page 20 of 25
and educational requirement data are available and where cell sizes are reasonable at
least at the three-digit level; accordingly, while the classification can be applied to any
contemporaneous data that includes the same occupation codes, the classification
methodology is specific to each task-based data set. The classification is not as simple
as, for example, describing graduate jobs through occupational major groups. Neverthe-
less, unlike expert-based evaluations of occupations, the statistically driven method-
ology is transparent and our classifier could be reproduced by other researchers (our
data is available on the UK Data Archive). The indicator performs better than or as well
as other available indicators in criterion validity tests.
The concept of a graduate job is also, as discussed in Section 2, somewhat fuzzy.
Nevertheless, it is widely deployed in public discourse, and the analytical value of any
graduate job classifier should be judged from its potential usefulness for understanding
change in graduate labour markets. A knowledge of the distribution and trend in
graduate jobs, as well as their varied pay, helps to inform the conditions surrounding
private investment in tertiary human capital—something that is especially useful at a
time of rising uncertainty about future skill demands of technology and (in the case of
Britain) of increasing student debt following the raising of tuition fees in 2012 to
£9000.
In this context, SOC(HE)_GH appears to yield a plausible analysis of changes in the
first decade of this century, which can complement the picture obtained from calcula-
tions of rates of return. The growth of graduate jobs kept up with the growth of gradu-
ates, but the differentiation trend would appear to be raising the risks associated with
an investment in college, altering thereby the potential contribution of growing tertiary
education to raising social mobility. The demonstrated risks are embodied in two
forms: the chances of being in the lower quartile of the (graduate) pay distribution and
the chances of being—and remaining—overeducated with its accompanying wage pen-
alty. While these are separate risks, they are related by the fact that overeducated grad-
uates are more likely to be in the lower parts of the distribution. Moreover, both
manifestations of risk show increases, consistent with the macro-level drivers noted in
the introduction: the relative diminution of middle-level jobs over the long term and
the effect of the Great Recession. And, while we found no structural change in the skills
used in graduate jobs over the period, massification of higher education might itself be
leading to increasing heterogeneity in graduate skills.
The findings also demonstrate how estimates of upskilling derived from changing oc-
cupational composition could be downward-biased in a decade where there has been
some net upgrading of occupations and vice versa if there develops a downskilling
trend as has been suggested for the USA (Beaudry et al. 2016). An adequate graduate
job classifier, using the methodology proposed here, will help to understand both the
distribution of high-skills demand and its growth. With the ongoing massification of
higher education worldwide, the supply of graduates will grow for at least the next two
decades, but the expansion of graduate jobs is more uncertain, given uncertainty over
future technologies, including predictions that the so-called fourth industrial revolution
may radically alter the demand for labour. A good understanding of graduate labour
markets is likely therefore to become even more important. Trends and distributions of
graduate jobs could be analysed for any population where suitable task-based and edu-
cational requirement data are available, such as Germany or the USA. If the OECD’s
Green and Henseke IZA Journal of Labor Policy (2016) 5:14 Page 21 of 25
Survey of Adult Skills is repeated with sufficient consistency after a decade, an analysis
of the trend in graduate jobs in multiple countries would be highly informative.
Endnotes1Here and throughout, we refer to “skills” in a broad sense, to embrace knowledge
and attitudes as well as technical capabilities (Green 2013, Chap. 2).2The term “job” is in this paper described by the three-digit occupation group (rather
than the individual contracts that employers and employees enter into). See Green and
Henseke (2014) for a parallel approach using unit groups at the four-digit level. The al-
ternative would be to treat each individual employment contract as a job. Using
individual-level data, some studies classify individual jobs according to whether gradu-
ates perceive their skills are being utilised (Smetherham 2006); such indices are inher-
ently not transferable to other data sets.3For this reason, some researchers derive fuzzy indicators of educational mismatch,
derived from latent variable analyses (Betti et al. 2011). Beyond the critique of existing
indicators developed here, a pure human capital approach might question the use of
any demand-side concept such as “graduate job”, given non-zero substitutability in pro-
duction; we take the view that demand-side concepts, given their explanatory power,
complement the human capital approach.4We have added the suffix “EP” in order to distinguish this classifier from the one we
develop below.5Full details of these surveys, which have all been placed in the UK Data Archive, can
be found at Ashton and Felstead (1998), Felstead et al. (2002, 2007), and Felstead and
Green (2008) and for the 2012 survey in Felstead et al. (2013) at http://www.cardiff.ac.uk/
socsi/ses2012/.6http://www.ons.gov.uk/ons/index.html7A special situation arises in a few cases where workers state that a post-graduate
level is required to get the job, but not necessary to perform it. It is plausible to assume
that a qualification at first-degree level or similar will be nonetheless essential or fairly
necessary to carry out the job tasks. We therefore replace the value of the binary vari-
able with the value 1 in such situations.8It is for this reason that the OECD Survey of Adult Skills used frequencies for the
response frames to task questions, since these were held to be less susceptible to cul-
tural/cross-national bias than an “importance” scale.9The threshold is taken to be time invariant, on the assumption, implicit in most re-
search on returns to higher education, that the standard of higher education has not
changed over the time period. While the latter is hard to test, absent skills data for
graduates in the two periods, we included a period dummy in the relationship that was
computed at stage 2 between the GSR and the tertiary educational requirement. The
result implied that there has been no substantive or significant change in the level of
skills that employers expect when requiring their employees to have degrees.10We also explored alternative approaches to derive an empirical classification of
graduate jobs (see Green and Henseke 2014 for details). These fared only slightly worse
in the validation procedure than SOC(HE)_GH.11Using the Gottschalk-Hansen classification approach also found a decrease in the
prevalence of graduate jobs and a rise in overeducation during the 2000s.
Green and Henseke IZA Journal of Labor Policy (2016) 5:14 Page 22 of 25
12As one check, by including a period dummy, we tested whether there was a change,
between time periods, in the relationship between required skills and the GSR index
used to derive the classifier. There was no significant change.13Moving to dependent interviewing caused a mid-2000s break in year-on-year occu-
pational mobility estimates from BHPS (Perales 2014). Following Longhi and Brynin
(2010) for period 1, we classified occupational switches as genuine only where the
current job started after the last interview.
Additional file
Additional file 1: This additional file gives further details of the procedures used for generating thegraduate job classifier (SOC(HE)_GH) used in the paper, lists graduate and non-graduate jobs within majoroccupation groups 1–4, and presents additional criterion validity tests of SOC(HE)2010_GH against existinggraduate job indicators used elsewhere.
Competing interestsThe IZA Journal of Labor Policy is committed to the IZA Guiding Principles of Research Integrity. The authors declarethat they have observed these principles.
AcknowledgementsWe would like to thank Claire Callender for her helpful comments on an earlier draft of the paper. We are alsothankful to the anonymous referees and editor for the useful remarks.Responsible editor: David Neumark
FundingThis study was funded by a grant to the LLAKES Centre, UCL Institute of Education, by the UK Commission forEmployment and Skills through its strategic partnership with the Economic and Social Research Council.
Received: 4 February 2016 Accepted: 20 May 2016
ReferencesAcemoglu D, Autor D (2011) Skills, tasks and technologies: implications for employment and earnings. Handb Labor
Econ 4:1043–1171Allen J, Van der Velden R (Eds) (2011) The flexible professional in the knowledge society: New challenges for higher
education. Springer Science & Business MediaAltonji JG, Blom E, and Meghir C (2012). Heterogeneity in human capital investments: high school curriculum, college
major, and careers (No. w17985). National Bureau of Economic Research.Ashton D, Felstead A (1998) Organisational characteristics and skill formation in Britain: is there a link?, Working Paper
22. Leicester University, Centre for Labour Market StudiesAutor D, Dorn D (2009) The skill content of jobs and the evolution of the wage structure—this job is “getting old”:
measuring changes in job opportunities using occupational age structure. Am Econ Rev 99(2):45Autor DH, Levy F, Murnane RJ (2003) The skill content of recent technological change: an empirical exploration. Q J
Econ 118(4):1279–1333Baert S, Cockx B, Verhaest D (2013) Overeducation at the start of the career: stepping stone or trap? Labour Econ 25:
123–140Beaudry P, Green DA, Sand BM (2016) The great reversal in the demand for skill and cognitive tasks. J Labor
Econ 34(1, pt 2):S199–S247Betti G, D’Agostino A, Neri L (2011) Educational mismatch of graduates: a multidimensional and fuzzy indicator. Soc
Indic Res 103(3):465–480Bukodi E, Goldthorpe J (2011) Social class returns to higher education: chances of access to the professional and
managerial salariat for men in three British birth cohorts. Longit Life Course Stud 2(2):185–201Cardoso AR (2007) Jobs for young university graduates. Econ Lett 94(2):271–277Carroll D, Tani M (2013) Over-education of recent higher education graduates: new Australian panel evidence. Econ
Educ Rev 32:207–218Chevalier A, Lindley J (2009) Overeducation and the skills of UK graduates. J R Stat Soc Ser A Stat 172(2):307–337Dustmann C, Ludsteck J, and Schönberg U (2009). Revisiting the German wage structure. Q J Econ, 124(2):843–881Elias P, McKnight A (2001) Skill measurement in official statistics: recent developments in the UK and the rest of Europe.
Oxf Econ Pap 53(3):508–540Elias P, Purcell K (2004a) Is mass higher education working? Evidence from the labour market experiences of recent
graduates. Natl Inst Econ Rev 190(1):60–74Elias P, Purcell K (2004b) SOC (HE): a classification of occupations for studying the graduate labour market, Research
Graduate Careers Seven Years On, Research Paper., p 6Elias P, Purcell K (2013) Classifying graduate occupations for the knowledge society, Institute for Employment Research.
University of Warwick. Futuretrack working paper, 5Everitt BS, Landau S, Leese M (2001) Cluster analysis. Arnold, A member of the Hodder Headline Group, London
Green and Henseke IZA Journal of Labor Policy (2016) 5:14 Page 23 of 25
Felstead A, Green F (2008) Skills at work in Scotland, 1997 to 2006. Glasgow, Scottish EnterpriseFelstead A, Gallie D, Green F (2002) Work skills in Britain 1986-2001. DfES Publications, Nottingham, p 160Felstead A, Gallie D, Green F, Zhou Y (2007) Skills at work, 1986-2006. University of Oxford, SKOPEFelstead A, Gallie D, Green F, Inanc H (2013) Skills at work in Britain. Centre for Learning and Life Chances in
Knowledge Economies and Societies, Institute of Education, LondonFernández-Macías E (2012). Job polarization in Europe? Changes in the employment structure and job quality,
1995-2007. Work and Occupations, 0730888411427078.Figueiredo H, Teixeira P, Rubery J (2011) Is mass higher education working?., An Update and a Reflection on the
Sustainability of Higher Education Expansion in Portugal, (No. 14)Figueiredo H, Teixeira P, Rubery J (2013) Unequal futures? Mass higher education and graduates’ relative earnings in
Portugal, 1995–2009. Appl Econ Lett 20(10):991–997Gathmann C, Schönberg U (2010) How general is human capital? A task-based approach. J Labor Econ 28(1):1–49Goos M, Manning A, Salomons A (2014) Explaining job polarization: routine-biased technological change and
offshoring. Am Econ Rev 104(8):2509–2526Gottschalk P, Hansen M (2003) Is the proportion of college workers in noncollege jobs increasing? J Labor Econ 21(2):449–471Green F (2012) Employee involvement, technology and evolution in job skills: a task-based analysis. Ind Labor Relat Rev
65(1):36–67Green, F. (2013). Skills and skilled work: an economic and social analysis. Oxford University Press, ParisGreen F, Henseke G (2014) The changing graduate labour market: analysis using a new indication of graduate jobs,
LLAKES Research Paper., p 50Green F, James D (2003) Assessing skills and autonomy: the job holder versus the line manager. Hum Resour Manag J
13(1):63–77Green F, McIntosh S (2007) Is there a genuine under-utilization of skills amongst the over-qualified? Appl Econ
39(4):427–439Green F, Zhu Y (2010) Overqualification, job dissatisfaction, and increasing dispersion in the returns to graduate
education. Oxf Econ Pap 62(4):740–763Green A, Green F, Pensiero N (2015) Cross-country variation in adult skills inequality, Why are the Anglophone
Countries so unequal? Comparative Education Review. AutumnGroom B (2013) Half of recent graduates are in non-graduate jobs, Financial Times, November 19th
Hoekstra M (2009) The effect of attending the flagship state university on earnings: a discontinuity-based approach.Rev Econ Stat 91(4):717–724
Jürges H (2007) True health vs response styles: exploring cross-country differences in self-reported health. Health Econ16(2):163–178
Kiersztyn A (2013) Stuck in a mismatch? The persistence of overeducation during twenty years of the post-communisttransition in Poland. Econ Educ Rev 32:78–91
Korpi T, Tåhlin M (2009) Educational mismatch, wages, and wage growth: overeducation in Sweden, 1974–2000. LabourEcon 16(2):183–193
Kuczera M, Field S, Windisch HC (2016) Building skills for all: a review of England. Policy insights from the Survey OfAdult Skills. OECD, Paris
Lindley J (2015) Gender differences in job quality. In: Green F, Felstead A, Gallie D (eds) Unequal Britain at work. Theevolution and distribution of job quality. Oxford University Press, Oxford, pp 42–61
Lindley JK, Machin S (2014) Spatial changes in labour market inequality. J Urban Econ 79:121–138Little B, Braun E, Tang WY (2008) Competences possessed and required by European graduates REFLEX Report to
HEFCE No 4Longhi S, Brynin M (2010) Occupational change in Britain and Germany. Labour Econ 17(4):655–666Lui HK, Suen W (2005) The shrinking earnings premium for university graduates in Hong Kong: the effect of quantity or
quality? Contemp Econ Policy 23(2):242–254Machin S, McNally S (2007) Tertiary education systems and labour markets, Education and Training Policy Division, OECDMacmillan, L., Tyler, C., and Vignoles, A. (2015). Who gets the top jobs? The role of family background and networks in
recent graduates’ access to high-status professions. J Soc Policy 44(03):487–515Martins PS, Pereira PT (2004) Does education reduce wage inequality? Quantile regression evidence from 16 countries.
Labour Econ 11(3):355–371Mason G, Williams G, Cranmer S (2009) Employability skills initiatives in higher education: what effects do they have on
graduate labour market outcomes? Educ Econ 17(1):1–30Matthes B, Christoph B, Janik F, Ruland M (2014) Collecting information on job tasks—an instrument to measure tasks
required at the workplace in a multi-topic survey. J Lab Mark Res 47(4):273–297Mavromaras K, McGuinness S (2012) Overskilling dynamics and education pathways. Econ Educ Rev 31(5):619–628McGuinness S (2006) Overeducation in the labour market. J Econ Surv 20(3):387–418McGuinness S, Bennett J (2007) Overeducation in the graduate labour market: a quantile regression approach. Econ
Educ Rev 26(5):521–531Milburn A (2009) Unleashing aspiration: the final report of the panel on fair access to the professionsNeumark D, Johnson H, Mejia MC (2013) Future skill shortages in the U.S. economy? Econ Educ Rev 32:151–167O’Leary NC, Sloane PJ (2014) Too many graduates? An application of the Gottschalk-Hansen model to young British
graduates between 2001-2010, IZA Discussion Paper., p 8413OECD. (2013). OECD Skills Outlook 2013: first results from the Survey of Adult Skills. OECD Publishing, ParisONS (2013) Full report—graduates in the UK labour market 2013Perales F (2014) How wrong were we? Dependent interviewing, self-reports and measurement error in occupational
mobility in panel surveys. Longit Life Course Stud 5(3):299–316Pierre G, Sanchez Puerta ML, Valerio A, Rajadel T (2014) STEP skills measurement surveys: innovative tools for assessing skillsRabe-Hesketh S, Skrondal A (2013) Avoiding biased versions of Wooldridge’s simple solution to the initial conditions
problem. Econ Lett 120(2):346–349
Green and Henseke IZA Journal of Labor Policy (2016) 5:14 Page 24 of 25
Riach PA, Rich J (2010) An experimental investigation of age discrimination in the English labor market, Annals ofEconomics and Statistics/Annales d’Économie et de Statistique., pp 169–185
Salvatori A (2015) The anatomy of job polarisation in the UK., IZA Discussion Papers, (No. 9193)Scurry T, Blenkinsopp J (2011) Under-employment among recent graduates: a review of the literature. Pers Rev
40(5):643–659Sloane PJ, Battu H, Seaman PT (1999) Overeducation, undereducation and the British labour market. Appl Econ
31(11):1437–1453Smetherham C (2006) Firsts among equals? Evidence on the contemporary relationship between educational
credentials and the occupational structure. J Educ Work 19(1):29–45Sullivan P (2009) Estimation of an occupational choice model when occupations are misclassified. J Hum Resour
44(2):495–535University of Essex (2010) Institute for Social and Economic Research, British Household Panel Survey: waves
1-18, 1991-2009 [computer file], 7th edn. UK Data Archive [distributor], Colchester, Essex, SN: 5151University of Essex (2014) Institute for Social and Economic Research and NatCen Social Research, Understanding
Society: waves 1-4, 2009-2013 [computer file], 6th edn. UK Data Archive [distributor], Colchester, Essex, SN: 6614Verdugo RR, and Verdugo NT (1989). The impact of surplus schooling on earnings: some additional findings. J Hum
Resour, 24(4):629-643Wilton N (2012) The impact of work placements on skills development and career outcomes for business and
management graduates. Stud High Educ 37(5):603–620Wooldridge JM (2005) Simple solutions to the initial conditions problem in dynamic, nonlinear panel data models with
unobserved heterogeneity. J Appl Econ 20(1):39–54
Submit your manuscript to a journal and benefi t from:
7 Convenient online submission
7 Rigorous peer review
7 Immediate publication on acceptance
7 Open access: articles freely available online
7 High visibility within the fi eld
7 Retaining the copyright to your article
Submit your next manuscript at 7 springeropen.com
Green and Henseke IZA Journal of Labor Policy (2016) 5:14 Page 25 of 25