The Changing Nature of Network Trafl:ic: Scaling Phenomena A. Feldmann, A.C. Gilbert* W. Willingertand T.G. Kurtz Abstract In this paper, we report on some preliminary results from an in-depth, wavelet-based analysis of a set of high-quality, packet-level traffic measurements, collected over the last 6-7 years from a number of different wide-area networks (WANs). We first validate and confirm an earlier finding, originally due to Paxson and Floyd [14], that actual WAN traffic is consistent with statistical self-similarity for sufficiently large time scales. We then relate this large-time scaling phenomenon to the empirically ob- served characteristics of WAN traffic at the level of individual connections or applications. In particular, we present here original results about a detailed statistical analysis of Web-session characteristics, and report on an intriguing scaling property of measured WAN traffic at the transport layer (i.e., number of TCP connection arrivals per time unit). This scaling property of WAN traffic at the TCP layer was absent in the pre-Web period but has become ubiquitous in today's WWW-dominated WANs and is a direct consequence of the ever-increasing popularity of the Web (WWW) and its emergence as the major contributor to WAN traffic. Moreover, we show that this changing nature of WAN traffic can be nat- urally accounted for by self-similar traffic models, primarily because of their ability to provide physical explanations for empirically observed traffic phenomena in a networking context. Finally, we provide empirical evidence that actual WAN traffic traces also exhibit scaling properties over small time scales, but that the small-time scaling phenomenon is distinctly different from the observed large-time scaling property. We relate this newly observed characteristic of WAN traffic to the effects that the dominant network protocols (e.g., TCP) and controls have on the flow of packets across the network and discuss the potential that multifractals have in this context for providing a structural modeling approach for WAN traffic and for capturing in a compact and parsimonious manner the observed scaling phenomena at large as well as small time scales. 1 Introduction Self-similar traffic modeling has, from the beginning, emphasized the need for physical-based or struc- tural approaches for understanding and describing actual network traffic dynamics. Structural models, as discussed in [19], attempt to implicitly take into account the complex hierarchical structure of modern computer communications networks and the intertwined networking mechanisms that determine the nature of the traffic which these networks carry. These structural models are different from the "black box" or "operational" traffic models which were popular in the past. The main objective of this paper is to improve our current understanding of the dynamic nature of traffic carried over wide-area networks (WANs) such as the Internet and to outline new structural modeling approaches for WAN traffic that are consistent with actual measurements. In particular, we (i) identify *This Research was supported by the NSF Grant DMS-9705665 at Yale University and AT&T Labs-Research, Florham Park, NJ. tThis research was partially supported by the NSF Grant NCR-9628067 at the University of California at Santa Cruz. ACM SIGCOMM 5 Computer Communication Review
Transcript
The Changing Nature of Network Trafl:ic: Scaling Phenomena
A. F e l d m a n n , A.C. Gilbert* W. Wi l l inger tand T .G. K u r t z
A b s t r a c t
In this paper, we report on some preliminary results from an in-depth, wavelet-based analysis of a set of high-quality, packet-level traffic measurements, collected over the last 6-7 years from a number of different wide-area networks (WANs). We first validate and confirm an earlier finding, originally due to Paxson and Floyd [14], that actual WAN traffic is consistent with statistical self-similarity for sufficiently large time scales. We then relate this large-time scaling phenomenon to the empirically ob- served characteristics of WAN traffic at the level of individual connections or applications. In particular, we present here original results about a detailed statistical analysis of Web-session characteristics, and report on an intriguing scaling property of measured WAN traffic at the transport layer (i.e., number of TCP connection arrivals per time unit). This scaling property of WAN traffic at the TCP layer was absent in the pre-Web period but has become ubiquitous in today's WWW-dominated WANs and is a direct consequence of the ever-increasing popularity of the Web (WWW) and its emergence as the major contributor to WAN traffic. Moreover, we show that this changing nature of WAN traffic can be nat- urally accounted for by self-similar traffic models, primarily because of their ability to provide physical explanations for empirically observed traffic phenomena in a networking context. Finally, we provide empirical evidence that actual WAN traffic traces also exhibit scaling properties over small time scales, but that the small-time scaling phenomenon is distinctly different from the observed large-time scaling property. We relate this newly observed characteristic of WAN traffic to the effects that the dominant network protocols (e.g., TCP) and controls have on the flow of packets across the network and discuss the potential that multifractals have in this context for providing a structural modeling approach for WAN traffic and for capturing in a compact and parsimonious manner the observed scaling phenomena at large as well as small time scales.
1 Introduct ion
Self-similar traffic modeling has, from the beginning, emphasized the need for physical-based or struc-
tural approaches for understanding and describing actual network traffic dynamics. Structural models,
as discussed in [19], a t t empt to implicitly take into account the complex hierarchical s tructure of modern
computer communications networks and the intertwined networking mechanisms tha t determine the nature
of the traffic which these networks carry. These structural models are different from the "black box" or
"operational" traffic models which were popular in the past.
The main objective of this paper is to improve our current understanding of the dynamic nature of
traffic carried over wide-area networks (WANs) such as the Internet and to outline new structural modeling
approaches for WAN traffic tha t are consistent with actual measurements. In particular, we (i) identify
*This Research was supported by the NSF Grant DMS-9705665 at Yale University and AT&T Labs-Research, Florham Park, NJ.
tThis research was partially supported by the NSF Grant NCR-9628067 at the University of California at Santa Cruz.
ACM SIGCOMM 5 Computer Communication Review
distinct scaling regions in aggregate packet-level WAN traces, one for small time scales (a few hundreds
of milliseconds and below) and one for large time scales (beyond a few hundreds of milliseconds); (ii)
demonstrate the changing nature of WAN traffic characteristics at the t ransport (i.e., T C P / I P ) level over
time; (iii) provide empirical evidence for the presence of application-layer WAN traffic characteristics, which
allows us to adopt a structural modeling approach that explains the empirically observed large-time scaling
phenomenon in aggregate WAN traffic; and (iv) discuss the feasibility of a structural modeling approach
for WAN traffic that is capable of capturing the large-time as well as small-time scaling properties in a
compact and parsimonious manner. To accomplish these goals, we rely on a set of high-quality, packet-level
WAN traffic measurements, collected over the past six to seven years from a number of different WANs
and representing a reasonable cross-section of wide-area Internet behavior. Our in-depth analysis of these
WAN traffic traces is based on a wavelet-based technique recently suggested and developed by Abry and
Veitch [1]. This technique provides a natural and effective tool for investigating scaling properties that
may be present in large data sets.
There have been significant advances in the recent past in structural modeling approaches for local area
network (LAN) traffic as opposed to WAN traffic. In fact, the empirically observed self-similar or fractal
nature of LAN traffic at the aggregate or macroscopic level (i.e., generated by all active hosts on the network;
see for example [12]) has recently resulted in structural models that are based on self-similar processes, have
a physical meaning in the LAN context, and provide fundamental and new insights into how individual
network connections behave. Moreover, the proposed structural models are based on constructions that are
mathematically rigorous, that highlight the predominance of heavy-tailed phenomena at the microscopic
level (i.e., in the packet arrival patterns generated by the individual host-host pairs in a LAN), and that
are fully consistent with measured LAN traffic at the macroscopic as well as microscopic level (for details,
see [20]). However, WANs differ from LANs in a number of fundamental ways, which makes structural
modeling of WAN traffic more challenging. On the one hand, WANs are generally more heterogeneous
than LANs and, more importantly, they have to cope with the problem of latency (i.e., non-negligible
delays associated with obtaining and adapting to feedback on current network conditions). They often
do so by relying on sophisticated t ransport protocols (e.g., Internet uses predominantly TCP) which, in
turn, are bound to introduce additional structure to the flow of packets over WANs that is absent in LAN
environments where feedbacks are essentially instantaneous.
The first empirical evidence for large-time scaling phenomena in measured WAN traffic traces was
reported by Paxson and Floyd [14], who relied on a set of 24 traces of WAN traffic traces, collected
between 1993 and 1995, primarily at the Lawrence Berkeley National Laboratory and at Digital's Western
Research Lab. They found typical scaling regions that extended over three to four orders of magnitudes
with lower cutoffs that varied consistently around a few hundreds of milliseconds. Similar findings have
been reported in other empirical traffic studies; e.g., see [20]. In Section 2 below, we use a collection of
more recent WAN traces and a wavelet-based scaling analysis to validate this previously observed large-
time scaling property of WAN traffic. We also identify a scaling phenomenon for small time scales (below a
ACM SIGCOMM 6 Computer Communication Review
few hundreds of milliseconds) that has been alluded to in previous studies; however, here we quantify this
small-time scaling behavior and demonstrate that it is distinctly different from that for large time scales.
Focusing on their 1993 traces, Paxson and Floyd [14] also proposed a structural modeling approach for
WAN traffic that a t tempts to explain the observed self-similar nature over large time scales of aggregate
WAN traffic at the packet level in terms of the characteristics of the main applications (e.g., T E L N E T ,
F T P ) which generated the overall traffic. Their structural model is based on a construction, originally
due to Cox [3], known as M/G/c<) model or birth-immigration process: session arrivals are assumed to
be Poisson or, more generally, of renewal-type; session duration (in seconds) or session size (in bytes) are
required to be heavy-tailed (e.g., Pareto with finite mean and infinite variance) and packets are generated
at a constant rate for the duration of a session. In Section 3, we provide new evidence that this structural
modeling approach remains partly valid for today's WAN traffic, even though over the last three to four
years, W W W has become the main WAN application and typically makes up a major portion of modern
WAN traffic. At the same time, we also demonstrate in Section 3 that with the increasing popularity and
familiarity of the Web, the traffic characteristics at the t ransport layer have undergone significant changes
between the pre-WWW days and now and that these changes clearly reveal the limitations of structural
modeling a la Cox. To this end, we confirm here with our latest collection of WAN traffic traces a recent
finding by Feldmann [6, 7] who observed self-similar features not only at the packet/bytes level (i.e., for
the process representing the number of packets/bytes per time unit) but also at the TCP level (i.e., for the
process representing the number of TCP connection arrivals per time unit). Clearly, Cox's construction is
not adequate enough to account either for this scaling property of WAN traffic at the t ransport level nor
for the small-time scaling phenomenon at the packet level.
In light of the empirical evidence presented here, we revisit the question of structural modeling ap-
proaches for modern WAN traffic and discuss two alternatives. One approach which builds on Cox's
approach is based on a construction proposed by Kurtz [11] and allows for very flexible "within-session"
traffic patterns that can, for example, mimic to some degree actual TCP dynamics, but cannot be ac-
counted for by Cox's construction. At this time, structural models based on Kurtz's construction are
capable of "explaining" the observed large-time scaling property of WAN traffic but fail to account for
any additional structure that is present in today's WAN traffic (e.g., small-time scaling features at the
packet level, self-similarity at the TCP level). A second, more radical approach to understanding and
describing the actual dynamics of modern WAN traffic is based on multifractals. Multifractals or self-
similar measures, that is, measures with a nontrivial multifractal structure, have been applied in the past
to such diverse fields as the statistical theory of turbulence, the study of strange at tractors of certain
dynamical systems, and more recently, to physically based rain and cloud modeling (see for example [8, 9]
and references therein). In the networking context, multifractals have only very recently been considered;
for example, Taqqu, Teverovsky and Willinger [17] discuss the question of whether or not network traffic
is self-similar or multifractal, and they conclude that while self-similar models seem to suffice in a LAN
setting, WAN environment may require more complex structures such as multifractals. In fact, the first
ACM SIGCOMM 7 Computer Communication Review
empirical evidence of multifractal features in wide area TCP traffic traces has recently been reported by
Riedi and Levy-Vehel [15]. Multifractals are particularly appealing from a networking perspective because
of their close connection to certain multiplicative processes or random cascade models which can be intu-
itively associated with the hierarchical structure present in modern communication networks. We conclude
in Section 4 with an intuitive explanation for why multifractals might be an appropriate mathematical
technique for gaining a better understanding of the dynamic nature of modern high-speed network traffic.
2 Scaling Properties of Measured WAN Traffic
Abry and Veitch [1] recently proposed a wavelet-based technique for analyzing long-range dependent data
and for estimating the associated Hurst parameter. We briefly review their proposed method and illustrate
that it has many attractive features including the ability to investigate scaling properties in large sets
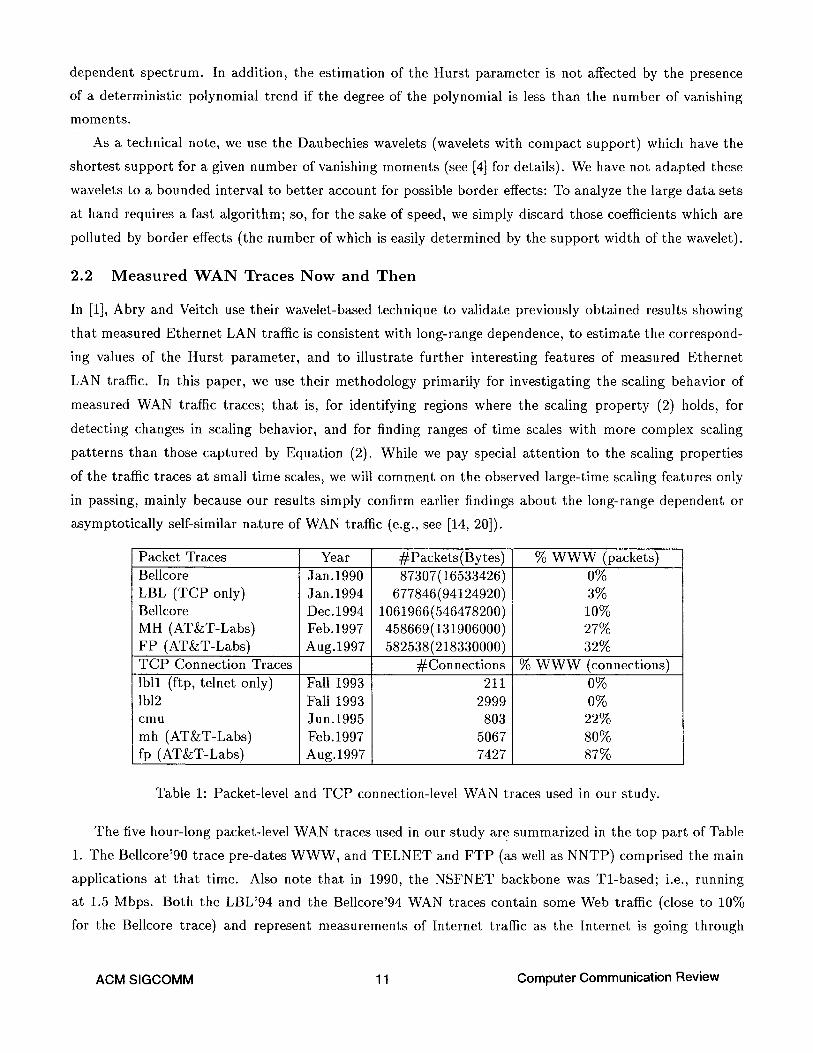
of traffic measurements from packet networks. The data sets analyzed below are summarized in Table 1
and represent a collection of high-quality WAN traffic traces, recorded in a number of different geographic
locations, over a period of about seven years (1990-1997). In particular, note that this collection period
covers the emergence of the Web (or WWW) as a "killer application" in the Internet and hence, the data
sets in Table 1 allow for a systematic study of the changing nature of WAN traffic, from the pre-Web period
(prior to 1993-1994) to today's situation where WAN traffic is consistently and ubiquitously dominated
by Web traffic.
2.1 M R A a n d a W a v e l e t - B a s e d S c a l i n g Analysis
Because the wavelet transform divides data into different frequency components and analyzes each com-
ponent with a resolution matched to its scale, we can use the coefficients of a wavelet decomposition to
directly s tudy the scale (or frequency) dependent properties of the data. In particular, we can use wavelets
to investigate the scaling structure in the spectra of self-similar processes which provide statistical models
for many naturally occurring phenomena. Multiresolution analysis (MRA) gives us a natural framework
for understanding wavelet bases and their transforms.
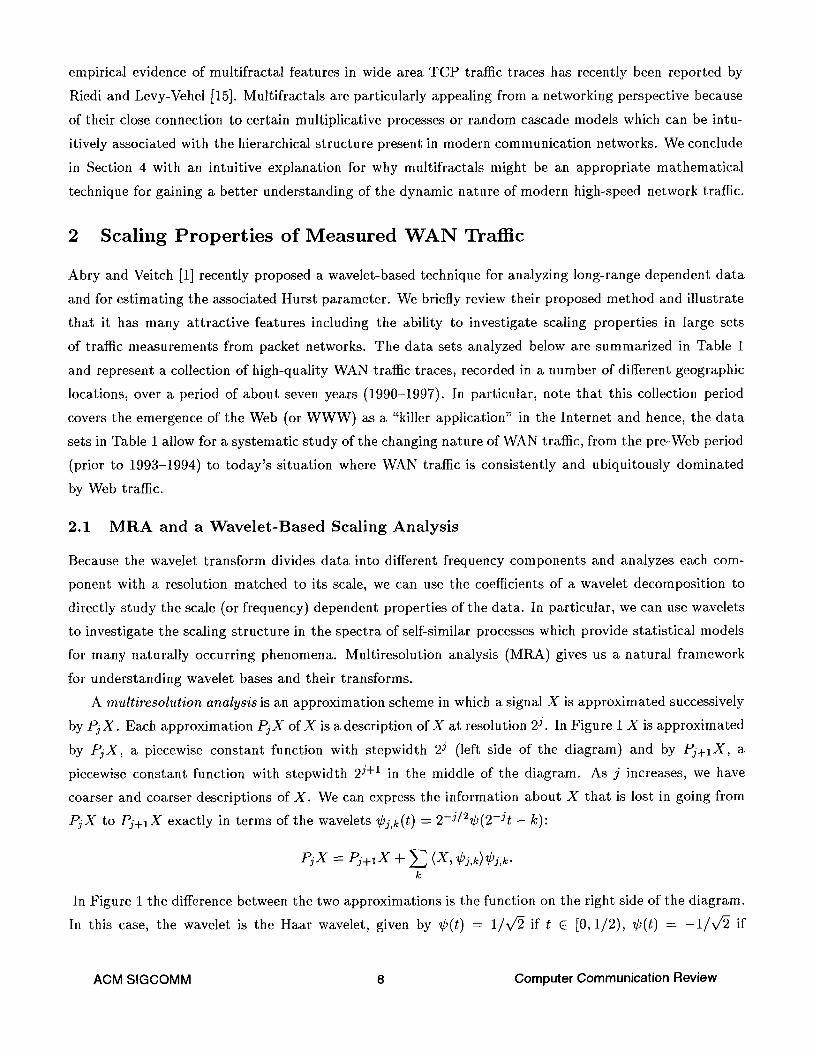
A multiresolution analysis is an approximation scheme in which a signal X is approximated successively
by P jX. Each approximation P j X of X is a description of X at resolution 2 j . In Figure 1 X is approximated
by PjX, a piecewise constant function with stepwidth 2 j (left side of the diagram) and by Pj+IX, a
piecewise constant function with stepwidth 2 j+ l in the middle of the diagram. As j increases, we have
coarser and coarser descriptions of X. We can express the information about X that is lost in going from
PjX to Pj+IX exactly in terms of the wavelets Cj,k(t) = 2-J /2¢(2-J t - k):
= P j + l x + (x , k
In Figure 1 the difference between the two approximations is the function on the right side of the diagram.
In this case, the wavelet is the Haar wavelet, given by ¢(t) = l/v/-2 if t E [0, 1/2), ¢(t) = - 1 / x / ~ if
ACM SIGCOMM 8 Computer Communication Review
XI X2 X3 (X2+X3)/2
f - I
~ XO+X 1 )/2 ~
Figure 1: picture for wavelets
(X0-X 1)/2
t E (1/2, 1], and ¢(t) = 0 otherwise. Thus, the wavelet basis is inherently linked to a multiresolution
analysis. We can "iterate" the above equation, writing it for many scales j and using that PjX tends to
zero and that P_jX tends to X as j tends to infinity to obtain the wavelet decomposition of X
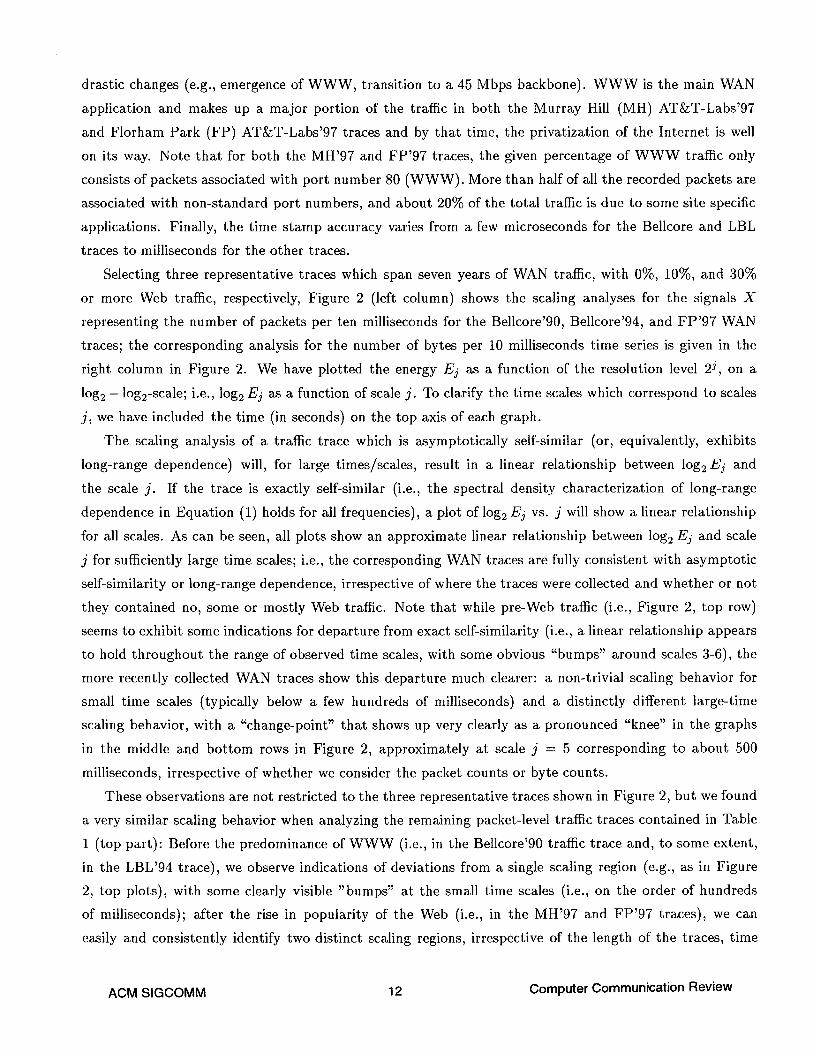
F i g u r e 2: S c a l i n g a n a l y s i s o f p a c k e t - l e v e l W A N t r a c e s ( l e f t c o l u m n : p a c k e t s / 1 0 m s e c ; r i g h t c o l u m n :
b y t e s / 1 0 m s e c ) : B e l l c o r e ' 9 0 ( t o p ) , B e l l c o r e ' 9 4 ( m i d d l e ) , F P ' 9 7 ( b o t t o m ) .
ACM SIGCOMM 13 Computer Communication Review
of day the traces were collected and geographic location of the traffic collection. For the Web-dominated
traffic traces, we also separated the data into Web-only and non-Web traffic. Performing the same scaling
analysis for the Web-only traces (not shown here), we noticed the same non-trivial scaling behavior as for
the combined traffic. Moreover, if we aggregate each of our traces and perform scaling analyses for the
time series representing the number of packets (or bytes) per one second, small-time scaling structures are
no longer visible and all we observe is a simple linear relationship between log 2 Ej and the scale j that
holds now for all scales. Thus, at t ime scales larger than about one second, WAN traffic is statistically self-
similar, and this characteristic has remained unchanged throughout the years, regardless of whether WAN
traffic has been dominated by TELNET, FTP, NNTP or WWW, independent of how fast the Internet
backbone has been running, and despite all the other drastic changes the Internet has experienced over the
past 7 years. Finally, concerning the ever-present question of non-stationarity vs. long-range dependence,
we note that as part of the wavelet-based scaling analysis, a systematic search for the presence of certain
non-trivial deterministic trends is possible through a judicious choice of the number of vanishing moments,
M, for the wavelet used in the analysis. For the traces at hand, this part of the scaling analysis (not shown
here) provided no indications for the presence of certain deterministic trends that might adversely effect
our conclusions about scaling laws in measured WAN traffic.
While our finding of the large-time scaling is not new and simply confirms earlier studies by Paxson and
Floyd [14] (see also Willinger et al. [20]) who first observed the asymptotically self-similar or long-range
dependent nature of measured WAN traffic, our empirical observation of the existence of a pronounced
small-time scaling behavior is new in the sense that is clearly differentiates between small-time and large-
time scaling properties. While earlier empirical studies of measured WAN traffic have also pointed out
apparent deviations from exact self-similarity at small time scales, their exclusive reliance on analysis
techniques such as variance-time plots, the R/S method, or periodogram-based approaches made it difficult
to focus in more detail on the nature of these deviations over small time scales. Subsequently, the results of
our wavelet-based scaling analysis of a historical collection of WAN traces imply that to fully understand
and accurately describe modern WAN traffic, exactly self-similar processes are not sufficient and need to
be replaced by traffic models that allow for a richer scaling behavior. To this end, gaining a physical
understanding of the origins of the observed small-time scaling phenomenon is of crucial importance as it
will lead to structural modeling approaches for WAN traffic that capture the full range of observed scaling
phenomena in a compact and parsimonious manner.
3 Physical Explanations for Scaling in WAN Traffic
To gain a physical understanding of the empirically observed scaling phenomena in actual WAN traffic
collected over the last 7 years, we provide in this section a plausible, application-level phenomenological
explanation for the large-time scaling behavior of WAN traffic at the packet level, identify (and provide a
physical explanation for) an intriguing feature of the changing nature of WAN traffic at the TCP connection
ACM SIGCOMM 14 Computer Communication Review
level as WANs experienced more and more Web traffic over the past couple of years, and illustrate with
further examples the difficulties associated with answering the question of the origins of the observed
small-time scaling behavior in today's WAN traffic.
The main applications that generated WAN traffic in the pre-Web days were TELNET, FTP, SMTP and
NNTP. Among those, FTP played a particularly important role because FTP sessions created the bulk of
data bytes sent over WANs in the pre-Web days. In an attempt to provide a physical explanation for the
observed asymptotically self-similar nature (i.e., large-time scaling phenomenon) of measured WAN traffic,
Paxson and Floyd [14] focused in part on the application layer trying to understand the characteristics of
such measurable quantities as FTP session size (in bytes), FTP session duration (in seconds) and FTP
session arrival times. Their extensive analysis of FTP traffic traces shows two key characteristics: (i) Over
one hour intervals, FTP session arrivals are well modeled by a Poisson process; and (ii) the distributions
of FTP session sizes or durations are heavy-tailed, with upper tails that are consistent with Pareto-type
tails and entail finite mean but infinite variance, i.e., high variability. Similar observations are made in [14]
about TELNET sessions, even though TELNET is an application qualitatively quite different from FTP,
with much less demand for bandwidth, but generating a high volume of (generally small) packets. Paxson
and Floyd also investigated the "within-session" structure of TELNET and FTP connections, and while
their approach seems adequate for describing pre-Web WAN traffic dynamics within individual connections,
the findings reported in this paper point out the need for new approaches to understanding WAN traffic
at the level of individual applications and connections.
In view of these empirically observed application-layer traffic characteristics, a construction due to Cox
[3], also known as an immigration death process or M/G/c~ queueing model, provides a structural model-
ing approach for pre-Web WAN traffic that is (i) mathematically rigorous, (ii) consistent with measured
packet-level WAN traffic at the macroscopic (i.e., aggregated over all individual connections) as well as
microscopic (i.e., for individual connections) level, and (iii) highlights the intimate connection between high
variability (i.e., heavy-tailed phenomenon) at the microscopic level and (asymptotic) self-similarity (i.e.,
large-time scaling phenomenon) at the macroscopic level. In short, in the context of WAN traffic mod-
eling, Cox's construction assumes that sessions arrive according to a Poisson process (or, more generally,
a renewal process), that the distribution of session lengths/sizes is heavy-tailed, and that packets/bytes
are transmitted at a constant rate for the duration of the session. Working in discrete time and letting
Xn denote the number of packets/bytes generated during the n-th time period by all the sessions active
at that time, it can be shown that Cox's construction results in a traffic model that exhibits large-time
scaling features (i.e., is long-range dependent or asymptotically self-similar) if and only if the distribution
of the session lengths/sizes has infinite variance; for details, see [19].
With the advent and popularity of the Web, WWW-related traffic makes up a significant portion of
the overall traffic on today's WANs (see Table 1). Despite the drastic changes that WANs have undergone
ACM SIGCOMM 15 Computer Communication Review
in the past 7 years, we have seen in Section 2 that the large-time scaling property is a robust characteristic
of WAN traffic, irrespective of how much of the traffic is due to WWW. Naturally, this gives rise to the
question of the appropriateness of Cox's construction not only for pre-Web but also for today's WWW-
dominated WAN traffic, and begs for a clear understanding of Web traffic at the level of individual user
sessions, each of which consists in general of several TCP connections. To this end, it is important to note
that to date, Web session characteristics have not been studied in detail, mainly because of the difficulties
in determining, from a packet-level WAN link trace, the instants when a Web session begins and ends. Due
to the details in how the different WAN applications are structured, this determination is easy for F T P
and TELNET (and other applications).
Here, we partially avoid these difficulties by relying on an indirect, somewhat inexact, but intuitively
reasonable method that provides novel insights into Web sessions and their statistical characteristics. Our
method makes use of a data base that provides information about every single modem call made to a
certain commercial ISP (Internet Service Provider); for our purposes, the important items collected for
each modem call are time of arrival of call (accurate to 1 second), duration (in seconds) and size (i.e., for
each direction, number of bytes t ransmit ted during the length of the call; below, we consider the total
number of bytes t ransmit ted) . Although there is no one-to-one correspondence between modem calls and
Web sessions (e.g., a single modem call can consist of a Web session, followed by email, followed by a
TELNET session, followed by another Web session etc.), substi tuting one for the other seems justified
and appears to be reasonably accurate if we focus mainly on arrival time and size information; after all,
web-browsing is the main activity of a typical ISP customer, and compared to email or TELNET or other
non-WWW related applications, Web sessions create currently the bulk of da ta bytes. In the following,
we will therefore use the notions of Web session and modem calls in an interchangeable fashion, and the
context in which these notions appear will typically resolve any potential confusion.
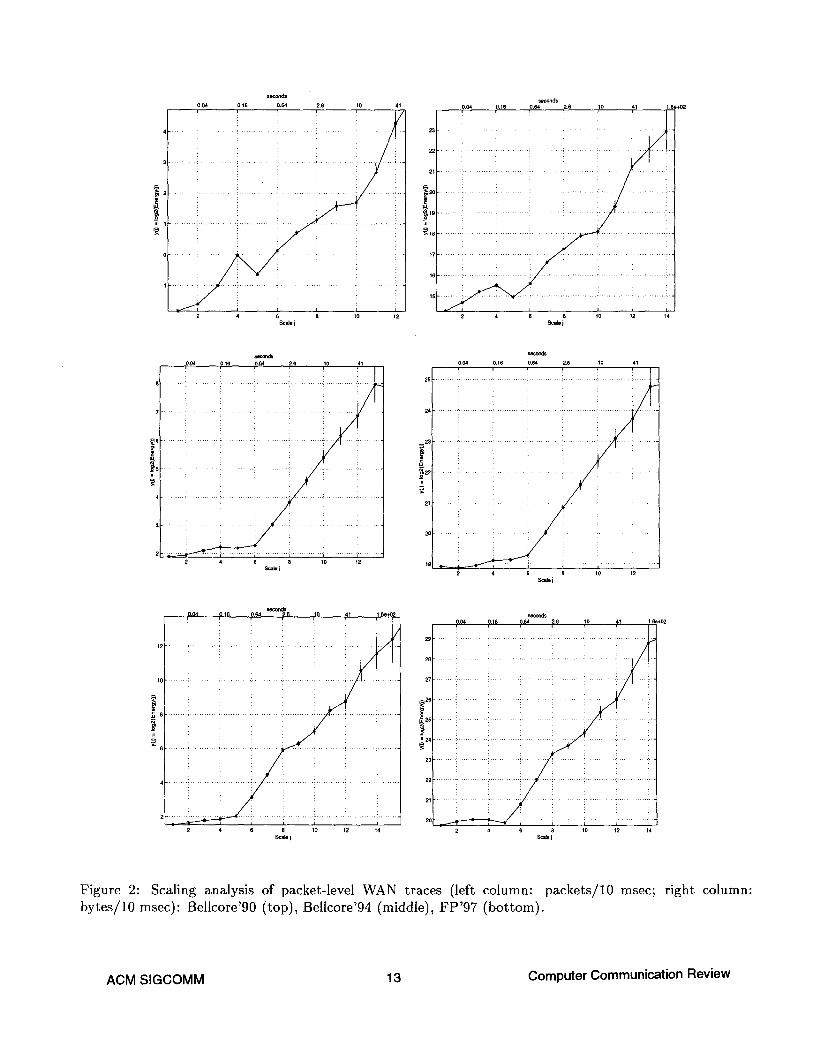
Given these caveats, Figure 3 shows the results of our analysis of an hour worth of calls into a large
modem pool (other data sets show similar characteristics). The top left plot in Figure 3 gives the empirical
complementary cumulative distribution function (CCDF) of the interarrival times of modem calls, on log-
linear scale; the plot illustrates that the interarrival time distribution is light-tailed and, moreover, that it
is consistent with the tail-behavior of an exponential distribution (note that we are here not concerned with
the shape of the main body of the distribution). The top right plot shows the autocorrelation function of the
number of modem call arrivals during successive one-second intervals. As can be seen, the autocorrelations
are essentially zero for all positive lags (i.e., lag 1 and beyond), implying that the arrivals are consistent
with a renewal-type process, i.e., independent and identically distributed. Finally, in the two bot tom
plots in Figure 3, we plot the CCDF of the sizes (on the left) and durations (on the right) of modem
calls, respectively, on log - log scale; the plots demonstrate the heavy-tailed or Pareto-type nature of the
corresponding distributions, and a crude estimate of the slope of the corresponding linear regions indicates
consistency with infinite variance behavior. In summary, using the modem Call data as subst i tute for Web
session information, we find that Cox's construction remains valid as a structural modeling approach for
ACM SIGCOMM 16 Computer Communication Review
,-,q
^
Eo .m • 4,-~ , r=.
~q E~, n v
0 ~ 0
I I I
I I I
I ! I ,
I I I
' 11
0 10 20 30 u
0 1f f -
CO 6
i i o
<d
0
0 d
0 1000 2000 3000 Lag
0 6
.-t
^q
(I) y.,
0'} 0 m
0
\
0 ¢5
:3
^ 0 ,.-,.: 0 I
0D
"-s " 0 0
0
o o
!
2 4 6 8 2 3 4 5 10glO(u) 10glO(u)
Figure 3: Analysis of modem call data: Complementary cumulative distribution function (CCDF) for modem call interarrival times (top left, log-linear scale); autocorrelation function of number of modem call arrivals per second (top right); CCDF for modem call size in bytes (bottom left, log-log scale); CCDF for modem call duration in seconds (bottom right, log-log scale).
ACM SIGCOMM 17 Computer Communication Review
WAN traffic, even when the latter is dominated by the Web - as long as we are only concerned with
application and packet level information and ignore other layers in the networking hierarchy, for example
TCP layer or IP layer (see Section 3.2 below).
3.2 Large-Time Scaling Phenomenon: TCP Layer
To date, structural modeling approaches for WAN traffic (e.g., Cox's construction) have focused almost
exclusively on explaining the observed large-time scaling phenomenon in packet-level WAN traffic in terms
of the phenomenon of high variability or infinite variance at the application level. They have done so
successfully (see Section 3.1), despite the constantly changing nature of modern-day WANs and of the traffic
they carry. However, these approaches reflect a source-centered view of traffic modeling, where sources are
assumed to simply inject (at a constant rate) as many packets into the network as is required by a user
session, and they essentially ignore the impact that the applications (e.g., downloading several Web pages)
and networks (e.g., TCP dynamics) have on the flow of packets that individual sources a t t empt to t ransmit
over the network. On the one hand, such a modeling view is justified for LAN environments where the
feedback from the network to the hosts about the current state of the network is essentially instantaneous.
On the other hand, because WANs are generally used for sending packets over long distances, the speed-
of-light limitations have a practical impact upon the transmission time of packets. In fact, latency or
non-negligible delays associated between obtaining and adapting to feedback on current network conditions
is one of the most difficult problems that WANs have to cope with, and they often do so by relying on
sophisticated "transport" protocols and/or end-to-end flow control schemes. In the Internet, the dominant
t ransport protocol continues to be the Transmission Control Protocol (TCP) that ensures reliable transfer
of data across the network (e.g., see Stevens [16]).
3 0
D (3L) E 2 0
o o 1 0
o I - - -
0
0 6 0 0 1 2 0 0 1 8 0 0 2 4 0 0 3 0 0 0 3 6 0 0
T i m e U n i t = 1 S e c o n d
Figure 4: Time series plot of the number of TCP connection arrivals per second (for the hour-long trace fp'97).
In this subsection, we focus exclusively on the t ransport layer which resides directly underneath the
application layer in the hierarchical structure of modern-day networks, but a few layers above the link layer
with its mechanisms and protocols controlling how the individual packets are sent over the media and where
ACM SIGCOMM 18 Computer Communication Review
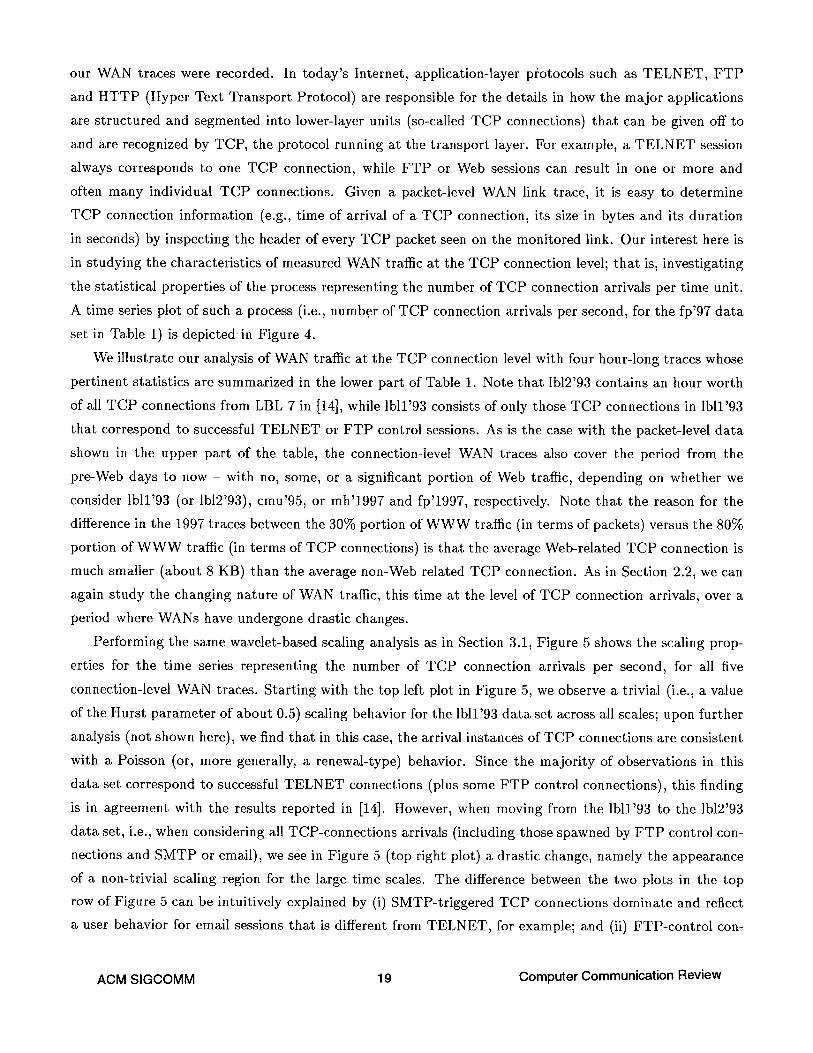
our WAN traces were recorded. In today 's Internet, application-layer piotocols such as TELNET, F T P
and H T T P (Hyper Text Transport Protocol) are responsible for the details in how the major applications
are s t ructured and segmented into lower-layer units (so-called TCP connections) tha t can be given off to
and are recognized by TCP, the protocol running at the t ranspor t layer. For example, a T E L N E T session
always corresponds to one T C P connection, while F T P or Web sessions can result in one or more and
often many individual TCP connections. Given a packet-level WAN link trace, it is easy to determine
TCP connection information (e.g., t ime of arrival of a TCP connection, its size in bytes and its duration
in seconds) by inspecting the header of every TCP packet seen on the monitored link. Our interest here is
in studying the characteristics of measured WAN traffic at the TCP connection level; tha t is, investigating
the statistical properties of the process representing the number of TCP connection arrivals per t ime unit.
A time series plot of such a process (i.e., number of TCP connection arrivals per second, for the fp'97 da ta
set in Table 1) is depicted-in Figure 4.
We illustrate our analysis of WAN traffic at the TCP connection level with four hour-long traces whose
pertinent statistics are summarized in the lower part of Table 1. Note tha t lb12'93 contains an hour worth
of all T C P connections from LBL 7 in [14], while lbll '93 consists of only those T C P connections in lbll '93
that correspond to successful T E L N E T or F T P control sessions. As is the case with the packet-level da ta
shown in the upper part of the table, the connection-level WAN traces also cover the period from the
pre-Web days to now - with no, some, or a significant portion of Web traffic, depending on whether we
consider lb11'93 (or lb12'93), cmu'95, or mh'1997 and fp'1997, respectively. Note tha t the reason for the
difference in the 1997 traces between the 30% portion of W W W traffic (in terms of packets) versus the 80%
portion of W W W traffic (in terms of T C P connections) is tha t the average Web-related T C P connection is
much smaller (about 8 KB) than the average non-Web related T C P connection. As in Section 2.2, we can
again s tudy the changing nature of WAN traffic, this t ime at the level of T C P connection arrivals, over a
period where WANs have undergone drastic changes.
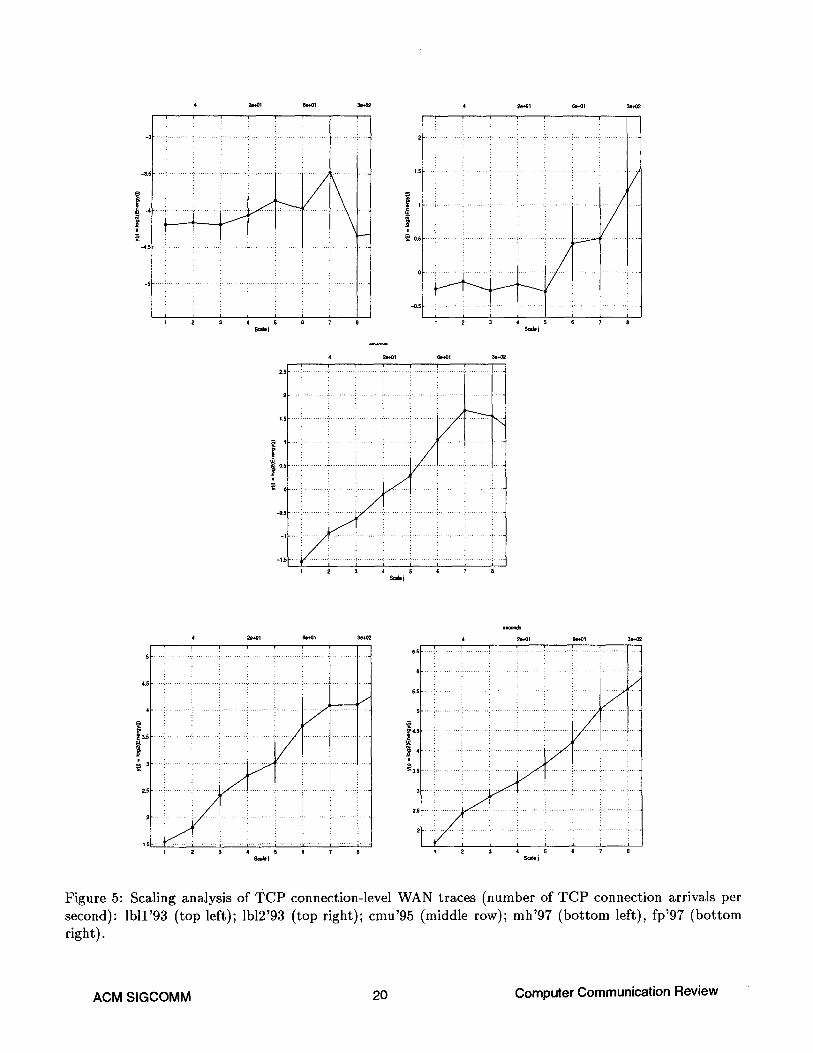
Performing the same wavelet-based scaling analysis as in Section 3.1, Figure 5 shows the scaling prop-
erties for the t ime series representing the number of TCP connection arrivals per second, for all five
connection-level WAN traces. Start ing with the top left plot in Figure 5, we observe a trivial (i.e., a value
of the Hurst parameter of about 0.5) scaling behavior for the lbll '93 da ta set across all scales; upon further
analysis (not shown here), we find that in this case, the arrival instances of TCP connections are consistent
with a Poisson (or, more generally, a renewal-type) behavior. Since the major i ty of observations in this
da ta set correspond to successful TELNET connections (plus some F T P control connections), this finding
is in agreement with the results reported in [14]. However, when moving from the lbll '93 to the lb12'93
data set, i.e., when considering all TCP-connections arrivals (including those spawned by F T P control con-
nections and SMTP or email), we see in Figure 5 (top right plot) a drastic change, namely the appearance
of a non-trivial scaling region for the large time scales. The difference between the two plots in the top
row of Figure 5 can be intuitively explained by (i) SMTP-triggered TCP connections dominate and reflect
a user behavior for email sessions tha t is different from TELNET, for example; and (ii) FTP-cont ro l con-
ACM SIGCOMM 19 Computer Communication Review
4 2e+oi 6e+Ol
I . . . . .
i : !
• : i i i
-s .-: ........ i ........... i .......... i ............ , ......... i ......... :: ..............
................................... ! ............ i
I : i i i i Z . ....
! 2 3 4 6 7 8 ~ J
seomlds
2e+Ol 6e. ioi 3 a + ~
~4.5
L ~ 3 . 5
~ 5
1 2 3 4 Scalej S 6 7
F i g u r e 5: S c a l i n g a n a l y s i s o f T C P c o n n e c t i o n - l e v e l W A N traces ( n u m b e r o f T C P c o n n e c t i o n arrivals per s e c o n d ) : l b l l ' 9 3 ( t o p left); lb12'93 ( t o p r ight) ; c m u ' 9 5 (midd le row); m h ' 9 7 ( b o t t o m le f t ) , fp '97 ( b o t t o m r ight ) .
ACM SIGCOMM 20 Computer Communication Review
nections typically spawn a number of TCP connections within the F T P session, and it is not unreasonable
to expect that there is an increasingly high variability in the number of spawned connections as the use of
F T P becomes more sophisticated. Moving on to the cmu'1995 trace and analyzing only the HTTP-related
portion of the TCP connections, Figure 5 (middle row) shows yet another change in the scaling behavior;
Web traffic at the level of TCP connection arrivals no longer exhibits trivial scaling at the small scales
but shows across all scales the same non-trivial scaling that we have seen in the pre-Web lb12'93 trace for
large time scales; that is, the traffic representing the number of HTTP-related TCP connection arrivals
per second is (exactly) self-similar for time scales of one second and beyond. As can be seen from the
remaining two plots in Figure 5 (i.e., bot tom row), this observation is confirmed and becomes even more
pronounced as we move to the latest connection-level WAN traces and perform the same scaling analysis
for the HTTP-related portion of TCP connections.
The finding of self-similarity of measured WAN traffic at the TCP connection level is not new, but
has been pointed out earlier by Feldmann [6, 7], and our analysis here simply confirms this previously
observed feature of TCP connection arrivals. What is new here is the observed gradual appearance of non-
trivial scaling in WAN traffic at the transport layer, from trivial scaling to non-trivial large-time scaling to
non-trivial scaling for all scales, as WANs see the traffic mix at the application level change from mostly
TELNET and simple use of email and FTP, to all-of-the-above plus more sophisticated use of FTP, to
all-of-the-above plus some Web usage, to predominantly Web-based. It will be interesting to see, how this
empirically observed scaling phenomenon at the transport layer will be affected as a growing portion of
Internet traffic will be "multicast", where a single sender transmits to multiple receivers, as other new
transport protocols come along, or as the current characteristics of a "typical" Web-page (i.e., median of
about 3K bytes, average around 8K bytes) change.
3 .3 T C P C o n n e c t i o n A r r i v a l D y n a m i c s W i t h i n W e b S e s s i o n s
Naturally, the gradual appearance over time of self-similarity in measured WAN traffic at the transport
layer gives rise to the question about the origins of this phenomenon, especially in view of its distinct
presence in today's WWW-dominated WAN traffic. To provide a plausible and empirically verifiable
answer to this question, we make again use of the information contained in the ISP's modem call data
base (see Section 3.1) and correlate it with the packet-level WAN trace collected from the same ISP's
wide-area network. To illustrate, Figure 6 shows the dynamics of a single Web session (i.e., modem call)
at the level of individual TCP connections. We use the textured plotting technique to indicate in the top
plot the bursty nature of TCP connection arrivals. Recall that the idea of textured plots is to display
one-dimensional da ta points in 'a strip in an a t tempt to show all data points individually. If necessary,
the points are displaced vertically by small amounts that are partly random, partly constrained. The
resulting textured dot strip facilitates a visual assessment of changing patterns of data intensities in a way
other better-known techniques (e.g., histogram plots) are unable to provide. Note that the plot in Figure
6 contains about 480 points, each of which represent the arrival time of a TCP connection within one
ACM SIGCOMM 21 Computer Communication Review
T C P C o n n . A r r i v a l s f o r S i n g l e W W W S e s s i o n - T e x t u r e d P l o t
= ~ o : . * ° * -
:;i:: :
- . : . - . ' (
: : : - . : - : - . - . : " --
° .
2 4 3 4 4 8 6 8 7 3 0 3 9 7 3 7 1 2 1 7 1
T i m e ( i n s e c ) S e s s i o n 8 6
T C P C o n n . A r r i v a l s f o r S i n g l e W W W S e s s i o n - W i t h S e s s i o n D u r a t i o n
0 2 4 3 4 4 8 6 6 7 3 0 3 8 7 3 7
T i m e ( in s e c ) S e s s i o n 8 6
m . _
°
Figure 6: Textured plot of TCP connection arrivals within a single Web-session (top) and augmented with their corresponding durations (bottom).
and the same Web session. In addition, for each arriving TCP connection, the bot tom plot in Figure 6
shows a horizontal line, representing the length or duration of the corresponding TCP connection. Thus, in
addition to the bursty nature of TCP connection arrivals, this plot also demonstrates the high variability
associated with the T C P connection durations; many of the connections are too short to show up in plot,
and those that can be recognized range in duration from seconds to minutes and hours. The plot also shows
a number of other characteristics that are typical for today's Web and its "typical" users: opening multiple
simultaneous connections (a characteristics of popular Web browsers such as Netscape 3.0), running more
than one Web-browser at the same time, and multiple connections stopping all at once (e.g., the result of
hitting the stop bot tom). Note that while this particular Web session is somewhat atypical with respect
to its duration (it lasts for about 4 hours!), we found it, in fact, to be very typical with respect to the
"within-session" dynamics of TCP connection arrivals for sessions - with the exception of the very short
ones .
Next, we consider all Web-sessions that were active during the packet-level traffic collection period
(i.e., 3.5 days, totaling 39620 sessions) and extract from the measured WAN trace the number of T CP
connections per Web session. Not counting the unsuccessful connections, the mean connection size is about
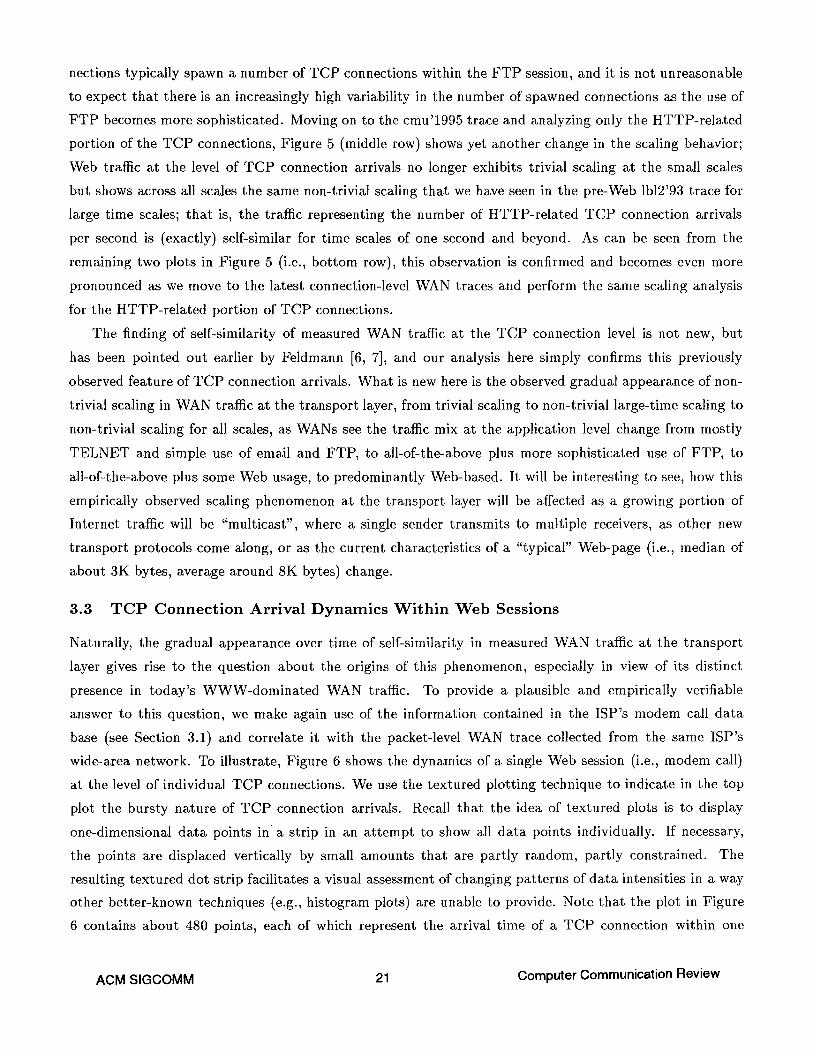
2Kbytes and the median is 14 Kbytes. Figure 7 shows the complementary cumulative distribution function
of the number of T C P connections per Web session, on log-log scale. In view of Figure 6, it should come
as no big surprise that the number of TCP connections per Web session is highly variable (extending over
more then 4 orders of magnitude, see x-axis); in fact, the apparent linear region in the tail of the plot
suggests that the number of TCP connections per Web session is heavy-tailed, and "eyeballing" the slope
ACM SIGCOMM 22 Computer Communication Review
~ O
r't
0 =~= ..~, GL... O
0 1 2 3 4 l o g 1 o ( u )
Figure 7: Complementary cumulative distribution function of the number of T C P connections per Web sessions.
of the linear region indicates tha t the observations are consistent with finite mean but are on the border
between having finite variance and exhibiting infinite variance (i.e., the "Noah Effect" or infinite variance
syndrome). This heuristic approach can be made more rigorous using, for example, Hill's method for
assessing the heavy-tailed nature of a distribution (e.g., see [20]).
Together with the Poisson nature of Web session arrivals (see Section 3.1), the empirically observed
property tha t the number of T C P connections per Web session are heavy-tailed with indications of infinite
variance behavior provides a mathematical explanation for the self-similar nature of WAN traffic at the
TCP level via a separate Cox's construction, where in this case, the "service times" are measured in terms
of the number of T C P connections. As far as overall structural modeling of WAN traffic is concerned, the
observed self-similar nature of WAN traffic at the TCP connection level clearly demonstra tes the limitations
of Cox-like constructions; they are restricted to two layers (i.e., sessions and packets, or sessions and TCP
connections) and are therefore too inflexible to account for multi-layer (i.e., more than two) structures.
In particular, they allow for no other "within-session" s t ructure than emitt ing units (e.g., packets or
connections) at a constant rate. Thus, they are unable to account at the same t ime for the observed
packet-level as well as TCP-layer dynamics.
In general, these constructions are also inadequate to capture the small-time scaling phenomena ob-
served in measured WAN traffic and reported in Section 2.2. However, recent work by Kurtz [11] provides
new insights into the problem of allowing for a more flexible "within-session" structure. Briefly, Kurtz
considers a large number of sessions, each of which arrives at a random point in t ime (i.e., session arrivals
are assumed to follow a Poisson process), is active for a random durat ion T, and then leaves the.system.
Associated with each active session is a stochastic process Y = (Y(t), 0 < t < r) such tha t Y(t) represents
the cumulative number of packets /bytes generated during the first t t ime units during the active session.
The only condition on Y is tha t since it describes the cumulative work generated during a session, it is
required to be non-decreasing. For example, Y(t) = t for the duration of the session means constant rate
A~M RIC~COMM 23 Computer Communication Review
and we recover Cox's construction; however, a Y-process that is piecewise linear with different non-negative
slopes (including slope 0, i.e., no traffic is generated) is an obvious candidate for capturing the fragmenta-
tion of an application-layer session into one or more transport-layer connections (e.g., a Web-session being
segmented into a number of TCP connection, interspersed with "idle periods" representing periods of user
inactivity or "think time"; see [2]). Kurtz's main results show that the same limiting regime (i.e., fractional
Brownian motion) holds for an appropriately normalized version (for details, see Kurtz [11]) of the total
traffic generated by all active sessions, under a number of different scenarios for the particular "within-
session" structure defined by the process Y; the only condition needed to obtain the limiting regime is that
the session duration r is heavy-tailed with infinite variance. From the perspective of structural modeling
approaches for WAN traffic, Kurtz's construction is an improvement over Cox's construction because it can
accommodate a number of relatively complex "within-session" structures. However, at this time, it remains
unclear how one would account for the observed self-similar nature of the "within-session" T C P connection
arrival counts or how such a structure (if it exists) would impact the limiting result. In its current version,
Kurtz's construction has two properties in common with Cox's construction: they both provide a (the
same) physical explanation for the observed large-time scaling phenomenon in measured packet-level WAN
traces, but they both cannot parsimoniously account for the small-time scaling phenomenon tha t is present
in measured packet-level WAN traces and is distinctly different from the large-time scaling property. In
fact, the observed pronounced small-time scaling behavior strongly suggests the presence of local irregular-
ities in measured WAN traces that , in turn, can only be accounted for by relying on mathematical models
that allow for scaling laws (e.g., multifractals - see below) that are more complex than the ones exhibited
by self-similar processes.
3 .4 S m a l l - T i m e S c a l i n g P r o p e r t i e s : P r e l i m i n a r y O b s e r v a t i o n s
We have seen in Section 2.2 that modern-day packet-level WAN traffic exhibits small-time scaling fea-
tures that are distinctly different from the observed large-time scaling phenomenon. Phenomenological
or structural modeling approaches for WAN traffic, such as Cox's or Kurtz 's constructions, successfully
explain the latter phenomenon in terms of the observed high variability of WAN traffic at the application
level, but have failed so far to capture the former. Clearly, the difficulties are with the small-time scaling
features which have generally been ignored by the mathematical modeling community and the networking
researchers alike. One problem that contributes to this neglect continues to be the difficulty to routinely
capturing WAN packet traces at a fine enough time resolution that makes fine-time scale analysis credible
and does not require expensive, custom-made traffic recorders. As an illustration of the insights gained
from measuring and analyzing high-time resolution WAN packet traces and the ensuing difficulties in try-
ing to understand and describe in a compact manner the small-time scaling behavior in packet-level WAN
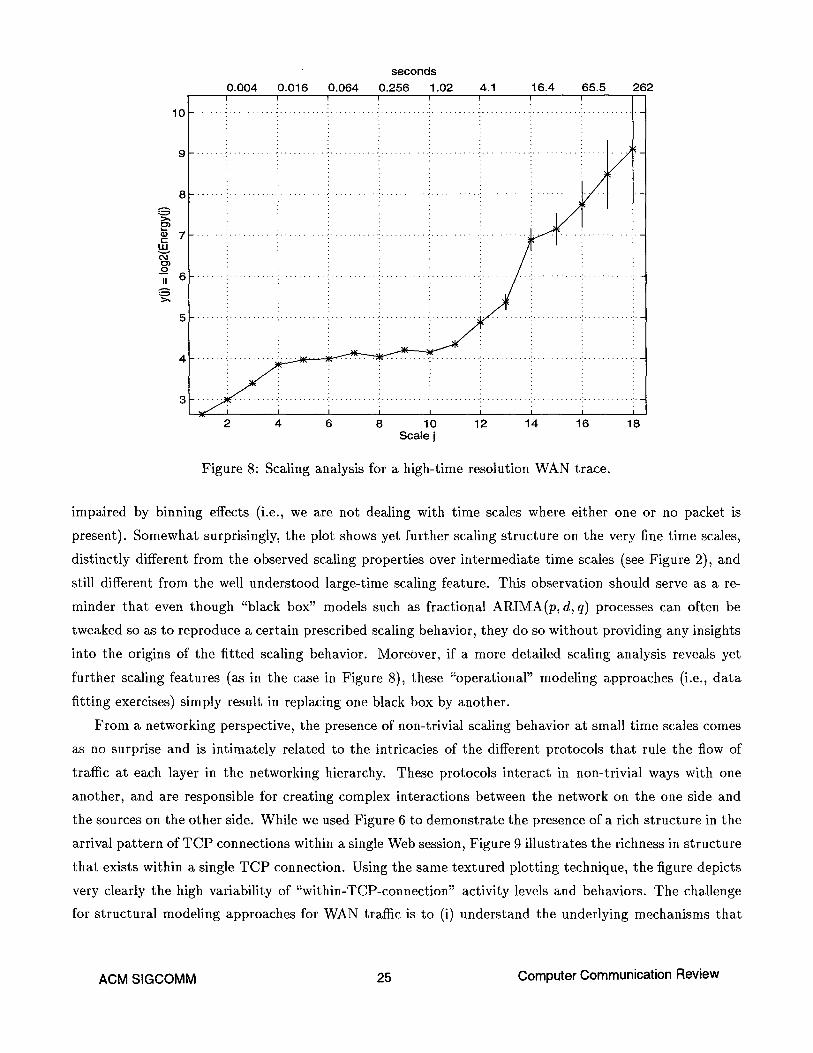
traffic, we show in Figure 8 the results of a wavelet-based scaling analysis for a WAN trace collected in
July'97 from a commercial network. For this WAN traffic trace, the time s tamp accuracy is estimated
at about 10 microseconds and allows for a scaling analysis down to the millisecond scale, without being
erties) during the last 7 years. In view of earlier studies involving T E L N E T and F T P and of the new
evidence reported in this paper on Web session characteristics, the origins of the large-time scaling phe-
nomenon in measured WAN traffic are now well understood and are directly related to well known features
of WAN traffic at the application layer. As a result, we fully expect future WAN traffic to exhibit this
same feature - unless we are in for dramatic changes (such as extreme schemes for pricing Internet traffic,
or radically different t ranspor t protocols). We also identify and quantify here a small-time scaling proper ty
of modern-day WAN traffic which is distinctly different from the large-time scaling behavior and is less
pronounced in pre-Web WAN traffic. On an intuitive level, there is agreement tha t much of this small-time
scaling phenomenon must be due to "real life" T C P dynamics; however, we currently do not have a good
understanding of the physics behind this phenomenon, which, in turn, makes it difficult to predict whether
or not future WAN traffic will have these same (or similar) small-time scaling properties. As a third result
of our s tudy of measured WAN traffic, we confirm a recently observed new scaling phenomenon of WAN
traffic at the T C P level where the process in question are T C P connections. In particular, we find the
process representing the number of TCP connection arrival per seconds to be self-similar (i.e., to have
non-trivial scaling across all scales larger than 1 second), and we observe that this scaling phenomenon
has appeared gradually as the amount of Web traffic has increased over the past 3-4 years. Combining
ACM SIGCOMM 26 Computer Communication Review
information that is generMly hard to get access to, we also provide a plausible physical explanation of the
observed TCP-layer self-similarity (i.e., an M/G/oo-construction at the TCP layer, where every session
brings with it a heavy-tailed number of TCP connections) and validate it against measured WAN traffic.
Currently considered structural modeling approaches for WAN traffic, especially two constructions due
to Cox and Kurtz, respectively, are well-suited to explain the large-time scaling features in terms of the
well-understood application layer traffic characteristic. However, in their current form, neither of these
approaches are capable of explaining the small-time scaling properties, nor are they able to reproduce the
self-similar nature of traffic at the TCP layer in an intrinsic and natural manner. The most promising of
the current approaches appears to be Kurtz's construction, mainly because in its general form, it allows for
the possibility of very general "within-session" packet arrival patterns, and because to date, the limiting
regime (i.e., aggregation over many sessions) is only known for a very special cases, all of which can only
account for large-time scaling properties. The challenge is to incorporate a more "network-centered" view of
traffic modeling into Kurtz's construction (as opposed to further pursuing the traditional "source-centered"
approach; see Section 3.2), so as to better account for the impact that the network has on the sources.
One plausible way of making Kurtz's construction more network-oriented - without getting into the
details of how the different protocol at the different layers in the networking hierarchy work and interact
with one another - is to view WANs or other networks, together with their protocols and controls, as
defining the deterministic mechanisms and rules of a process that fragments units of information at one
layer into smaller units at the next layer etc. That is, networks act as cascades by fragmenting, for example,
a Web session into a number of TCP connections (determined by the HTTP protocol) which, in turn, are
further fragmented into several H T T P requests (the mechanism for this is provided by the H T T P protocol)
which, in turn, are fragmented into IP flows, and so on. Note that during this fragmentation process, the
total number of information units (in our example, this would be the total number of bytes t ransmit ted
during the Web-session) remains essentially preserved and hence, the cascade analogy is appropriate.
Cascades are an important paradigm in the theory of multifractals as they can account for many
multifractal or self-similar measures; that is, measures with a nontrivial multifractal structure (for an
overview, definitions and properties of multifractals, see for example Holley and Waymire [9] and Evertsz
and Mandelbrot [5]). Although the multifractal approach to understanding and describing network traffic
appears to be a radical departure from the more conventional structural traffic modeling approaches pursued
to date, there exists a close link between Kurtz's construction and random cascade models: simply allow
the Y-process that defines the "within-session" traffic patterns (see Section 1 or consult [11]) to be a
multifractal measure, generated via an appropriately defined random cascade model. Moreover, there
already exists empirical evidence in favor of non-trivial multifractal properties of measured WAN TCP
traffic - see the recent work by Riedi and Levy-Vehel [15]. Although multifractals and random cascade
models are new traffic modeling paradigms, the motivation for studying them in the network context
comes directly from the desire for physically meaningful descriptions of empirically observed phenomena in
measured network traffic. In view of the already existing empirical evidence, these new modeling paradigms
ACM SIGCOMM 27 Computer Communication Review
are more then speculation and offer unique opportunities for studying challenging new mathematical and
statistical problems. At the same time they point towards new ways of understanding and describing
real-world network traffic, resulting in new engineering insights that can be expected to be of practical
relevance for a wide range of network engineering tasks.
A c k n o w l e d g m e n t s
Many of the traces considered in this paper were collected using the tcpdump packet capture tool developed
by V. Jacobson, C. Leres and S. McCanne and available via anonymous ftp to f t p . ee. l b l . gov. To extract
TCP connection information from the traces, we relied on V. Paxson's tcp-conn and/or tcp-reduce tools,
both of which are available from h t t p : / / i t a . e e . l b l . g o v / i n d e x . h t m l .
The Bellcore traces were collected by D. V. Wilson, the LBL/lbl traces were gathered by V. Paxson
and are available from ht tp : / /www, acre. org /s igcomm/ITt / , and we thank S. Alexander and S. Gao from
AT&:T Labs-Research for making the MH and FP traffic collection possible. We also acknowledge the help
of many of our colleagues at AT&T Labs, especially of J. Friedmanns and A. Greenberg, with the data
collection effort.
Finally, we are very grateful to P. Abry and D. Veitch for making available their programs to perform
the wavelet-based scaling analysis.
R e f e r e n c e s
[1]
[2]
[3]
[4]
[5]
P. Abry and D. Veitch. Wavelet analysis of long-range dependent traffic. IEEE Transactions on Information Theory 44, pp. 2-15, 1998.
M. E. Crovella and A. Bestavros. Self-similarity in world wide web traffic - evidence and possible causes. Proceedings of Sigmetrics'96, pp. 160-169, 1996.
D. R. Cox. Long-range dependence: A review. In H. A. David and H. T. David, editors, Statistics: An Appraisal, pages 55-74. Iowa State University Press, Ames, Iowa, 1984.
I. Daubechies. Ten lectures on wavelets., SIAM, Philadelphia, 1992.
C. J. G. Evertsz and B. B. Mandelbrot. Multifractal measures. In H.-O. Peitgen, H. Jurgens and D. Saupe, editors, Chaos and Fractals: New Frontiers in Science, Springer-Verlag, New York, 1992.
[6] A. Feldmann. On-line call admission for high-speed networks. Ph.D. Thesis, School of Computer Science, Carnegie Mellon University, Pittsburgh, PA, 1995.
[7] A. Feldmann. Modelling characteristics of TCP connections. Preprint, 1996.
[8] V. K. Gupta and E. C. Waymire. A statistical analysis of mesoscale rainfall as a random cascade. Journal of Applied Meteorology 32, pp. 251-267, 1993.
[9] R. Holley and E. C. Waymire. Multifractal dimensions and scaling exponents for strongly bounded random cascades. Annals of Applied Probability 2, pp. 819-845, 1992.
[10] G. Kaiser. A friendly guide to wavelets, Birkh~user, Boston, 1994.
ACM SIGCOMM 28 Computer Communication Review
[11] T. G. Kurtz. Limit theorems for workload input models. In F. P. Kelly, S. Zachary, and I. Ziedins, editors, Stochastic Networks: Theory and Applications. Clarendon Press, Oxford, 1996.
[12] W. E. Leland, M. S. Taqqu, W. Willinger and D. V. Wilson. On the self-similar nature of Ethernet traffic (Extended Version). IEEE/ACM Transactions on Networking 2, pp. 1-15, 1994.
[13] Y. Meyer. Wavelets and operators, Cambridge University Press, Cambridge, UK, 1993.
[14] V. Paxson and S. Floyd. Wide area traffic: The failure of poisson modeling. IEEE/ACM Transactions on Networking 3, pp. 226-244, 1995.
[15] R. H. Riedi and J. Levy Vehel. Multifractal properties of TCP traffic: A numerical study. Preprint, 1997.
[16] W. Stevens. TCP/IP Blustrated, Volume 1: The Protocols, Addison-Wesley, Reading, MA, 1994.
[17] M. S. Taqqu, V. Teverovsky and W. Willinger. Is network traffic self-similar or multifractal? Fractals 5, pp. 63-73, 1997.
[18]
[19]
[20]
W. Willinger, M. S. Taqqu, and A. Erramilli. A bibliographical guide to self-similar traffic and performance modeling for modern high-speed networks. In F. P. Kelly, S. Zachary, and I. Ziedins, editors, Stochastic Networks: Theory and Applications, pages 339-366. Clarendon Press, Oxford, 1996.
W. Willinger, V. Paxson, and M. S. Taqqu. Self-similarity and heavy tails: Structural modeling of network Traffic. To appear in R. Adler, R. Feldman, and M. S. Taqqu, editors, A Practical Guide to Heavy Tails: Statistical Techniques for Analyzing Heavy Tailed Distributions, Birkhauser Verlag, Boston.
W. Willinger, M. S. Taqqu, R. Sherman, and D. V. Wilson. Self-similarity through high-variability: Statistical analysis of Ethernet LAN traffic at the source level. IEEE/ACM Transactions on Network- ing 5, pp. 71-86, 1997.
Anja Feldmann, Anna C. Gilbert, Walter Willinger AT&T Labs-Research Florham Park, NJ 07932-0971, USA Email: {anja , agilbert, walter}@research.att.com
Thomas G. Kurtz Center for the Mathematical Sciences University of Wisconsin at Madison Madison, WI 53717 Emaih kurtzQmath.wisc.edu