30
The Changing US Beer Market - Dr. Bart Watson, Brewers Association

The Changing US Beer Market
- Dr. Bart Watson, Brewers Association
0
1000
2000
3000
4000
5000
6000
700018
73
18
75
18
77
18
79
18
81
18
83
18
85
18
87
18
89
18
91
18
93
18
95
18
97
18
99
19
01
19
03
19
05
19
07
19
09
19
11
19
13
19
15
19
17
19
19
19
32
19
34
19
36
19
38
19
40
19
42
19
44
19
46
19
48
19
50
19
52
19
54
19
56
19
58
19
60
19
62
19
64
19
66
19
68
19
70
19
72
19
74
19
76
19
78
19
80
19
82
19
84
19
86
19
88
19
90
19
92
19
94
19
96
19
98
20
00
20
02
20
04
20
06
20
08
20
10
20
12
20
14
20
16
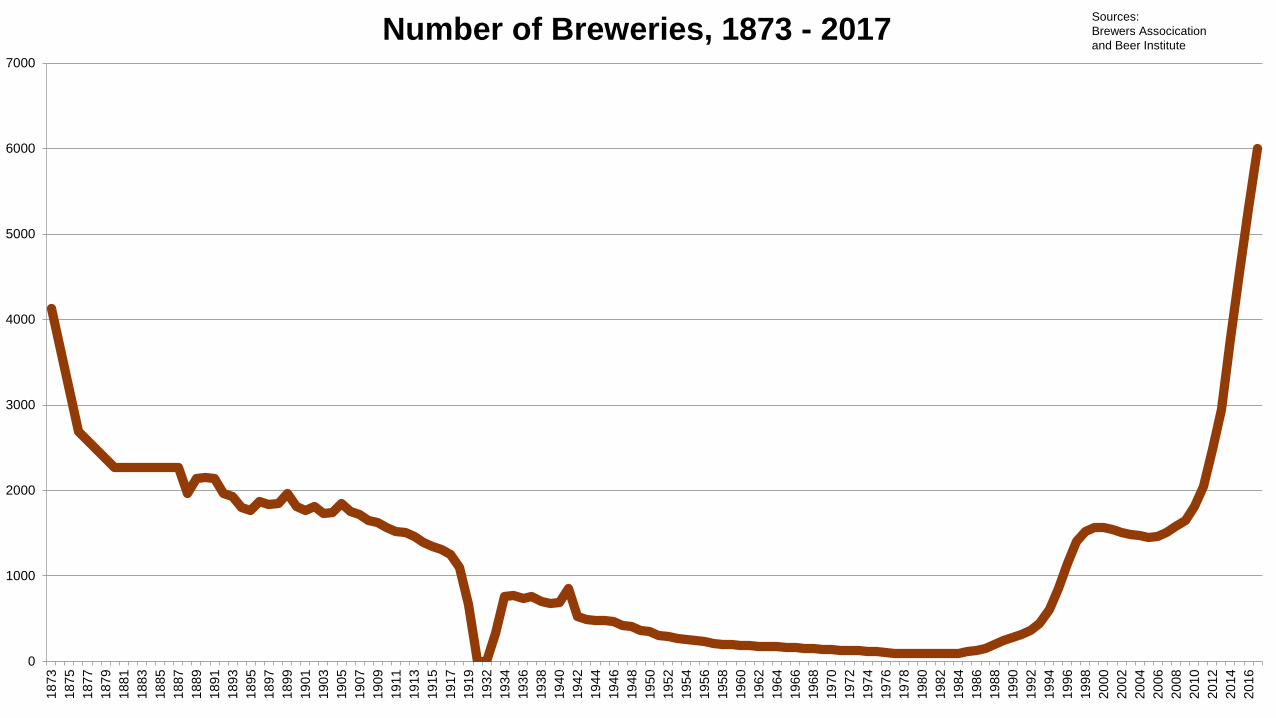
Number of Breweries, 1873 - 2017Sources:
Brewers Assocication
and Beer Institute
0
1,000
2,000
3,000
4,000
5,000
6,000
7,000
8,000
9,000
10,000
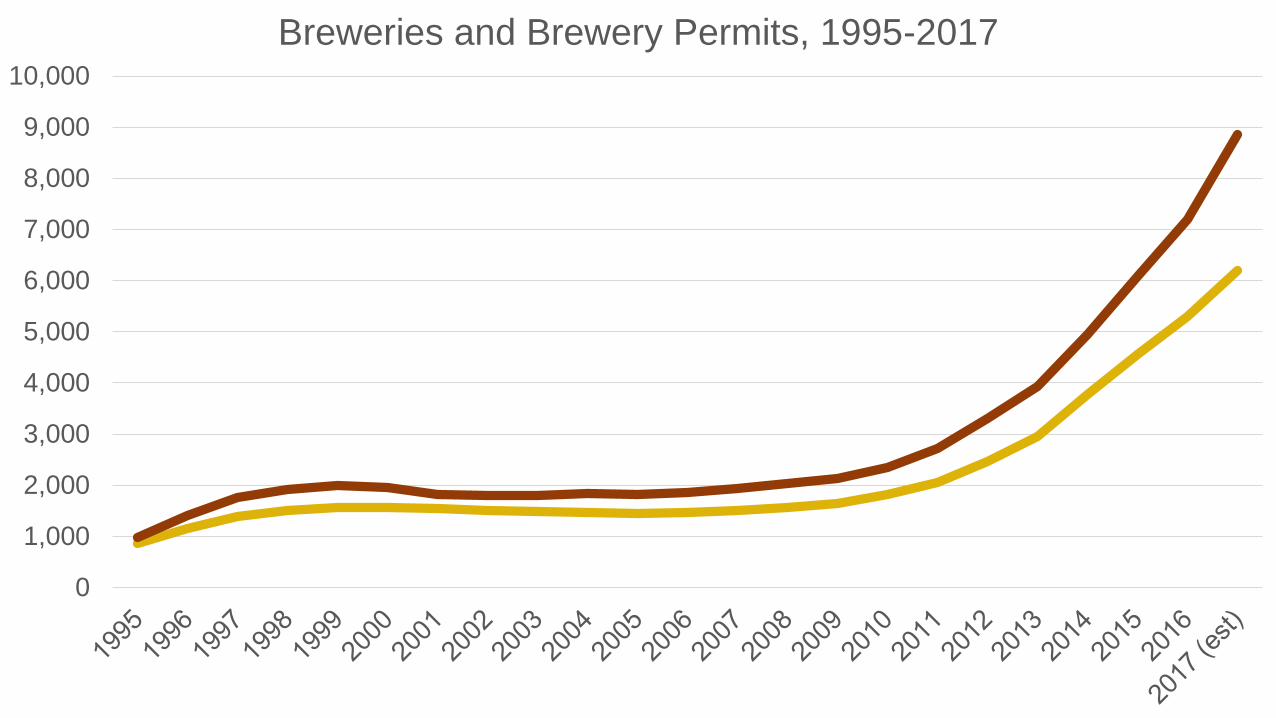
Breweries and Brewery Permits, 1995-2017

0%
10%
20%
30%
40%
50%
60%
70%
80%
90%
100%
1950 1955 1960 1965 1970 1975 1980 1985 1990 1995 2000 2005 2010 2015
Beer's Premiumization Trends
Tier 1 (Old Regionals + Value) Tier 2 (Premium) Tier 3 (Craft, Import, SuperPremium, FMB)

-1,000
0
1,000
2,000
3,000
4,000
5,000
6,000
7,000
2013 2014 2015 2016 2017
Beer, High End Growth, 2013-2017 (est)
Craft/Specialty Superpremium FMB/Cider Import

Comparative
Brewery Growth

DEPARTMENT OF THE TREASURY
Alcohol and Tobacco Tax and Trade Bureau
NUMBER OF BREWERS BY PRODUCTION SIZE - CY 2016Revised: 10/25/2017
Production Size - CY 2016
Barrels (31 gallons) Number of Breweries Taxable Removals % of Breweries % of Removals
6,000,001 Barrels and Over 14 119,774,531.97 0.3% 69.3%
2,000,000 to 6,000,000 Barrels 7 25,147,830.59 0.1% 14.5%
1,000,001 to 1,999,999 Barrels 4 4,994,536.90 0.1% 2.9%
500,001 to 1,000,000 Barrels 6 4,014,943.39 0.1% 2.3%
100,001 to 500,000 Barrels 45 8,618,323.45 0.9% 5.0%
60,001 to 100,000 Barrels 38 2,395,062.26 0.7% 1.4%
30,001 to 60,000 Barrels 53 2,069,205.94 1.0% 1.2%
15,001 to 30,000 Barrels 75 1,341,223.91 1.5% 0.8%
7,501 to 15,000 Barrels 148 1,351,541.96 2.9% 0.8%
1,001 to 7,500 Barrels 935 2,282,897.14 18.3% 1.3%
0 to 1,000 Barrels 3,771 967,080.60 74.0% 0.6%
Total 5,096 172,957,178.11 100.0% 100.0%

2016 US Breweries by Size
69.3%
17.4%
7.3% 5.5%0.6%0.3% 0.2% 1.0%
24.5%
74.0%
0.0%
10.0%
20.0%
30.0%
40.0%
50.0%
60.0%
70.0%
80.0%
6M+ 1M to 6M 100,001 to 1M 1,001 to 100,000 0 to 1,000
% of Taxable Removals % of Breweries

0
2
4
6
8
10
12
14
16
18
20
0 200 400 600 800 1000 1200
U.S. States, TTB Brewery Permits, Permits per Capita, 2017
U.S. Average

Beverage Alcohol, Demographics, &
Economics

Alcohol Consumption Over TimeDo You Have Occasion to Drink Alcohol?
0
10
20
30
40
50
60
70
80
Perc
ent
who s
aid
“Y
es”
Source: Gallup Poll, 2016.

Per Capita Consumption of Ethanol U.S. from 2000 to 2016
ABV for Beer 4.6%, Wine 11.5% Spirits 38%
1.43 1.24
0.3
0.4
0.7 0.9
0
0.5
1
1.5
2
2.5
3
2000 2001 2002 2003 2004 2005 2006 2007 2008 2009 2010 2011 2012 2013 2014 2015 2016
Ga
llon
s P
er
LD
A
Beer Wine Spirits
0.0
2.0
4.0
6.0
8.0
10.0
12.0
14.0
16.0
18.0Jan-0
4
May-0
4
Sep-0
4
Ja
n-0
5
May-0
5
Sep-0
5
Jan-0
6
May-0
6
Sep-0
6
Jan-0
7
May-0
7
Sep-0
7
Jan-0
8
Ma
y-0
8
Sep-0
8
Jan-0
9
May-0
9
Sep-0
9
Jan-1
0
May-1
0
Sep-1
0
Jan-1
1
May-1
1
Se
p-1
1
Jan-1
2
May-1
2
Sep-1
2
Jan-1
3
May-1
3
Sep-1
3
Jan-1
4
May-1
4
Sep-1
4
Ja
n-1
5
May-1
5
Sep-1
5
Jan-1
6
May-1
6
Sep-1
6
Jan-1
7
May-1
7
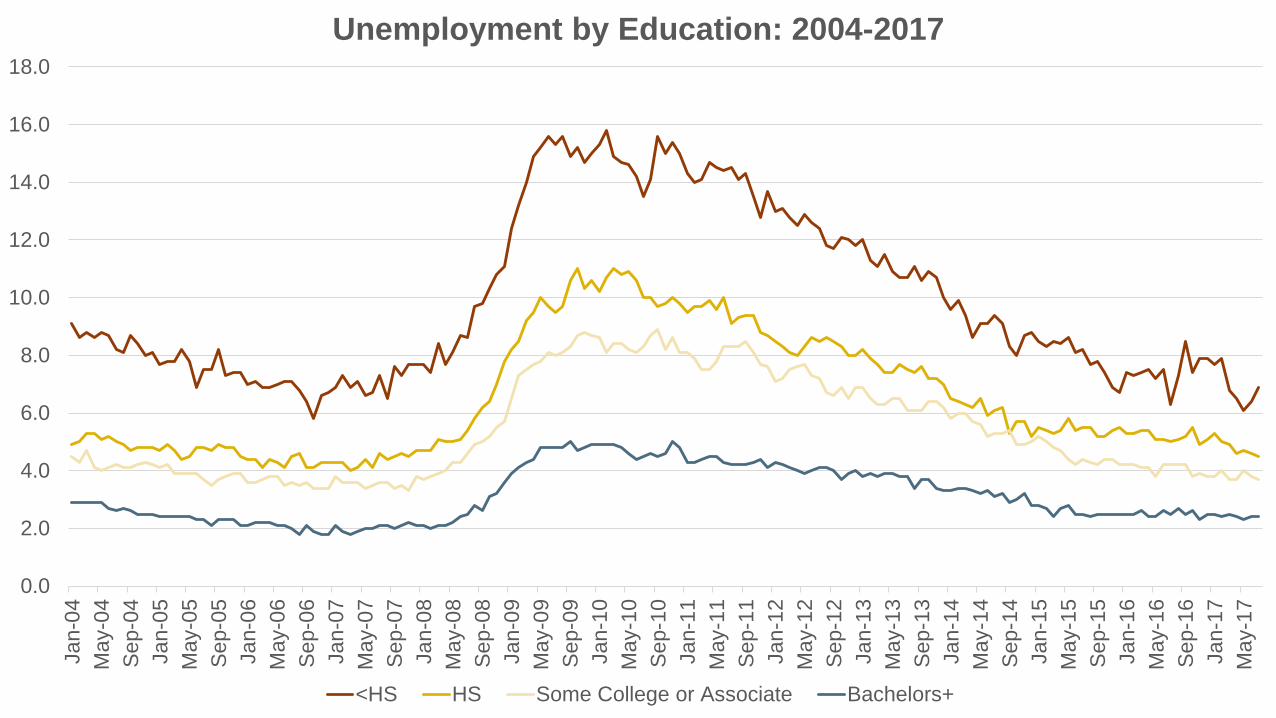
Unemployment by Education: 2004-2017
<HS HS Some College or Associate Bachelors+

The Changing Craft/Beer Industry
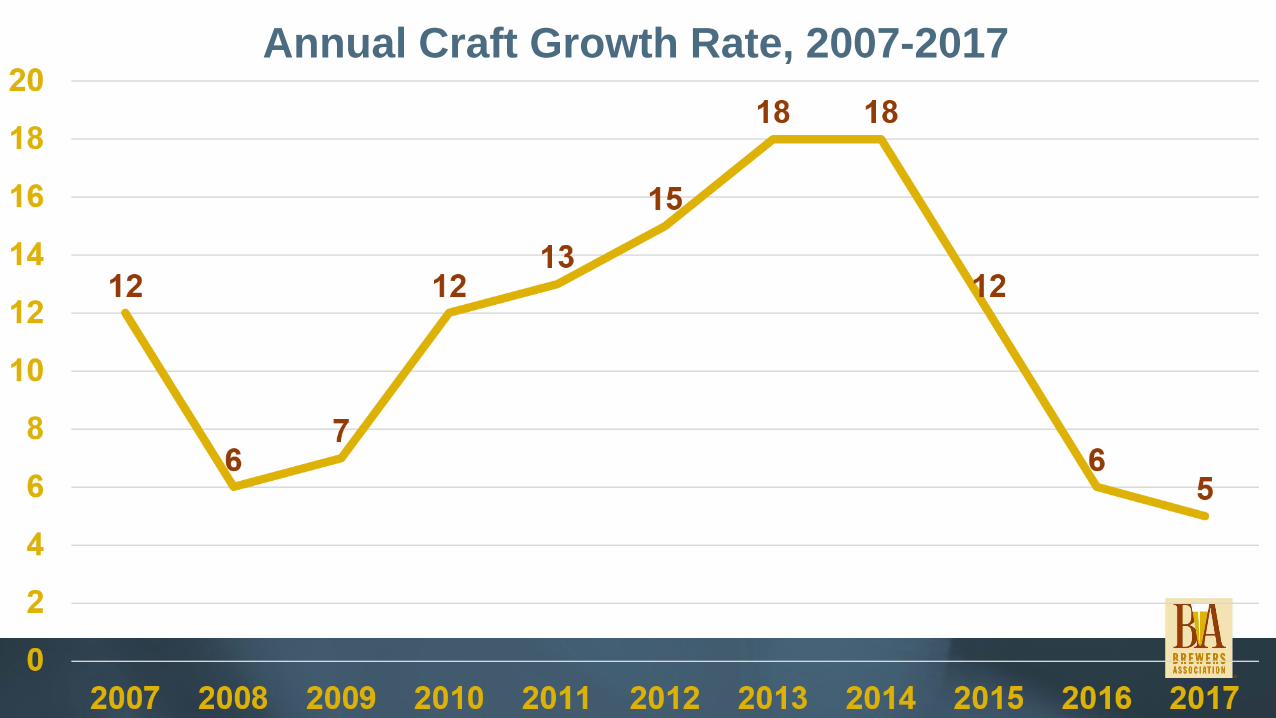
Annual Craft Growth Rate, 2007-2017

At home remains key location for craft beer drinkers, with increases outside the home
Which of the following describe when you typically drink craft beer? Please select all that apply.
Source: Nielsen's Craft Beer Insights Poll (CIP) conducted June 2016 by Harris Poll (n=1,018 Craft Drinkers; n=555 weekly craft drinkers)
AT HOME/AT A
FRIEND’S
HOME
GROWING
OCCASIONS
DOWN VS.
YEAR AGO
While eating out at a
RESTAURANT
While out with my
friends at a
BAR/CLUBWhile visiting a
CRAFT BREWERY
At an OUTDOOR recreational activity
During a craft brewing
FESTIVAL/EVENT
87% of TOTAL
Craft Beers
Drinkers
93% of
WEEKLY Craft
Beers Drinkers
? ?
?
?
??
??
??
?
?
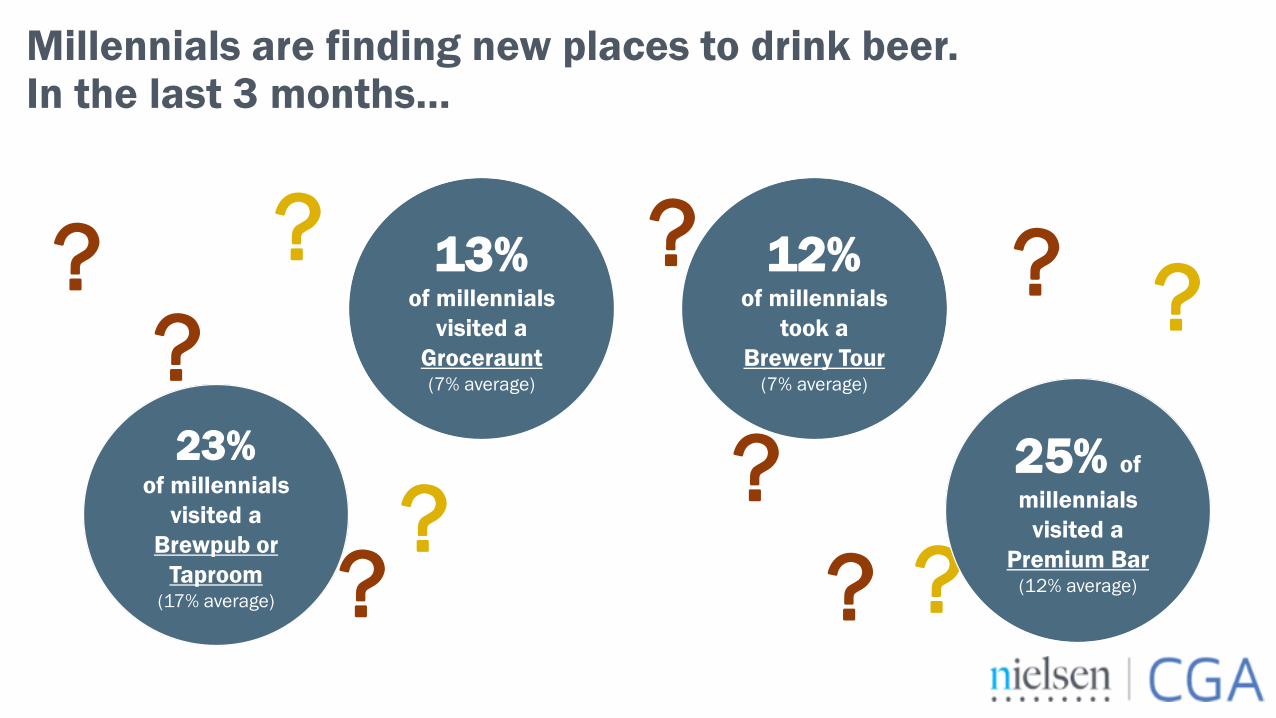
?23% of millennials
visited a
Brewpub or
Taproom(17% average)
25% of
millennials
visited a
Premium Bar(12% average)
13% of millennials
visited a
Groceraunt(7% average)
?
Millennials are finding new places to drink beer. In the last 3 months…
12% of millennials
took a
Brewery Tour(7% average)
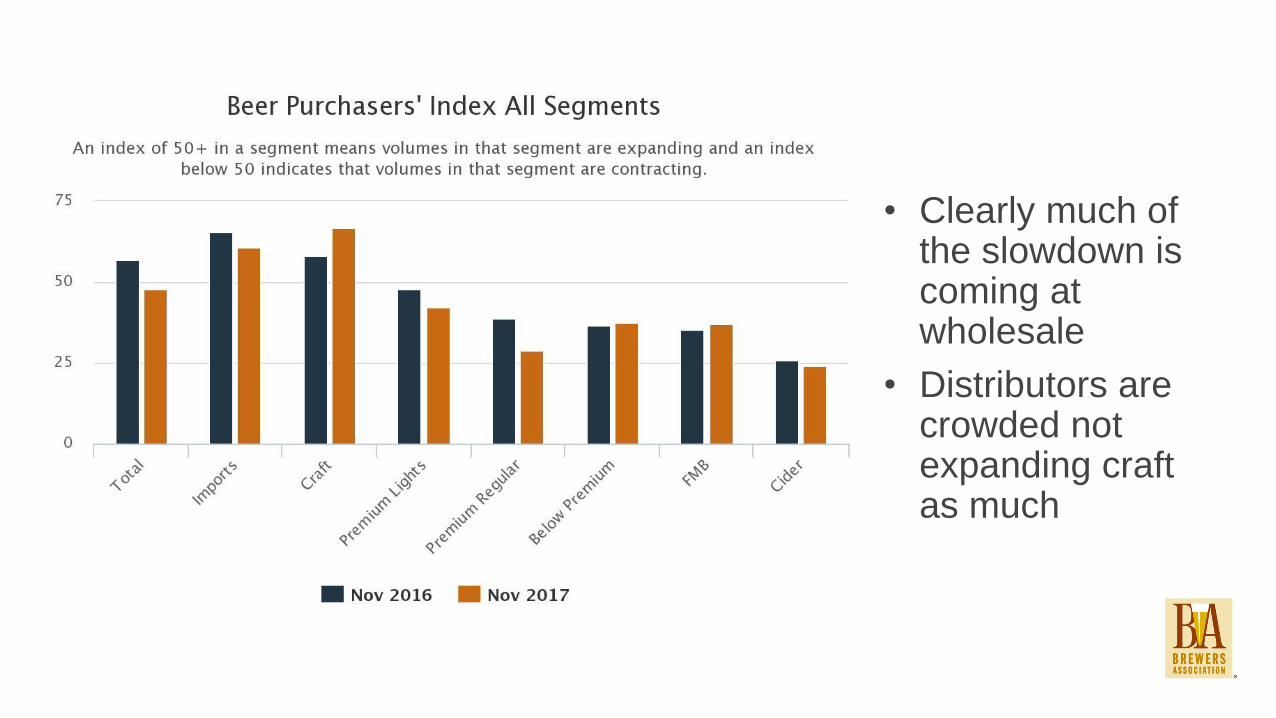
• Clearly much of the slowdown is coming at wholesale
• Distributors are crowded not expanding craft as much

AND INCREASINGLY A THIRD CHANNEL STORYEspecially for Millennials at the High End
• Source: Nielsen Bev Al Generations Study - 2016
• Q: What percentage of the time did you make your purchase at each of the following places/venues?
% OF TIME PURCHASES MADE
AT…
OFF PREMISE
Retail Store
ON PREMISE
Bar/Restaurant
3rd SPACE
CHANNEL
DM NON CRAFT (total 21+) 56% 34% 9%
DM NON CRAFT – MILLENNIALS 55% 34% 11%
IMPORTS (total 21+) 52% 35% 13%
IMPORTS – MILLENNIALS 41% 35% 23%
CRAFT (total 21+) 43% 40% 17%
CRAFT – MILLENNIALS 40% 37% 23%
3rd space channel here includes…
Sporting events; Music Festivals; Tasting rooms

Number of Bars (NAICS 72241)
0
10,000
20,000
30,000
40,000
50,000
60,000
2001 2002 2003 2004 2005 2006 2007 2008 2009 2010 2011 2012 2013 2014 2015 2016
Source: QCEW (2017)

Brewery Visits are Partially New Occasions

How important is “local” in purchase decisions?
67
45
34
23
71
53
34
25
0
10
20
30
40
50
60
70
80
Craft Beer Wine Spirits
Nielsen Surveys: Sum of very/somewhat important
Total 21+ 21-34
Source: Nielsen Quick Query Omnibus Survey, 12-17, 2015. (Base: LDA consumers who drink at least several times per year)

Source: IRI MULO+C, Total US, YTD thru 12/24/17
Total US for Small Brewers
Brewer Size (CEs)
Growth %YTD % Volume
1,000,000+ -1.7% 61.2%
100k to 1M 6.0% 24.5%
10K to 100K 17.1% 12.1%
Less than 10K+ New
58.5% 2.2%

So far in Production Survey…
2016 Size (bbls) % of 2017 Growth (of total)
>100,000 -11.9%
10K-100K 38.9%
<10K 72.9%
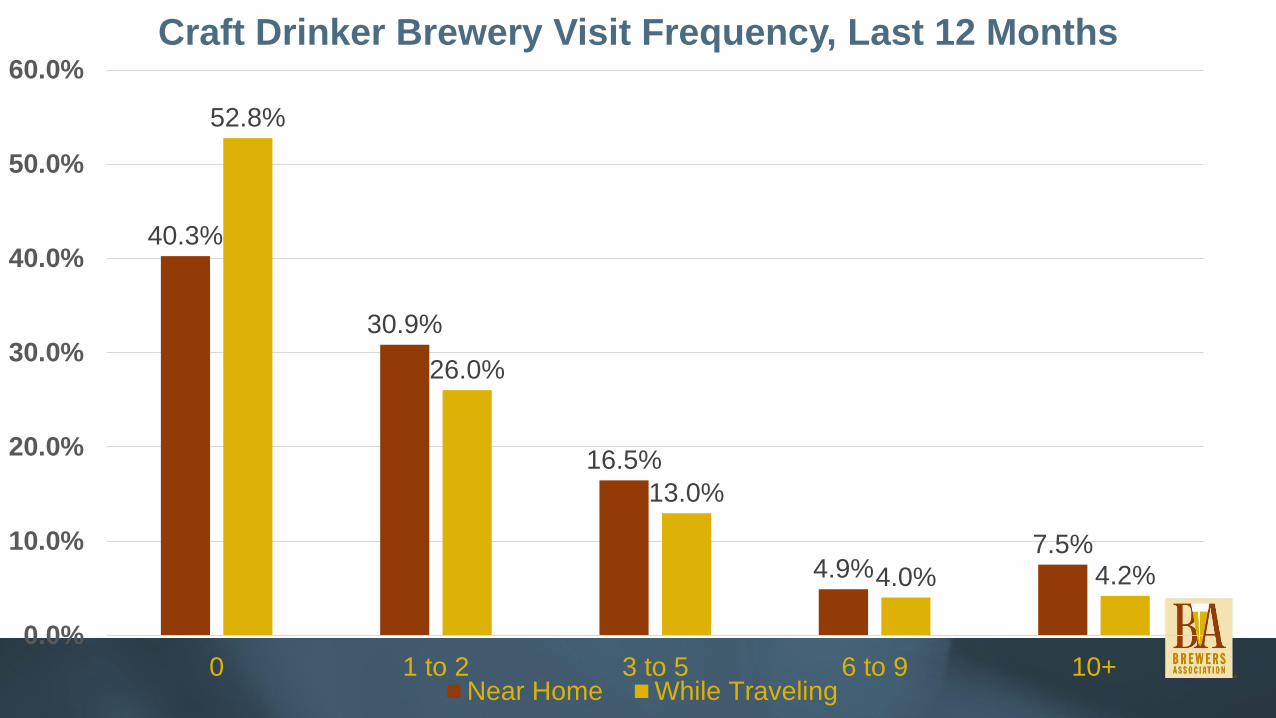
40.3%
30.9%
16.5%
4.9%7.5%
52.8%
26.0%
13.0%
4.0% 4.2%
0.0%
10.0%
20.0%
30.0%
40.0%
50.0%
60.0%
0 1 to 2 3 to 5 6 to 9 10+
Craft Drinker Brewery Visit Frequency, Last 12 Months
Near Home While Traveling
0
200,000
400,000
600,000
800,000
1,000,000
1,200,000
1,400,000
1,600,000
1,800,000
2,000,000
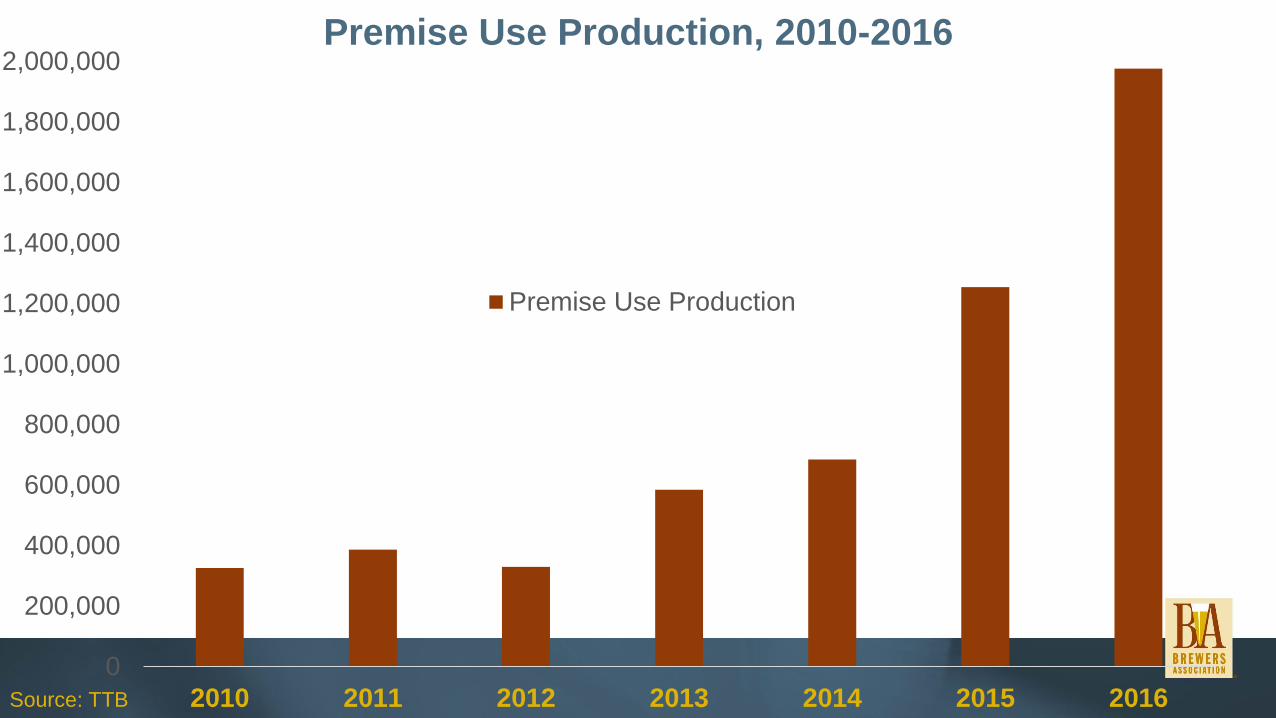
2010 2011 2012 2013 2014 2015 2016
Premise Use Production, 2010-2016
Premise Use Production
Source: TTB
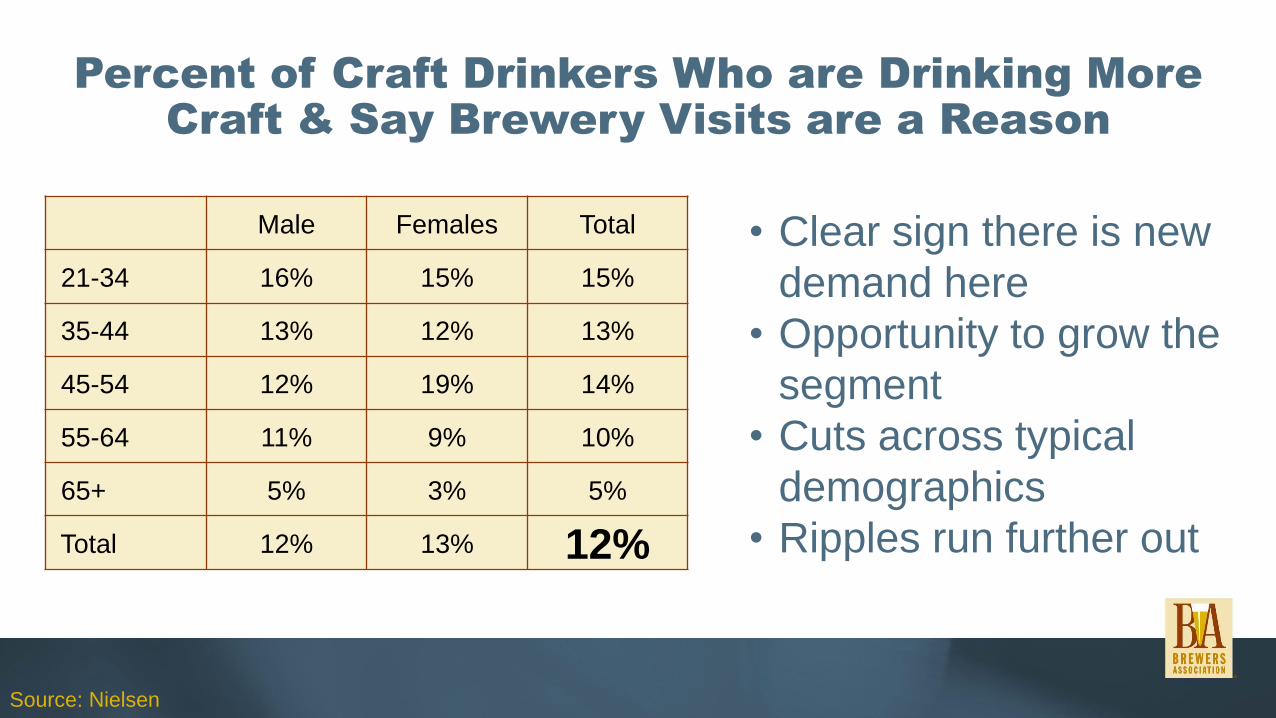
Percent of Craft Drinkers Who are Drinking More Craft & Say Brewery Visits are a Reason
Male Females Total
21-34 16% 15% 15%
35-44 13% 12% 13%
45-54 12% 19% 14%
55-64 11% 9% 10%
65+ 5% 3% 5%
Total 12% 13% 12%
• Clear sign there is new
demand here
• Opportunity to grow the
segment
• Cuts across typical
demographics
• Ripples run further out
Source: Nielsen

Copyrig
ht
© 2
017 T
he N
iels
en C
om
pany.
Confid
entia
l and p
roprie
tary
.
A VISIT TO A CRAFT BREWERY HAS SIGNIFICANT, AND INCREASING POST-VISIT SALES BENEFITS
After your visit(s) to a craft brewery, which of the following describe how, if at all, your purchasing habits of that craft brewer’s products changed?
Source: Nielsen's Craft Beer Insights Poll (CIP) conducted June 2017 by Harris Poll (n=1,188 Craft Drinkers; n=379 weekly craft drinkers)
Base: Among those who visited Craft Brewery
19%
35%
54% 49%
36%
32%
20% 25%
ALL CRAFTDRINKERS
WEEKLY CRAFTDRINKERS
West Weekly CraftDrinkers
Weekly CraftDrinkers 21-34
Purchasing a lot more Purchasing a little more
55%
>55% among 21-54(64% men 21-34)
70% among $100K+
67%74% 74%
2015/16
16%/24%
2015/16
11%/16%
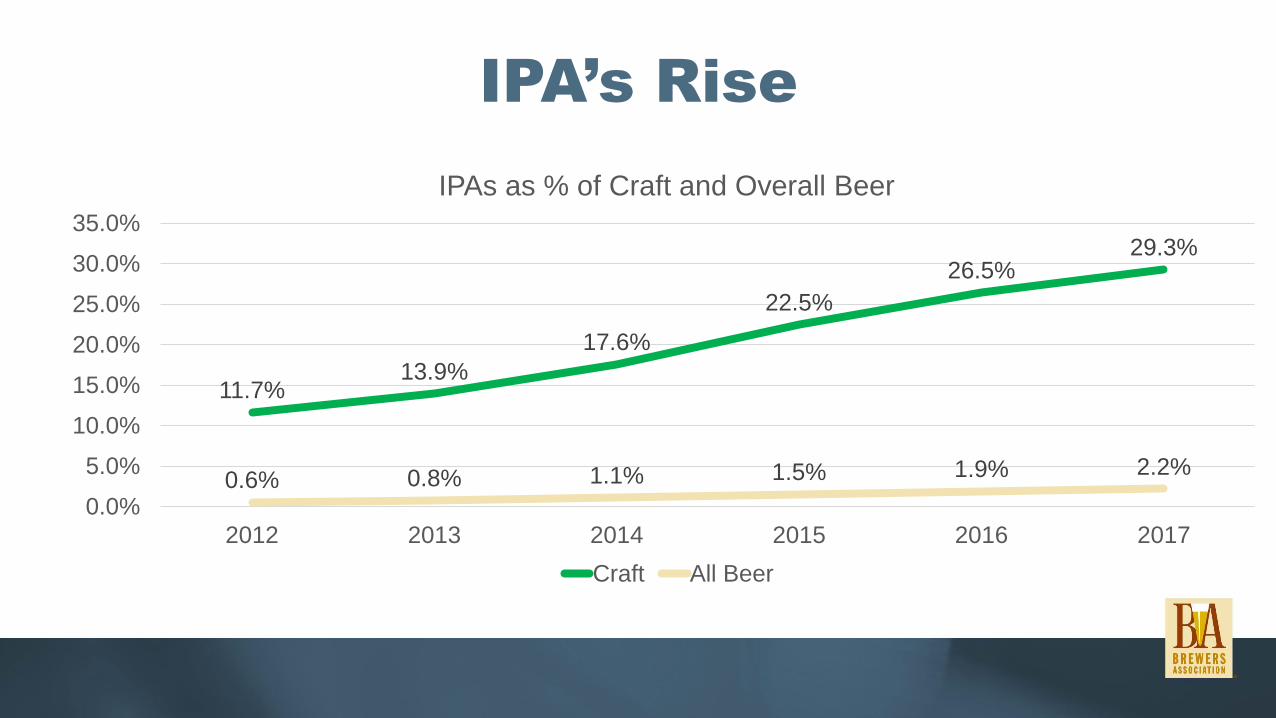
IPA’s Rise
11.7%13.9%
17.6%
22.5%
26.5%29.3%
0.6% 0.8% 1.1% 1.5% 1.9% 2.2%
0.0%
5.0%
10.0%
15.0%
20.0%
25.0%
30.0%
35.0%
2012 2013 2014 2015 2016 2017
IPAs as % of Craft and Overall Beer
Craft All Beer


