1 The Charles Edward Via, Jr. Department of Civil and Environmental Engineering VIRGINIA POLYTECHNIC INSTITUTE 418 New Engineering Building, Mail Code 0246 AND STATE UNIVERSITY Blacksburg, Virginia 24061 Phone: (540) 231-7236 Fax: (540) 231-7916 Aaron Yeow, M.P.H. U.S. Environmental Protection Agency (U.S. EPA) Science Advisory Board (SAB) 1200 Pennsylvania Avenue, NW, (1400R) Washington, DC 20460 April 27, 2011 Re: Marc Edwards Submission to EPA SAB on the Issue of Partial Pipe Replacement Dear Aaron, Attached are documents that might be useful to the EPA SAB in their consideration of partial pipe replacements including the following: 1) Marc Edwards Conflict of Interest Statement (pages 1-3) 2) "Flawed Science Begets Flawed Policy" Lambrinidou/Edwards (pages 4-16) 3) 1997 E-mail of Mike Schock (produced by Freedom of Information Act) pages 17-18 4) Excerpt of Edwards' 2004 Congressional Testimony (pages 19-20) 5) Exemplary notarized letter sent from Marc Edwards to EPA in early 2004 (page 21-27) 6) No pages 28-38: Copyright permission not obtained. 8) Exemplary Use of Reiber Report to Congress, April 2008 (39) 9) Edwards Critique of the Reiber and Dufresne Study May 2008, with background information derived from Marc Edwards Freedom of Information Act Request (pages 40-68) 10) Nguyen et al., 2009 WQTC presentation. (pages 69-77) 11) Nguyen et al., 2010 Webcast slides. (pages 78-95) 12) No pages 96-137: Copyright permission not obtained. 13) Cartier et al., 2011. Poster: Effect of Flow Rate and Lead/Copper Pipe Sequence and Junction Types on Galvanic and Deposition Corrosion of Lead Pipe (page 138) 14) Triantafyllidou et al., Lead (Pb) in Tap Water and in Blood: A Critical Review (139- 194) 15) Edwards' Comment on Brown et. al, 2010 (195) 16) Excerpt of Edwards Congressional Testimony 2011 (pages 196-198) My phone is (540) 231-7236 if you should have questions about this submission. Marc Edwards Charles Lunsford Professor of Civil Engineering Virginia Tech
Transcript
1
The Charles Edward Via, Jr. Department of
Civil and Environmental Engineering VIRGINIA POLYTECHNIC INSTITUTE 418 New Engineering Building, Mail Code 0246 AND STATE UNIVERSITY Blacksburg, Virginia 24061
Phone: (540) 231-7236 Fax: (540) 231-7916 Aaron Yeow, M.P.H. U.S. Environmental Protection Agency (U.S. EPA) Science Advisory Board (SAB) 1200 Pennsylvania Avenue, NW, (1400R) Washington, DC 20460 April 27, 2011 Re: Marc Edwards Submission to EPA SAB on the Issue of Partial Pipe Replacement Dear Aaron, Attached are documents that might be useful to the EPA SAB in their consideration of partial pipe replacements including the following:
1) Marc Edwards Conflict of Interest Statement (pages 1-3) 2) "Flawed Science Begets Flawed Policy" Lambrinidou/Edwards (pages 4-16) 3) 1997 E-mail of Mike Schock (produced by Freedom of Information Act) pages 17-18 4) Excerpt of Edwards' 2004 Congressional Testimony (pages 19-20) 5) Exemplary notarized letter sent from Marc Edwards to EPA in early 2004 (page 21-27) 6) No pages 28-38: Copyright permission not obtained. 8) Exemplary Use of Reiber Report to Congress, April 2008 (39) 9) Edwards Critique of the Reiber and Dufresne Study May 2008, with background
information derived from Marc Edwards Freedom of Information Act Request (pages 40-68)
10) Nguyen et al., 2009 WQTC presentation. (pages 69-77) 11) Nguyen et al., 2010 Webcast slides. (pages 78-95) 12) No pages 96-137: Copyright permission not obtained. 13) Cartier et al., 2011. Poster: Effect of Flow Rate and Lead/Copper Pipe Sequence and
Junction Types on Galvanic and Deposition Corrosion of Lead Pipe (page 138) 14) Triantafyllidou et al., Lead (Pb) in Tap Water and in Blood: A Critical Review (139-
194) 15) Edwards' Comment on Brown et. al, 2010 (195) 16) Excerpt of Edwards Congressional Testimony 2011 (pages 196-198)
My phone is (540) 231-7236 if you should have questions about this submission. Marc Edwards
Charles Lunsford Professor of Civil Engineering Virginia Tech
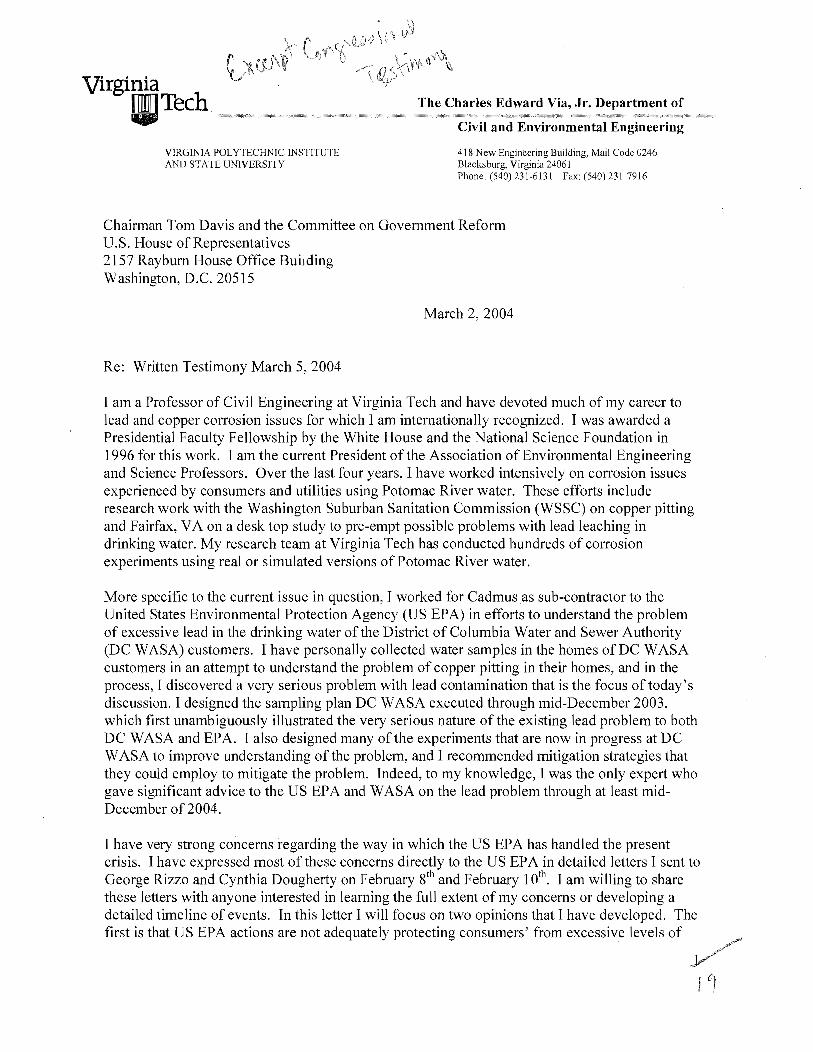
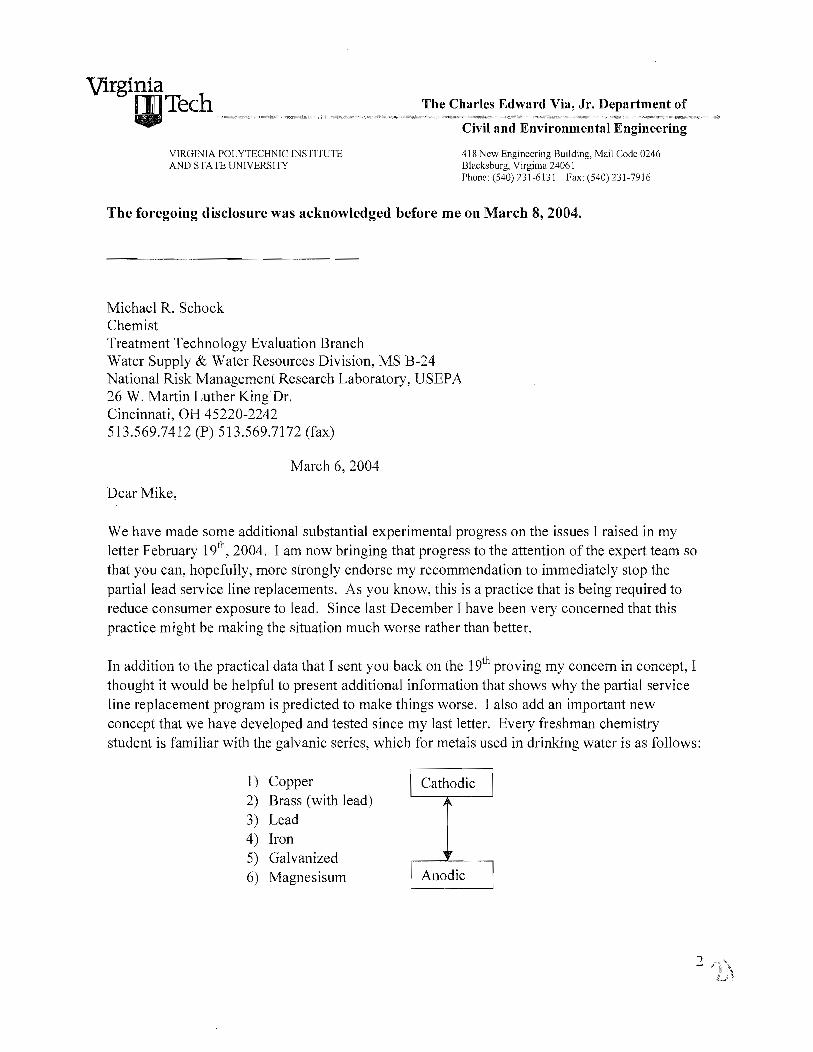
Conflict of Interest Statement: Partial Pipe Replacements. Marc Edwards-Virginia Tech
Dr. Marc Edwards has been outspoken against partial pipe replacements as they are currently practiced under the EPA Lead and Copper Rule. He gave testimony to Congress in 2004 indicating that his experiments showed that the practice sometimes created spikes of lead in water, posed a serious public health hazard, and requesting that the practice be banned in Washington D.C. until the EPA proved that partial replacements were beneficial. Several notarized letters outlining his concerns were sent to appropriate authorities in 2004. The practice was banned temporarily in 2004. After a study (Wujek et al, 2004) claimed that lead spikes did not occur in Washington D.C. after partial replacements, and allegedly contradicting research of Dr. Edwards and other investigators, the partial pipe replacements were resumed. Alarmed at spikes of lead that he later personally measured after partial replacements in Washington D.C. homes, Dr. Edwards conducted a Freedom of Information Act (FOIA) request of EPA RIII in 2005, 2006 and 2007 related to partial replacements in Washington DC, and to examine the scientific evidence for EPA RIII public claims that lead spikes did not occur after partial pipe replacements. The FOIAs revealed that the Wujek study was actually conducted in a brief period of time in which chloramine was not present in the water, but free chlorine was. It was perfectly obvious to EPA RIII and their consultants that free chlorine inhibited lead corrosion, and their e-mails acknowledge that the purported "benefits" from partial replacements described in Wujek et al. 2004 were probably due to the presence of chlorine. On the basis of Dr. Edwards’ work, and after reporters began to question EPA RIII on this issue, this critical omission was finally acknowledged 6 years after the study was conducted (http://www.epa.gov/dclead/links.htm):
Note (March 2010): The Wujek (2004) paper discussed in section 2.5.3 does not mention that the post-partial replacement samples were collected during a temporary free chlorine treatment period, a treatment regime associated with lower lead levels.
Dr. Edwards conducted a FOIA with Dr. Yanna Lambrinidou (Founder, Parents for Non-Toxic Alternatives) of the DC Department of Health in 2007, which revealed that a high percentage of Washington D.C. children with lead-poisoning lived in homes with partially replaced pipes. Dr. Edwards’ FOIAs further revealed that EPA RIII and DC WASA had sampling data since late 2004, indicating lead spikes did occur after partial replacements, contradicting their prior public statements. In more than a dozen samples the lead spikes measured by the utility (and reported to EPA RIII) after partial pipe replacements exceeded 5,000 ppb lead. Dr. Edwards presented information about these spikes in testimony to the D.C. Council on this issue in 2008. That testimony helped stop partial pipe replacements in Washington D.C., although they still occur in some cases. Dr. Edwards also determined that a DC WASA employee (Rich Giani) was mistaken about DC WASA's practices related to partial pipe replacement. Specifically, for more than 4 years, Mr. Giani repeatedly stated that DC WASA had always used a dielectric during partial pipe replacements. This fact would imply that Dr. Edwards' concerns about galvanic
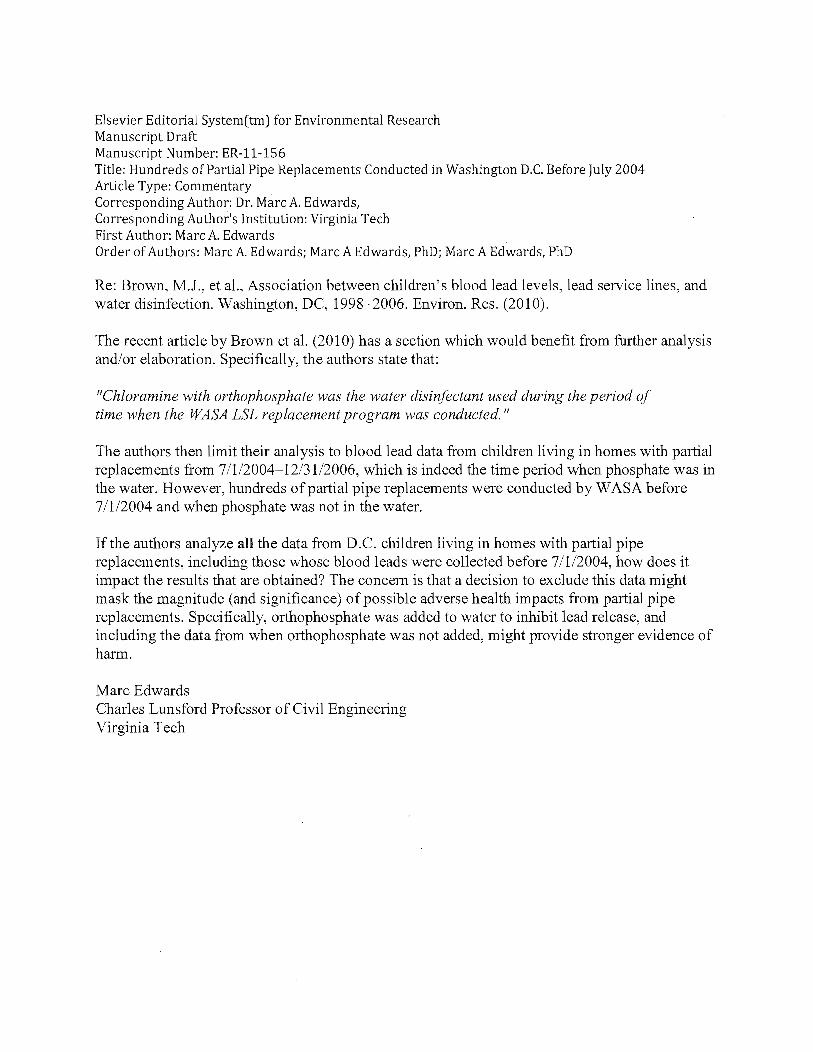
corrosion at Washington, D.C. homes were without basis, and cast into doubt results of his voluntary sampling in homes of D.C. residents which showed long-term problems associated with the practice. Mr. Giani's mistaken assertions about the utility’s use of dielectrics appeared in a later EPA RIII report written by Dr. Steve Reiber (Reiber and Dufresne, 2006). After years of investigation on the issue by Dr. Edwards, including trips to personally observe partial replacements that did not use a dielectric in Washington D.C., DC WASA and EPA RIII eventually acknowledged that dielectrics had never been used for partial replacements. EPA RIII published a correction on this issue (http://www.epa.gov/dclead/links.htm). Dr. Edwards has also conducted a FOIA for documents related to the above EPA RIII study (Reiber and Dufresne, 2006), which contradicted decades of prior research, and claimed that even in the worst case galvanic corrosion from partial pipe replacements had inconsequential impacts on lead in water. The study further claimed that partial pipe replacements in Washington, D.C. were part of an effective program to reduce lead in water, and the D.C. lead pipe replacement program was presented as the "Solution" to lead in water and utility liability associated with lead service lines. The Reiber et al. document has repeatedly been given to the U.S. Congress and other entities by the U.S. EPA, as "proof" that galvanic corrosion is insignificant. Other utilities in the U.S. and around the world have cited this document to support their own partial pipe replacement programs. After years of failed attempts to convince EPA RIII and Dr. Reiber to acknowledge limitations of the Reiber et al. study and to publish appropriate caveats (including several attempts before the final report was even written), Dr. Edwards grew concerned about how the report was repeatedly used in a manner that downplayed legitimate health concerns. Dr. Edwards then wrote a letter to the DC WASA Ad Hoc Committee on Drinking Water Quality documenting numerous scientific concerns about Reiber et al.. In that report Dr. Edwards characterized the EPA RIII study by Dr. Reiber as a “third rate hack job,” and highlighted issues with the studies approach, methods and conclusions. Dr. Edwards has given, and will continue to give, public presentations in which he cites this report, as an exemplar of unethical science and engineering. To date, EPA RIII and Dr. Reiber have refused to acknowledge, in writing, many of the obvious limitations and errors in the report. Dr. Edwards also reported on his work to Congressional Investigators, which helped prompt an investigation of the U.S. Centers for Disease Control (CDC) and Prevention, related to their studies of health effects associated with high lead in Washington, D.C.’s drinking water. The congressional investigation revealed that the CDC knew about higher incidence of lead-poisoning of D.C. children living in homes in which pipes had been partially replaced-- information that the CDC did not publicly acknowledge until issuing a health alert in 2010. Aspects of Dr. Edwards’ work on this issue are described his sworn testimony to Congress in May of 2010 and in a related Congressional Report. Under severe criticism for their actions, the CDC later wrote a peer reviewed paper in which they stated that partial pipe replacements did not significantly increase the likelihood of elevated blood lead in Washington D.C. children relative to that observed in homes with intact lead service lines (Brown, M.J., et al., 2011), even though there was a higher likelihood of elevated blood lead in children living in homes with partial pipe replacements (confidence did not exceed 95%). Unfortunately, the Brown et al. report did not use data for several hundred partial pipe replacements that were conducted before corrosion control was implemented by DC WASA. Dr. Edwards has written a comment to the journal that published the CDC paper, asking that CDC acknowledge this fact, and requesting a new statistical analysis using all the available data.
During an EPA public meeting on potential revisions to the lead and copper rule October 2008, and despite previously acknowledging the study was fatally flawed, the EPA and their consultants once again tried to present the Wujek et al. 2004 study as evidence that partial replacements reduced lead in water. Yet again, the EPA and their consultants did not mention that chlorine was in the water. Dr. Edwards once again criticized the use of the study in this manner. In response to a FOIA, EPA RIII later acknowledged that they had no data to demonstrate benefits of partial pipe replacements in reducing lead in water. Dr. Edwards has repeatedly stated that he believes there are instances in which galvanic corrosion does not cause problems, instances where galvanic corrosion does cause problems, and is committed to doing sound fundamental research to better understand the potential benefits and hazards of partial pipe replacements. He is currently collaborating with several researchers and utilities who are attempting to advance fundamental understanding of this issue. He is presenting several articles on this subject at the 2011 AWWA Conference in Washington D.C. and is advising graduate students who are conducting research on this subject. The work to date has conclusively demonstrated that galvanic corrosion is sometimes a long-term concern, consistent with decades of prior research on the subject. Dr. Edwards has also written a paper on galvanic corrosion during partial service line replacements with Simoni Triantafyllidou, parts of which were presented at AWWA National Conferences and which is under review in Journal AWWA. Several other peer reviewed papers are in progress. Dr. Edwards was recently awarded a grant from the Robert Wood Johnson Foundation along with investigators from Northeastern University, EPA and Parents for Nontoxic Alternatives to study the issue of partial pipe replacements and conduct a cost benefit analysis. That work is underway, and involves collaboration with DC WASA, EPA, and a Providence water utility. Dr. Edwards is also collaborating with Canadian researchers who are studying impacts of partial pipe replacements on lead in water. He is co-advising a Canadian researcher who is conducting his PhD work on the subject and hosted the student in his lab at Virginia Tech where he worked on a large scale pilot rig of partial pipe replacements. Dr. Edwards was asked to serve as an expert witness in a lawsuit served on behalf of lead poisoned children in Washington D.C.. He has refused to participate as a paid expert in any lawsuit related to health impacts of elevated lead on DC children, but his testimony has been subpoenaed. Some of these lawsuits may address lead poisoning of Washington D.C. children which occurred as a result of partial pipe replacements. As a final point, this disclosure does not reveal every publication, presentation and public statement by Dr. Edwards on the issue of partial pipe replacements, nor does it reflect on every negative public comment he has made regarding the behavior of EPA, DC WASA and their consultants in relation to this issue.
3/19/2011
1
Flawed sciencebegets flawed policy
APHA 138th Annual Meeting & ExpoNovember 6-10, 2010Denver, CO
begets flawed policyEPA’s Lead and Copper Rule,partial lead service line replacement,and elevated blood lead levels among children
Yanna Lambrinidou, PhD, Parents for Nontoxic Alternatives, Washington, DCMarc Edwards, PhD, Virginia Tech, Blacksburg, VA
Simoni Triantafyllidou, PhD Candidate, Virginia Tech, Blacksburg, VA
Presenter Disclosures
The following personal financial relationships with commercial interests relevant to this presentation existed during the past 12 months:
1
No relationships to disclose
Outline
1. Why is lead in drinking water a health concern?2. EPA’s Lead and Copper Rule (LCR) of 19913. Washington, DC 2001-2004: lead-in-water crisis
2
3 g , 44. 2004 and 2006 PLSLR studies5. CDC’s 2010 announcement about analysis of Washington,
DC data6. Where is the science on PLSLR today?7. Social justice: policy and practice
1.
Why is
3
leadin drinking watera health concern?
• 312 BC: Romans note high death rate of slaves involved in production of lead drinking-water pipe
4
• 2nd century BC: “Lead makes the mind give way”
Dioscorides, ancient Greek physician, pharmacologist, and botanist
November 30, 1855New York Daily Times“Iron and Lead Pipes for Carrying Water”
“Lead pipe is more conveniently laid down, as it is easily bent around large stones, and
6
easily bent around large stones, and to fit any irregularities in the soil.
Everything considered, lead pipe is to be preferred to iron for conveying water or gases under ground, even when it is required to be of such size and thickness that the first cost will be considerably higher.”
• Around 1900, >80% of large US cities used lead service lines (LSLs), especially in the Northeast and Midwest
• In the late 1800s-early 1900s, journal articles and reports from Great Britain and the US began to document lead poisonings from drinking
7
to document lead poisonings from drinking water
• By the 1920s, many US cities and states had begun revising plumbing codes to ban or limit the use of LSLs.
Troesken, 2006, The Great Lead Water Pipe Disaster.Rabin, 2008, “The Lead Industry and Lead Water Pipes,” American Journal of Public Health.
8
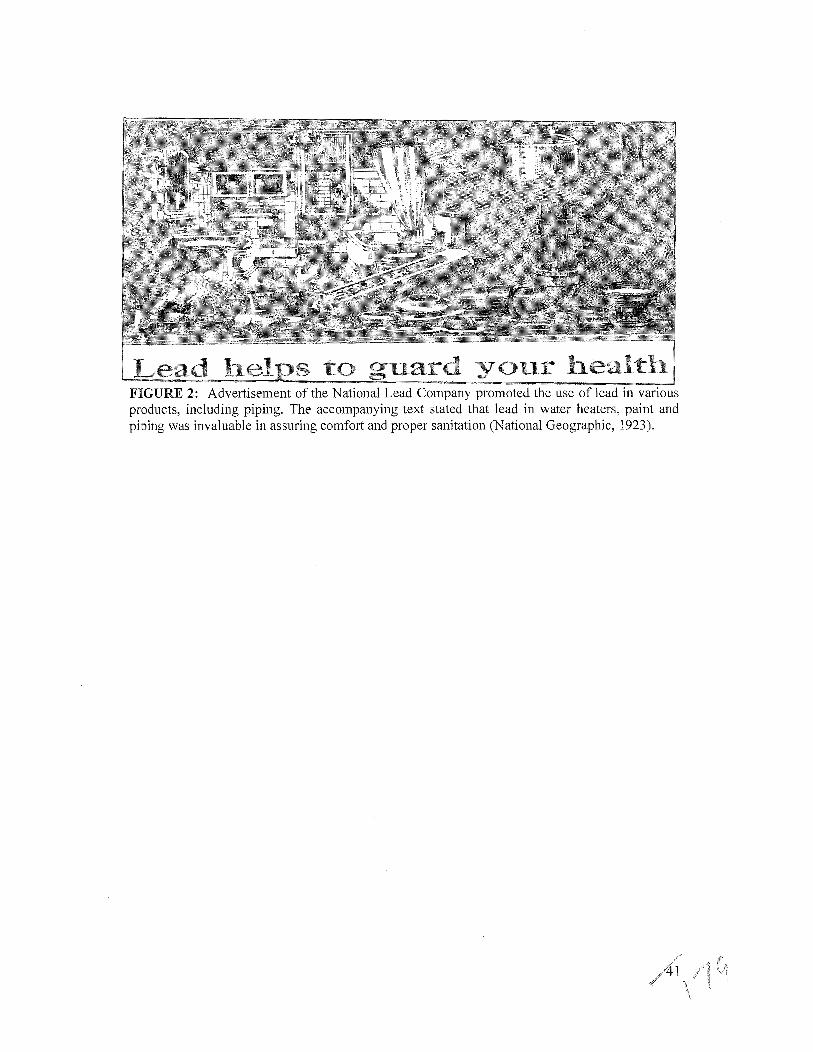
Edited from ad in National Geographic 11/1923
• Promotional campaigns by the lead industry continued until the 1970s
• The plumbing codes of large US cities like Boston, Milwaukee, San Diego, Philadelphia, Denver, and Chicago called for LSLs well into the 20th
century, and the 3 national model plumbing codes allowed the use of LSLs until the 1970s and 1980s
9
• It is believed that approximately 3.3-6.4 million LSLs were installed
• In some cities (e.g., Chicago), LSLs were required until 1986, when Congress passed the “Lead Ban” that prohibited the use of LSLs
Rabin, 2008, “The Lead Industry and Lead Water Pipes,” American Journal of Public Health.AWWA, 1990, “Lead Service Line Replacement: A Benefit-to-Cost Analysis.”
Troesken, 2005, “Historical Predictions,” Unpublished paper.Renner, 2010, “Reaction to the Solution,” Environmental Health Perspectives.
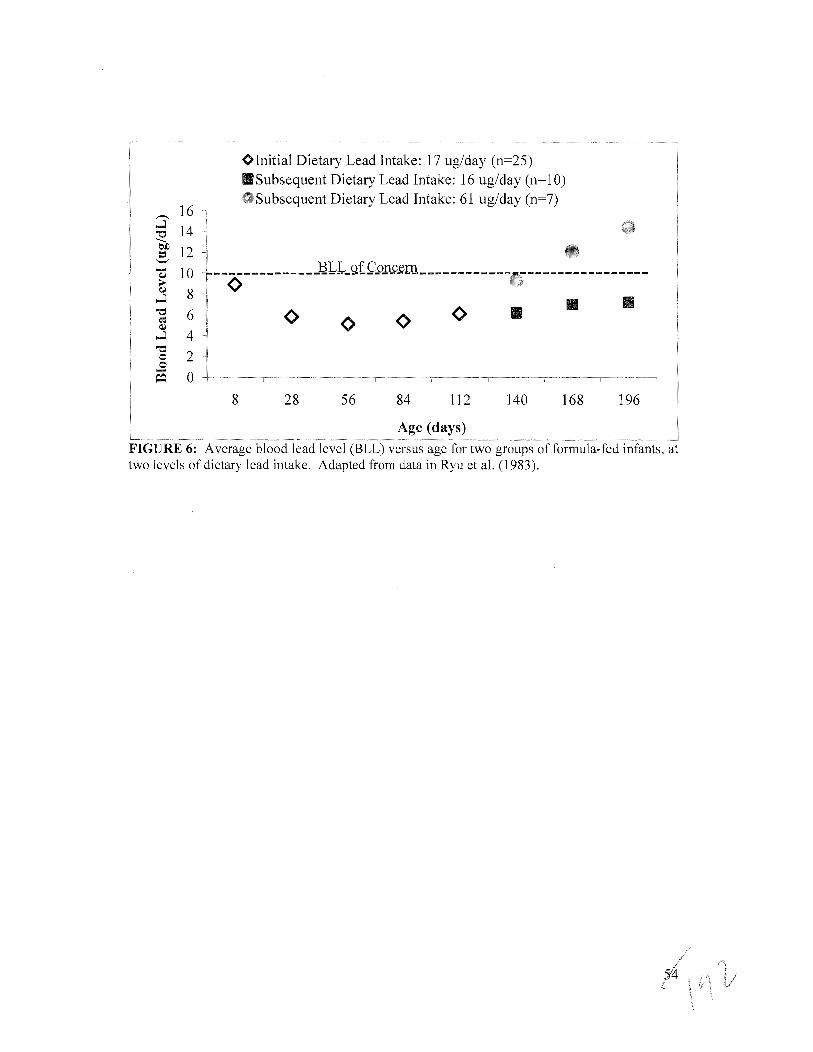
1983Ryu, J. E., Ziegler, E. E., Nelson, S. E., and Fomon, S. J. 1983. Dietary intake of lead and blood lead concentration in early infancy. American Journal of Diseases of Children 137:886–891.
12
Whole cow milk in cartons with mean
Canned cow milk or formula with mean
10 infants (3.7-6.5 months)
7 infants (3.7-6.5 months)
10 ppb lead 70 ppb lead
Iowa City, IA
13
i f i f
Whole cow milk in cartons with mean
10 ppb lead
Canned cow milk or formula with mean
70 ppb lead
10 infants (3.7-6.5 months)
7 infants (3.7-6.5 months)
Slight increase, butno elevated
blood lead levels
Elevated blood lead levels by 5.6 months
14
Study Year Location
Pocock, S. J., et al., Journal of Epidemiology and Community Health
1983 Britain
Sherlock, J. C., et al., Human Toxicology 1984 Scotland
Elwood, P. C., et al., Nature 1984 Cardiff
Lacey, R., et al., Science of the Total Environment 1985 Glasgow
Bonnefoy, X., et al., Water Research 1985 France
Raab, G. M., et al., Environmental Geochemistry & Health
1987 Edinburgh
Shannon, M. and J. W. Graef, Clinical Pediatrics 1989 Boston
Cosgrove, E. V., et al., Journal of Environmental Health
1989 Boston
15
Study Year Location
Lockitch, G., et al., Canadian Medical Association Journal
1991 Vancouver
Maes, E. F., et al., EPA Drinking Water Docket 1991 Hawaii
Pocock, et al. 1983 and Lacey, et al. 1985, Maes, et al. 1991
were used by EPA to write theLead and Copper Rule (LCR) of 1991
2.
EPA’sL d d C R l (LCR)
16
Lead and Copper Rule (LCR)of 1991
• Enacted to protect the public from exposure to lead & copper at the tap
• “… the total drinking water contribution to overall lead levels may range from
as little as 5 percent to more than 50 percent of
17
p pchildren’s total lead exposure. Infants dependent on formula may receive more than 85 percent of their lead from drinking water.
As exposures decline to sources of lead other than drinking water, such as gasoline and soldered food cans, drinking water will account for a larger proportion of total intake.”
(Federal Register, Vol. 56, No. 110, June 7, 1991, p. 26470)
3/19/2011
4
18
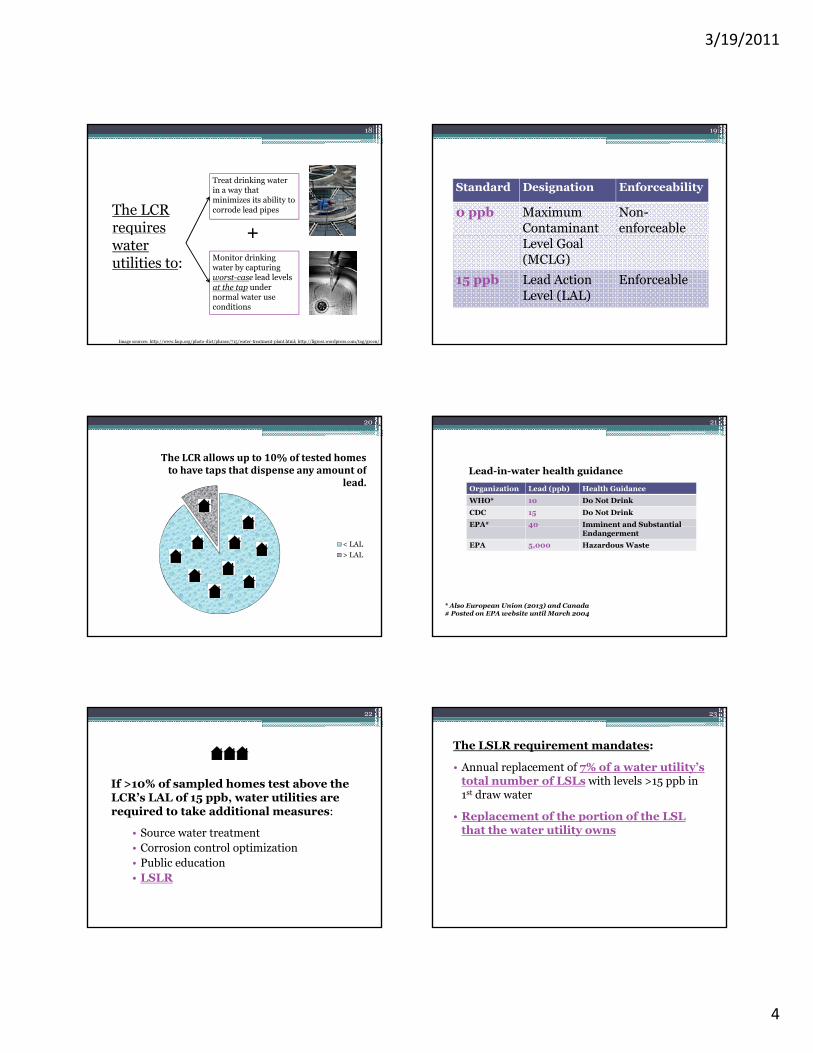
The LCR requires
Treat drinking water in a way that minimizes its ability to corrode lead pipes
+qwater utilities to: Monitor drinking
water by capturing worst-case lead levels at the tap under normal water use conditions
The LCR allows up to 10% of tested homes to have taps that dispense any amount of
lead.
< LAL
> LAL
21
Organization Lead (ppb) Health Guidance
WHO* 10 Do Not Drink
CDC 15 Do Not Drink
EPA# 40 Imminent and Substantial
Lead-in-water health guidance
EPA 40 Imminent and SubstantialEndangerment
EPA 5,000 Hazardous Waste
* Also European Union (2013) and Canada# Posted on EPA website until March 2004
If >10% of sampled homes test above the LCR’s LAL of 15 ppb, water utilities are required to take additional measures:
22
• Source water treatment• Corrosion control optimization• Public education• LSLR
The LSLR requirement mandates:
• Annual replacement of 7% of a water utility’s total number of LSLs with levels >15 ppb in 1st draw water
• Replacement of the portion of the LSL
23
• Replacement of the portion of the LSL that the water utility owns
3/19/2011
5
24
20% of utilities do not own any part of the LSL
1% of utilities own the whole LSL
Most utilities own part of the LSL
Sandvig & Kwan, 2007, Opflow
The LCR’s LSLR requirementmakes clear that FLSLR is preferable,
but is essentiallya PLSLR requirement
25
EPA was aware of potential PLSLR risks
o Studies going back to the mid-1800s documented in some instances accelerated lead release after connecting lead pipe with other metals
26
o Prior to 1991, individual commentors had expressed concern about occasional increases in lead leaching after PLSLR
Why accelerated lead leaching?
27
d h i d di b d l d f ll Physical Physical
New Copper Pipe
OldLead Pipe flow
• Lead shavings and disturbed lead rust can fall into the water
ydisturbance of old lead pipe
ydisturbance of old lead pipe
• In some waters, contact between old lead pipe and new copper pipe can create battery effect that accelerates corrosion of lead pipe above what would normally occur for lead pipe alone
Galvanic corrosion of old lead
Galvanic corrosion of old lead
• As the water flows from copper to lead, copper can attach to the old lead pipe and create small galvanic batteries that result in accelerated lead corrosion
Deposition corrosion of old lead
Deposition corrosion of old lead
28
Lead pipe area adjacent to copper junction after 1+ year of experimentation
Lead dose in one glass of water exceeding the CPSC “acute health threat” for lead 71 times
29
Study
Finding EPA’s interpretation
tto
n &
Ric
ha
rds
1
69 homes: Occasionally,increased and erraticlead levels observed. In some cases, no low lead measurementswere obtained, despite satisfactory pH control.
Focused only on one case study in the paper that took place in a town with satisfactory pH control and rare lead-in-water problems. Concluded that lead increases after PLSLR are only temporary and can be minimized, if not prevented, when water corrosivity is optimally controlled. Asserted th t i t l i thi “ ”
Bri
t19
81 that corrosion control in this case was “poor”
when in fact the authors note the opposite.
AW
WA
199
0
9 homes: Temporary increases (1-2 weeks) in lead levels after PLSLR in chlorinated water
Concluded that increases are short-lived, but also acknowledged the presence of an “effective passivation film.” Did not raise questions about lead leaching in the absence of such film.
PA
19
91c
4 homes: “Very little change in lead levels… and some increases in some cases” in chlorinated
Contended that the findings were notrelevant to the LCR because all pre-PLSLR values were below 15 ppb, and the LCR does not require LSLR in low lead homes.
3/19/2011
6
1991 EPA:
• PLSLR has benefits
• Removal of any amount of lead in plumbing reduces risk
i i l d i l l ill
30
• Any increases in lead-in-water levels will be temporary, if they occur at all
• Residents will be protected because water utilities will tell them how to take temporary precautions
• Commentors continued to express concern: EPA has no studies showing that lead falls below the LAL after PLSLR in different waters and different water treatments.
• 1997 internal e-mail from EPA chemist:
31
[T]he bottom line is that EPA ispromulgating a policy thatKNOWINGLY INCREASES LEAD LEVELSfor an UNKNOWN DURATION.*
* From: Chair Brad Miller, US House Subcommittee on Investigations and Oversight, 10/5/10 Letter to EPA Administrator Jackson
* Also European Union (2013) and Canada# Posted on EPA website until March 2004
3/19/2011
7
• Contamination followed November 2000 change in water treatment from
FREE CHLORINE CHLORAMINE
36
FREE CHLORINE to CHLORAMINE
• DC WASA knew about lead-in-water contamination since 2001 => reported LAL exceedance to EPA Region 3 in 2002
• Began replacing LSLs in 2003: of the 382 LSLRs that year, only 9 were FLSLRs
• Late 2003: Virginia Tech research:Began showing that the chloramine in Washington DC’s drinking water accelerated galvanic corrosion between lead and copper
• 2/19/04: Letter from Dr. Edwards to EPA:“ l i h lf l d i i h
37
“…replacing a half a lead service with copper is going to dramatically worsen the galvanic corrosion between copper and lead. Such partial replacements should be stopped immediately.”
• 2/26/04: “LEAD” coalition press conference
“Evidence is mounting that partial lead service line replacement often will not solve the problem and
38
solve the problem, and actually can make lead levels worse by shaking loose lead in the pipes and causing galvanic corrosion that may exacerbate lead problems.”
LEAD, 2004, Recommendations.
• 3/4/04: Two homes tested 24,000 ppb and 48,000 ppb after PLSLR
“Lead contamination of tap water in two District houses is so extraordinarily high
39
y gthat experts say the residents might be able to taste it, but city health officials never made more than routine efforts to inform the homeowners of the health risks. ”
DC Department of Health (DOH) ordered DC WASA to stop cutting LSLs and conduct additional testing to determine the duration of lead spikes and identify safe construction practices.
• 3/17/04: Letter to EPA from Congressmen Tom Davis and Henry Waxman and Delegate Eleanor Holmes Norton
Recent experience in the District indicates that replacing only the WASA-owned portion of a lead service line may actually increase lead levels at th t EPA h ld h th ff t f
41
the tap. EPA should research the effect of partial replacement of lead service lines and modify the regulations to address this issue. If EPA confirms that partial replacement commonly causes a long term increase in lead levels or fails to produce any reduction in lead levels, it would make no sense to encourage such partial lead service line replacements.
3/19/2011
8
4.
2004 and 2006PLSLR t di
42
PLSLR studies
2004 Wujek study
• DC WASA sponsored study in collaboration with EPA and DC DOH to “determine the duration of the temporary high lead levels”
• Goal: to measure lead levels before PLSLR and for 2 weeks after PLSLR
43
2 weeks after PLSLR• Scope: 7 homes that underwent a 15-minute
flushing of the tap immediately after PLSLR
Wujek, J. J., 2004, Minimizing Peak Lead Concentrations After Partial Lead Service Line Replacements [WQTC Conference Proceedings].
44
Samples from the service line >15 ppb
DATA ON WASA PARTIAL REPLACEMENT STUDY (WUJEK 2004).“Proving” PLSLR result in lower lead levels and create no spike.
Conclusion:
• Flushing for 15 minutes immediately after PLSLR reduces lead spikes that can result from construction => i.e., no problem with the physical disturbance of the l d i
45
lead pipe
• The connection between new copper and old lead does not significantly increase lead in the water => i.e., no problem with galvanic corrosion
5/4/04:
DC WASA request to DC DOH(cc-ed to EPA)
“… see the attached initial sample results, t th ith bi f f Jh
46
together with a brief summary from John Wujek. We would like to meet at your earliest convenience to discuss the results and obtain your approval to resume the replacement of services to the property line.”
DC DOH granted DC WASA permissionto continue with PLSLRs
47
Image source: http://www.johnhanlin.com/
3/19/2011
9
DC WASA:
o Launched a 1,734 PLSLR program for 2004o Signed an agreement with EPA Region 3 to
partially replace ALL known LSLs (estimated at the time at 23,000) by 2010…
48
the time at 23,000) by 2010…
…beginning the largest LSLR programin US history
4/4/05: EPA on NPR-affiliate radio show
[…] WASA’s data…, they did a very extensive short-term study last spring that looked at the effects of replacing lead service lines partially and found that there was no immediate increase in lead levels in the tap water as many
49
p yhad suspected or had been even seen in a few other very old research studies.
[…] [Over the long-term] there is no evidence that the lead levels increase, in fact […] you remove half the lead, you have a lot less lead in your tap water as a result. It’s not a perfect solution.
• Faucet aerators were removed prior to sampling (this can result in missing lead particles)
50
• After PLSLR, average lead levels in water that was in contact with the copper:lead service line remained >15 ppb
• The highest post-PLSLR sample (854 ppb) was excluded from analysis because it was assumed that it was not caused by the PLSLR
What was later discovered via FOIA
• Every water sample in the study was collected during a one month period (4/2/04-5/8/04) when DC’s disinfectant was switched back to free chlorine (an effective corrosion control h i l)
51
chemical)
NO CHLORAMINE IN THE WATER
• Every water sample was collected with a very low flow rate, which can miss lead problems
• Discussed Virginia Tech findings about acceleration of galvanic corrosion between copper and
52
corrosion between copper and lead in the presence of chloramine => “Lead leaching can increase 4 to 100 times faster than normal”
7/9/04:
• In response to the ES&T article, consultants for EPA Region 3 offered to conduct a study on galvanic corrosion
“This could be especially important as WASA embarks on their aggressive
53
WASA embarks on their aggressive program to replace all lead service lines (partial replacements mostly) in 6 years.”
• EPA Region 3 agreed to fund the research
Dufresne, e-mail to EPA R3 and Cadmus, obtained via FOIA
3/19/2011
10
2006 Reiber & Dufresne study
• Goal: “…to determine if replacing a portion of a lead pipe with copper piping might cause accelerated lead release”
• Method: Controlled laboratory conditions designed to exacerbate lead release Examination of
54
to exacerbate lead release. Examination of connections between new copper and new lead vs. new copper and old lead.
• Conclusion: Galvanic corrosion is minimal and, in the long-term, likely inconsequential when LSL surfaces are well-aged and passivated, like in Washington DC.
Reiber & Dufresne, 2006, Effects of External Currents and Dissimilar Metal Contact on Corrosion from Lead Service Lines.
• 2006 Reiber/Dufresne study received as proof that PLSLR in Washington, DC did not place residents at significant risk
• Routinely distributed to DC residents and lawmakers at DC WASA meetings about lead
55
• Used on 4/15/08 by EPA Region 3 in Congressional testimony to allay concerns about PLSLR
• Still on EPA’s website
What wasn’t made clear about the study:
• Conclusions based on “surface potential” measurements, at best an indirect indicator of galvanic corrosion of lead
• At least some lead-in-water levels measured,
56
but not reported in the paper and, to date, not released to the public even after multi-year FOIA requests
• Water not allowed to stagnate in the pipes, as occurs in practice and known to worsen galvanic corrosion problems
2007 FOIA revealed that by 2006 DC WASA and EPA Region 3 had data showing lead spikes and ongoing lead problems in numerous homes with PLSLRs:
1st half of 2006
57
1 half of 2006
Time after PLSLR
90th percentile lead –1st draw
90th percentile lead – 2nd draw
0-1 week 140 ppb(25,800 ppb highest)
95 ppb(814 ppb highest)
1 week-1 month
22 ppb(17,400 ppb highest)
17 ppb(73 ppb highest)
1 month-596 days
17 ppb(47 ppb highest)
17 ppb(29 ppb highest)
• 2007 FOIA of Washington, DC environmental risk assessments at the homes of children with elevated blood lead levels revealed that in 5 of 41 assessments parents reported having a PLSLR
Total PLSLRs = 14,450 (81%)Total cost = >$100 million in ratepayer money
3/19/2011
11
2008
DC WASA’s accelerated LSLR program was terminated prematurely
60
The decision was based in part on data obtained and exposed by the public showing that PLSLR sometimes resulted in lead-in-water elevations for months after replacement.
5.
CDC’s 2010announcement
61
announcementabout analysis ofWashington, DCdata
62
September 4, 2009: Letter to DC WASA
63
January 12, 2010:
CDCOnline announcement toChildhood Lead Poisoning Prevention Programs across the US Programs across the US
• PLSLRs are associated with increased risk for elevated blood lead levels (≥10 ug/dL).
64
The CDC states that it shared its findingsgwith EPA in 2007
10/5/10 letter from Congressman Brad Miller to EPA Administrator Lisa P. Jackson
PLSLRs in the US
• LSLRs for LCR compliance have occurred in at least 13 states, plus Washington, DC
• This number does not include
65
“voluntary” replacements that utilities conduct during distribution system maintenance, road repairs, and as a proactive measure to prevent lead-in-water contamination.
GAO, 2006, GAO-06-148
3/19/2011
12
6.
Where isthe science
66
the scienceon PLSLRtoday?
Real world observations: Lead pipes excavated after 70-114 years in service showed that the rust layer that can form from galvanic corrosion can contain hundreds of milligrams of lead per liter(DeSantis et al. 2009)
67
New Copper Pipe Old Lead Pipe
Accumulating rust layer
Lab observations:
Increases in lead leaching after PLSLR
• Can be short-term (days to weeks) or longer-term (months to years) => but there is a dearth of unambiguous data demonstrating the maximum duration, severity of this effect, and causes of
68
worst-case leaching
• Depend on the water’s chemistry and on resident water use patterns (e.g., stagnation times, water flow)
• Can occur whether the lead pipe is new or old
(Triantafyllidou & Edwards 2010, submitted for publication)
7.
Social justice: policy
69
policyandpractice
EPA revisions to the LCRPublic stakeholder meeting 11/4/10
• EPA’s presentation on LSLR made no mention of “galvanic corrosion” as a phenomenon of potential concern
70
• EPA did not discuss data or concerns about long-term lead-in-water problems after PLSLR
• All stakeholders present -- water utilities, lead corrosion scientists, health professionals, and lead poisoning prevention advocates -- called for a MORATORIUM on PLSLRs.
Questions
• Unknowns remain about:oLonger-term galvanic corrosion effectsoEffective ways to protect consumers from
excessively high lead spikes in the short- and l
71
long-term
• Who gets to define what constitutes “acceptable risk”?
• Is it accurate and ethical to present PLSLR as an effective “remedial” action in every case?
3/19/2011
13
Acknowledgments
• Marc Edwards and Simoni Triantafyllidouthank the Water Research Foundation for their financial support to study partial lead
72
their financial support to study partial lead service line replacement.
• The presenters are in the process of receiving financial support from the Robert Wood Johnson Foundation for research on the Lead and Copper Rule.
1 NSERC Industrial Chair in Drinking Water, Civil, Geological and Mining Engineering Department, Ecole Polytechnique, Montreal, Qc2 City of Montreal, Technical Expertise Division, Charles-J. DesBaillets Laboratory, Montreal (Qc)
3 Virginia Polytechnic Institute & State University, Jr. Department of Civil and Environmental Engineering, Blacksburg, Virginia, [email protected]
Effect of flow rate and lead/copper pipe sequence and
junction types on galvanic & deposition corrosion of lead pipeCartier, Clément1; Nour, Shokoufeh1; Laurent Laroche2; Marc Edwards3; Prévost, Michèle1
IntroductionWater utilities have been spending billions on partial lead service line replacements with copper. However, limited data is available on its effectiveness.
Recent pipe rig research conducted at Virginia Tech suggested that lead release can be exacerbated by galvanic corrosion attributable to the contact between copper and lead. Deposition corrosion was also suspected.
Deposition corrosion
Cu pipe
2 e-
Pb2+O2 OH- Cu pipe Pb pipe
Pb2+
Cu pipe Pb pipe
Direct contamination
Deposits as reservoirPb (S)
Cu2+ Cu(S)
Cu pipe Pb pipe
Cu(S)
O2 OH-Flow
Cu pipe Pb pipePb pipe
Cu2+
Galvanic corrosion
Flow Flow
Adapted from Triantafyllidou and Edwards, accepted in JAWWA, 2011
ObjectivesPhase 1
• Study short and long-term galvanic impacts on partial lead service line replacement
• Evaluate the effect of flow rate on galvanic corrosionPhase 2
• Assess the effect of junctions/ release from material versus lead release from galvanic (ongoing experiments)
Phase 3• Determine the impact of long term galvanic
corrosion following partial service line replacement on lead release using:
• Excavated lead pipe stabilized over 1 year• Typical configurations, junctions, and flow rates• 4 water conditions including corrosion
inhibitors
Acknowledgment• CWN & NSERC• The City of Montreal (supports, lead
pipes, lead analyses)• Yves Fontaine (pipe loop assembly
and operation)• Genevière Senécal-Léonard and
Stéphanie Fey (interns)• Roger Arnold, Simoni Triantafyllidou
et Jeff Parks (VT)
Phase 1: Effect of pipe sequence and flow rate Phase 2: Effect of junctions type Phase 3: Pilot experiment
Experimental protocol (conducted at Virginia Tech.) All conditions tested simultaneously under different water quality
A
A
Tap water
Pressure reducing valve
Solenoid/ Safety valve
Ball valve
Spacer (dielectric)
Removable Pb section
Potentiostat (Gamry System)
Pb Upstream (Pb-U) x3
11 feet
Pb Downstream (Pb-D) x3
100% Pb x3
Copper (control) x1
50 % Pb 50 % Cu
50 % Cu 50 % Pb
100 % Pb
100 % Cu
water sample filter
or
or
or
or
• 2 Flow events every day 8 hours apart
• Low flow rate of 1.3 LPM for 100 minutes
• 16 hr overnight stagnation
Conditions preventing important Pb release• Non aggressive water• Low flow promotes scale
formation and reduce galvanic effect
• New Pipe: No pipe cutting or particulate lead mobilization
Water parameters:
pH 7.4
Alkalinity (mg CaCO3/L) 31
Disinfection:
(Tot Cl2 mg/L)
2.6
Orthophosphate(mg P/L)
0.5
Cl- (mg/L) 15.4
SO42- (mg/L) 6.2
Temp (˚C) 20
chloramines
Sampling: Low flow: 3 times/week
(up to July) then 2 times/month
Med flow: 2 times/monthHigh flow: Once/month
(except December)
Results - after one month
0
200
400
600
800
1000
1200
1400
Pb
co
nce
ntr
atio
n (p
pb
) Median25 % - 75 %Min - MaX
05
-15
06
-01
06
-15
07
-01
07
-15
08
-01
08
-15
09
-01
09
-15
10
-01
10
-15
11
-01
12
-01 0
200
400
600
800
1000
1200
1400
Pb
co
nce
ntr
atio
n (p
pb
)
05
-15
06
-01
06
-15
07
-01
07
-15
08
-01
08
-15
09
-01
09
-15
10
-01
10
-15
11
-01
12
-01
0
200
400
600
800
1000
1200
1400
Pb
co
nce
ntr
atio
n (p
pb
)
06
-01
07
-01
08
-01
09
-01
10
-01
11
-01
12
-07
AM
PM
12
-08
AM
PM
12
-09
AM
PM
12
-10
AM
PM
12
-11
AM
PM
12
-12
AM
PM
100 % Pb Pb Downstream (Pb-D)Pb Upstream (Pb-U)
Low flow (1.3 LPM) Medium flow (8 LPM) High flow (32 LPM)
ConclusionsUnder low flow:
• Short-term lead “spike” was observed for few weeks after partial replacement due to galvanic effect comparing to full lead pipe. During 3 following months, as scale became accumulated at the junction, the partial pipes released less lead than the 100 % Pb pipe.
• For 50% Pb-D pipe, lead release was never proportional to the length of lead pipe comparing to 100% Pb pipe
• At the end of the experiment, lead release from Pb-D and 100% Pb were comparable. Under medium/High flow:
• Even if lead release was decreasing with time, lead release was exacerbated by the flow events for Pb-D and Pb-U conditions
• Under high flow, lead release was significant for Pb-U and Pb-D conditions even if the samples were taken at a higher frequency which confirms the presence of mobilized lead scales
In terms of mass balance: • For 50% lead pipe upstream of copper pipe (Pb-U), lead release is slightly higher than
expected based on lead pipe length which confirms the galvanic effect• The difference between Pb-D and Pb-U can be explained by deposition corrosion• At Longer-term, under low flow, the slight benefit of partial pipe replacement
disappears, and may even be reversed eventually, due to release of lead scale accumulated at joint from galvanic connection.
• Considering relatively stable high current (not presented here), this situation persist indefinitely
Cumulative mass balance
0
100
200
300
400
500
Pb
(mg
)
100 % PbPb-U
Pb-DPb-U
Pb-D
Pb from current (mg)
Ext. Samp.
32 LPM
8 LPM
1.3LPM - First draw
1.3 LPM flow
Experimental protocol Conducted at Polytechnique
in collaboration with Virginia Tech. (ongoing experiments)
• Pipe rigs to assess the effect of junction on galvanic corrosion - 0.4 L/rig
• Cumulative sampling 3 x / week with an average 56 hrs stagnation time
Total mass of released lead
Lead generated theoretically
from galvanic current
Water parameters:
pH 8.5
Alkalinity (mg CaCO3/L) 118
Free chlorine (Cl2 mg/L) 0.00
Cl- (mg/L) 22
SO42- (mg/L) 28
Temp (˚C) 20
3 X
3 X
3 X 0.1’’
≈2.0’’
≈0’’
0.1’’3 XA
AppearanceSpacer without
external connection
Spacer with wire external connection
Union fitting (brass)
Corporation valve (brass)
Nb Replicate
Distance Pb vs Cu
Junctions tested
Results - after one month
0
5 000
10 000
15 000
20 000
25 000
30 000 Week 1 Week 2 Week 3 Week 4
Pb
co
nce
ntr
atio
n (p
pb
)
Without external
connection
With external connection
Union fitting Corporation valve
Preliminary conclusions• Higher lead release was observed under galvanic corrosion
conditions• Corporation valves (as used usually on the field) are the worst case
after four weeks (and going worst) possibly due to crevice corrosion • After four weeks, union fittings and spacer with external connection
produce similar results• Upcoming experiments: Investigate lead release specific to the
fittings
For Spacer with external wire connectionCurrent: before stagnation: 46 µA and after stagnation: 30 µA
Step 1: 1 year stabilization • 5 LPM during 8 hrs (16 hrs stagnation)• 5 stages x 3 pipes / stage x 3 section (60 cm