National Research Center, Inc. 3005 30 th St. • Boulder, CO 80301 • T: (303) 444-7863 • F: (303) 444-1145 • www.n-r-c.com City Hall • Dallas, TX 75201 • T: (214) 670-3302 • www.dallscityhall.com The City of Dallas, Texas Report of Normative Comparisons to Full Database 2006 The National Citizen Survey™
Transcript
National Research Center, Inc. 3005 30th St. • Boulder, CO 80301 • T: (303) 444-7863 • F: (303) 444-1145 • www.n-r-c.com
City Hall • Dallas, TX 75201 • T: (214) 670-3302 • www.dallscityhall.com
The City of Dallas, Texas Report of Normative Comparisons to Full Database 2006
The National Citizen Survey™
The City of Dallas Citizen Survey
Report of Normative Comparisons
The
Nat
iona
l Citi
zen
Sur
vey™
by
Nat
iona
l Res
earc
h C
ente
r, In
c.
Table of Contents Survey Background.......................................................................................... 1
About The National Citizen Survey™ ................................................................................. 1
Understanding the Normative Comparisons .................................................... 2 Comparison Data ............................................................................................................... 2 Use of the “Excellent, Good, Fair, Poor” Response Scale .................................................... 3 Putting Evaluations onto a 100-Point Scale ....................................................................... 3 Interpreting the Results ...................................................................................................... 4
Appendix A: List of Jurisdictions Included in Normative Comparisons ......... 21
Appendix B: Frequently Asked Questions about the Citizen Survey Database ........................................................................................................ 33
The City of Dallas Citizen Survey
Report of Normative Comparisons 1
The
Nat
iona
l Citi
zen
Sur
vey™
by
Nat
iona
l Res
earc
h C
ente
r, In
c.
Survey Background
About The National Citizen Survey™ The National Citizen Survey™ (The NCS™) is a collaborative effort between National Research Center, Inc. (NRC) and the International City/County Management Association (ICMA).
The survey and its administration are standardized to assure high quality survey methods and comparable results across The National Citizen Survey™ jurisdictions. Participating households are selected at random and the household member who responds is selected without bias. Multiple mailings give each household more than one chance to participate with self-addressed and postage paid envelopes. Results are statistically re-weighted to reflect the proper demographic composition of the entire community.
The National Citizen Survey™ customized for this jurisdiction was developed in close cooperation with local jurisdiction staff. The City of Dallas staff selected items from a menu of questions about services and community problems; they defined the jurisdiction boundaries NRC used for sampling; and they provided the appropriate letterhead and signatures for mailings. City of Dallas staff also determined local interest in a variety of add-on options to The National Citizen Survey™ Basic Service.
The City of Dallas Citizen Survey
Report of Normative Comparisons 2
The
Nat
iona
l Citi
zen
Sur
vey™
by
Nat
iona
l Res
earc
h C
ente
r, In
c.
Understanding the Normative Comparisons
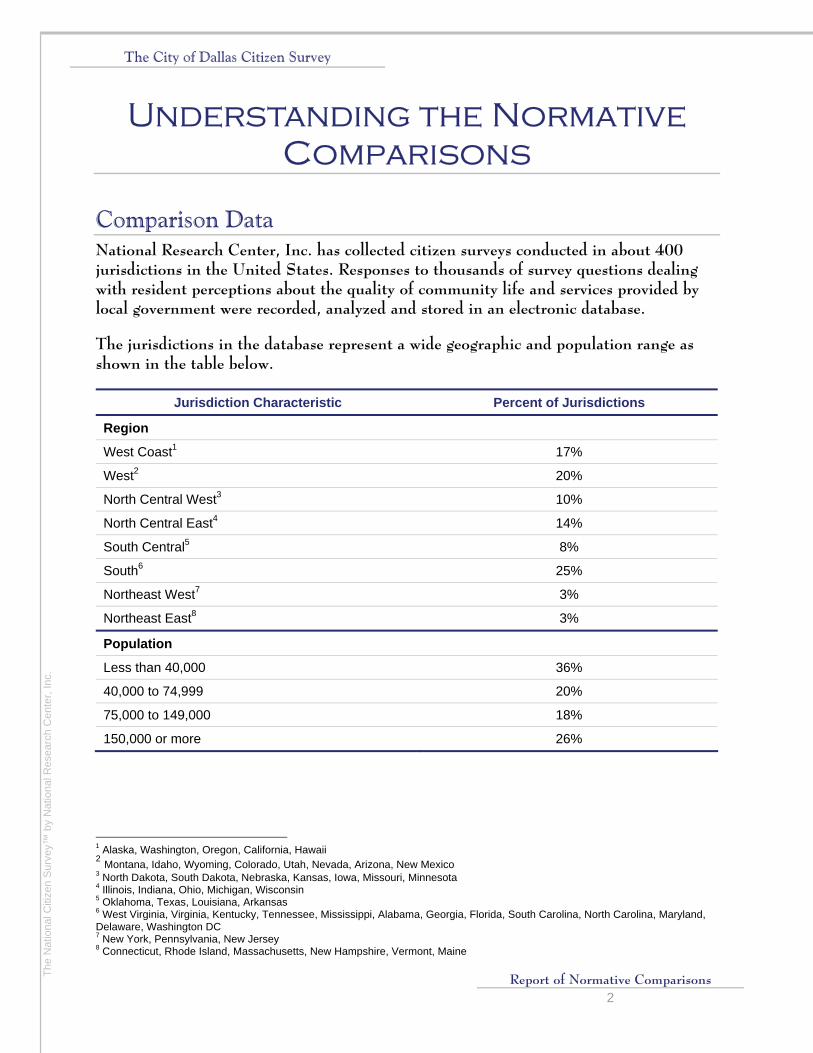
Comparison Data National Research Center, Inc. has collected citizen surveys conducted in about 400 jurisdictions in the United States. Responses to thousands of survey questions dealing with resident perceptions about the quality of community life and services provided by local government were recorded, analyzed and stored in an electronic database.
The jurisdictions in the database represent a wide geographic and population range as shown in the table below.
Jurisdiction Characteristic Percent of Jurisdictions
Region
West Coast1 17%
West2 20%
North Central West3 10%
North Central East4 14%
South Central5 8%
South6 25%
Northeast West7 3%
Northeast East8 3%
Population
Less than 40,000 36%
40,000 to 74,999 20%
75,000 to 149,000 18%
150,000 or more 26%
1 Alaska, Washington, Oregon, California, Hawaii 2 Montana, Idaho, Wyoming, Colorado, Utah, Nevada, Arizona, New Mexico 3 North Dakota, South Dakota, Nebraska, Kansas, Iowa, Missouri, Minnesota 4 Illinois, Indiana, Ohio, Michigan, Wisconsin 5 Oklahoma, Texas, Louisiana, Arkansas 6 West Virginia, Virginia, Kentucky, Tennessee, Mississippi, Alabama, Georgia, Florida, South Carolina, North Carolina, Maryland, Delaware, Washington DC 7 New York, Pennsylvania, New Jersey 8 Connecticut, Rhode Island, Massachusetts, New Hampshire, Vermont, Maine
The City of Dallas Citizen Survey Local Government
Report of Normative Comparisons 3
The
Nat
iona
l Citi
zen
Sur
vey™
by
Nat
iona
l Res
earc
h C
ente
r, In
c.
Use of the “Excellent, Good, Fair, Poor” Response Scale The scale on which respondents are asked to record their opinions about service and community quality is “excellent,” “good,” “fair” or “poor” (EGFP). This scale has important advantages over other scale possibilities (very good to very bad; very satisfied to very dissatisfied; strongly agree to strongly disagree, as examples). EGFP is used by the plurality of jurisdictions conducting citizen surveys across the U.S. The advantage of familiarity is one we did not want to dismiss because elected officials, staff and residents already are acquainted with opinion surveys measured this way. EGFP also has the advantage of offering three positive options, rather than only two, over which a resident can offer an opinion. While symmetrical scales often are the right choice in other measurement tasks, we have found that ratings of almost every local government service in almost every jurisdiction tend, on average, to be positive (that is, above the scale midpoint). Therefore, to permit finer distinctions among positively rated services, EGFP offers three options across which to spread those ratings. EGFP is more neutral because it requires no positive statement of service quality to judge (as agree-disagree scales require) and, finally, EGFP intends to measure absolute quality of service delivery or community quality (unlike satisfaction scales which ignore residents’ perceptions of quality in favor of their report on the acceptability of the level of service offered).
Putting Evaluations onto a 100-Point Scale Although responses to many of the evaluative questions were made on a 4 point scale with 4 representing the best rating and 1 the worst, many of the results in this summary are reported on a common scale where 0 is the worst possible rating and 100 is the best possible rating. If everyone reported “excellent,” then the result would be 100 on the 100-point scale. Likewise, if all respondents gave a “poor” rating, the result would be 0 on the 100-point scale. If the average rating for quality of life was “good,” then the result would be 67 on a 100-point scale; “fair” would be 33 on the 100-point scale. The 95 percent confidence interval around an average score on the 100-point scale is no greater than plus or minus 2 points based on all respondents.
The City of Dallas Citizen Survey Local Government
Report of Normative Comparisons 4
The
Nat
iona
l Citi
zen
Sur
vey™
by
Nat
iona
l Res
earc
h C
ente
r, In
c.
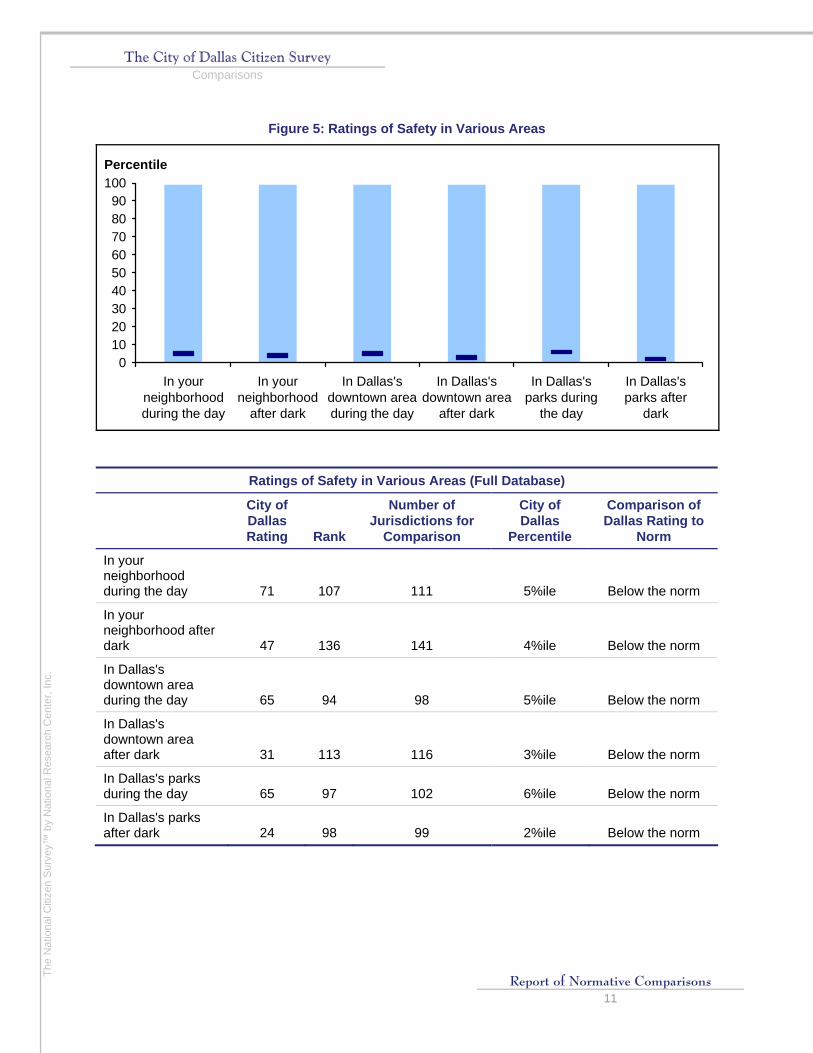
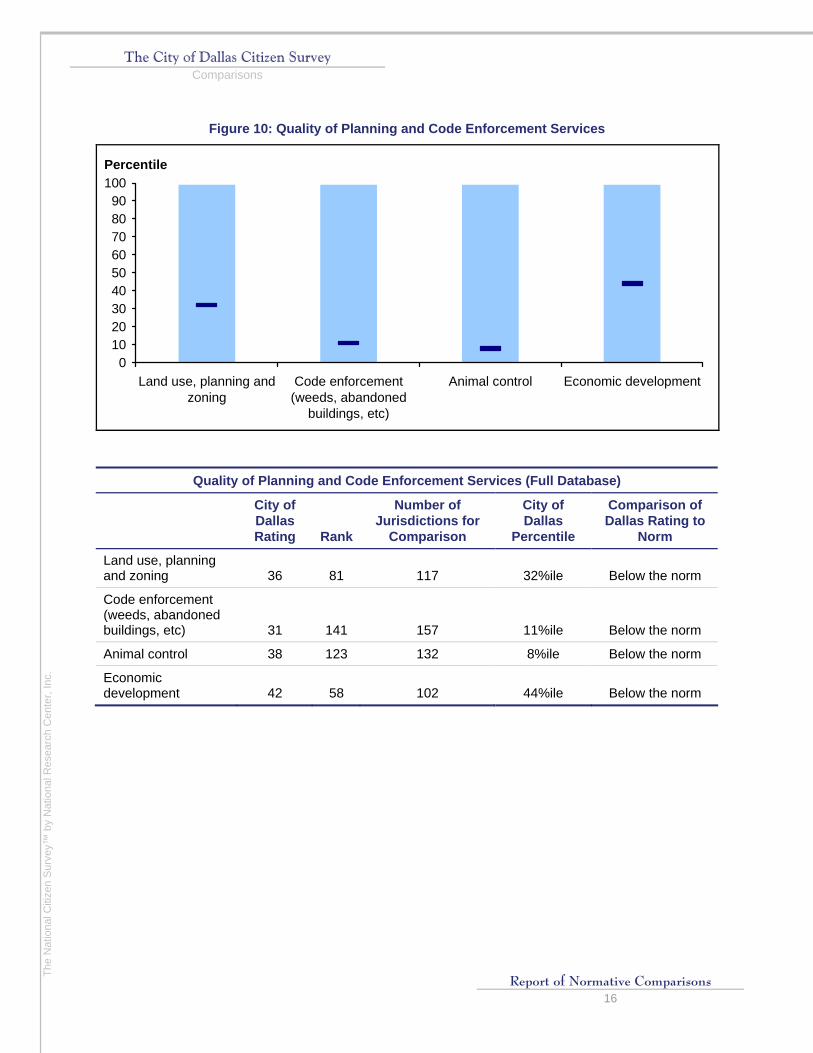
Interpreting the Results Comparisons are provided when similar questions are included in our database, and there are at least five other jurisdictions in which the question was asked. Where comparisons are available, three numbers are provided in the table. The first is the rank assigned to your jurisdiction’s rating among jurisdictions where a similar question was asked. The second is the number of jurisdictions that asked a similar question. Third, the rank is expressed as a percentile to indicate its distance from the top score. This rank (5th highest out of 25 jurisdictions’ results, for example) translates to a percentile (the 80th percentile in this example). A percentile indicates the percent of jurisdictions with identical or lower ratings. Therefore, a rating at the 80th percentile would mean that your jurisdiction’s rating is equal to or better than 80 percent of the ratings from other jurisdictions. Conversely, 20 percent of the jurisdictions where a similar question was asked had higher ratings.
Alongside the rank and percentile appears a comparison: “above the norm,” “below the norm” or “similar to the norm.” This evaluation of “above,” “below” or “similar to” comes from a statistical comparison of your jurisdiction’s rating to the norm (the average rating from all the comparison jurisdictions where a similar question was asked). Differences of 2 or more points on the 100-point scale between your jurisdiction’s ratings and the average based on the appropriate comparisons from the database are considered “statistically significant,” and thus are marked as “above” or “below” the norm. When differences between your jurisdiction’s ratings and the national norms are less than 2 points, they are marked as “similar to” the norm.
The data are represented visually in a chart that accompanies each table. Your jurisdiction’s percentile for each compared item is marked with a black line on the chart.
The City of Dallas Citizen Survey
Report of Normative Comparisons 5
The
Nat
iona
l Citi
zen
Sur
vey™
by
Nat
iona
l Res
earc
h C
ente
r, In
c.
Comparisons
Figure 1: Quality of Life Ratings
0102030405060708090
100
How do yourate Dallas as
a place to live?
How do yourate your
neighborhoodas a place to
live?
How do yourate Dallas as
a place to raisechildren?
How do yourate Dallas as
a place towork?
How do yourate Dallas as
a place toretire?
How do yourate the overallquality of life in
Dallas?
Percentile
Quality of Life Ratings (Full Database)
City of Dallas Rating Rank
Number of Jurisdictions for
Comparison
City of Dallas
Percentile
Comparison of Dallas Rating to
Norm
How do you rate Dallas as a place to live? 57 155 195 21%ile Below the norm
How do you rate your neighborhood as a place to live? 50 113 114 2%ile Below the norm
How do you rate Dallas as a place to raise children? 43 127 135 7%ile Below the norm
How do you rate Dallas as a place to work? 57 15 43 67%ile Above the norm
How do you rate Dallas as a place to retire? 36 114 116 3%ile Below the norm
How do you rate the overall quality of life in Dallas? 51 153 173 12%ile Below the norm
The City of Dallas Citizen Survey Comparisons
Report of Normative Comparisons 6
The
Nat
iona
l Citi
zen
Sur
vey™
by
Nat
iona
l Res
earc
h C
ente
r, In
c.
Figure 2: Characteristics of the Community: General and Opportunities
0
10
20
30
40
50
60
70
80
90
100
Sense
ofcomm
unity
Openness and
acceptance o
f the
comm
unity…
Overall
appeara
nce o
fDallas
Opportunities to
attend c
ultura
lactivities
Shopping
opportunities
Air qu
ality
Recreational
opportunities
Job op
portunities
Educational
opportunities
Overall
image/reputa
tion
of Dallas
Overall q
uality of
new development
in Dallas
Percentile
The City of Dallas Citizen Survey Comparisons
Report of Normative Comparisons 7
The
Nat
iona
l Citi
zen
Sur
vey™
by
Nat
iona
l Res
earc
h C
ente
r, In
c.
Characteristics of the Community: General and Opportunities (Full Database)
City of Dallas Rating Rank
Number of Jurisdictions for
Comparison
City of Dallas
Percentile
Comparison of Dallas Rating to
Norm
Sense of community 39 98 99 2%ile Below the norm
Openness and acceptance of the community towards people of diverse backgrounds 41 79 84 7%ile Below the norm
Overall appearance of Dallas 48 88 117 26%ile Below the norm
Opportunities to attend cultural activities 53 47 104 56%ile
Similar to the norm
Shopping opportunities 72 11 103 90%ile Above the norm
Air quality 37 43 46 9%ile Below the norm
Recreational opportunities 50 73 112 36%ile Below the norm
Job opportunities 50 14 126 90%ile Above the norm
Educational opportunities 55 22 29 28%ile Below the norm
Overall image/reputation of Dallas 47 27 32 19%ile Below the norm
Overall quality of new development in Dallas 53 16 31 52%ile
Similar to the norm
The City of Dallas Citizen Survey Comparisons
Report of Normative Comparisons 8
The
Nat
iona
l Citi
zen
Sur
vey™
by
Nat
iona
l Res
earc
h C
ente
r, In
c.
Figure 3: Characteristics of the Community: Access and Mobility
0
10
20
30
40
50
60
70
80
90
100
Access toaffordable
qualityhousing
Access toaffordable
quality childcare
Access toaffordable
qualityhealth care
Access toaffordable
quality food
Ease of cartravel inDallas
Ease of bustravel inDallas
Ease ofrail/subway
travel inDallas
Ease ofbicycletravel inDallas
Ease ofwalking in
Dallas
Percentile
Characteristics of the Community: Access and Mobility (Full Database)
City of Dallas Rating Rank
Number of Jurisdictions for
Comparison City of Dallas
Percentile
Comparison of Dallas Rating to
Norm
Access to affordable quality housing 42 73 141 49%ile Similar to the norm
Access to affordable quality child care 38 53 70 26%ile Below the norm
Access to affordable quality health care 41 41 59 32%ile Below the norm
Access to affordable quality food 58 5 11 64%ile Above the norm
Ease of car travel in Dallas 44 68 96 30%ile Below the norm
Ease of bus travel in Dallas 49 16 50 70%ile Above the norm
Ease of rail/subway travel in Dallas 50 8 15 53%ile Below the norm
The City of Dallas Citizen Survey Comparisons
Report of Normative Comparisons 9
The
Nat
iona
l Citi
zen
Sur
vey™
by
Nat
iona
l Res
earc
h C
ente
r, In
c.
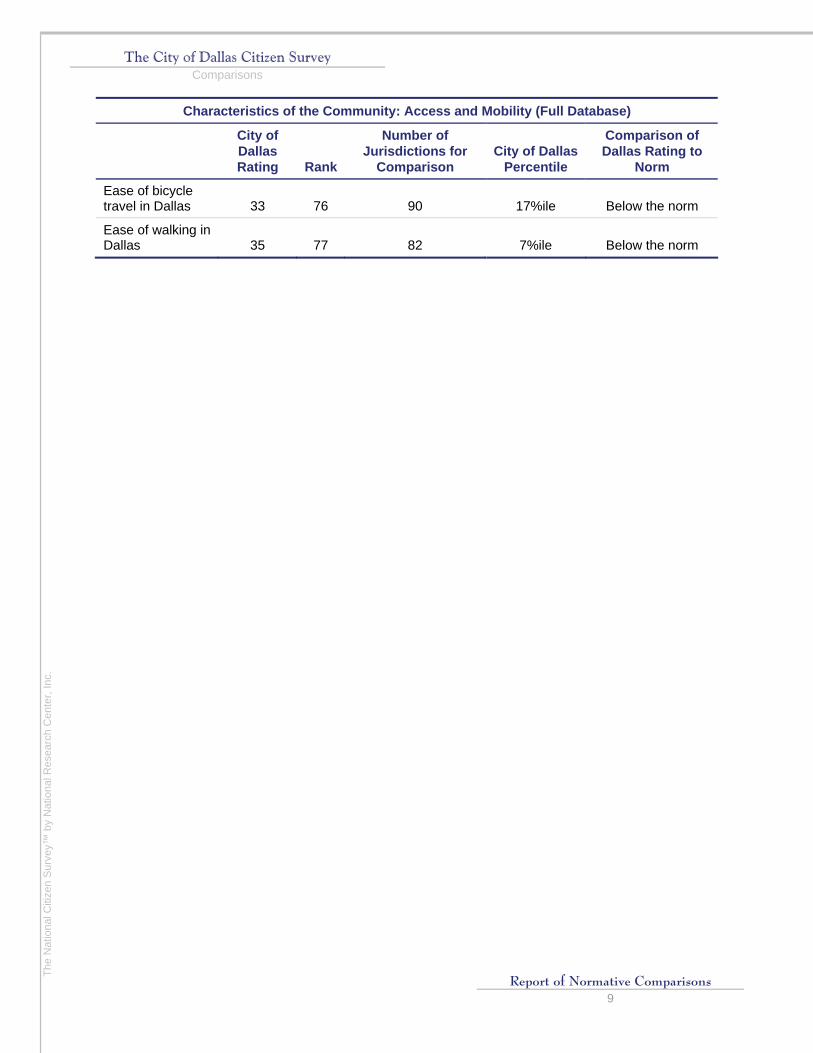
Characteristics of the Community: Access and Mobility (Full Database)
City of Dallas Rating Rank
Number of Jurisdictions for
Comparison City of Dallas
Percentile
Comparison of Dallas Rating to
Norm
Ease of bicycle travel in Dallas 33 76 90 17%ile Below the norm
Ease of walking in Dallas 35 77 82 7%ile Below the norm
The City of Dallas Citizen Survey Comparisons
Report of Normative Comparisons 10
The
Nat
iona
l Citi
zen
Sur
vey™
by
Nat
iona
l Res
earc
h C
ente
r, In
c.
Figure 4: Ratings of Safety from Various Problems
0
10
20
30
40
50
60
70
80
90
100
Violent crime (e.g., rape,assault, robbery)
Property crimes (e.g., burglary,theft)
Fire
Percentile
Ratings of Safety From Various Problems (Full Database)
Ratings of Contact with the City Employees (Full Database)
City of Dallas Rating Rank
Number of Jurisdictions for
Comparison City of Dallas
Percentile
Comparison of Dallas Rating to
Norm
Knowledge 53 129 130 2%ile Below the norm
Responsiveness 46 135 136 1%ile Below the norm
Courtesy 50 101 102 2%ile Below the norm
Overall Impression 47 149 151 2%ile Below the norm
The City of Dallas Citizen Survey Comparisons
Report of Normative Comparisons 20
The
Nat
iona
l Citi
zen
Sur
vey™
by
Nat
iona
l Res
earc
h C
ente
r, In
c.
Figure 14: Ratings of Public Trust
0102030405060708090
100
I receive good value forthe City of Dallas taxes
I pay
I am pleased with theoverall direction thatthe City of Dallas is
taking
The City of Dallasgovernment welcomes
citizen involvement
The City of Dallasgovernment listens to
citizens
Percentile
Ratings of Public Trust (Full Database)
City of Dallas Rating Rank
Number of Jurisdictions for
Comparison
City of Dallas
Percentile
Comparison of Dallas Rating to
Norm
I receive good value for the City of Dallas taxes I pay 47 110 123 11%ile Below the norm
I am pleased with the overall direction that the City of Dallas is taking 49 104 120 14%ile Below the norm
The City of Dallas government welcomes citizen involvement 51 104 108 5%ile Below the norm
The City of Dallas government listens to citizens 42 98 102 5%ile Below the norm
The City of Dallas Citizen Survey
Report of Normative Comparisons 21
The
Nat
iona
l Citi
zen
Sur
vey™
by
Nat
iona
l Res
earc
h C
ente
r, In
c.
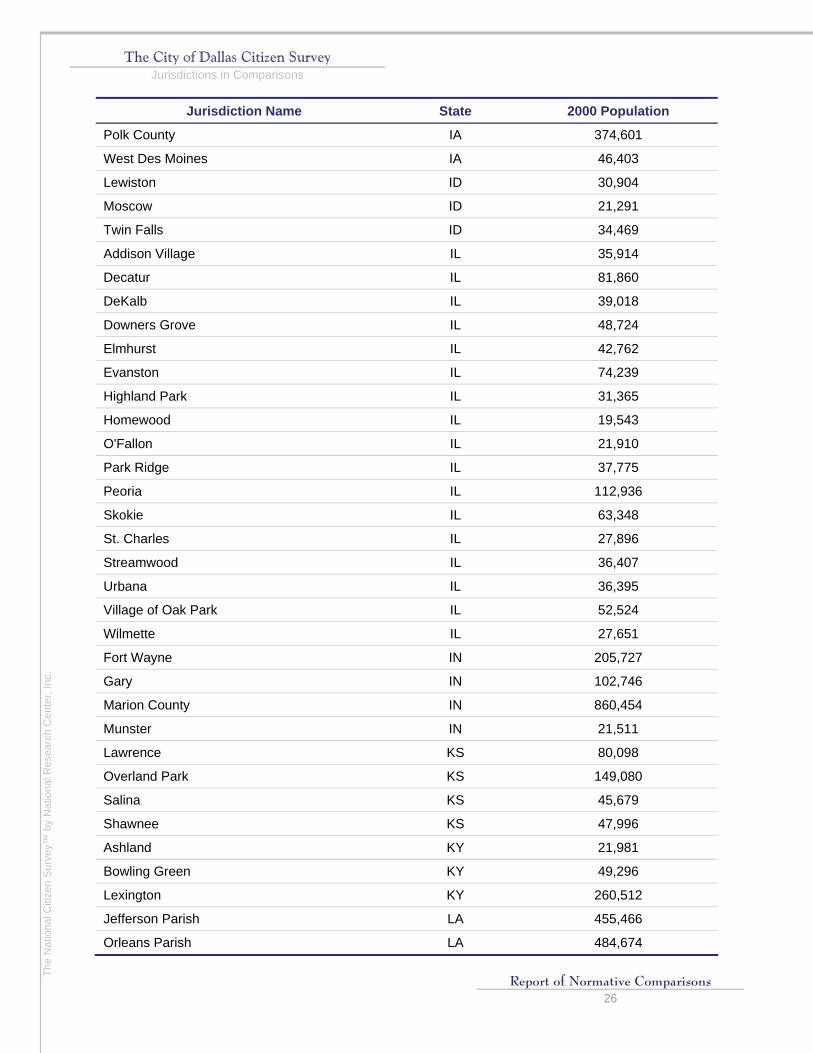
Appendix A: List of Jurisdictions Included in Normative
Comparisons
Jurisdiction Name State 2000 Population
Homer AK 3,946
Auburn AL 42,987
Phenix City AL 28,265
Fayetteville AR 58,047
Fort Smith AR 80,268
Hot Springs AR 35,613
Little Rock AR 183,133
Siloam Springs AR 10,000
Chandler AZ 176,581
Gilbert AZ 109,697
Mesa AZ 396,375
Phoenix AZ 1,321,045
Safford AZ 9,232
Scottsdale AZ 202,705
Sedona AZ 10,192
Tempe AZ 158,625
Tucson AZ 486,699
Antioch CA 90,532
Arcadia CA 53,054
Bakersfield CA 247,057
Berkeley CA 102,743
Chula Vista CA 173,556
Claremont CA 33,998
Concord CA 121,780
Coronado CA 24,100
Cypress CA 46,229
El Cerrito CA 23,171
Encinitas CA 54,014
Fremont CA 203,413
The City of Dallas Citizen Survey Jurisdictions in Comparisons
Report of Normative Comparisons 22
The
Nat
iona
l Citi
zen
Sur
vey™
by
Nat
iona
l Res
earc
h C
ente
r, In
c.
Jurisdiction Name State 2000 Population
Garden Grove CA 165,196
Gilroy CA 41,464
Hercules CA 19,488
Highland CA 44,605
La Mesa CA 54,749
Lakewood CA 79,345
Livermore CA 73,345
Lompoc CA 41,103
Long Beach CA 461,522
Los Alamitos CA 11,536
Los Gatos CA 28,592
Menlo Park CA 30,785
Monterey CA 29,674
Mountain View CA 70,708
Novato CA 47,630
Oceanside CA 161,029
Oxnard CA 170,358
Palm Springs CA 42,807
Palo Alto CA 58,598
Pasadena CA 133,936
Pleasanton CA 63,654
Pomona CA 149,473
Poway CA 48,044
Redding CA 80,865
Ridgecrest CA 24,927
Riverside CA 255,166
Rosemead CA 53,505
Sacramento County CA 1,223,499
San Francisco CA 776,733
San Jose CA 894,943
San Luis Obispo County CA 247,900
San Mateo CA 92,482
San Rafael CA 56,063
San Ramon CA 44,722
Santa Barbara County CA 399,347
The City of Dallas Citizen Survey Jurisdictions in Comparisons
Report of Normative Comparisons 23
The
Nat
iona
l Citi
zen
Sur
vey™
by
Nat
iona
l Res
earc
h C
ente
r, In
c.
Jurisdiction Name State 2000 Population
Santa Clara CA 102,361
Santa Clarita CA 151,088
Santa Monica CA 84,084
Santa Rosa CA 147,595
Simi Valley CA 111,351
Solana Beach CA 12,979
South Gate CA 96,375
Sunnyvale CA 131,760
Temecula CA 57,716
Thousand Oaks CA 117,005
Torrance CA 137,946
Visalia CA 91,565
Walnut Creek CA 64,296
Yuba City CA 36,758
Arvada CO 102,153
Boulder CO 94,673
Boulder County CO 291,288
Broomfield CO 38,272
Castle Rock CO 20,224
Denver (City and County) CO 554,636
Douglas County CO 175,766
Englewood CO 31,727
Fort Collins CO 118,652
Golden CO 17,159
Greeley CO 76,930
Highlands Ranch CO 70,931
Jefferson County CO 527,056
Lafayette CO 23,197
Lakewood CO 144,126
Larimer County CO 251,494
Littleton CO 40,340
Longmont CO 71,093
Louisville CO 18,937
Loveland CO 50,608
Northglenn CO 31,575
The City of Dallas Citizen Survey Jurisdictions in Comparisons
Report of Normative Comparisons 24
The
Nat
iona
l Citi
zen
Sur
vey™
by
Nat
iona
l Res
earc
h C
ente
r, In
c.
Jurisdiction Name State 2000 Population
Parker CO 23,558
Thornton CO 82,384
Vail CO 4,531
Westminster CO 100,940
Wheat Ridge CO 32,913
Hartford CT 121,578
Manchester CT 54,740
New London CT 25,671
Vernon CT 28,063
West Hartford CT 63,589
Wethersfield CT 26,271
Dover DE 32,135
Newark DE 28,547
Altamonte Springs FL 41,200
Boca Raton FL 74,764
Bonita Springs FL 32,797
Bradenton FL 49,504
Brevard County FL 476,230
Broward County FL 1,623,018
Cape Coral FL 102,286
Collier County FL 251,377
Cooper City FL 27,939
Coral Springs FL 117,549
Dania Beach FL 20,061
Deerfield Beach FL 64,583
Delray Beach FL 60,020
Fort Lauderdale FL 152,397
Jacksonville FL 735,617
Kissimmee FL 47,814
Melbourne FL 71,382
Miami FL 362,470
Miami Beach FL 87,933
Miami-Dade County FL 2,253,362
Ocoee FL 24,391
Orange County FL 896,344
The City of Dallas Citizen Survey Jurisdictions in Comparisons
Report of Normative Comparisons 25
The
Nat
iona
l Citi
zen
Sur
vey™
by
Nat
iona
l Res
earc
h C
ente
r, In
c.
Jurisdiction Name State 2000 Population
Orlando FL 185,951
Oviedo FL 26,316
Palm Bay FL 79,413
Palm Beach County FL 1,131,184
Palm Coast FL 32,732
Pinellas County FL 921,482
Pinellas Park FL 45,658
Port Orange FL 45,823
Port St. Lucie FL 88,769
Sarasota FL 52,715
St. Petersburg FL 248,232
Tallahassee FL 150,624
Titusville FL 40,670
Walton County FL 40,601
Atlanta GA 416,474
Cartersville GA 15,925
Columbus GA 185,781
Decatur GA 18,147
Douglas County GA 92,174
Macon GA 97,255
Milledgeville GA 18,757
Savannah GA 131,510
Adams County IA 4,482
Ames IA 50,731
Ankeny IA 27,117
Cedar Rapids IA 120,758
Clarke County IA 9,133
Des Moines County IA 42,351
Fort Dodge IA 25,136
Fort Madison IA 10,715
Indianola IA 12,998
Iowa County IA 15,671
Louisa County IA 12,183
Marion IA 7,144
Newton IA 15,579
The City of Dallas Citizen Survey Jurisdictions in Comparisons
Report of Normative Comparisons 26
The
Nat
iona
l Citi
zen
Sur
vey™
by
Nat
iona
l Res
earc
h C
ente
r, In
c.
Jurisdiction Name State 2000 Population
Polk County IA 374,601
West Des Moines IA 46,403
Lewiston ID 30,904
Moscow ID 21,291
Twin Falls ID 34,469
Addison Village IL 35,914
Decatur IL 81,860
DeKalb IL 39,018
Downers Grove IL 48,724
Elmhurst IL 42,762
Evanston IL 74,239
Highland Park IL 31,365
Homewood IL 19,543
O'Fallon IL 21,910
Park Ridge IL 37,775
Peoria IL 112,936
Skokie IL 63,348
St. Charles IL 27,896
Streamwood IL 36,407
Urbana IL 36,395
Village of Oak Park IL 52,524
Wilmette IL 27,651
Fort Wayne IN 205,727
Gary IN 102,746
Marion County IN 860,454
Munster IN 21,511
Lawrence KS 80,098
Overland Park KS 149,080
Salina KS 45,679
Shawnee KS 47,996
Ashland KY 21,981
Bowling Green KY 49,296
Lexington KY 260,512
Jefferson Parish LA 455,466
Orleans Parish LA 484,674
The City of Dallas Citizen Survey Jurisdictions in Comparisons
Report of Normative Comparisons 27
The
Nat
iona
l Citi
zen
Sur
vey™
by
Nat
iona
l Res
earc
h C
ente
r, In
c.
Jurisdiction Name State 2000 Population
Andover MA 31,247
Barnstable MA 47,821
Boston MA 589,141
Brookline MA 57,107
Worcester MA 172,648
Greenbelt MD 21,456
Rockville MD 47,388
Ann Arbor MI 114,024
Battle Creek MI 53,364
Delhi Township MI 22,569
Detroit MI 951,270
East Lansing MI 46,525
Grand Rapids MI 197,800
Kentwood MI 45,255
Meridian Charter Township MI 38,987
Muskegon MI 40,105
Novi MI 47,386
Port Huron MI 32,338
Rochester Hills MI 68,825
Troy MI 80,959
Blaine MN 44,942
Burnsville MN 60,220
Carver County MN 70,205
Chanhassen MN 20,321
Dakota County MN 355,904
Duluth MN 86,918
Eagan MN 63,557
Golden Valley MN 20,281
Grand Forks MN 231
Mankato MN 32,427
Maplewood MN 34,947
Minneapolis MN 382,618
Minnetonka MN 51,301
Plymouth MN 65,894
Polk County MN 31,369
The City of Dallas Citizen Survey Jurisdictions in Comparisons
Report of Normative Comparisons 28
The
Nat
iona
l Citi
zen
Sur
vey™
by
Nat
iona
l Res
earc
h C
ente
r, In
c.
Jurisdiction Name State 2000 Population
Richfield MN 34,439
Roseville MN 33,690
Scott County MN 89,498
St. Clair Shores MN 827
St. Cloud MN 59,107
St. Paul MN 287,151
Washington County MN 201,130
Ballwin MO 31,283
Columbia MO 84,531
Ellisville MO 9,104
Kansas City MO 441,545
Kirkwood MO 27,324
Platte City MO 3,866
Platte County MO 73,791
Saint Joseph MO 73,990
Saint Peters MO 51,381
Springfield MO 151,580
Biloxi MS 50,644
Pascagoula MS 26,200
Bozeman MT 27,509
Yellowstone County MT 129,352
Cary NC 94,536
Charlotte NC 540,828
Durham NC 187,038
Greensboro NC 223,891
Hickory NC 37,222
Hudson NC 3,078
Rocky Mount NC 55,893
Wilmington NC 90,400
Wilson NC 44,405
Grand Forks ND 49,321
Kearney NE 27,431
Dover NH 26,884
Merrimack NH 25,119
Salem NH 28,112
The City of Dallas Citizen Survey Jurisdictions in Comparisons
Report of Normative Comparisons 29
The
Nat
iona
l Citi
zen
Sur
vey™
by
Nat
iona
l Res
earc
h C
ente
r, In
c.
Jurisdiction Name State 2000 Population
Hackensack NJ 42,677
Medford NJ 22,253
Willingboro Township NJ 33,008
Alamogordo NM 35,582
Albuquerque NM 448,607
Bloomfield NM 6,417
Los Alamos County NM 18,343
Rio Rancho NM 51,765
Taos NM 4,700
Henderson NV 175,381
North Las Vegas NV 115,488
Reno NV 180,480
Sparks NV 66,346
Genesee County NY 60,370
New York City NY 8,008,278
Ontario County NY 100,224
Rochester NY 219,773
Rye NY 14,955
Watertown NY 26,705
Akron OH 217,074
Cincinnati OH 331,285
Columbus OH 711,470
Dayton OH 166,179
Dublin OH 31,392
Fairborn OH 32,052
Huber Heights OH 38,212
Hudson OH 22,439
Kettering OH 57,502
Sandusky OH 27,844
Shaker Heights OH 29,405
Springfield OH 65,358
Westerville OH 35,318
Oklahoma City OK 506,132
Albany OR 40,852
Ashland OR 19,522
The City of Dallas Citizen Survey Jurisdictions in Comparisons
Report of Normative Comparisons 30
The
Nat
iona
l Citi
zen
Sur
vey™
by
Nat
iona
l Res
earc
h C
ente
r, In
c.
Jurisdiction Name State 2000 Population
Corvallis OR 49,322
Eugene OR 137,893
Gresham OR 90,205
Jackson County OR 181,269
Lake Oswego OR 35,278
Multnomah County OR 660,486
Portland OR 529,121
Springfield OR 52,864
Lower Merion Township PA 59,850
Manheim PA 4,784
Philadelphia PA 1,517,550
State College PA 38,420
Upper Merion Township PA 28,863
Newport RI 26,475
Columbia SC 116,278
Mauldin SC 15,224
Myrtle Beach SC 22,759
Pickens County SC 110,757
Rock Hill SC 49,765
York County SC 164,614
Aberdeen SD 24,658
Cookeville TN 23,923
Franklin TN 41,842
Knoxville TN 173,890
Memphis TN 650,100
Oak Ridge TN 27,387
Arlington TX 332,969
Austin TX 656,562
Bedford TX 47,152
Carrollton TX 109,576
College Station TX 67,890
Corpus Christi TX 277,454
Denton TX 80,537
DeSoto TX 37,646
Fort Worth TX 534,694
The City of Dallas Citizen Survey Jurisdictions in Comparisons
Report of Normative Comparisons 31
The
Nat
iona
l Citi
zen
Sur
vey™
by
Nat
iona
l Res
earc
h C
ente
r, In
c.
Jurisdiction Name State 2000 Population
Garland TX 215,768
Grand Prairie TX 127,427
Lewisville TX 77,737
Lubbock TX 199,564
Lufkin TX 32,709
McAllen TX 106,414
McKinney TX 54,369
Missouri City TX 52,913
Mount Pleasant TX 13,935
Nacogdoches TX 29,914
Pasadena TX 141,674
Plano TX 222,030
Round Rock TX 61,136
Sugar Land TX 63,328
Temple TX 54,514
Victoria TX 60,603
Bountiful UT 41,301
Ogden UT 77,226
Washington City UT 8,186
West Valley City UT 108,896
Albemarle County VA 79,236
Bedford County VA 60,371
Blacksburg VA 39,357
Botetourt County VA 30,496
Chesapeake VA 199,184
Chesterfield County VA 259,903
Hampton VA 146,437
Hanover County VA 86,320
Hopewell VA 22,354
James City County VA 48,102
Lynchburg VA 65,269
Norfolk VA 234,403
Northampton County VA 13,093
Prince William County VA 280,813
Richmond VA 197,790
The City of Dallas Citizen Survey Jurisdictions in Comparisons
Report of Normative Comparisons 32
The
Nat
iona
l Citi
zen
Sur
vey™
by
Nat
iona
l Res
earc
h C
ente
r, In
c.
Jurisdiction Name State 2000 Population
Roanoke County VA 85,778
Stafford County VA 92,446
Virginia Beach VA 425,257
Williamsburg VA 11,998
Bellevue WA 109,569
Bothell WA 30,150
Kent WA 79,524
Kitsap County WA 231,969
Lynnwood WA 33,847
Marysville WA 12,268
Ocean Shores WA 3,836
Olympia WA 42,514
Pasco WA 32,066
Redmond WA 45,256
Renton WA 50,052
Richland WA 38,708
Seattle WA 563,374
University Place WA 29,933
Vancouver WA 143,560
Walla Walla WA 29,686
Appleton WI 70,087
Eau Claire WI 61,704
Janesville WI 59,498
Kenosha WI 90,352
Madison WI 208,054
Marquette County WI 15,832
Milton WI 5,132
Superior WI 27,368
Village of Brown Deer WI 12,170
Wausau WI 38,426
Whitewater WI 13,437
Winnebago County WI 156,763
Laramie WY 27,204
The City of Dallas Citizen Survey
Report of Normative Comparisons 33
The
Nat
iona
l Citi
zen
Sur
vey™
by
Nat
iona
l Res
earc
h C
ente
r, In
c.
Appendix B: Frequently Asked Questions about the Citizen
Survey Database What is in the citizen survey database? NRC’s database includes the results from citizen surveys conducted in about 400 jurisdictions in the United States. These are public opinion polls answered by hundreds of thousands of residents around the country. We have recorded, analyzed and stored responses to thousands of survey questions dealing with resident perceptions about the quality of community life and public trust and residents’ report of their use of public facilities. Respondents to these surveys are intended to represent over 50 million Americans.
What kinds of questions are included? Residents’ ratings of the quality of virtually every kind of local government service are included – from police, fire and trash haul to animal control, planning and cemeteries. Many dimensions of quality of life are included such as feeling of safety and opportunities for dining, recreation and shopping as well as ratings of the overall quality of community life and community as a place to raise children and retire.
What is so unique about National Research Center’s Citizen Survey database? It is the only database of its size that contains the people’s perceptions about government service delivery and quality of life. For example, others use government statistics about crime to deduce the quality of police services or speed of pot hole repair to draw conclusions about the quality of street maintenance. Only National Research Center’s database adds the opinion of service recipients themselves to the service quality equation. We believe that conclusions about service or community quality are made prematurely if opinions of the community’s residents themselves are missing.
What is the database used for? Benchmarking. Our clients use the comparative information in the database to help interpret their own citizen survey results, to create or revise community plans, to evaluate the success of policy or budget decisions, to measure local government performance. We don’t know what is small or tall without comparing. Taking the pulse of the community has little meaning without knowing what pulse rate is too high and what is too low. So many surveys of service satisfaction turn up at least “good” citizen evaluations that we need to know how others rate their services to understand if “good” is good enough. Furthermore, in the absence of national or peer community comparisons, a jurisdiction is left with comparing its fire protection rating to its street maintenance rating. That comparison is unfair. Streets always lose to fire. We need to
The City of Dallas Citizen Survey FAQ
Report of Normative Comparisons 34
The
Nat
iona
l Citi
zen
Sur
vey™
by
Nat
iona
l Res
earc
h C
ente
r, In
c.
ask more important and harder questions. We need to know how our residents’ ratings of fire service compare to opinions about fire service in other communities.
So what if we find that our public opinions are better or – for that matter – worse than opinions in other communities? What does it mean? A police department that provides the fastest and most efficient service—one that closes most of its cases, solves most of its crimes and keeps the crime rate low—still has a problem to fix if its clients believe services are not very good compared to ratings received by objectively “worse” departments.
National Research Center’s database can help that police department – or any city department – to understand how well citizens think it is doing. Without the comparative data from National Research Center’s database, it would be like bowling in a tournament without knowing what the other teams are scoring. We recommend that citizen opinion be used in conjunction with other sources of data to help managers know how to respond to comparative results.
Aren’t comparisons of questions from different surveys like comparing apples and oranges? It is true that you can’t simply take a given result from one survey and compare it to the result from a different survey. National Research Center, Inc. principals have pioneered and reported their methods for converting all survey responses to the same scale. Because scales responses will differ among types of survey questions, National Research Center, Inc. statisticians have developed statistical algorithms, which adjust question results based on many characteristics of the question, its scale and the survey methods. All results are then converted to the PTM (percent to maximum) scale with a minimum score of 0 (equaling the lowest possible rating) to a maximum score of 100 (equaling the highest possible rating). We then can provide a norm that not only controls for question differences, but also controls for differences in types of survey methods. This way we put all questions on the same scale and a norm can be offered for communities of given sizes or in various regions.
How can managers trust the comparability of results? Principals of National Research Center, Inc. have submitted their work to peer reviewed scholarly journals where its publication fully describes the rigor of our methods and the quality of our findings. We have published articles in Public Administration Review, Journal of Policy Analysis and Management and Governing, and we wrote a book, Citizen Surveys: How to do them, how to use them, what they mean, that describes in detail how survey responses can be adjusted to provide fair comparisons for ratings among many jurisdictions. Our work on calculating national norms for resident opinions about service delivery and quality of life won the Samuel C. May award for research excellence from the Western Governmental Research Association.