Presidents and the Politicization of the United States Federal Government, 1988-2004 ∗ In this paper I explain when politicization occurs in the U.S. federal government, focusing on the tradeoff between political control and bureaucratic competence. I analyze data on the percentage of political appointments among managers in 250 federal agencies over the 1988-2004 period. I show that politicization is neither increasing steadily over time nor caused by the actions of Republican presidents. Politicization increases when agency preferences diverge from those of the president and when agency outputs are relatively insensitive to changes in politicization such as when agency tasks are uncomplicated or when outside wages available to career managers are low. Politicization also increases during periods when Congress and the president share similar policy preferences. I conclude that politicization occurs in regular and predictable patterns and that understanding these patterns are essential for an understanding of American politics, public management, and the policy process. David E. Lewis Woodrow Wilson School 311 Robertson Hall Princeton University Princeton, NJ 08544 [email protected](609) 258-0089 (o) ∗ Paper presented at the 2005 annual meeting of the American Political Science Association, Washington, DC. I gratefully acknowledge the help of Nolan McCarty who got me started on this project and helped me to think more rigorously about it. Larry Bartels, Joshua Clinton, Fred Greenstein, Shigeo Hirano, Greg Huber, John Huber, Herbert Kaufman, George Krause, Adam Meirowitz, Tom Romer and the Breakfast Club at Princeton University spent more time than I deserve talking about this project and teaching me how to do it better. Seminar participants at Princeton University and Yale University provided many useful comments. The errors that remain are my own. 1
Transcript
Presidents and the Politicization of the United States Federal Government, 1988-2004∗
In this paper I explain when politicization occurs in the U.S. federal government, focusing on the tradeoff between political control and bureaucratic competence. I analyze data on the percentage of political appointments among managers in 250 federal agencies over the 1988-2004 period. I show that politicization is neither increasing steadily over time nor caused by the actions of Republican presidents. Politicization increases when agency preferences diverge from those of the president and when agency outputs are relatively insensitive to changes in politicization such as when agency tasks are uncomplicated or when outside wages available to career managers are low. Politicization also increases during periods when Congress and the president share similar policy preferences. I conclude that politicization occurs in regular and predictable patterns and that understanding these patterns are essential for an understanding of American politics, public management, and the policy process.
David E. Lewis
Woodrow Wilson School 311 Robertson Hall Princeton University Princeton, NJ 08544
∗ Paper presented at the 2005 annual meeting of the American Political Science Association, Washington, DC. I gratefully acknowledge the help of Nolan McCarty who got me started on this project and helped me to think more rigorously about it. Larry Bartels, Joshua Clinton, Fred Greenstein, Shigeo Hirano, Greg Huber, John Huber, Herbert Kaufman, George Krause, Adam Meirowitz, Tom Romer and the Breakfast Club at Princeton University spent more time than I deserve talking about this project and teaching me how to do it better. Seminar participants at Princeton University and Yale University provided many useful comments. The errors that remain are my own.
In the summer of the 2004 President Bush appointed Porter Goss to succeed George
Tenet as the Director of the Central Intelligence Agency. Goss brought with him a number of
political appointees from Capitol Hill to help him run the agency.1 Conflicts quickly arose
between Goss’s new team and career staff at the CIA.2 Goss froze top careerists out of high
level decision making and sought to put his stamp on the agency. Goss’s actions created
significant attrition among top career managers at CIA. The Director of Central Intelligence, the
Executive Director (3rd in command), and the head of the Analysis Branch all left. In total about
20 top career managers within the agency left after Goss’s arrival.3 The “Gossification” of the
CIA, while praised by some, was widely decried on Capitol Hill and the press as bad
management that could have dangerous consequences for national security.4
The politicization of the CIA is one example of many such stories in the United States.
Fears of an increasing number of political appointees are part of a larger set of concerns about
the “politicization” of the bureaucracy in the United States. Politicization can refer to a number
of different but related phenomena. The term often refers to the addition of political appointees
on top of existing career civil service employees or the practice of placing loyal political
appointees into important bureaucratic posts formerly held by career professionals. It can also
mean, however, a number of related practices associated with political intervention in
administration including the practice of recruiting appointees only on the basis of party loyalty,
involving civil servants in political fights, and making appointment and promotion decisions in
1 Pincus, Walter, and Dana Priest. 2004. “Goss Brings 4 Staffers From Hill to CIA.” Washington Post, October 1, 2004, p. A4; Jehl, Douglas. 2004. “New C.I.A. Chief Chooses 4 Top Aides From House.” New York Times, October 1, 2004, (on-line edition). 2 Priest, Dana, and Walter Pincus. 2004. “Deputy Chief Resigns from CIA.” Washington Post, November 13, 2004, p. A1; Priest, Dana. 2004. “Shake Up at CIA Headquarters Continues.” Washington Post, November 15, 2004 (on-line edition); Pincus, Walter. 2005. “Changing of the Guard at the CIA.” Washington Post, January 6, 2005, p. A3. 3 Pincus, “Changing of the Guard at the CIA.” 4 See, for example, Pincus, Walter. 2004. “McCain Backs CIA Shake-Up.” Washington Post, November 15, 2004, p. A2; Priest, Dana, and Walter Pincus. 2004. “CIA Chief Seeks to Reassure Employees.” Washington Post, November 16, 2004, p. A1.
2
the civil service on the basis of political attitudes. This discussion focuses primarily on the first
of these potential definitions, the layering of political appointees on top of career civil personnel
or the replacement of career personnel with political appointees.
Apart from the consequences of politicization for national security, there are a number of
reasons why studying politicization is important for the study of American politics. First,
decisions about the number and depth of political appointments are examples of practical
democratic theory.5 Political appointees make the government responsive to elected officials but
too many political appointees can reduce government competence. A government full of
likeminded democrats who cannot administer is cannot be responsive to the public because they
lack capacity. Effectiveness depends in part upon a continuing professional corps of personnel
immune from direct political appointment or day-to-day intervention. The irony of bureaucracy
in democracy is that bureaucracy’s anti-democratic character helps ensure a government’s
responsiveness. Second, understanding politicization illuminates important parts of the policy
process. The policy making process does not stop after the enactment of legislation. Indeed, as
the tasks of government have increased in number, scope, and complexity, the amount of policy
making authority delegated to administrative actors has increased. Who these bureaucrats are
and how they are selected has a large influence on policy outcomes. Finally, studying
politicization tells us something important about public management. Slippage between what
politicians articulate and what administrative agencies deliver can be caused by a variety of
factors including resource constraints, task complexity, and political disagreements. Importantly,
the quality of program management can also account for the failure of policy outputs to match
initial promise. A large literature claims that political appointees do not have the management
5 Indeed, it is worth noting that this has important consequences for theories of governance more generally since non-democratic governments must make similar decisions about whether to seek loyalty or preserve competence in the apparatus of the state.
3
skills, policy expertise, agency experience, or working networks that facilitate public
management.
In this paper I take up the important question of when politicization occurs in the U.S.
federal government, focusing on the tradeoff between political control and bureaucratic
competence. I analyze data on the percentage of political appointments among managers in 250
federal agencies over the 1988-2004 period. I show that politicization is neither increasing
steadily over time nor caused by the actions of Republican presidents. Politicization increases
when agency preferences diverge from those of the president and when agency outputs are
relatively insensitive to changes in politicization such as when agency tasks are uncomplicated or
when outside wages available to career managers are low. Politicization also increases during
periods when Congress and the president share similar policy preferences. I conclude that
politicization occurs in regular and predictable patterns and that understanding these patterns are
essential for an understanding of public management, the policy process, and American politics.
Part I. Politicization: Why and When?
Scholars of American politics have been interested in the phenomenon of politicization at
least since the 1970s and even before that if we allow for different labels. There are two primary
competing but not mutually exclusive explanations about when politicization occurs. First, a
number of academics, public officials, and journalists claim that politicization is increasing
steadily over time (see, e.g., Light 1995; Moe 1985; Suleiman 2003). Moe (1985) argues that all
presidents have institutional incentives to get control of the bureaucracy and these incentives
lead presidents to both politicize the bureaucracy and centralize control in the White House.
4
There have been two major studies that address when politicization occurs by tracking
political appointments across the government over time. Both studies conclude that
politicization is increasing over time. In the first study, Light (1995) describes an increase in
management layers in the federal government—what he calls “thickening”—and assesses both
the causes and consequences of this phenomenon. He argues that some of this “thickening” is
due to increasing number of political appointees added to the government by the president and
Congress.6 While “natural” growth in the number of appointees explains part of the increase in
raw numbers, others have been added to enhance presidential control, or at the request interest
groups or agencies themselves.7
The National Commission on the Public Service (1989) identified a “quiet crisis” in
government precipitated partly by a dramatic expansion in the number of political appointments.
They count 3,000 political appointees in 1989 compared to barely over 200 in 1933. They
conclude that all of the expansion in appointments cannot be explained by growth in the size and
responsibilities of the federal government. From 1933 to 1965 they claim the number of Senate-
confirmed appointees grew from 73 to 152. From 1965 to 1989, however, the number increased
to 573, a rate much faster than the size of government. In a subsequent report (National
Commission on the Public Service 2003) the commission concludes that the increase in political
appointees continued into the Clinton Administration. 6 Light’s particular focus is “thickening” in government which he defines as an increase in the number of management positions both vertically (layers) and horizontally in the executive branch. This is something different from politicization since management positions are filled primarily by civil servants. That is, thickening can have the effect of depoliticizing or politicizing depending upon the career/appointee makeup of the new positions added. Light notes an increase in thickening and names an increase in the number of appointed positions as one cause among many. It is unclear from Light’s study, however, whether the growth in appointees outstrips the growth in federal employment and agency programmatic responsibilities. See also Kilborn, Peter T. “Hail to the Senior General Deputy Assistant Chief.” New York Times, April 26, 1984, p. B10. 7 While there has been a general increase in the number of appointed positions, Light also notes that that the increase has not been even across agencies or across time. Light points out that there was actually a decline in the percentage of political appointees relative to employment in the 1984 to 1992 period. He also notes that while some agencies like the International Trade Administration or the Office of Justice Programs have lots of presidential appointees, others like the Patents and Trademark Office and the Bureau or Prisons have zero.
5
These studies document what most believe, namely that there has been a steady and
significant increase in the number of political appointments in the United States over time.8 For
some, this increase is driven by the actions of Republican presidents more than Democratic
presidents. A number of sources have documented Richard Nixon’s administrative strategy
(Heclo 1977, Nathan 1975, 1983). As part of a larger administrative strategy Nixon replaced
existing appointees with loyalists, inserted loyal political appointees deep into the departments
and bureaus, and tried to accomplish informally what Congress would not allow formally in
reorganization.9
Taking their cue from the Nixon Administration, the Reagan Administration believed that
environmental and social welfare agencies were populated with Democratic partisans hired and
promoted because they were dedicated to programs they were managing. By almost all accounts
the number and penetration of political appointees increased in the Reagan Administration.
Aberbach and Rockman show that the top managers in the upper reaches of government, both
civil servants and appointees, were both more Republican and more conservative in 1986-7 than
in 1970.10 Reagan accomplished this by taking advantage of enhanced appointment power in the
8 For example, a 1973 New York Times article stated, “Each administration has made attempts to increase the number of Schedule C positions, either by new jobs or by converting civil service slots, to permit it to get a better handle on the bureaucracy.” Causey, Mike. “Agencies Adding More Political Jobs.” Washington Post, October 24, 1973, p. C23; See also Kilborn, Peter T. “Hail to the Senior General Deputy Assistant Chief.” New York Times, April 26, 1984, p. B10. 9 An important component of this personnel strategy was both the layering of appointees on top of existing structures and the replacement of unfriendly career officials with politically chosen executives. In White House Aide and OMB official Fred Malek’s “Malek Manual” for political appointees the administration details a number of techniques for getting around civil service laws and replacing unwanted careerists in the executive branch. See the “Federal Political Personnel Manual” reprinted in Presidential Campaign Activities of 1972, vol. 19: Watergate and Related Activities, Use of Incumbency-Responsiveness Program. Executive Session Hearings before the Select Committee on Presidential Campaign Activities 93 Cong. 2 sess (Washington, DC: Government Printing Office), pp. 8903-9050. 10 Aberbach and Rockman 1990. The trends described in the piece appear to have continued into the Bush Administration. Surveys from 1991-2 confirm the trend described in their earlier work. Aberbach and Rockman 2000.
6
Civil Service Reform Act of 1978 and natural vacancies occurring through attrition,
reorganization, and program cuts.11
These views of politicization are worth revisiting for several reasons. First, in order to
determine whether politicization is increasing we need to look at data on politicization over time.
Existing efforts have looked primarily at Senate-confirmed positions only and assumed that all
Senate-confirmed positions are the same. As I will show below, the undeniable growth in
Senate-confirmed positions is due to increases in part-time, non-salaried, and advisory positions
outside the cabinet. There has actually been a decrease in the number and percentage of political
appointees since 1980. Second, the focus on high profile cases of politicization in the Nixon and
Reagan administrations has given the false impression that politicization is a partisan
phenomenon. While Nixon and Reagan are purported to have increased the number and
penetration of appointees, scholars do not mention Gerald Ford or George H.W. Bush, both of
whom were relatively friendly to the civil service. Indeed, the most dramatic increase in political
appointees occurred in the Carter Administration through the creation of the Senior Executive
Service. Finally, there is a large literature on politicization focusing on the adverse
consequences of such choices for performance (see, e.g., Gilmour and Lewis 2005; Heclo 1975,
1977). It is rare for theories of politicization to account for how presidents are constrained in
their politicization choices by concerns for bureaucratic competence. What remains is
interesting variation over time and across agencies in need of theorizing that goes beyond
existing institutional or partisan explanations.
11 The Civil Service Reform Act (CSRA) created the Senior Executive Service, a corps of managers generally one level below the political appointees that require Senate confirmation. The CSRA gave presidents the ability to appoint 10 percent of these managers from outside the civil service and new power to remove and select career managers for executive branch management positions. For sources on Reagan’s politicization see Goldenberg 1984, Rosen 1983; Causey, Mike. 1984. “Reagan’s Plum Book Plumper than Carter’s.” Washington Post, May 11, 1984, p. C2.
7
In the next section I explain when presidents want to politicize, taking into account their
concern both for controlling the bureaucracy but also preserving its competence. The result is a
series of clear predictions about when we should see more or less politicization both across
agencies and across time.
Part II. When Do Presidents Want to Politicize?
Given that there are important similarities in how modern presidents desire to control the
administrative state, theorizing generically about presidents can be an appropriate and powerful
tool for understanding trends in politicization over time. This approach self-consciously does not
account for a lot of president, agency, or time-specific context. Instead, I hope that by
abstracting from the specifics of individual cases, I can identify the factors that explain most of
the variance in this important political phenomenon, recognizing that I cannot hope to explain all
of it. I begin theorizing with 4 simple assumptions about presidents, agencies, and the impact of
political appointments. Each assumption is grounded in the existing literature on the presidency
and bureaucracy. If we accept these four assumptions together, a number of interesting
implications result. These are derived formally in Appendix A.
Assumptions
To begin, I assume that presidents care about policy outcomes both now and in the
future.12 They care about policy either because they inherently want good public policy or
because their policy choices influence how voters and historians will perceive them. Presidents
12 I talk explicitly about the president’s incentives but these incentives apply equally to the president’s subordinates. The Secretary of Defense views the politicization decision in the same way as the president although he or she is only concerned about the Department of Defense. This is important because many politicization decisions are most proximately the choice of the president’s appointees rather than the president directly.
8
know what outcomes they want, from an ideal level of agricultural price supports to the
stringency of environmental regulation to the amount of defense spending. Presidents want
administrative agencies to produce outputs that generate the policy outcomes the administration
prefers.13
Second, I assume that presidents want agencies to be competent. Agencies will attempt
to set policy so that they will achieve the agency’s desired policy outcome but they will not
always do so successfully. Variation in agency success can be due to a number of factors
including the competence of the agency itself or the complexity of the task environment. All
else equal, presidents prefer that an agency not make mistakes since mistakes can lead to policy
outcomes that are worse for the president. Consider the case of budget forecasting. All
presidents want competent forecasters even if they want forecasts to be biased in different
directions. All presidents are made worse off if forecasters cannot hit their targets, whether the
target is an accurate forecast or a forecast biased for political reasons.
Of course, if presidents knew that an agency failure would lead to policy outcomes
beneficial to the president, they might prefer failure over competence. The number of cases
where failure produces policy outcomes the president prefers is uncertain. One obvious case is
health and safety or environmental regulation. We might think, for example, that conservative
presidents want OSHA or EPA to fail thinking that a low competence OSHA or EPA is going to
regulate less. Perhaps this is true but would presidents prefer a low competence EPA to an EPA
that shares the president’s conservative ideology and is extremely competent? It is not clear. It
is also worth considering whether a low competence regulatory agency actually regulates less or
just regulates erratically. Equally plausible is the case that a low competence agency produces
13 I implicitly use here Wilson’s (2000 [1989], 158) distinction between policy outputs and policy outcomes. Outputs are the work that an agency does and outcomes are how the world changes as a result of outputs.
9
poorly written regulations that hurt business by increasing uncertainty or imposing unforeseen
political or economic costs.14
Third, I assume that agencies themselves have preferences for particular outcomes.
Agency preferences are determined by an inherent agency policy preference and the president’s
preferences as reflected in the number and depth of appointees.15 Inherent agency policy
preferences are sometimes embedded in the statutes or decrees that created the agency. For
example, the statute creating the Occupational Safety and Health Administration states that the
agency is to “assure as far as possible every man and woman in the Nation safe and healthy
working conditions.” 16 An agency’s policy preferences can also be embedded in the personnel
who populate the agency. The personnel may be Republicans or Democrats or they may care
about the mission of the agency they work for in a way that makes them different than the
president. The combination of these two factors and other factors like the unique agency history
and culture, pressure from Congress or interest groups, and routinization of process or mission
creep can lead agencies to want something different from what the sitting president wants.
Presidents can bring the agency’s policies into alignment with the president’s preferences by
adding political appointees. Agencies with more appointees increasingly share the president’s
preferences.
Finally, I assume that agencies with lots of appointees have less competence than
agencies with few appointees. Agencies filled entirely with political appointees will be the most
14 More specifically, presidents not only prefer that on average (mean) the policy outcomes end up right where the agency intended for them to end up but also that the mistakes, particularly extreme mistakes from the president’s perspective, are minimized. In other words, presidents are risk averse. I assume that the mistakes are symmetrically distributed around the mean. If they are asymmetric so that failures happen in the president’s favor, presidents will prefer more politicization than otherwise. 15 That is, the agency’s induced ideal point is a weighted average of the agency’s inherent ideal point and the president’s ideal point and the weighting is a function of the percentage of an agency’s employees that are political appointees. 16 29 U.S.C. 651.
10
likely to have the same preferences as the president but they will probably not be the most
competent. Similarly, those agencies that are staffed with a high percentage of career civil
servants will have a measure of expertise and institutional memory that are valuable but they will
also be less likely to completely share the president’s preferences. Differences in competence
stem from differences between career employees and appointees and structural factors associated
with appointed positions. Career employees are more likely to have subject area expertise,
public management experience, knowledge of how the agency works, and a sensitivity to the
agency’s political environment. Of course, the extent of the competence advantage between
these two populations varies according to a number of factors including the economy, length of
time since the party in power was last in power, and permeability of the merit system. Even if
careerists and appointees were comparable in capacity, designating positions as appointee
positions means these positions will turn over more frequently than careerist-filled positions.
Turnover makes it hard for managers to craft and communicate clear goals to program
employees and follow through on the implementation of these goals. Designating positions as
appointee positions also reduces the opportunities for career employees to influence policy and
get the highest paying jobs. This makes recruitment and retention of high quality employees
difficult, reducing agency capacity.
Choosing the Optimal Appointment Levels
Presidents want agencies to have identical preferences to their own and be perfectly
competent. In practice, agencies neither faithfully share the president’s preferences nor exhibit
faultless competence. Presidents make what amounts to a mean variance tradeoff when making
a decision about the optimal number of appointments. They can either move the average policy
11
outcome closer to their ideal policy by adding appointees or they can increase agency
competence by reducing the number of appointees. One cannot add appointees without
endangering agency competence. In some cases, presidents are willing to trade or risk some
bureaucratic competence in order to bring the agency in line with presidential preferences. In
other cases the president is willing to cut the influence of appointees in order to preserve or
enhance the stability and capacity of an agency. Presidents set the optimal number of appointees
by comparing the marginal benefits of increasing ideological consistency against the marginal
costs in competence.
A number of factors influence the president’s optimal level of appointees including most
prominently differences in agency preferences and agency sensitivity to politicization. Each of
these attributes has a direct effect on the president’s preference for more or less appointees.
Preferences
One reason a president politicizes an agency is that the agency has different policy
preferences than the president. When a new presidential administration assumes office, they
encounter a preexisting administrative state made up of hundreds of agencies with millions of
employees. These agencies vary in how their policy preferences match up with those of the
president and during periods of party turnover in the White House there can be quite a bit of
difference between what agencies want and what the new administration wants. Adding political
appointees or replacing career employees with noncareer appointees is one way of bringing the
agency’s preferences in line with those of the president. These appointees can be program
managers or ministerial staff and the changes are usually targeted toward the top positions of the
managerial hierarchy.
12
The degree of preference divergence between the president and agencies can vary as a
function of their purpose embedded in law and personnel. Some agencies are designed with a
specific policy goal in mind. If an agency like the Environmental Protection Agency is
inherently pro-regulation by function or character of career managers, the number of positions
necessary for presidential control will vary depending upon the ideology of the president. The
number of positions necessary for a Democrat to control and guide the EPA is smaller than the
number necessary for Republicans. Similarly, if an agency like the Department of Defense is
hawkish by culture and personnel, the number of positions required for a Democratic president to
get control is greater than those required by a Republican. Presidents Reagan and Bush were
more concerned about the policy direction of the Environmental Protection Agency, the
Department of Interior, and the Civil Rights Division of the Justice Department than President
Clinton. The former presidents felt a concrete need to alter the direction of these agencies while
the latter’s preferences were more in line with the natural preferences of these agencies. The
likelihood of politicization should increase when the president’s preferences are much different
than those embodied in the agency.
Sometimes the political biases of a particular agency have less to do with the mission of
the agency embedded in law or executive decree and more to do with personnel. This can be the
case for a number of reasons. Surveys of top executives from the Nixon and Ford
Administrations showed that many top managers were unsympathetic to the policy goals of the
Nixon Administration, particularly executives in social service agencies.17 Forty seven percent
of supergrade (GS 16-18) career managers in the Nixon Administration were Democrats,
compared to 17 percent Republican and 36 percent independent. A large percentage of the
Democrats at this level worked in departments with large social service expenditures like the 17 Aberbach and Rockman 1976, 459.
13
Office of Economic Opportunity, the Department of Housing and Urban Development, or the
Department of Health, Education, and Welfare. They were the most liberal in their views about
the proper role of government in the provision of social services and their perceptions of
inequities in representation. Sometimes persons filling offices feel more bound to the policy
content of the program they run or legal, moral or professional norms than to the president for
understandable reasons. As Herman Miles Somers writes, “The fact is that able men are rarely
neutral in sentiment about important issues in which they share responsibility. Real neutrality
would border on indifference and indifference soon becomes incompetence.”18 Whatever the
cause, whether mission or personnel, presidents will try to increase the number of appointments
when agency preferences diverge from those of the president.
H1: Presidents politicize when their preferences diverge from those of the agency.
Over time presidents can have some success changing bureaucratic preferences through
changes in agency policies and rules, the recruitment and promotion of sympathetic career
employees, and the burrowing in of political appointees into career jobs. Surveys of top-level
managers in the late 1980s showed a significant change in policy attitudes since the 1970s.
Managers had become significantly more conservative after 8 years of Republican governance in
the White House. These changes in agency policy views decrease preference divergence
between the president and agencies and lessen the need for political appointees.
Sensitivity to Politicization
The decision to politicize also hinges on certain characteristics of the agency and its
tasks. In particular, some agencies are very sensitive to politicization while others can tolerate
the addition of appointees without much consequence for performance. Sensitivity to 18 Somers 1965, 81.
14
politicization can vary across agencies and over time according to a number of important factors.
One important factor defining an agency’s sensitivity to politicization is its task complexity.
Agencies that perform mundane tasks like sending out social security checks are less sensitive to
changing levels of political appointments because the jobs are easy enough that appointees or
careerists can manage equally well. Agencies that perform difficult tasks like rocket science or
complex statistical models will be more sensitive to changes in levels of politicization since
some jobs cannot be done or managed equally well by people from the outside of an agency. For
example, some government agencies like the National Aeronautics and Space Administration or
the Department of Energy Weapons labs are literally are doing rocket science. Others like the
Bureau of Labor Statistics, the Census Bureau, and the Environmental Protection Agency are
responsible for collecting data on the labor market, demographics, or environmental pollutants
for use in estimating complex statistical models.
In some cases, as in the case of former counterterrorism official Richard Clarke, agencies
are sensitive to politicization precisely because the costs of task failure are extremely high. Very
small variance in quality or the likelihood of making mistakes can have a large impact on
outcomes. Mistakes in air traffic control, secret weapons research, or attacks on the lives of
public officials can have dire consequences. The cost of mistakes can also be economic as in the
case of ergonomics rules promulgated by the Occupational Safety and Health Administration.
Whether the costs will be in terms lives, security or the environment, when agency mistakes are
costly, agencies are more sensitive to politicization and presidents are less likely to politicize.
A final source of variance in sensitivity to politicization is the labor market. Sensitivity
to politicization varies with the availability of outside options for agency career managers. If
outside wage offers are high, small decreases in the satisfaction of work, either due to loss of
15
policy influence, lack of access to top policy and pay jobs, or the increased influence of
appointees can have a large impact on turnover within an agency’s career ranks. If outside
options are bad, career managers are more likely to stay even if work becomes less rewarding.
This means presidents can politicize with less impact on agency performance. All three sources
of difference among agencies at points in time—task complexity, costs of errors, outside
options—influence the level of politicization.
H2: Politicization decreases as the sensitivity of agency competence to politicization
increases.
Congress and Politicization
In some ways the views of the two branches with regard to politicization are very similar.
Like presidents, members of Congress care about policy outcomes. Some members care about
policy inherently and others care because delivering outcomes that mirror the preferences of their
districts or states enhances reelection chances. Congress recognizes the importance of
appointments for presidential control of the bureaucracy and acknowledges the dangers of over-
politicization. Congress has also decried on a number of occasions how increasing appointments
impact the quality of administration. While members of Congress share the president’s concern
for policy and thus the number of appointments and the amount the agency capacity, they differ
in important ways from the president. First, members of Congress are less enthusiastic about
presidential appointments. Presidential appointments do not necessarily make members of
Congress better off because individual members do not always share the president’s views on
policy. Increasing the number of appointments or replacing careerists with appointees can aid
the president in pulling an agency’s policy away from what a member of Congress prefers.
16
Whether a member of Congress prefers more appointees will depend upon how similar their
preferences are to those of the president and where the agency’s policies are relative to those of
the member and the president. When preferences diverge between an agency and Congress,
Congress is more willing to politicize. In fact, as with presidents, this is a necessary condition
for Congress to support politicization since if the agency shares Congress’s preferences,
Congress only stands to lose from politicization. In cases where the agency’s preferences
diverge from the president and Congress and one or both parties want to politicize three types of
scenarios exist depending upon the policy views of the president and Congress relative to the
agency in question. For the purposes of this paper I focus on the straightforward claim that
politicization should increase when Congress and the president share the same policy views.
H3: The more preferences between the president and Congress converge, the
more Congress wants to politicize.
Of course, not all politicization has to do with policy. Patronage considerations influence
the calculation of both the president and Congress about the proper number and location of
political appointments. To the extent that patronage and other non-policy related considerations
play a role in the politicization decision, the influence of the theoretical explanation given above
should decrease. I explore this in more detail below.
Part III. Data, Variables, and Methods
There are two primary sources of data about the number of political appointments in
federal government agencies over time. The first is data from what is commonly referred to as
the Plum Book and equivalents prior to its publication.19 The Plum Book, first published in
19 Data from 1953 come from U.S. Congress. 1953. Positions Not Under the Civil Service, 83d Cong., 1st Sess., Senate Doc. 18. Washington, DC: Government Printing Office. Table 1. Data from 1933 come from U.S.
17
1960, is a congressional publication produced every election year listing all the policy and
supporting positions of the federal government. The second source of appointments data is the
Central Personnel Data File (CPDF) managed by the Office of Personnel Management. Neither
source of data is ideal. The Plum Book is only published every four years which makes tracking
appointments over time difficult and makes connecting these changes to year to year variation in
wages or the political environment unfeasible. The difficulty with data from the CPDF is that it
is only available reliably back to 1988.20 Data from the CPDF includes political appointment
data on 251 agencies over this 17 year period (3,436 obs., 17 observations is median number).
This has the disadvantage of being a relatively short time period that includes only 1 Democratic
president, only two party changes in the White House, and only two second term presidents. For
most of this analysis I rely on data from the CPDF but will refer from time to time to Plum Book
data.
Insert Figure 1 here.
The most common belief about politicization is that it is increasing over time at least
since the merit system peaked in coverage at the end of the Franklin Roosevelt administration.
In Figure 1 I graph the number of Senate confirmed positions from 1933 to 2004. The top line
reflects to the total number of positions and the bottom line includes only those positions in
cabinet departments. What is striking about the figure is that even though the number and size of
the cabinet departments has increased, the number of political appointments has not increased
notably. Most of the growth has occurred outside the cabinet. If politicization is occurring, it is Congress. Senate. 1933. Positions Not Under the Civil Service, 72nd Cong., 2d Sess., Senate Doc. 173. Washington, DC: Government Printing Office, Table 1. 20 According to OPM, the Central Personnel Data File (CPDF) codes changed during this period but many agencies did not adjust their self-reporting behavior consistent with the code changes so there may be miscounting. An employee in the Office of Federal Civilian Workforce Statistics explained to me, “For any data submitted by agencies in 1988, there would probably be some discrepancy. Because the coding changed in the CPDF as of 1986, some agencies may not have changed their coding.” Email correspondence with British Morrison, Office of Federal Civilian Workforce Statistics, August 4, 2004.
18
not in the cabinet departments. This is confirmed by Figure 2 where it is clear that the total
number of appointments has actually decreased slightly since 1980. It is also important to note
that politicization increased under Democratic presidents like Kennedy, Johnson, and Carter and
decreased under presidents like Ford and Reagan. These simple figures demonstrate neither a
steady increase in the number of political appointments nor a partisan politicization. Rather, they
suggest interesting variation across presidencies worth explaining.
Insert Figure 2 here.
Measuring politicization is not as straightforward as it may seem. Indeed, in both figures
I graphed counts of the number of appointed positions. Counts of the total number of appointees
can be misleading since there should be some “natural” growth in the number of appointees
when government grows. Similarly, there should be a natural decline in appointments if the
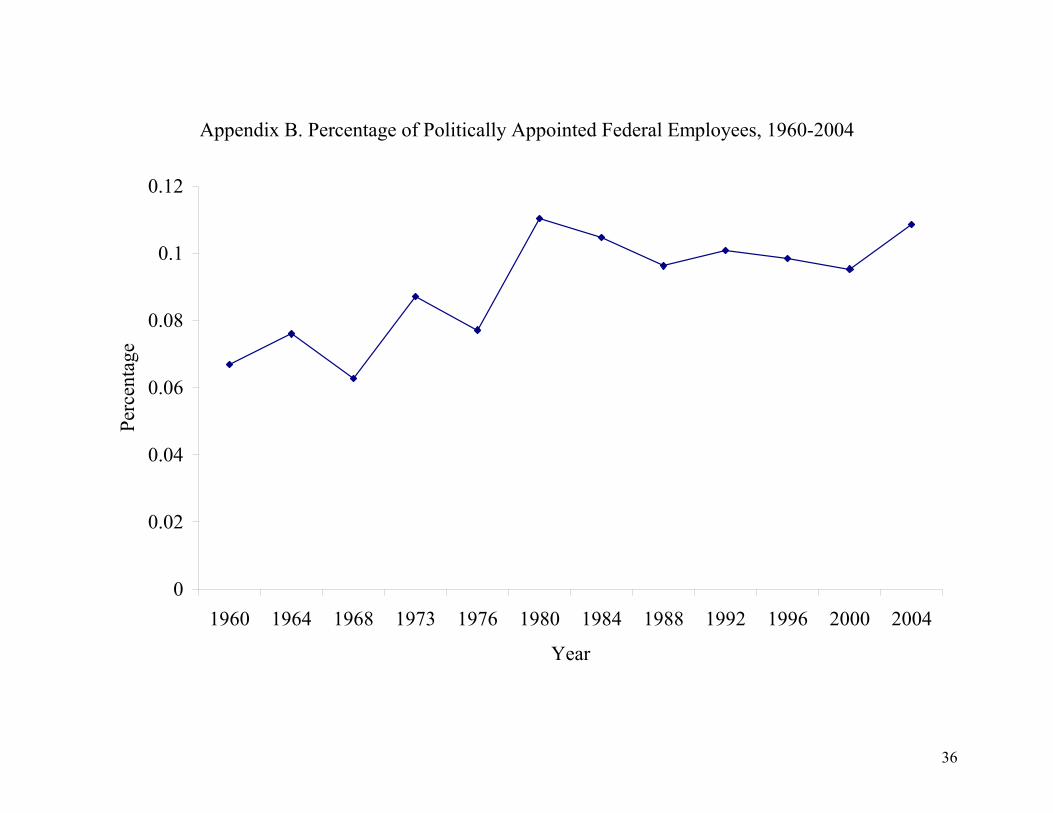
government gets smaller. One obvious solution is to examine the percentage of appointees
relative to the number of federal civilian employees (See Appendix B). Percentages can also be
misleading, however, since increases or decreases in federal employment affect the percentage
but may have nothing at all to do with politicization. This is particularly problematic since the
numbers of appointees are so small relative to the number of employees. The appropriate
denominator for a measure of politicization is the number of managers.
With this in mind I use the percentage of Senior Executive Service (SES) members that
are political appointees to measure changes in politicization over time. Between top-level
Senate-confirmed positions and traditional civil servants in the federal hierarchy is a layer of top
management positions that must be filled by a mixture of career employees from what is called
the Senior Executive Service (SES) and political appointees who will be designated noncareer
19
members of this service.21 Presidents or their subordinates can choose either an existing member
of the SES (a career civil servant who applied to be a part of the SES) or a political appointee
from outside who will fill an SES allocated position.22 By law political appointees cannot
exceed 10 percent of the entire SES or 25 percent of the allocated SES positions in a specific
agency.23 In September of 2004 there were 7,062 persons in the SES, 691 of whom were
appointees.24 This is an ideal place to see the dynamics of politicization since this bureaucratic
layer is the mixing ground of appointees and careerists. Presidents could choose all careerists if
they so desired but all presidents have placed appointees into key jobs. The average change in
politicization percentage by agency--appointed SES/(appointed SES + career SES)*100—is
close to 0, about .35 (minimum---100; maximum—100). During 1988 to 2004 the lowest total
percentage of appointees in the whole service was 4.15% in 2001 and the highest was 10.17% in
1995.
21 The Office of Personnel Management, based upon their own assessment and the requests of agencies, allocates a certain number of SES positions to each agency and the administration chooses which persons it will use to fill these slots. They do so subject to the further limitation that some SES positions are designated as “career reserved”. Agencies designate certain positions as career reserved if the agency believers these positions require impartiality or the public perception of impartiality. Examples include law enforcement or auditing positions. These positions can only be filled by career employees in the SES. About one half of all SES positions are currently designated as career reserved. Once a position has this designation it can only be changed by action of the Office of Personnel Management. Policy and Supporting Positions, 2000, p. 324. Every two years agencies submit to the Office of Personnel Management an executive resource inventory detailing their requests and justification for the number of SES slots the agency needs. OPM reviews these requests and allocates a number of SES slots. The agency may allocate these SES slots among its component parts as it sees fit. These slots are filled by persons from the SES. 22 Career personnel in the SES have rank in their persons as opposed to rank in their jobs. This allows them to be moved around while retaining status. So, for example, a career SES employee can serve in Senate confirmed or other positions but retain reemployment rights when they leave those positions. 23 There are two exceptions to this rule. First, small agencies with only a few SES positions often have more than 25% appointees. Second, percentages are calculated according to allocated positions rather than filled positions. If political appointees manipulate the total number of allocated SES positions they can have more than 25% appointees. 24 U.S. Office of Personnel Management, Fedscope website (www.fedscope.opm.gov).
20
Variables
My expectation is that increases in preference divergence between the president and an
agency will increase the percentage of an agency’s employees that are appointees. Measuring
policy disagreement between the president and an agency is difficult since there is no direct way
to measure agency preferences. Secondary indicators of likely disagreement between the
president and the permanent government do exist, however. Specifically, we should see an
increase in preference divergence between the president and government agencies when there is
party (or preference) turnover in the White House.25 Each president influences the shape and
composition of the bureaucracy. When new presidents assume office, it is only natural that the
existing structure and personnel be viewed with some suspicion. New presidents perceive that
their preferences diverge from those of the continuing bureaucracy. In order to test whether
preference divergence stemming from party turnover increases the percentage of appointees, I
use two variables. I first code 1993-1996 and 2001-2004 with a 1 and all other years a 0. These
are presidential terms where party turnover has occurred. I also create a variable that is coded 1
only for 1993 and 2001 since these years are transition years with a party change in the White
House.
Another means of evaluating whether preference divergence influences the percentage of
appointees is to look and see whether Republicans and Democrats treat agencies differently
depending upon what they do. Specifically, we might expect that Republicans would be more
likely to politicize an agency involved in the environment and regulation such as the
Environmental Protection Agency but perhaps less likely to politicize a military or defense
agency. In the analysis that follows I code all agencies according to whether they are regulatory
25 I talk exclusively here in terms of party and partisanship but have estimated models using preference measures in place of partisan measures and the results mimic what I find with the partisan measures (McCarty and Poole 1995; Poole 1998).
21
(0,1) or defense (0,1) agencies and interact this with the partisanship of the president.26 I also
code all observations for whether there is a Republican president (0,1). I expect that the
interaction of Republican president and regulatory agency should be positive, indicating that
Republicans politicize regulatory agencies more than Democrats. I expect the interaction of
Republican presidents and military/defense agencies to be negative, indicating that Democrats
politicize such agencies more than Republicans.
My second primary expectation is that those agencies that are most sensitive to
politicization will have the fewest appointees. To measure task complexity and the costs of
policy mistakes I include indicators (0,1) for defense, regulatory, and science agencies.27 All
else equal, these agencies should have lower percentages of appointees because they are more
sensitive to politicization. Their tasks are arguably more complex and the costs of errors can
have higher costs economically and in security.
Sensitivity to politicization varies over time according to the availability of good private
sector options for agency employees. If agency personnel have good outside options, small
changes in politicization can have a significant impact on the decision of careerists to stay in an
agency or leave. Politicization can decrease the material and non-material benefits of work,
particularly for those who do not share the president’s preferences. To measure the quality of
26 I code regulatory agencies from Dudley, Susan, and Melinda Warren. 2003. Regulatory Spending Soars: An Analysis of the U.S. Budget for Fiscal Years 2003and 2004. Mercatus Center (George Mason University) and Weidenbaum Center (Washington University, St. Louis). This regular publication of the Weidenbaum Center tracks regulatory spending over time on an agency-by-agency basis and is a useful tool for identifying which federal agencies engage in regulatory behavior (http://wc.wustl.edu). I use codes from the Office of Management and Budget’s public budget database to identify which agencies are military or defense agencies (www.omb.gov). 27 National Academy of Sciences. Science and Technology Leadership in American Government: Ensuring the Best Presidential Appointments (Washington, DC: National Academy Press, 1992); National Academy of Sciences. Science and Technology in the National Interest: The Presidential Appointment Process (Washington, DC: National Academy Press, 2000); National Academy of Science. Science and Technology in the National Interest: Ensuring the Best Presidential and Federal Advisory Committee Science and Technology Appointments (Washington, DC: National Academies Press, 2004).
outside options I use hourly private sector business and professional wages in real dollars.28 As
private sector wages increase, politicization should decrease.
I include an indicator for unified government (0,1) to since Congress should allow
presidents to politicize more when they have similar policy views.
Controls
Of course, there are a number of other factors that could influence changes in the
percentage of appointees. As suggested above, I include an indicator for whether or not the
president is a Republican (0,1). It is possible, despite the evidence presented above, that
politicization is a partisan rather than institutional phenomenon. I control for normal within term
dynamics by including indicators for year of the term. I also estimate models estimated with
various controls including the log of agency size, the size of the White House Office, and a time
trend.
Methods
The theoretical argument I pose suggests that there is an optimal level of political
appointees depending upon the degree of preference divergence, the sensitivity of the agency to
politicization, and the degree of policy agreement between the president and Congress.
Changing the independent variables should change the optimal level of appointees either up or
down. In some cases we may expect that changes to the independent variables will have long-
lasting, permanent effects on the number of appointees. For example, we expect the optimal
percentage of appointees to be lower for regulatory agencies than other agencies over the long
28 Source: Bureau of Labor Statistics (www.bls.gov). The series is average hourly wage, seasonally adjusted, for professional and business occupations.
haul. In other cases, however, changes in the independent variables may have only short-run
effects on the degree of politicization. That is, the percentage of appointees will immediately go
up or down in response to a change in the independent variable but will eventually go back to an
equilibrium level. For example, it is possible that a change from a Democrat to Republican in
the White House will produce a short run increase in the number of appointees in the EPA or the
Department of Housing and Urban Development but ultimately, the number of appointees will
go back to an original optimal level once the new president has established control.
Alternatively, it is possible that this party change in the White House increases the number of
appointees in these agencies for the duration of the president’s term.
To account for the possibility of both short and long-run effects I estimate a series of
error correction (EC) models. The standard EC model is:
tititititi xyxy ,1,1,,, )( εγφβα +−+Δ+=Δ −− (1)
where )( 1,1, γφ −− − titi xy is the EC term. In equilibrium γ1,1, −− = titi xy . Changes in γ1, −tix result in
long run changes in the percentage of appointees, . When there has been a shock that
throws
1, −tiy
)( 1,1, γ−− − titi xy out of equilibrium, φ reflects the rate at which a process returns to
equilibrium.29
I estimate the following equation to obtain estimates of both the short run effects, βtix ,Δ ,
and the EC mechanism:
tijtiktititi xxyy ,1,,01,, εβββα ++Δ++=Δ −− (2)
where 0β is φ in Equation 1 and jβ is φ γ .
29For a good review of dynamic specifications see Beck 1991.
24
Estimating models on time-series-cross-sectional (TSCS) data using OLS can be
problematic since the errors can be correlated over time (errors in agency i at time t are
correlated with errors in agency i at time t-1), correlated across agencies (errors in agency i at
time t are correlated with errors in agency j at time t), and different panels can have different
error processes. In this instance the dependent variable is a difference and first differenced series
are often stationary where normal time series are not. To account for heteroscedastic and
contemporaneously correlated errors across panels, I report panel corrected standard errors.30
Part IV. Results
In Table 1 I include estimates of 4 models of politicization. Additional specifications are
included in Appendix C. The primary reason I estimate multiple models is that many of the
variables only vary across years and not agencies. Variables like unified government, business
and professional wages, and party change do not vary by agency. They only vary across the 17
years of observations common to all agencies. There is significant collinearity among some of
the variables that vary only across years so it is difficult to disentangle, for example, whether
politicization increases because of unified government or party change in the White House since
all periods of unified government in this sample occur during a presidential term where there has
been a party change in the White House. With this caveat in mind, the estimates are supportive
of the theoretical argument I put forward.
The advantage of an EC model is that it is agnostic about whether changes in the
independent variables have long or short run effects on the dependent variable. In order to
interpret the coefficients in Table 1 we need to transform the results to calculate the EC portion
30 Beck and Katz 1995 show via simulation that panel corrected standard errors are successful in accounting for contemporaneous and panel heteroskedastic standard errors. Specifically, these models are estimated using the xtpcse command in Stata 8.0.
25
of the model. For example, the EC portion based upon estimates from the first model is
)(19. 1,1, γ−− −− titi xy which, after substituting, is:
The values inside the parentheses reflect the estimated coefficients from Equation 2 divided
by the coefficient on the lag of the percent politically appointed, . If the coefficients on
the variables in the EC mechanism are significant and large, these variables have a long-run
impact on the level of politicization in an agency. If the coefficients on the variables
outside the EC mechanism are large and significant, the variables have short run impacts on
the level of politicization.
1, −tiy
My expectation was that increases or decreases in preference divergence between the
president and the permanent government would alter the number of political appointees. The
models show that party change in the White House has a clear impact on the number of
appointees in the SES. There is a short-run and a long-term effect. The negative coefficient on
the change in the party turnover variable suggests that party turnover in the White House leads
initially to a lower level of appointees in the first year of the new term and then a comparable
increase in the second year of their term. There is a long run increase in the level of appointees
during the term. The initial decrease in appointee percentage is likely the result of the transition.
It takes new presidents the first year to fill out their teams. The Clinton Administration’s
difficulties during the transition year of 1993 are well documented.31 Even the George W. Bush
31 Burke 2000, 283.
26
administration had difficulty filling all the vacancies in appointed positions.32 In addition, career
members of the Senior Executive Service cannot be removed for at least three months after a
new president takes office.
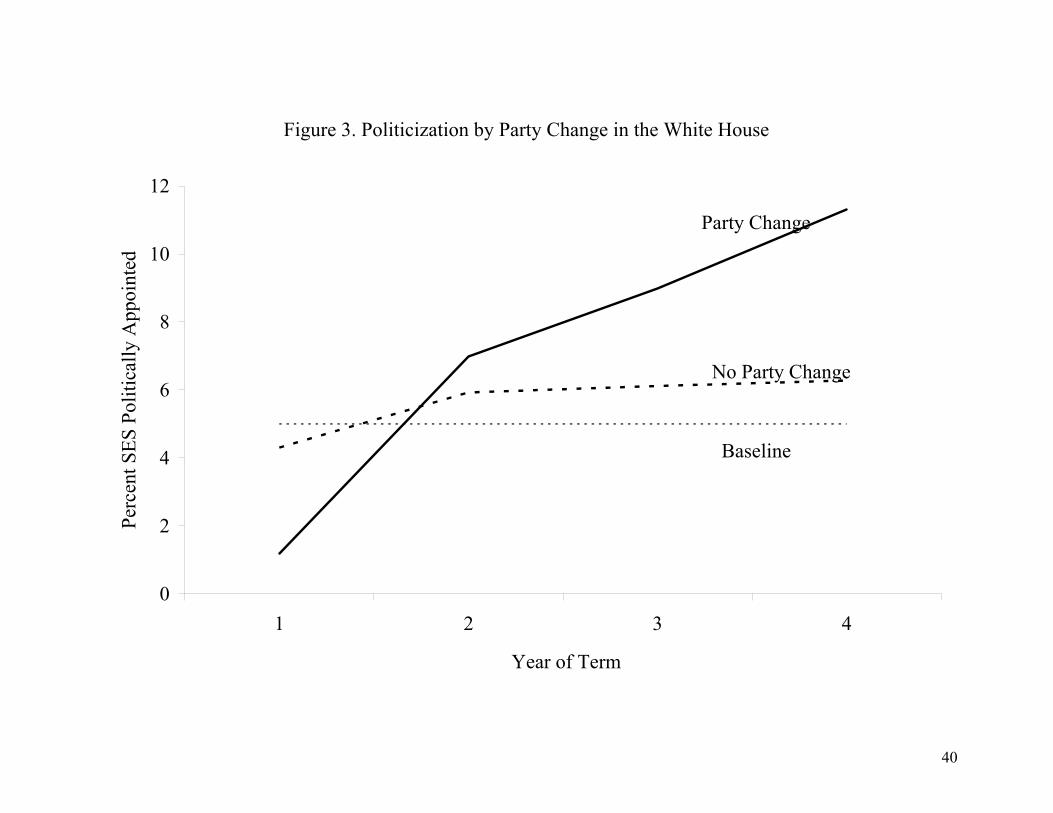
Insert Figure 3 here.
In Figure 3 I graph the impact of party change in the White House on the percentage of
the SES employees that are politically appointed. The base comparison is a presidential term
where no party change took place. When the sitting president in a new term is from the same
party as the past president we see an increase of about 1-2 percentage points in the politically
appointed members of the SES compared to the 4th year of the previous term. Party change adds
another 5-6 percent politically appointed. To put this in perspective, consider an agency that had
100 SES positions at the end of the last president’s term. This agency would have 5 appointees
out of the 100 positions. In a new term filled by a president from the same party, the number
would increase to 6 or 7 appointees. If a party change has occurred, however, the number of
appointees would increase to 10 or 11 appointees over the original 5. In broader perspective,
consider that the total SES includes about 7,000 employees. Party change in the White House
will lead to about 350 more political appointees spread throughout the government.
If these 350 additional appointees are placed in what President Kennedy’s team called
“pressure points” these additional appointees can have a substantial impact on policy outcomes
and management. According to the Federal Yellow Book, political appointees in the SES run
agencies such as the Health Resources and Services Administration, the Rural Housing Service,
the Agricultural Marketing Service, the Food and Nutrition Service, and the Public Buildings
32 Light, Paul. 2001. “The Confirmation Crawl.” Washington Post, August 10, 2001, p. A25 (Brookings website).
27
Service.33 They run agencies with budgets in excess of $10 Billion and employ as many as
25,000 employees. They make grants, oversee crop insurance programs, monitor hospital patient
safety, and direct school lunch programs. Whether or not these people are appointees or career
managers can have a large impact on policy and bureaucratic performance.
These estimates together suggest that preference divergence between the president and
the bureaucracy increases the number of political appointees. These estimates have only been
able to suggest in a very general way that the number of appointees will increase noticeably after
party turnover. The models have been less successful identifying which agencies will receive the
appointees. Some agencies in the federal government have virtually no appointees and are
unlikely to get any. Others are much more likely to get appointees than others. My expectation
was that Republicans would be more likely to politicize regulatory agencies and less likely to
politicize defense or military agencies. We know from the estimates that both regulatory and
defense agencies have lower equilibrium levels of appointments since the coefficients are
negative and significant but Republicans are no more or less likely to politicize these agencies by
type. While the coefficients on the interaction terms suggest that Republican presidents prefer
slightly more appointees in regulatory agencies and slightly less appointees in defense agencies, I
cannot reject the null that the coefficients on the interaction terms are 0 in Model 1.
The coefficients on the science, regulatory, and defense variables are all consistently
negative and at least marginally significant in most of the models. Estimates suggest that if the
average agency has 9-10 percent political appointees in its SES, regulatory, defense, and science
agencies have only 1 to 6% appointees in the SES. This provides evidence that agencies that
should be most sensitive to politicization on the basis of what they do are, indeed, the least
33 The Federal Yellow Book is a privately produced directory of government officials that identifies, among other things, which executive branch officials are appointed. Federal Yellow Book, various years.
28
politicized. Agencies with complex tasks that require specific skills or knowledge to manage are
less politicized than other agencies. Similarly, agencies that perform tasks where the costs of
failure are high--either in security or economic costs—are less politicized than other agencies.
The evidence for the impact of outside wage offers on politicization is more equivocal
but also confirms that sensitivity to politicization constrains politicization choices. When
economic conditions provide good outside options, politicization can have a much more dramatic
impact on agency personnel, morale, and overall performance. Presidents politicize less when
outside wages are high. A one time average increase ($.50) in real business and professional
wages decreases the percentage of appointees by about .5% or 35 positions across the entire SES
for a four year term. This likely understates the true impact of wages during this period since
real wages rose steadily during the 1988 to 2004 period. One explanation for the gradual decline
in the number of appointees during the Clinton Administration may be the performance of the
private sector economy. It is impossible to disentangle here whether presidents and their
subordinates choose to add fewer appointees during good economic times because appointees are
less willing to serve or because careerists are more likely to leave. In either case, presidents
recognize that performance will suffer with the addition of appointees.
Not surprisingly, Congress is more enthusiastic about presidential appointees during
periods of unified government. During periods of unified government, the equilibrium
percentage of appointees in the SES increases. Because of the overlap in variables such as party
change and unified government it is hard to estimate the impact of unified government with
precision. At minimum unified government leads to a 1 percentage point increase in political
appointees in the SES (70 positions in the whole SES). The effect is likely substantially larger
given the estimates in Model 3. Neither this effect nor any other appears to be caused by the
29
presence of a Republican president. Estimates indicate that Republican presidents are no more
likely to politicize than Democrats. Larger agencies tended to have fewer appointees and the
size of the White House Office had no significant relationship with the president’s propensity to
politicize. The coefficient is negative, however, indicating that presidents politicize less when
the White House is large.
In total, presidents do politicize in response to preference divergence, subject to the
constraints of agency sensitivity to politicization and the preferences of Congress. Presidents
increase the number of appointees when they suspect an agency does not share their preferences.
They decrease the number of appointees when the agency shares the president’s views on policy.
This is particularly true in periods when Congress shares the president’s preferences. Congress
is less likely to restrain presidential politicization when such actions will change policy in a
direction consistent with the opinions of a majority in Congress. Politicization choices are also
constrained by differences among agencies across time related to how sensitive their
performance is to politicization. Some agencies can function easily and well with more
appointees. The performance of other agencies can deteriorate dramatically. As the sensitivity
of an agency’s performance to politicization increases, the number of appointees in the SES
decreases.
It is important to put these estimates of politicization in the SES in the context of other
types of appointees and the appointments process. Political appointees in the SES are only one
type of political appointment in the federal government. There are also Senate-confirmed
positions (~600 key positions) and Schedule C positions (~1,500 positions). In addition, there
are other techniques for using career personnel like political appointees. Further work should be
done to determine whether these patterns extend to other personnel arenas. Increases or
30
decreases in the number of appointees usually occur in the context of other forms of
politicization such as selecting Senate-confirmed appointees primarily on the basis of loyalty.
There are similarities between how presidents want to select appointees and how they make
decisions about the number of appointees. In both cases, presidents must balance concerns for
loyalty with concerns for competent management if the president wants effective control.
Part V. Discussion and Conclusion
The uptick in the number and percentage of political appointments across the government
during President Bush’s first term demonstrates that Porter Goss’s tactic at the CIA is not an
isolated incident. The CIA case illustrates a number of important general conclusions about
politicization from this paper. First, politicians politicize when they believe an agency does not
share their preferences. The CIA was politicized because the Bush Administration and Goss
were suspicious of the loyalty of the CIA and did not believe that CIA’s preferences coincided
with their own. Indeed, many in the administration believed the CIA to be a rogue agency and
the source of embarrassing leaks during the 2004 campaign.
Second, politicization results in lower agency competence. The politicization of the CIA
undoubtedly hurt its capacity. Morale is lower and losing the institutional memory, expertise,
and human capital associated with 20 of the top career managers at CIA has hurt the agency.
But, this illustrates a third point which is that sometimes presidents are willing to trade capacity
in order to get an agency to share their preferences. Goss and the administration knew what the
likely consequences of their action would be. Their own perception of the competence of the
people who left was undoubtedly colored by partisanship and the failings associated with 9/11
and the intelligence work on weapons of mass destruction.
31
Finally, members of Congress were divided about whether this widely acknowledged
politicization of the CIA was a necessary tactic to reign in an unresponsive government agency
or a dangerous example of bad management with potentially disastrous consequences for
national security. Generally, those members of Congress who shared the administration’s
preferences took the former view while those who opposed the administration took the latter
view. This does not necessarily reflect only base partisanship. Rather, it is an example of a
more general pattern which is that members of Congress are much more tolerant of politicization
when it helps a president of their party or ideology to get control of the bureaucracy.
As of this writing the upheaval within CIA stemming from Goss’s politicization seems to
be over. In its aftermath Goss has worked to rebuild CIA by restructuring and more hiring. CIA
will be a different agency when the next president assumes office. Whether the next president
trusts the new CIA more or less will partly depend upon the preferences of the next president and
the long term consequences for capacity of this politicization. Some partisans have called for
President Bush to “Gossify” other parts of the bureaucracy. Whether or not he chooses to do so
likely will have dramatic consequences for policy outputs, political control, and agency
Business and Professional Hourly Wages t-1 -- 0.02 -- -0.21*
Unified Government
Unified Government t-1 (0,1) -- -- 2.69** --
Controls
Republican President t-1 (0,1) -0.25 -- -- --
Constant 1.76* 4.16 1.12 4.76**
N 2764 2762 2764 2762 Χ2 (11, 9, 5, 11 df) 222.71** 59.8** 59.0** 323.63**Note: Dependent variable is Δ political appointee %. *significant at the .10 level in two-tailed test; **significant at the .05 level in two-tailed test. Panel corrected standard errors reported. Models estimated on 222 agencies. Excluded agencies have no SES positions.
33
Appendix A. Formalization of theoretical argument
Assume that presidents care about policy outcomes and want agencies to act in ways that will produce outcomes that presidents prefer and assume that the president and the agency have single peaked and quadratic preferences over policy outcomes in a unidimensional policy space so that
2)( ixui −−= . (1) Policy outcomes are determined partly by the outputs produced by the agency. Agency outputs are a function of the agency’s policy preferences and its competence. Specifically, the agency will try and set policy (e.g., prepare budget, write a policy memo, negotiate trade agreement) exactly at its own induced ideal point, a’, but they cannot do so perfectly. The agency will try to implement a’ but the actual outcome will be a’-ω where ω is a random variable so that )(' qax ω−= (2) and ω has a mean 0 and a variance defined partly by q, the percentage of appointments. There are a number of possible ways to model how q influences the variance but for simplicity assume var(ω)=mq. Substantively, this means that errors increase as q increases.
The agency’s induced ideal policy, a’, is a function of its inherent ideal policy, a, the president’s ideal policy (p) and the percentage of political appointees (q): aqpqpqa ))(1()(),(' γγ −+= (3) where )(qγ is increasing in q. The amount of presidential influence in the agency’s ideal policy is a function of the percentage of political appointees in the agency. Substituting the induced ideal point into the president’s utility function gives: (4) 2)]))((1[( paqu p −−−= γand this means that the president’s expected utility is: (5) mqpaquE p −−−−= 2)]))((1[()( γwhere mq is the expectation of the variance. The separability of the mean and the variance in the utility function is a property of the quadratic utility function. mq reflects the errors that agencies can make in trying to carry out their responsibilities. The variance is a function of q since I argue that bureaucratic capacity is partly determined by the career/appointee percentage. Presidents have utility for mq because they prefer that agencies have more capacity rather than less. Presidents choose the optimal percentage of political appointees, q*, so that the marginal benefits of decreasing preference divergence between the agency and the president equal the marginal costs of decreasing competence. The partial derivative with respect to q is
mpapaqu
−−−−=∂∂ )(')])(1[(2 γγ (6)
which when solved is:
2
']))(1[( 2 mpa =−− γγ . (7)
This nicely sets the impact of preference divergence between the president and the agency against presidential concerns for agency capacity if m is understood as an agency’s sensitivity to the percentage of appointees. If preference divergence increases, the optimal q increases. To see this consider that:
34
34
35
02
]))(1[( 2 =−′−−mpa γγ . (8)
By the implicit function rule
222 )(''']))(1[()1('
)(*
papapaq
−−−−−−
=−∂∂
γγγγγ .
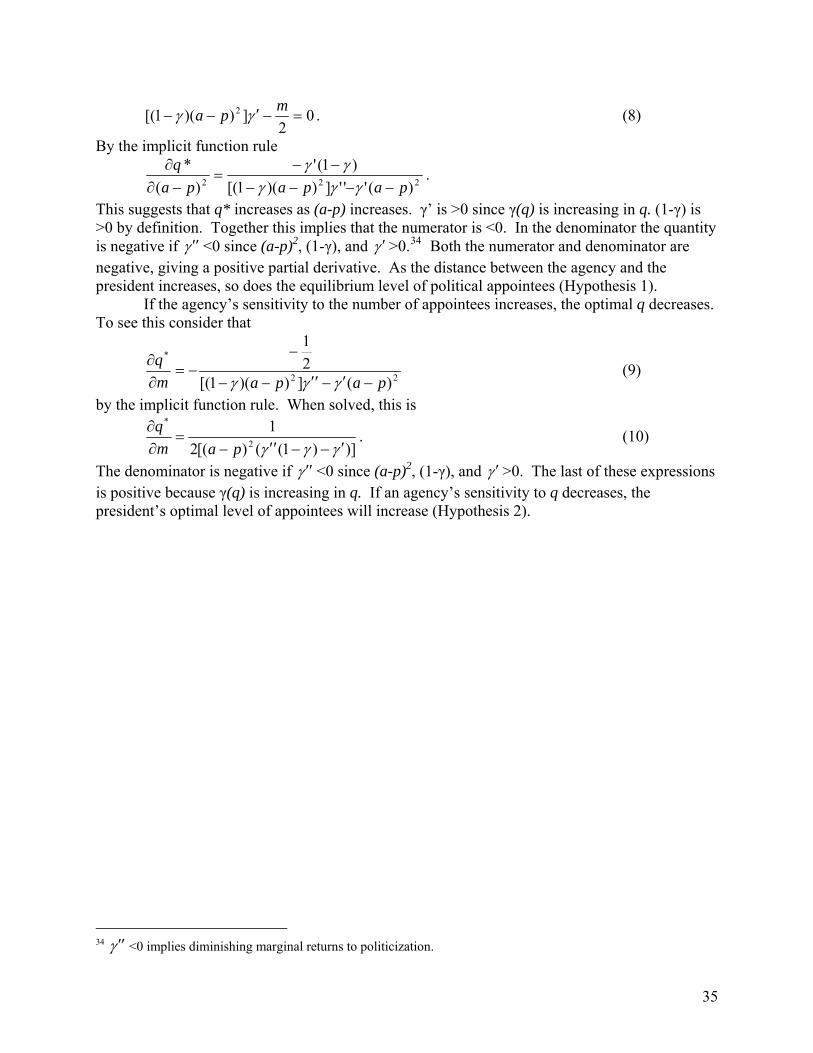
This suggests that q* increases as (a-p) increases. γ’ is >0 since γ(q) is increasing in q. (1-γ) is >0 by definition. Together this implies that the numerator is <0. In the denominator the quantity is negative if γ ′′ <0 since (a-p)2, (1-γ), and γ ′>0.34 Both the numerator and denominator are negative, giving a positive partial derivative. As the distance between the agency and the president increases, so does the equilibrium level of political appointees (Hypothesis 1).
If the agency’s sensitivity to the number of appointees increases, the optimal q decreases. To see this consider that
22
*
)(]))(1[(21
papamq
−′−′′−−
−−=
∂∂
γγγ (9)
by the implicit function rule. When solved, this is
)])1(()[(21
2
*
γγγ ′−−′′−=
∂∂
pamq . (10)
The denominator is negative if γ ′′ <0 since (a-p)2, (1-γ), and γ ′>0. The last of these expressions is positive because γ(q) is increasing in q. If an agency’s sensitivity to q decreases, the president’s optimal level of appointees will increase (Hypothesis 2).
γ
′′ <0 implies diminishing marginal returns to politicization.
36
Appendix B. Percentage of Politically Appointed Federal Employees, 1960-2004
Business and Professional Hourly Wages t-1 -0.22* -0.18 -0.15 -0.06
Unified Government
Unified Government t-1 (0,1) -- -- -0.17 --
Controls
Republican President t-1 (0,1) -- -- -1.18 --
Ln(Agency Employment) t-1 -0.34** -- -0.30** --
White House Employees t-1 -- -0.01 -0.03 --
Constant 7.38** 7.42 20.54 4.01**
N (Obs, Groups) 2762, 222 2410, 210 2410, 210 2762, 222 Χ2 (df) 327.14** 437.98** 541.84** 268.8** Note: Dependent variable is Δ political appointee %. *significant at the .10 level in two-tailed test; **significant at the .05 level in two-tailed test. Panel corrected standard errors reported. Model 8 includes common space scores in place of partisan measures.
Figure 1. Number of Senate-confirmed Appointed Positions (PAS), 1933-2004