Page 1
The Cluster of Blue Stars Surrounding the M31 Nuclear Black Hole 1
Tod R. Lauer,1 Ralf Bender,2,3 John Kormendy,4,2,3 Philip Rosenfield,5
and
Richard F. Green6
ABSTRACT
We obtained U330 and B band images of the M31 nucleus using the High Resolution
Camera of the Advanced Camera for Surveys on board the Hubble Space Telescope
(HST). The spatial resolution in the U330-band, 0 ′′. 03 FWHM, or 0.1 pc at M31, is
sufficient to resolve the outskirts of the compact cluster (P3) of UV-bright stars sur-
rounding the M31 black hole. The center of the cluster is marked by an extended source
that is both brighter and redder than the other P3 sources; it is likely to be a blend
of several bright stars. We hypothesize that it marks the location of the M31 black
hole. Both stellar photometry and a surface brightness fluctuation analysis, show that
the P3 stellar population is consistent with early-type main sequence stars formed in a
∼ 100 − 200 Myr old starburst population. In contrast, evolutionary tracks of post
early asymptotic giant-branch stars, associated with late-stage evolution of an old pop-
ulation, also traverse the U and U− B domain occupied by the P3 stars; but we argue
that only a few stars might be accounted for that way. PEAGB evolution is very rapid,
and there is no progenitor population of red giants associated with P3. The result that
P3 comprises young stars is consistent with inferences from earlier HST observations
of the integrated light of the cluster. Like the Milky Way, M31 harbors a black hole
closely surrounded by apparently young stars.
Subject headings: galaxies: nuclei — Galaxies: M31
1National Optical Astronomy Observatory2, P.O. Box 26732, Tucson, AZ 85726
2Universitats-Sternwarte Munchen, Scheinerstrasse 1, Munchen D-81679, Germany
3Max-Planck-Institut fur Extraterrestrische Physik, Giessenbachstrasse, D-85748 Garching, Germany
4Department of Astronomy, University of Texas at Austin, 1 University Station C1400, Austin, TX 78712-0259,
USA
5Astronomy Department, University of Washington, Seattle, WA 98195
6Large Binocular Telescope Observatory, University of Arizona, 933 North Cherry Avenue, Tucson, AZ 85721,
USA
Page 2
– 2 –
1. Blue Stars / Black Hole
There is a highly-compact cluster of blue stars (Lauer et al. 1998; Brown et al. 1998) at the
heart of the M31 double nuclear-cluster of old stars. Kormendy & Bender (1999) showed that
this blue cluster in turn hosts the ∼ 108M⊙ super-massive black hole also known to reside in the
nucleus (Dressler 1984; Dressler & Richstone 1988; Kormendy 1988; Richstone et al. 1990). Bender
et al. (2005) argue that the integrated spectrum and spectral-energy distribution of the stars are
consistent with their formation in a burst 200 Myr ago. Young stars are also closely bound to
the nuclear black hole in our galaxy (Forrest et al. 1987; Allen et al. 1990; Krabbe et al. 1995),
suggesting that this may not be a rare phenomenon. Understanding how apparently young stars
were formed deeply interior to the tidal field of a supermassive black hole probes several issues of
how stars and gas interact within such an extreme environment (see Alexander 2006 for a review).
Study of the blue cluster in M31 provides an additional context in which to test theories for the
formation of the unusual population surrounding the Milky Way black hole.
There is a diversity of ideas for explaining the origin of the M31 blue cluster. Chang et al.
(2007), for example, argue that the cluster is the expected consequence of the non-axisymmetric
structure of the surrounding M31 nucleus funneling gas from stellar mass-loss into orbit around
the black hole, where it periodically reaches surface densities sufficient to induce collapse and star
formation. Likewise, Wardle & Yusef-Zadeh (2011) recently considered the formation of compact
disks of young stars around black holes by massive central accretion of gas. In contrast, Demarque &
Virani (2007) argue that the blue stars result from stellar collisions and tidal stripping acting on an
old population of stars interacting within the high-velocity orbits and strong tidal-field associated
with the black hole. We present new observations of the blue cluster obtained at the maximum
angular resolution offered by the Hubble Space Telescope to provide better constraints on the origin
of the stars residing in this unusual environment.
1.1. The Discovery of the Blue Cluster
The discovery of the blue cluster proceeded in stages. King et al. (1995) imaged the nucleus
of M31 with the HST Faint Object Camera at 1750A, seeing a double structure similar to that
discovered in the optical by Lauer et al. (1993). By the simple expedient of checking the position-
angle of their images, however, they discovered that the optically-dimmer peak, designated P2 by
Lauer et al., was actually brighter in the UV than P1. King et al. (1995) lacked S/N sufficient to
1Based on observations made with the NASA/ESA Hubble Space Telescope, obtained at the Space Telescope
Science Institute, which is operated by the Association of Universities for Research in Astronomy, Inc., under NASA
contract NAS 5-26555. These observations are associated with GO # 10572.
2The National Optical Astronomy Observatory is operated by AURA, Inc., under cooperative agreement with the
National Science Foundation.
Page 3
– 3 –
resolve the spatial structure of the UV source at P2, noting only that it was highly-compact and
possibly consistent with a point source, such as low-level emission associated with the weak AGN
detected in the radio (Crane et al. 1992), or emission from a single PAGB star, such as those seen
further out from the nucleus (King et al. 1992; Bertola et al. 1995). In retrospect, the discovery of
a UV-bright nuclear source explains the observations of Nieto et al. (1986), who found the nucleus
to have color gradient becoming bluer towards its center, using CFHT images obtained at 3750A.
Discovery of the cluster may also have been presaged by an enigmatic reference in Redman &
Shirley (1937) to third-party unpublished “Mt. Wilson material” purporting to show that “the
spectrum of the nucleus is of a peculiar dwarf A type,” a result supported by no other work prior
to Bender et al. (2005) to the best of our literature research.3
Later HST observations by Lauer et al. (1998) and Brown et al. (1998) were able to resolve the
UV-source; both papers argued that it is a cluster of stars. WFPC2/PC images at 3000A obtained
by Lauer et al. (1998) showed that the half-power radius of the blue source is ∼ 0.2 pc. Lauer et al.
(1998) further combined their U and V band fluxes of the source with the King et al. (1995) fluxes
at 1750A to conclude that the source is consistent with an A-star spectral energy distribution.
Bender et al. (2005) refined this picture further by obtaining HST STIS spectroscopy of the
nucleus over λ ≈ 3600−5100A, and reanalyzing the F300W images presented in Lauer et al. (1998).
The spectroscopy shows strong Balmer lines, including a strong Balmer break, consistent with either
A0 main-sequence or giant stars, but not a population of white dwarfs of the same photospheric
temperature. The best match to the spectrum is provided by a 200± 50 Myr population formed in
a single burst. Populations of less than half this age would exhibit too much UV-flux to the blue
side of the Balmer break.
Bender et al. (2005) further show that the stars are distributed in a flat disk with an exponential
profile of scale-length of 0.37 ± 0.04 pc in rapid rotation about the black hole.4 The rotational
broadening of the STIS spectrum implies a black hole mass of M• = 1.4 × 10⁸M⊙, a significant
upwards revision from earlier determinations.
1.2. The Blue Cluster in the Context of the M31 Nucleus
The M31 black hole and its cluster of blue stars mark the center of a much larger nuclear
star-cluster of complex structure. The surface brightness of the nuclear stellar system begins to rise
above the underlying M31 bulge interior to r ∼ 3′′ or ∼ 10 pc from the center. The cluster becomes
increasingly elliptical at smaller radii, with 1 − b/a > 0.3 for r < 1 ′′. 7, but its isophotes remain
concentric with the photo-center of the bulge for r > 1 ′′. 4 (Lauer et al. 1993). At yet smaller radii
3We have also been unable to find photographic spectra of the M31 nucleus prior to 1937 in catalogues of Mt.
Wilson observations. We thank Dr. Christopher Burns of the Carnegie Observatories for searching for this material.
4We use 770 Kpc as the distance to M31 (Freedman & Madore 1990).
Page 4
– 4 –
the nuclear cluster exhibits the double-peaked structure discovered by Lauer et al. (1993). The
optically-brighter peak, P1, is offset by 0 ′′. 49 from the secondary brightness peak, P2, and a slightly
lesser amount from the M31 bulge photo-center.
The best explanation for the double morphology is that both peaks result from the line-of-
sight projection of an eccentric disk of stars roughly ∼ 2 pc in diameter bound to the black hole
(Tremaine 1995). The black hole strongly dominates the potential, thus the stars in the disk follow
Keplerian orbits, spending most of their time at the orbital apo-center, creating an enhancement
of light at P1. Significantly, the P1—P2 line twists away from the major axis of the outer nucleus
by ∼ 20◦. P1 and P2 are both redder in V − I than the surrounding nucleus (Lauer et al. 1998).
High spatial-resolution spectroscopy shows that both P1 and P2 comprise old stellar populations
with characteristics more like each other, than the underlying bulge (Kormendy & Bender 1999).
The “Tremaine Disk” thus appears to be a distinct component embedded in a much larger nuclear-
cluster. The initial model of the disk provided by Tremaine (1995) has been refined by the more
detailed analysis presented by Peiris & Tremaine (2003). An interesting feature of the refined
model is that the disk requires a central hole in order to generate the apparent minimum of stellar
emission that occurs between P1 and P2.
The cluster of blue stars occurs at still smaller radii, r < 0 ′′. 1, and must be closely bound to
the black hole, which was first inferred to exist from ground-based spectroscopy (Dressler 1984;
Dressler & Richstone 1988; Kormendy 1988; Richstone et al. 1990). Kormendy & Bender (1999)
carefully registered their high spatial-resolution spectroscopy to the WFPC2 imagery of Lauer et
al. (1998), concluding that the M31 black hole was coincident with the cluster and that both were
within 0 ′′. 07 of the M31 bulge photo-center. The conclusion that the cluster hosts the black hole
was further confirmed by Bender et al. (2005), who used STIS spectroscopy to show that the central
velocity dispersion in the cluster rises to 1183 ± 200 km s−1, with organized rotation peaking at
618± 81 km s−1. Building on the analysis of Kormendy & Bender (1999), they reduced the offset
of the black hole from the bulge center to 0 ′′. 033 in the “anti-P1” direction along the P1-P2 line.
They further demonstrated that this slight offset is balanced by the asymmetry of the Tremaine
disk — the center of mass of the complete nuclear system is coincident with the bulge photo-center
to < 0 ′′. 01.
Bender et al. (2005) also designated the cluster as a third component, P3, of the inner nucleus.
This designation includes a subtle redefinition of P2 as it previously had been introduced by Lauer
et al. (1993) and used by Lauer et al. (1998). The center of the cluster is coincident with the peak
of a shallow surface-brightness cusp seen in V-band that falls within 0 ′′. 1 of the bulge center; it was
this location that the two Lauer et al. papers adopted as the center of P2. Bender et al. (2005),
however, use P2 to denote the elongated and more diffuse concentration of older stars that extends
from the cluster on the side opposite from P1. In this schema, P1 and P2 explicitly correspond
to the apo- and peri-center apses of the Tremaine disk, which has a mean peri-center that is not
coincident with the cluster.
Page 5
– 5 –
1.3. A Closer Look. . .
Under the Bender et al. (2005) description of P3, the cluster is a disk comprising only a
few hundred A-stars. Given the scale length of the disk, we concluded that it should begin to
show resolution into discrete sources in images with slightly higher angular resolution than were
obtained by Lauer et al. (1998), such as could be provided by the HST ACS/HRC in the blue. The
photometry of the brighter sources might be obtained directly, but in any case, the full image of the
cluster could also be analyzed by surface-brightness fluctuation (SBF) analysis (Tonry & Schneider
1988) to constrain the P3 stellar population. If the cluster indeed comprises main sequence A stars,
it would look “lumpy” in HRC images. SBF could quantify the amplitude of the lumpiness, and in
turn the typical luminosity of the stars that the cluster comprises.
2. Obtaining the Highest Spatial Resolution Image of the Nucleus
We obtained images of the M31 nucleus under GO-program 10572, using the HST ACS High
Resolution Channel (HRC), which provided the best angular resolution available on the telescope.
Images were obtained in filters F330W (U330)5 and F435W (B) to best enhance the visibility of
the blue cluster against the contrast of the older, redder population of the larger surrounding
nucleus. Even the fine scale of the HRC (0 ′′. 028 × 0 ′′. 025) undersamples the point-spread function
(PSF) in the blue, however; we thus dithered the exposures in a 2 × 2 square pattern of 0.5 pixel
sub-steps (respecting the different angular sampling-pitches of the two CCD axes). In detail, the
B-band images were obtained in a single orbit comprising two dither-sets with a total of eight
298s exposures. The two sets were offset by 3.5 pixels to reject hot-pixels and other fixed defects.
The reduced flux and sensitivity of the camera in the U330-band required three orbits to obtain an
adequate signal. A complete dither set was obtained in each orbit for a total of 12 672s-exposures.
The three sets were offset from each other in an L-shaped pattern of 0 ′′. 125 steps, again to reject
CCD defects. The total peak signal levels per pixel are ∼ 3100 e in P3 and ∼ 1600 e in P1 for
the U330 image; and ∼ 8400 e in P3 and ∼ 7600 e in P1 for the B image.
The goal of the image reduction was to produce a single summed-image for each filter with
a 2× finer scale, sufficient to ensure Nyquist sampling. Because the images were obtained with
non-redundant pointings, the image construction was done in stages to eliminate cosmic ray events
and other defects. The sub-pixel dither-patterns were executed very precisely, thus each dither
set could be simply interlaced to produce an initial up-sampled image at the given pointing, with
the images within the set used to recognize and repair (with interpolation) cosmic-ray events by
comparing any one image to its three neighbors. The two B and three U330 interlaced images were
then combined into a single image for each filter. This initial estimate of a Nyquist-sampled image
5We have designated the F330W filter band-pass as ‘U330’ to avoid confusing it with the standard Johnson U-filter,
which has a significantly different passband. All magnitudes are on the Vega system, expect as noted.
Page 6
– 6 –
was then used in a repeat of the first reduction cycle to go back to and improve the initial detection
and repair of cosmic ray events (and fixed CCD defects) in the source images.
With the second cycle of defect repair completed, the source images could be then combined
more precisely to make a Nyquist-sampled image directly using the Fourier-method of Lauer (1999).
This procedure combines the images in the Fourier domain to algebraically remove the aliased power
present in the source images; significantly it handles departures from the optimal dither pattern
and combines the complete data set into the optimal average Nyquist-sampled image (in a least-
squares sense). Crucially, the Lauer (1999) method of image reconstruction is used in preference
to Drizzle (Fruchter & Hook 2002). The Fourier-method requires no parametric choices and avoids
the blurring inherent in Drizzle reconstructions.
The final reduction step for the U330 and B images was to reproject them to rectilinear sam-
pling, removing the inherent angular shear and the rectangular 0 ′′. 028× 0 ′′. 025 pixels present in the
native HRC image-sampling. This was done with reference to the the STScI field-distortion tables
for the HRC, which vary with filter. Sinc-function interpolation was used to compute the undis-
torted images. This is the only appropriate interpolation algorithm to use for Nyquist-sampled
images; it does not degrade the resolution in any way. The final pixel scale of the images was se-
lected to be 0 ′′. 0114, which is 1/4 of the WFPC2/PC pixel scale, to allow for convenient comparison
of the present HRC images to the V and I M31 nucleus images presented in Lauer et al. (1998).
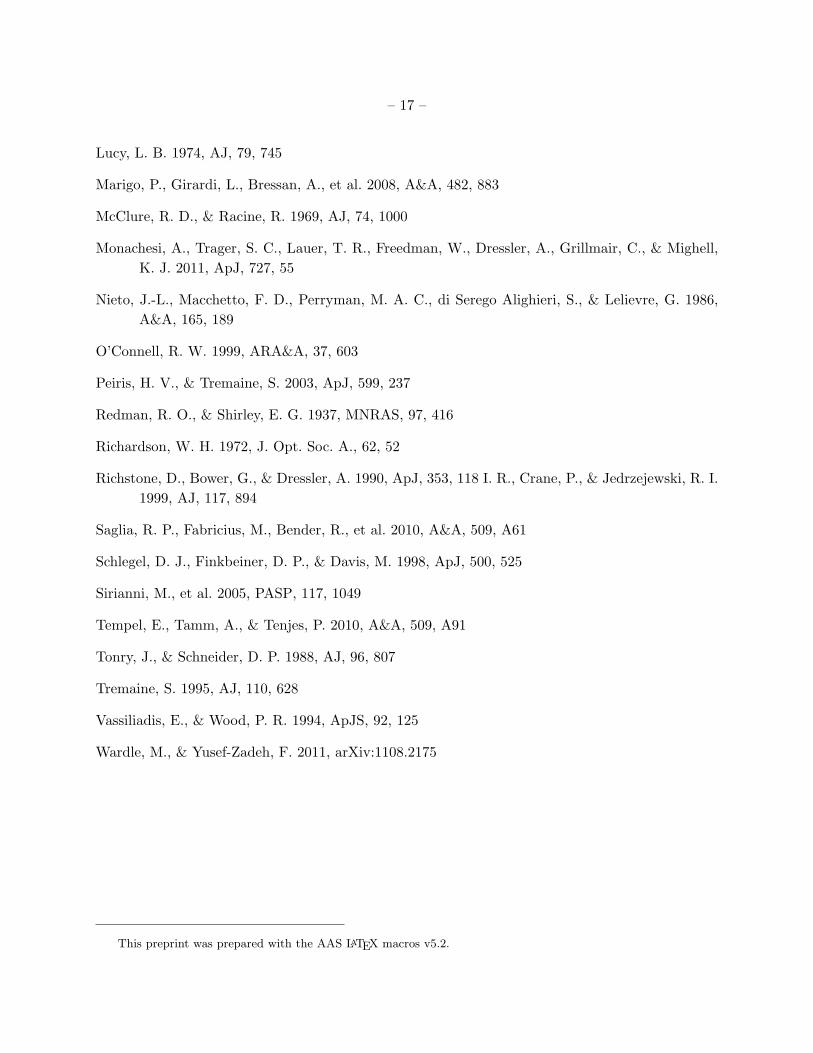
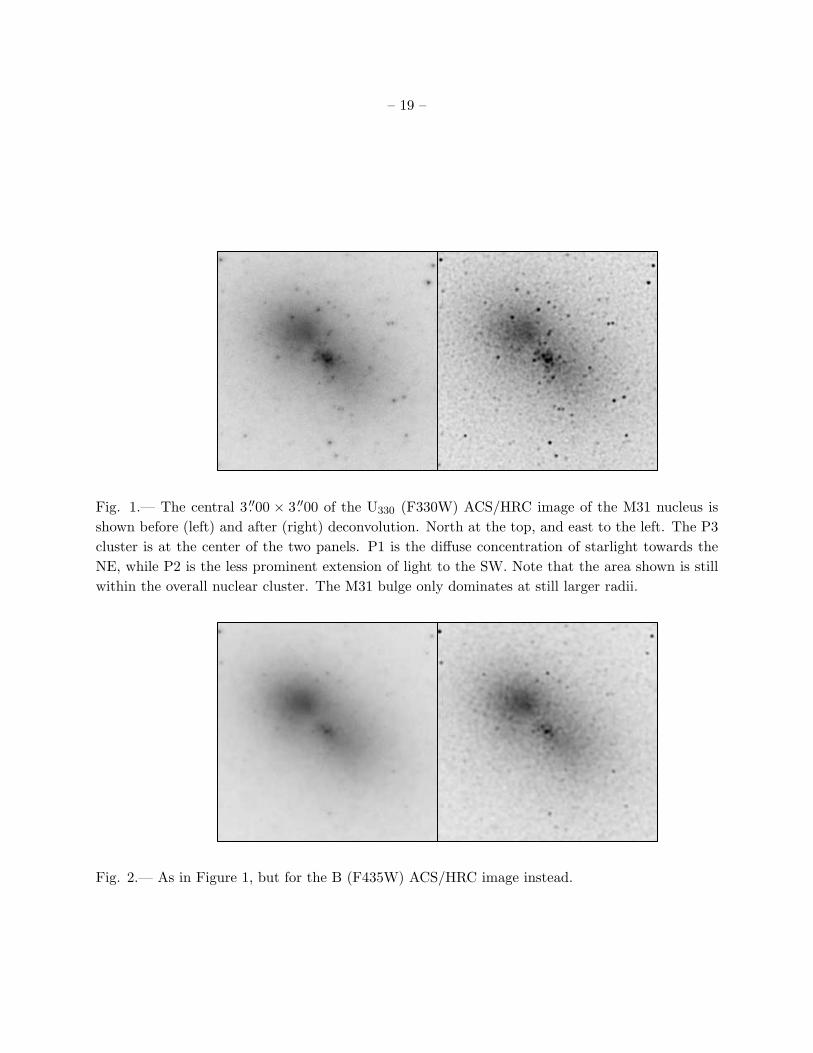
The Nyquist-sampled, rectified, and summed U330 and B images of the M31 nucleus are presented
in Figures 1 and 2.
The spatial resolution of the U330 images is 0 ′′. 039 FWHM, or 0.15 pc at M31, putting this
among the highest resolution images obtained by HST. As sharp as this PSF width is, however, it
is actually significantly broader than a purely diffraction-limited PSF at 330 nm, which has 0 ′′. 029
FWHM. This is due in part to the blurring associated with the HRC pixel-kernal; however, PSF
deconvolution can largely correct for this, as well removing the wings of the PSF, yielding nearly
diffraction-limited images at both U330 and B. Figures 1 and 2 also show the nuclear images after
40 iterations of Lucy-Richardson (Lucy 1974; Richardson 1972) deconvolution. The PSFs required
were generated from bright stars present in the outskirts of the images. Tests presented in Lauer
et al. (1998) show that this deconvolution procedure is well-suited to recovering the intrinsic light
distribution of the M31 nucleus. The final FWHM after deconvolution is 0 ′′. 030, which corresponds
to a physical resolution at M31 of 0.11 pc.
3. The Structure and Stellar Population of the Blue Cluster
The UV-bright P3 star-cluster clearly dominates the U330 image. The cluster has a clumpy
appearance in this filter, and further breaks up into apparently discrete sources in its outskirts
(about > 0 ′′. 05 from the center of the cluster). P3 is still bright in the B image; however, it appears
to be less clumpy and more concentrated. As we show below, the source that appears to define the
Page 7
– 7 –
center of P3 (S11 in Table 1) is somewhat redder than the surrounding cluster, while the discrete
sources in the cluster outskirts are especially blue. The center of P3 thus increases in relative
prominence going from the U330 to the B band-pass. The center of P3 also remains unresolved.
S11, and a secondary maximum (S07 in Table 1) only offset from it by 0 ′′. 05, are both extended
rather than stellar. Both sources likely comprise the blended light of several bright stars.
At large radii, both the U330 and B images show the presence of a number of hot stars dis-
tributed throughout the nucleus.6 This is the UV-bright stellar population observed by King et
al. (1995) and Brown et al. (1998), although these authors did not characterize sources within 1 ′′. 5
of the nucleus. The visual impression is that the hot stars outside of P3 appear to be weakly
concentrated about the cluster, but show no obvious correlation with the P1 or P2 concentrations
of the Tremaine disk.
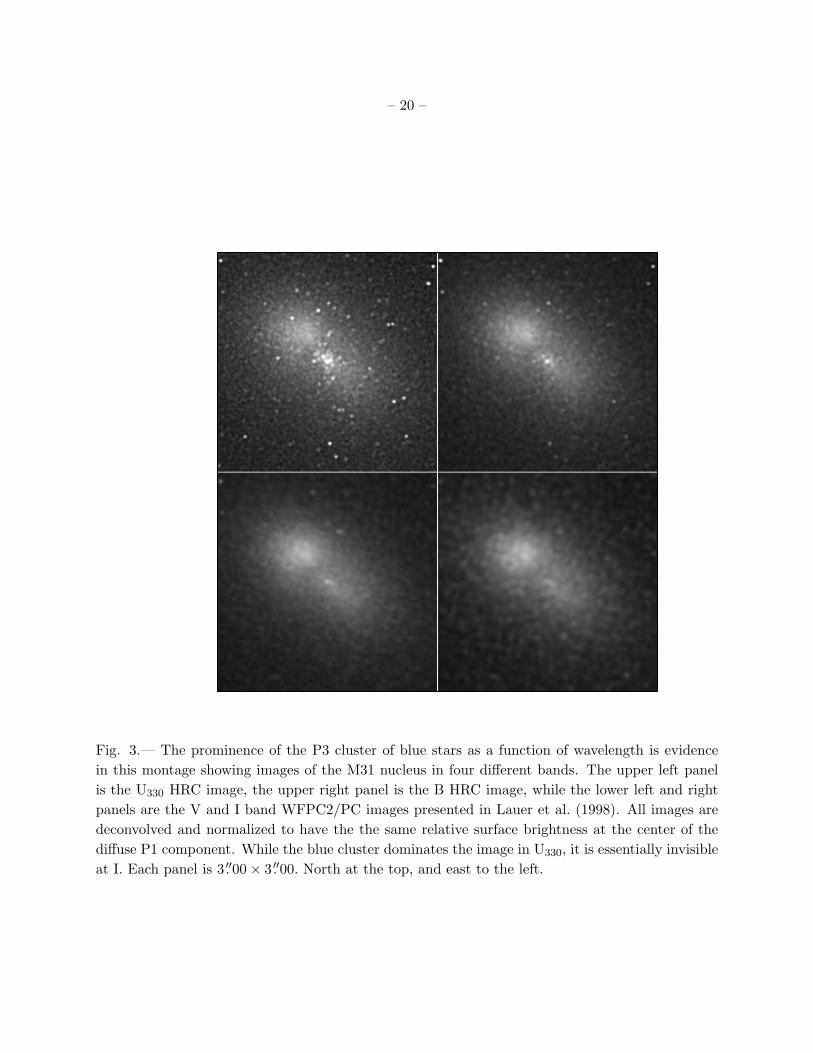
P3 is much less prominent at redder band-passes. It is essentially invisible at I-band, and shows
up only weakly in V-band, as can be seen in Figure 3, which compares the present HRC images
to the WFPC2/PC images presented in Lauer et al. (1998). For this comparison, all four images
were normalized to have the same surface brightness at the center of the diffuse P1 component.
The WFPC2/PC images had already been subsampled to a scale 2× finer than that of the native
PC-scale, and were readily shifted, interpolated, and rotated using sinc-function interpolation to a
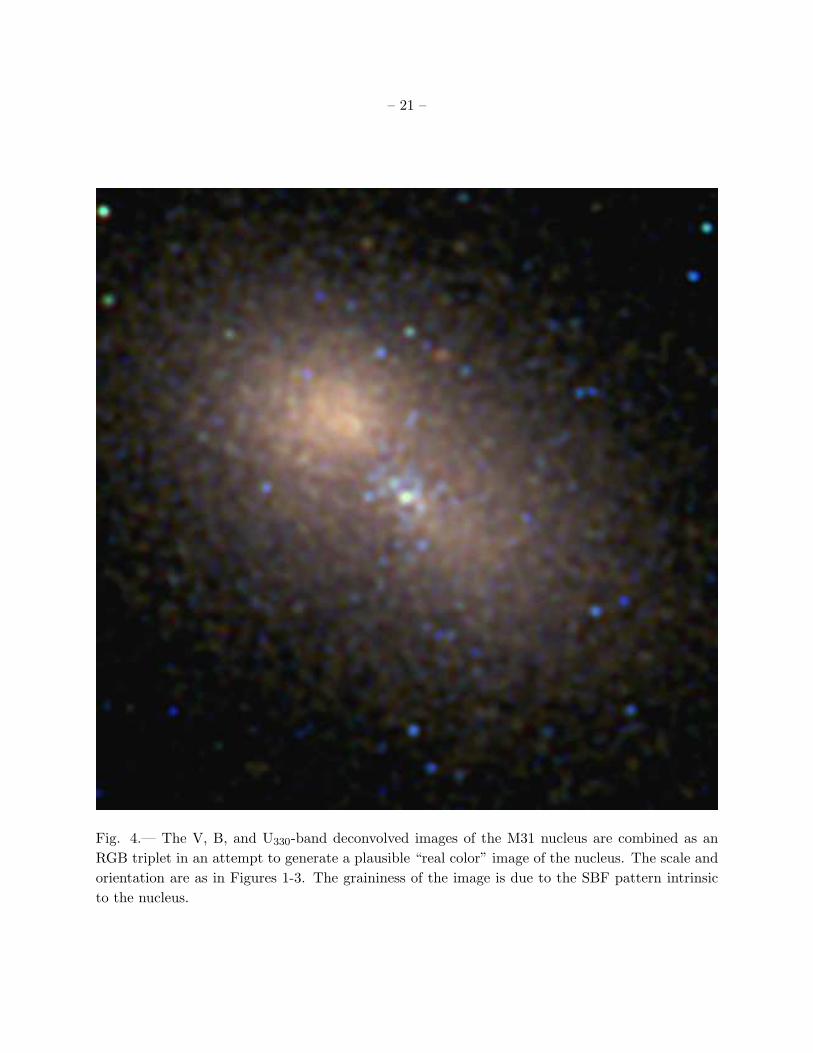
final scale 4× finer than the native PC scale. Figure 4 shows the U330, B, and V images combined
to make a representative color image. The reddish color of the Tremaine disk contrasts strongly
with the hot blue P3 population. In passing, we note that the grainy texture of P1, P2, and the
surrounding nucleus in the deconvolved images is due to strong intrinsic SBF. Close comparison of
the B and V images show them to have correlated SBF patterns, an impressive agreement, given
that the images were taken with different HST cameras, with differing PSFs and pixel scales. At
0 ′′. 03 angular resolution the image “noise” characteristics are dominated by the finite number of
stars making up the nuclear components, not the number of photons collected by the instruments.
The reduced visibility of P3 at V and I highlights the distinction between it and P2, under
the revised schema of Bender et al. (2005). P2, which would now be considered to be the stellar
emission associated with the peri-center portion of the Tremaine disk, is visible in the V and I
images as a highly elongated feature extending beyond P3 in the “anti-P1” direction. The centroid
of this emission is clearly displaced from P3. Figures 1 and 2 are shown as negative prints, while
Figure 3 is given a positive gray-scale to offer some diversity in representing the inner nucleus. The
negative gray scale in the first two figures, for example, appears to accentuate the diffuse toroidal
morphology of the Tremaine disk.
6As noted above, the nucleus dominates the center of M32 for r < 3′′. All the images shown in this paper are
limited to radii interior to the nucleus.
Page 8
– 8 –
3.1. Resolved Sources in the Central 1pc of P3
3.1.1. Isolation of P3 from the Surrounding Nucleus
To understand the properties of the P3 system we attempted to isolate it from the surrounding
nucleus. Since the cluster is much less prominent at V and B or U330, we used the V image as a
proxy for the “background” light distribution for both the B and U330 images. The correct scaling
required to subtract the background was somewhat problematic, given variations in color among
the different nuclear stellar populations. As shown in Lauer et al. (1998), P1 is significantly redder
than the outer nucleus, having ∆V − I = 0.07, with the portion of P2 outside P3 in the “anti-
P1” direction having an intermediate color. A simple hypothesis is that the Tremaine disk, which
comprises both P1 and P2, is redder than the outer portions of the nucleus. P2 appears to be
slightly bluer than P1, since it has lower contrast against the underlying nucleus.
The redder color of the Tremaine disk as compared to the surrounding nucleus means that there
is no simple scaling of the V to the U330 or B images that will yield a completely flat background
around P3. Scaling the V image to the outer nucleus in the U330 image over-subtracts the Tremaine
disk, leaving large negative residuals at P1, as well as somewhat reduced but still negative residuals
in the P2 region immediately surrounding P3. Conversely, scaling the two images by their P1
fluxes, leaves P3 in a significantly positive background. Our solution was to scale to the portion of
P2 immediately outside the apparent extent of the P3 cluster in the anti-P1 direction. This still
yields a positive background in the outer nucleus, and negative residuals in P1, but does produce
a low background surrounding P3. We also “clipped out” residual portion of P3 still present at V,
and slightly smoothed the image as well, to avoid biassing the measurement of the central fluxes of
P3 in U330 or B, or introducing artificial structure to either image.
3.1.2. Stellar Photometry of the P3 Sources
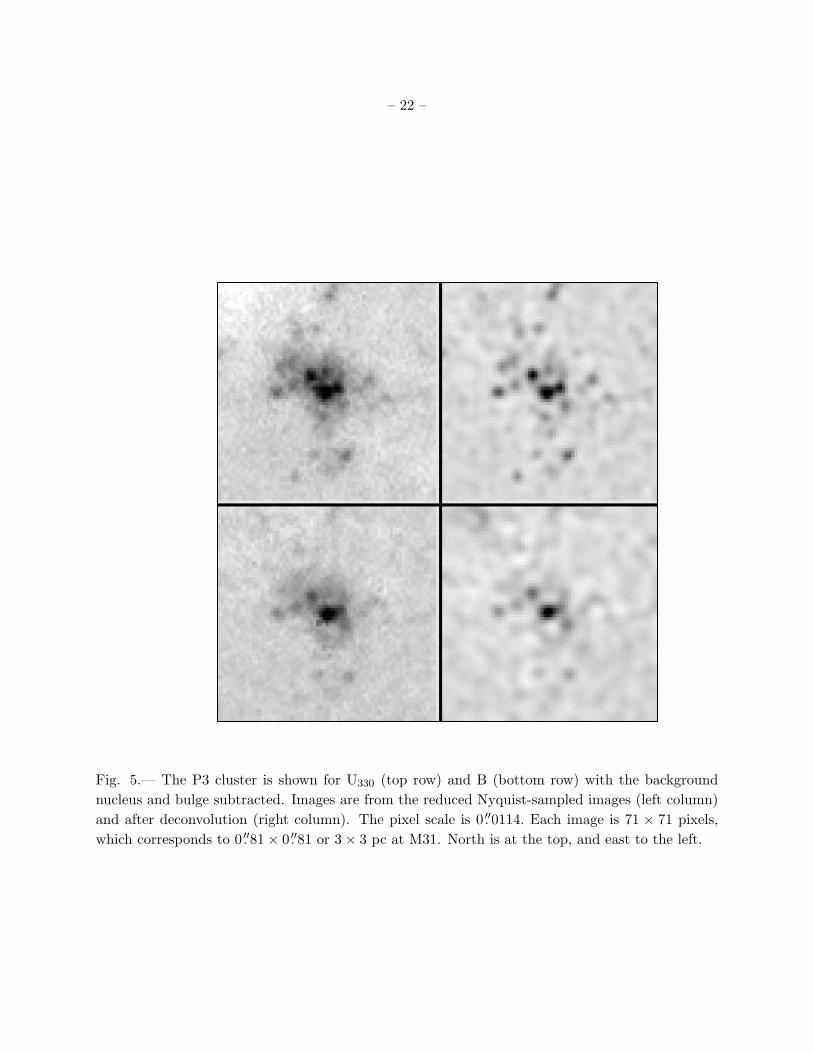
The isolated P3 cluster before and after deconvolution in the U330 and B filters is shown in
Figure 5. This figure zooms into the cluster, ratifying the visual impression stated at the start of
this section that the outskirts of the cluster breakup into individual point sources. The deconvolved
images show little diffuse emission outside the very center of the cluster. Close comparison of the
U330 and B images shows that the sources cover a range in color. There are a number of sources
that are readily visible in U330, but nearly invisible in B (which unfortunately give rise to large
errors in the formal U− B values measured). The bright source, S11, at the center of P3 is clearly
extended, as is S7, the source adjacent to it; however, to the degree of resolution afforded by these
observations, most of the other sources appear to be stellar.
Measuring the fluxes of the P3 sources is difficult with traditional PSF-fitting techniques,
given the high degree of crowding and the strongly variable background. Instead, we used a novel
procedure that measures stellar fluxes from aperture photometry on deconvolved images, which
Page 9
– 9 –
has been shown to work extremely well on Nyquist-sampled ACS/HRC images of M32 (Monachesi
et al. 2011). The methodology is to take the deconvolution of the U330 and B frames to 640
Lucy-Richardson iterations. This effectively transforms the observed PSF into a highly compact
“deconvolved PSF” that essentially concentrates all of its flux to within a radius of 0 ′′. 02. Aperture
photometry is done on the sources in the resulting image, once the background nucleus light is
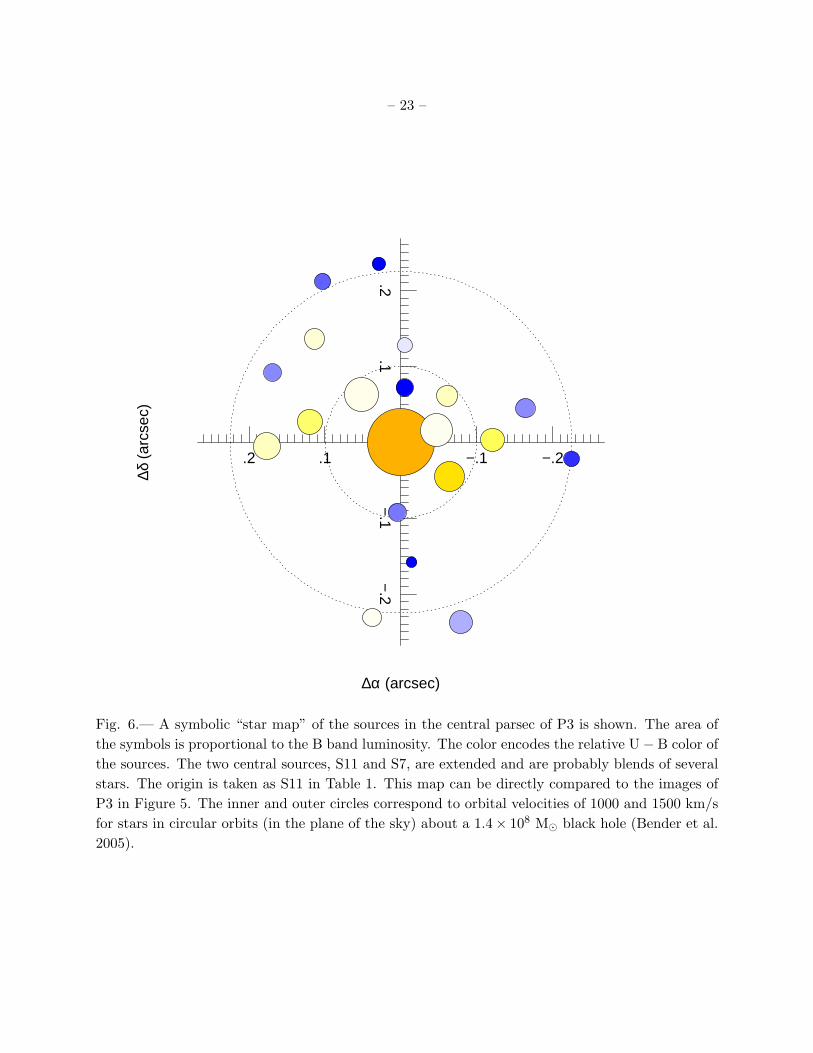
subtracted off. The resulting colors and magnitudes of the sources within 1 pc of P3 are mapped
in Figure 6 and listed in Table 1. A comparison of this figure to the images in Figure 5, ratifies the
impression that the bluer sources occur on the outskirts of the P3 cluster.
Interpreting the present photometry is complicated by the large color-terms required to bring
the F330W into concordance with the standard Johnson U band-pass. Based on the color equations
presented by Sirianni et al. (2005), for Johnson U− B < 0.2 we derive the transformation from the
F330W to U bandpass as
U−U330 = 0.116− 0.406(U− B) + 0.125(U− B)2. (1)
Fortunately, the difference between the HRC F435W filter and Johnson B only varies by a few
hundreds of a magnitude over the large F330W-F435W color range of the observations, and can be
directly taken as B, given the larger random errors in the photometry. The analogous transformation
for U− B > 0.2 is
U−U330 = 0.160− 0.104(U− B)− 0.093(U− B)2. (2)
As can be seen from the equations above, and the transformed values in Table 1, the implied
corrections are as large as ∼ 40% of the observed F330W − F435W colors. While Sirianni et al.
(2005) present calibrating observations over the needed range of U− B, the actual corrections will
depend on the unknown metalicities and atmospheric properties of the actual P3 stars.
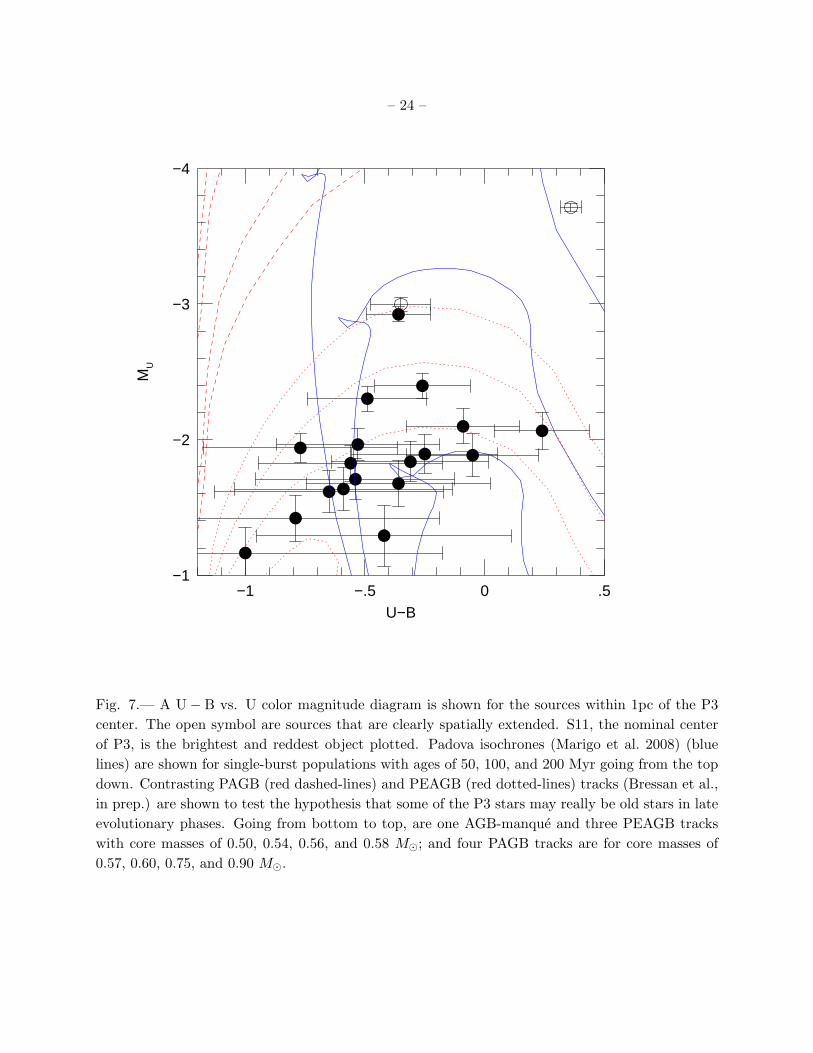
We plot the colors and absolute magnitudes of the P3 sources in Figure 7. We attempted to
correct for both foreground and M31 internal dust absorption. The galactic foreground extinction
provided by Schlegel et al. (1998) is AV = 0.206 mag, which given the reddening tables in Sirianni
et al. (2005) yields AB = 0.26 and AU330= 0.31 mag. A survey of the literature shows that
internal dust extinction in the M31 bulge is small (e.g. Tempel et al. 2010). Hui Dong (private
communication) estimates internal AV = 0.08 for the region of the bulge just outside the nucleus
based on stellar-population models of multi-color HST imagery. The implied total values are then
AB = 0.36 and AU330= 0.44 mag.
Figure 7 plots Padova (Marigo et al. 2008) isochrones (blue) for single-burst stellar populations
of 50, 100, and 200 Myr. It appears that most, if not all, of the sources are consistent with an age
of ∼ 100 − 200 Myr. We note that the brightest source in the cluster, S11 in Table 1, is also the
reddest source; it is extended as well. S11 is at the center of P3, and we have adopted it is the ad
hoc center of the system for the coordinates given in Table 1 and Figure 6.
At the same time, evolutionary tracks for some late evolutionary-phases of old stellar popula-
tions pass through the U and U− B domain occupied by the P3 stars, as well. These are all due to
Page 10
– 10 –
metal-rich giants that have evolved into “extreme horizontal branch” (EHB) stars and later move
back to the red as their core helium-burning phase is completed. Stars that populate the EHB have
lost a significant amount of their envelope on the RGB, though the mechanism causing the mass
loss is not precisely known (for a full review see Greggio & Renzini 1999; O’Connell 1999). These
stars do not have a large enough convective envelope to allow a full AGB phase. Instead, the hottest
of these EHB stars will fail to reach the AGB track at all, and evolve through the AGB-manque
channel. Cooler EHB stars will eventually leave the AGB track early and become Post Early-AGB
stars (PEAGB). These phases, collectively called hot post-horizontal branch (HP-HB) evolution,
have been previously found in M31 (e.g., King et al. 1995; Brown et al. 1998; Bertola et al. 1995).
Their surface density has recently been shown to increase towards the center of M31 (Rosenfield et
al., submitted) more rapidly than the underlying bulge surface brightness, although there appears
to be no enhancement associated with the overall nucleus, itself.
Figure 7 shows several examples of HP-HB tracks, such as H-burning Post-AGB (PAGB) tracks
of masses 0.57 < M⊙ < 0.90 (red, dashed) from Vassiliadis & Wood (1994) with Z = 0.016 and
Y = 0.25, and AGB-manque and PEAGB tracks (red, dotted) of masses 0.50 < M⊙ < 0.58. These
are from the most recent Padova stellar evolution library (Bressan et al., in prep.) with Z = 0.07 and
Y = 0.389 and an α-enhanced composition typical of elliptical galaxies (adapted from Bensby et al.
2010). Tracks were converted to Johnson filters following the color transformations of Marigo et al.
(2008). The metallicity of the Padova tracks was chosen as an extreme case to allow for high helium
content, ensuring high mass loss on the RGB. As these tracks are preliminary, other metallicity and
mass loss rate combinations could also produce HP-HB stars with similar luminosities and effective
temperatures.
Figure 7 shows that the canonical PAGB tracks are too bright and too hot to explain the P3
sources; however, a number of the P3 sources, especially the bluest and faintest ones, are consistent
with the PEAGB evolutionary tracks shown (and the brightest of the AGB-manque tracks, which is
the faintest track shown). Despite this concordance, however, we suggest that only a few of the P3
stars could be in the HP-HB phase, in contrast to being hot newly-formed stars. HP-HB evolution
across the U and U− B domain in Figure 7 is very rapid, occupying only ∼ 105 yr. The P3 stars
are highly concentrated, suggestive of a local population tightly bound to the black hole, but there
is no trace of the associated substantial population of giants required to generate and maintain a
short-lived UV-phase sufficient to account for the complete UV luminosity of P3.
3.2. Surface Brightness Fluctuation Analysis of the Cluster Population
A separate approach to characterizing the stellar population of P3 is to use “surface brightness
fluctuations” (SBF) as a diagnostic (Tonry & Schneider 1988). In this case we are effectively using
the “clumpiness” of P3 as an indicator of the typical luminosity of the stars that characterize the
variance in surface brightness. For a constant total luminosity of the P3 cluster, the variance about
a perfectly smooth distribution will steadily increase as we go from modelling it as the aggregate
Page 11
– 11 –
of a large number of intrinsically faint old stars to a small handful of high luminosity young stars.
The procedure for conducting an SBF analysis on P3 requires measuring the power spectrum
from the images of the cluster, and comparing it to the power spectra of models of the cluster.
Measurement of the observed power spectrum begins with subtracting a smooth model of the P3
light distribution (see §3.4), and then measuring the power spectrum of the residual image. Since
the SBF technique uses the shape of the PSF power-spectrum as a template, the analysis is done on
the background-subtracted image of P3 in the observed, as opposed to the deconvolved domain. In
detail, we restricted the analysis to a 0 ′′. 5 radius aperture centered on P3. We also only performed
the SBF analysis on the U330 image, given concerns about the accuracy of the technique in the B
image, which has a significantly reduced contribution from P3, but increased background variance
(which cannot be subtracted) from the underlying old-population of the nucleus. The “raw” power
spectrum of P3 includes a constant noise term that largely represents random photon shot-noise
in the image. We subtracted this off by measuring the power a spatial frequencies higher than the
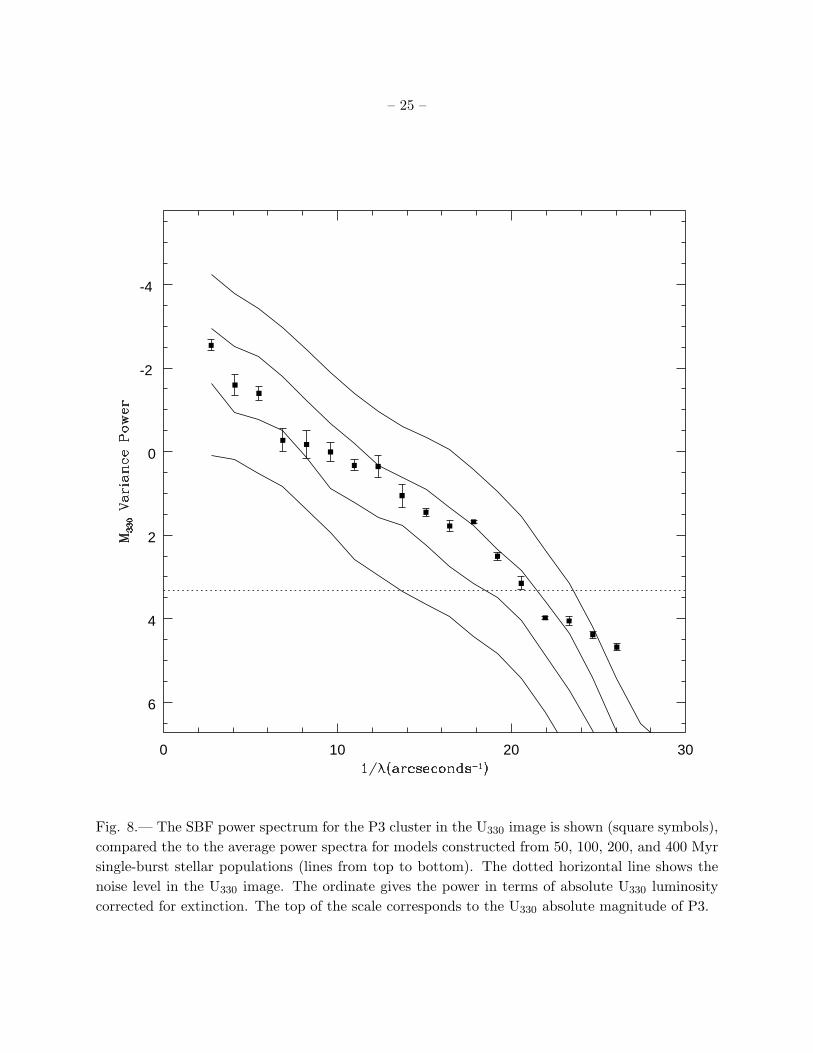
PSF Nyquist scale. We show the resulting power spectrum in Figure 8.
The simulated power spectra comes from models constructed for bursts of 50, 100, 200, and
400 Myr, drawing stars at random from the Padova (Marigo et al. 2008) isochrones transformed
to U330. The location of the stars was drawn at random from the smooth model of the P3 light
distribution until the total U330 luminosity of P3 was reached. The models were then analyzed
by the same procedure used for the real data. A few dozen models were generated for each burst
age to average out statistical fluctuations in the power spectra. The power spectra in Figure 8 are
plotted in terms of the implied absolute U330 magnitude of the flux. The intercept of the curves at
zero spatial-frequency gives the luminosity of the Tonry & Schneider (1988) L∗ parameter, which
characterizes the variance as due stars of that representative brightness. The limit of the vertical
scale is set by the luminosity of P3, itself.
The observed SBF power appears to fall between that of the 100 and 200 Myr bursts, which
is qualitatively ratified by the subjective appearance of the P3 models of the same age. This result
is thus in excellent agreement with the P3 CMD analysis presented in the previous section.
Some sample models for P3 are shown in Figure 9. The clumpiness of the models shown can
be seen to steadily decrease with increasing burst age. It is notable that the strong SBF pattern
completely dominates the appearance of the simulated clusters. Further, the location of either the
peak brightness, or light-weighted centroid of the entire cluster can be displaced significantly away
from the nominal center of the ideal smooth cluster model due to the large random fluctuations
in the structure. This is an important caveat to respect when evaluating the precise location of
the P3 cluster with respect to the M31 center of mass or the location of the M31 black hole (see
below). For the ensemble of 50 Myr models, the average location of the peak flux is offset from
the true cluster center by 0 ′′. 12, and the photo-center is displaced placed by 0 ′′. 05, with the typical
scatter from model to model being nearly as large as these mean values. For the 100 Myr models,
the two offsets decrease to 0 ′′. 06 and 0 ′′. 02; and 0 ′′. 03 and 0 ′′. 01 for the 200 Myr models.
Page 12
– 12 –
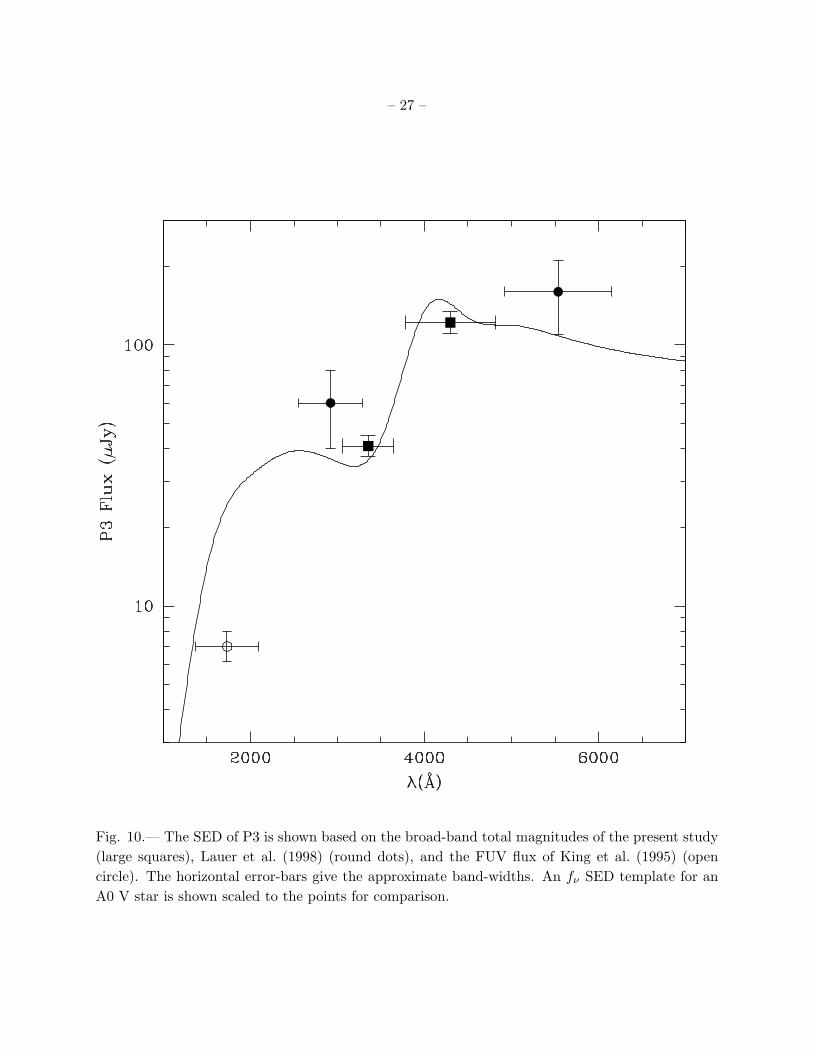
3.3. The Spectral Energy Distribution of P3
The total brightness of P3 was measured by aperture photometry performed on the difference
images. The apparent magnitudes of P3 are 20.3±0.1 (AB) or 19.1±0.1 (Vega) in U330, and 19.0±0.1
(AB) and 19.1±0.1 (Vega) in B, uncorrected for foreground extinction. Using the reddening values
stated earlier, the the corrected apparent fluxes are 42± 4 µJy in U330 and 125± 12 µJy in B. The
implied reddening-corrected colors are U330 − B = −0.1± 0.2 and B−V = 0.4± 0.3 (Vega), using
the mV measure from Lauer et al. (1998).
The implied spectral energy distribution (SED) of P3 is plotted in Figure 10, based on the FUV
175nm flux measured by King et al. (1995), the U330 and V fluxes measured by Lauer et al. (1998),
the present U330 and B values. We reduced the FUV measurement from 6.7 µJy to 5.6 µJy, for
consistency with the present reddening corrections. King et al. (1995) assumed A175 = 0.88, based
on the total E(B−V ) = 0.11 for M31 measured by McClure & Racine (1969). Our E(B−V ) = 0.086
value implies A175 = 0.69, instead. An fν SED of an A0 main sequence star scaled to the flux-points
is shown for comparison. As noted in Lauer et al. (1998), and shown spectroscopically by Bender
et al. (2005), the SED of P3 is indeed “A-like.” The FUV point does fall well below the template,
but this portion of the SED is highly sensitive to temperature, and the FUV point could be fitted
with a modest adjustment of the template; this point will also be the most sensitive to the correct
value of the extinction.
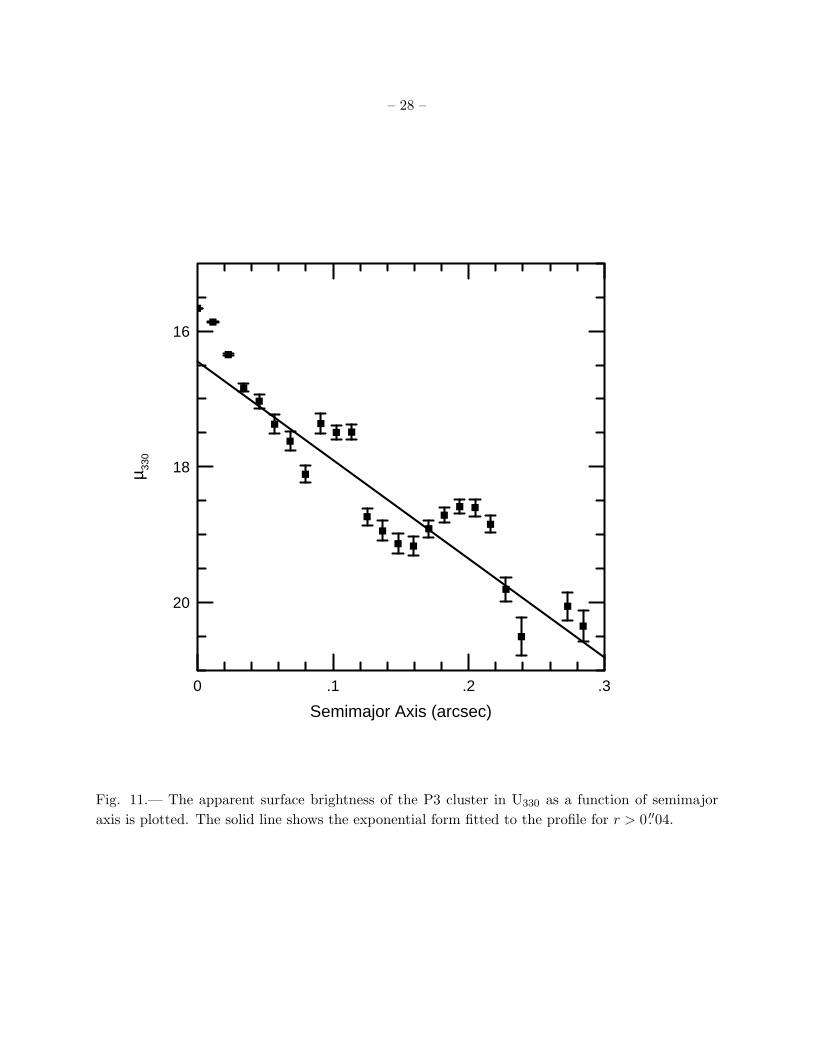
3.4. The Surface Brightness Profile of P3
The over all distribution of light within the P3 cluster is confirmed to roughly follow the
exponential light distribution derived by Bender et al. (2005). A U330-band surface brightness
profile of P3 is shown in Figure 11, with the exponential model shown as a solid line. S11 was
taken as the center of the cluster, but the fit excludes points with r < 0 ′′. 04, given that the inner-
most points will still be affected by the residual PSF associated with the deconvolution. The
exponential form recovered is
µ330(a) = (13.4± 1.7) a + 16.45± 0.32, (3)
where a is the semimajor axis in arcseconds, and µ330 is the surface brightness (magnitudes/sq.
arcsec) observed with the F330W Vega-based zeropoint (no reddening correction has been applied).
The implied exponential scale-length is 0 ′′. 075± 0 ′′. 010, which is marginally more compact than the
0 ′′. 1 ± 0 ′′. 01 value derived by Bender et al. (2005). The average ellipticity of the isophotes is
0.33± 0.03, which implies an inclination of 48◦± 5◦, if P3 is interpreted to be a disk, again in good
agreement with the 55◦ ± 2◦ of Bender et al. (2005).
Although S11 was excluded from the fit, given concerns about the residual deconvolved-PSF,
ironically the brightness profile of S11 actually rises about the exponential model. The core radius
of S11 is < 0 ′′. 024 or < 0.09 pc. If we estimate the implied volume light density of S11 from
Page 13
– 13 –
ρL = I0/(2rC), where I0 is the central surface brightness (< 15.53 in U, corrected for extinction),
then at S11 we estimate ρL > 3× 10⁵ L⊙ pc−3 in the U-band.
3.5. The Location of the M31 Black Hole
The present work provides no new dynamical information about the M31 black hole, and
cannot offer any objective improvement on the conclusion of Kormendy & Bender (1999) or Bender
et al. (2005) that the black hole must be close to the center of P3. At the same time, we advance
subjective arguments that the location of the black hole may be coincident with S11 (see Table 1).
The central location of this source is suggestive. While we showed in §3.2 that simulated models
of the cluster often have the brightest clump of stars to be significantly offset from the true center
of the cluster (which is where we would expect the black hole to be). However, while we do not
know the “true” center of P3, case, the location of S11 and the photo-center of P3 at least agree to
within 0 ′′. 02. S11 is also extended and significantly redder than the other sources, underscoring its
unique properties among the other sources. Its red color indeed makes it the only source to mark
the location of P3 in the V-band. A truly extended source should not exist within the strong tidal
field of the black hole, unless it represents the peak of a cusp made of the stars most closely bound
to it. At the same time, it’s possible that the structure of S11 is only due to a random fluctuation
of stars along the line-of-sight. S07, is also extended, is offset from the center of P3, but otherwise
has no special attributes.
4. Discussion, Summary, and Conclusion
We began the paper with a history of earlier work on P3, which already built a strong case
that it is a cluster of young stars. We have now partially resolved the cluster into individual stars,
and characterized its form with significantly higher spatial resolution than was provided by the
WFPC2/PC observations of Lauer et al. (1998); however, in broad detail the conclusions of that
paper, and the later work of Bender et al. (2005) remain unaltered. Both a color-magnitude diagram
(CMD) obtained of the resolved stars, and an SBF analysis performed on the total image, show
that P3 plausibly comprises a population formed in a burst 100 to 200 Myr ago, consistent with
the P3 SED and the spectrum obtained by Bender et al. (2005). The result may also be supported
by the Saglia et al. (2010) spectroscopy observation of the inner bulge, which suggest that a burst
of star formation occurred within the nucleus about ∼ 100 Myr ago.
One small modification of the earlier results provided by the present work is that that P3 may
be slightly younger than the 200 Myr age derived by Bender et al. (2005), but that work really
only ruled out an age much younger than 100 Myr. Another new result is that the color of S11
suggests that a single-age starburst model for the cluster does not capture the full story of P3. At
some level, the large luminosity of P3 blends with the much bluer stars around it to generate an
Page 14
– 14 –
overall A-like SED. It is intriguing that S11 provides the only visible trace of P3 in the V-band. If
it does mark the location of the M31 black hole, then it suggests that there may yet be another
change in the stellar population of the nucleus within ∼ 0 ′′. 03 or ∼ 0.1 pc of the black hole.
Although we have concluded that the P3 stars are young, King et al. (1995) and Brown et al.
(1998) argue that the UV-bright stars in the bulge of M31, which of course surrounds the nucleus,
represent the final stages of stellar evolution in an old metal-rich stellar population. If there are
truly two different populations contributing UV-bright stars to the bulge and nucleus of M31, it
still begs the question of whether or not old remnants may be present in P3, as well as how far
out the putative young stars in P3 may be traced out into the surrounding nucleus or even bulge.
We show that PEAGB tracks traverse the U vs. U− B domain defined by the P3 stars, thus it is
possible that a few of the P3 stars are indeed old-evolved stars, rather than being young massive
main sequence stars. However, since this is a very rapid evolutionary phase, it is extremely unlikely
that the entire P3 cluster could be accounted for by PEAGB stars.
A strong factor in constraining the population of P3 is the compactness of P3, itself. The
UV-stars outside the nucleus do trace the bulge-light at long wavelengths, but yet are not strongly
concentrated within the outer nucleus; their abundance by total light or number is but a small
faction of the bulge. Requiring any sort of HP-HB stars as the dominant P3 population requires an
associated massive population of red giants also closely bound to the M31 black hole to continually
generate the short-lived PEAGB stars. There is no evidence for such a population in the V and I
nuclear images of Lauer et al. (1998).
This same consideration would appear to also apply to the hypothesis of Demarque & Virani
(2007), who suggest that the P3 UV-bright stars may be the remnant cores of giants stripped by
close encounters with the black hole. The high velocities associated with the black hole are such
that stars passing close to the black hole from the bulge, or even the outer nucleus will not dwell
in the vicinity of P3. If the P3 stars are really processed giants, they still must have been initially
closely bound to the black hole, which again begs the question of where the progenitor giants are.
The only way that this mechanism might work is if the stripping of the P3 stars takes place just
as they begin their first ascent up the red giant branch. This might produce long-lived UV-bright
stripped-cores, and would account for lack of progenitor giants as well.
Further investigation of the origin of P3 might be linked to understanding the early-type stars
closely bound to the black hole in our own galaxy. The existence of P3 in a second Local Group
galaxy suggests that this is not a rare phenomenon. The present observations offer an additional
site to test mechanisms that can form stars within the strong tidal field of a supermassive black
hole. We finish by noting that as with the galactic center, it may be possible to measure the proper
motions of stars closely bound to the M31 black hole. Figure 6 shows that circular velocities in the
plane of the sky around the M31 black hole will exceed 1000 km s−1 over the entire extent of P3.
It is possible that proper motions may be detected in about a decade after the present observations
were made.
Page 15
– 15 –
We thank Karl Gebhardt, Scott Tremaine, and Pierre Demarque for useful conversations. We
thank Alessandro Bressan and Leo Girardi for advance use of preliminary Padova stellar evolution
tracks. Pete Merenfeld (NOAO) kindly prepared the three-color image of the nucleus.
Page 16
– 16 –
REFERENCES
Alexander, T. 2006, Journal of Physics Conference Series, 54, 243
Allen, D. A., Hyland, A. R., & Hillier, D. J. 1990, MNRAS, 244, 706
Bender, R., et al. 2005, ApJ, 631, 280
Bensby, T., Feltzing, S., Johnson, J. A., et al. 2010, A&A, 512, A41
Bertola, F., Bressan, A., Burstein, D., Buson, L. M., Chiosi, C., & di Serego Alighieri, S. 1995,
ApJ, 438, 680
Brown, T. M., Ferguson, H. C., Stanford, S. A., & Deharveng, J.-M. 1998, ApJ, 504, 113
Chang, P., Murray-Clay, R., Chiang, E., & Quataert, E. 2007, ApJ, 668, 236
Crane, P. C., Dickel, J. R., & Cowan, J. J. 1992, ApJ, 390, L9
Demarque, P., & Virani, S. 2007, A&A, 461, 651
Dressler, A. 1984, ApJ, 286, 97
Dressler, A., & Richstone, D. O. 1988, ApJ, 324, 701
Forrest, W. J., Shure, M. A., Pipher, J. L., & Woodward, C. E. 1987, The Galactic Center, 155,
153
Freedman, W. L., & Madore, B. F. 1990, ApJ, 365, 186
Fruchter, A. S., & Hook, R. N. 2002, PASP, 114, 144
Greggio, L., & Renzini, A. 1999, Mem. Soc. Astron. Italiana, 70, 691
King, I. R., Stanford, S. A., & Crane, P. 1995, AJ, 109, 164
King, I. R., et al. 1992, ApJ, 397, L35
Kormendy, J. 1988, ApJ, 325, 128
Kormendy, J. & Bender, R. 1999, ApJ, 522, 772
Krabbe, A., et al. 1995, ApJ, 447, L95
Lauer, T. R. 1999, PASP, 111, 227
Lauer, T. R., Faber, S. M., Ajhar, E. A., Grillmair, C. J., & Scowen, P. A. 1998, AJ, 116, 2263
Lauer, T. R. et al. 1993, AJ, 106, 1436
Page 17
– 17 –
Lucy, L. B. 1974, AJ, 79, 745
Marigo, P., Girardi, L., Bressan, A., et al. 2008, A&A, 482, 883
McClure, R. D., & Racine, R. 1969, AJ, 74, 1000
Monachesi, A., Trager, S. C., Lauer, T. R., Freedman, W., Dressler, A., Grillmair, C., & Mighell,
K. J. 2011, ApJ, 727, 55
Nieto, J.-L., Macchetto, F. D., Perryman, M. A. C., di Serego Alighieri, S., & Lelievre, G. 1986,
A&A, 165, 189
O’Connell, R. W. 1999, ARA&A, 37, 603
Peiris, H. V., & Tremaine, S. 2003, ApJ, 599, 237
Redman, R. O., & Shirley, E. G. 1937, MNRAS, 97, 416
Richardson, W. H. 1972, J. Opt. Soc. A., 62, 52
Richstone, D., Bower, G., & Dressler, A. 1990, ApJ, 353, 118 I. R., Crane, P., & Jedrzejewski, R. I.
1999, AJ, 117, 894
Saglia, R. P., Fabricius, M., Bender, R., et al. 2010, A&A, 509, A61
Schlegel, D. J., Finkbeiner, D. P., & Davis, M. 1998, ApJ, 500, 525
Sirianni, M., et al. 2005, PASP, 117, 1049
Tempel, E., Tamm, A., & Tenjes, P. 2010, A&A, 509, A91
Tonry, J., & Schneider, D. P. 1988, AJ, 96, 807
Tremaine, S. 1995, AJ, 110, 628
Vassiliadis, E., & Wood, P. R. 1994, ApJS, 92, 125
Wardle, M., & Yusef-Zadeh, F. 2011, arXiv:1108.2175
This preprint was prepared with the AAS LATEX macros v5.2.
Page 18
– 18 –
Table 1. Sources in the Central Parsec of M31
∆α ∆δ
N (arcsec) (arcsec) m330 M330 m330 −m435 MU U− B
S01 −0.225 −0.022 22.82± 0.15 −2.05 −1.10± 0.48 −1.61 −0.65
S02 −0.164 0.045 22.54± 0.12 −2.33 −0.93± 0.34 −1.96 −0.53
S03 −0.121 0.003 22.85± 0.16 −2.02 −0.20± 0.28 −1.88 −0.05
S04 −0.079 −0.237 22.22± 0.09 −2.65 −0.86± 0.25 −2.30 −0.49
S05 −0.064 −0.045 22.68± 0.14 −2.19 0.14± 0.20 −2.06 0.24
S06 −0.061 0.061 22.75± 0.14 −2.12 −0.50± 0.30 −1.89 −0.25
S07 −0.047 0.016 21.67± 0.06 −3.20 −0.66± 0.13 −2.92 −0.36
S08 −0.014 −0.158 23.06± 0.19 −1.81 −1.67± 0.82 −1.16 −1.00
S09 −0.005 0.072 22.43± 0.11 −2.44 −1.29± 0.40 −1.94 −0.77
S10 −0.005 0.128 23.27± 0.23 −1.60 −0.74± 0.53 −1.29 −0.42
S11 0.000 0.000 21.05± 0.03 −3.82 0.27± 0.04 −3.71 0.36
S12 0.005 −0.092 22.66± 0.13 −2.21 −0.96± 0.38 −1.82 −0.56
S13 0.029 0.235 22.93± 0.17 −1.94 −1.32± 0.60 −1.42 −0.79
S14 0.038 −0.231 22.92± 0.17 −1.95 −0.66± 0.39 −1.68 −0.36
S15 0.052 0.063 21.60± 0.05 −3.27 −0.64± 0.12 −3.00 −0.35
S16 0.103 0.212 22.84± 0.16 −2.03 −1.01± 0.46 −1.64 −0.59
S17 0.114 0.136 22.78± 0.15 −2.09 −0.58± 0.33 −1.84 −0.31
S18 0.120 0.027 22.62± 0.13 −2.25 −0.27± 0.24 −2.10 −0.09
S19 0.169 0.092 22.79± 0.15 −2.08 −0.93± 0.42 −1.71 −0.54
S20 0.177 −0.005 22.24± 0.09 −2.63 −0.51± 0.20 −2.40 −0.26
Note. — The m330 values are not corrected for galactic extinction, while all
values in the subsequent columns are corrected assuming AU = 0.44 mag, and
AB = 0.36 mag. Standard Johnson U and B values are derived using the color
transformations in Sirianni et al. (2005). The distance to M31 is assumed to be
770 kpc (Freedman & Madore 1990). S07 and S11 are extended and are probably
blends of several stars. S11 is hypothesized to be the location of the M31 black
hole.
Page 19
– 19 –
Fig. 1.— The central 3 ′′. 00 × 3 ′′. 00 of the U330 (F330W) ACS/HRC image of the M31 nucleus is
shown before (left) and after (right) deconvolution. North at the top, and east to the left. The P3
cluster is at the center of the two panels. P1 is the diffuse concentration of starlight towards the
NE, while P2 is the less prominent extension of light to the SW. Note that the area shown is still
within the overall nuclear cluster. The M31 bulge only dominates at still larger radii.
Fig. 2.— As in Figure 1, but for the B (F435W) ACS/HRC image instead.
Page 20
– 20 –
Fig. 3.— The prominence of the P3 cluster of blue stars as a function of wavelength is evidence
in this montage showing images of the M31 nucleus in four different bands. The upper left panel
is the U330 HRC image, the upper right panel is the B HRC image, while the lower left and right
panels are the V and I band WFPC2/PC images presented in Lauer et al. (1998). All images are
deconvolved and normalized to have the the same relative surface brightness at the center of the
diffuse P1 component. While the blue cluster dominates the image in U330, it is essentially invisible
at I. Each panel is 3 ′′. 00× 3 ′′. 00. North at the top, and east to the left.
Page 21
– 21 –
Fig. 4.— The V, B, and U330-band deconvolved images of the M31 nucleus are combined as an
RGB triplet in an attempt to generate a plausible “real color” image of the nucleus. The scale and
orientation are as in Figures 1-3. The graininess of the image is due to the SBF pattern intrinsic
to the nucleus.
Page 22
– 22 –
Fig. 5.— The P3 cluster is shown for U330 (top row) and B (bottom row) with the background
nucleus and bulge subtracted. Images are from the reduced Nyquist-sampled images (left column)
and after deconvolution (right column). The pixel scale is 0 ′′. 0114. Each image is 71 × 71 pixels,
which corresponds to 0 ′′. 81× 0 ′′. 81 or 3× 3 pc at M31. North is at the top, and east to the left.
Page 23
– 23 –
.2 .1 0 −.1 −.2
.2.1
0−
.1−
.2
∆α (arcsec)
∆δ (
arcs
ec)
Fig. 6.— A symbolic “star map” of the sources in the central parsec of P3 is shown. The area of
the symbols is proportional to the B band luminosity. The color encodes the relative U− B color of
the sources. The two central sources, S11 and S7, are extended and are probably blends of several
stars. The origin is taken as S11 in Table 1. This map can be directly compared to the images of
P3 in Figure 5. The inner and outer circles correspond to orbital velocities of 1000 and 1500 km/s
for stars in circular orbits (in the plane of the sky) about a 1.4× 10⁸ M⊙ black hole (Bender et al.
2005).
Page 24
– 24 –
−1 −.5 0 .5−1
−2
−3
−4
U−B
MU
Fig. 7.— A U− B vs. U color magnitude diagram is shown for the sources within 1pc of the P3
center. The open symbol are sources that are clearly spatially extended. S11, the nominal center
of P3, is the brightest and reddest object plotted. Padova isochrones (Marigo et al. 2008) (blue
lines) are shown for single-burst populations with ages of 50, 100, and 200 Myr going from the top
down. Contrasting PAGB (red dashed-lines) and PEAGB (red dotted-lines) tracks (Bressan et al.,
in prep.) are shown to test the hypothesis that some of the P3 stars may really be old stars in late
evolutionary phases. Going from bottom to top, are one AGB-manque and three PEAGB tracks
with core masses of 0.50, 0.54, 0.56, and 0.58 M⊙; and four PAGB tracks are for core masses of
0.57, 0.60, 0.75, and 0.90 M⊙.
Page 25
– 25 –
0 10 20 30
6
4
2
0
-2
-4
Fig. 8.— The SBF power spectrum for the P3 cluster in the U330 image is shown (square symbols),
compared the to the average power spectra for models constructed from 50, 100, 200, and 400 Myr
single-burst stellar populations (lines from top to bottom). The dotted horizontal line shows the
noise level in the U330 image. The ordinate gives the power in terms of absolute U330 luminosity
corrected for extinction. The top of the scale corresponds to the U330 absolute magnitude of P3.
Page 26
– 26 –
Fig. 9.—Models of the P3 cluster based on the smooth light distribution derived in §3.4 and random
samples of stars drawn from the Padova isochrones (Marigo et al. 2008) for bursts of 50 Myr (top
row), 100 Myr (middle), and 200 Myr (bottom). Each row shows three different realizations for
the given burst age. The scale and image size are the same as in Figure 5.
Page 27
– 27 –
Fig. 10.— The SED of P3 is shown based on the broad-band total magnitudes of the present study
(large squares), Lauer et al. (1998) (round dots), and the FUV flux of King et al. (1995) (open
circle). The horizontal error-bars give the approximate band-widths. An fν SED template for an
A0 V star is shown scaled to the points for comparison.
Page 28
– 28 –
0 .1 .2 .3
20
18
16
Semimajor Axis (arcsec)
µ 330
Fig. 11.— The apparent surface brightness of the P3 cluster in U330 as a function of semimajor
axis is plotted. The solid line shows the exponential form fitted to the profile for r > 0 ′′. 04.


![arXiv:1407.2259v1 [astro-ph.SR] 8 Jul 2014 · 2018-08-29 · arXiv:1407.2259v1 [astro-ph.SR] 8 Jul 2014 Luminous and Variable Stars in M31 and M33. II. Luminous Blue Variables, Candidate](https://static.documents.pub/doc/80x56/5f4ec805c7590f474b228367/arxiv14072259v1-astro-phsr-8-jul-2014-2018-08-29-arxiv14072259v1-astro-phsr.jpg)


![Drilling through the M31 Halo near Mayall-II/G1€¦ · [Fe/H] = −1.54, −1.34, −0.95, −0.56, −0.37 (mean abundance of G1 and ±1σ, ±1.5σ) MW stars M31 stars Distribution](https://static.documents.pub/doc/80x56/60183546e727e955876bc63f/drilling-through-the-m31-halo-near-mayall-iig1-feh-a154-a134-a095.jpg)

