THE COCA-COLA COMPANY FINANCIAL REPORTING AND ANALYSIS PROFESSOR CLARK M. WHEATLEY GROUP 7 BLUE COHORT NOUF AL-FRAIH IVAN CABALLERO VARUN DAHL JEFFREY GHITMAN NITHYA HARIHARAN JANUARY 25, 2010
Transcript
THE COCA-COLA COMPANY
FINANCIAL REPORTING AND ANALYSIS
PROFESSOR CLARK M. WHEATLEY
GROUP 7 BLUE COHORT NOUF AL-FRAIH
IVAN CABALLERO VARUN DAHL
JEFFREY GHITMAN NITHYA HARIHARAN
JANUARY 25, 2010
EXECUTIVE SUMMARY
The Coca-Cola Company is internationally known for its excellence within the beverage business. It
is an industry titan that has maintained market dominance for the better part of a century through
innovation, acquisitions and process design. Although most companies do not have the stable resources
of the Coca-Cola Company to pursue their endeavors, Coca-Cola must continue to remain flexible and
agile as it seeks to expand both its global market share and profitability levels.
1. OVERALL RECOMMENDATION
We found that The Coca-Cola Company is undervalued at the current stock market price as well as
per Dec 31, 2008 figures, and is thus rate the stock as a BUY. We value the shares using several methods
and then average them, yielding the midpoint of our estimated fair value rate, EFVR (the range within
which we view thestock as fairly valued). Using the DCF valuation model we took the average between our
optimistic, pessimistic and expected stock price values and averaged them with the mean of the DAE
model's comparable values. Given this overall perspective, we believe that a fair market price of USD 69 is
what the Coca-Cola Company should be valued at.
2. SUMMARY RATIONAL FOR RECOMMENDATION
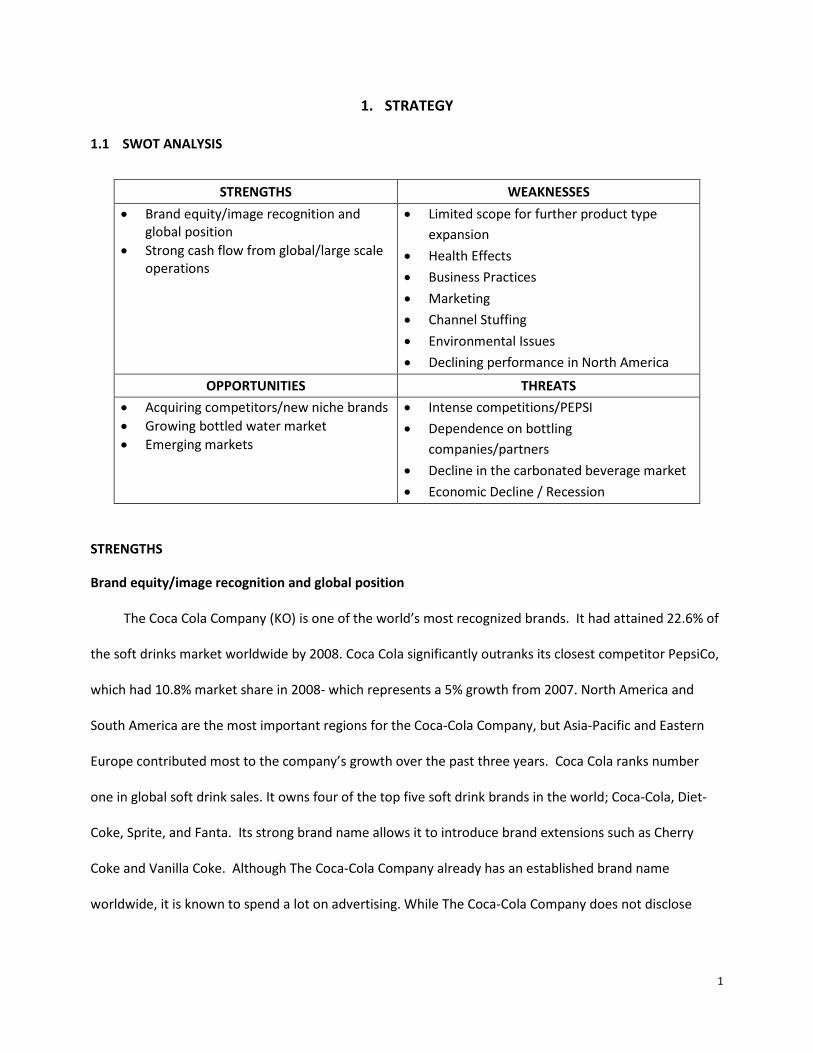
The project begins by conducting an in-depth SWOT analysis to better comprehend Coca-Cola’s
strengths and weaknesses within the company itself and within the industry as a whole. While Coca-Cola
has strong brand equity throughout the world and a strong cash flow due to its operations, it faces some
adversity when it comes to product expansion, along with consumers’ changing demands, which could
affect sales of its carbonated beverages. Furthermore, the company has at times been scrutinized for its
advertising and business practices, with some critics claiming that Coca-Cola does not have any concern
for the best interest of its consumers. However, there are numerous opportunities that the company has
in its sight, such as continuing to create and grow niche products within its markets, or taking advantage
of the growing popularity of bottled water. There are also emerging markets within previously and
relatively untapped areas, such as Latin America, where the increase in the quality of living is allowing for
families to purchase more luxury goods. Coca-Cola needs to continue to keep the state of the economy
and the current recession in mind when planning its next steps.
In assessing the corporate culture of a company as complex as Coca-Cola, we discovered that
becoming invested in the well being of its employees as well as its consumers was something that this
company held in high regard. Coca-Cola has encouraged its employees to give back to its communities by
participating in various efforts. In addition, Coca-Cola focuses on creating a lifestyle that its consumers
could adhere to and live by through the use of its product. The company encourages its consumers to live
on the “Coke side of life”, which has been heavily marketed and supported through various initiatives.
When we conducted an accounting analysis of the company’s assets, it was apparent that Coca-
Cola adhered strictly to the GAAP standards. Despite the economic downturn last year the company has
maintained a positive return on assets and positive return on equity. This supports that the company is
able to do well even in poor economic conditions.
Next, we conducted a financial analysis of the industry and were pleased to discover that Coca-Cola
has remained the top player in the industry as the number one beverage company with a sizable margin
of market share in comparison to its main competitor PepsiCo. This speaks volumes because it displays
the impact that this company has within the market. Furthermore, Coca-Cola’s returns on sales and price
to earnings ratios have remained higher than any other competitor in the market.
3. SPECIFIC CONSIDERATIONS
When forecasting the company’s value over time, it was decided that Coca-Cola seems to have a
strong hold within the market and will be able to weather most ups and downs that the market will bring.
By calculating various growth rates for the company, we were able to establish what we believe to be
conservative figures that relate to and depict various valuation models that could be used for the Coca-
Cola Company. Finally, we conducted an assessment of solvency for Coca Cola, in which we discovered the
Coca-Cola Company was most stable in 2006 and has maintained financial stability in the past 3 years.
Coca-Cola is a company that has a long-standing future within the consumer goods market. It has
firmly established itself as a key player within the industry through different targeted marketing strategies
and meticulous business practices. The diversification of the company’s beverage lines has also greatly
improved Coca-Cola’s standing within the industry. Today, Coca-Cola sells more than four hundred brands
in approximately two hundred countries. Being in tune with consumer inclinations and having the ability
to anticipate what lies ahead, along with marketing advancements have always been a hallmark of Coca-
Cola, ultimately facilitating the brand to evolve over time and stay in rhythm with consumers’ morphing
lifestyles. In the future Coca-Cola’s global reach should continue to give it the upper hand in the
territories that offer the greatest growth potential.
marketing information for any of its brands, it is estimated that Coca Cola spent over $2.6 billion on
advertising1
Strong cash flow from global/large scale operations
.
The Coca-Cola Company is the largest manufacturer, distributor and marketer of nonalcoholic
beverage concentrates and syrups in the world. The company owns or licenses around 500 brands,
including diet and light soft drinks, waters, enhanced waters, juices, teas, coffees, and energy and sports
drinks. It manufactures concentrates and syrups and sells them to over a hundred bottling and canning
operations and distributors they have interests with. It currently sells its products in over 200 countries,
and owns and manages a large number of manufacturing plants worldwide. In recent years, the company
acquired numerous bottling and water companies, and has joint ventures with a variety of beverage
companies world-wide. The large scale of Coca Cola’s operations allows it to feed its market demand with
relative ease and thus maximize its revenue generating capacity2
WEAKNESSES
.
Limited scope for further product type expansion
At a time when international expansion is a key growth strategy in the soft drink industry, Coca
Cola’s extensive global reach leaves relatively limited scope for further expansion3
Health Effects
.
The company’s usage of high fructose corn syrup rather than sucrose (for cost reduction purposes)
has caused some health concerns. The corn syrup is produced from corn plants that have been genetically
modified, and has been known to metabolize differently than sugar by the body.It is also linked to obesity
1 The Coca-Cola Company (n.d.). Retrieved November 9, 2009, from http://thecoca-colacompany.com 2 Ibid 3 Ibid
3
and diabetes4
Business Practices
.
Another criticism of the Coca Cola Company is that its business practices are monopolistic. PepsiCo
Inc. filed an antitrust lawsuit against the company for monopolizing the market for fountain-dispensed
soft drinks in the U.S.5.In Europe, in response to the European Unions’ investigation on monopolistic
practices, the Coca Cola company ended its deals with shops and bars to sell its drinks exclusively6. In
Mexico, the Coca Cola Export Corporation was fined over $60 million for unfair commercial practices7
Marketing
.
The Coca-Cola Company is heavily advertises to children. In a 2004 study on childhood obesity, the
British government reported that the Coca-Cola Company was broadcasted most of its advertisements
during children shows8
Channel Stuffing
.
In 2008, the Coca-Cola company paid $137.5 million to settle a 2000 shareholder lawsuit. It was
claimed that the company forced some bottlers to buy hundreds of millions of dollars of beverage
concentrate. Investors accused Coca-Cola of “channel stuffing”, or artificially inflating its results and
presenting a false image of the company’s health9
4 Forristal, L. J. (2003, December 3). The Murky World of High-Fructose Corn Syrup. Retrieved November 21, 2009, from http://www.westonaprice.org/The-Murky-World-of-High-Fructose-Corn-Syrup.html
.
5 All Business (2000, September 25). PepsiCo Inc.. Retrieved November 19, 2009, from http://www.allbusiness.com/retail-trade/food-beverage-stores/637726-1.html 6 BBC News (2005, June 22). EU makes Coke throw open fridges. Retrieved November 13, 2009, from http://news.bbc.co.uk/2/hi/business/4119372.stm 7 BBC News (2005, November 17). Mexican shopkeeper defeats Coke. Retrieved November 13, 2009, from
http://news.bbc.co.uk/2/hi/business/4119372.stm 8 BBC News (2004, April 7). TV food adverts target children. Retrieved November 13, 2009, from http://news.bbc.co.uk/2/hi/business/4119372.stm 9 Google News (2008, July 6). Coca-Cola settles stockholder lawsuit with 137 million. Retrieved November 20, 2009, from http://afp.google.com/article/ALeqM5icIwE8QDkIe8uVeQYi2ug_k3HCcA
4
Environmental Issues
One of the major environmental issues the Coca-Cola Company is facing is its use of pesticides and other
harmful chemicals such as lindane and DTT in India. This resulted in the company losing 11% of its
sales10.Another environmental concern is the company’s use of water, which dries up aquifers causing
farmers to relocate. Also, in India a Coke bottling plant was shut down due to the company’s usage of
water that led to the deterioration of both the quality and quantity of water available to the local people.
However, these claims were found to be false after noticing that there was no change in water levels even
after shutting down the plant. In another incident, also in India, many NGO’s and local residents in India
protested against the company for polluting groundwater and releasing waste water into surrounding
land. The company did not deny these allegations11
Declining performance in the United States
.
The Coca-Cola Company’s revenues decreased 4.2% in the third quarter of 2009. North America
volumes decreased 4% in the third quarter of 2009. This decrease in sales is believed to have come from
lower consumption of sodas due to increase health consciousness. The decline in performance might
hinder the company’s growth prospect. The Coca-Cola Company could offset the loss of sales in sodas by
strengthening its market position in bottled water, flavored water, and juices12
OPPORTUNITIES
.
Acquiringcompetitors/new niche brands
Coca-Cola’s solid cashflow provides strong acquisition capability and funds for marketing, which is
crucial for expansion and retaining consumers’ loyalty. This is especially true during difficult economic
times.
10 Business Standard (2003, October 29). Coke sales fall 11% on pesticide controversy. Retrieved November 21, 2009, from http://www.business-standard.com/india/news/coke-sales-fall-11pesticide-controversy/159950/ 11 Stecklow, S. (2005, June 7). How a Global Web of Activists Gives Coke Problems in India. The Wall Street Journal. Retrieved November 7, 2009, from http://livesinfocus.org/aids/files/2008/11/wsjhow_a_global_web_of_activists_gives_coke_problems_in_india.pdf 12 Euromonitor International (2009, May). Coca-Cola Co, The in Soft Drinks. Retrieved November 11, 2009, from http://www.euromonitor.com/Coca_Cola_Co_The_in_Soft_Drinks
5
Growing bottled water market
Due to rising health concerns, bottled water is one of the fastest-growing segments of the food and
beverage market. The total bottled water consumption for 2008 was 8.6 billion gallons. While
consumption for carbonated beverages decreased 3.1%, and package fruit beverages decreased by 2%,
bottled water consumption only decreased by 1% in 2008. Vitamin water consumption went up by 8.3%.
Bottled water captured 28.9% of the packaged beverage water market in 200813. The Coca-Cola Company
had a share of 6.4% of that market14. It is forecasted that the global bottled water market will increase by
38.6%, representing a consumption of 165.5 billion liters by 201215. The Coca-Cola Company has been
actively acquiring water brands world-wide. It currently own a large number of water brands. Some of
Deep River Rock, Dorna, EvaWater, H2OK, Ice Dew, Kin, Kiwi Blue, MalvernWater, Mount Franklin,
Multiva, Namthip, Nature’s Own, Pump, San Luis, Spring! By Dannon, Dannon, Valpre, Vitamin Water,
Vital, Viva!,Wilkin’s16.The company’s bestselling water brand is Dasani. It is one of the two best selling
bottled waters in the U.S.17
Moreover, the company’s Vitamin Water is one of the U.S. best selling flavored and vitamin-
fortified water. Given that the market for flavored market is significantly increasing, the Coca-Cola
company could enforce its strong position in the bottled water segment to take the advantage of this
13 International Bottle Water Association (2009). Bottled Water Market Share Volume Increased in 2008. Retrieved November 21, 2009, from http://www.bottledwater.org/news/bottled-water-market-share-volume-increased-2008 14 Nestle Water North America (2009). Trended Bottled Water Volume Growth. Retrieved January 21, 2010, from http://www.nestle-watersna.com/Menu/AboutUs/Performance/Trended+Bottled+Water+Volume+Growth.htm 15 Yahoo! Finance (2009, November 17). Research and Markets: In 2012 The Global Bottled Water Market Is Forecast To Have a Volume of 165.5 Billion Liters, an Increase Of 38.6% Since 2007. Retrieved November 21, 2009, from http://ca.news.finance.yahoo.com/s/17112009/34/biz-f-business-wire-research-markets-2012-global-bottled-water-market-forecast.html 16 The Coca-Cola Company (n.d.). Retrieved November 9, 2009, from http://thecoca-colacompany.com 17 Creamer, M. (2009, November 22). Maine bottler markets water with a pure distinction. Portland Press Herald. Retrieved January 21, 2010, from http://pressherald.mainetoday.com/story.php?id=297334&ac=PHbiz
6
market growth. Moreover, the company should further fortify the position of its bottled water and try to
obtain more market share and a solid brand positioning in that market.
Emerging markets (i.e. Growing Hispanic population in the U.S.)
Selective emerging markets will continue to provide some positive growth regardless of the
slowdown of the general economy. Recession in the Western world may create revived opportunities for
carbonates.The company has expanded its investment in RTD beverages including increasing research and
development into Chinese herbal drinks and a gradual global roll-out of Illycafé.
THREATS
Intense competitions/PEPSI
PepsiCo is increasing its investments in Russia and China, which are also among the core growth
markets for Coca-Cola. The competition for acquisitions of juice and bottled water will be particularly
tense between the two American giants.
Dependence on bottling companies/partners
The Coca-Cola Company generates most of its revenues by selling concentrates and syrups to
bottling companies it does not own. As independent companies, these bottling companies make their
own business decisions that may not always be aligned with the Coca-Cola Company’s interests.
Moreover, since these companies manufacture and distribute more than one product, they may decide to
drop Coca-Cola if they are not provided the right incentives. Actions such as these would greatly impact
the Coca-Cola Company. This would result in Coca-Cola losing a great deal of market share, especially in
places where there are very few bottling companies. This heavy dependence on third parties is a weak link
in Coca-Cola’s operations and increases the company’s business risks.
7
Decline in the carbonated beverage market
People have become increasingly health conscious. This has led to a decrease in the consumption
of carbonated and other sweetened beverages.
Economic Decline/Recession
The recession in developed Western markets is likely to impact on sales of premium products such
soft drinks in the short to medium term. Cash-strapped consumers may switch to tap water from bottled
water in view of the poor income outlook.
1.2 CORPORATE CULTURE AND SOCIETAL EXPECTATIONS/RESPONSIBILITIES
The world that exists today is more linked than ever before. Government, businesses and society
are far more interactive than they have been in the past. Corporations are more aware of their role in
society. They see the need to be perceived as responsible entities that feel a certain sense of obligation
towards society and the environment. This has come with a mounting consciousness that these
companies, as a fundamental and vital aspect of humanity, can play a part in the empowerment and
betterment of the society. These days, in this aggressive business setting, societal responsibilities are
seen as the means to not only triumphing over competition but also to guaranteeing sustainable
development.
Coca-Cola emphasizes the importance of creating balance and harmony between its
responsibilities to its employees and to the environment. In regards to employee benefits, the company
strives to establish and foster an atmosphere in which the workers feel a sense of belonging and equality.
Each employee is encouraged to contribute their own ideas and thoughts to the development of new
products and promotions. Consistent with this value, the “company reaffirms its long‑standing
commitment to…create an inclusive work environment free of discrimination and physical or verbal
8
harassment”18
In regards to Coca-Cola doing its part to help the world around us, it has various programs that aid
in the improvement of our environment. As of 2007, it has implemented a nationwide recycling initiative
dubbed ‘Coca-Cola Recycling’. Through this endeavor, the company has worked with communities
through the country to amplify the gathering of recycled materials that can be used again. Currently, it
manages “30 dedicated recycling centers, a commercial brokerage network, an online recycling bin
fulfillment site and the execution of hundreds of local recycling programs around the country”
in regards to any sort of discrimination. It also getsits employees involved in team events
across the country. It encourages participation in extracurricular events such as marathons and projects.
19
All in all, Coca Cola finds a balance between its employees’ work and personal lives. It attempts to
incorporate its employees into its lifestyle and cultural goals. Coca-Cola also finds it a necessity to
.Itis also in
the process of developing methods for the cost-effective reuse of materials. The desired goal is to obtain
five hundred million pounds of reuseable plastic by 2010, having already gathered 200 million. In order to
incorporate this mentality into the lives of its consumers, it has implemented initiatives that infuse this
thinking into what it portrays to be the Coca-Cola “lifestyle”. Some of these initiatives include selling eco-
apparel on its website, setting up ‘RecycleBank’ which is a rewards program, attempting to conserve
national parks, and involving and encouraging college campuses to get involved in the green initiative
through its ‘Give It Back’ program and ‘RecycleMania’ competition. Furthermore, the company is heavily
involved in water conservation and climate protection programs with similar partnerships, projects, and
challenges. One important program that has been implemented is the ‘Triple Play’ program, which
encourages children to establish a healthier, more active lifestyle. This is vital due to the growing
alarming rates of childhood obesity throughout America. It has recognized that this is a challenge and
have embraced it to benefit its younger consumers.
18 The Coca-Cola Company (n.d.). 2008/2009 Sustainability Review. Retrieved November 17, 2009, from http://www.thecoca-colacompany.com/citizenship/2008-2009_sustainability_review.html 19 Live Positively (n.d.). Recicle Bank. Retrieved November 12, 2009, from http://www.livepositively.com/recycle_bank?WT.srch=1#/recycle_bank
9
participate in the concerns of its consumers and in turn collaborate with local chapters to do their part to
ensure a better environment. Eventually, this will lead to the improvement of the world and a stronger,
more positive image for the company as a whole. This is a company whose logo and image are recognized
worldwide. To act positively now and make an impact in a strong way can only further its success the
world over.
The strategy itself is extremely smart on Coca Cola’s side due tothe fact that itis incorporating itself
into society andbecoming a part of the consumers’ lifestyles. Itis also creatingacommunity with its
consumers where it can effectively createchange within communities and discover the different causes
that fuela customer’s passion. Additionally, by putting time and effort into
the community, they in turn create profits by increasing its targetmarket.
10
2. ACCOUNTING ANALYSIS
According to the Accounting Principles Board in its Opinion 22, ‘Disclosure of Acceding Policies’, April
1972, paragraph 620
The accounting policies of a reporting entity are the specific accounting principles and the methods of
applying those principles that are judged by the management of the entity to be the most appropriate
in the circumstances to present fairly financial position, and results of operations in accordance with
generally accepted accounting principles and that accordingly have been adopted for preparing the
financial statements.
:
2.1 KEY ACCOUNTING POLICIES
The Coca-Cola Company, in this respect, has conformed to a set of accounting policies and principles
that are generally accepted (GAAP) in the United States. The Coca-Cola Company believes that its most
critical accounting policies and estimates relate to the following:
• Basis of Presentation and Consolidation
• Recoverability of Noncurrent Assets
• Revenue Recognition
• Income Taxes
• Contingencies
The company accounts for and consolidates the financial statements of other entities that it has
ownership rights to. It uses the equity method to account for its investments in those entities. According
to the equity method, the company records the original investment at the cost and then adjusts the value
of the investment over time, i.e., it increases (decreases) the value when its investment generates income
20 Riahi-Belkaoui, A. (2000). Accounting Theory (4th ed.). Cengage Learning Business Press. Retrieved December 10, 2009
11
(losses). Companies to which Coca-Cola has no ownership rights to are accounted under either the fair
value or cost method. Investments in equity securities are carried at fair value and are classified as either
trading or available-for-sale securities. The gains or losses in these securities are realized and accounted
for in the consolidated income statement. The Coca-Cola Company even accounts for the gains and losses
in its available-for-sale securities in its consolidated balance sheet as a component of accumulated other
comprehensive income (loss), whereas its trading securities are reported as marketable securities in its
consolidated balance sheet21
The Coca-Cola Company’s Management has to assess and estimate the impairment costs of the
recoverability of noncurrent assets. These estimates are made on factors such as economic life of the
asset, sales volume, prices, inflation, cost of capital, marketing spending, foreign country exchange rates,
tax rates and capital spending. These factors were difficult to predict keeping in mind the economic crisis
that occurred last year.
.
We noticed that whenever and wherever there is a difference between the carrying value of the asset
and its fair value, it is accounted for as an impairment charge, but the company does not change its
method of classifying different assets (tangible and intangible) and securities, which according to us is
correct.
Depreciation is recorded by the straight line method over the estimated useful life of the assets:
Buildings and improvements, 40 years or less; machinery or equipments, 15 years or less; and containers,
10 years or less. This method of depreciation is very common among similar industries and it is by far the
most appropriate method of accounting for depreciation. Coca-Cola’s depreciation expense in proportion
21 The Coca-Cola Company (2009). 2008 Annual Report on Form 10-K. Retrieved December 22, 2009, from http://www.thecoca-colacompany.com/investors/form_10K_2008.html
12
to its acquisitions is relatively constant over the various years to be $993 million, $958 million, and $763
million for the years ended December 31, 2008, 2007, 2006 respectively22
Net Income declined by $174 million in 2008 from 2007 primarily due to the economic setback which
caused investment losses (Value of Coca-Cola Enterprises Inc., CCE, was reduced to zero due to its
proportionate share of impairment charges impacting AOCI, accumulated other comprehensive income,
recorded by CCE)
.
23
Despite the economic downturn last year the company has a positive ROA and ROE. This shows that
the company is able to do well even in poor economic conditions.
.
In 2008, ROA = Net Income/Average Total Assets = 5,807/41,894 = 0.1386
In 2008, ROE = Net Income/Average Shareholder Equity = 5,807/21,108 = 0.2751
A positive and high ROA reveals how efficient the company is at using its assets to generate income.
A positive and high ROE reveals that the company is concerned about maximizing its shareholder’s
wealth.
2.2 ACCOUNTING ADJUSTMENTS
As a conclusion, The Coca Cola Company is honest in its accounting of gains and losses; hence there
isnot a need for major changes in its accounting policies. The Annual Report of The Coca Cola Company
reveals all decisions that are made by management as well as discrepancies that may occur at times of
financial crises.
22 Ibid 23 Ibid
13
3. FINANCIAL ANALYSIS – MULTIYEAR ANALYSIS/COMPARISONS The soft drink industry is a highly competitive global industry. At least in the last five years, The
Coca-Cola Company has been the number one company with a market share over 42% in the U.S.24 and
22% globally25. Pepsi follows with a market share between 30% and 31%26 in the U.S. and slightly under
11% globally27. Far behind is Dr Pepper in third place in the U.S. with a market share of 15%28, and in fifth
place globally with a market share less than 2%29. However, these market shares for both Coca-Cola and
Pepsihave decreased slightly from 2003 to 200830
The financial statements studied for this analysis belong to (1) The Coca-Cola Company (KO)
.
i,ii,iii,
which is almost a pure beverage company; (2) PepsiCo, Inc.(PEP)iv,v,vi, which has a large snack food
division; and (3) Dr Pepper Snapple Group, Inc.(DPS)vii,viii,ix, established in 2008 following the spinoff of
Cadbury Schweppes Americas Beverages (CSAB) from Cadbury Schweppes plc31
Much can be said about the fact that people around the world are over the last years consuming
fewer carbonated drinks while turning to healthier alternatives. PepsiCo has a slight advantage in this
regard, even though Coca-Cola and Dr Pepper have some more favorable ratios: PepsiCo’s diversification
into snacks and other food products means that its revenues will be less affected by consumers’ changing
preferences in comparison to Coca-Cola and Dr Pepper. However, it should also be noted that the industry
leaders, namely Coca-Cola and PepsiCo, are constantly acquiring growing brands that would otherwise be
seen as competitors to its already existing portfolio of brands. Furthermore, it is throughthese acquisitions
. All ratios will reference
figures from the 2006, 2007 and 2008 financial statements of these three companies.
24 Sicher, J. (2009). Beverage Digest (Vols. 50 - 54). Bedford Hills, NY: Beverage Digest Company L.L.C. Retrieved December 21, 2009 25 Euromonitor International (2009, May). Coca-Cola Co, The in Soft Drinks. Retrieved November 11, 2009, from http://www.euromonitor.com/Coca_Cola_Co_The_in_Soft_Drinks 26 Sicher, J. (2009) 27 Euromonitor International (2009, May). 28 Sicher, J. (2009) 29 Euromonitor International (2009, May). 30 Sicher, J. (2009) 31 Dr Pepper Snapple Group, Inc. (n.d.). Our Story. Retrieved December 23, 2009, from http://www.drpeppersnapplegroup.com/about/our-story/
14
and through the constant search andimplementation of efficiencies that Coca-Cola and PepsiCo will
continue to grow.
3.1 MULTIYEAR ROE DECOMPOSITION – THE COCA-COLA COMPANY AND MAJOR COMPETITORS
RETURN ON EQUITY (ROE)
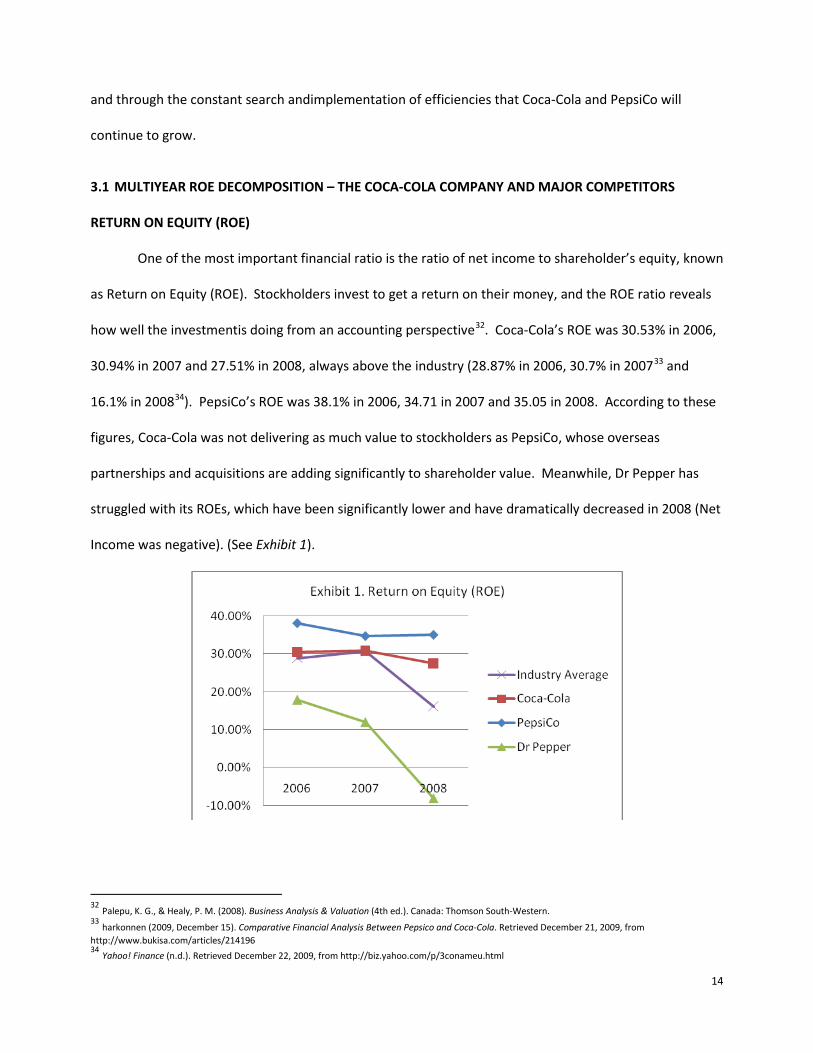
One of the most important financial ratio is the ratio of net income to shareholder’s equity, known
as Return on Equity (ROE). Stockholders invest to get a return on their money, and the ROE ratio reveals
how well the investmentis doing from an accounting perspective32. Coca-Cola’s ROE was 30.53% in 2006,
30.94% in 2007 and 27.51% in 2008, always above the industry (28.87% in 2006, 30.7% in 200733 and
16.1% in 200834). PepsiCo’s ROE was 38.1% in 2006, 34.71 in 2007 and 35.05 in 2008. According to these
figures, Coca-Cola was not delivering as much value to stockholders as PepsiCo, whose overseas
partnerships and acquisitions are adding significantly to shareholder value. Meanwhile, Dr Pepper has
struggled with its ROEs, which have been significantly lower and have dramatically decreased in 2008 (Net
Income was negative). (See Exhibit 1).
32 Palepu, K. G., & Healy, P. M. (2008). Business Analysis & Valuation (4th ed.). Canada: Thomson South-Western. 33 harkonnen (2009, December 15). Comparative Financial Analysis Between Pepsico and Coca-Cola. Retrieved December 21, 2009, from http://www.bukisa.com/articles/214196 34 Yahoo! Finance (n.d.). Retrieved December 22, 2009, from http://biz.yahoo.com/p/3conameu.html
15
ROE DECOMPOSITION
The ROE decomposition was approached in three different ways.The first includes(1) Return on
Sales (ROS), expressed as Net Income/Sales; (2) Asset Turnover, defined as Sales/Average Assets; and (3)
Financial leverage expressed as Average Assets/Average Shareholder’s Equity (See Exhibit 2 trough Exhibit
4 and Chart 1. Multiyear ROE Decomposition. The Coca-Cola Company and Major Competitors. Approach
1).
16
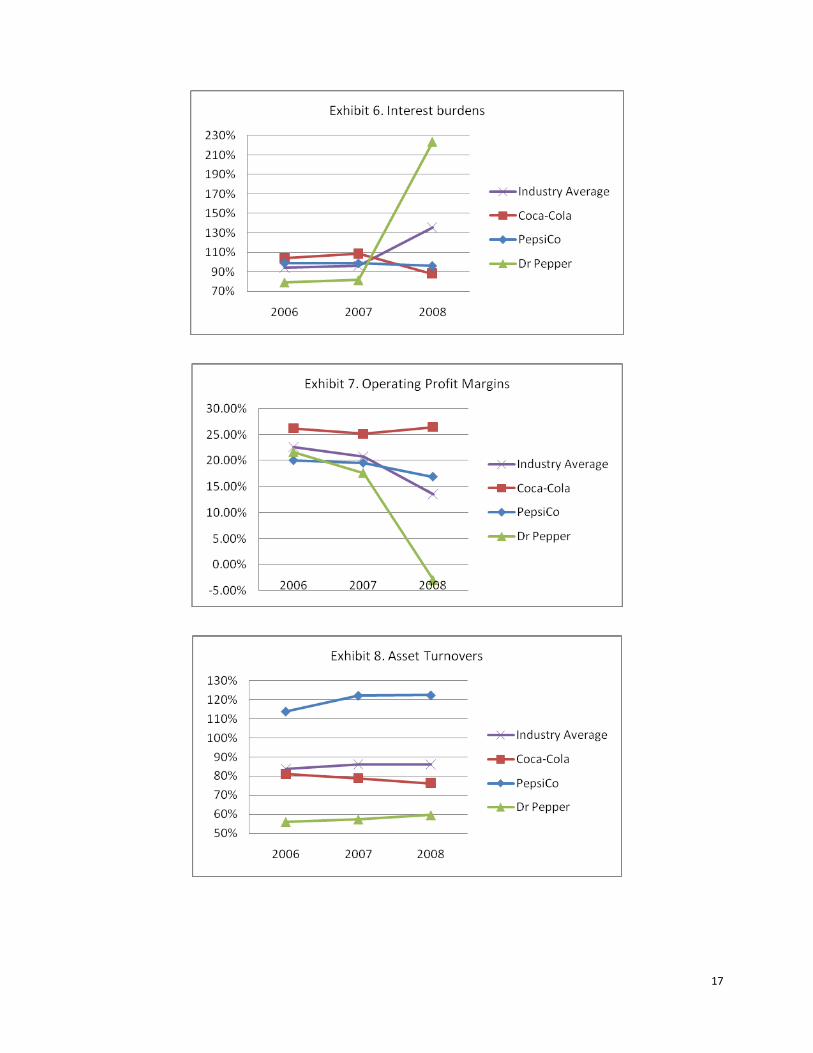
The second approach takes into account (1) Tax Burden, expressed as Net Income/Income before
Taxes; (2) Interest Burden, defined as Income before Taxes/EBIT; (3) Operating Profit Margin, expressed as
EBIT/Sales; (4) Asset Turnover, defined as Sales/Average Assets; and (5) Financial leverage expressed as
Average Assets/Average Shareholder’s Equity (See Exhibit 5 through Exhibit 9and Chart 2. Multiyear ROE
Decomposition. The Coca-Cola Company and Major Competitors. Approach 2).
17
18
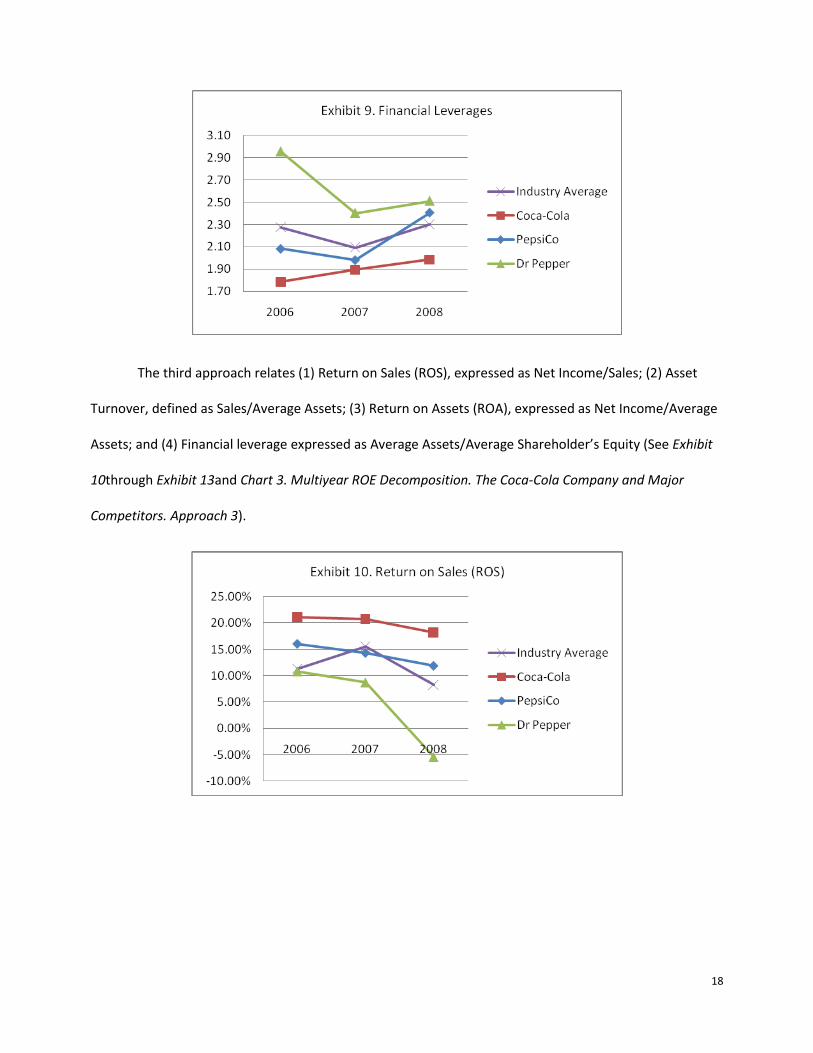
The third approach relates (1) Return on Sales (ROS), expressed as Net Income/Sales; (2) Asset
Turnover, defined as Sales/Average Assets; (3) Return on Assets (ROA), expressed as Net Income/Average
Assets; and (4) Financial leverage expressed as Average Assets/Average Shareholder’s Equity (See Exhibit
10through Exhibit 13and Chart 3. Multiyear ROE Decomposition. The Coca-Cola Company and Major
Competitors. Approach 3).
19
20
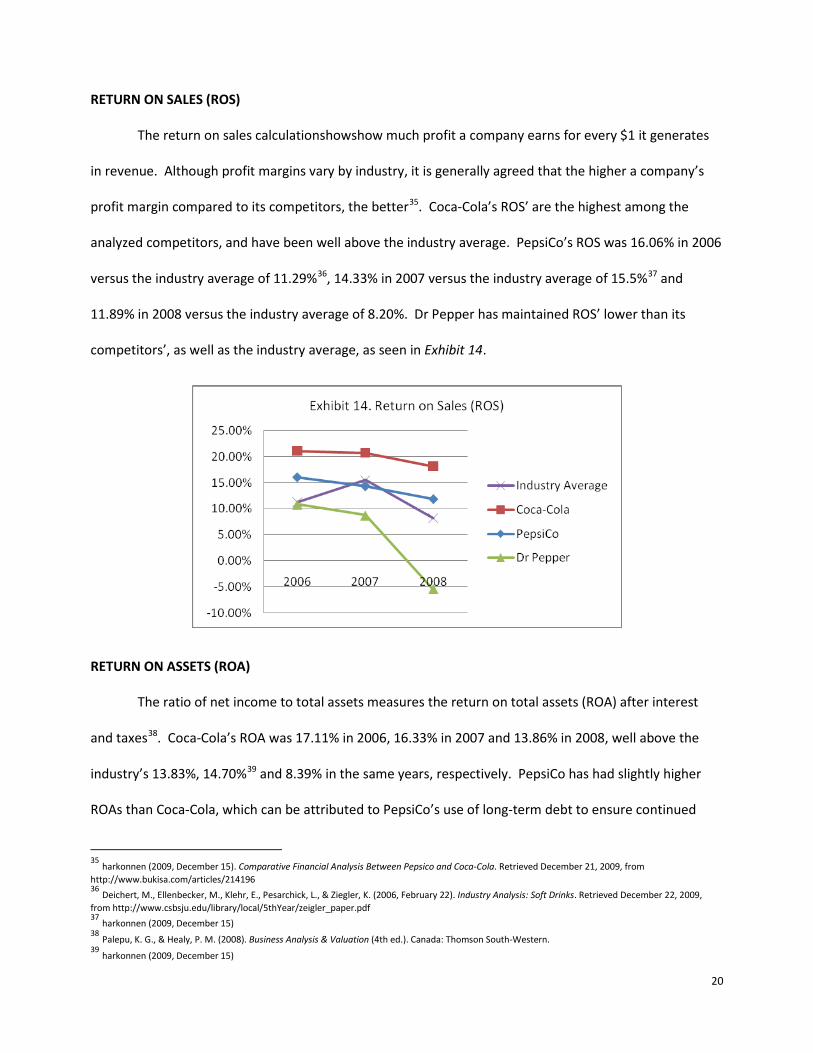
RETURN ON SALES (ROS)
The return on sales calculationshowshow much profit a company earns for every $1 it generates
in revenue. Although profit margins vary by industry, it is generally agreed that the higher a company’s
profit margin compared to its competitors, the better35. Coca-Cola’s ROS’ are the highest among the
analyzed competitors, and have been well above the industry average. PepsiCo’s ROS was 16.06% in 2006
versus the industry average of 11.29%36, 14.33% in 2007 versus the industry average of 15.5%37 and
11.89% in 2008 versus the industry average of 8.20%. Dr Pepper has maintained ROS’ lower than its
competitors’, as well as the industry average, as seen in Exhibit 14.
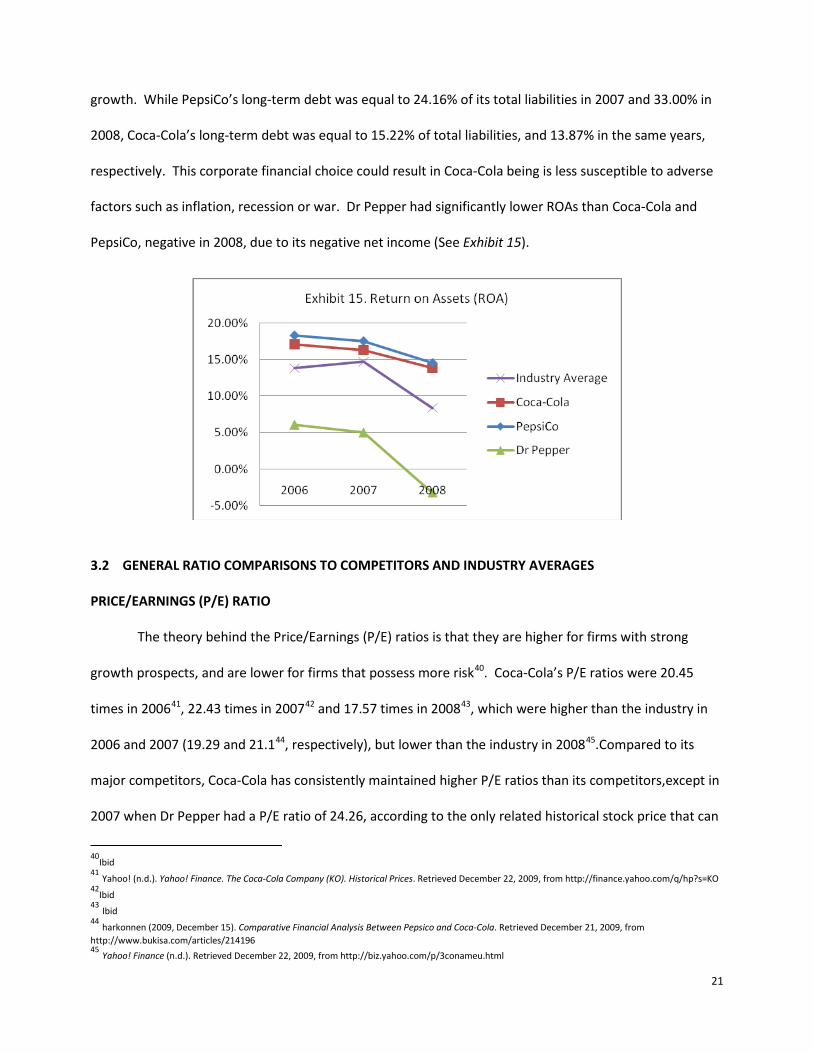
RETURN ON ASSETS (ROA)
The ratio of net income to total assets measures the return on total assets (ROA) after interest
and taxes38. Coca-Cola’s ROA was 17.11% in 2006, 16.33% in 2007 and 13.86% in 2008, well above the
industry’s 13.83%, 14.70%39
35 harkonnen (2009, December 15). Comparative Financial Analysis Between Pepsico and Coca-Cola. Retrieved December 21, 2009, from http://www.bukisa.com/articles/214196
and 8.39% in the same years, respectively. PepsiCo has had slightly higher
ROAs than Coca-Cola, which can be attributed to PepsiCo’s use of long-term debt to ensure continued
36 Deichert, M., Ellenbecker, M., Klehr, E., Pesarchick, L., & Ziegler, K. (2006, February 22). Industry Analysis: Soft Drinks. Retrieved December 22, 2009, from http://www.csbsju.edu/library/local/5thYear/zeigler_paper.pdf 37 harkonnen (2009, December 15) 38 Palepu, K. G., & Healy, P. M. (2008). Business Analysis & Valuation (4th ed.). Canada: Thomson South-Western. 39 harkonnen (2009, December 15)
21
growth. While PepsiCo’s long-term debt was equal to 24.16% of its total liabilities in 2007 and 33.00% in
2008, Coca-Cola’s long-term debt was equal to 15.22% of total liabilities, and 13.87% in the same years,
respectively. This corporate financial choice could result in Coca-Cola being is less susceptible to adverse
factors such as inflation, recession or war. Dr Pepper had significantly lower ROAs than Coca-Cola and
PepsiCo, negative in 2008, due to its negative net income (See Exhibit 15).
3.2 GENERAL RATIO COMPARISONS TO COMPETITORS AND INDUSTRY AVERAGES
PRICE/EARNINGS (P/E) RATIO
The theory behind the Price/Earnings (P/E) ratios is that they are higher for firms with strong
growth prospects, and are lower for firms that possess more risk40. Coca-Cola’s P/E ratios were 20.45
times in 200641, 22.43 times in 200742 and 17.57 times in 200843, which were higher than the industry in
2006 and 2007 (19.29 and 21.144, respectively), but lower than the industry in 200845
40
Ibid
.Compared to its
major competitors, Coca-Cola has consistently maintained higher P/E ratios than its competitors,except in
2007 when Dr Pepper had a P/E ratio of 24.26, according to the only related historical stock price that can
41 Yahoo! (n.d.). Yahoo! Finance. The Coca-Cola Company (KO). Historical Prices. Retrieved December 22, 2009, from http://finance.yahoo.com/q/hp?s=KO 42
Ibid 43 Ibid 44 harkonnen (2009, December 15). Comparative Financial Analysis Between Pepsico and Coca-Cola. Retrieved December 21, 2009, from http://www.bukisa.com/articles/214196 45 Yahoo! Finance (n.d.). Retrieved December 22, 2009, from http://biz.yahoo.com/p/3conameu.html
22
be retrieved today which is Cadbury plc’s46 (SeeExhibit 16 andChart 4. General Ratio Comparisons to
Competitors and Industry Averages).
LONG-TERM DEBT-TO-EQUITY RATIO
The long-term debt/equity ratio indicates the relative proportion of equity and long-term debt
used to finance a company’s assets47. Coca-Cola’s long-term debt/equity ratio was as low as 0.07 in 2006,
0.13 in 2007 and 0.12 in 2008. PepsiCo maintained higher long-term debt/equity ratios of 0.14 in 2006,
0.20 in 2007 and 0.39 in 2008, because it had consistently increased its long-term debt through the
issuance of senior unsecured notes48(64.82% in 2007 and 86.96% in 2008),in addition PepsiCo decreased
its shareholder’s equity in 2008 by 29.76%, due basically to currency translation adjustment, losses in
pension and retiree medical, and share repurchases49. Dr Pepper, however, has maintained much higher
long-term debt/equity ratios as a result of its strategy of generating cash from increased
operations50
46 Yahoo! (n.d.). Yahoo! Finance. Cadbury plc (CBY). Historical Prices. Retrieved December 22, 2009, from http://finance.yahoo.com/q?s=cby
.Using these calculations and this approach, Coca-Cola has a seemingly more advantageous
position than its competitors.Long-term debt is a smaller component of Coca-Cola’s total liabilities. It is
thus less reliant on debt to finance continued growth than PepsiCo and Dr Pepper, which can be perceived
47 Forbes Digital (n.d.). Investopedia. Debt/Equity Ratio. Retrieved December 28, 2009, from http://www.investopedia.com/terms/d/debtequityratio.asp 48 PepsiCo, Inc. (2009). SEC Filings Form 10-K 2008. Retrieved December 23, 2009, from http://www.pepsico.com/Investors/SEC-Filings.html 49 Ibid 50 Dr Pepper Snapple Group, Inc. (2009). Annual Report 2008. Retrieved December 23, 2009, from http://www.drpeppersnapplegroup.com/annualreport/2008/HTML/DPSG_2008_AnnualReport_Web.pdf
23
as an an added bonus to a potential investor (See Exhibit 17 and Chart 4. General Ratio Comparisons to
Competitors and Industry Averages).
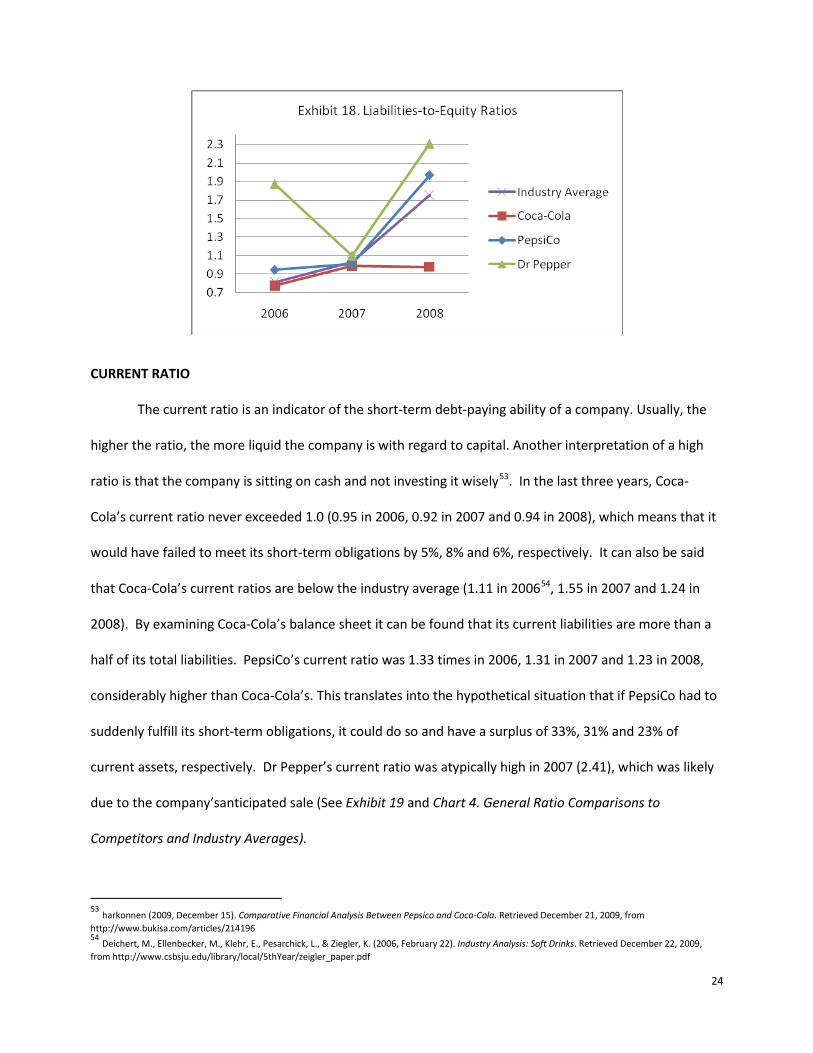
LIABILITIES-TO-EQUITY RATIO
The total liabilities/equity ratio indicates what proportion of equity and debt the company is using
to finance its assets51. The performance of these ratios for the three companies is very similar to the
performance of the long-term debt-to-equity ratio. It is important to note the high portion of Coca-Cola’s
total liabilities that is not long-term debt.Note for example that Dr Pepper liabilities/equity ratios have
been very high: In 2008, it had twice as much debt as it did equity, which means that its funds was mainly
provided by creditors as opposed to owners. This high ratio may be explained as a result of the
reclassification of the Cadbury’s total invested equity to reflect the post-separation capital structure52
51 Forbes Digital (n.d.). Investopedia. Debt/Equity Ratio. Retrieved December 28, 2009, from http://www.investopedia.com/terms/d/debtequityratio.asp
;this
fact alone made the equity decrease more than 48%(See Exhibit 18 and Chart 4. General Ratio
Comparisons to Competitors and Industry Averages).
52 Dr Pepper Snapple Group, Inc. (2009). Annual Report 2008. Retrieved December 23, 2009, from http://www.drpeppersnapplegroup.com/annualreport/2008/HTML/DPSG_2008_AnnualReport_Web.pdf
24
CURRENT RATIO
The current ratio is an indicator of the short-term debt-paying ability of a company. Usually, the
higher the ratio, the more liquid the company is with regard to capital. Another interpretation of a high
ratio is that the company is sitting on cash and not investing it wisely53. In the last three years, Coca-
Cola’s current ratio never exceeded 1.0 (0.95 in 2006, 0.92 in 2007 and 0.94 in 2008), which means that it
would have failed to meet its short-term obligations by 5%, 8% and 6%, respectively. It can also be said
that Coca-Cola’s current ratios are below the industry average (1.11 in 200654
53 harkonnen (2009, December 15). Comparative Financial Analysis Between Pepsico and Coca-Cola. Retrieved December 21, 2009, from http://www.bukisa.com/articles/214196
, 1.55 in 2007 and 1.24 in
2008). By examining Coca-Cola’s balance sheet it can be found that its current liabilities are more than a
half of its total liabilities. PepsiCo’s current ratio was 1.33 times in 2006, 1.31 in 2007 and 1.23 in 2008,
considerably higher than Coca-Cola’s. This translates into the hypothetical situation that if PepsiCo had to
suddenly fulfill its short-term obligations, it could do so and have a surplus of 33%, 31% and 23% of
current assets, respectively. Dr Pepper’s current ratio was atypically high in 2007 (2.41), which was likely
due to the company’santicipated sale (See Exhibit 19 and Chart 4. General Ratio Comparisons to
Competitors and Industry Averages).
54 Deichert, M., Ellenbecker, M., Klehr, E., Pesarchick, L., & Ziegler, K. (2006, February 22). Industry Analysis: Soft Drinks. Retrieved December 22, 2009, from http://www.csbsju.edu/library/local/5thYear/zeigler_paper.pdf
25
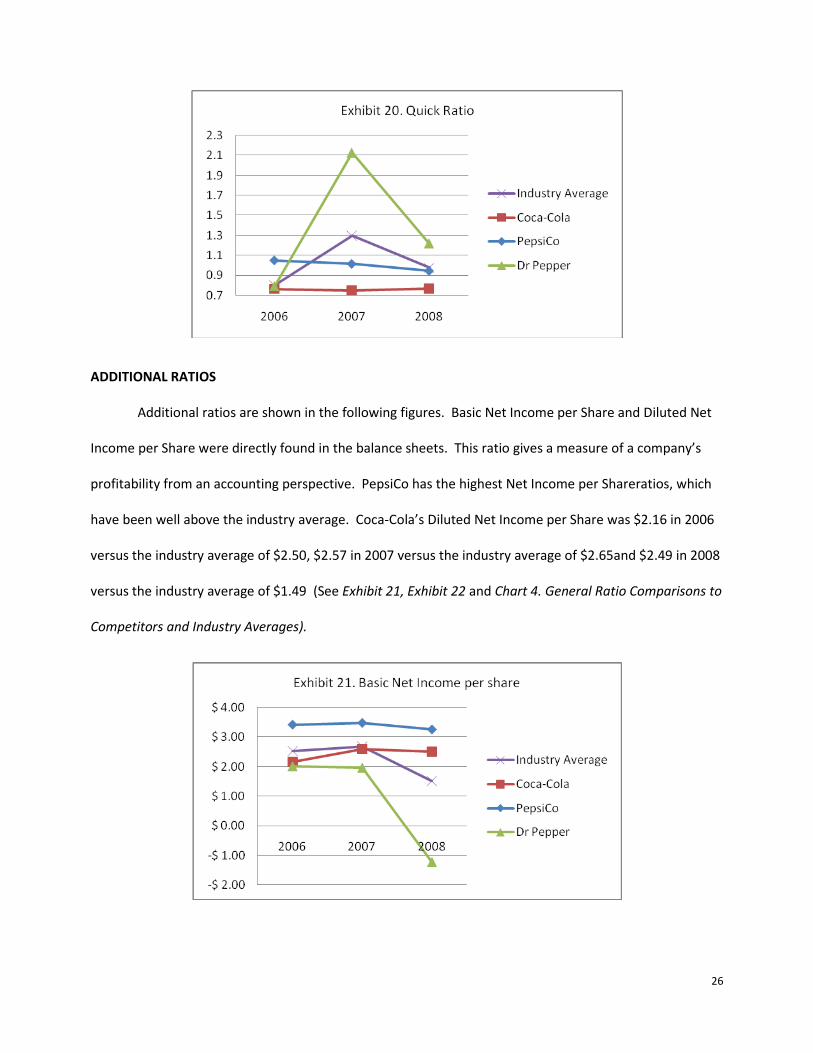
QUICK RATIO
The quick ratio is more conservative than the current ratio because it excludes inventory from
current assets. Inventory is excluded because some companies have difficulty turning their inventory into
cash. In the event that short-term obligations need to be paid off immediately, there are situations in
which the current ratio would overestimate a company’s short-term financial strength55.The performance
of these ratios for the three companies is very similar to the performance of the current ratios. Coca-
Cola’s quick ratios put the company in a more compromising situation: It may nothave the ability to pay
short term debt without selling inventory. However, this is probably due to the fact that Coca-Cola is
confident about its global brand recognition and sales ability. Once again Coca-Cola’s ratios are below the
industry averages:0.8 in 200656
55 Forbes Digital (n.d.). Investopedia. Quick Ratio. Retrieved December 28, 2009, from http://www.investopedia.com/terms/q/quickratio.asp
, 1.3 in 2007 and 0.98 in 2008(See Exhibit 20 and Chart 4. General Ratio
Comparisons to Competitors and Industry Averages).
56 Deichert, M., Ellenbecker, M., Klehr, E., Pesarchick, L., & Ziegler, K. (2006, February 22). Industry Analysis: Soft Drinks. Retrieved December 22, 2009, from http://www.csbsju.edu/library/local/5thYear/zeigler_paper.pdf
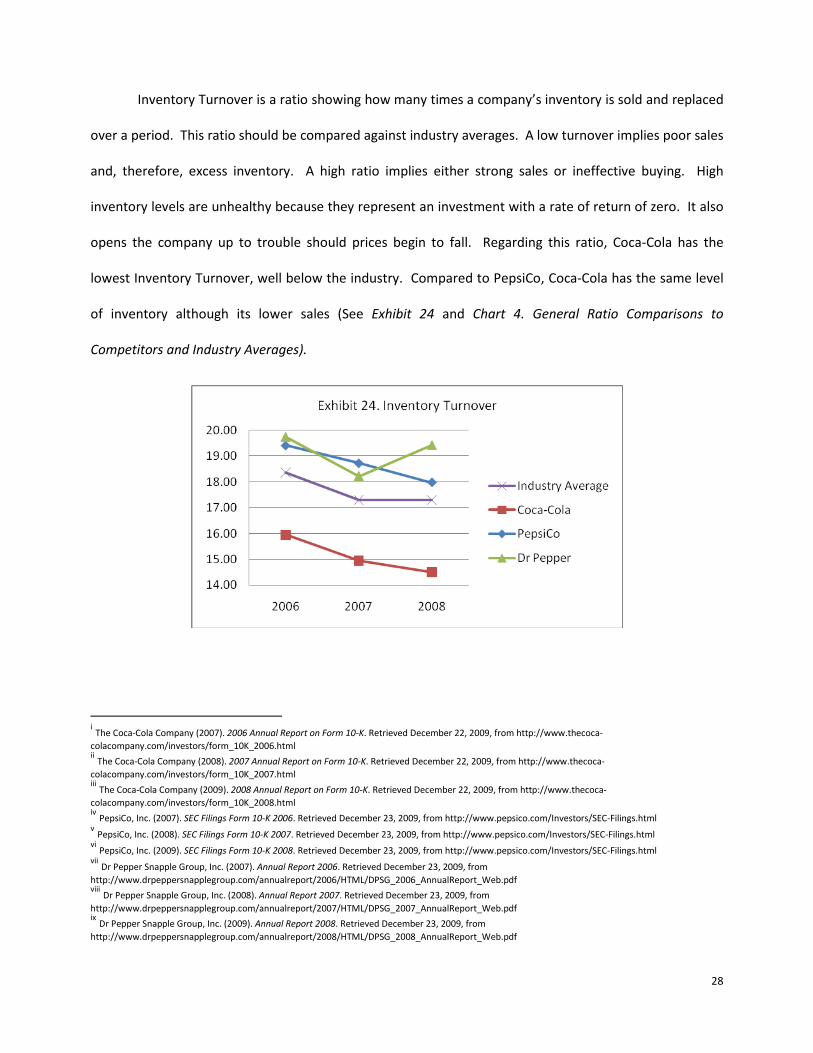
Inventory Turnover is a ratio showing how many times a company’s inventory is sold and replaced
over a period. This ratio should be compared against industry averages. A low turnover implies poor sales
and, therefore, excess inventory. A high ratio implies either strong sales or ineffective buying. High
inventory levels are unhealthy because they represent an investment with a rate of return of zero. It also
opens the company up to trouble should prices begin to fall. Regarding this ratio, Coca-Cola has the
lowest Inventory Turnover, well below the industry. Compared to PepsiCo, Coca-Cola has the same level
of inventory although its lower sales (See Exhibit 24 and Chart 4. General Ratio Comparisons to
Competitors and Industry Averages).
i The Coca-Cola Company (2007). 2006 Annual Report on Form 10-K. Retrieved December 22, 2009, from http://www.thecoca-colacompany.com/investors/form_10K_2006.html ii The Coca-Cola Company (2008). 2007 Annual Report on Form 10-K. Retrieved December 22, 2009, from http://www.thecoca-colacompany.com/investors/form_10K_2007.html iii The Coca-Cola Company (2009). 2008 Annual Report on Form 10-K. Retrieved December 22, 2009, from http://www.thecoca-colacompany.com/investors/form_10K_2008.html iv PepsiCo, Inc. (2007). SEC Filings Form 10-K 2006. Retrieved December 23, 2009, from http://www.pepsico.com/Investors/SEC-Filings.html v PepsiCo, Inc. (2008). SEC Filings Form 10-K 2007. Retrieved December 23, 2009, from http://www.pepsico.com/Investors/SEC-Filings.html vi PepsiCo, Inc. (2009). SEC Filings Form 10-K 2008. Retrieved December 23, 2009, from http://www.pepsico.com/Investors/SEC-Filings.html vii Dr Pepper Snapple Group, Inc. (2007). Annual Report 2006. Retrieved December 23, 2009, from http://www.drpeppersnapplegroup.com/annualreport/2006/HTML/DPSG_2006_AnnualReport_Web.pdf viii Dr Pepper Snapple Group, Inc. (2008). Annual Report 2007. Retrieved December 23, 2009, from http://www.drpeppersnapplegroup.com/annualreport/2007/HTML/DPSG_2007_AnnualReport_Web.pdf ix Dr Pepper Snapple Group, Inc. (2009). Annual Report 2008. Retrieved December 23, 2009, from http://www.drpeppersnapplegroup.com/annualreport/2008/HTML/DPSG_2008_AnnualReport_Web.pdf
The information used in the following charts, valuations, and models were calculated using data
published by The Coca-Cola Company (KO) and other relevant sources. The information gathered and
assembled in this paper represents various forecasts and valuation models that are used to determine the
stock prices of KO based upon its theories of calculation. In order to better understand the major
assumptions used to calculate the attached forecasts and valuations models, see 4.2 NOTES/MAJOR
ASSUMPTIONS OF CALCULATIONS at the next page.
Furthermore, attached throughout the paper are the previously mentioned figures, charts and
calculations used to determine the information for the price per share valuation model comparison as
shown below.
4.1 SUMMARY
The values obtained from the different valuation models are summarized in the following chart,
and plotted in the subsequent graph. Note the actual stock price in December 31, 2008, day in which the
valuation is assumed to be done.
(In millions except price per share)
SCENARIO VALUATION DCF MODEL DAE MODEL DAROE MODEL
OPTIMISTIC g = 9,05%
COMPANY VALUE $ 401,368 $ 244,316 $ 77,595
PRICE PER SHARE $ 171.82 $ 104.59 $ 33.22
EXPECTED g = 5,78%
COMPANY VALUE $ 121,097 $ 85,248 $ 34,888
PRICE PER SHARE $ 51.84 $ 36.49 $ 14.94
PESSIMISTIC g = 2,50%
COMPANY VALUE $ 69,543 $ 52,776 $ 26,204
PRICE PER SHARE $ 29.77 $ 22.59 $ 11.22
30
4.2 NOTES/MAJOR ASSUMPTIONS OF CALCULATIONS
FORECASTING
The Income Statements and the Balance Sheets were forecasted based on growth of
Revenues/Assets. The growth rates (g) were determined assuming three different scenarios, as explained
in the next paragraph. The structures of both the Income Statement and the Balance Sheet were
established using the average incidence of each item on the revenues and assets, respectively, during the
last five years.
GROWTH RATES (g)
• Optimistic Growth Rate (9.05%): If the company would continue with its extremely impressive
growth rate of the last five years on average, 9.05% would be the future rate of growth that could
be projected for the company.
31
• Pessimistic Growth Rate (2.5%): Given the difficult financial scenario in the global business
climate, the fact that the company already has a global presence, and some might argue has a
large enough stake in the beverage industry, the growth rate of 2.5% is used to demonstrate (1)
the global population growth of 1.7%, and (2) plus 0.8% which is used to account for the fact that
more people are integrated in the global business environment, use global brands and are
affected by media and advertising efforts.
• Expected /Neutral Growth Rate (5.78%): In order to establish the expected or neutral growth
rate, a mean of the optimistic and pessimistic rates was calculated.
WEIGHTED AVERAGE COST OF CAPITAL (WACC)
• Long-term debt was taken from the Balance Sheet.
• Current maturities of long-term debt were taken from the Balance Sheet.
• The stock price used in order to calculate the value of equity was taken from Yahoo! Finance57
• Since the WACC is calculated using figures of a fixed period of time the tax rate was calculated
from the income statement by looking at the Income Taxes and dividing it by the Income before
Income Taxes, in order to get the tax rate.
and
is the December 31, 2008 stock price of KO.
• The Cost of Debt was calculated by weighing the average borrowing rates adjusted for company’s
tax rate. These figures were derived from the notes of the consolidated financial statements,
where the long-term debt is broken down into the five major loans taken by the company.
• The government bond yield (rf) was obtained fromthe U.S. Department of the Treasury58
• A Beta of 1 is assumed for the purposes of calculating the WACC figures.
, for the
December 31, 2008 bond yield.
57 Yahoo! (n.d.). Yahoo! Finance. The Coca-Cola Company (KO). Historical Prices. Retrieved January 8, 2010, from http://finance.yahoo.com/q/hp?s=KO 58 U.S. Department of the Treasury (n.d.). Daily Treasury Yield Curve Rates 2008. Retrieved January 9, 2010, from http://www.ustreas.gov/offices/domestic-finance/debt-management/interest-rate/yield_historical_2008.shtml
32
• In order to calculate the (rm) or the market rate of return, it was not possible to use the 2008
figures due to the economic situation of the S&P 500, so the historical average market risk of 8%
was taken and the (rf) of 2.69% was added in order to come up with the (rm).
• Figures derived from 1-7 were then used to compute the Weighted Average Cost of Capital
(WACC), which provide for the discount rate to be used in the valuations of the NPV of the Free
Cash Flows of the company in order to help value the organization59
DISCOUNTED CASH FLOW VALUATION METHOD (DCF)
.
• The Net Income (NI) figures were derived from the Income Statements.
• Depreciation figures were taken from the Income Statements.
• The Non-Cash Current Assets were calculated by taking the current assets and subtracting the
cash that the company kept on hand for that year. Furthermore, in order to figure out the delta
between the years, the non-cash current assets between the years were figured out by
subtracting the calculated figures from the prior year’s figures.
• Differed Income Tax was taken from the Balance Sheet, and was derived from taking the current
year from the previous year’s in order to calculate the deltas.
• Interest Expenses were derived from the Income Statements. Furthermore, the tax rate was
calculated by using the average tax rate of the last five years in order to get a more accurate
depiction of the tax rate for said figure.
• Capital Investment figured were derived from the Consolidated Cash Flow Statements, where the
last five years were taking into account for the average to be utilized in the forecast.
59 Wheatley, C. (n.d.). Computing the Weighted Average Cost of Capital. Retrieved January 8, 2010, from http://www.fiu.edu/~wheatley/ACG6175/webfiles/wacc.htm
33
• Figures 1-7 were needed in order to figure out the Free Cash Flows (FCF), which were then
inserted into the standard NPV FCF equation.
• The WACC is used as the discount rate for the FCF in NPV equations.
• For the purposes of the equation the long-term debt was used as the beginning debt and was
derived from the balance sheet of the company.
• The beginning cash was taken from the balance sheet of the company.
• The average shares outstanding are not affected by revenue and are kept relatively stable
throughout last five years, so for the purpose of valuations these shares outstanding are kept
• The Book Value (BV) for 2008 was calculated using data from the balance sheet.
• The Cost on Equity (re) was calculated using the WACC formula and is used as the discount rate in
the equations needed in this valuation.
• The future BVs were calculated using the present BV added to the Net Income (NI), which can be
calculated based on information taken from the balance sheet and income statements.
• Normal book earnings were calculated by taking the Cost on Equity (re) multiplied by the BV of the
prior year.
• Abnormal earnings were calculated by subtracting the normal earnings from the Net Income (NI).
• Discounted abnormal earnings were calculated by taking the Net Present Value (NPV) of the
Abnormal Earnings. Furthermore, the standard equation of a growing perpetuity was taken into
consideration when valuing the earnings.
• Finally, the sum of the discounted abnormal earnings was added to the original 2008 Book Value
(BV) in order to come up with the DAE company valuation.
34
DISCOUNTED ABNORMAL RETURN ON EQUITY RATIO VALUATION METHOD (DAROE)
• The Cost of Equity Capital (re) is calculated using the WACC formula and is used as the discount
rate in the equations needed in this valuation.
• ROE is as shown on projected balance sheets, or can be calculated by using figures from the
projected income statements by looking at the Net Income (NI) divided by the average
shareholder’s equity which can be found in the projected balance sheets.
• To calculate the Abnormal ROE, the Cost on Equity (re) was subtracted from the ROE.
• The Abnormal ROEs were then discounted to present levels by using a standard NPV equation and
using the (re) as the discount rate.
• The sum of the discounted stream of ROE plus one, multiplied by the BV is what provides the
valuation for this model.
SUSTAINABLE EARNINGS MODEL
• Price is derived from the stock price used in order to calculate the value of equity which was taken
from Yahoo! Finance60
• EPS was taken from the Income Statements under the diluted income per share section.
and is the December 31, 2008 stock price of KO. The prices for other
previous years were obtained from the same source.
• DPS was obtained from the Statement of Shareholder’s Equity.
• BVPS is equal to the Book Value (BV) divided by the shares outstanding. These BV figures can be
calculated and obtained using figures from the Balance Sheets and the shares outstanding can be
found the Income Statements.
• The government bond yield was obtained fromthe U.S. Department of the Treasury61
60 Yahoo! (n.d.). Yahoo! Finance. The Coca-Cola Company (KO). Historical Prices. Retrieved January 8, 2010, from http://finance.yahoo.com/q/hp?s=KO
for the
December 31, 2008 bond yield.
61 U.S. Department of the Treasury (n.d.). Daily Treasury Yield Curve Rates 2008. Retrieved January 9, 2010, from http://www.ustreas.gov/offices/domestic
35
FORECASTING
36
DISCOUNTED CASH FLOW VALUATION METHOD
37
DISCOUNTED ABNORMAL EARNINGS VALUATION MODEL
38
DISCOUNTED ABNORMAL RETURN ON EQUITY RATIO VALUATION MODEL
39
SUSTAINABLE EARNINGS MODEL BASED ON HISTORICAL AVERAGES
40
5. ASSESSMENT OF SOLVENCY
5.1 CALCULATION OF 2008 ALTMAN’S Z
Altman’s Z, also known as the Z-score, is a model that uses five financial ratios to predict the
probability a company would go bankrupt within two years. It is a tool used to measure the health of a
company. Low Z-scores, lower than 1.8, indicate that there is a high chance a company will go bankrupt.
Based on the financial figures used, companies with scores higher than 3 have a low probability of a
company going bankrupt. Z-scores that are between 1.8 and 3 are considered to be in a grey area62
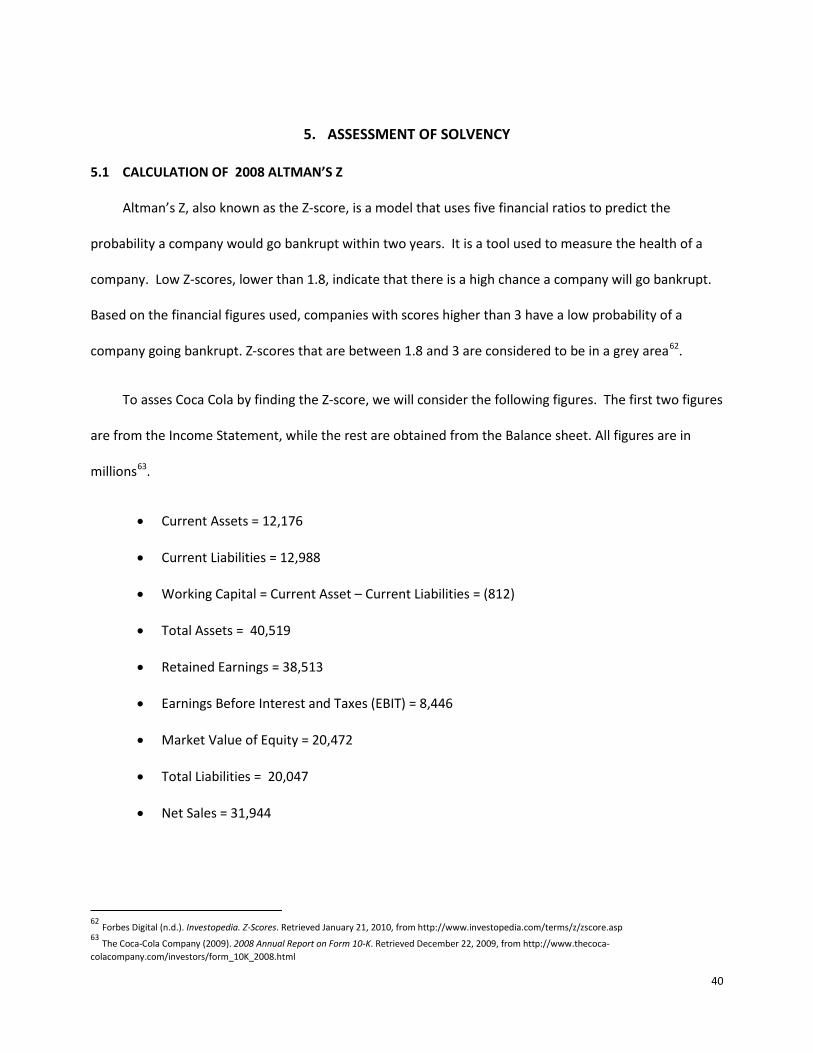
To asses Coca Cola by finding the Z-score, we will consider the following figures. The first two figures
are from the Income Statement, while the rest are obtained from the Balance sheet. All figures are in
millions
.
63
• Current Assets = 12,176
.
• Current Liabilities = 12,988
• Working Capital = Current Asset – Current Liabilities = (812)
• Total Assets = 40,519
• Retained Earnings = 38,513
• Earnings Before Interest and Taxes (EBIT) = 8,446
• Market Value of Equity = 20,472
• Total Liabilities = 20,047
• Net Sales = 31,944
62 Forbes Digital (n.d.). Investopedia. Z-Scores. Retrieved January 21, 2010, from http://www.investopedia.com/terms/z/zscore.asp 63 The Coca-Cola Company (2009). 2008 Annual Report on Form 10-K. Retrieved December 22, 2009, from http://www.thecoca-colacompany.com/investors/form_10K_2008.html
41
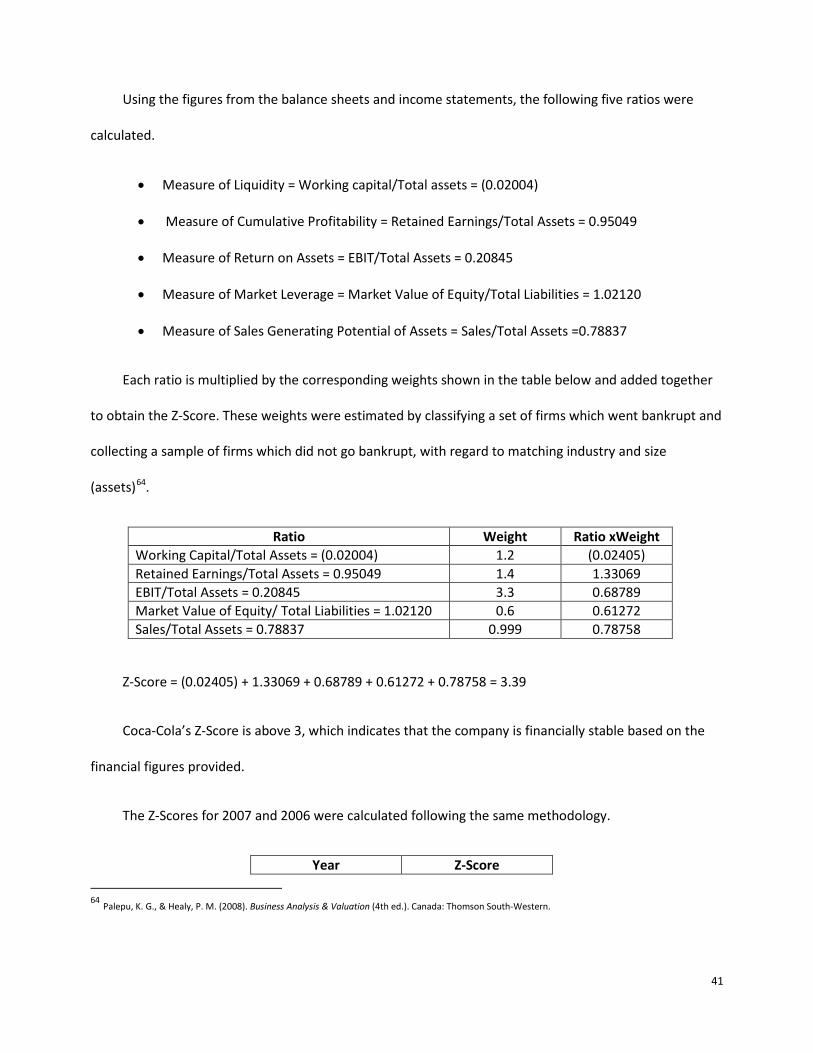
Using the figures from the balance sheets and income statements, the following five ratios were
calculated.
• Measure of Liquidity = Working capital/Total assets = (0.02004)
The ratios for 2007 and 2006 were calculated following the same methodology.
Ratio 2008 2007 2006 Pre-Tax Interest Coverage 19.28311 15.90351 28.67273 Pre-Tax Return on Long Term Capital 0.363222 0.289837 0.345947 Working Capital to Total Debt 0.781455 0.756744 1.327969 Long Term Debt to Total Capital 0.093372 0.105461 0.061111
43
The value of the ratios are then compared to the values in Debt Rating table and categorized with its
corresponding debt rating.
Debt Ratings: Median Financial Ratios by Category65
S&P Debt Rating
Pre-Tax Interest Coverage
Pre-Tax Return on Long Term
Debt
Working Capital to Total Debt
Long Term Debt to Total Capital
AAA 31.4 25.3% 118% -3% AA 16.7 32.2 85 14 A 9.2 20.2 52 27
CCC 0.2 2.9 1 116 CC -1.2 -6.9 -5 100 D -0.4 -18.1 15 93
Coca-Cola’s Rating 2008
AA AA AA AA
Coca-Cola’s Rating 2007
AA AA AA AA
Coca-Cola’s Rating 2006
AAA AA AAA AA
Therefore, Coca-Cola’s estimated Bond valuation is AA for the past three years. This means that
Coca-Cola is doing quite well, has very strong earnings and cash flow such that debt is negative66
5.3 ACTUAL BOND RATING
.
According to Standard&Poor’s, the Coca Cola Company’s credit ratings are as follows67
Issuer Credit Rating
:
Ratings Rating Date Credit
Watch/Outlook
Credit Watch/Outlook
Date Foreign Long Term A+ 21-Dec-99 Stable 05-Oct-09 Foreign Short Term A-1 21-Dec-99 Local Long Term A+ 21-Dec-99 Stable 05-Oct-09 Local Short Term A-1 21-Dec-99
65 Palepu, K. G., & Healy, P. M. (2008). Business Analysis & Valuation (4th ed.). Canada: Thomson South-Western. 66 Ibid 67 Standard & Poor's (n.d.). Ratings: Coca-Cola Co. (The). Retrieved January 21, 2010, from http://www.standardandpoors.com/prot/ratings/entity-ratings/en/us/?entityID=269067§orCode=CORP
44
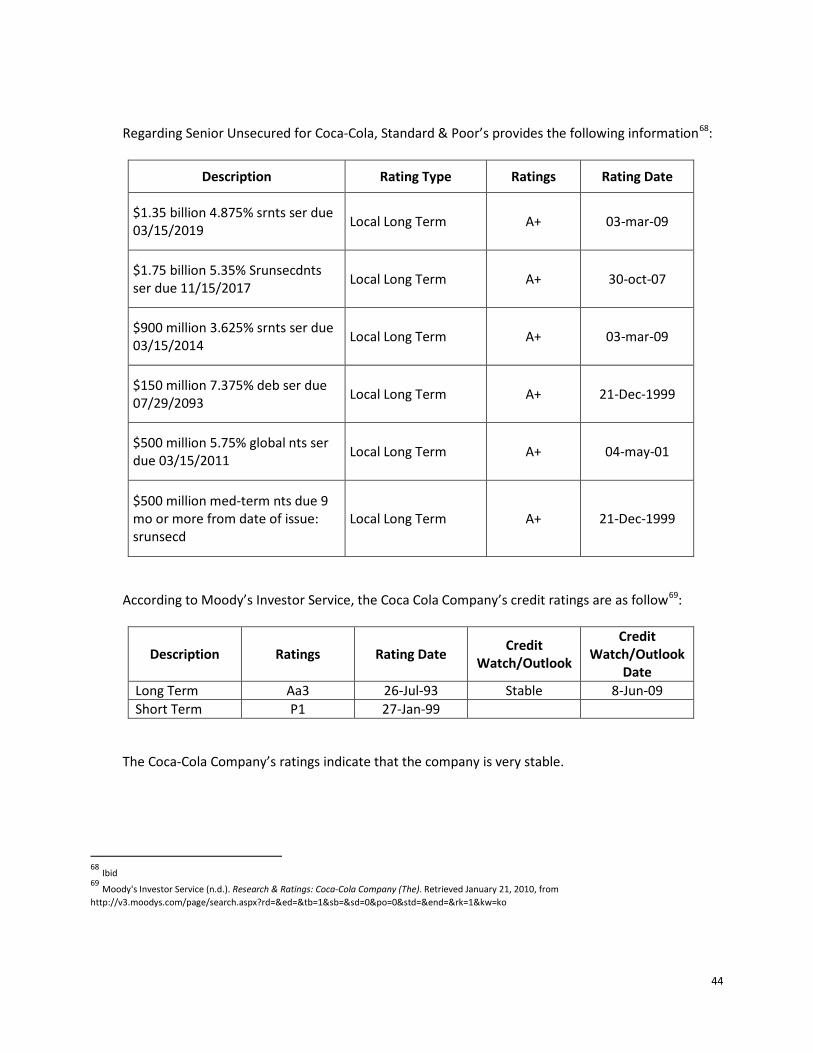
Regarding Senior Unsecured for Coca-Cola, Standard & Poor’s provides the following information68
Description
:
Rating Type Ratings Rating Date
$1.35 billion 4.875% srnts ser due 03/15/2019
Local Long Term A+ 03-mar-09
$1.75 billion 5.35% Srunsecdnts ser due 11/15/2017
Local Long Term A+ 30-oct-07
$900 million 3.625% srnts ser due 03/15/2014
Local Long Term A+ 03-mar-09
$150 million 7.375% deb ser due 07/29/2093
Local Long Term A+ 21-Dec-1999
$500 million 5.75% global nts ser due 03/15/2011
Local Long Term A+ 04-may-01
$500 million med-term nts due 9 mo or more from date of issue: srunsecd
Local Long Term A+ 21-Dec-1999
According to Moody’s Investor Service, the Coca Cola Company’s credit ratings are as follow69
Description
:
Ratings Rating Date Credit
Watch/Outlook
Credit Watch/Outlook
Date Long Term Aa3 26-Jul-93 Stable 8-Jun-09 Short Term P1 27-Jan-99
The Coca-Cola Company’s ratings indicate that the company is very stable.
68 Ibid 69 Moody's Investor Service (n.d.). Research & Ratings: Coca-Cola Company (The). Retrieved January 21, 2010, from http://v3.moodys.com/page/search.aspx?rd=&ed=&tb=1&sb=&sd=0&po=0&std=&end=&rk=1&kw=ko