1249
THE COLLECTIVE INVESTMENT FUNDS OF FIRST MERCANTILE TRUST COMPANY Financial Statements December 31, 2015

THE COLLECTIVE INVESTMENT FUNDS OF FIRST MERCANTILE TRUST COMPANY
Financial Statements December 31, 2015

THE COLLECTIVE INVESTMENT FUNDS OF FIRST MERCANTILE TRUST COMPANY
Table of Contents
Page
Independent Auditor's Report 6-7
Financial Statements
Target Risk Allocation
FMT LifeStyle Aggressive Growth Fund 8-17FMT LifeStyle Balanced Growth Fund 18-27FMT LifeStyle Income and Conservative Growth Fund 28-37FMT LifeStyle Moderately Aggressive Growth Fund 38-47FMT LifeStyle Moderately Conservative Growth Fund 48-57
Target Date Allocation FMT LifeStyle Target Date 2010 Fund 58-66FMT LifeStyle Target Date 2020 Fund 67-75FMT LifeStyle Target Date 2030 Fund 76-84FMT LifeStyle Target Date 2040 Fund 85-93FMT LifeStyle Target Date 2050 Fund 94-102FMT/Vanguard Target Retirement 2015 Fund 103-108FMT/Vanguard Target Retirement 2020 Fund 109-114FMT/Vanguard Target Retirement 2025 Fund 115-120FMT/Vanguard Target Retirement 2030 Fund 121-126FMT/Vanguard Target Retirement 2035 Fund 127-132FMT/Vanguard Target Retirement 2040 Fund 133-138FMT/Vanguard Target Retirement 2045 Fund 139-144FMT/Vanguard Target Retirement 2050 Fund 145-150FMT/Vanguard Target Retirement 2055 Fund 151-156FMT/Vanguard Target Retirement 2060 Fund 157-162FMT/Vanguard Target Retirement Income Fund 163-168
Money Market Funds
FMT/SSgA Prime Money Market Fund 169-174FMT/SSgA U.S. Treasury Money Market Fund 175-180
Stable Value
FMT/FFTW Income Plus Fund 181-187FMT/Wells Fargo Stable Value Fund 188-194
THE COLLECTIVE INVESTMENT FUNDS OF FIRST MERCANTILE TRUST COMPANY
Table of Contents (Continued)
Page
Financial Statements (continued)
Fixed Income
FMT High Yield Bond (Federated) Fund 195-206FMT U.S. Core Bond (Highmark) Fund 207-218FMT U.S. Government Securities (C.S. McKee) Fund 219-227FMT/American Funds Bond Fund of America Fund 228-233FMT/Delaware High Yield Opportunity Fund 234-239FMT/DFA 1 Year Fixed Income Fund 240-245FMT/DFA Five Year Global Fixed Income Fund 246-251FMT/DFA Intermediate Term Extended Quality Portfolio Fund 252-257FMT/DFA Short Term Extended Quality Institutional Fund 258-263FMT/DFA Two Year Global Fixed Income Fund 264-269FMT/FFTW U.S. TIPS Fund 270-273FMT/Global Diversified Bond Fund 274-279FMT/Loomis Sayles Bond Fund 280-285FMT/MetWest Total Return Fund 286-291FMT/PIMCO High Yield Fund 292-297FMT/PIMCO Total Return Institutional Fund 298-303FMT/T. Rowe Price International Bond Fund 304-309FMT/Templeton International Bond Fund 310-315FMT/Vanguard GNMA Fund 316-321FMT/Vanguard Inflation Protected Securities Fund 322-327FMT/Vanguard Total Bond Market Index Fund 328-333
Balanced
FMT Balanced Opportunities (Aristotle) Fund 334-342FMT/American Funds Capital Income Builder Fund 343-348FMT/DFA Global 60/40 Fund 349-354FMT/Dodge & Cox Balanced Fund 355-360FMT/Vanguard Balanced Index Fund 361-366FMT/Vanguard Wellesley Income Fund 367-372
Equity
FMT Aggressive International Growth (WCM) Fund 373-380FMT Diversified International (Thomas White) Fund 381-390FMT Equity Income (Sterling) Fund 391-398FMT Global Diversified Equity Fund 399-407
THE COLLECTIVE INVESTMENT FUNDS OF FIRST MERCANTILE TRUST COMPANY
Table of Contents (Continued)
Page
Financial Statements (continued)
Equity (continued)
FMT International Growth (WCM) Fund 408-415FMT International Value Opportunities (Harris) Fund 416-424FMT Large Cap Classic Value (C.S. McKee) Fund 425-432FMT Large Cap Concentrated Equity (Cornerstone) Fund 433-440FMT Large Cap Diversified Equity Fund 441-447FMT Large Cap Focus Growth (Jackson Square) Fund 448-455FMT Large Cap Fundamental Growth (Wellington) Fund 456-465FMT Large Cap GARP (Argent) Fund 466-473FMT Large Cap Intrinsic Value (MetWest) Fund 474-481FMT Large Cap Opportunities (Smith Group) Fund 482-489FMT Mid Cap Growth (Disciplined Growth Investors) Fund 490-497FMT Mid Cap Value (NewSouth) Fund 498-505FMT Small Cap Aggressive Growth (CCI/Cupps) Fund 506-516FMT Small Cap Diversified Equity (Delaware) Fund 517-527FMT Small Cap Intrinsic Value (MetWest) Fund 528-537FMT Small Cap Value (Opus) Fund 538-546FMT SMID Diversified Growth (Frontier/Geneva) Fund 547-558FMT SMID Value (Fisher Investments) Fund 559-567FMT Special Opportunities (Sterling) Fund 568-575FMT U.S. Growth Opportunities (Zevenbergen) Fund 576-583FMT/Alger Spectra Fund 584-589FMT/American Beacon Large Cap Value Institutional Fund 590-595FMT/American Beacon Small Cap Value Institutional Fund 596-601FMT/American Century Mid Cap Value Fund 602-607FMT/American Funds Amcap Fund 608-613FMT/American Funds Europacific Fund 614-619FMT/American Funds Growth Fund of America Fund 620-625FMT/American Funds New Perspective Fund 626-631FMT/American Funds Small Cap World Fund 632-637FMT/American Funds Washington Mutual Fund 638-643FMT/Artisan International Fund 644-649FMT/Columbia Acorn Z Fund 650-655FMT/DFA Emerging Markets Core Equity Fund 656-661FMT/DFA Emerging Markets I Fund 662-667FMT/DFA Emerging Markets Small Cap Fund 668-673

THE COLLECTIVE INVESTMENT FUNDS OF FIRST MERCANTILE TRUST COMPANY
Table of Contents (Continued)
Page
Financial Statements (continued)
Equity (continued)
FMT/DFA Emerging Markets Value Fund 674-679FMT/DFA Global Equity Fund 680-685FMT/DFA International Core Equity Fund 686-691FMT/DFA International Small Cap Value Fund 692-697FMT/DFA International Small Company Fund 698-703FMT/DFA International Value Fund 704-709FMT/DFA U.S. Core Equity I Fund 710-715FMT/DFA U.S. Core Equity II Fund 716-721FMT/DFA U.S. Large Cap Value Fund 722-727FMT/DFA U.S. Large Cap Value III Fund 728-733FMT/DFA U.S. Large Company Fund 734-739FMT/DFA U.S. Micro Cap Fund 740-745FMT/DFA U.S. Small Cap Portfolio Fund 746-751FMT/DFA U.S. Small Cap Value Fund 752-757FMT/DFA U.S. Targeted Value Fund 758-763
FMT/DFA U.S. Vector Equity Fund 764-769FMT/Dodge & Cox International Fund 770-775FMT/Dodge & Cox Stock Fund 776-781FMT/Domini Social Equity Fund 782-787FMT/Fifth Third Equity Index Fund 788-793FMT/Franklin Mutual Global Discovery Fund 794-799FMT/Harbor Capital Appreciation Fund 800-805FMT/International Equity Index Fund 806-811FMT/iShares MSCI EAFE Index ETF 812-817FMT/iShares Russell 2000 Growth Index ETF 818-823FMT/iShares Russell 2000 Index ETF 824-829FMT/iShares Russell 2000 Value Index ETF 830-835FMT/iShares Russell 3000 Index ETF 836-841FMT/iShares Russell Mid-Cap Growth Index ETF 842-847FMT/iShares Russell Mid-Cap Value Index ETF 848-853FMT/Longleaf Partners Fund 854-859FMT/Longleaf Small Cap Fund 860-865FMT/Meridian Growth Fund 866-871FMT/Morgan Stanley Institutional Small Cap Growth Fund 872-877FMT/Neuberger Berman Genesis Trust Fund 878-883

THE COLLECTIVE INVESTMENT FUNDS OF FIRST MERCANTILE TRUST COMPANY
Table of Contents (Continued)
Page
Financial Statements (continued)
Equity (continued)
FMT/SPDR S and P 500 Index ETF 884-889FMT/T. Rowe Price Midcap Growth Fund 890-895FMT/T. Rowe Price Value Fund 896-901FMT/Third Avenue Value Fund 902-907FMT/Thornburg International Equity Fund 908-913FMT/Vanguard 500 Index Fund 914-919FMT/Vanguard Emerging Markets ETF 920-925FMT/Vanguard Growth Index Fund 926-931FMT/Vanguard Mid Cap Index Fund 932-937FMT/Vanguard Selected Value Fund 938-943FMT/Vanguard Small Cap Stock Index Fund 944-949FMT/Vanguard Value Index Fund 950-955FMT/Vanguard Windsor II Fund 956-961FMT/Virtus Emerging Markets Opportunity Fund 962-967FMT/ Equity Income Index 968-973FMT/Wells Fargo Advantage Discovery Fund 974-979
Alternative
FMT Global Infrastructure (Miller/Howard) Fund 980-987FMT/BlackRock Global Allocation Fund 988-993FMT/DFA Commodity Strategy Portfolio Fund 994-999FMT/DFA International Real Estate Securities Fund 1000-1005FMT/DFA Real Estate Securities Fund 1006-1011FMT/First Eagle Gold Fund 1012-1017FMT/Gateway Fund 1018-1023FMT/Ivy Global Natural Resources Fund 1024-1029FMT/Neuberger Berman REIT Fund 1030-1035FMT/Nuveen Real Estate Securities Fund 1036-1041FMT/PIMCO All Asset All Authority Fund 1042-1047FMT/SPDR Energy Sector ETF 1048-1053FMT/SPDR Gold ETF 1054-1059FMT/SPDR Health Care Sector ETF 1060-1065FMT/SPDR Technology Sector ETF 1066-1071FMT/T. Rowe Price Financial Services Fund 1072-1077FMT/T. Rowe Price Health Sciences Fund 1078-1083
Notes to Financial Statements 1084-1089

MTEMMayer Hoffman McCann P.C.
An lndependent CPA Firm
Clark Tower, 5100 Poplar Avenue, 30th Floor. Memphis, Tennessee 38137Main: 901.685.5575 r Fax: 901.685.5583 r www.mhmcpa.com
lndependent Auditor's Report
To the TrusteeThe Collective Investment Funds ofFirst Mercantile Trust CompanyMemphis, Tennessee
We have audited the accompanying financial statements for each of the one-hundred and fifty-ninecollective trust funds comprising The Collective lnvestment Funds of First Mercantile Trust Company,which comprise the statements of assets and liabilities, including the schedules of investments andspecific fund disclosures, as of December 31, 2015, and thJrelated statements of operations,changes in net assets, schedules of participant transactions, and financiat highlights foi the yearthen ended, and the related notes to the financial statements.
M a n ag emenú's Resp o nsi b i I ity fo r th e F i n an c i at sfaúemenfs
Management is responsible for the preparatíon and fair presentatÍon of these financial statements,sc.hedules of participant transactions, and financial highlights in accordance with accountingprinciples generally accepted in the United States óf Ámerica; this includes the design,implementation, and maintenance of internal control relevant to the preparation and fair presentationof financial statements, schedules of participant transactions, and î¡nánc¡al highlights that are freefrom material misstatement, whether due to fraud or error.
Auditor's Respo nsi bi I ity
Our responsibility is to express an opinion on these financial statements, schedules of participanttransactions, and financial highlights based on our audits. We conducted our audits in aðcordancewith auditing standards generally accepted in the United States of America. Those standards rãquirethat we plan and perform the audíts to obtain reasonable assurance about whether the financialstatements, schedules of participant transactions, and financial highlights are free from materialmisstatement.
fn .aud1t involves performing procedures to obtain audit evidence about the amounts and disclosuresin the financial statements. The procedures selected depend on the auditor's judgment, includingthe assessment of the risks of material misstatement of the financial statemeñts,-whether due tofraud or error. ln making those risk assessments, the auditor considers internal control relevant tothe enlity's preparation and fair presentation of the financial statements in order to design auditprocedures that are appropriate in the circumstances, but not for the purpose of expres-sing anopinion on the effectiveness of the entity's internal control. Accordingly, wä express no such opiñion.An audit also include.s. evaluating the appropriateness of accõunting policies used and thereasonableness of significant accounting estimates made by managemeni as well as evaluating theoverall presentation of the financial statements.
{*orrron Member of Kreston lnternat¡onal - a global network of ¡ndependent account¡ng firms

We believe that the audit evidence we have obtained is sufficient and appropriate to provide a basisfor our audit opinion.
Opinion
ln our opinion, the financial statements, schedules of participant transactions, and financial highlights¡eferred to above present fairly, in all material respects, the financial position of each of tñe one-hundred and fifty-nine funds comprising The Collective lnvestment Funds of First Mercantile TrustCompany as of December 31 , 2015, and the results of each Fund's operations, changes in their netassets, their participant transactions, and their financial highlights for the year tñen ended, inaccordance with accounting principles generally accepted in the United States oï Ame¡ca.
ryry-{ß-^Vrh,,(cMemphis, TennesseeJune 10, 2016
7

FMT LifeStyle Aggressive Growth Fund

THE COLLECTIVE INVESTMENT FUNDS OF FIRST MERCANTILE TRUST COMPANY FMT LifeStyle Aggressive Growth Fund
Statement of Assets and Liabilities December 31, 2015
The accompanying notes are an integral part of these financial statements.
Assets Investments in securities, at fair value $ 118,154,238 Liabilities Trustee fees 66,198 Net assets $ 118,088,040 Components of net assets
Units of
Participation NAV
per Unit Net
Assets Class R1 LifeStyle 3,984,330 $ 14.8150 $ 59,027,953Class R2 LifeStyle 329,677 $ 13.9704 4,605,711Class R3 LifeStyle 997,190 $ 13.8936 13,854,537Class R4 LifeStyle 1,551,357 $ 13.7649 21,354,295Class R5 LifeStyle 569,842 $ 13.7070 7,810,811Class R6 LifeStyle 411,309 $ 14.2775 5,872,454Class R7 LifeStyle 269,410 $ 13.6113 3,667,027Class R8 LifeStyle 135,726 $ 13.9638 1,895,252
$ 118,088,040
8
THE COLLECTIVE INVESTMENT FUNDS OF FIRST MERCANTILE TRUST COMPANY FMT LifeStyle Aggressive Growth Fund
Statement of Operations For the Year Ended December 31, 2015
The accompanying notes are an integral part of these financial statements.
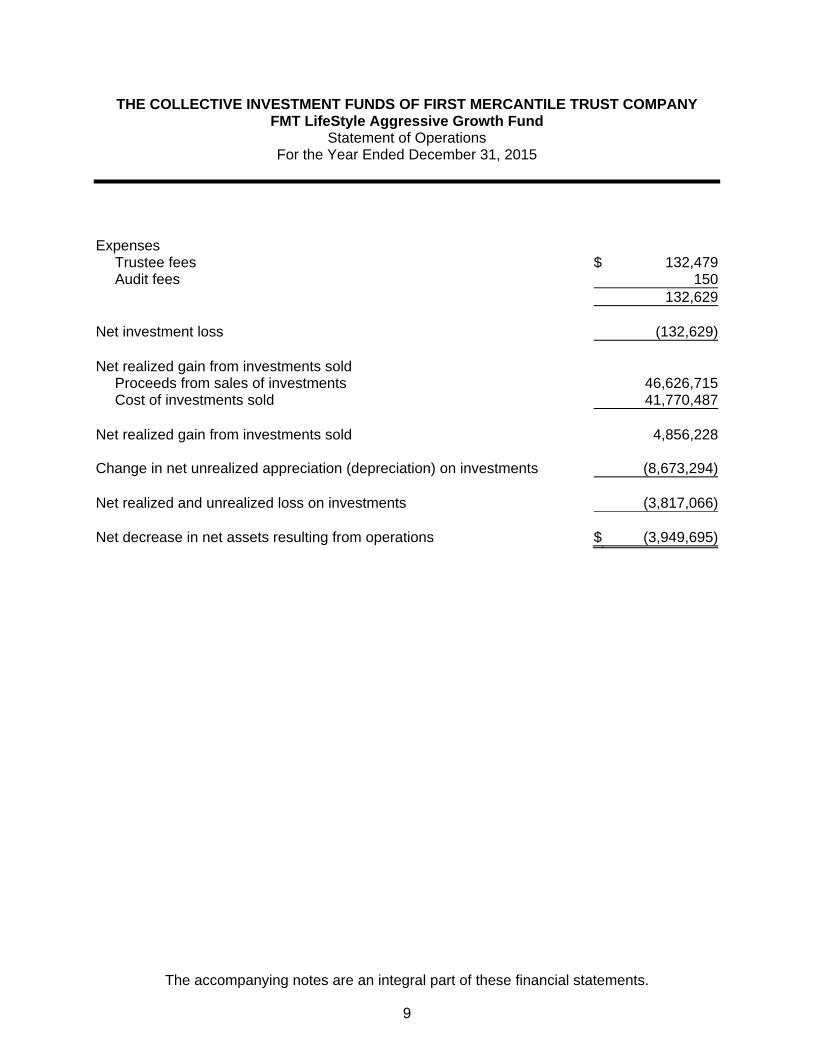
Expenses
Trustee fees $ 132,479Audit fees 150
132,629 Net investment loss (132,629) Net realized gain from investments sold
Proceeds from sales of investments 46,626,715Cost of investments sold 41,770,487
Net realized gain from investments sold 4,856,228 Change in net unrealized appreciation (depreciation) on investments (8,673,294) Net realized and unrealized loss on investments (3,817,066) Net decrease in net assets resulting from operations $ (3,949,695)
9
THE COLLECTIVE INVESTMENT FUNDS OF FIRST MERCANTILE TRUST COMPANY FMT LifeStyle Aggressive Growth Fund
Statement of Changes in Net Assets For the Year Ended December 31, 2015
The accompanying notes are an integral part of these financial statements.
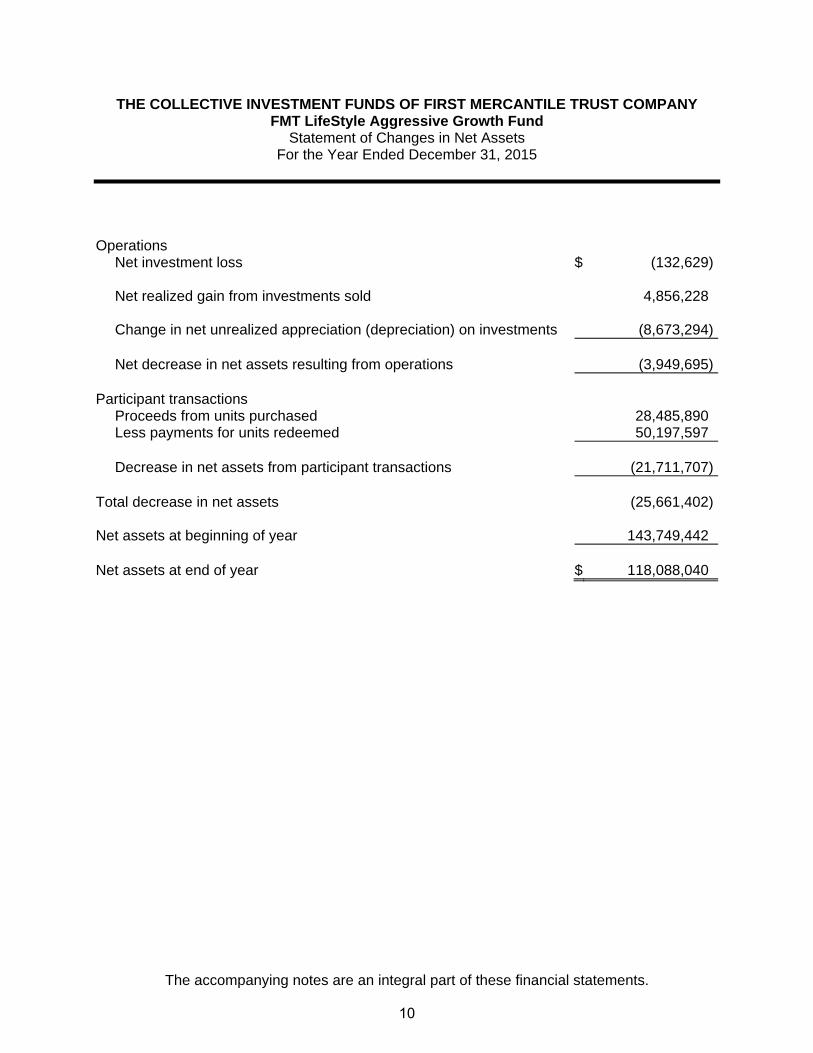
Operations
Net investment loss $ (132,629)
Net realized gain from investments sold 4,856,228
Change in net unrealized appreciation (depreciation) on investments (8,673,294)
Net decrease in net assets resulting from operations (3,949,695) Participant transactions
Proceeds from units purchased 28,485,890Less payments for units redeemed 50,197,597
Decrease in net assets from participant transactions (21,711,707)
Total decrease in net assets (25,661,402) Net assets at beginning of year 143,749,442 Net assets at end of year $ 118,088,040
10
THE COLLECTIVE INVESTMENT FUNDS OF FIRST MERCANTILE TRUST COMPANY FMT LifeStyle Aggressive Growth Fund
Schedule of Investments and Specific Fund Disclosures December 31, 2015
The accompanying notes are an integral part of these financial statements.
Investments Cost Fair Value ____________ ____________
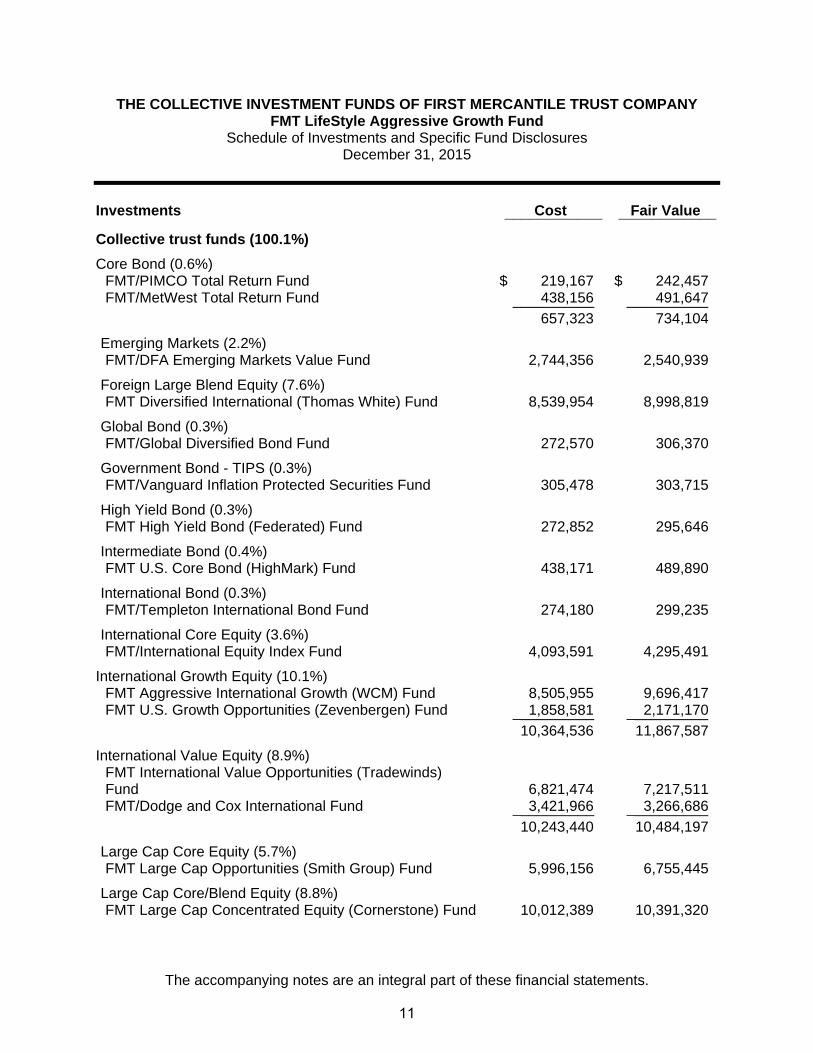
Collective trust funds (100.1%)
Core Bond (0.6%) FMT/PIMCO Total Return Fund $ 219,167 $ 242,457 FMT/MetWest Total Return Fund 438,156 491,647 __________ __________ 657,323 734,104
Emerging Markets (2.2%) FMT/DFA Emerging Markets Value Fund 2,744,356 2,540,939
Foreign Large Blend Equity (7.6%) FMT Diversified International (Thomas White) Fund 8,539,954 8,998,819
Global Bond (0.3%) FMT/Global Diversified Bond Fund 272,570 306,370
Government Bond - TIPS (0.3%) FMT/Vanguard Inflation Protected Securities Fund 305,478 303,715
High Yield Bond (0.3%) FMT High Yield Bond (Federated) Fund 272,852 295,646
Intermediate Bond (0.4%) FMT U.S. Core Bond (HighMark) Fund 438,171 489,890
International Bond (0.3%) FMT/Templeton International Bond Fund 274,180 299,235
International Core Equity (3.6%) FMT/International Equity Index Fund 4,093,591 4,295,491
International Growth Equity (10.1%) FMT Aggressive International Growth (WCM) Fund 8,505,955 9,696,417 FMT U.S. Growth Opportunities (Zevenbergen) Fund 1,858,581 2,171,170 __________ __________ 10,364,536 11,867,587
International Value Equity (8.9%)
FMT International Value Opportunities (Tradewinds) Fund 6,821,474 7,217,511
FMT/Dodge and Cox International Fund 3,421,966 3,266,686 __________ __________ 10,243,440 10,484,197
Large Cap Core Equity (5.7%) FMT Large Cap Opportunities (Smith Group) Fund 5,996,156 6,755,445
Large Cap Core/Blend Equity (8.8%) FMT Large Cap Concentrated Equity (Cornerstone) Fund 10,012,389 10,391,320
11
THE COLLECTIVE INVESTMENT FUNDS OF FIRST MERCANTILE TRUST COMPANY FMT LifeStyle Aggressive Growth Fund
Schedule of Investments and Specific Fund Disclosures (continued) December 31, 2015
The accompanying notes are an integral part of these financial statements.
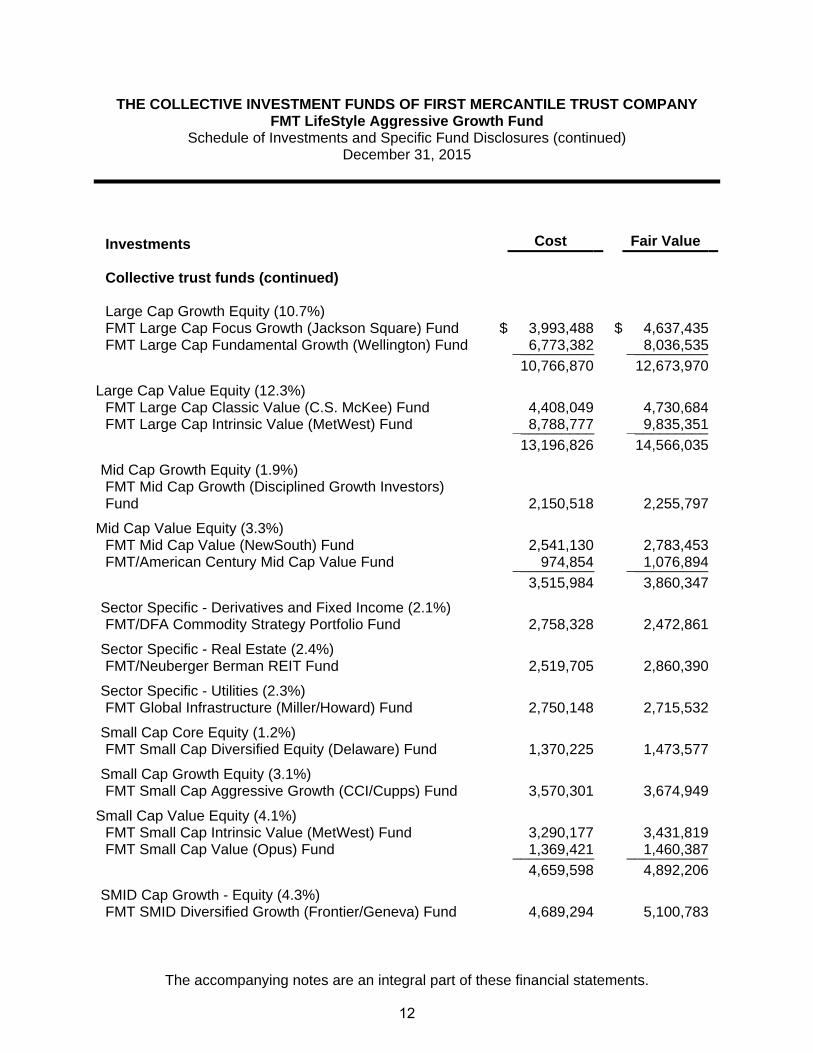
Investments Cost Fair Value Collective trust funds (continued)
Large Cap Growth Equity (10.7%)
FMT Large Cap Focus Growth (Jackson Square) Fund $ 3,993,488 $ 4,637,435 FMT Large Cap Fundamental Growth (Wellington) Fund 6,773,382 8,036,535 __________ __________ 10,766,870 12,673,970
Large Cap Value Equity (12.3%) FMT Large Cap Classic Value (C.S. McKee) Fund 4,408,049 4,730,684 FMT Large Cap Intrinsic Value (MetWest) Fund 8,788,777 9,835,351 __________ __________ 13,196,826 14,566,035
Mid Cap Growth Equity (1.9%)
FMT Mid Cap Growth (Disciplined Growth Investors) Fund 2,150,518 2,255,797
Mid Cap Value Equity (3.3%) FMT Mid Cap Value (NewSouth) Fund 2,541,130 2,783,453 FMT/American Century Mid Cap Value Fund 974,854 1,076,894 __________ __________ 3,515,984 3,860,347
Sector Specific - Derivatives and Fixed Income (2.1%) FMT/DFA Commodity Strategy Portfolio Fund 2,758,328 2,472,861
Sector Specific - Real Estate (2.4%) FMT/Neuberger Berman REIT Fund 2,519,705 2,860,390
Sector Specific - Utilities (2.3%) FMT Global Infrastructure (Miller/Howard) Fund 2,750,148 2,715,532
Small Cap Core Equity (1.2%) FMT Small Cap Diversified Equity (Delaware) Fund 1,370,225 1,473,577
Small Cap Growth Equity (3.1%) FMT Small Cap Aggressive Growth (CCI/Cupps) Fund 3,570,301 3,674,949
Small Cap Value Equity (4.1%) FMT Small Cap Intrinsic Value (MetWest) Fund 3,290,177 3,431,819 FMT Small Cap Value (Opus) Fund 1,369,421 1,460,387 __________ __________ 4,659,598 4,892,206
SMID Cap Growth - Equity (4.3%) FMT SMID Diversified Growth (Frontier/Geneva) Fund 4,689,294 5,100,783
12

THE COLLECTIVE INVESTMENT FUNDS OF FIRST MERCANTILE TRUST COMPANY FMT LifeStyle Aggressive Growth Fund
Schedule of Investments and Specific Fund Disclosures (continued) December 31, 2015
The accompanying notes are an integral part of these financial statements.
Investments Cost Fair Value Collective trust funds (continued) SMID Cap Value – Equity (3.3%)
FMT SMID Value (Fisher Investments) Fund $ 3,504,672 $ 3,845,033 __________ __________ Total Investments $ 109,667,465 $ 118,154,238 __________ ____________________ __________
13
THE COLLECTIVE INVESTMENT FUNDS OF FIRST MERCANTILE TRUST COMPANY FMT LifeStyle Aggressive Growth Fund
Schedule of Investments and Specific Fund Disclosures (continued) December 31, 2015
The accompanying notes are an integral part of these financial statements.
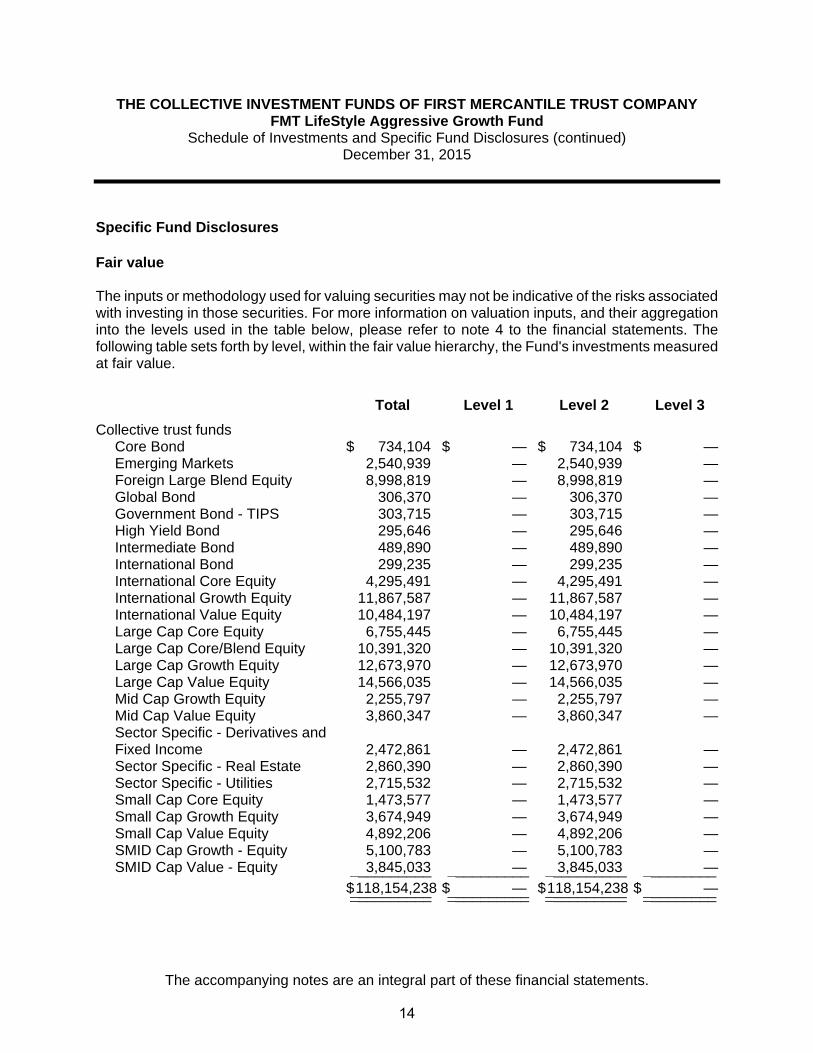
Specific Fund Disclosures Fair value The inputs or methodology used for valuing securities may not be indicative of the risks associated with investing in those securities. For more information on valuation inputs, and their aggregation into the levels used in the table below, please refer to note 4 to the financial statements. The following table sets forth by level, within the fair value hierarchy, the Fund's investments measured at fair value.
Total Level 1 Level 2 Level 3
Collective trust funds Core Bond $ 734,104 $ — $ 734,104 $ —Emerging Markets 2,540,939 — 2,540,939 —Foreign Large Blend Equity 8,998,819 — 8,998,819 —Global Bond 306,370 — 306,370 —Government Bond - TIPS 303,715 — 303,715 —High Yield Bond 295,646 — 295,646 —Intermediate Bond 489,890 — 489,890 —International Bond 299,235 — 299,235 —International Core Equity 4,295,491 — 4,295,491 —International Growth Equity 11,867,587 — 11,867,587 —International Value Equity 10,484,197 — 10,484,197 —Large Cap Core Equity 6,755,445 — 6,755,445 —Large Cap Core/Blend Equity 10,391,320 — 10,391,320 —Large Cap Growth Equity 12,673,970 — 12,673,970 —Large Cap Value Equity 14,566,035 — 14,566,035 —Mid Cap Growth Equity 2,255,797 — 2,255,797 —Mid Cap Value Equity 3,860,347 — 3,860,347 —Sector Specific - Derivatives and Fixed Income 2,472,861 — 2,472,861 —Sector Specific - Real Estate 2,860,390 — 2,860,390 —Sector Specific - Utilities 2,715,532 — 2,715,532 —Small Cap Core Equity 1,473,577 — 1,473,577 —Small Cap Growth Equity 3,674,949 — 3,674,949 —Small Cap Value Equity 4,892,206 — 4,892,206 —SMID Cap Growth - Equity 5,100,783 — 5,100,783 —SMID Cap Value - Equity 3,845,033 — 3,845,033 —__________ __________ __________ _________
$118,154,238 $ — $118,154,238 $ —__________ __________ __________ ___________________ __________ __________ _________
14

THE COLLECTIVE INVESTMENT FUNDS OF FIRST MERCANTILE TRUST COMPANY FMT LifeStyle Aggressive Growth Fund
Schedule of Investments and Specific Fund Disclosures (continued) December 31, 2015
The accompanying notes are an integral part of these financial statements.
The estimated fair value of the underlying collective trust funds is net asset value. The use of net asset value as fair value is deemed appropriate as the collective trust funds do not have a finite life, no unfunded commitments relating to this type of investment, or no significant restrictions on redemptions. Investment transactions The aggregate cost of purchases of investment securities and proceeds from sales of investment securities (other than temporary cash investments) totaled $24,848,577 and $46,626,715, respectively, for the year ended December 31, 2015. Class-specific expenses Class-specific trustee fees for the year ended December 31, 2015 were as follows: Class R1 LifeStyle $ 39,695 Class R2 LifeStyle 5,037 Class R3 LifeStyle 16,578 Class R4 LifeStyle 31,818 Class R5 LifeStyle 14,760 Class R6 LifeStyle 11,784 Class R7 LifeStyle 8,112 Class R8 LifeStyle 4,695 $ 132,479
15
THE COLLECTIVE INVESTMENT FUNDS OF FIRST MERCANTILE TRUST COMPANY FMT LifeStyle Aggressive Growth Fund
Schedule of Participant Transactions December 31, 2015
The accompanying notes are an integral part of these financial statements.
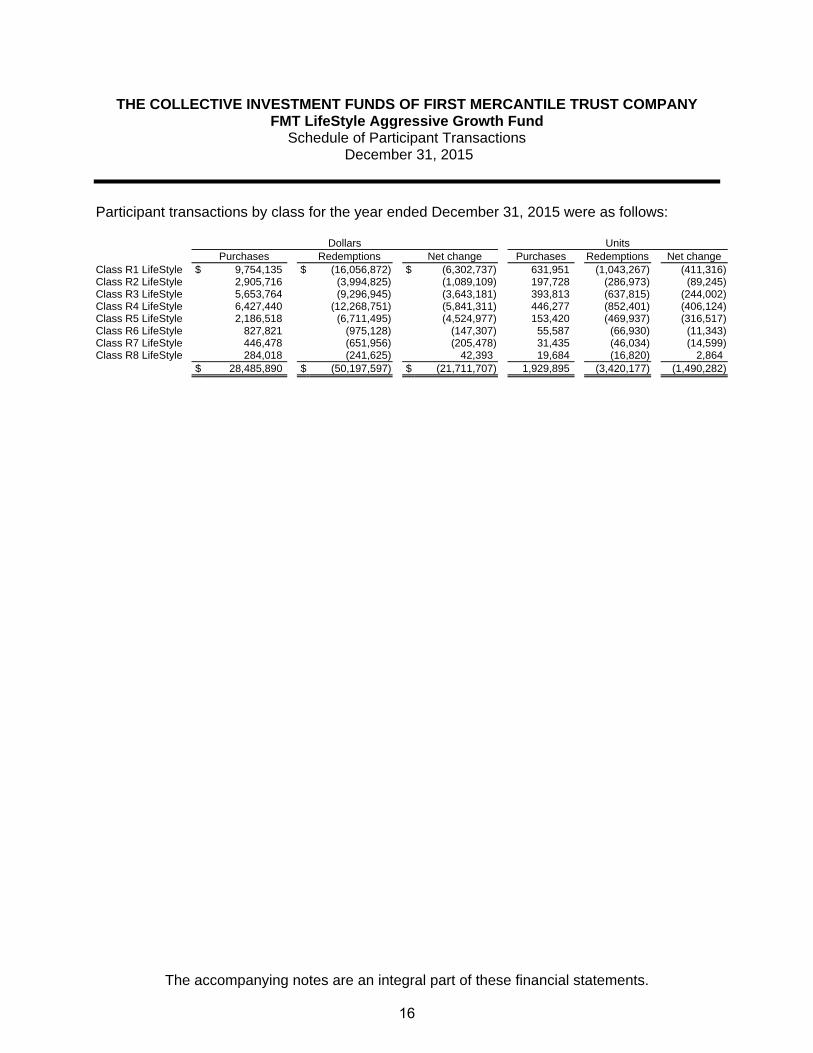
Participant transactions by class for the year ended December 31, 2015 were as follows: Dollars Units Purchases Redemptions Net change Purchases Redemptions Net change Class R1 LifeStyle $ 9,754,135 $ (16,056,872) $ (6,302,737) 631,951 (1,043,267) (411,316)Class R2 LifeStyle 2,905,716 (3,994,825) (1,089,109) 197,728 (286,973) (89,245)Class R3 LifeStyle 5,653,764 (9,296,945) (3,643,181) 393,813 (637,815) (244,002)Class R4 LifeStyle 6,427,440 (12,268,751) (5,841,311) 446,277 (852,401) (406,124)Class R5 LifeStyle 2,186,518 (6,711,495) (4,524,977) 153,420 (469,937) (316,517)Class R6 LifeStyle 827,821 (975,128) (147,307) 55,587 (66,930) (11,343)Class R7 LifeStyle 446,478 (651,956) (205,478) 31,435 (46,034) (14,599)Class R8 LifeStyle 284,018 (241,625) 42,393 19,684 (16,820) 2,864 $ 28,485,890 $ (50,197,597) $ (21,711,707) 1,929,895 (3,420,177) (1,490,282)
16

THE COLLECTIVE INVESTMENT FUNDS OF FIRST MERCANTILE TRUST COMPANY FMT LifeStyle Aggressive Growth Fund
Financial Highlights December 31, 2015
The accompanying notes are an integral part of these financial statements.
Change in Net Asset Value Resulting from Operations Ratios (to average net
assets)
NAV per Unit, Beginning of
Period
Net Investment
Income (Loss)(a)(b)
Net Realized and Unrealized
Gain (Loss) from
Investments(a)
Total from Investment Activities
NAV per Unit, End of
Period Total
Return Expenses(b)
Net Investment
Income (Loss)(b)
Class R1 LifeStyle $ 15.2656 $ (0.0096) $ (0.4410) $ (0.4506) $ 14.8150 (2.95)% (0.06)% (0.06)% Class R2 LifeStyle 14.4278 (0.0118) (0.4456) (0.4574) 13.9704 (3.17)% (0.08)% (0.08)% Class R3 LifeStyle 14.3727 (0.0151) (0.4640) (0.4791) 13.8936 (3.33)% (0.10)% (0.10)% Class R4 LifeStyle 14.2617 (0.0195) (0.4773) (0.4968) 13.7649 (3.48)% (0.14)% (0.14)% Class R5 LifeStyle 14.2267 (0.0193) (0.5004) (0.5197) 13.7070 (3.65)% (0.13)% (0.13)% Class R6 LifeStyle 14.8452 (0.0278) (0.5399) (0.5677) 14.2775 (3.82)% (0.19)% (0.19)% Class R7 LifeStyle 14.1776 (0.0305) (0.5358) (0.5663) 13.6113 (3.99)% (0.21)% (0.21)% Class R8 LifeStyle 14.5693 (0.0349) (0.5706) (0.6055) 13.9638 (4.16)% (0.24)% (0.24)%
(a) Per unit amounts are based on average daily units outstanding.
(b) The Lifestyle and Multi-Managed funds (Funds of Funds) invest in a number of underlying funds
within The Collective Trust. Through November 8, 2015 these Funds of Funds did not charge aninvestment fee nor incur other expenses, as such charges and expenses were incurred at therespective share classes of the underlying funds. Beginning November 9, 2015 these Funds ofFunds began charging an investment fee and incurring other expenses, coinciding with such Funds of Funds investing in a unique share class of the underlying funds that do not incur an investmentfee or other such expenses. The purpose of this change was solely to record a more directaccounting of the charges and expenses for the Funds of Funds and underlying funds, and has no net effect on the charges or expenses of any of the funds. The Funds of Funds do not reportinvestment income as none of the underlying funds in which these Funds of Funds invest paydividends. Consequently, the change in NAV is due solely to realized and unrealized gains andlosses, and fees, e.g., trustee, audit, charged directly to the fund. Expenses and income items for the underlying funds are shown in the financial statements for those respective funds. The effective Annual Investment Expense is shown on the respective underlying fund's quarterly profile (fact)sheet and on the Schedule of Investment Elections. The effective Annual Investment Expense for the Fund of Funds, e.g. Lifestyle fund, is the weighted average expense of all the underlying funds that compose the specific Fund of Funds.
17

FMT LifeStyle Balanced Growth Fund

THE COLLECTIVE INVESTMENT FUNDS OF FIRST MERCANTILE TRUST COMPANY FMT LifeStyle Balanced Growth Fund
Statement of Assets and Liabilities December 31, 2015
The accompanying notes are an integral part of these financial statements.
Assets Investments in securities, at fair value $ 72,232,532 Liabilities Trustee fees 45,478 Net assets $ 72,187,054 Components of net assets
Units of
Participation NAV
per Unit Net
Assets Class R1 LifeStyle 1,728,622 $ 12.3279 $ 21,310,293Class R2 LifeStyle 727,860 $ 13.0802 9,520,547Class R3 LifeStyle 829,206 $ 12.7366 10,561,303Class R4 LifeStyle 1,177,917 $ 13.0575 15,380,639Class R5 LifeStyle 781,665 $ 12.5445 9,805,574Class R6 LifeStyle 158,760 $ 12.5135 1,986,641Class R7 LifeStyle 211,909 $ 12.3084 2,608,258Class R8 LifeStyle 81,789 $ 12.3953 1,013,799
$ 72,187,054
18

THE COLLECTIVE INVESTMENT FUNDS OF FIRST MERCANTILE TRUST COMPANY FMT LifeStyle Balanced Growth Fund
Statement of Operations For the Year Ended December 31, 2015
The accompanying notes are an integral part of these financial statements.
Expenses
Trustee fees $ 91,180Audit fees 150
91,330 Net investment loss (91,330) Net realized gain from investments sold
Proceeds from sales of investments 31,293,640Cost of investments sold 29,959,255
Net realized gain from investments sold 1,334,385 Change in net unrealized appreciation (depreciation) on investments (3,663,197) Net realized and unrealized loss on investments (2,328,812) Net decrease in net assets resulting from operations $ (2,420,142)
19

THE COLLECTIVE INVESTMENT FUNDS OF FIRST MERCANTILE TRUST COMPANY FMT LifeStyle Balanced Growth Fund
Statement of Changes in Net Assets For the Year Ended December 31, 2015
The accompanying notes are an integral part of these financial statements.
Operations
Net investment loss $ (91,330)
Net realized gain from investments sold 1,334,385
Change in net unrealized appreciation (depreciation) on investments (3,663,197)
Net decrease in net assets resulting from operations (2,420,142) Participant transactions
Proceeds from units purchased 17,654,224Less payments for units redeemed 28,729,837
Decrease in net assets from participant transactions (11,075,613)
Total decrease in net assets (13,495,755) Net assets at beginning of year 85,682,809 Net assets at end of year $ 72,187,054
20

THE COLLECTIVE INVESTMENT FUNDS OF FIRST MERCANTILE TRUST COMPANY FMT LifeStyle Balanced Growth Fund
Schedule of Investments and Specific Fund Disclosures December 31, 2015
The accompanying notes are an integral part of these financial statements.
Investments Cost Fair Value ____________ ____________
Collective trust funds (100.1%)
Core Bond (7.1%) FMT/MetWest Total Return Fund $ 3,177,865 $ 3,350,405 FMT/PIMCO Total Return Fund 1,709,705 1,778,011 __________ __________ 4,887,570 5,128,416
Emerging Markets (1.4%) FMT/DFA Emerging Markets Value Fund 1,150,116 1,000,554
Foreign Large Blend Equity (4.9%) FMT Diversified International (Thomas White) Fund 3,605,392 3,567,947
Global Bond (5.4%) FMT/Global Diversified Bond Fund 3,723,178 3,886,649
Government Bond (5.4%) FMT US Government Securities (C.S. McKee) Fund 3,672,865 3,914,338
Government Bond - TIPS (4.6%) FMT/Vanguard Inflation Protected Securities Fund 3,300,025 3,280,995
High Yield Bond (3.0%) FMT High Yield Bond (Federated) Fund 2,126,618 2,164,041
Intermediate Bond (5.3%) FMT U.S. Core Bond (HighMark) Fund 3,674,767 3,854,199
International Bond (3.0%) FMT/Templeton International Bond Fund 2,127,465 2,157,327
International Core Equity (2.4%) FMT/International Equity Index Fund 1,730,750 1,706,362
International Growth Equity (6.5%) FMT Aggressive International Growth (WCM) Fund 3,595,335 3,848,331 FMT U.S. Growth Opportunities (Zevenbergen) Fund 779,859 855,716 __________ __________ 4,375,194 4,704,047
International Value Equity (5.8%)
FMT International Value Opportunities (Tradewinds) Fund 2,881,540 2,866,023
FMT/Dodge and Cox International Fund 1,440,738 1,289,657 __________ __________ 4,322,278 4,155,680
Large Cap Core Equity (3.7%) FMT Large Cap Opportunities (Smith Group) Fund 2,530,324 2,676,358
21
THE COLLECTIVE INVESTMENT FUNDS OF FIRST MERCANTILE TRUST COMPANY FMT LifeStyle Balanced Growth Fund
Schedule of Investments and Specific Fund Disclosures (continued) December 31, 2015
The accompanying notes are an integral part of these financial statements.
Investments Cost Fair Value
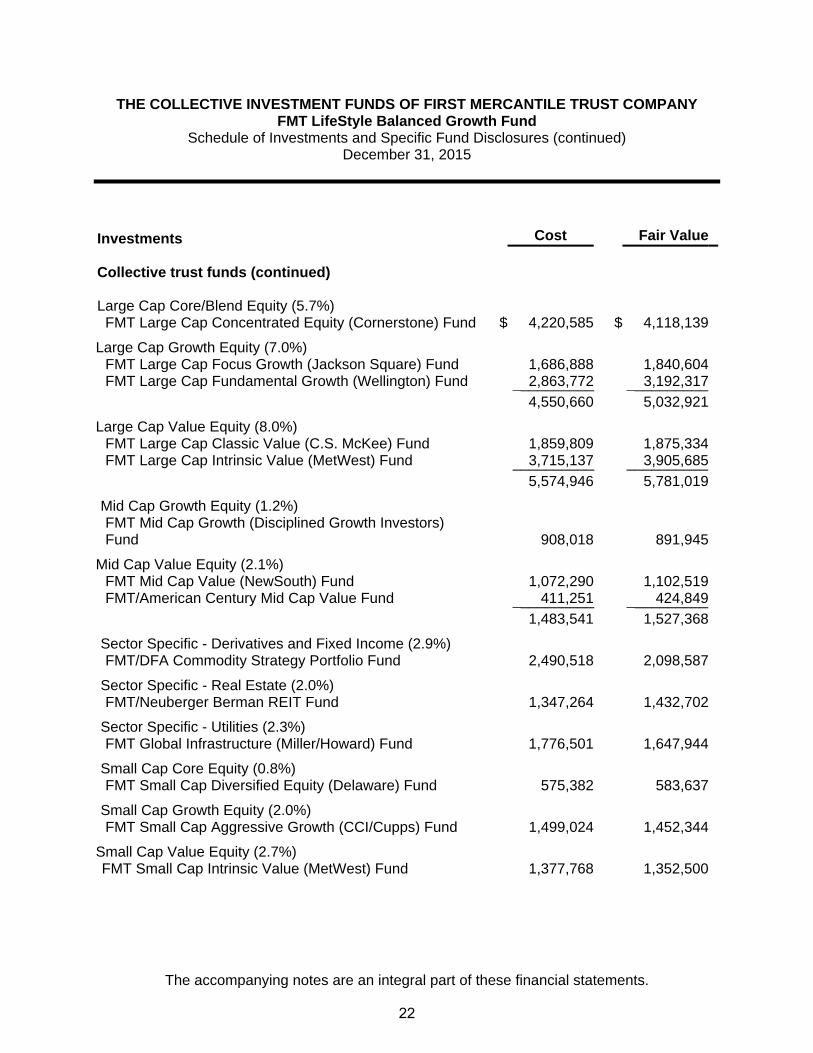
Collective trust funds (continued) Large Cap Core/Blend Equity (5.7%) FMT Large Cap Concentrated Equity (Cornerstone) Fund $ 4,220,585 $ 4,118,139
Large Cap Growth Equity (7.0%) FMT Large Cap Focus Growth (Jackson Square) Fund 1,686,888 1,840,604 FMT Large Cap Fundamental Growth (Wellington) Fund 2,863,772 3,192,317 __________ __________ 4,550,660 5,032,921
Large Cap Value Equity (8.0%) FMT Large Cap Classic Value (C.S. McKee) Fund 1,859,809 1,875,334 FMT Large Cap Intrinsic Value (MetWest) Fund 3,715,137 3,905,685 __________ __________ 5,574,946 5,781,019
Mid Cap Growth Equity (1.2%)
FMT Mid Cap Growth (Disciplined Growth Investors) Fund 908,018 891,945
Mid Cap Value Equity (2.1%) FMT Mid Cap Value (NewSouth) Fund 1,072,290 1,102,519 FMT/American Century Mid Cap Value Fund 411,251 424,849 __________ __________ 1,483,541 1,527,368
Sector Specific - Derivatives and Fixed Income (2.9%) FMT/DFA Commodity Strategy Portfolio Fund 2,490,518 2,098,587
Sector Specific - Real Estate (2.0%) FMT/Neuberger Berman REIT Fund 1,347,264 1,432,702
Sector Specific - Utilities (2.3%) FMT Global Infrastructure (Miller/Howard) Fund 1,776,501 1,647,944
Small Cap Core Equity (0.8%) FMT Small Cap Diversified Equity (Delaware) Fund 575,382 583,637
Small Cap Growth Equity (2.0%) FMT Small Cap Aggressive Growth (CCI/Cupps) Fund 1,499,024 1,452,344
Small Cap Value Equity (2.7%) FMT Small Cap Intrinsic Value (MetWest) Fund 1,377,768 1,352,500
22

THE COLLECTIVE INVESTMENT FUNDS OF FIRST MERCANTILE TRUST COMPANY FMT LifeStyle Balanced Growth Fund
Schedule of Investments and Specific Fund Disclosures (continued) December 31, 2015
The accompanying notes are an integral part of these financial statements.
Investments Cost Fair Value Collective trust funds (continued)
Small Cap Value Equity (continued) FMT Small Cap Value (Opus) Fund $ 575,687 $ 579,648 __________ __________
1,953,455 1,932,148
SMID Cap Growth - Equity (2.8%) FMT SMID Diversified Growth (Frontier/Geneva) Fund 1,973,093 2,015,561
SMID Cap Value - Equity (2.1%) FMT SMID Value (Fisher Investments) Fund 1,476,587 1,521,304 __________ __________ Total Investments $ 71,056,116 $ 72,232,532 __________ ____________________ __________
23

THE COLLECTIVE INVESTMENT FUNDS OF FIRST MERCANTILE TRUST COMPANY FMT LifeStyle Balanced Growth Fund
Schedule of Investments and Specific Fund Disclosures (continued) December 31, 2015
The accompanying notes are an integral part of these financial statements.
Specific Fund Disclosures Fair value The inputs or methodology used for valuing securities may not be indicative of the risks associated with investing in those securities. For more information on valuation inputs, and their aggregation into the levels used in the table below, please refer to note 4 to the financial statements. The following table sets forth by level, within the fair value hierarchy, the Fund's investments measured at fair value.
Total Level 1 Level 2 Level 3
Collective trust funds Core Bond $ 5,128,416 $ — $ 5,128,416 $ —Emerging Markets 1,000,554 — 1,000,554 —Foreign Large Blend Equity 3,567,947 — 3,567,947 —Global Bond 3,886,649 — 3,886,649 —Government Bond 3,914,338 — 3,914,338 —Government Bond - TIPS 3,280,995 — 3,280,995 —High Yield Bond 2,164,041 — 2,164,041 —Intermediate Bond 3,854,199 — 3,854,199 —International Bond 2,157,327 — 2,157,327 —International Core Equity 1,706,362 — 1,706,362 —International Growth Equity 4,704,047 — 4,704,047 —International Value Equity 4,155,680 — 4,155,680 —Large Cap Core Equity 2,676,358 — 2,676,358 —Large Cap Core/Blend Equity 4,118,139 — 4,118,139 —Large Cap Growth Equity 5,032,921 — 5,032,921 —Large Cap Value Equity 5,781,019 — 5,781,019 —Mid Cap Growth Equity 891,945 — 891,945 —Mid Cap Value Equity 1,527,368 — 1,527,368 —Sector Specific - Derivatives and Fixed Income 2,098,587 — 2,098,587 —Sector Specific - Real Estate 1,432,702 — 1,432,702 —Sector Specific - Utilities 1,647,944 — 1,647,944 —Small Cap Core Equity 583,637 — 583,637 —Small Cap Growth Equity 1,452,344 — 1,452,344 —Small Cap Value Equity 1,932,148 — 1,932,148 —SMID Cap Growth - Equity 2,015,561 — 2,015,561 —SMID Cap Value - Equity 1,521,304 — 1,521,304 —__________ __________ __________ _________
$ 72,232,532 $ — $ 72,232,532 $ —__________ __________ __________ ___________________ __________ __________ _________
24

THE COLLECTIVE INVESTMENT FUNDS OF FIRST MERCANTILE TRUST COMPANY FMT LifeStyle Balanced Growth Fund
Schedule of Investments and Specific Fund Disclosures (continued) December 31, 2015
The accompanying notes are an integral part of these financial statements.
The estimated fair value of the underlying collective trust funds is net asset value. The use of net asset value as fair value is deemed appropriate as the collective trust funds do not have a finite life, no unfunded commitments relating to this type of investment, or no significant restrictions on redemptions. Investment transactions The aggregate cost of purchases of investment securities and proceeds from sales of investment securities (other than temporary cash investments) totaled $20,172,175 and $31,293,640, respectively, for the year ended December 31, 2015.
Class-specific expenses Class-specific trustee fees for the year ended December 31, 2015 were as follows: Class R1 LifeStyle $ 14,911 Class R2 LifeStyle 9,516 Class R3 LifeStyle 13,564 Class R4 LifeStyle 23,030 Class R5 LifeStyle 17,898 Class R6 LifeStyle 4,071 Class R7 LifeStyle 5,662 Class R8 LifeStyle 2,528 $ 91,180
25
THE COLLECTIVE INVESTMENT FUNDS OF FIRST MERCANTILE TRUST COMPANY FMT LifeStyle Balanced Growth Fund
Schedule of Participant Transactions December 31, 2015
The accompanying notes are an integral part of these financial statements.
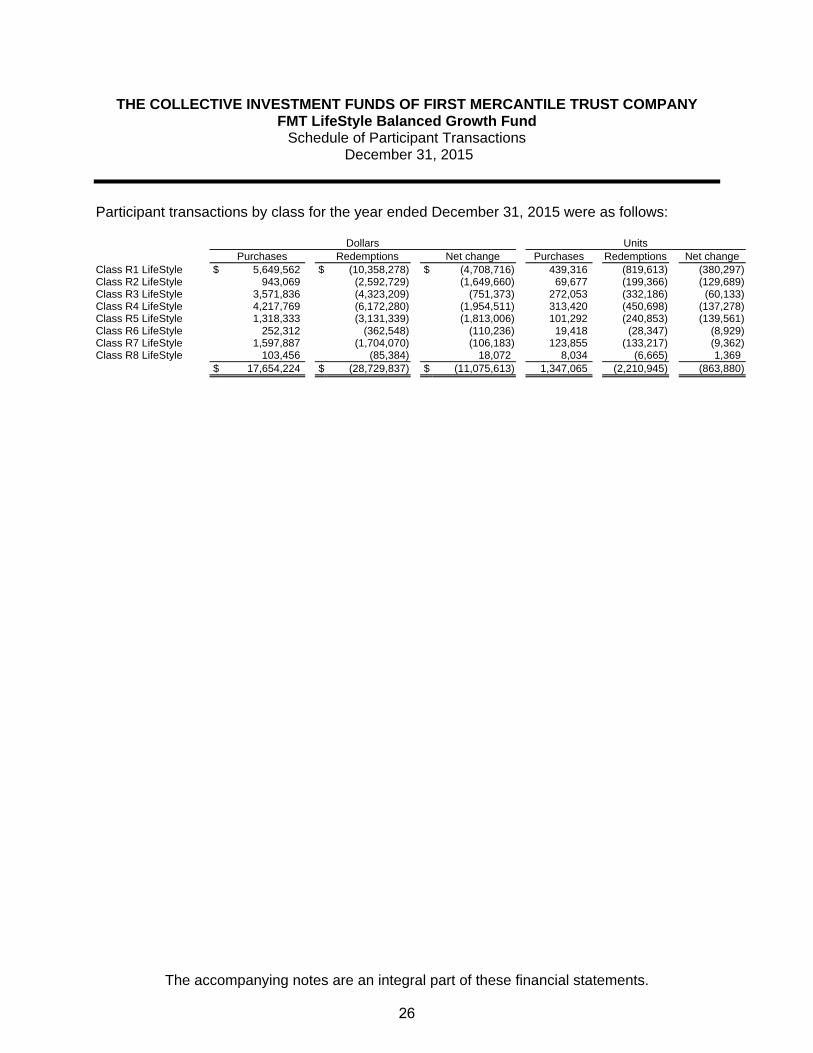
Participant transactions by class for the year ended December 31, 2015 were as follows: Dollars Units Purchases Redemptions Net change Purchases Redemptions Net change Class R1 LifeStyle $ 5,649,562 $ (10,358,278) $ (4,708,716) 439,316 (819,613) (380,297)Class R2 LifeStyle 943,069 (2,592,729) (1,649,660) 69,677 (199,366) (129,689)Class R3 LifeStyle 3,571,836 (4,323,209) (751,373) 272,053 (332,186) (60,133)Class R4 LifeStyle 4,217,769 (6,172,280) (1,954,511) 313,420 (450,698) (137,278)Class R5 LifeStyle 1,318,333 (3,131,339) (1,813,006) 101,292 (240,853) (139,561)Class R6 LifeStyle 252,312 (362,548) (110,236) 19,418 (28,347) (8,929)Class R7 LifeStyle 1,597,887 (1,704,070) (106,183) 123,855 (133,217) (9,362)Class R8 LifeStyle 103,456 (85,384) 18,072 8,034 (6,665) 1,369 $ 17,654,224 $ (28,729,837) $ (11,075,613) 1,347,065 (2,210,945) (863,880)
26

THE COLLECTIVE INVESTMENT FUNDS OF FIRST MERCANTILE TRUST COMPANY FMT LifeStyle Balanced Growth Fund
Financial Highlights December 31, 2015
The accompanying notes are an integral part of these financial statements.
Change in Net Asset Value Resulting from Operations Ratios (to average net
assets)
NAV per Unit, Beginning of
Period
Net Investment
Income (Loss)(a)(b)
Net Realized and Unrealized
Gain (Loss) from
Investments(a)
Total from Investment Activities
NAV per Unit, End of Period
Total Return Expenses(b)
Net Investment
Income (Loss)(b)
Class R1 LifeStyle $ 12.6642 $ (0.0076) $ (0.3287) $ (0.3363) $ 12.3279 (2.66)% (0.06)% (0.06)%Class R2 LifeStyle 13.4682 (0.0116) (0.3764) (0.3880) 13.0802 (2.88)% (0.09)% (0.09)%Class R3 LifeStyle 13.1360 (0.0133) (0.3861) (0.3994) 12.7366 (3.04)% (0.10)% (0.10)%Class R4 LifeStyle 13.4901 (0.0192) (0.4134) (0.4326) 13.0575 (3.21)% (0.14)% (0.14)%Class R5 LifeStyle 12.9830 (0.0209) (0.4176) (0.4385) 12.5445 (3.38)% (0.16)% (0.16)%Class R6 LifeStyle 12.9724 (0.0244) (0.4345) (0.4589) 12.5135 (3.54)% (0.19)% (0.19)%Class R7 LifeStyle 12.7823 (0.0271) (0.4468) (0.4739) 12.3084 (3.71)% (0.21)% (0.21)%Class R8 LifeStyle 12.8935 (0.0311) (0.4671) (0.4982) 12.3953 (3.86)% (0.24)% (0.24)%
(a) Per unit amounts are based on average daily units outstanding.
(b) The Lifestyle and Multi-Managed funds (Funds of Funds) invest in a number of underlying funds
within The Collective Trust. Through November 8, 2015 these Funds of Funds did not charge aninvestment fee nor incur other expenses, as such charges and expenses were incurred at therespective share classes of the underlying funds. Beginning November 9, 2015 these Funds ofFunds began charging an investment fee and incurring other expenses, coinciding with suchFunds of Funds investing in a unique share class of the underlying funds that do not incur an investment fee or other such expenses. The purpose of this change was solely to record a moredirect accounting of the charges and expenses for the Funds of Funds and underlying funds, andhas no net effect on the charges or expenses of any of the funds. The Funds of Funds do not report investment income as none of the underlying funds in which these Funds of Funds investpay dividends. Consequently, the change in NAV is due solely to realized and unrealized gainsand losses, and fees, e.g., trustee, audit, charged directly to the fund. Expenses and income itemsfor the underlying funds are shown in the financial statements for those respective funds. Theeffective Annual Investment Expense is shown on the respective underlying fund's quarterly profile (fact) sheet and on the Schedule of Investment Elections. The effective Annual InvestmentExpense for the Fund of Funds, e.g. Lifestyle fund, is the weighted average expense of all the underlying funds that compose the specific Fund of Funds.
27

FMT LifeStyle Income and Conservative Growth Fund

THE COLLECTIVE INVESTMENT FUNDS OF FIRST MERCANTILE TRUST COMPANY FMT LifeStyle Income and Conservative Growth Fund
Statement of Assets and Liabilities December 31, 2015
The accompanying notes are an integral part of these financial statements.
Assets Investments in securities, at fair value $ 56,946,878 Liabilities Trustee fees 34,472 Net assets $ 56,912,406 Components of net assets
Units of
Participation NAV
per Unit Net
Assets Class R1 LifeStyle 1,398,258 $ 14.1456 $ 19,779,141Class R2 LifeStyle 506,886 $ 11.1481 5,650,806Class R3 LifeStyle 605,950 $ 11.1095 6,731,775Class R4 LifeStyle 985,858 $ 11.0514 10,895,146Class R5 LifeStyle 263,050 $ 11.0703 2,912,051Class R6 LifeStyle 279,486 $ 11.0503 3,088,408Class R7 LifeStyle 234,713 $ 10.8286 2,541,612Class R8 LifeStyle 109,061 $ 10.7626 1,173,782Lehman LifeStyle 301,110 $ 13.7481 4,139,685
$ 56,912,406
28

THE COLLECTIVE INVESTMENT FUNDS OF FIRST MERCANTILE TRUST COMPANY FMT LifeStyle Income and Conservative Growth Fund
Statement of Operations For the Year Ended December 31, 2015
The accompanying notes are an integral part of these financial statements.
Expenses
Trustee fees $ 69,006Audit fees 150
69,156 Net investment loss (69,156) Net realized gain from investments sold
Proceeds from sales of investments 38,279,939Cost of investments sold 38,276,783
Net realized gain from investments sold 3,156 Change in net unrealized appreciation (depreciation) on investments (1,465,730) Net realized and unrealized loss on investments (1,462,154) Net decrease in net assets resulting from operations $ (1,531,730)
29

THE COLLECTIVE INVESTMENT FUNDS OF FIRST MERCANTILE TRUST COMPANY FMT LifeStyle Income and Conservative Growth Fund
Statement of Changes in Net Assets For the Year Ended December 31, 2015
The accompanying notes are an integral part of these financial statements.
Operations
Net investment loss $ (69,156)
Net realized gain from investments sold 3,156
Change in net unrealized appreciation (depreciation) on investments (1,465,730)
Net decrease in net assets resulting from operations (1,531,730) Participant transactions
Proceeds from units purchased 22,226,818Less payments for units redeemed 34,416,655
Decrease in net assets from participant transactions (12,189,837)
Total decrease in net assets (13,721,567) Net assets at beginning of year 70,633,973 Net assets at end of year $ 56,912,406
30

THE COLLECTIVE INVESTMENT FUNDS OF FIRST MERCANTILE TRUST COMPANY FMT LifeStyle Income and Conservative Growth Fund Schedule of Investments and Specific Fund Disclosures
December 31, 2015
The accompanying notes are an integral part of these financial statements.
Investments Cost Fair Value ____________ ____________
Collective trust funds (100.1%)
Core Bond (11.0%) FMT/MetWest Total Return Fund $ 4,072,451 $ 4,076,101 FMT/PIMCO Total Return Fund 2,192,545 2,189,866 __________ __________ 6,264,996 6,265,967
Emerging Markets (0.5%) FMT/DFA Emerging Markets Value Fund 359,860 303,725
Foreign Large Blend Equity (1.9%) FMT Diversified International (Thomas White) Fund 1,119,973 1,063,341
Global Bond (8.1%) FMT/Global Diversified Bond Fund 4,640,971 4,617,264
Government Bond (8.4%) FMT US Government Securities (C.S. McKee) Fund 4,697,533 4,763,977
Government Bond - TIPS (8.0%) FMT/Vanguard Inflation Protected Securities Fund 4,580,881 4,554,428
High Yield Bond (4.0%) FMT High Yield Bond (Federated) Fund 2,319,677 2,252,817
Intermediate Bond (8.2%) FMT U.S. Core Bond (HighMark) Fund 4,698,627 4,696,861
International Bond (4.0%) FMT/Templeton International Bond Fund 2,320,717 2,252,340
International Core Equity (0.9%) FMT/International Equity Index Fund 533,945 507,773
International Growth Equity (2.4%) FMT Aggressive International Growth (WCM) Fund 1,118,833 1,142,695 FMT U.S. Growth Opportunities (Zevenbergen) Fund 232,275 244,330 __________ __________ 1,351,108 1,387,025
International Value Equity (2.2%)
FMT International Value Opportunities (Tradewinds) Fund 894,150 848,146
FMT/Dodge and Cox International Fund 447,693 384,607 __________ __________ 1,341,843 1,232,753
Large Cap Core Equity (1.4%) FMT Large Cap Opportunities (Smith Group) Fund 782,788 788,773
31

THE COLLECTIVE INVESTMENT FUNDS OF FIRST MERCANTILE TRUST COMPANY FMT LifeStyle Income and Conservative Growth Fund
Schedule of Investments and Specific Fund Disclosures (continued) December 31, 2015
The accompanying notes are an integral part of these financial statements.
Investments Cost Fair Value
Collective trust funds (continued) Large Cap Core/Blend Equity (2.1%) FMT Large Cap Concentrated Equity (Cornerstone) Fund $ 1,306,333 $ 1,223,827
Large Cap Growth Equity (2.6%) FMT Large Cap Focus Growth (Jackson Square) Fund 522,010 543,544 FMT Large Cap Fundamental Growth (Wellington) Fund 885,860 937,975 __________ __________ 1,407,870 1,481,519
Large Cap Value Equity (3.0%) FMT Large Cap Classic Value (C.S. McKee) Fund 574,238 555,798 FMT Large Cap Intrinsic Value (MetWest) Fund 1,147,473 1,153,429 __________ __________ 1,721,711 1,709,227
Mid Cap Growth Equity (0.4%)
FMT Mid Cap Growth (Disciplined Growth Investors) Fund 278,103 257,487
Mid Cap Value Equity (0.8%) FMT Mid Cap Value (NewSouth) Fund 330,194 321,228 FMT/American Century Mid Cap Value Fund 128,051 130,808 __________ __________ 458,245 452,036
Sector Specific - Derivatives and Fixed Income (3.8%) FMT/DFA Commodity Strategy Portfolio Fund 2,676,102 2,167,154
Sector Specific - Real Estate (1.6%) FMT/Neuberger Berman REIT Fund 870,196 889,403
Sector Specific - Utilities (2.3%) FMT Global Infrastructure (Miller/Howard) Fund 1,451,847 1,293,601
Short Duration Bond (18.5%) FMT/DFA 1 Year Fixed Income Fund 10,440,748 10,549,430
Small Cap Core Equity (0.3%) FMT Small Cap Diversified Equity (Delaware) Fund 180,070 175,988
Small Cap Growth Equity (0.8%) FMT Small Cap Aggressive Growth (CCI/Cupps) Fund 469,957 434,382
Small Cap Value Equity (1.0%) FMT Small Cap Intrinsic Value (MetWest) Fund 428,952 402,021
32
THE COLLECTIVE INVESTMENT FUNDS OF FIRST MERCANTILE TRUST COMPANY FMT LifeStyle Income and Conservative Growth Fund
Schedule of Investments and Specific Fund Disclosures (continued) December 31, 2015
The accompanying notes are an integral part of these financial statements.
Investments Cost Fair Value
Collective trust funds (continued)
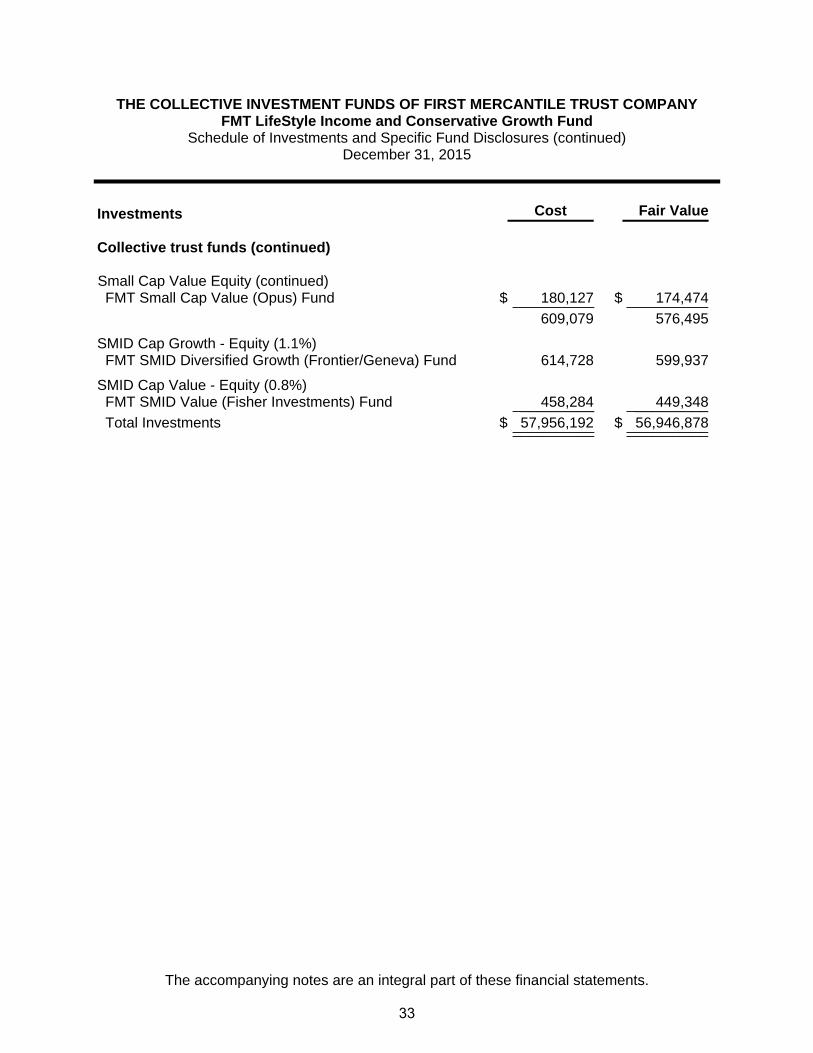
Small Cap Value Equity (continued) FMT Small Cap Value (Opus) Fund $ 180,127 $ 174,474 __________ __________ 609,079 576,495
SMID Cap Growth - Equity (1.1%) FMT SMID Diversified Growth (Frontier/Geneva) Fund 614,728 599,937
SMID Cap Value - Equity (0.8%) FMT SMID Value (Fisher Investments) Fund 458,284 449,348 __________ __________ Total Investments $ 57,956,192 $ 56,946,878 __________ ____________________ __________
33

THE COLLECTIVE INVESTMENT FUNDS OF FIRST MERCANTILE TRUST COMPANY FMT LifeStyle Income and Conservative Growth Fund
Schedule of Investments and Specific Fund Disclosures (continued) December 31, 2015
The accompanying notes are an integral part of these financial statements.
Specific Fund Disclosures Fair value The inputs or methodology used for valuing securities may not be indicative of the risks associated with investing in those securities. For more information on valuation inputs, and their aggregation into the levels used in the table below, please refer to note 4 to the financial statements. The following table sets forth by level, within the fair value hierarchy, the Fund's investments measured at fair value.
Total Level 1 Level 2 Level 3
Collective trust funds Core Bond $ 6,265,967 $ — $ 6,265,967 $ —Emerging Markets 303,725 — 303,725 —Foreign Large Blend Equity 1,063,341 — 1,063,341 —Global Bond 4,617,264 — 4,617,264 —Government Bond 4,763,977 — 4,763,977 —Government Bond - TIPS 4,554,428 — 4,554,428 —High Yield Bond 2,252,817 — 2,252,817 —Intermediate Bond 4,696,861 — 4,696,861 —International Bond 2,252,340 — 2,252,340 —International Core Equity 507,773 — 507,773 —International Growth Equity 1,387,025 — 1,387,025 —International Value Equity 1,232,753 — 1,232,753 —Large Cap Core Equity 788,773 — 788,773 —Large Cap Core/Blend Equity 1,223,827 — 1,223,827 —Large Cap Growth Equity 1,481,519 — 1,481,519 —Large Cap Value Equity 1,709,227 — 1,709,227 —Mid Cap Growth Equity 257,487 — 257,487 —Mid Cap Value Equity 452,036 — 452,036 —Sector Specific - Derivatives and Fixed Income 2,167,154 — 2,167,154 —Sector Specific - Real Estate 889,403 — 889,403 —Sector Specific - Utilities 1,293,601 — 1,293,601 —Short Duration Bond 10,549,430 — 10,549,430 —Small Cap Core Equity 175,988 — 175,988 —Small Cap Growth Equity 434,382 — 434,382 —Small Cap Value Equity 576,495 — 576,495 —SMID Cap Growth - Equity 599,937 — 599,937 —SMID Cap Value - Equity 449,348 — 449,348 —__________ __________ __________ _________
$ 56,946,878 $ — $ 56,946,878 $ —__________ __________ __________ ___________________ __________ __________ _________
34
THE COLLECTIVE INVESTMENT FUNDS OF FIRST MERCANTILE TRUST COMPANY FMT LifeStyle Income and Conservative Growth Fund
Schedule of Investments and Specific Fund Disclosures (continued) December 31, 2015
The accompanying notes are an integral part of these financial statements.
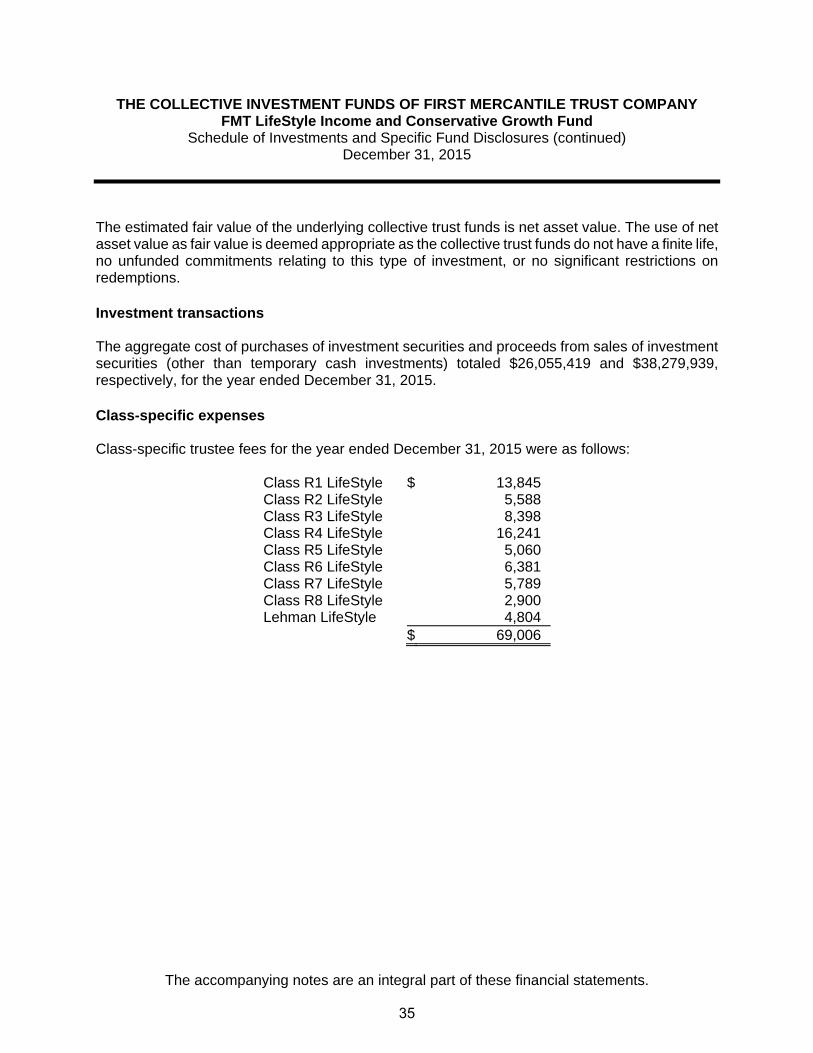
The estimated fair value of the underlying collective trust funds is net asset value. The use of net asset value as fair value is deemed appropriate as the collective trust funds do not have a finite life, no unfunded commitments relating to this type of investment, or no significant restrictions on redemptions. Investment transactions The aggregate cost of purchases of investment securities and proceeds from sales of investment securities (other than temporary cash investments) totaled $26,055,419 and $38,279,939, respectively, for the year ended December 31, 2015. Class-specific expenses Class-specific trustee fees for the year ended December 31, 2015 were as follows: Class R1 LifeStyle $ 13,845 Class R2 LifeStyle 5,588 Class R3 LifeStyle 8,398 Class R4 LifeStyle 16,241 Class R5 LifeStyle 5,060 Class R6 LifeStyle 6,381 Class R7 LifeStyle 5,789 Class R8 LifeStyle 2,900 Lehman LifeStyle 4,804 $ 69,006
35

THE COLLECTIVE INVESTMENT FUNDS OF FIRST MERCANTILE TRUST COMPANY FMT LifeStyle Income and Conservative Growth Fund
Schedule of Participant Transactions December 31, 2015
The accompanying notes are an integral part of these financial statements.
Participant transactions by class for the year ended December 31, 2015 were as follows: Dollars Units Purchases Redemptions Net change Purchases Redemptions Net change Class R1 LifeStyle $ 6,474,284 $ (15,602,209) $ (9,127,925) 445,238 (1,076,584) (631,346)Class R2 LifeStyle 3,498,277 (3,227,458) 270,819 310,394 (286,028) 24,366Class R3 LifeStyle 5,700,220 (6,808,809) (1,108,589) 500,342 (602,466) (102,124)Class R4 LifeStyle 3,269,296 (4,086,635) (817,339) 289,043 (357,704) (68,661)Class R5 LifeStyle 1,138,677 (1,342,720) (204,043) 100,604 (117,102) (16,498)Class R6 LifeStyle 403,745 (820,702) (416,957) 35,381 (71,977) (36,596)Class R7 LifeStyle 1,223,702 (1,664,330) (440,628) 108,838 (148,883) (40,045)Class R8 LifeStyle 275,075 (390,908) (115,833) 24,859 (35,147) (10,288)Lehman LifeStyle 243,542 (472,884) (229,342) 17,313 (33,837) (16,524) $ 22,226,818 $ (34,416,655) $ (12,189,837) 1,832,012 (2,729,728) (897,716)
36

THE COLLECTIVE INVESTMENT FUNDS OF FIRST MERCANTILE TRUST COMPANY FMT LifeStyle Income and Conservative Growth Fund
Financial Highlights December 31, 2015
The accompanying notes are an integral part of these financial statements.
Change in Net Asset Value Resulting from Operations Ratios (to average net
assets)
NAV per Unit, Beginning of
Period
Net Investment
Income (Loss)(a)(b)
Net Realized and Unrealized
Gain (Loss) from
Investments(a)
Total from Investment Activities
NAV per Unit, End of
Period Total
Return Expenses(b)
Net Investment
Income (Loss)(b)
Class R1 LifeStyle $ 14.4704 $ (0.0079) $ (0.3169) $ (0.3248) $ 14.1456 (2.24)% (0.05)% (0.05)%Class R2 LifeStyle 11.4271 (0.0118) (0.2672) (0.2790) 11.1481 (2.44)% (0.10)% (0.10)%Class R3 LifeStyle 11.4094 (0.0123) (0.2876) (0.2999) 11.1095 (2.63)% (0.11)% (0.11)%Class R4 LifeStyle 11.3688 (0.0169) (0.3005) (0.3174) 11.0514 (2.79)% (0.15)% (0.15)%Class R5 LifeStyle 11.4080 (0.0195) (0.3182) (0.3377) 11.0703 (2.96)% (0.17)% (0.17)%Class R6 LifeStyle 11.4063 (0.0217) (0.3343) (0.3560) 11.0503 (3.12)% (0.19)% (0.19)%Class R7 LifeStyle 11.1966 (0.0234) (0.3446) (0.3680) 10.8286 (3.29)% (0.21)% (0.21)%Class R8 LifeStyle 11.1479 (0.0283) (0.3570) (0.3853) 10.7626 (3.46)% (0.26)% (0.26)%Lehman LifeStyle 14.1123 (0.0155) (0.3487) (0.3642) 13.7481 (2.58)% (0.11)% (0.11)%
(a) Per unit amounts are based on average daily units outstanding.
(b) The Lifestyle and Multi-Managed funds (Funds of Funds) invest in a number of underlying funds
within The Collective Trust. Through November 8, 2015 these Funds of Funds did not charge aninvestment fee nor incur other expenses, as such charges and expenses were incurred at therespective share classes of the underlying funds. Beginning November 9, 2015 these Funds ofFunds began charging an investment fee and incurring other expenses, coinciding with suchFunds of Funds investing in a unique share class of the underlying funds that do not incur aninvestment fee or other such expenses. The purpose of this change was solely to record a more direct accounting of the charges and expenses for the Funds of Funds and underlying funds, andhas no net effect on the charges or expenses of any of the funds. The Funds of Funds do notreport investment income as none of the underlying funds in which these Funds of Funds invest pay dividends. Consequently, the change in NAV is due solely to realized and unrealized gainsand losses, and fees, e.g., trustee, audit, charged directly to the fund. Expenses and incomeitems for the underlying funds are shown in the financial statements for those respective funds.The effective Annual Investment Expense is shown on the respective underlying fund's quarterlyprofile (fact) sheet and on the Schedule of Investment Elections. The effective Annual InvestmentExpense for the Fund of Funds, e.g. Lifestyle fund, is the weighted average expense of all the underlying funds that compose the specific Fund of Funds.
37
FMT LifeStyle Moderately Aggressive Growth Fund

THE COLLECTIVE INVESTMENT FUNDS OF FIRST MERCANTILE TRUST COMPANY FMT LifeStyle Moderately Aggressive Growth Fund
Statement of Assets and Liabilities December 31, 2015
The accompanying notes are an integral part of these financial statements.
Assets Investments in securities, at fair value $ 193,068,738 Liabilities Trustee fees 117,897 Net assets $ 192,950,841 Components of net assets
Units of
Participation NAV
per Unit Net
Assets Class R1 LifeStyle 4,855,931 $ 15.3254 $ 74,419,087Class R2 LifeStyle 1,499,628 $ 13.2319 19,842,999Class R3 LifeStyle 2,061,972 $ 13.1546 27,124,340Class R4 LifeStyle 2,462,707 $ 13.1018 32,265,873Class R5 LifeStyle 1,119,475 $ 13.0733 14,635,209Class R6 LifeStyle 762,929 $ 13.4305 10,246,495Class R7 LifeStyle 556,817 $ 12.8751 7,169,082Class R8 LifeStyle 552,140 $ 13.1267 7,247,756
$ 192,950,841
38

THE COLLECTIVE INVESTMENT FUNDS OF FIRST MERCANTILE TRUST COMPANY FMT LifeStyle Moderately Aggressive Growth Fund
Statement of Operations For the Year Ended December 31, 2015
The accompanying notes are an integral part of these financial statements.
Expenses
Trustee fees $ 235,492Audit fees 150
235,642 Net investment loss (235,642) Net realized gain from investments sold
Proceeds from sales of investments 83,667,334Cost of investments sold 76,823,788
Net realized gain from investments sold 6,843,546 Change in net unrealized appreciation (depreciation) on investments (12,907,281) Net realized and unrealized loss on investments (6,063,735) Net decrease in net assets resulting from operations $ (6,299,377)
39

THE COLLECTIVE INVESTMENT FUNDS OF FIRST MERCANTILE TRUST COMPANY FMT LifeStyle Moderately Aggressive Growth Fund
Statement of Changes in Net Assets For the Year Ended December 31, 2015
The accompanying notes are an integral part of these financial statements.
Operations
Net investment loss $ (235,642)
Net realized gain from investments sold 6,843,546
Change in net unrealized appreciation (depreciation) on investments (12,907,281)
Net decrease in net assets resulting from operations (6,299,377) Participant transactions
Proceeds from units purchased 43,939,129Less payments for units redeemed 83,590,714
Decrease in net assets from participant transactions (39,651,585)
Total decrease in net assets (45,950,962) Net assets at beginning of year 238,901,803 Net assets at end of year $ 192,950,841
40
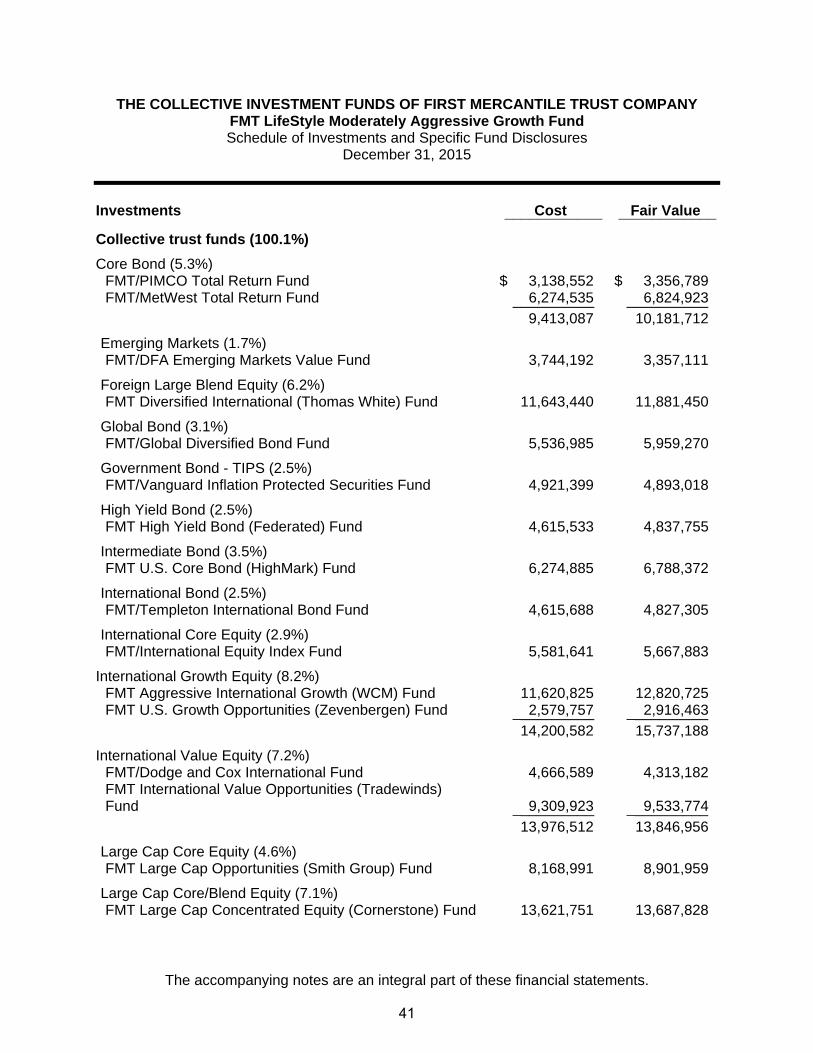
THE COLLECTIVE INVESTMENT FUNDS OF FIRST MERCANTILE TRUST COMPANY FMT LifeStyle Moderately Aggressive Growth Fund Schedule of Investments and Specific Fund Disclosures
December 31, 2015
The accompanying notes are an integral part of these financial statements.
Investments Cost Fair Value ____________ ____________
Collective trust funds (100.1%)
Core Bond (5.3%) FMT/PIMCO Total Return Fund $ 3,138,552 $ 3,356,789 FMT/MetWest Total Return Fund 6,274,535 6,824,923 __________ __________ 9,413,087 10,181,712
Emerging Markets (1.7%) FMT/DFA Emerging Markets Value Fund 3,744,192 3,357,111
Foreign Large Blend Equity (6.2%) FMT Diversified International (Thomas White) Fund 11,643,440 11,881,450
Global Bond (3.1%) FMT/Global Diversified Bond Fund 5,536,985 5,959,270
Government Bond - TIPS (2.5%) FMT/Vanguard Inflation Protected Securities Fund 4,921,399 4,893,018
High Yield Bond (2.5%) FMT High Yield Bond (Federated) Fund 4,615,533 4,837,755
Intermediate Bond (3.5%) FMT U.S. Core Bond (HighMark) Fund 6,274,885 6,788,372
International Bond (2.5%) FMT/Templeton International Bond Fund 4,615,688 4,827,305
International Core Equity (2.9%) FMT/International Equity Index Fund 5,581,641 5,667,883
International Growth Equity (8.2%) FMT Aggressive International Growth (WCM) Fund 11,620,825 12,820,725 FMT U.S. Growth Opportunities (Zevenbergen) Fund 2,579,757 2,916,463 __________ __________ 14,200,582 15,737,188
International Value Equity (7.2%) FMT/Dodge and Cox International Fund 4,666,589 4,313,182
FMT International Value Opportunities (Tradewinds) Fund 9,309,923 9,533,774 __________ __________
13,976,512 13,846,956
Large Cap Core Equity (4.6%) FMT Large Cap Opportunities (Smith Group) Fund 8,168,991 8,901,959
Large Cap Core/Blend Equity (7.1%) FMT Large Cap Concentrated Equity (Cornerstone) Fund 13,621,751 13,687,828
41

THE COLLECTIVE INVESTMENT FUNDS OF FIRST MERCANTILE TRUST COMPANY FMT LifeStyle Moderately Aggressive Growth Fund
Schedule of Investments and Specific Fund Disclosures (continued) December 31, 2015
The accompanying notes are an integral part of these financial statements.
Investments Cost Fair Value
Collective trust funds (continued) Large Cap Growth Equity (8.7%)
FMT Large Cap Focus Growth (Jackson Square) Fund $ 5,439,726 $ 6,104,488 FMT Large Cap Fundamental Growth (Wellington) Fund 9,228,146 10,582,617 __________ __________ 14,667,872 16,687,105
Large Cap Value Equity (10.0%) FMT Large Cap Classic Value (C.S. McKee) Fund 6,001,338 6,230,164 FMT Large Cap Intrinsic Value (MetWest) Fund 11,970,160 12,959,776 __________ __________ 17,971,498 19,189,940
Mid Cap Growth Equity (1.5%)
FMT Mid Cap Growth (Disciplined Growth Investors) Fund 2,919,153 2,958,990
Mid Cap Value Equity (2.6%) FMT/American Century Mid Cap Value Fund 1,327,829 1,432,398 FMT Mid Cap Value (NewSouth) Fund 3,470,057 3,667,654 __________ __________ 4,797,886 5,100,052
Sector Specific - Derivatives and Fixed Income (2.5%) FMT/DFA Commodity Strategy Portfolio Fund 5,565,611 4,839,240
Sector Specific - Real Estate (2.2%) FMT/Neuberger Berman REIT Fund 3,877,205 4,259,829
Sector Specific - Utilities (2.3%) FMT Global Infrastructure (Miller/Howard) Fund 4,628,108 4,427,859
Small Cap Core Equity (1.0%) FMT Small Cap Diversified Equity (Delaware) Fund 1,865,031 1,949,559
Small Cap Growth Equity (2.5%) FMT Small Cap Aggressive Growth (CCI/Cupps) Fund 4,863,719 4,838,447
Small Cap Value Equity (3.4%) FMT Small Cap Intrinsic Value (MetWest) Fund 4,470,608 4,518,632 FMT Small Cap Value (Opus) Fund 1,865,180 1,934,950 __________ __________ 6,335,788 6,453,582
SMID Cap Growth - Equity (3.5%) FMT SMID Diversified Growth (Frontier/Geneva) Fund 6,387,388 6,723,973
42

THE COLLECTIVE INVESTMENT FUNDS OF FIRST MERCANTILE TRUST COMPANY FMT LifeStyle Moderately Aggressive Growth Fund
Schedule of Investments and Specific Fund Disclosures (continued) December 31, 2015
The accompanying notes are an integral part of these financial statements.
Investments Cost Fair Value SMID Cap Value - Equity (2.6%) FMT SMID Value (Fisher Investments) Fund $ 4,779,222 $ 5,072,355 __________ __________ Total Investments $ 184,973,167 $ 193,068,738 __________ ____________________ __________
43

THE COLLECTIVE INVESTMENT FUNDS OF FIRST MERCANTILE TRUST COMPANY FMT LifeStyle Moderately Aggressive Growth Fund
Schedule of Investments and Specific Fund Disclosures (continued) December 31, 2015
The accompanying notes are an integral part of these financial statements.
Specific Fund Disclosures Fair value The inputs or methodology used for valuing securities may not be indicative of the risks associated with investing in those securities. For more information on valuation inputs, and their aggregation into the levels used in the table below, please refer to note 4 to the financial statements. The following table sets forth by level, within the fair value hierarchy, the Fund's investments measured at fair value.
Total Level 1 Level 2 Level 3
Collective trust funds Core Bond $ 10,181,712 $ — $ 10,181,712 $ — Emerging Markets 3,357,111 — 3,357,111 — Foreign Large Blend Equity 11,881,450 — 11,881,450 — Global Bond 5,959,270 — 5,959,270 — Government Bond - TIPS 4,893,018 — 4,893,018 — High Yield Bond 4,837,755 — 4,837,755 — Intermediate Bond 6,788,372 — 6,788,372 — International Bond 4,827,305 — 4,827,305 — International Core Equity 5,667,883 — 5,667,883 — International Growth Equity 15,737,188 — 15,737,188 — International Value Equity 13,846,956 — 13,846,956 — Large Cap Core Equity 8,901,959 — 8,901,959 — Large Cap Core/Blend Equity 13,687,828 — 13,687,828 — Large Cap Growth Equity 16,687,105 — 16,687,105 — Large Cap Value Equity 19,189,940 — 19,189,940 — Mid Cap Growth Equity 2,958,990 — 2,958,990 — Mid Cap Value Equity 5,100,052 — 5,100,052 — Sector Specific - Derivatives and Fixed Income 4,839,240 — 4,839,240 — Sector Specific - Real Estate 4,259,829 — 4,259,829 — Sector Specific - Utilities 4,427,859 — 4,427,859 — Small Cap Core Equity 1,949,559 — 1,949,559 — Small Cap Growth Equity 4,838,447 — 4,838,447 — Small Cap Value Equity 6,453,582 — 6,453,582 — SMID Cap Growth – Equity 6,723,973 — 6,723,973 —SMID Cap Value – Equity 5,072,355 — 5,072,355 — __________ __________ __________ _________
$193,068,738 $ — $193,068,738 $ — __________ __________ __________ ___________________ __________ __________ _________
44

THE COLLECTIVE INVESTMENT FUNDS OF FIRST MERCANTILE TRUST COMPANY FMT LifeStyle Moderately Aggressive Growth Fund
Schedule of Investments and Specific Fund Disclosures (continued) December 31, 2015
The accompanying notes are an integral part of these financial statements.
The estimated fair value of the underlying collective trust funds is net asset value. The use of net asset value as fair value is deemed appropriate as the collective trust funds do not have a finite life, no unfunded commitments relating to this type of investment, or no significant restrictions on redemptions. Investment transactions The aggregate cost of purchases of investment securities and proceeds from sales of investment securities (other than temporary cash investments) totaled $43,898,004 and $83,667,334 respectively, for the year ended December 31, 2015. Class-specific expenses Class-specific trustee fees for the year ended December 31, 2015 were as follows: Class R1 LifeStyle $ 50,660 Class R2 LifeStyle 20,862 Class R3 LifeStyle 33,473 Class R4 LifeStyle 47,438 Class R5 LifeStyle 27,779 Class R6 LifeStyle 20,463 Class R7 LifeStyle 16,233 Class R8 LifeStyle 18,584 $ 235,492
45
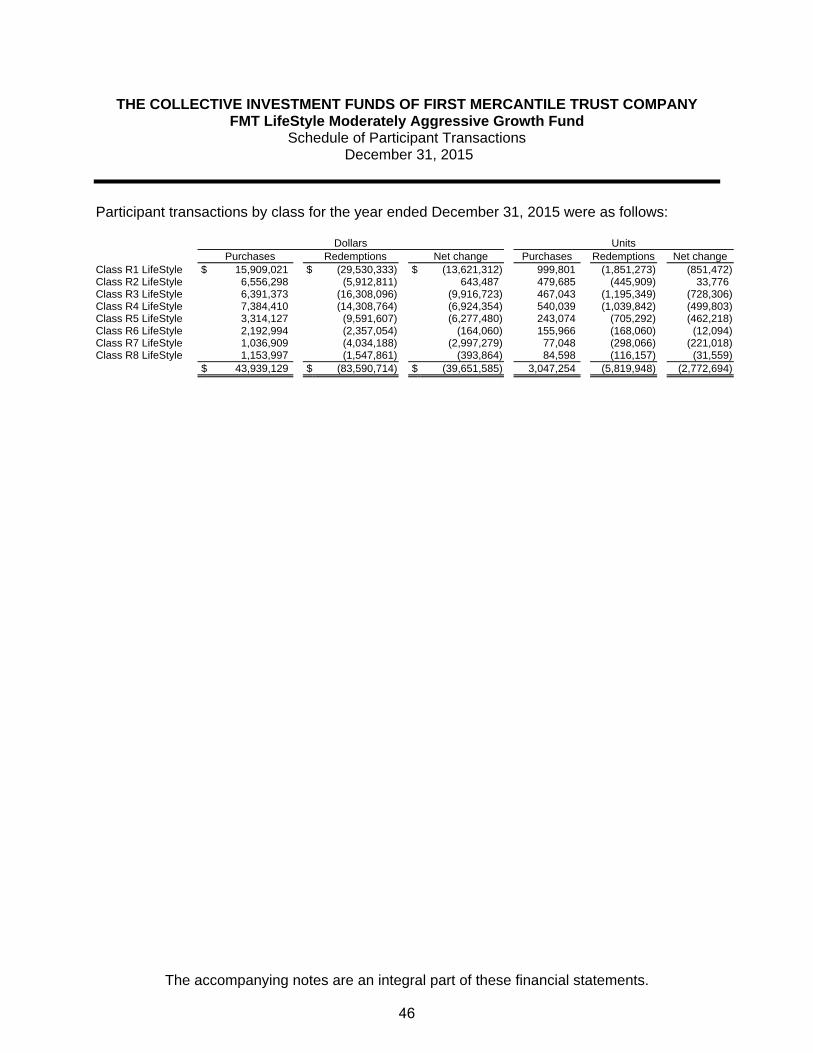
THE COLLECTIVE INVESTMENT FUNDS OF FIRST MERCANTILE TRUST COMPANY FMT LifeStyle Moderately Aggressive Growth Fund
Schedule of Participant Transactions December 31, 2015
The accompanying notes are an integral part of these financial statements.
Participant transactions by class for the year ended December 31, 2015 were as follows: Dollars Units Purchases Redemptions Net change Purchases Redemptions Net change Class R1 LifeStyle $ 15,909,021 $ (29,530,333) $ (13,621,312) 999,801 (1,851,273) (851,472)Class R2 LifeStyle 6,556,298 (5,912,811) 643,487 479,685 (445,909) 33,776Class R3 LifeStyle 6,391,373 (16,308,096) (9,916,723) 467,043 (1,195,349) (728,306)Class R4 LifeStyle 7,384,410 (14,308,764) (6,924,354) 540,039 (1,039,842) (499,803)Class R5 LifeStyle 3,314,127 (9,591,607) (6,277,480) 243,074 (705,292) (462,218)Class R6 LifeStyle 2,192,994 (2,357,054) (164,060) 155,966 (168,060) (12,094)Class R7 LifeStyle 1,036,909 (4,034,188) (2,997,279) 77,048 (298,066) (221,018)Class R8 LifeStyle 1,153,997 (1,547,861) (393,864) 84,598 (116,157) (31,559) $ 43,939,129 $ (83,590,714) $ (39,651,585) 3,047,254 (5,819,948) (2,772,694)
46

THE COLLECTIVE INVESTMENT FUNDS OF FIRST MERCANTILE TRUST COMPANY FMT LifeStyle Moderately Aggressive Growth Fund
Financial Highlights December 31, 2015
The accompanying notes are an integral part of these financial statements.
Change in Net Asset Value Resulting from Operations Ratios (to average net
assets)
NAV per Unit,
Beginning of Period
Net Investment
Income (Loss)(a)(b)
Net Realized and Unrealized
Gain (Loss) from
Investments(a)
Total from Investment Activities
NAV per Unit, End of
Period Total
Return Expenses(b)
Net Investment
Income (Loss)(b)
Class R1 LifeStyle $ 15.7812 $ (0.0098) $ (0.4460) $ (0.4558) $ 15.3254 (2.89)% (0.06)% (0.06)% Class R2 LifeStyle 13.6558 (0.0133) (0.4106) (0.4239) 13.2319 (3.10)% (0.10)% (0.10)% Class R3 LifeStyle 13.5986 (0.0136) (0.4304) (0.4440) 13.1546 (3.27)% (0.10)% (0.10)% Class R4 LifeStyle 13.5673 (0.0186) (0.4469) (0.4655) 13.1018 (3.43)% (0.14)% (0.14)% Class R5 LifeStyle 13.5614 (0.0208) (0.4673) (0.4881) 13.0733 (3.60)% (0.15)% (0.15)% Class R6 LifeStyle 13.9549 (0.0276) (0.4968) (0.5244) 13.4305 (3.76)% (0.20)% (0.20)% Class R7 LifeStyle 13.4010 (0.0252) (0.5007) (0.5259) 12.8751 (3.92)% (0.19)% (0.19)% Class R8 LifeStyle 13.6863 (0.0316) (0.5280) (0.5596) 13.1267 (4.09)% (0.23)% (0.23)%
(a) Per unit amounts are based on average daily units outstanding.
(b) The Lifestyle and Multi-Managed funds (Funds of Funds) invest in a number of underlying funds
within The Collective Trust. Through November 8, 2015 these Funds of Funds did not charge aninvestment fee nor incur other expenses, as such charges and expenses were incurred at therespective share classes of the underlying funds. Beginning November 9, 2015 these Funds ofFunds began charging an investment fee and incurring other expenses, coinciding with suchFunds of Funds investing in a unique share class of the underlying funds that do not incur aninvestment fee or other such expenses. The purpose of this change was solely to record a more direct accounting of the charges and expenses for the Funds of Funds and underlying funds, andhas no net effect on the charges or expenses of any of the funds. The Funds of Funds do notreport investment income as none of the underlying funds in which these Funds of Funds invest pay dividends. Consequently, the change in NAV is due solely to realized and unrealized gainsand losses, and fees, e.g., trustee, audit, charged directly to the fund. Expenses and income itemsfor the underlying funds are shown in the financial statements for those respective funds. Theeffective Annual Investment Expense is shown on the respective underlying fund's quarterly profile(fact) sheet and on the Schedule of Investment Elections. The effective Annual Investment Expense for the Fund of Funds, e.g. Lifestyle fund, is the weighted average expense of all the underlying funds that compose the specific Fund of Funds.
47

FMT LifeStyle Moderately Conservative Growth Fund

THE COLLECTIVE INVESTMENT FUNDS OF FIRST MERCANTILE TRUST COMPANY FMT LifeStyle Moderately Conservative Growth Fund
Statement of Assets and Liabilities December 31, 2015
The accompanying notes are an integral part of these financial statements.
Assets Investments in securities, at fair value $ 96,925,994 Liabilities Trustee fees 54,767 Net assets $ 96,871,227 Components of net assets
Units of
Participation NAV
per Unit Net
Assets Class R1 LifeStyle 2,864,992 $ 14.1025 $ 40,403,680Class R2 LifeStyle 1,291,776 $ 11.9689 15,461,151Class R3 LifeStyle 895,802 $ 11.8923 10,653,190Class R4 LifeStyle 1,208,685 $ 11.8149 14,280,460Class R5 LifeStyle 637,408 $ 11.8189 7,533,451Class R6 LifeStyle 447,657 $ 11.9901 5,367,448Class R7 LifeStyle 128,926 $ 11.6244 1,498,680Class R8 LifeStyle 142,780 $ 11.7185 1,673,167
$ 96,871,227
48

THE COLLECTIVE INVESTMENT FUNDS OF FIRST MERCANTILE TRUST COMPANY FMT LifeStyle Moderately Conservative Growth Fund
Statement of Operations For the Year Ended December 31, 2015
The accompanying notes are an integral part of these financial statements.
Expenses
Trustee fees $ 111,245Audit fees 150
111,395 Net investment loss (111,395) Net realized gain from investments sold
Proceeds from sales of investments 76,373,604Cost of investments sold 75,869,874
Net realized gain from investments sold 503,730 Change in net unrealized appreciation (depreciation) on investments (3,611,980) Net realized and unrealized loss on investments (3,108,250) Net decrease in net assets resulting from operations $ (3,219,645)
49

THE COLLECTIVE INVESTMENT FUNDS OF FIRST MERCANTILE TRUST COMPANY FMT LifeStyle Moderately Conservative Growth Fund
Statement of Changes in Net Assets For the Year Ended December 31, 2015
The accompanying notes are an integral part of these financial statements.
Operations
Net investment loss $ (111,395)
Net realized gain from investments sold 503,730
Change in net unrealized appreciation (depreciation) on investments (3,611,980)
Net decrease in net assets resulting from operations (3,219,645) Participant transactions
Proceeds from units purchased 27,998,178Less payments for units redeemed 72,453,567
Decrease in net assets from participant transactions (44,455,389)
Total decrease in net assets (47,675,034) Net assets at beginning of year 144,546,261 Net assets at end of year $ 96,871,227
50

THE COLLECTIVE INVESTMENT FUNDS OF FIRST MERCANTILE TRUST COMPANY FMT LifeStyle Moderately Conservative Growth Fund Schedule of Investments and Specific Fund Disclosures
December 31, 2015
The accompanying notes are an integral part of these financial statements.
Investments Cost Fair Value ____________ ____________
Collective trust funds (100.1%)
Core Bond (8.8%) FMT/PIMCO Total Return Fund $ 2,918,110 $ 2,967,738 FMT/MetWest Total Return Fund 5,418,901 5,584,642 __________ __________ 8,337,011 8,552,380
Emerging Markets (1.0%) FMT/DFA Emerging Markets Value Fund 1,147,772 976,670
Foreign Large Blend Equity (3.6%) FMT Diversified International (Thomas White) Fund 3,572,730 3,458,086
Global Bond (6.6%) FMT/Global Diversified Bond Fund 6,301,998 6,434,721
Government Bond (6.7%) FMT US Government Securities (C.S. McKee) Fund 6,248,500 6,510,472
Government Bond - TIPS (6.0%) FMT/Vanguard Inflation Protected Securities Fund 5,887,061 5,853,080
High Yield Bond (3.5%) FMT High Yield Bond (Federated) Fund 3,392,007 3,379,375
Intermediate Bond (6.6%) FMT U.S. Core Bond (HighMark) Fund 6,251,686 6,413,331
International Bond (3.5%) FMT/Templeton International Bond Fund 3,394,754 3,367,594
International Core Equity (1.7%) FMT/International Equity Index Fund 1,708,979 1,640,907
International Growth Equity (4.7%) FMT U.S. Growth Opportunities (Zevenbergen) Fund 773,828 829,198 FMT Aggressive International Growth (WCM) Fund 3,565,194 3,725,434 __________ __________ 4,339,022 4,554,632
International Value Equity (4.2%) FMT/Dodge and Cox International Fund 1,438,275 1,262,328
FMT International Value Opportunities (Tradewinds) Fund 2,852,668 2,767,833 __________ __________
4,290,943 4,030,161
Large Cap Core Equity (2.7%) FMT Large Cap Opportunities (Smith Group) Fund 2,498,888 2,585,383
51
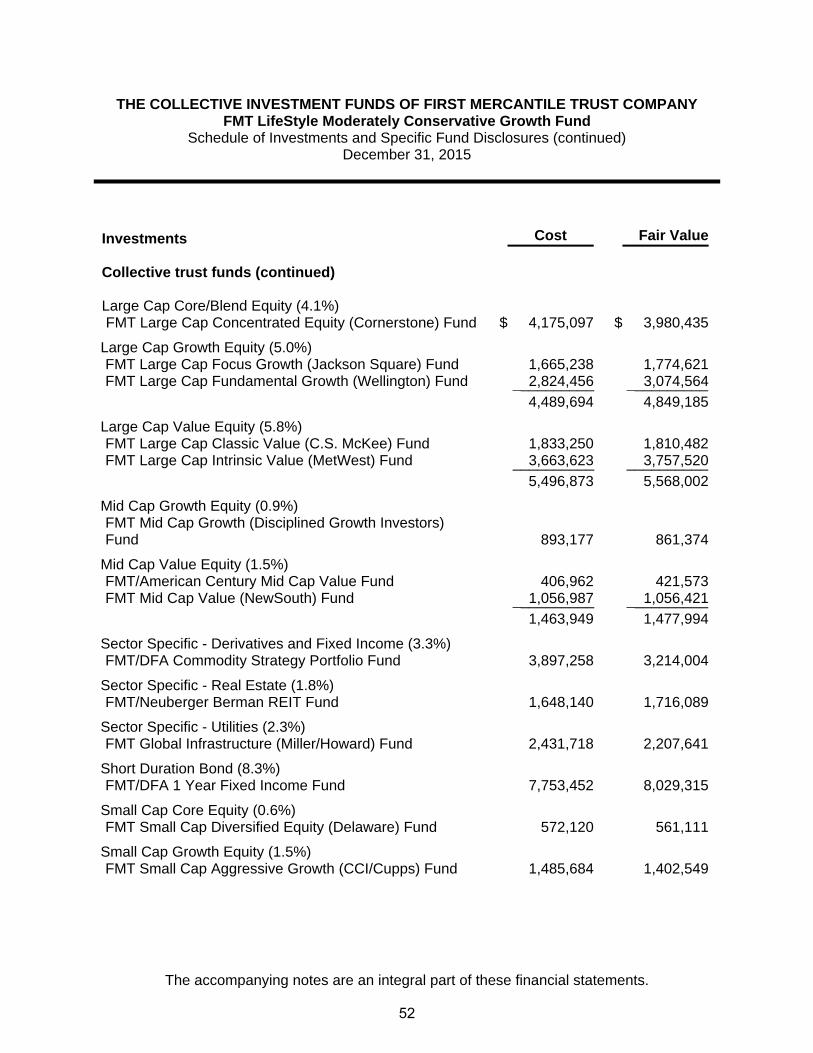
THE COLLECTIVE INVESTMENT FUNDS OF FIRST MERCANTILE TRUST COMPANY FMT LifeStyle Moderately Conservative Growth Fund
Schedule of Investments and Specific Fund Disclosures (continued) December 31, 2015
The accompanying notes are an integral part of these financial statements.
Investments Cost Fair Value
Collective trust funds (continued) Large Cap Core/Blend Equity (4.1%)
FMT Large Cap Concentrated Equity (Cornerstone) Fund $ 4,175,097 $ 3,980,435
Large Cap Growth Equity (5.0%) FMT Large Cap Focus Growth (Jackson Square) Fund 1,665,238 1,774,621 FMT Large Cap Fundamental Growth (Wellington) Fund 2,824,456 3,074,564 __________ __________ 4,489,694 4,849,185
Large Cap Value Equity (5.8%) FMT Large Cap Classic Value (C.S. McKee) Fund 1,833,250 1,810,482 FMT Large Cap Intrinsic Value (MetWest) Fund 3,663,623 3,757,520 __________ __________ 5,496,873 5,568,002
Mid Cap Growth Equity (0.9%)
FMT Mid Cap Growth (Disciplined Growth Investors) Fund 893,177 861,374
Mid Cap Value Equity (1.5%) FMT/American Century Mid Cap Value Fund 406,962 421,573 FMT Mid Cap Value (NewSouth) Fund 1,056,987 1,056,421 __________ __________ 1,463,949 1,477,994
Sector Specific - Derivatives and Fixed Income (3.3%) FMT/DFA Commodity Strategy Portfolio Fund 3,897,258 3,214,004
Sector Specific - Real Estate (1.8%) FMT/Neuberger Berman REIT Fund 1,648,140 1,716,089
Sector Specific - Utilities (2.3%) FMT Global Infrastructure (Miller/Howard) Fund 2,431,718 2,207,641
Short Duration Bond (8.3%) FMT/DFA 1 Year Fixed Income Fund 7,753,452 8,029,315
Small Cap Core Equity (0.6%) FMT Small Cap Diversified Equity (Delaware) Fund 572,120 561,111
Small Cap Growth Equity (1.5%) FMT Small Cap Aggressive Growth (CCI/Cupps) Fund 1,485,684 1,402,549
52

THE COLLECTIVE INVESTMENT FUNDS OF FIRST MERCANTILE TRUST COMPANY FMT LifeStyle Moderately Conservative Growth Fund
Schedule of Investments and Specific Fund Disclosures (continued) December 31, 2015
The accompanying notes are an integral part of these financial statements.
Investments Cost Fair Value
Collective trust funds (continued)
Small Cap Value Equity (1.9%) FMT Small Cap Intrinsic Value (MetWest) Fund $ 1,378,325 $ 1,319,343
FMT Small Cap Value (Opus) Fund 572,191 557,258 __________ __________ 1,950,516 1,876,601
SMID Cap Growth - Equity (2.0%) FMT SMID Diversified Growth (Frontier/Geneva) Fund 1,959,314 1,950,516
SMID Cap Value - Equity (1.5%) FMT SMID Value (Fisher Investments) Fund 1,464,182 1,474,386 __________ __________ Total Investments $ 97,052,525 $ 96,925,994 __________ ____________________ __________
53
THE COLLECTIVE INVESTMENT FUNDS OF FIRST MERCANTILE TRUST COMPANY FMT LifeStyle Moderately Conservative Growth Fund
Schedule of Investments and Specific Fund Disclosures (continued) December 31, 2015
The accompanying notes are an integral part of these financial statements.
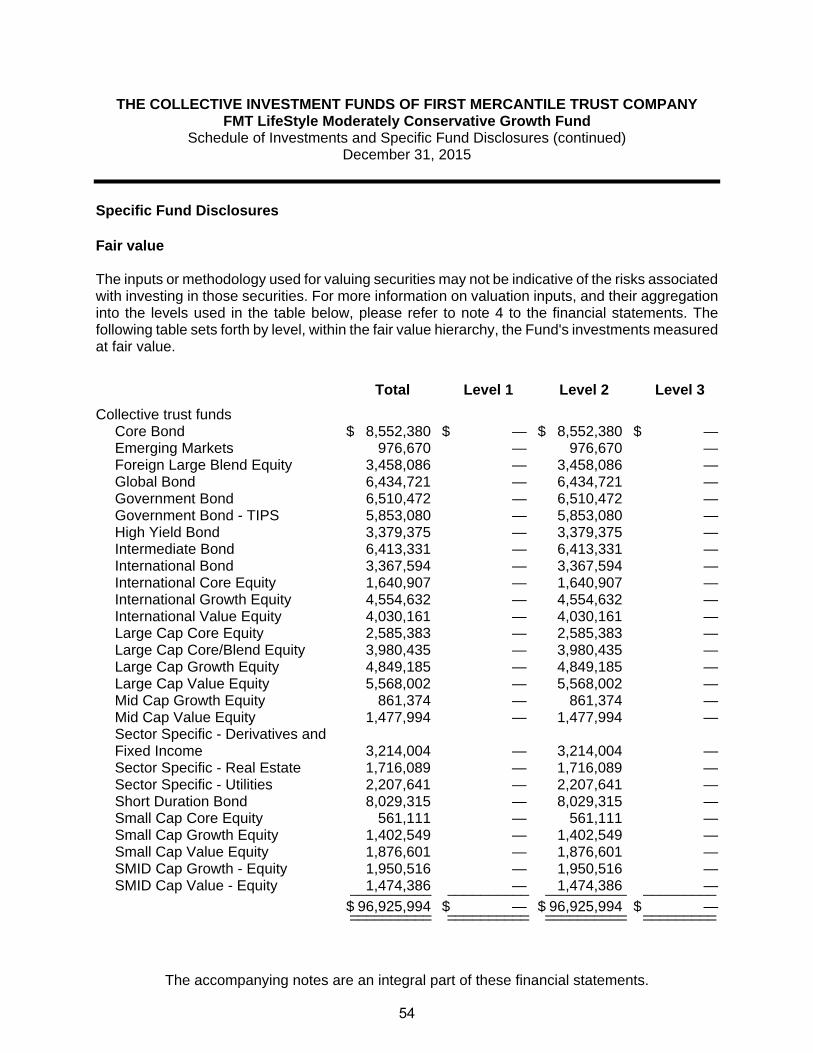
Specific Fund Disclosures Fair value The inputs or methodology used for valuing securities may not be indicative of the risks associated with investing in those securities. For more information on valuation inputs, and their aggregation into the levels used in the table below, please refer to note 4 to the financial statements. The following table sets forth by level, within the fair value hierarchy, the Fund's investments measured at fair value.
Total Level 1 Level 2 Level 3
Collective trust funds Core Bond $ 8,552,380 $ — $ 8,552,380 $ —Emerging Markets 976,670 — 976,670 —Foreign Large Blend Equity 3,458,086 — 3,458,086 —Global Bond 6,434,721 — 6,434,721 —Government Bond 6,510,472 — 6,510,472 —Government Bond - TIPS 5,853,080 — 5,853,080 —High Yield Bond 3,379,375 — 3,379,375 —Intermediate Bond 6,413,331 — 6,413,331 —International Bond 3,367,594 — 3,367,594 —International Core Equity 1,640,907 — 1,640,907 —International Growth Equity 4,554,632 — 4,554,632 —International Value Equity 4,030,161 — 4,030,161 —Large Cap Core Equity 2,585,383 — 2,585,383 —Large Cap Core/Blend Equity 3,980,435 — 3,980,435 —Large Cap Growth Equity 4,849,185 — 4,849,185 —Large Cap Value Equity 5,568,002 — 5,568,002 —Mid Cap Growth Equity 861,374 — 861,374 —Mid Cap Value Equity 1,477,994 — 1,477,994 —Sector Specific - Derivatives and Fixed Income 3,214,004 — 3,214,004 —Sector Specific - Real Estate 1,716,089 — 1,716,089 —Sector Specific - Utilities 2,207,641 — 2,207,641 —Short Duration Bond 8,029,315 — 8,029,315 —Small Cap Core Equity 561,111 — 561,111 —Small Cap Growth Equity 1,402,549 — 1,402,549 —Small Cap Value Equity 1,876,601 — 1,876,601 —SMID Cap Growth - Equity 1,950,516 — 1,950,516 —SMID Cap Value - Equity 1,474,386 — 1,474,386 —__________ __________ __________ _________
$ 96,925,994 $ — $ 96,925,994 $ —__________ __________ __________ ___________________ __________ __________ _________
54
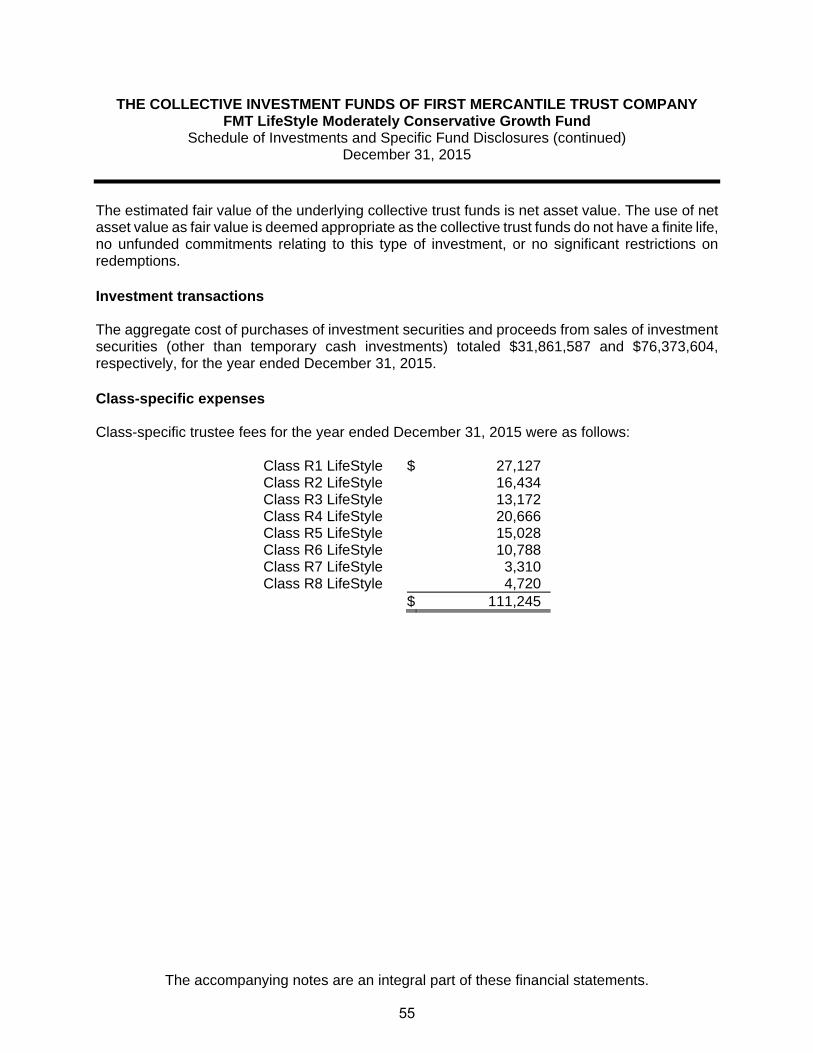
THE COLLECTIVE INVESTMENT FUNDS OF FIRST MERCANTILE TRUST COMPANY FMT LifeStyle Moderately Conservative Growth Fund
Schedule of Investments and Specific Fund Disclosures (continued) December 31, 2015
The accompanying notes are an integral part of these financial statements.
The estimated fair value of the underlying collective trust funds is net asset value. The use of net asset value as fair value is deemed appropriate as the collective trust funds do not have a finite life, no unfunded commitments relating to this type of investment, or no significant restrictions on redemptions. Investment transactions The aggregate cost of purchases of investment securities and proceeds from sales of investment securities (other than temporary cash investments) totaled $31,861,587 and $76,373,604, respectively, for the year ended December 31, 2015. Class-specific expenses Class-specific trustee fees for the year ended December 31, 2015 were as follows: Class R1 LifeStyle $ 27,127 Class R2 LifeStyle 16,434 Class R3 LifeStyle 13,172 Class R4 LifeStyle 20,666 Class R5 LifeStyle 15,028 Class R6 LifeStyle 10,788 Class R7 LifeStyle 3,310 Class R8 LifeStyle 4,720 $ 111,245
55

THE COLLECTIVE INVESTMENT FUNDS OF FIRST MERCANTILE TRUST COMPANY FMT LifeStyle Moderately Conservative Growth Fund
Schedule of Participant Transactions December 31, 2015
The accompanying notes are an integral part of these financial statements.
Participant transactions by class for the year ended December 31, 2015 were as follows: Dollars Units Purchases Redemptions Net change Purchases Redemptions Net change Class R1 LifeStyle $ 9,691,079 $ (18,752,815) $ (9,061,736) 662,408 (1,286,728) (624,320)Class R2 LifeStyle 4,609,937 (6,414,475) (1,804,538) 373,912 (534,862) (160,950)Class R3 LifeStyle 4,072,115 (24,224,263) (20,152,148) 331,722 (1,992,316) (1,660,594)Class R4 LifeStyle 4,729,055 (11,181,247) (6,452,192) 387,634 (915,315) (527,681)Class R5 LifeStyle 2,711,423 (5,470,606) (2,759,183) 221,354 (450,634) (229,280)Class R6 LifeStyle 1,267,370 (3,297,173) (2,029,803) 101,996 (267,097) (165,101)Class R7 LifeStyle 284,258 (1,277,858) (993,600) 23,784 (106,973) (83,189)Class R8 LifeStyle 632,941 (1,835,130) (1,202,189) 52,029 (154,734) (102,705) $ 27,998,178 $ (72,453,567) $ (44,455,389) 2,154,839 (5,708,659) (3,553,820)
56

THE COLLECTIVE INVESTMENT FUNDS OF FIRST MERCANTILE TRUST COMPANY FMT LifeStyle Moderately Conservative Growth Fund
Financial Highlights December 31, 2015
The accompanying notes are an integral part of these financial statements.
Change in Net Asset Value Resulting from Operations Ratios (to average net
assets)
NAV per Unit, Beginning of
Period
Net Investment
Income (Loss)(a)(b)
Net Realized and Unrealized
Gain (Loss) from
Investments(a)
Total from Investment Activities
NAV per Unit, End of
Period Total Return Expenses(b)
Net Investm
ent Income
(Loss)(b)Class R1 LifeStyle $ 14.4646 $ (0.0088) $ (0.3533) $ (0.3621) $ 14.1025 (2.50)% (0.06)% (0.06)%Class R2 LifeStyle 12.3040 (0.0112) (0.3239) (0.3351) 11.9689 (2.72)% (0.09)% (0.09)%Class R3 LifeStyle 12.2468 (0.0070) (0.3475) (0.3545) 11.8923 (2.89)% (0.06)% (0.06)%Class R4 LifeStyle 12.1868 (0.0149) (0.3570) (0.3719) 11.8149 (3.05)% (0.12)% (0.12)%Class R5 LifeStyle 12.2114 (0.0187) (0.3738) (0.3925) 11.8189 (3.21)% (0.15)% (0.15)%Class R6 LifeStyle 12.4099 (0.0210) (0.3988) (0.4198) 11.9901 (3.38)% (0.17)% (0.17)%Class R7 LifeStyle 12.0525 (0.0185) (0.4096) (0.4281) 11.6244 (3.55)% (0.15)% (0.15)%Class R8 LifeStyle 12.1702 (0.0199) (0.4318) (0.4517) 11.7185 (3.71)% (0.16)% (0.16)%
(a) Per unit amounts are based on average daily units outstanding.
(b) The Lifestyle and Multi-Managed funds (Funds of Funds) invest in a number of underlying funds
within The Collective Trust. Through November 8, 2015 these Funds of Funds did not charge aninvestment fee nor incur other expenses, as such charges and expenses were incurred at therespective share classes of the underlying funds. Beginning November 9, 2015 these Funds of Funds began charging an investment fee and incurring other expenses, coinciding with such Fundsof Funds investing in a unique share class of the underlying funds that do not incur an investmentfee or other such expenses. The purpose of this change was solely to record a more direct accounting of the charges and expenses for the Funds of Funds and underlying funds, and has nonet effect on the charges or expenses of any of the funds. The Funds of Funds do not reportinvestment income as none of the underlying funds in which these Funds of Funds invest paydividends. Consequently, the change in NAV is due solely to realized and unrealized gains andlosses, and fees, e.g., trustee, audit, charged directly to the fund. Expenses and income items for the underlying funds are shown in the financial statements for those respective funds. The effectiveAnnual Investment Expense is shown on the respective underlying fund's quarterly profile (fact)sheet and on the Schedule of Investment Elections. The effective Annual Investment Expense for the Fund of Funds, e.g. Lifestyle fund, is the weighted average expense of all the underlying fundsthat compose the specific Fund of Funds.
57
FMT LifeStyle Target Date 2010 Fund

THE COLLECTIVE INVESTMENT FUNDS OF FIRST MERCANTILE TRUST COMPANY
FMT LifeStyle Target Date 2010 Fund Statement of Assets and Liabilities
December 31, 2015
The accompanying notes are an integral part of these financial statements.
Assets Investments in securities, at fair value $ 2,050,326 Liabilities Trustee fees 874
Net assets $ 2,049,452
Components of net assets
Units of
Participation NAV
per Unit Net
Assets Class R1 LifeStyle 597,789 $ 2.6501 $ 1,584,221
Class R2 LifeStyle 2,212 $ 12.5130 27,680
Class R3 LifeStyle 2,951 $ 12.1125 35,747
Class R4 LifeStyle 8,747 $ 11.3827 99,566
Class R5 LifeStyle 22,562 $ 12.1919 275,070
Class R6 LifeStyle 2,415 $ 11.2500 27,168
$ 2,049,452
58

THE COLLECTIVE INVESTMENT FUNDS OF FIRST MERCANTILE TRUST COMPANY
FMT LifeStyle Target Date 2010 Fund Statement of Operations
For the Year Ended December 31, 2015
The accompanying notes are an integral part of these financial statements.
Expenses
Trustee fees $ 1,749
Audit fees 150
1,899
Net investment loss (1,899)
Net realized loss from investments sold
Proceeds from sales of investments 1,162,892
Cost of investments sold 1,626,534
Net realized loss from investments sold (463,642)
Change in net unrealized appreciation (depreciation) on investments 406,142
Net realized and unrealized loss on investments (57,500)
Net decrease in net assets resulting from operations $ (59,399)
59

THE COLLECTIVE INVESTMENT FUNDS OF FIRST MERCANTILE TRUST COMPANY
FMT LifeStyle Target Date 2010 Fund Statement of Changes in Net Assets
For the Year Ended December 31, 2015
The accompanying notes are an integral part of these financial statements.
Operations
Net investment loss $ (1,899)
Net realized loss from investments sold (463,642)
Change in net unrealized appreciation (depreciation) on investments 406,142
Net decrease in net assets resulting from operations (59,399)
Participant transactions
Proceeds from units purchased 554,132
Less payments for units redeemed 1,211,214
Decrease in net assets from participant transactions (657,082)
Total decrease in net assets (716,481)
Net assets at beginning of year 2,765,933
Net assets at end of year $ 2,049,452
60

THE COLLECTIVE INVESTMENT FUNDS OF FIRST MERCANTILE TRUST COMPANY FMT LifeStyle Target Date 2010 Fund
Schedule of Investments and Specific Fund Disclosures December 31, 2015
The accompanying notes are an integral part of these financial statements.
Investments Cost Fair Value ____________ ____________
Collective trust funds (100.0%)
Emerging Markets (1.3%) FMT/Vanguard Emerging Markets ETF $ 43,674 $ 27,107
Global Bond (9.4%) FMT/Global Diversified Bond Fund 263,794 192,258
Government Bond - TIPS (7.4%) FMT/Vanguard Inflation Protected Securities Fund 211,072 151,410
Intermediate Bond (30.2%) FMT/Vanguard Total Bond Market Index Fund 844,002 619,270
International Core Equity (8.5%) FMT/International Equity Index Fund 253,063 173,743
International Growth Equity (1.9%) FMT U.S. Growth Opportunities (Zevenbergen) Fund 20,033 15,173 FMT Aggressive International Growth (WCM) Fund 32,368 24,120 __________ __________ 52,401 39,293
International Value Equity (1.1%)
FMT International Value Opportunities (Tradewinds) Fund 32,407 22,274
Large Cap Core Equity (12.9%) FMT Large Cap Opportunities (Smith Group) Fund 16,909 12,415 FMT/Vanguard 500 Index Fund 339,248 252,384 __________ __________ 356,157 264,799
Large Cap Core/Blend Equity (0.9%) FMT Large Cap Concentrated Equity (Cornerstone) Fund 25,520 17,432
Large Cap Growth Equity (0.6%) FMT Large Cap Focus Growth (Jackson Square) Fund 16,917 12,795
Large Cap Value Equity (0.9%) FMT Large Cap Intrinsic Value (MetWest) Fund 25,507 18,569
Mid Cap Core Equity (1.4%) FMT/Vanguard Midcap Index Fund 41,312 29,142
Mid Cap Growth Equity (1.0%)
FMT Mid Cap Growth (Disciplined Growth Investors) Fund 28,974 19,770
Mid Cap Value Equity (1.2%) FMT Mid Cap Value (NewSouth) Fund 32,961 23,502
61
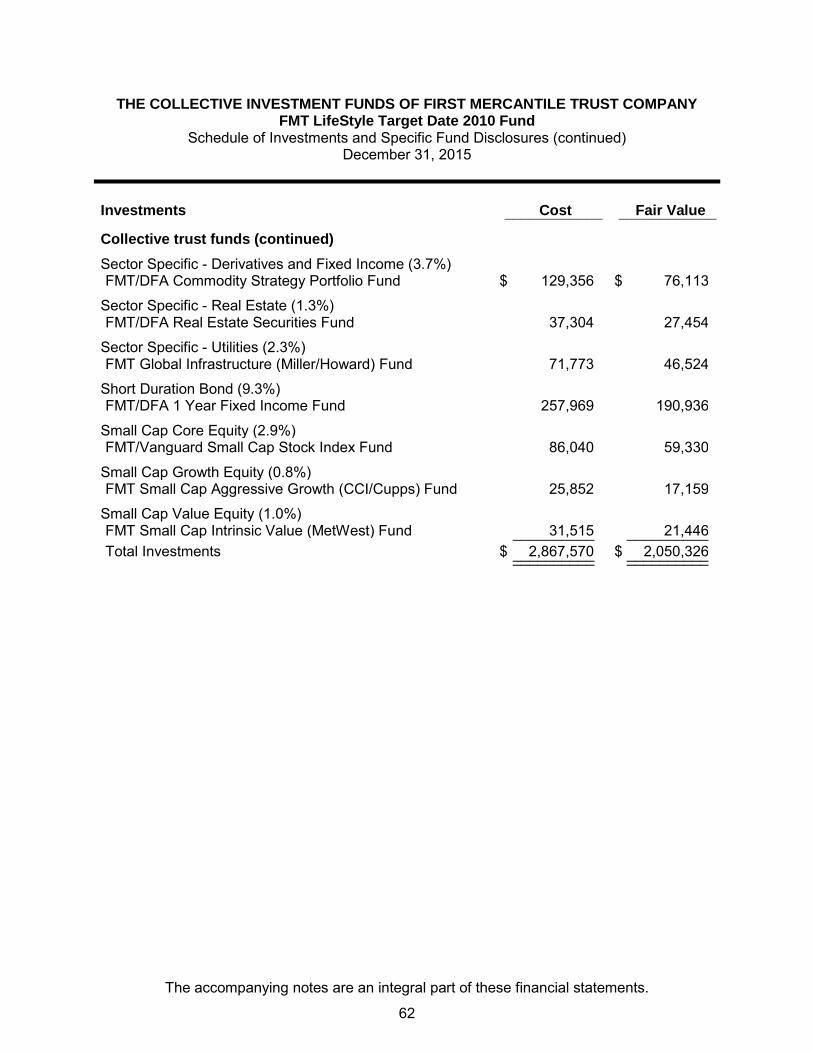
THE COLLECTIVE INVESTMENT FUNDS OF FIRST MERCANTILE TRUST COMPANY FMT LifeStyle Target Date 2010 Fund
Schedule of Investments and Specific Fund Disclosures (continued) December 31, 2015
The accompanying notes are an integral part of these financial statements.
Investments Cost Fair Value ____________ ____________
Collective trust funds (continued)
Sector Specific - Derivatives and Fixed Income (3.7%) FMT/DFA Commodity Strategy Portfolio Fund $ 129,356 $ 76,113
Sector Specific - Real Estate (1.3%) FMT/DFA Real Estate Securities Fund 37,304 27,454
Sector Specific - Utilities (2.3%) FMT Global Infrastructure (Miller/Howard) Fund 71,773 46,524
Short Duration Bond (9.3%) FMT/DFA 1 Year Fixed Income Fund 257,969 190,936
Small Cap Core Equity (2.9%) FMT/Vanguard Small Cap Stock Index Fund 86,040 59,330
Small Cap Growth Equity (0.8%) FMT Small Cap Aggressive Growth (CCI/Cupps) Fund 25,852 17,159
Small Cap Value Equity (1.0%) FMT Small Cap Intrinsic Value (MetWest) Fund 31,515 21,446 __________ __________ Total Investments $ 2,867,570 $ 2,050,326 __________ __________ __________ __________
62
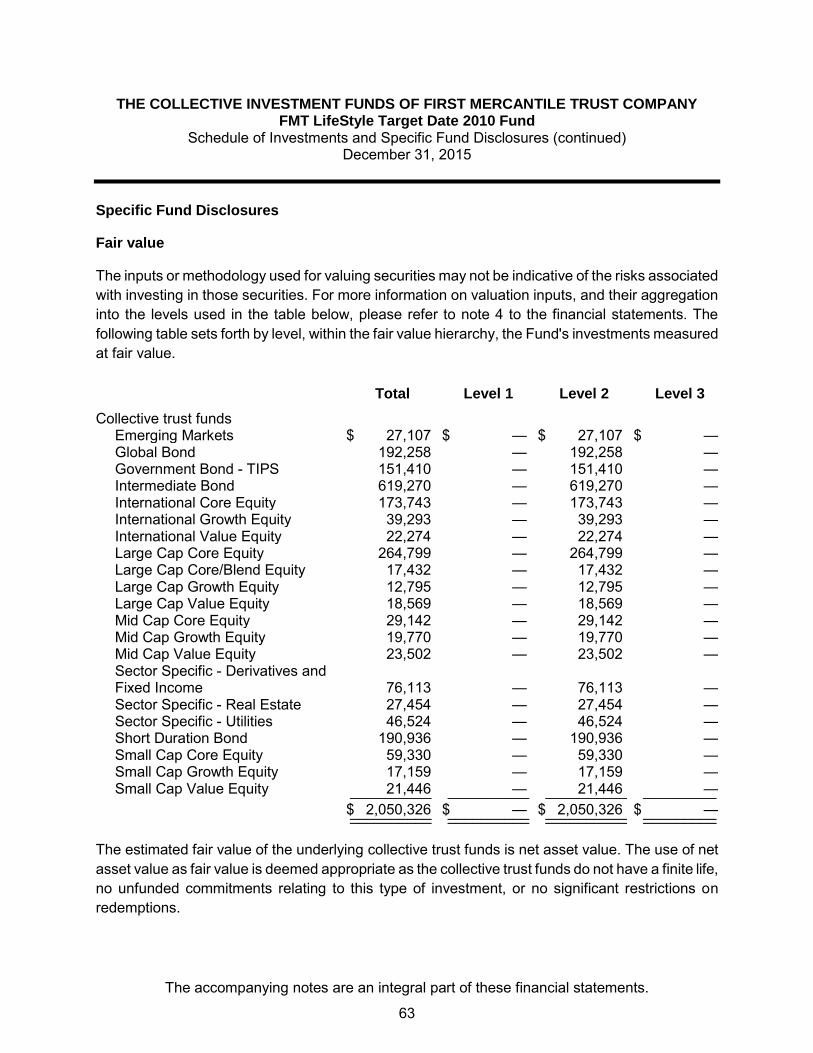
THE COLLECTIVE INVESTMENT FUNDS OF FIRST MERCANTILE TRUST COMPANY FMT LifeStyle Target Date 2010 Fund
Schedule of Investments and Specific Fund Disclosures (continued) December 31, 2015
The accompanying notes are an integral part of these financial statements.
Specific Fund Disclosures
Fair value
The inputs or methodology used for valuing securities may not be indicative of the risks associated with investing in those securities. For more information on valuation inputs, and their aggregation into the levels used in the table below, please refer to note 4 to the financial statements. The following table sets forth by level, within the fair value hierarchy, the Fund's investments measured at fair value.
Total Level 1 Level 2 Level 3
Collective trust funds Emerging Markets $ 27,107 $ — $ 27,107 $ — Global Bond 192,258 — 192,258 — Government Bond - TIPS 151,410 — 151,410 — Intermediate Bond 619,270 — 619,270 — International Core Equity 173,743 — 173,743 — International Growth Equity 39,293 — 39,293 — International Value Equity 22,274 — 22,274 — Large Cap Core Equity 264,799 — 264,799 — Large Cap Core/Blend Equity 17,432 — 17,432 — Large Cap Growth Equity 12,795 — 12,795 — Large Cap Value Equity 18,569 — 18,569 — Mid Cap Core Equity 29,142 — 29,142 — Mid Cap Growth Equity 19,770 — 19,770 — Mid Cap Value Equity 23,502 — 23,502 — Sector Specific - Derivatives and Fixed Income 76,113 — 76,113 — Sector Specific - Real Estate 27,454 — 27,454 — Sector Specific - Utilities 46,524 — 46,524 — Short Duration Bond 190,936 — 190,936 — Small Cap Core Equity 59,330 — 59,330 — Small Cap Growth Equity 17,159 — 17,159 — Small Cap Value Equity 21,446 — 21,446 — __________ __________ __________ _________
$ 2,050,326 $ — $ 2,050,326 $ — __________ __________ __________ _________ __________ __________ __________ _________ The estimated fair value of the underlying collective trust funds is net asset value. The use of net asset value as fair value is deemed appropriate as the collective trust funds do not have a finite life, no unfunded commitments relating to this type of investment, or no significant restrictions on redemptions.
63

THE COLLECTIVE INVESTMENT FUNDS OF FIRST MERCANTILE TRUST COMPANY FMT LifeStyle Target Date 2010 Fund
Schedule of Investments and Specific Fund Disclosures (continued) December 31, 2015
The accompanying notes are an integral part of these financial statements.
Investment transactions
The aggregate cost of purchases of investment securities and proceeds from sales of investment securities (other than temporary cash investments) totaled $504,786 and $1,162,892, respectively, for the year ended December 31, 2015.
Class-specific expenses Class-specific trustee fees for the year ended December 31, 2015 were as follows: Class R1 LifeStyle $ 1,012 Class R2 LifeStyle 26 Class R3 LifeStyle 44 Class R4 LifeStyle 142 Class R5 LifeStyle 472 Class R6 LifeStyle 53 $ 1,749
64

THE COLLECTIVE INVESTMENT FUNDS OF FIRST MERCANTILE TRUST COMPANY
FMT LifeStyle Target Date 2010 Fund Schedule of Participant Transactions
December 31, 2015
The accompanying notes are an integral part of these financial statements.
Participant transactions by class for the year ended December 31, 2015 were as follows: Dollars Units Purchases Redemptions Net change Purchases Redemptions Net change Class R1 LifeStyle $ 201,980 $ (920,681) $ (718,701) 74,435 (342,399) (267,964) Class R2 LifeStyle 4,972 (68,562) (63,590) 389 (5,338) (4,949) Class R3 LifeStyle 66,519 (120,437) (53,918) 5,323 (9,926) (4,603) Class R4 LifeStyle 22,558 (7,220) 15,338 1,931 (617) 1,314 Class R5 LifeStyle 254,428 (84,482) 169,946 20,067 (6,736) 13,331 Class R6 LifeStyle 3,675 (9,832) (6,157) 319 (832) (513) $ 554,132 $ (1,211,214) $ (657,082) 102,464 (365,848) (263,384)
65

THE COLLECTIVE INVESTMENT FUNDS OF FIRST MERCANTILE TRUST COMPANY
FMT LifeStyle Target Date 2010 Fund Financial Highlights December 31, 2015
The accompanying notes are an integral part of these financial statements.
Change in Net Asset Value Resulting from Operations Ratios (to average net assets)
NAV per Unit, Beginning of
Period
Net Investment
Income (Loss)(a)(b)
Net Realized and Unrealized
Gain (Loss) from
Investments(a)
Total from Investment Activities
NAV per Unit, End of
Period Total
Return Expenses(b)
Net Investment
Income (Loss)(b)
Class R1 LifeStyle $ 2.7072 $ (0.0014) $ (0.0557) $ (0.0571) $ 2.6501 (2.11) % (0.05) % (0.05) % Class R2 LifeStyle 12.8101 (0.0053) (0.2918) (0.2971) 12.5130 (2.32) % (0.04) % (0.04) % Class R3 LifeStyle 12.4207 (0.0060) (0.3022) (0.3082) 12.1125 (2.48) % (0.05) % (0.05) % Class R4 LifeStyle 11.6934 (0.0196) (0.2911) (0.3107) 11.3827 (2.66) % (0.17) % (0.17) % Class R5 LifeStyle 12.5390 (0.0313) (0.3158) (0.3471) 12.1919 (2.77) % (0.25) % (0.25) % Class R6 LifeStyle 11.5958 (0.0229) (0.3229) (0.3458) 11.2500 (2.98) % (0.20) % (0.20) % (a) Per unit amounts are based on average daily units outstanding.
(b) The Lifestyle and Multi-Managed funds (Funds of Funds) invest in a number of underlying funds within
The Collective Trust. Through November 8, 2015 these Funds of Funds did not charge an investment fee nor incur other expenses, as such charges and expenses were incurred at the respective share classes of the underlying funds. Beginning November 9, 2015 these Funds of Funds began charging an investment fee and incurring other expenses, coinciding with such Funds of Funds investing in a unique share class of the underlying funds that do not incur an investment fee or other such expenses. The purpose of this change was solely to record a more direct accounting of the charges and expenses for the Funds of Funds and underlying funds, and has no net effect on the charges or expenses of any of the funds. The Funds of Funds do not report investment income as none of the underlying funds in which these Funds of Funds invest pay dividends. Consequently, the change in NAV is due solely to realized and unrealized gains and losses, and fees, e.g., trustee, audit, charged directly to the fund. Expenses and income items for the underlying funds are shown in the financial statements for those respective funds. The effective Annual Investment Expense is shown on the respective underlying fund's quarterly profile (fact) sheet and on the Schedule of Investment Elections. The effective Annual Investment Expense for the Fund of Funds, e.g. Lifestyle fund, is the weighted average expense of all the underlying funds that compose the specific Fund of Funds.
66

FMT LifeStyle Target Date 2020 Fund

THE COLLECTIVE INVESTMENT FUNDS OF FIRST MERCANTILE TRUST COMPANY
FMT LifeStyle Target Date 2020 Fund Statement of Assets and Liabilities
December 31, 2015
The accompanying notes are an integral part of these financial statements.
Assets Investments in securities, at fair value $ 8,431,970 Liabilities Trustee fees 4,533
Net assets $ 8,427,437
Components of net assets
Units of
Participation NAV
per Unit Net
Assets Class R1 LifeStyle 307,039 $ 14.0459 $ 4,312,634
Class R2 LifeStyle 34,697 $ 13.1478 456,186
Class R3 LifeStyle 96,116 $ 12.7091 1,221,554
Class R4 LifeStyle 125,482 $ 12.1557 1,525,323
Class R5 LifeStyle 41,013 $ 12.5386 514,242
Class R6 LifeStyle 30,083 $ 11.7060 352,154
Class R7 LifeStyle 237 $ 4.7696 1,131
Class R8 LifeStyle 3,464 $ 12.7632 44,213
$ 8,427,437
67
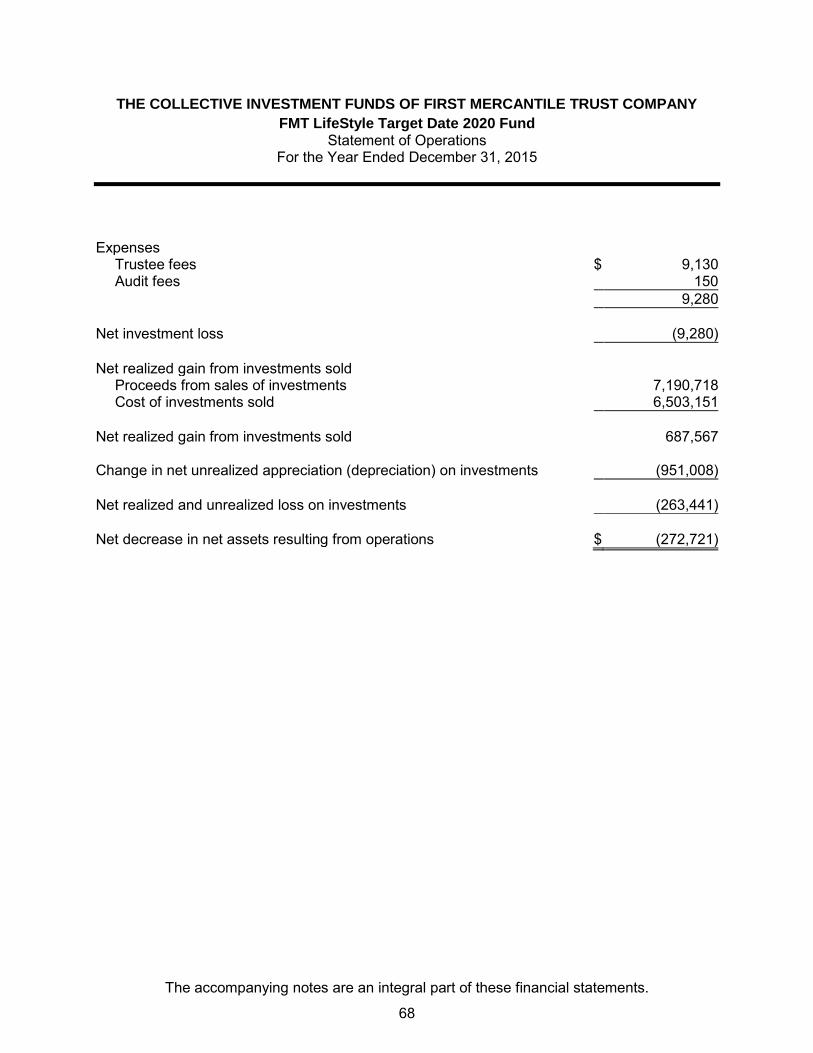
THE COLLECTIVE INVESTMENT FUNDS OF FIRST MERCANTILE TRUST COMPANY
FMT LifeStyle Target Date 2020 Fund Statement of Operations
For the Year Ended December 31, 2015
The accompanying notes are an integral part of these financial statements.
Expenses
Trustee fees $ 9,130
Audit fees 150
9,280
Net investment loss (9,280)
Net realized gain from investments sold
Proceeds from sales of investments 7,190,718
Cost of investments sold 6,503,151
Net realized gain from investments sold 687,567
Change in net unrealized appreciation (depreciation) on investments (951,008)
Net realized and unrealized loss on investments (263,441)
Net decrease in net assets resulting from operations $ (272,721)
68

THE COLLECTIVE INVESTMENT FUNDS OF FIRST MERCANTILE TRUST COMPANY
FMT LifeStyle Target Date 2020 Fund Statement of Changes in Net Assets
For the Year Ended December 31, 2015
The accompanying notes are an integral part of these financial statements.
Operations
Net investment loss $ (9,280)
Net realized gain from investments sold 687,567
Change in net unrealized appreciation (depreciation) on investments (951,008)
Net decrease in net assets resulting from operations (272,721)
Participant transactions
Proceeds from units purchased 2,501,584
Less payments for units redeemed 7,373,036
Decrease in net assets from participant transactions (4,871,452)
Total decrease in net assets (5,144,173)
Net assets at beginning of year 13,571,610
Net assets at end of year $ 8,427,437
69
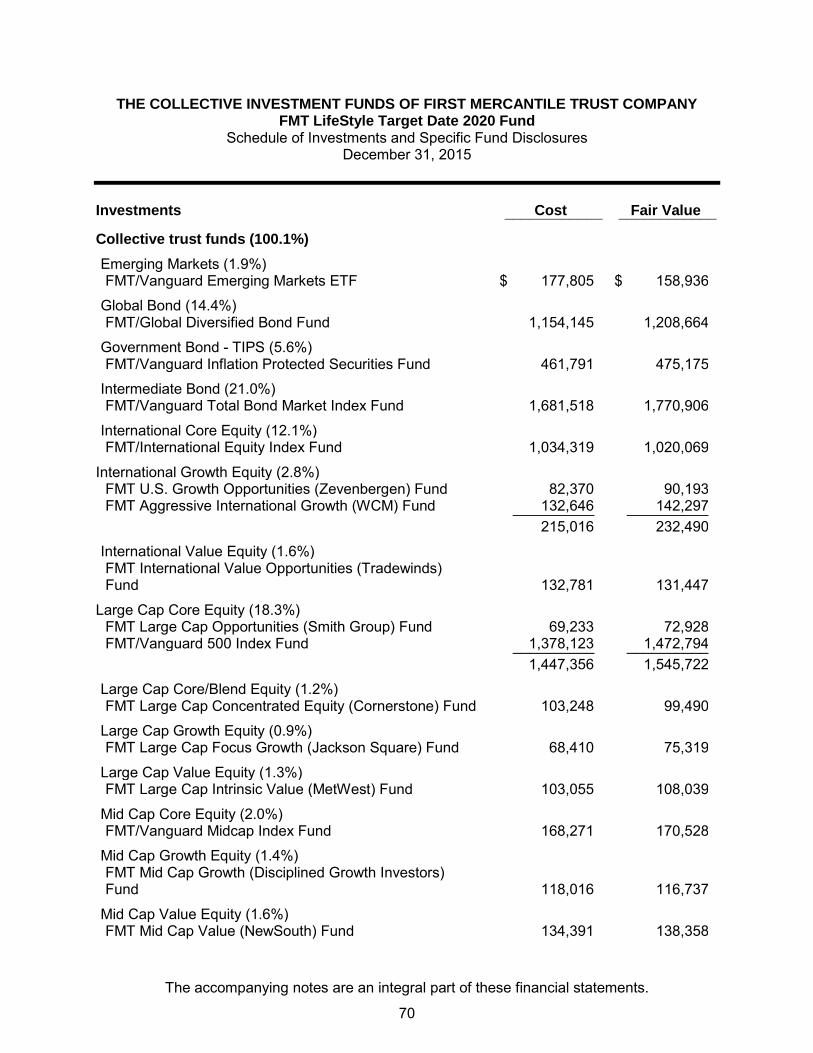
THE COLLECTIVE INVESTMENT FUNDS OF FIRST MERCANTILE TRUST COMPANY FMT LifeStyle Target Date 2020 Fund
Schedule of Investments and Specific Fund Disclosures December 31, 2015
The accompanying notes are an integral part of these financial statements.
Investments Cost Fair Value ____________ ____________
Collective trust funds (100.1%)
Emerging Markets (1.9%) FMT/Vanguard Emerging Markets ETF $ 177,805 $ 158,936
Global Bond (14.4%) FMT/Global Diversified Bond Fund 1,154,145 1,208,664
Government Bond - TIPS (5.6%) FMT/Vanguard Inflation Protected Securities Fund 461,791 475,175
Intermediate Bond (21.0%) FMT/Vanguard Total Bond Market Index Fund 1,681,518 1,770,906
International Core Equity (12.1%) FMT/International Equity Index Fund 1,034,319 1,020,069
International Growth Equity (2.8%) FMT U.S. Growth Opportunities (Zevenbergen) Fund 82,370 90,193 FMT Aggressive International Growth (WCM) Fund 132,646 142,297 __________ __________ 215,016 232,490
International Value Equity (1.6%)
FMT International Value Opportunities (Tradewinds) Fund 132,781 131,447
Large Cap Core Equity (18.3%) FMT Large Cap Opportunities (Smith Group) Fund 69,233 72,928 FMT/Vanguard 500 Index Fund 1,378,123 1,472,794 __________ __________ 1,447,356 1,545,722
Large Cap Core/Blend Equity (1.2%) FMT Large Cap Concentrated Equity (Cornerstone) Fund 103,248 99,490
Large Cap Growth Equity (0.9%) FMT Large Cap Focus Growth (Jackson Square) Fund 68,410 75,319
Large Cap Value Equity (1.3%) FMT Large Cap Intrinsic Value (MetWest) Fund 103,055 108,039
Mid Cap Core Equity (2.0%) FMT/Vanguard Midcap Index Fund 168,271 170,528
Mid Cap Growth Equity (1.4%)
FMT Mid Cap Growth (Disciplined Growth Investors) Fund 118,016 116,737
Mid Cap Value Equity (1.6%) FMT Mid Cap Value (NewSouth) Fund 134,391 138,358
70

THE COLLECTIVE INVESTMENT FUNDS OF FIRST MERCANTILE TRUST COMPANY FMT LifeStyle Target Date 2020 Fund
Schedule of Investments and Specific Fund Disclosures (continued) December 31, 2015
The accompanying notes are an integral part of these financial statements.
Investments Cost Fair Value ____________ ____________
Collective trust funds (continued)
Sector Specific - Derivatives and Fixed Income (3.3%) FMT/DFA Commodity Strategy Portfolio Fund $ 330,934 $ 279,941
Sector Specific - Real Estate (1.6%) FMT/DFA Real Estate Securities Fund 123,750 130,595
Sector Specific - Utilities (2.3%) FMT Global Infrastructure (Miller/Howard) Fund 206,664 192,228
Small Cap Core Equity (4.1%) FMT/Vanguard Small Cap Stock Index Fund 351,541 347,936
Small Cap Growth Equity (1.2%) FMT Small Cap Aggressive Growth (CCI/Cupps) Fund 105,711 102,476
Small Cap Value Equity (1.5%) FMT Small Cap Intrinsic Value (MetWest) Fund 129,518 126,914 __________ __________ Total Investments $ 8,248,240 $ 8,431,970 __________ __________ __________ __________
71

THE COLLECTIVE INVESTMENT FUNDS OF FIRST MERCANTILE TRUST COMPANY FMT LifeStyle Target Date 2020 Fund
Schedule of Investments and Specific Fund Disclosures (continued) December 31, 2015
The accompanying notes are an integral part of these financial statements.
Specific Fund Disclosures
Fair value
The inputs or methodology used for valuing securities may not be indicative of the risks associated with investing in those securities. For more information on valuation inputs, and their aggregation into the levels used in the table below, please refer to note 4 to the financial statements. The following table sets forth by level, within the fair value hierarchy, the Fund's investments measured at fair value.
Total Level 1 Level 2 Level 3
Collective trust funds Emerging Markets $ 158,936 $ — $ 158,936 $ — Global Bond 1,208,664 — 1,208,664 — Government Bond - TIPS 475,175 — 475,175 — Intermediate Bond 1,770,906 — 1,770,906 — International Core Equity 1,020,069 — 1,020,069 — International Growth Equity 232,490 — 232,490 — International Value Equity 131,447 — 131,447 — Large Cap Core Equity 1,545,722 — 1,545,722 — Large Cap Core/Blend Equity 99,490 — 99,490 — Large Cap Growth Equity 75,319 — 75,319 — Large Cap Value Equity 108,039 — 108,039 — Mid Cap Core Equity 170,528 — 170,528 — Mid Cap Growth Equity 116,737 — 116,737 — Mid Cap Value Equity 138,358 — 138,358 — Sector Specific - Derivatives and Fixed Income 279,941 — 279,941 — Sector Specific - Real Estate 130,595 — 130,595 — Sector Specific - Utilities 192,228 — 192,228 — Small Cap Core Equity 347,936 — 347,936 — Small Cap Growth Equity 102,476 — 102,476 — Small Cap Value Equity 126,914 — 126,914 — __________ __________ __________ _________
$ 8,431,970 $ — $ 8,431,970 $ — __________ __________ __________ _________ __________ __________ __________ _________
The estimated fair value of the underlying collective trust funds is net asset value. The use of net asset value as fair value is deemed appropriate as the collective trust funds do not have a finite life, no unfunded commitments relating to this type of investment, or no significant restrictions on redemptions.
72

THE COLLECTIVE INVESTMENT FUNDS OF FIRST MERCANTILE TRUST COMPANY FMT LifeStyle Target Date 2020 Fund
Schedule of Investments and Specific Fund Disclosures (continued) December 31, 2015
The accompanying notes are an integral part of these financial statements.
Investment transactions
The aggregate cost of purchases of investment securities and proceeds from sales of investment securities (other than temporary cash investments) totaled $2,314,519 and $7,190,718, respectively, for the year ended December 31, 2015.
Class-specific expenses Class-specific trustee fees for the year ended December 31, 2015 were as follows: Class R1 LifeStyle $ 2,798 Class R2 LifeStyle 613 Class R3 LifeStyle 1,521 Class R4 LifeStyle 2,496 Class R5 LifeStyle 897 Class R6 LifeStyle 680 Class R7 LifeStyle 14 Class R8 LifeStyle 111 $ 9,130
73

THE COLLECTIVE INVESTMENT FUNDS OF FIRST MERCANTILE TRUST COMPANY
FMT LifeStyle Target Date 2020 Fund Schedule of Participant Transactions
December 31, 2015
The accompanying notes are an integral part of these financial statements.
Participant transactions by class for the year ended December 31, 2015 were as follows: Dollars Units Purchases Redemptions Net change Purchases Redemptions Net change Class R1 LifeStyle $ 616,779 $ (5,475,799) $ (4,859,020) 42,494 (381,456) (338,962) Class R2 LifeStyle 261,899 (507,422) (245,523) 19,161 (37,848) (18,687) Class R3 LifeStyle 542,489 (429,817) 112,672 41,218 (33,877) 7,341 Class R4 LifeStyle 589,745 (386,474) 203,271 46,398 (31,662) 14,736 Class R5 LifeStyle 385,278 (280,785) 104,493 29,286 (22,381) 6,905 Class R6 LifeStyle 81,935 (74,706) 7,229 6,774 (6,021) 753 Class R7 LifeStyle 1,648 (82,288) (80,640) 334 (16,892) (16,558) Class R8 LifeStyle 21,811 (135,745) (113,934) 1,628 (10,266) (8,638) $ 2,501,584 $ (7,373,036) $ (4,871,452) 187,293 (540,403) (353,110)
74
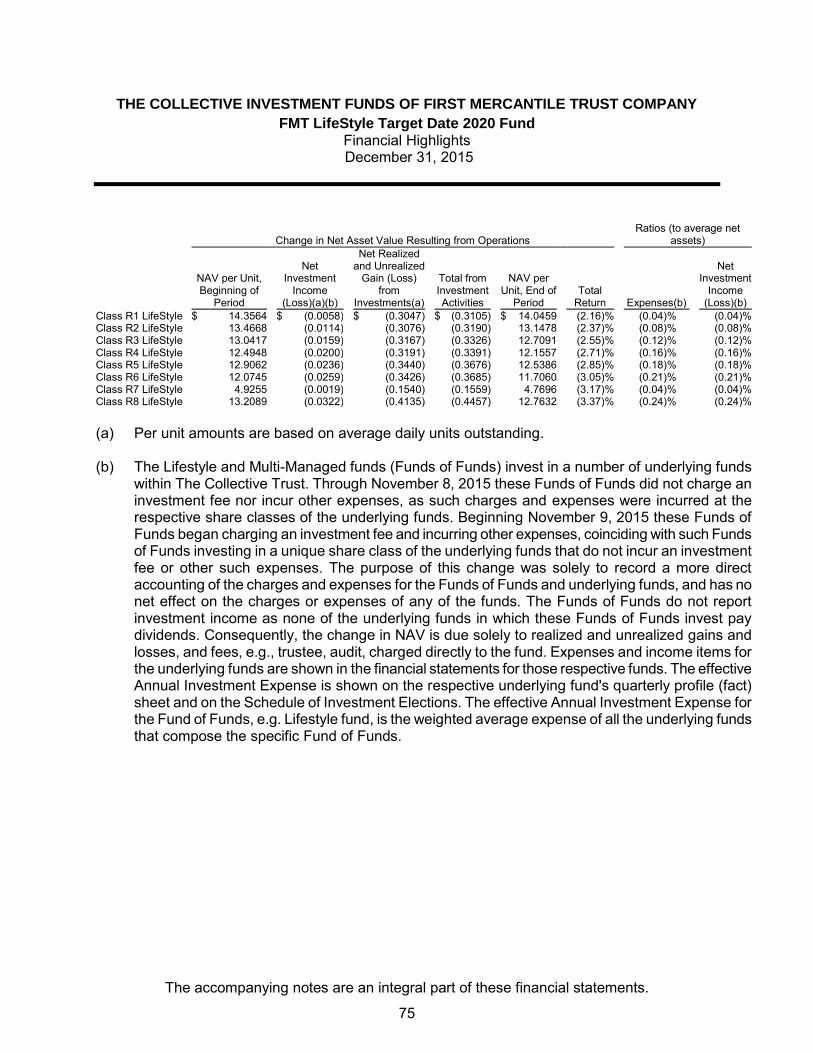
THE COLLECTIVE INVESTMENT FUNDS OF FIRST MERCANTILE TRUST COMPANY
FMT LifeStyle Target Date 2020 Fund Financial Highlights December 31, 2015
The accompanying notes are an integral part of these financial statements.
Change in Net Asset Value Resulting from Operations Ratios (to average net
assets)
NAV per Unit, Beginning of
Period
Net Investment
Income (Loss)(a)(b)
Net Realized and Unrealized
Gain (Loss) from
Investments(a)
Total from Investment Activities
NAV per Unit, End of
Period Total
Return Expenses(b)
Net Investment
Income (Loss)(b)
Class R1 LifeStyle $ 14.3564 $ (0.0058) $ (0.3047) $ (0.3105) $ 14.0459 (2.16) % (0.04) % (0.04) % Class R2 LifeStyle 13.4668 (0.0114) (0.3076) (0.3190) 13.1478 (2.37) % (0.08) % (0.08) % Class R3 LifeStyle 13.0417 (0.0159) (0.3167) (0.3326) 12.7091 (2.55) % (0.12) % (0.12) % Class R4 LifeStyle 12.4948 (0.0200) (0.3191) (0.3391) 12.1557 (2.71) % (0.16) % (0.16) % Class R5 LifeStyle 12.9062 (0.0236) (0.3440) (0.3676) 12.5386 (2.85) % (0.18) % (0.18) % Class R6 LifeStyle 12.0745 (0.0259) (0.3426) (0.3685) 11.7060 (3.05) % (0.21) % (0.21) % Class R7 LifeStyle 4.9255 (0.0019) (0.1540) (0.1559) 4.7696 (3.17) % (0.04) % (0.04) % Class R8 LifeStyle 13.2089 (0.0322) (0.4135) (0.4457) 12.7632 (3.37) % (0.24) % (0.24) % (a) Per unit amounts are based on average daily units outstanding.
(b) The Lifestyle and Multi-Managed funds (Funds of Funds) invest in a number of underlying funds
within The Collective Trust. Through November 8, 2015 these Funds of Funds did not charge an investment fee nor incur other expenses, as such charges and expenses were incurred at the respective share classes of the underlying funds. Beginning November 9, 2015 these Funds of Funds began charging an investment fee and incurring other expenses, coinciding with such Funds of Funds investing in a unique share class of the underlying funds that do not incur an investment fee or other such expenses. The purpose of this change was solely to record a more direct accounting of the charges and expenses for the Funds of Funds and underlying funds, and has no net effect on the charges or expenses of any of the funds. The Funds of Funds do not report investment income as none of the underlying funds in which these Funds of Funds invest pay dividends. Consequently, the change in NAV is due solely to realized and unrealized gains and losses, and fees, e.g., trustee, audit, charged directly to the fund. Expenses and income items for the underlying funds are shown in the financial statements for those respective funds. The effective Annual Investment Expense is shown on the respective underlying fund's quarterly profile (fact) sheet and on the Schedule of Investment Elections. The effective Annual Investment Expense for the Fund of Funds, e.g. Lifestyle fund, is the weighted average expense of all the underlying funds that compose the specific Fund of Funds.
75

FMT LifeStyle Target Date 2030 Fund
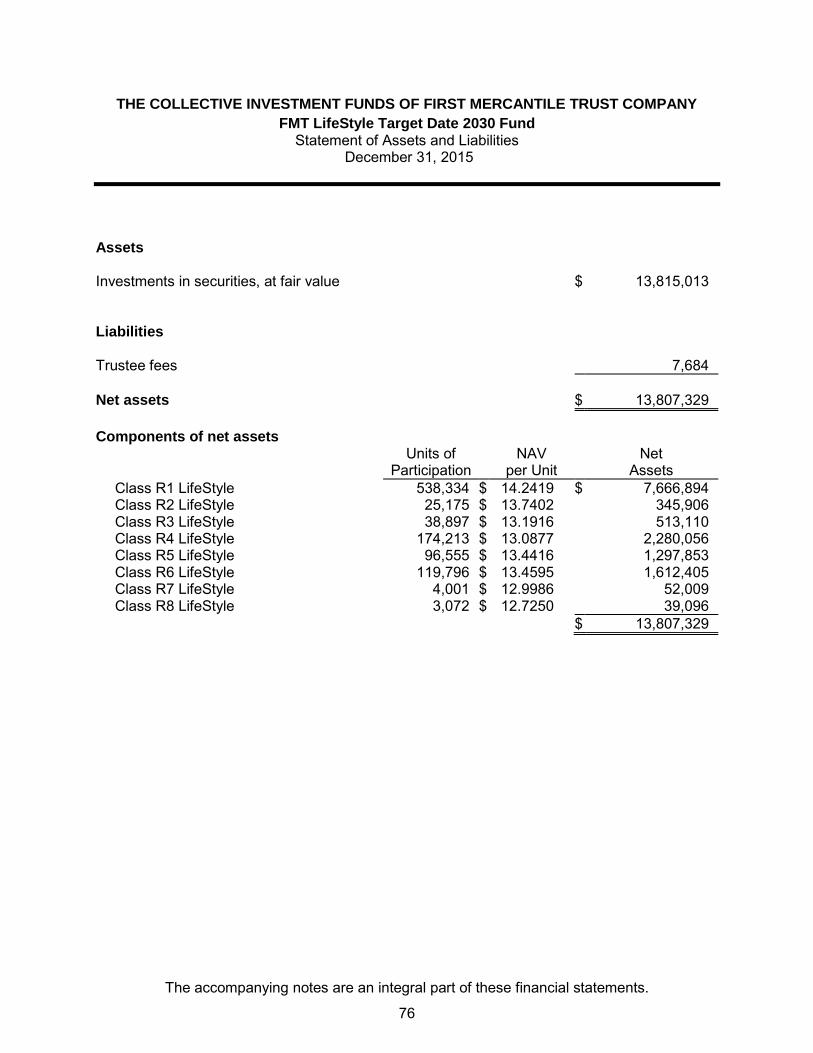
THE COLLECTIVE INVESTMENT FUNDS OF FIRST MERCANTILE TRUST COMPANY
FMT LifeStyle Target Date 2030 Fund Statement of Assets and Liabilities
December 31, 2015
The accompanying notes are an integral part of these financial statements.
Assets Investments in securities, at fair value $ 13,815,013 Liabilities Trustee fees 7,684
Net assets $ 13,807,329
Components of net assets
Units of
Participation NAV
per Unit Net
Assets Class R1 LifeStyle 538,334 $ 14.2419 $ 7,666,894
Class R2 LifeStyle 25,175 $ 13.7402 345,906
Class R3 LifeStyle 38,897 $ 13.1916 513,110
Class R4 LifeStyle 174,213 $ 13.0877 2,280,056
Class R5 LifeStyle 96,555 $ 13.4416 1,297,853
Class R6 LifeStyle 119,796 $ 13.4595 1,612,405
Class R7 LifeStyle 4,001 $ 12.9986 52,009
Class R8 LifeStyle 3,072 $ 12.7250 39,096
$ 13,807,329
76
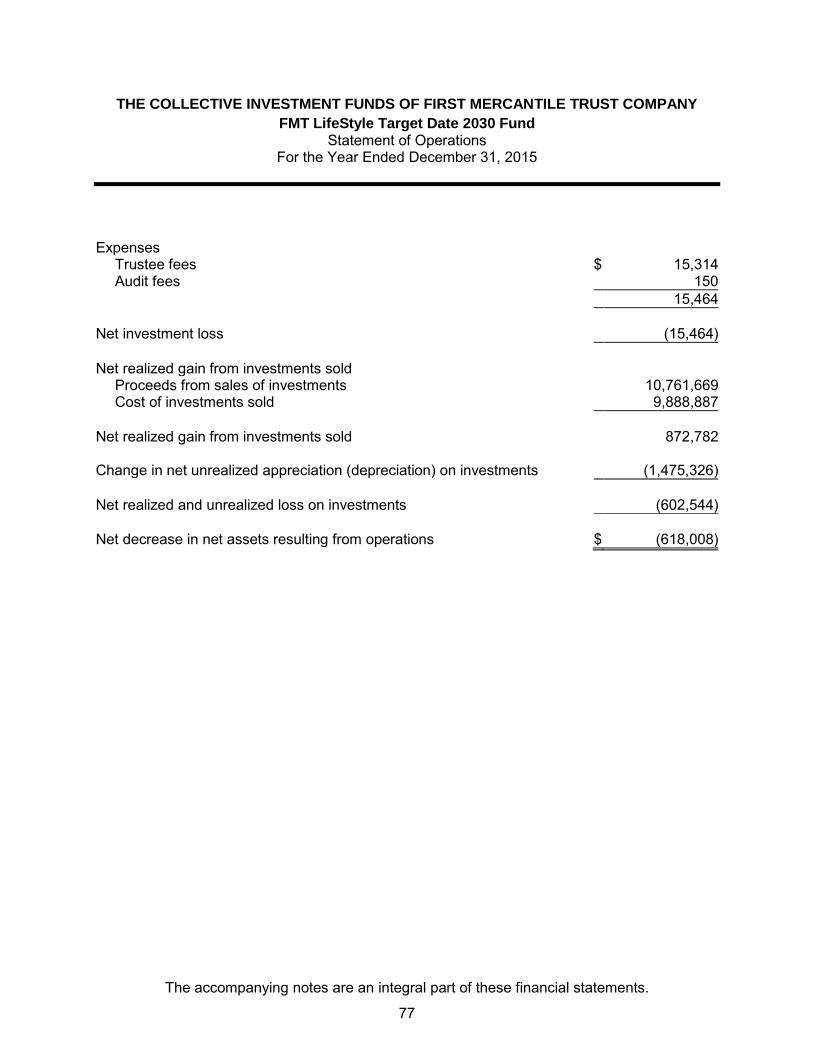
THE COLLECTIVE INVESTMENT FUNDS OF FIRST MERCANTILE TRUST COMPANY
FMT LifeStyle Target Date 2030 Fund Statement of Operations
For the Year Ended December 31, 2015
The accompanying notes are an integral part of these financial statements.
Expenses
Trustee fees $ 15,314
Audit fees 150
15,464
Net investment loss (15,464)
Net realized gain from investments sold
Proceeds from sales of investments 10,761,669
Cost of investments sold 9,888,887
Net realized gain from investments sold 872,782
Change in net unrealized appreciation (depreciation) on investments (1,475,326)
Net realized and unrealized loss on investments (602,544)
Net decrease in net assets resulting from operations $ (618,008)
77

THE COLLECTIVE INVESTMENT FUNDS OF FIRST MERCANTILE TRUST COMPANY
FMT LifeStyle Target Date 2030 Fund Statement of Changes in Net Assets
For the Year Ended December 31, 2015
The accompanying notes are an integral part of these financial statements.
Operations
Net investment loss $ (15,464)
Net realized gain from investments sold 872,782
Change in net unrealized appreciation (depreciation) on investments (1,475,326)
Net decrease in net assets resulting from operations (618,008)
Participant transactions
Proceeds from units purchased 5,237,992
Less payments for units redeemed 11,382,924
Decrease in net assets from participant transactions (6,144,932)
Total decrease in net assets (6,762,940)
Net assets at beginning of year 20,570,269
Net assets at end of year $ 13,807,329
78
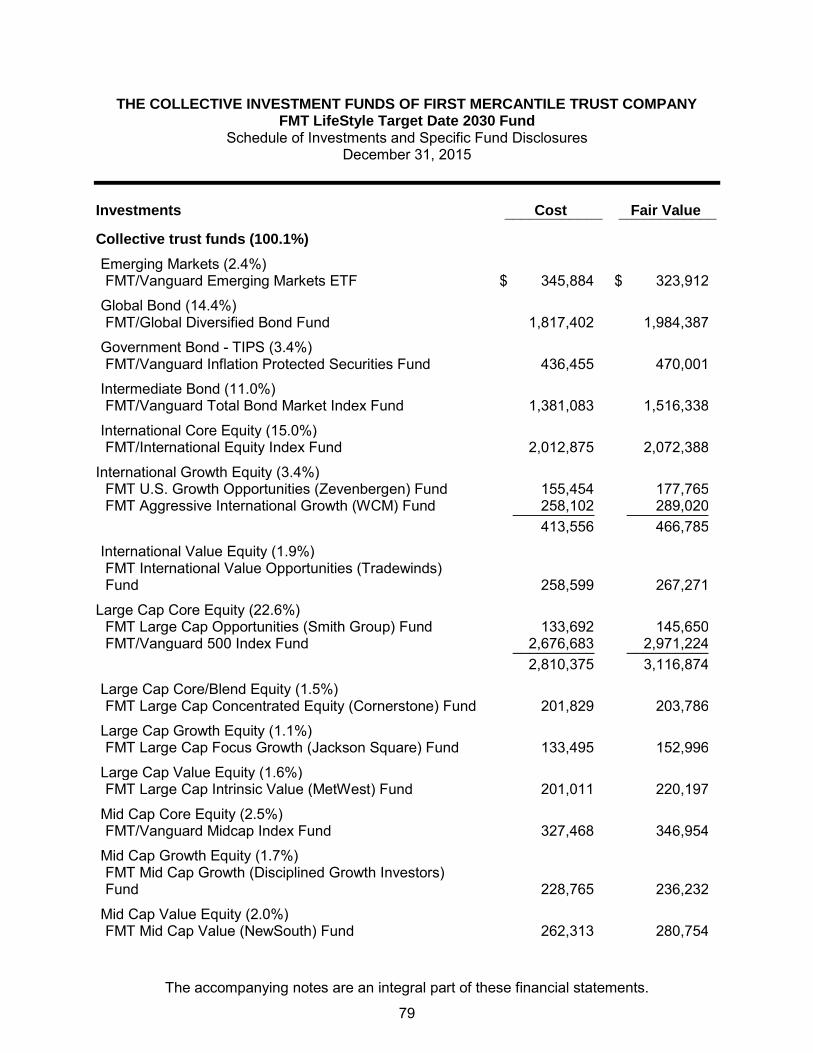
THE COLLECTIVE INVESTMENT FUNDS OF FIRST MERCANTILE TRUST COMPANY FMT LifeStyle Target Date 2030 Fund
Schedule of Investments and Specific Fund Disclosures December 31, 2015
The accompanying notes are an integral part of these financial statements.
Investments Cost Fair Value ____________ ____________
Collective trust funds (100.1%)
Emerging Markets (2.4%) FMT/Vanguard Emerging Markets ETF $ 345,884 $ 323,912
Global Bond (14.4%) FMT/Global Diversified Bond Fund 1,817,402 1,984,387
Government Bond - TIPS (3.4%) FMT/Vanguard Inflation Protected Securities Fund 436,455 470,001
Intermediate Bond (11.0%) FMT/Vanguard Total Bond Market Index Fund 1,381,083 1,516,338
International Core Equity (15.0%) FMT/International Equity Index Fund 2,012,875 2,072,388
International Growth Equity (3.4%) FMT U.S. Growth Opportunities (Zevenbergen) Fund 155,454 177,765 FMT Aggressive International Growth (WCM) Fund 258,102 289,020 __________ __________ 413,556 466,785
International Value Equity (1.9%)
FMT International Value Opportunities (Tradewinds) Fund 258,599 267,271
Large Cap Core Equity (22.6%) FMT Large Cap Opportunities (Smith Group) Fund 133,692 145,650 FMT/Vanguard 500 Index Fund 2,676,683 2,971,224 __________ __________ 2,810,375 3,116,874
Large Cap Core/Blend Equity (1.5%) FMT Large Cap Concentrated Equity (Cornerstone) Fund 201,829 203,786
Large Cap Growth Equity (1.1%) FMT Large Cap Focus Growth (Jackson Square) Fund 133,495 152,996
Large Cap Value Equity (1.6%) FMT Large Cap Intrinsic Value (MetWest) Fund 201,011 220,197
Mid Cap Core Equity (2.5%) FMT/Vanguard Midcap Index Fund 327,468 346,954
Mid Cap Growth Equity (1.7%)
FMT Mid Cap Growth (Disciplined Growth Investors) Fund 228,765 236,232
Mid Cap Value Equity (2.0%) FMT Mid Cap Value (NewSouth) Fund 262,313 280,754
79

THE COLLECTIVE INVESTMENT FUNDS OF FIRST MERCANTILE TRUST COMPANY FMT LifeStyle Target Date 2030 Fund
Schedule of Investments and Specific Fund Disclosures (continued) December 31, 2015
The accompanying notes are an integral part of these financial statements.
Investments Cost Fair Value ____________ ____________
Collective trust funds (continued)
Sector Specific - Derivatives and Fixed Income (2.9%) FMT/DFA Commodity Strategy Portfolio Fund $ 457,759 $ 403,889
Sector Specific - Real Estate (1.9%) FMT/DFA Real Estate Securities Fund 234,034 258,775
Sector Specific - Utilities (2.3%) FMT Global Infrastructure (Miller/Howard) Fund 326,026 318,390
Small Cap Core Equity (5.1%) FMT/Vanguard Small Cap Stock Index Fund 686,335 709,343
Small Cap Growth Equity (1.5%) FMT Small Cap Aggressive Growth (CCI/Cupps) Fund 205,694 208,788
Small Cap Value Equity (1.9%) FMT Small Cap Intrinsic Value (MetWest) Fund 252,271 256,953 __________ __________ Total Investments $ 12,993,229 $ 13,815,013 __________ __________ __________ __________
80
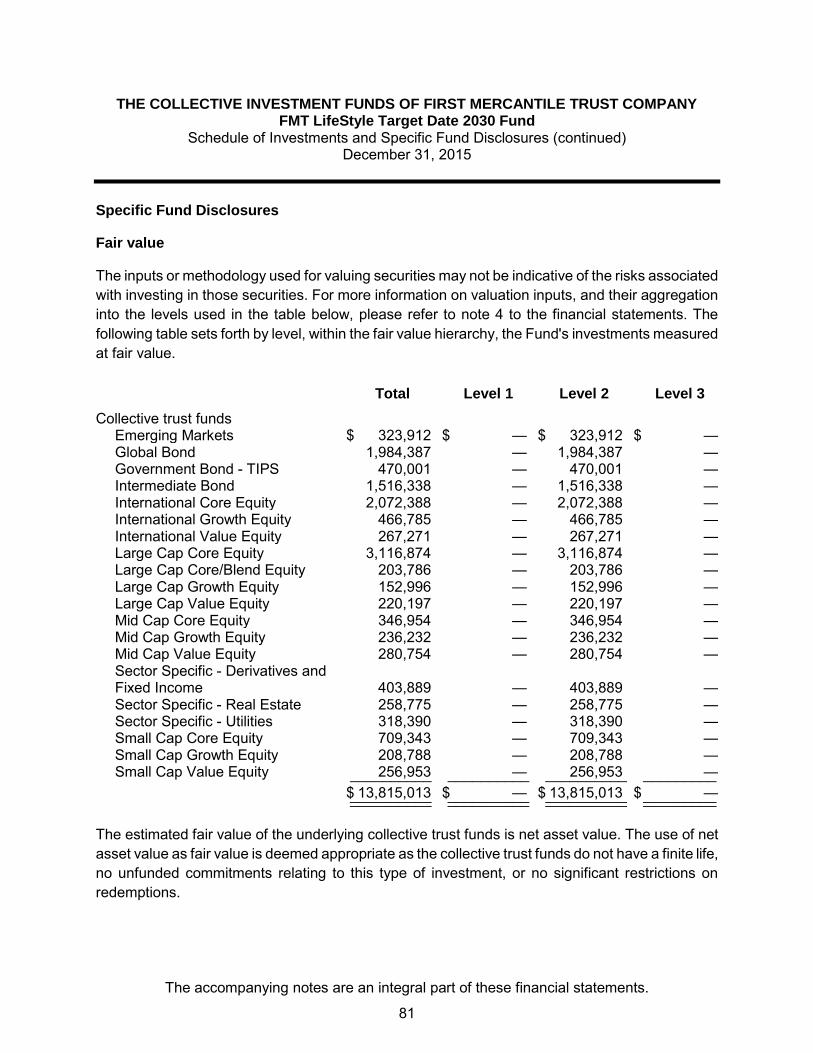
THE COLLECTIVE INVESTMENT FUNDS OF FIRST MERCANTILE TRUST COMPANY FMT LifeStyle Target Date 2030 Fund
Schedule of Investments and Specific Fund Disclosures (continued) December 31, 2015
The accompanying notes are an integral part of these financial statements.
Specific Fund Disclosures
Fair value
The inputs or methodology used for valuing securities may not be indicative of the risks associated with investing in those securities. For more information on valuation inputs, and their aggregation into the levels used in the table below, please refer to note 4 to the financial statements. The following table sets forth by level, within the fair value hierarchy, the Fund's investments measured at fair value.
Total Level 1 Level 2 Level 3
Collective trust funds Emerging Markets $ 323,912 $ — $ 323,912 $ — Global Bond 1,984,387 — 1,984,387 — Government Bond - TIPS 470,001 — 470,001 — Intermediate Bond 1,516,338 — 1,516,338 — International Core Equity 2,072,388 — 2,072,388 — International Growth Equity 466,785 — 466,785 — International Value Equity 267,271 — 267,271 — Large Cap Core Equity 3,116,874 — 3,116,874 — Large Cap Core/Blend Equity 203,786 — 203,786 — Large Cap Growth Equity 152,996 — 152,996 — Large Cap Value Equity 220,197 — 220,197 — Mid Cap Core Equity 346,954 — 346,954 — Mid Cap Growth Equity 236,232 — 236,232 — Mid Cap Value Equity 280,754 — 280,754 — Sector Specific - Derivatives and Fixed Income 403,889 — 403,889 — Sector Specific - Real Estate 258,775 — 258,775 — Sector Specific - Utilities 318,390 — 318,390 — Small Cap Core Equity 709,343 — 709,343 — Small Cap Growth Equity 208,788 — 208,788 — Small Cap Value Equity 256,953 — 256,953 — __________ __________ __________ _________
$ 13,815,013 $ — $ 13,815,013 $ — __________ __________ __________ _________ __________ __________ __________ _________ The estimated fair value of the underlying collective trust funds is net asset value. The use of net asset value as fair value is deemed appropriate as the collective trust funds do not have a finite life, no unfunded commitments relating to this type of investment, or no significant restrictions on redemptions.
81
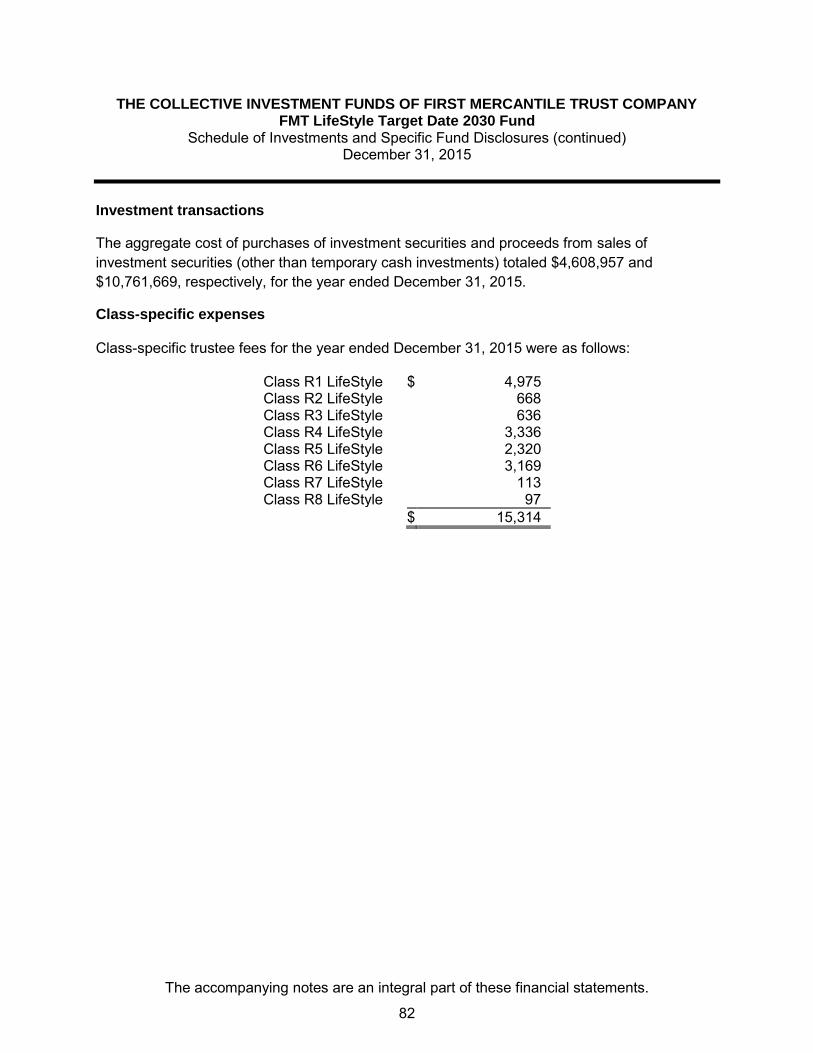
THE COLLECTIVE INVESTMENT FUNDS OF FIRST MERCANTILE TRUST COMPANY FMT LifeStyle Target Date 2030 Fund
Schedule of Investments and Specific Fund Disclosures (continued) December 31, 2015
The accompanying notes are an integral part of these financial statements.
Investment transactions
The aggregate cost of purchases of investment securities and proceeds from sales of investment securities (other than temporary cash investments) totaled $4,608,957 and $10,761,669, respectively, for the year ended December 31, 2015.
Class-specific expenses Class-specific trustee fees for the year ended December 31, 2015 were as follows: Class R1 LifeStyle $ 4,975 Class R2 LifeStyle 668 Class R3 LifeStyle 636 Class R4 LifeStyle 3,336 Class R5 LifeStyle 2,320 Class R6 LifeStyle 3,169 Class R7 LifeStyle 113 Class R8 LifeStyle 97 $ 15,314
82

THE COLLECTIVE INVESTMENT FUNDS OF FIRST MERCANTILE TRUST COMPANY
FMT LifeStyle Target Date 2030 Fund Schedule of Participant Transactions
December 31, 2015
The accompanying notes are an integral part of these financial statements.
Participant transactions by class for the year ended December 31, 2015 were as follows: Dollars Units Purchases Redemptions Net change Purchases Redemptions Net change Class R1 LifeStyle $ 2,292,385 $ (7,422,304) $ (5,129,919) 156,221 (519,651) (363,430) Class R2 LifeStyle 451,184 (1,018,872) (567,688) 31,339 (72,868) (41,529) Class R3 LifeStyle 302,282 (1,498,714) (1,196,432) 22,160 (115,427) (93,267) Class R4 LifeStyle 721,981 (441,804) 280,177 53,914 (32,954) 20,960 Class R5 LifeStyle 1,226,849 (642,608) 584,241 86,322 (46,255) 40,067 Class R6 LifeStyle 203,684 (204,523) (839) 14,542 (14,393) 149 Class R7 LifeStyle 24,497 (25,380) (883) 1,814 (1,908) (94) Class R8 LifeStyle 15,130 (128,719) (113,589) 1,140 (9,752) (8,612) $ 5,237,992 $ (11,382,924) $ (6,144,932) 367,452 (813,208) (445,756)
83

THE COLLECTIVE INVESTMENT FUNDS OF FIRST MERCANTILE TRUST COMPANY
FMT LifeStyle Target Date 2030 Fund Financial Highlights December 31, 2015
The accompanying notes are an integral part of these financial statements.
Change in Net Asset Value Resulting from Operations Ratios (to average net
assets)
NAV per Unit, Beginning of
Period
Net Investment
Income (Loss)(a)(b)
Net Realized and Unrealized
Gain (Loss) from
Investments(a)
Total from Investment Activities
NAV per Unit, End of Period
Total Return Expenses(b)
Net Investment
Income (Loss)(b)
Class R1 LifeStyle $ 14.5590 $ (0.0060) $ (0.3111) $ (0.3171) $ 14.2419 (2.18) % (0.04) % (0.04) % Class R2 LifeStyle 14.0737 (0.0101) (0.3234) (0.3335) 13.7402 (2.37) % (0.07) % (0.07) % Class R3 LifeStyle 13.5410 (0.0058) (0.3436) (0.3494) 13.1916 (2.58) % (0.04) % (0.04) % Class R4 LifeStyle 13.4516 (0.0213) (0.3426) (0.3639) 13.0877 (2.71) % (0.16) % (0.16) % Class R5 LifeStyle 13.8363 (0.0288) (0.3659) (0.3947) 13.4416 (2.85) % (0.21) % (0.21) % Class R6 LifeStyle 13.8838 (0.0288) (0.3955) (0.4243) 13.4595 (3.06) % (0.21) % (0.21) % Class R7 LifeStyle 13.4270 (0.0260) (0.4024) (0.4284) 12.9986 (3.19) % (0.19) % (0.19) % Class R8 LifeStyle 13.1685 (0.0368) (0.4067) (0.4435) 12.7250 (3.37) % (0.28) % (0.28) % (a) Per unit amounts are based on average daily units outstanding.
(b) The Lifestyle and Multi-Managed funds (Funds of Funds) invest in a number of underlying funds
within The Collective Trust. Through November 8, 2015 these Funds of Funds did not charge an investment fee nor incur other expenses, as such charges and expenses were incurred at the respective share classes of the underlying funds. Beginning November 9, 2015 these Funds of Funds began charging an investment fee and incurring other expenses, coinciding with such Funds of Funds investing in a unique share class of the underlying funds that do not incur an investment fee or other such expenses. The purpose of this change was solely to record a more direct accounting of the charges and expenses for the Funds of Funds and underlying funds, and has no net effect on the charges or expenses of any of the funds. The Funds of Funds do not report investment income as none of the underlying funds in which these Funds of Funds invest pay dividends. Consequently, the change in NAV is due solely to realized and unrealized gains and losses, and fees, e.g., trustee, audit, charged directly to the fund. Expenses and income items for the underlying funds are shown in the financial statements for those respective funds. The effective Annual Investment Expense is shown on the respective underlying fund's quarterly profile (fact) sheet and on the Schedule of Investment Elections. The effective Annual Investment Expense for the Fund of Funds, e.g. Lifestyle fund, is the weighted average expense of all the underlying funds that compose the specific Fund of Funds.
84

FMT LifeStyle Target Date 2040 Fund

THE COLLECTIVE INVESTMENT FUNDS OF FIRST MERCANTILE TRUST COMPANY FMT LifeStyle Target Date 2040 Fund
Statement of Assets and Liabilities December 31, 2015
The accompanying notes are an integral part of these financial statements.
Assets Investments in securities, at fair value $ 9,540,819 Liabilities Trustee fees 5,127 Net assets $ 9,535,692 Components of net assets
Units of
Participation NAV
per Unit Net
Assets Class R1 LifeStyle 346,293 $ 14.0787 $ 4,875,350Class R2 LifeStyle 49,255 $ 14.0064 689,885Class R3 LifeStyle 89,618 $ 13.4568 1,205,980Class R4 LifeStyle 90,024 $ 13.0537 1,175,149Class R5 LifeStyle 40,451 $ 13.7282 555,322Class R6 LifeStyle 50,912 $ 13.4012 682,284Class R7 LifeStyle 13,152 $ 13.5812 178,620Class R8 LifeStyle 13,337 $ 12.9792 173,102
$ 9,535,692
85

THE COLLECTIVE INVESTMENT FUNDS OF FIRST MERCANTILE TRUST COMPANY FMT LifeStyle Target Date 2040 Fund
Statement of Operations For the Year Ended December 31, 2015
The accompanying notes are an integral part of these financial statements.
Expenses
Trustee fees $ 10,208Audit fees 150
10,358 Net investment loss (10,358) Net realized gain from investments sold
Proceeds from sales of investments 3,818,245Cost of investments sold 3,571,637
Net realized gain from investments sold 246,608 Change in net unrealized appreciation (depreciation) on investments (525,825) Net realized and unrealized loss on investments (279,217) Net decrease in net assets resulting from operations $ (289,575)
86

THE COLLECTIVE INVESTMENT FUNDS OF FIRST MERCANTILE TRUST COMPANY FMT LifeStyle Target Date 2040 Fund
Statement of Changes in Net Assets For the Year Ended December 31, 2015
The accompanying notes are an integral part of these financial statements.
Operations
Net investment loss $ (10,358)
Net realized gain from investments sold 246,608
Change in net unrealized appreciation (depreciation) on investments (525,825)
Net decrease in net assets resulting from operations (289,575) Participant transactions
Proceeds from units purchased 3,268,295Less payments for units redeemed 4,589,331
Decrease in net assets from participant transactions (1,321,036)
Total decrease in net assets (1,610,611) Net assets at beginning of year 11,146,303 Net assets at end of year $ 9,535,692
87
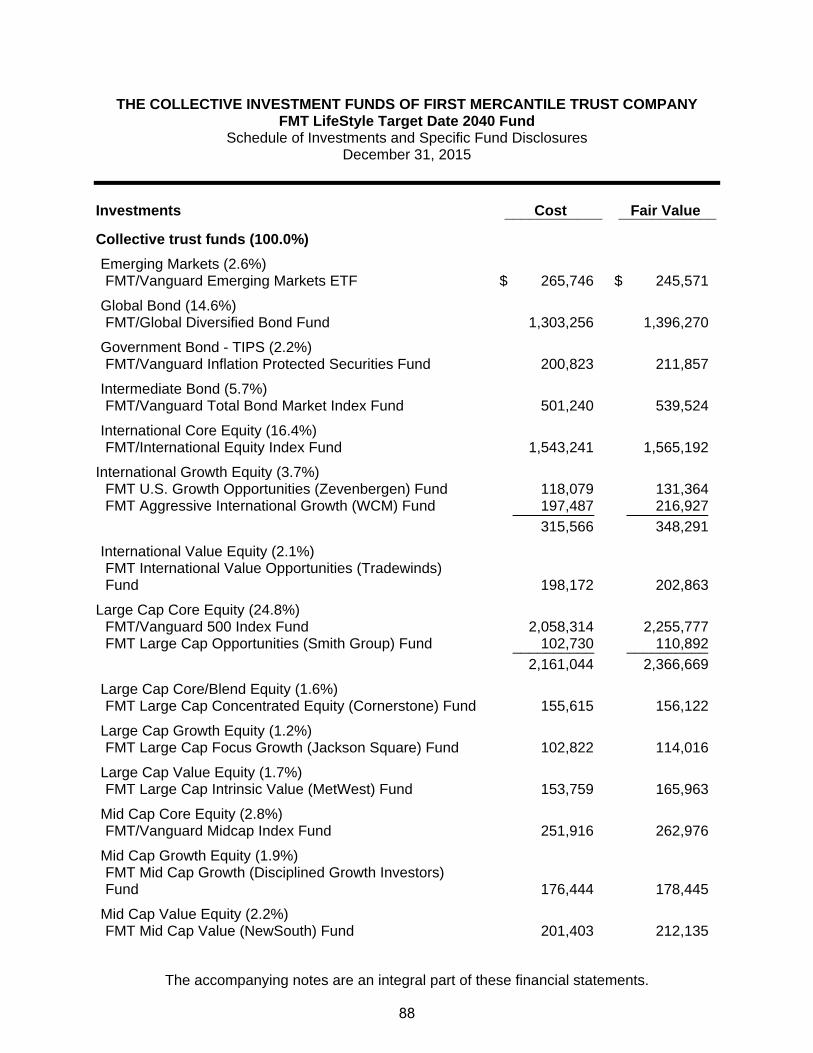
THE COLLECTIVE INVESTMENT FUNDS OF FIRST MERCANTILE TRUST COMPANY FMT LifeStyle Target Date 2040 Fund
Schedule of Investments and Specific Fund Disclosures December 31, 2015
The accompanying notes are an integral part of these financial statements.
Investments Cost Fair Value ____________ ____________
Collective trust funds (100.0%)
Emerging Markets (2.6%) FMT/Vanguard Emerging Markets ETF $ 265,746 $ 245,571
Global Bond (14.6%) FMT/Global Diversified Bond Fund 1,303,256 1,396,270
Government Bond - TIPS (2.2%) FMT/Vanguard Inflation Protected Securities Fund 200,823 211,857
Intermediate Bond (5.7%) FMT/Vanguard Total Bond Market Index Fund 501,240 539,524
International Core Equity (16.4%) FMT/International Equity Index Fund 1,543,241 1,565,192
International Growth Equity (3.7%) FMT U.S. Growth Opportunities (Zevenbergen) Fund 118,079 131,364 FMT Aggressive International Growth (WCM) Fund 197,487 216,927 __________ __________ 315,566 348,291
International Value Equity (2.1%)
FMT International Value Opportunities (Tradewinds) Fund 198,172 202,863
Large Cap Core Equity (24.8%) FMT/Vanguard 500 Index Fund 2,058,314 2,255,777 FMT Large Cap Opportunities (Smith Group) Fund 102,730 110,892 __________ __________ 2,161,044 2,366,669
Large Cap Core/Blend Equity (1.6%) FMT Large Cap Concentrated Equity (Cornerstone) Fund 155,615 156,122
Large Cap Growth Equity (1.2%) FMT Large Cap Focus Growth (Jackson Square) Fund 102,822 114,016
Large Cap Value Equity (1.7%) FMT Large Cap Intrinsic Value (MetWest) Fund 153,759 165,963
Mid Cap Core Equity (2.8%) FMT/Vanguard Midcap Index Fund 251,916 262,976
Mid Cap Growth Equity (1.9%)
FMT Mid Cap Growth (Disciplined Growth Investors) Fund 176,444 178,445
Mid Cap Value Equity (2.2%) FMT Mid Cap Value (NewSouth) Fund 201,403 212,135
88
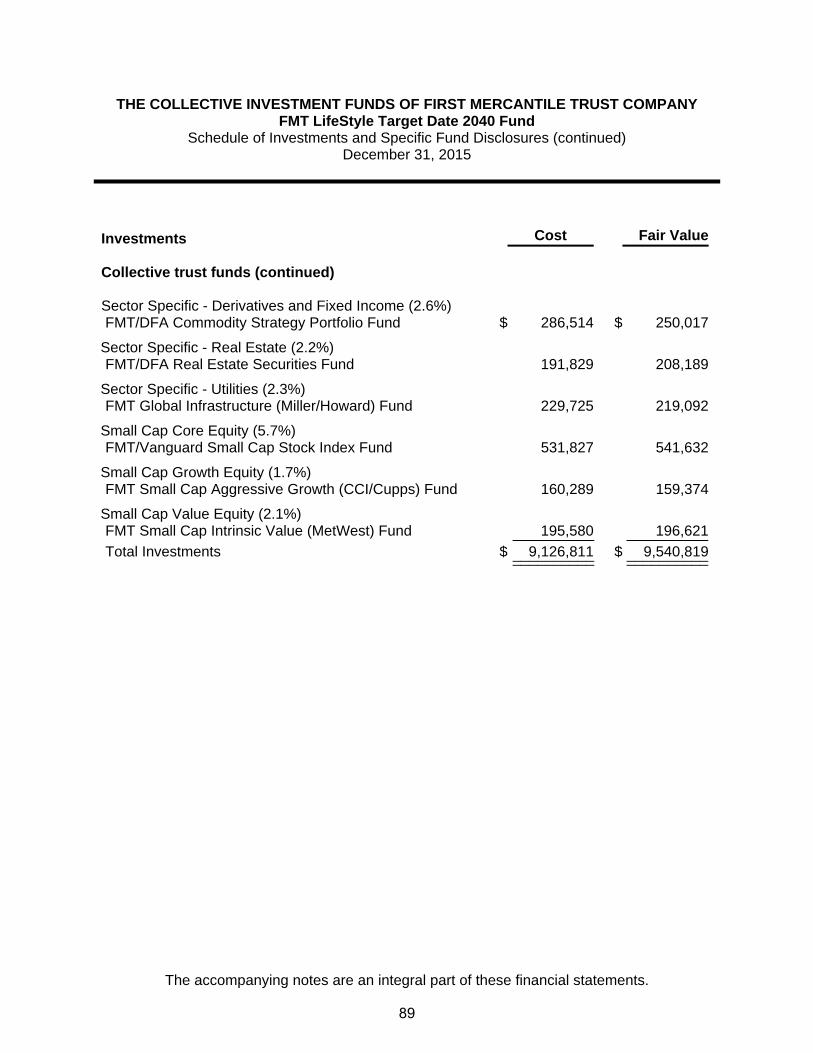
THE COLLECTIVE INVESTMENT FUNDS OF FIRST MERCANTILE TRUST COMPANY FMT LifeStyle Target Date 2040 Fund
Schedule of Investments and Specific Fund Disclosures (continued) December 31, 2015
The accompanying notes are an integral part of these financial statements.
Investments Cost Fair Value
Collective trust funds (continued) Sector Specific - Derivatives and Fixed Income (2.6%) FMT/DFA Commodity Strategy Portfolio Fund $ 286,514 $ 250,017
Sector Specific - Real Estate (2.2%) FMT/DFA Real Estate Securities Fund 191,829 208,189
Sector Specific - Utilities (2.3%) FMT Global Infrastructure (Miller/Howard) Fund 229,725 219,092
Small Cap Core Equity (5.7%) FMT/Vanguard Small Cap Stock Index Fund 531,827 541,632
Small Cap Growth Equity (1.7%) FMT Small Cap Aggressive Growth (CCI/Cupps) Fund 160,289 159,374
Small Cap Value Equity (2.1%) FMT Small Cap Intrinsic Value (MetWest) Fund 195,580 196,621 __________ __________ Total Investments $ 9,126,811 $ 9,540,819 __________ ____________________ __________
89

THE COLLECTIVE INVESTMENT FUNDS OF FIRST MERCANTILE TRUST COMPANY FMT LifeStyle Target Date 2040 Fund
Schedule of Investments and Specific Fund Disclosures (continued) December 31, 2015
The accompanying notes are an integral part of these financial statements.
Specific Fund Disclosures Fair value The inputs or methodology used for valuing securities may not be indicative of the risks associated with investing in those securities. For more information on valuation inputs, and their aggregation into the levels used in the table below, please refer to note 4 to the financial statements. The following table sets forth by level, within the fair value hierarchy, the Fund's investments measured at fair value.
Total Level 1 Level 2 Level 3
Collective trust funds Emerging Markets $ 245,571 $ — $ 245,571 $ —Global Bond 1,396,270 — 1,396,270 —Government Bond - TIPS 211,857 — 211,857 —Intermediate Bond 539,524 — 539,524 —International Core Equity 1,565,192 — 1,565,192 —International Growth Equity 348,291 — 348,291 —International Value Equity 202,863 — 202,863 —Large Cap Core Equity 2,366,669 — 2,366,669 —Large Cap Core/Blend Equity 156,122 — 156,122 —Large Cap Growth Equity 114,016 — 114,016 —Large Cap Value Equity 165,963 — 165,963 —Mid Cap Core Equity 262,976 — 262,976 —Mid Cap Growth Equity 178,445 — 178,445 —Mid Cap Value Equity 212,135 — 212,135 —Sector Specific - Derivatives and Fixed Income 250,017 — 250,017 —Sector Specific - Real Estate 208,189 — 208,189 —Sector Specific - Utilities 219,092 — 219,092 —Small Cap Core Equity 541,632 — 541,632 —Small Cap Growth Equity 159,374 — 159,374 —Small Cap Value Equity 196,621 — 196,621 —__________ __________ __________ _________
$ 9,540,819 $ — $ 9,540,819 $ —__________ __________ __________ ___________________ __________ __________ _________ The estimated fair value of the underlying collective trust funds is net asset value. The use of net asset value as fair value is deemed appropriate as the collective trust funds do not have a finite life, no unfunded commitments relating to this type of investment, or no significant restrictions on redemptions.
90

THE COLLECTIVE INVESTMENT FUNDS OF FIRST MERCANTILE TRUST COMPANY FMT LifeStyle Target Date 2040 Fund
Schedule of Investments and Specific Fund Disclosures (continued) December 31, 2015
The accompanying notes are an integral part of these financial statements.
Investment transactions The aggregate cost of purchases of investment securities and proceeds from sales of investment securities (other than temporary cash investments) totaled $2,491,978 and $3,818,245, respectively, for the year ended December 31, 2015. Class-specific expenses Class-specific trustee fees for the year ended December 31, 2015 were as follows: Class R1 LifeStyle $ 3,186 Class R2 LifeStyle 656 Class R3 LifeStyle 1,251 Class R4 LifeStyle 1,699 Class R5 LifeStyle 1,237 Class R6 LifeStyle 1,339 Class R7 LifeStyle 395 Class R8 LifeStyle 445 $ 10,208
91

THE COLLECTIVE INVESTMENT FUNDS OF FIRST MERCANTILE TRUST COMPANY FMT LifeStyle Target Date 2040 Fund
Schedule of Participant Transactions December 31, 2015
The accompanying notes are an integral part of these financial statements.
Participant transactions by class for the year ended December 31, 2015 were as follows: Dollars Units Purchases Redemptions Net change Purchases Redemptions Net change Class R1 LifeStyle $ 1,079,262 $ (2,292,898) $ (1,213,636) 74,746 (159,823) (85,077)Class R2 LifeStyle 255,929 (249,370) 6,559 17,681 (17,093) 588Class R3 LifeStyle 853,633 (1,102,999) (249,366) 62,178 (82,379) (20,201)Class R4 LifeStyle 336,330 (80,486) 255,844 25,150 (6,031) 19,119Class R5 LifeStyle 443,692 (721,651) (277,959) 30,679 (51,496) (20,817)Class R6 LifeStyle 209,958 (22,484) 187,474 15,148 (1,649) 13,499Class R7 LifeStyle 28,100 (4,964) 23,136 1,989 (353) 1,636Class R8 LifeStyle 61,391 (114,479) (53,088) 4,500 (8,436) (3,936) $ 3,268,295 $ (4,589,331) $ (1,321,036) 232,071 (327,260) (95,189)
92

THE COLLECTIVE INVESTMENT FUNDS OF FIRST MERCANTILE TRUST COMPANY FMT LifeStyle Target Date 2040 Fund
Financial Highlights December 31, 2015
The accompanying notes are an integral part of these financial statements.
Change in Net Asset Value Resulting from Operations Ratios (to average net
assets)
NAV per Unit, Beginning of
Period
Net Investment
Income (Loss)(a)(b)
Net Realized and Unrealized
Gain (Loss) from
Investments(a)
Total from Investment Activities
NAV per Unit, End of Period
Total Return Expenses(b)
Net Investment
Income (Loss)(b)
Class R1 LifeStyle $ 14.3850 $ (0.0083) $ (0.2980) $ (0.3063) $ 14.0787 (2.13)% (0.06)% (0.06)%Class R2 LifeStyle 14.3396 (0.0134) (0.3198) (0.3332) 14.0064 (2.32)% (0.09)% (0.09)%Class R3 LifeStyle 13.8047 (0.0127) (0.3352) (0.3479) 13.4568 (2.52)% (0.09)% (0.09)%Class R4 LifeStyle 13.4124 (0.0220) (0.3367) (0.3587) 13.0537 (2.67)% (0.16)% (0.16)%Class R5 LifeStyle 14.1297 (0.0187) (0.3828) (0.4015) 13.7282 (2.84)% (0.13)% (0.13)%Class R6 LifeStyle 13.8178 (0.0298) (0.3868) (0.4166) 13.4012 (3.02)% (0.21)% (0.21)%Class R7 LifeStyle 14.0282 (0.0320) (0.4150) (0.4470) 13.5812 (3.19)% (0.23)% (0.23)%Class R8 LifeStyle 13.4261 (0.0277) (0.4192) (0.4469) 12.9792 (3.33)% (0.21)% (0.21)%
(a) Per unit amounts are based on average daily units outstanding.
(b) The Lifestyle and Multi-Managed funds (Funds of Funds) invest in a number of underlying funds
within The Collective Trust. Through November 8, 2015 these Funds of Funds did not charge aninvestment fee nor incur other expenses, as such charges and expenses were incurred at therespective share classes of the underlying funds. Beginning November 9, 2015 these Funds ofFunds began charging an investment fee and incurring other expenses, coinciding with such Fundsof Funds investing in a unique share class of the underlying funds that do not incur an investment fee or other such expenses. The purpose of this change was solely to record a more directaccounting of the charges and expenses for the Funds of Funds and underlying funds, and has nonet effect on the charges or expenses of any of the funds. The Funds of Funds do not report investment income as none of the underlying funds in which these Funds of Funds invest paydividends. Consequently, the change in NAV is due solely to realized and unrealized gains andlosses, and fees, e.g., trustee, audit, charged directly to the fund. Expenses and income items forthe underlying funds are shown in the financial statements for those respective funds. The effectiveAnnual Investment Expense is shown on the respective underlying fund's quarterly profile (fact) sheet and on the Schedule of Investment Elections. The effective Annual Investment Expense forthe Fund of Funds, e.g. Lifestyle fund, is the weighted average expense of all the underlying fundsthat compose the specific Fund of Funds.
93

FMT LifeStyle Target Date 2050 Fund

THE COLLECTIVE INVESTMENT FUNDS OF FIRST MERCANTILE TRUST COMPANY FMT LifeStyle Target Date 2050 Fund
Statement of Assets and Liabilities December 31, 2015
The accompanying notes are an integral part of these financial statements.
Assets Investments in securities, at fair value $ 3,745,110 Liabilities Trustee fees 2,276 Net assets $ 3,742,834 Components of net assets
Units of
Participation NAV
per Unit Net
Assets Class R1 LifeStyle 61,849 $ 23.9103 $ 1,478,820Class R2 LifeStyle 30,325 $ 10.6349 322,507Class R3 LifeStyle 36,229 $ 13.8558 501,977Class R4 LifeStyle 48,195 $ 13.1837 635,389Class R5 LifeStyle 13,124 $ 13.6923 179,696Class R6 LifeStyle 33,904 $ 14.2215 482,160Class R7 LifeStyle 1,412 $ 12.4392 17,562Class R8 LifeStyle 9,329 $ 13.3691 124,723
$ 3,742,834
94
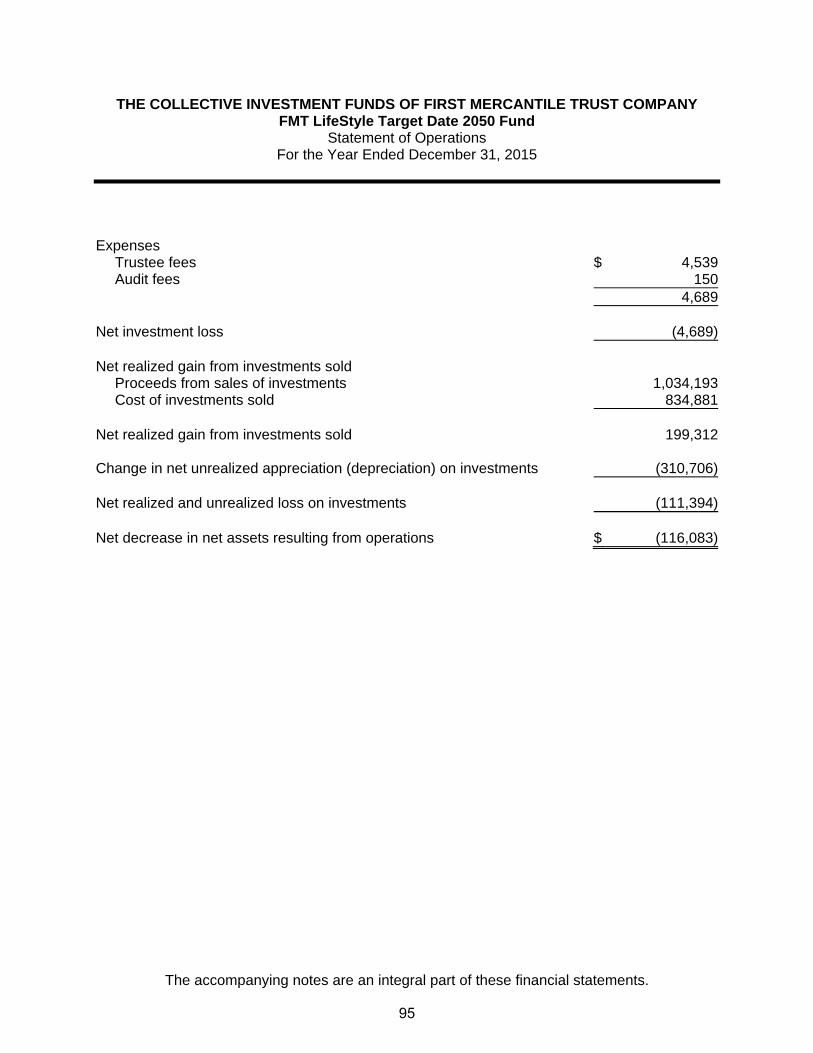
THE COLLECTIVE INVESTMENT FUNDS OF FIRST MERCANTILE TRUST COMPANY FMT LifeStyle Target Date 2050 Fund
Statement of Operations For the Year Ended December 31, 2015
The accompanying notes are an integral part of these financial statements.
Expenses
Trustee fees $ 4,539Audit fees 150
4,689 Net investment loss (4,689) Net realized gain from investments sold
Proceeds from sales of investments 1,034,193Cost of investments sold 834,881
Net realized gain from investments sold 199,312 Change in net unrealized appreciation (depreciation) on investments (310,706) Net realized and unrealized loss on investments (111,394) Net decrease in net assets resulting from operations $ (116,083)
95

THE COLLECTIVE INVESTMENT FUNDS OF FIRST MERCANTILE TRUST COMPANY FMT LifeStyle Target Date 2050 Fund
Statement of Changes in Net Assets For the Year Ended December 31, 2015
The accompanying notes are an integral part of these financial statements.
Operations
Net investment loss $ (4,689)
Net realized gain from investments sold 199,312
Change in net unrealized appreciation (depreciation) on investments (310,706)
Net decrease in net assets resulting from operations (116,083) Participant transactions
Proceeds from units purchased 1,948,031Less payments for units redeemed 1,153,308
Increase in net assets from participant transactions 794,723
Total increase in net assets 678,640 Net assets at beginning of year 3,064,194 Net assets at end of year $ 3,742,834
96

THE COLLECTIVE INVESTMENT FUNDS OF FIRST MERCANTILE TRUST COMPANY FMT LifeStyle Target Date 2050 Fund
Schedule of Investments and Specific Fund Disclosures December 31, 2015
The accompanying notes are an integral part of these financial statements.
Investments Cost Fair Value ____________ ____________
Collective trust funds (100.1%)
Emerging Markets (2.9%) FMT/Vanguard Emerging Markets ETF $ 124,167 $ 109,251
Global Bond (10.7%) FMT/Global Diversified Bond Fund 393,680 399,223
Government Bond - TIPS (1.3%) FMT/Vanguard Inflation Protected Securities Fund 49,245 49,144
Intermediate Bond (1.3%) FMT/Vanguard Total Bond Market Index Fund 49,213 50,155
International Core Equity (18.6%) FMT/International Equity Index Fund 724,293 696,585
International Growth Equity (4.2%) FMT U.S. Growth Opportunities (Zevenbergen) Fund 56,686 59,273 FMT Aggressive International Growth (WCM) Fund 93,048 96,521 __________ __________ 149,734 155,794
International Value Equity (2.4%)
FMT International Value Opportunities (Tradewinds) Fund 93,179 89,876
Large Cap Core Equity (28.1%) FMT Large Cap Opportunities (Smith Group) Fund 48,408 49,660 FMT/Vanguard 500 Index Fund 968,051 1,002,975 __________ __________ 1,016,459 1,052,635
Large Cap Core/Blend Equity (1.9%) FMT Large Cap Concentrated Equity (Cornerstone) Fund 72,762 69,462
Large Cap Growth Equity (1.4%) FMT Large Cap Focus Growth (Jackson Square) Fund 48,411 51,021
Large Cap Value Equity (2.0%) FMT Large Cap Intrinsic Value (MetWest) Fund 72,626 73,937
Mid Cap Core Equity (3.1%) FMT/Vanguard Midcap Index Fund 118,154 116,794
Mid Cap Growth Equity (2.1%)
FMT Mid Cap Growth (Disciplined Growth Investors) Fund 82,577 79,306
Mid Cap Value Equity (2.5%) FMT Mid Cap Value (NewSouth) Fund 94,632 94,460
97

THE COLLECTIVE INVESTMENT FUNDS OF FIRST MERCANTILE TRUST COMPANY FMT LifeStyle Target Date 2050 Fund
Schedule of Investments and Specific Fund Disclosures (continued) December 31, 2015
The accompanying notes are an integral part of these financial statements.
Investments Cost Fair Value
Collective trust funds (continued) Sector Specific - Derivatives and Fixed Income (2.3%) FMT/DFA Commodity Strategy Portfolio Fund $ 102,719 $ 85,462
Sector Specific - Real Estate (2.4%) FMT/DFA Real Estate Securities Fund 87,089 90,571
Sector Specific - Utilities (2.3%) FMT Global Infrastructure (Miller/Howard) Fund 94,920 86,319
Small Cap Core Equity (6.4%) FMT/Vanguard Small Cap Stock Index Fund 247,791 239,034
Small Cap Growth Equity (1.9%) FMT Small Cap Aggressive Growth (CCI/Cupps) Fund 74,344 69,650
Small Cap Value Equity (2.3%) FMT Small Cap Intrinsic Value (MetWest) Fund 90,938 86,431 __________ __________ Total Investments $ 3,786,933 $ 3,745,110 __________ ____________________ __________
98

THE COLLECTIVE INVESTMENT FUNDS OF FIRST MERCANTILE TRUST COMPANY FMT LifeStyle Target Date 2050 Fund
Schedule of Investments and Specific Fund Disclosures (continued) December 31, 2015
The accompanying notes are an integral part of these financial statements.
Specific Fund Disclosures Fair value The inputs or methodology used for valuing securities may not be indicative of the risks associated with investing in those securities. For more information on valuation inputs, and their aggregation into the levels used in the table below, please refer to note 4 to the financial statements. The following table sets forth by level, within the fair value hierarchy, the Fund's investments measured at fair value.
Total Level 1 Level 2 Level 3
Collective trust funds Emerging Markets $ 109,251 $ — $ 109,251 $ —Global Bond 399,223 — 399,223 —Government Bond - TIPS 49,144 — 49,144 —Intermediate Bond 50,155 — 50,155 —International Core Equity 696,585 — 696,585 —International Growth Equity 155,794 — 155,794 —International Value Equity 89,876 — 89,876 —Large Cap Core Equity 1,052,635 — 1,052,635 —Large Cap Core/Blend Equity 69,462 — 69,462 —Large Cap Growth Equity 51,021 — 51,021 —Large Cap Value Equity 73,937 — 73,937 —Mid Cap Core Equity 116,794 — 116,794 —Mid Cap Growth Equity 79,306 — 79,306 —Mid Cap Value Equity 94,460 — 94,460 —Sector Specific - Derivatives and Fixed Income 85,462 — 85,462 —Sector Specific - Real Estate 90,571 — 90,571 —Sector Specific - Utilities 86,319 — 86,319 —Small Cap Core Equity 239,034 — 239,034 —Small Cap Growth Equity 69,650 — 69,650 —Small Cap Value Equity 86,431 — 86,431 —__________ __________ __________ _________
$ 3,745,110 $ — $ 3,745,110 $ —__________ __________ __________ ___________________ __________ __________ _________ The estimated fair value of the underlying collective trust funds is net asset value. The use of net asset value as fair value is deemed appropriate as the collective trust funds do not have a finite life, no unfunded commitments relating to this type of investment, or no significant restrictions on redemptions.
99
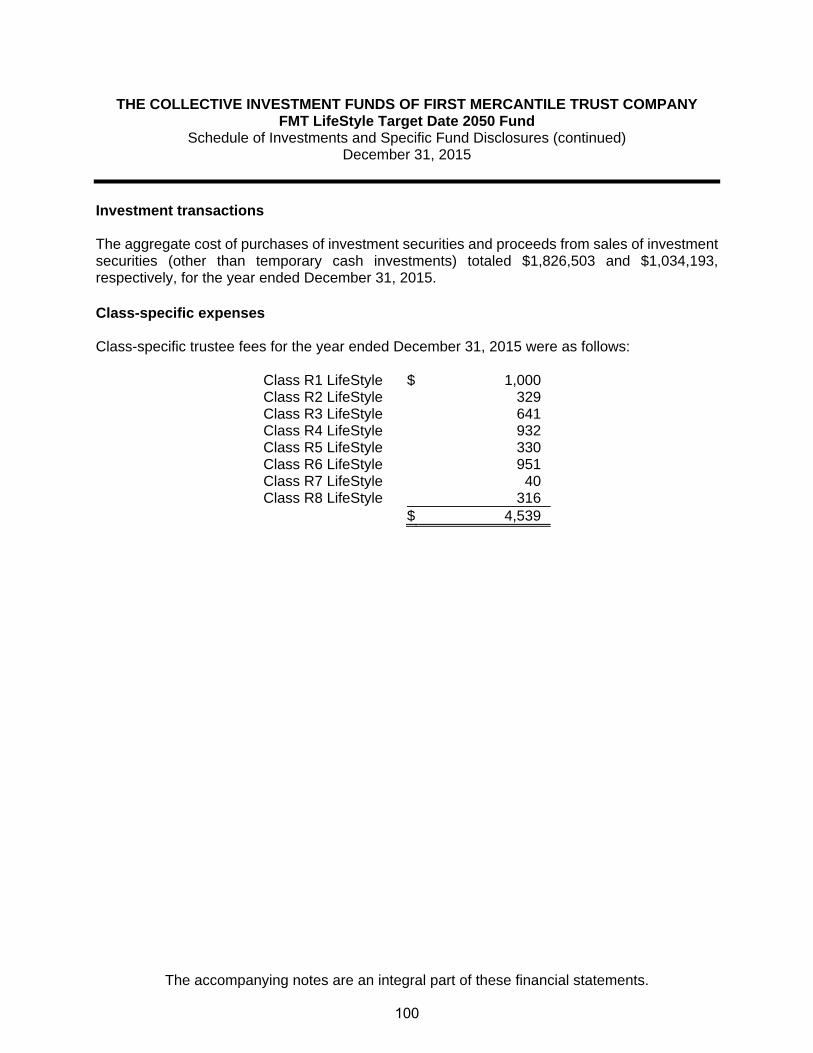
THE COLLECTIVE INVESTMENT FUNDS OF FIRST MERCANTILE TRUST COMPANY FMT LifeStyle Target Date 2050 Fund
Schedule of Investments and Specific Fund Disclosures (continued) December 31, 2015
The accompanying notes are an integral part of these financial statements.
Investment transactions The aggregate cost of purchases of investment securities and proceeds from sales of investment securities (other than temporary cash investments) totaled $1,826,503 and $1,034,193, respectively, for the year ended December 31, 2015. Class-specific expenses Class-specific trustee fees for the year ended December 31, 2015 were as follows: Class R1 LifeStyle $ 1,000 Class R2 LifeStyle 329 Class R3 LifeStyle 641 Class R4 LifeStyle 932 Class R5 LifeStyle 330 Class R6 LifeStyle 951 Class R7 LifeStyle 40 Class R8 LifeStyle 316 $ 4,539
100
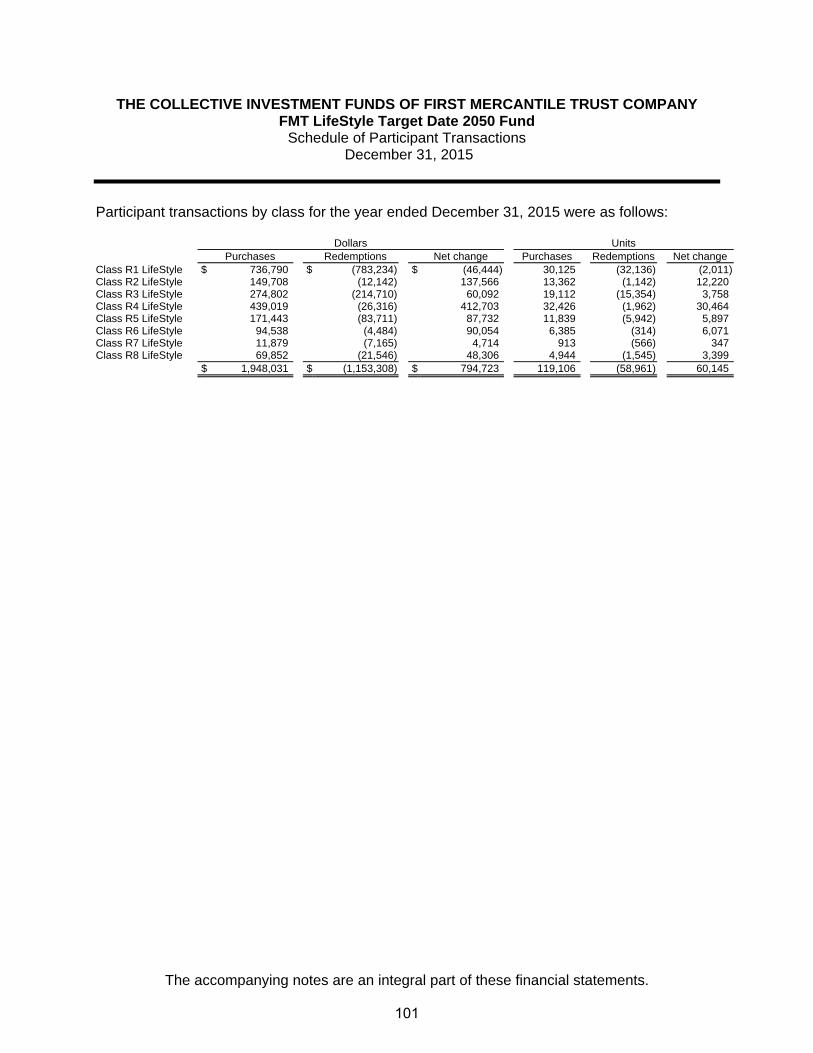
THE COLLECTIVE INVESTMENT FUNDS OF FIRST MERCANTILE TRUST COMPANY FMT LifeStyle Target Date 2050 Fund
Schedule of Participant Transactions December 31, 2015
The accompanying notes are an integral part of these financial statements.
Participant transactions by class for the year ended December 31, 2015 were as follows: Dollars Units Purchases Redemptions Net change Purchases Redemptions Net change Class R1 LifeStyle $ 736,790 $ (783,234) $ (46,444) 30,125 (32,136) (2,011)Class R2 LifeStyle 149,708 (12,142) 137,566 13,362 (1,142) 12,220Class R3 LifeStyle 274,802 (214,710) 60,092 19,112 (15,354) 3,758Class R4 LifeStyle 439,019 (26,316) 412,703 32,426 (1,962) 30,464Class R5 LifeStyle 171,443 (83,711) 87,732 11,839 (5,942) 5,897Class R6 LifeStyle 94,538 (4,484) 90,054 6,385 (314) 6,071Class R7 LifeStyle 11,879 (7,165) 4,714 913 (566) 347Class R8 LifeStyle 69,852 (21,546) 48,306 4,944 (1,545) 3,399 $ 1,948,031 $ (1,153,308) $ 794,723 119,106 (58,961) 60,145
101
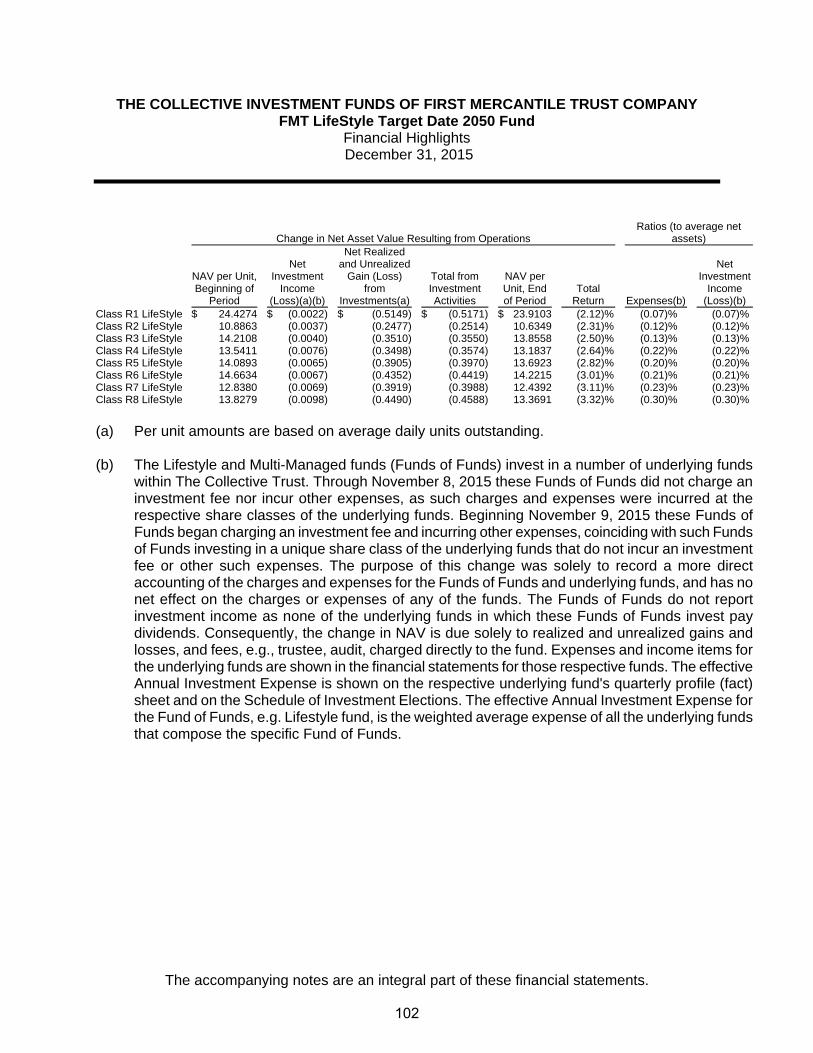
THE COLLECTIVE INVESTMENT FUNDS OF FIRST MERCANTILE TRUST COMPANY FMT LifeStyle Target Date 2050 Fund
Financial Highlights December 31, 2015
The accompanying notes are an integral part of these financial statements.
Change in Net Asset Value Resulting from Operations Ratios (to average net
assets)
NAV per Unit, Beginning of
Period
Net Investment
Income (Loss)(a)(b)
Net Realized and Unrealized
Gain (Loss) from
Investments(a)
Total from Investment Activities
NAV per Unit, End of Period
Total Return Expenses(b)
Net Investment
Income (Loss)(b)
Class R1 LifeStyle $ 24.4274 $ (0.0022) $ (0.5149) $ (0.5171) $ 23.9103 (2.12)% (0.07)% (0.07)%Class R2 LifeStyle 10.8863 (0.0037) (0.2477) (0.2514) 10.6349 (2.31)% (0.12)% (0.12)%Class R3 LifeStyle 14.2108 (0.0040) (0.3510) (0.3550) 13.8558 (2.50)% (0.13)% (0.13)%Class R4 LifeStyle 13.5411 (0.0076) (0.3498) (0.3574) 13.1837 (2.64)% (0.22)% (0.22)%Class R5 LifeStyle 14.0893 (0.0065) (0.3905) (0.3970) 13.6923 (2.82)% (0.20)% (0.20)%Class R6 LifeStyle 14.6634 (0.0067) (0.4352) (0.4419) 14.2215 (3.01)% (0.21)% (0.21)%Class R7 LifeStyle 12.8380 (0.0069) (0.3919) (0.3988) 12.4392 (3.11)% (0.23)% (0.23)%Class R8 LifeStyle 13.8279 (0.0098) (0.4490) (0.4588) 13.3691 (3.32)% (0.30)% (0.30)%
(a) Per unit amounts are based on average daily units outstanding.
(b) The Lifestyle and Multi-Managed funds (Funds of Funds) invest in a number of underlying funds
within The Collective Trust. Through November 8, 2015 these Funds of Funds did not charge aninvestment fee nor incur other expenses, as such charges and expenses were incurred at therespective share classes of the underlying funds. Beginning November 9, 2015 these Funds ofFunds began charging an investment fee and incurring other expenses, coinciding with such Fundsof Funds investing in a unique share class of the underlying funds that do not incur an investmentfee or other such expenses. The purpose of this change was solely to record a more direct accounting of the charges and expenses for the Funds of Funds and underlying funds, and has nonet effect on the charges or expenses of any of the funds. The Funds of Funds do not reportinvestment income as none of the underlying funds in which these Funds of Funds invest pay dividends. Consequently, the change in NAV is due solely to realized and unrealized gains andlosses, and fees, e.g., trustee, audit, charged directly to the fund. Expenses and income items forthe underlying funds are shown in the financial statements for those respective funds. The effectiveAnnual Investment Expense is shown on the respective underlying fund's quarterly profile (fact)sheet and on the Schedule of Investment Elections. The effective Annual Investment Expense for the Fund of Funds, e.g. Lifestyle fund, is the weighted average expense of all the underlying fundsthat compose the specific Fund of Funds.
102

FMT/Vanguard Target Retirement 2015 Fund

THE COLLECTIVE INVESTMENT FUNDS OF FIRST MERCANTILE TRUST COMPANY FMT/Vanguard Target Retirement 2015 Fund
Statement of Assets and Liabilities December 31, 2015
The accompanying notes are an integral part of these financial statements.
Assets Investments in securities, at fair value $ 9,468,897 Liabilities Trustee fees 3,859 Net assets $ 9,465,038 Components of net assets
Units of
Participation NAV
per Unit Net
Assets Class R1 634,798 $ 12.2562 $ 7,780,239Class R3 35,741 $ 10.4306 372,800Class R4 23,308 $ 11.9481 278,490Class R5 8,509 $ 12.2019 103,824Class R6 79,910 $ 11.6341 929,685
$ 9,465,038
103

THE COLLECTIVE INVESTMENT FUNDS OF FIRST MERCANTILE TRUST COMPANY FMT/Vanguard Target Retirement 2015 Fund
Statement of Operations For the Year Ended December 31, 2015
The accompanying notes are an integral part of these financial statements.
Investment income
Dividends $ 620,714 Expenses
Trustee fees 53,696Custody fees 4,334Audit fees 1,200
59,230 Net investment income 561,484 Net realized gain from investments sold
Proceeds from sales of investments 5,976,485Cost of investments sold 5,635,614
Net realized gain from investments sold 340,871 Change in net unrealized appreciation (depreciation) on investments (941,893) Net realized and unrealized loss on investments (601,022) Net decrease in net assets resulting from operations $ (39,538)
104

THE COLLECTIVE INVESTMENT FUNDS OF FIRST MERCANTILE TRUST COMPANY FMT/Vanguard Target Retirement 2015 Fund
Statement of Changes in Net Assets For the Year Ended December 31, 2015
The accompanying notes are an integral part of these financial statements.
Operations
Net investment income $ 561,484
Net realized gain from investments sold 340,871
Change in net unrealized appreciation (depreciation) on investments (941,893)
Net decrease in net assets resulting from operations (39,538) Participant transactions
Proceeds from units purchased 3,474,933Less payments for units redeemed 6,283,709
Decrease in net assets from participant transactions (2,808,776)
Total decrease in net assets (2,848,314) Net assets at beginning of year 12,313,352 Net assets at end of year $ 9,465,038
105
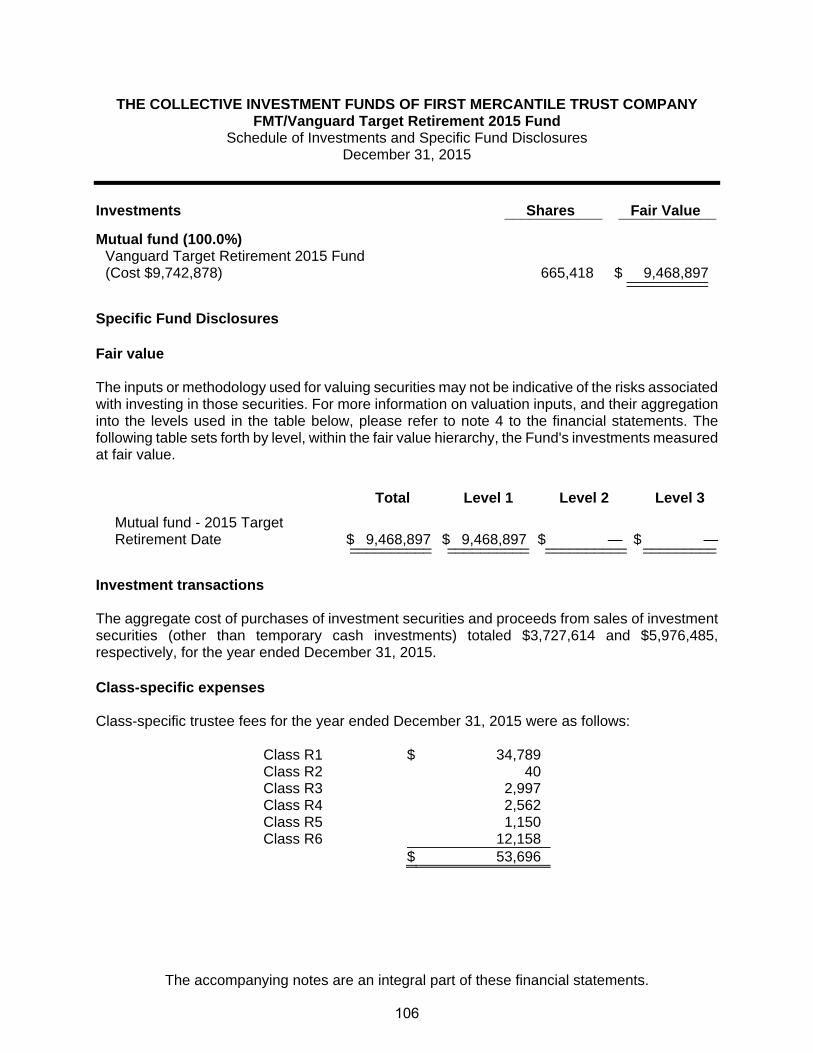
THE COLLECTIVE INVESTMENT FUNDS OF FIRST MERCANTILE TRUST COMPANY FMT/Vanguard Target Retirement 2015 Fund
Schedule of Investments and Specific Fund Disclosures December 31, 2015
The accompanying notes are an integral part of these financial statements.
Investments Shares Fair Value ____________ ____________
Mutual fund (100.0%)
Vanguard Target Retirement 2015 Fund (Cost $9,742,878) 665,418 $ 9,468,897 ____________________
Specific Fund Disclosures Fair value The inputs or methodology used for valuing securities may not be indicative of the risks associated with investing in those securities. For more information on valuation inputs, and their aggregation into the levels used in the table below, please refer to note 4 to the financial statements. The following table sets forth by level, within the fair value hierarchy, the Fund's investments measured at fair value.
Total Level 1 Level 2 Level 3
Mutual fund - 2015 Target Retirement Date $ 9,468,897 $ 9,468,897 $ — $ —__________ __________ __________ ___________________ __________ __________ _________
Investment transactions The aggregate cost of purchases of investment securities and proceeds from sales of investment securities (other than temporary cash investments) totaled $3,727,614 and $5,976,485, respectively, for the year ended December 31, 2015. Class-specific expenses Class-specific trustee fees for the year ended December 31, 2015 were as follows: Class R1 $ 34,789 Class R2 40 Class R3 2,997 Class R4 2,562 Class R5 1,150 Class R6 12,158 $ 53,696
106
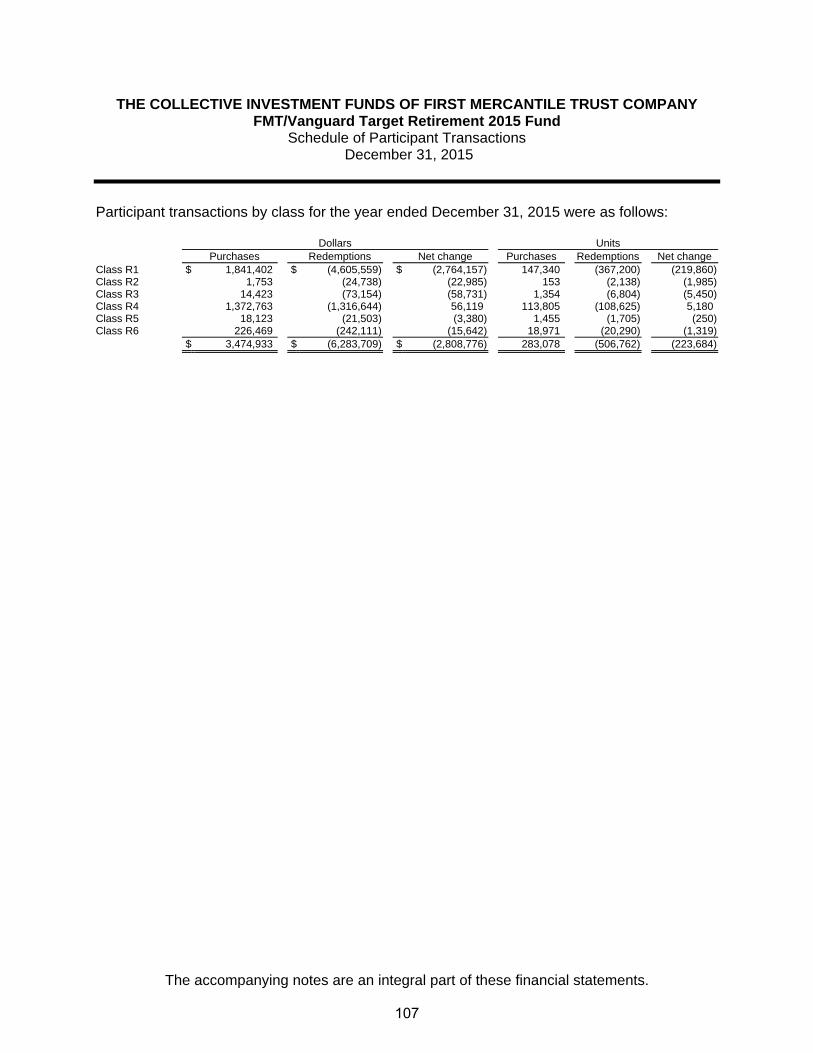
THE COLLECTIVE INVESTMENT FUNDS OF FIRST MERCANTILE TRUST COMPANY FMT/Vanguard Target Retirement 2015 Fund
Schedule of Participant Transactions December 31, 2015
The accompanying notes are an integral part of these financial statements.
Participant transactions by class for the year ended December 31, 2015 were as follows: Dollars Units Purchases Redemptions Net change Purchases Redemptions Net change Class R1 $ 1,841,402 $ (4,605,559) $ (2,764,157) 147,340 (367,200) (219,860)Class R2 1,753 (24,738) (22,985) 153 (2,138) (1,985)Class R3 14,423 (73,154) (58,731) 1,354 (6,804) (5,450)Class R4 1,372,763 (1,316,644) 56,119 113,805 (108,625) 5,180Class R5 18,123 (21,503) (3,380) 1,455 (1,705) (250)Class R6 226,469 (242,111) (15,642) 18,971 (20,290) (1,319) $ 3,474,933 $ (6,283,709) $ (2,808,776) 283,078 (506,762) (223,684)
107
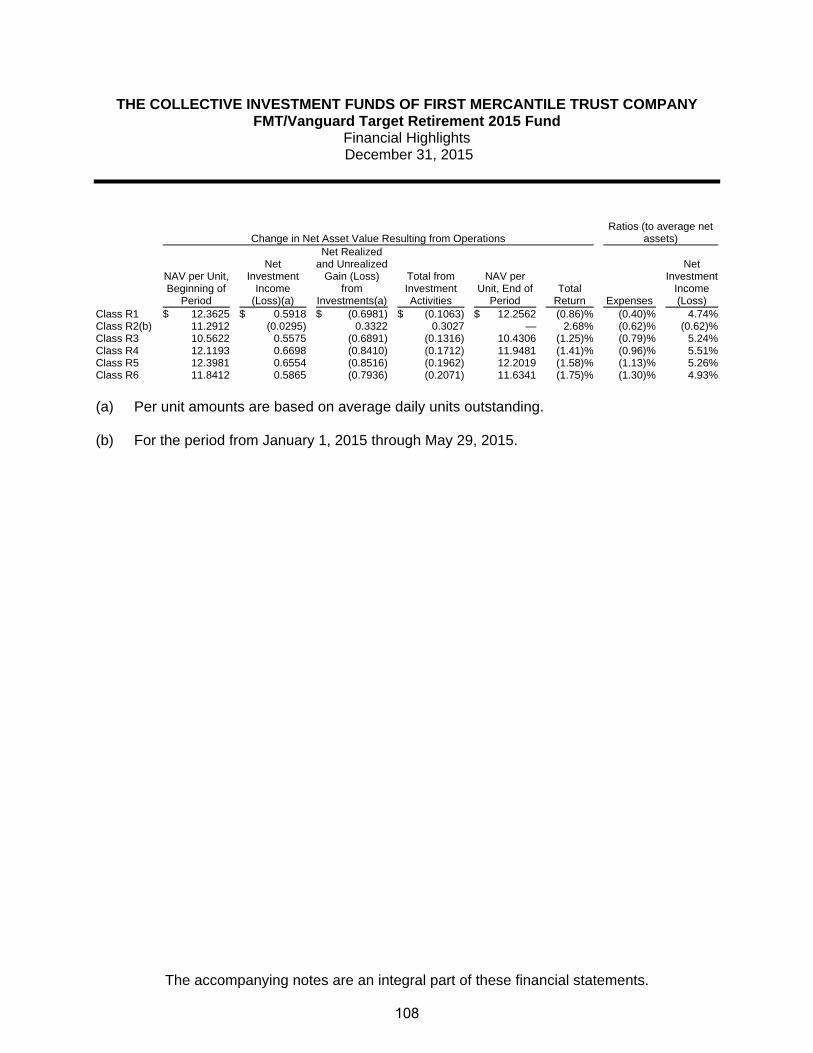
THE COLLECTIVE INVESTMENT FUNDS OF FIRST MERCANTILE TRUST COMPANY FMT/Vanguard Target Retirement 2015 Fund
Financial Highlights December 31, 2015
The accompanying notes are an integral part of these financial statements.
Change in Net Asset Value Resulting from Operations Ratios (to average net
assets)
NAV per Unit, Beginning of
Period
Net Investment
Income (Loss)(a)
Net Realized and Unrealized
Gain (Loss) from
Investments(a)
Total from Investment Activities
NAV per Unit, End of
Period Total
Return Expenses
Net Investment
Income (Loss)
Class R1 $ 12.3625 $ 0.5918 $ (0.6981) $ (0.1063) $ 12.2562 (0.86)% (0.40)% 4.74%Class R2(b) 11.2912 (0.0295) 0.3322 0.3027 — 2.68% (0.62)% (0.62)%Class R3 10.5622 0.5575 (0.6891) (0.1316) 10.4306 (1.25)% (0.79)% 5.24%Class R4 12.1193 0.6698 (0.8410) (0.1712) 11.9481 (1.41)% (0.96)% 5.51%Class R5 12.3981 0.6554 (0.8516) (0.1962) 12.2019 (1.58)% (1.13)% 5.26%Class R6 11.8412 0.5865 (0.7936) (0.2071) 11.6341 (1.75)% (1.30)% 4.93%
(a) Per unit amounts are based on average daily units outstanding.
(b) For the period from January 1, 2015 through May 29, 2015.
108
FMT/Vanguard Target Retirement 2020 Fund

THE COLLECTIVE INVESTMENT FUNDS OF FIRST MERCANTILE TRUST COMPANY
FMT/Vanguard Target Retirement 2020 Fund Statement of Assets and Liabilities
December 31, 2015
The accompanying notes are an integral part of these financial statements.
Assets Investments in securities, at fair value $ 18,543,984 Liabilities Trustee fees 8,610
Net assets $ 18,535,374
Components of net assets
Units of
Participation NAV
per Unit Net
Assets Class R1 765,780 $ 12.8074 $ 9,807,670
Class R2 315,283 $ 11.3987 3,593,812
Class R3 223,793 $ 11.5243 2,579,069
Class R4 74,081 $ 12.9682 960,700
Class R5 119,103 $ 11.9906 1,428,122
Class R6 11,504 $ 12.2153 140,527
Class R7 2,022 $ 11.4078 23,066
Class R8 236 $ 10.2072 2,408
$ 18,535,374
109

THE COLLECTIVE INVESTMENT FUNDS OF FIRST MERCANTILE TRUST COMPANY
FMT/Vanguard Target Retirement 2020 Fund Statement of Operations
For the Year Ended December 31, 2015
The accompanying notes are an integral part of these financial statements.
Investment income
Dividends $ 738,195
Expenses
Trustee fees 91,521
Custody fees 5,533
Audit fees 1,200
98,254
Net investment income 639,941
Net realized gain from investments sold
Proceeds from sales of investments 3,170,259
Cost of investments sold 2,969,608
Net realized gain from investments sold 200,651
Change in net unrealized appreciation (depreciation) on investments (966,484)
Net realized and unrealized loss on investments (765,833)
Net decrease in net assets resulting from operations $ (125,892)
110

THE COLLECTIVE INVESTMENT FUNDS OF FIRST MERCANTILE TRUST COMPANY
FMT/Vanguard Target Retirement 2020 Fund Statement of Changes in Net Assets
For the Year Ended December 31, 2015
The accompanying notes are an integral part of these financial statements.
Operations
Net investment income $ 639,941
Net realized gain from investments sold 200,651
Change in net unrealized appreciation (depreciation) on investments (966,484)
Net decrease in net assets resulting from operations (125,892)
Participant transactions
Proceeds from units purchased 7,747,976
Less payments for units redeemed 3,861,236
Increase in net assets from participant transactions 3,886,740
Total increase in net assets 3,760,848
Net assets at beginning of year 14,774,526
Net assets at end of year $ 18,535,374
111

THE COLLECTIVE INVESTMENT FUNDS OF FIRST MERCANTILE TRUST COMPANY FMT/Vanguard Target Retirement 2020 Fund
Schedule of Investments and Specific Fund Disclosures December 31, 2015
The accompanying notes are an integral part of these financial statements.
Investments Shares Fair Value ____________ ____________
Mutual fund (100.0%)
Vanguard Target Retirement 2020 Fund (Cost $18,489,570) 683,020 $ 18,543,984 __________ __________
Specific Fund Disclosures
Fair value
The inputs or methodology used for valuing securities may not be indicative of the risks associated with investing in those securities. For more information on valuation inputs, and their aggregation into the levels used in the table below, please refer to note 4 to the financial statements. The following table sets forth by level, within the fair value hierarchy, the Fund's investments measured at fair value.
Total Level 1 Level 2 Level 3
Mutual fund - 2020 Target Retirement Date $ 18,543,984 $ 18,543,984 $ — $ — __________ __________ __________ _________ __________ __________ __________ _________
Investment transactions
The aggregate cost of purchases of investment securities and proceeds from sales of investment securities (other than temporary cash investments) totaled $7,698,497 and $3,170,259, respectively, for the year ended December 31, 2015.
Class-specific expenses Class-specific trustee fees for the year ended December 31, 2015 were as follows: Class R1 $ 34,079 Class R2 8,193 Class R3 15,803 Class R4 11,788 Class R5 19,023 Class R6 2,283 Class R7 259 Class R8 93 $ 91,521
112

THE COLLECTIVE INVESTMENT FUNDS OF FIRST MERCANTILE TRUST COMPANY
FMT/Vanguard Target Retirement 2020 Fund Schedule of Participant Transactions
December 31, 2015
The accompanying notes are an integral part of these financial statements.
Participant transactions by class for the year ended December 31, 2015 were as follows: Dollars Units Purchases Redemptions Net change Purchases Redemptions Net change Class R1 $ 1,641,720 $ (1,594,882) $ 46,838 127,544 (121,541) 6,003 Class R2 3,504,139 (275,878) 3,228,261 311,414 (23,345) 288,069 Class R3 1,135,554 (189,636) 945,918 97,952 (16,195) 81,757 Class R4 848,600 (808,205) 40,395 64,160 (63,050) 1,110 Class R5 539,642 (827,669) (288,027) 43,651 (67,639) (23,988) Class R6 59,031 (156,330) (97,299) 4,752 (12,405) (7,653) Class R7 11,162 (2,139) 9,023 957 (178) 779 Class R8 8,128 (6,497) 1,631 775 (620) 155 $ 7,747,976 $ (3,861,236) $ 3,886,740 651,205 (304,973) 346,232
113

THE COLLECTIVE INVESTMENT FUNDS OF FIRST MERCANTILE TRUST COMPANY
FMT/Vanguard Target Retirement 2020 Fund Financial Highlights December 31, 2015
The accompanying notes are an integral part of these financial statements.
Change in Net Asset Value Resulting from Operations Ratios (to average net
assets)
NAV per Unit, Beginning of
Period
Net Investment
Income (Loss)(a)
Net Realized and Unrealized
Gain (Loss) from
Investments(a)
Total from Investment Activities
NAV per Unit, End of
Period Total
Return Expenses
Net Investment
Income (Loss)
Class R1 $ 12.9461 $ 0.4734 $ (0.6121) $ (0.1387) $ 12.8074 (1.07) % (0.39) % 3.62 % Class R2 11.5476 1.0765 (1.2254) (0.1489) 11.3987 (1.29) % (0.61) % 9.35 % Class R3 11.6948 0.4741 (0.6446) (0.1705) 11.5243 (1.46) % (0.78) % 4.03 % Class R4 13.1824 0.2652 (0.4794) (0.2142) 12.9682 (1.62) % (0.95) % 1.99 % Class R5 12.2095 0.2590 (0.4779) (0.2189) 11.9906 (1.79) % (1.12) % 2.11 % Class R6 12.4594 0.2222 (0.4663) (0.2441) 12.2153 (1.96) % (1.29) % 1.77 % Class R7 11.6556 0.4165 (0.6643) (0.2478) 11.4078 (2.13) % (1.46) % 3.56 % Class R8 10.4456 0.0018 (0.2402) (0.2384) 10.2072 (2.28) % (1.63) % 0.02 % (a) Per unit amounts are based on average daily units outstanding.
114

FMT/Vanguard Target Retirement 2025 Fund

THE COLLECTIVE INVESTMENT FUNDS OF FIRST MERCANTILE TRUST COMPANY FMT/Vanguard Target Retirement 2025 Fund
Statement of Assets and Liabilities December 31, 2015
The accompanying notes are an integral part of these financial statements.
Assets Investments in securities, at fair value $ 15,072,754 Liabilities Trustee fees 6,422 Net assets $ 15,066,332 Components of net assets
Units of
Participation NAV
per Unit Net
Assets Class R1 894,697 $ 13.4395 $ 12,024,282Class R3 19,073 $ 10.2467 195,430Class R4 67,216 $ 12.4086 834,058Class R5 23,517 $ 12.7565 299,992Class R6 130,611 $ 11.8286 1,544,937Class R8 17,482 $ 9.5890 167,633
$ 15,066,332
115
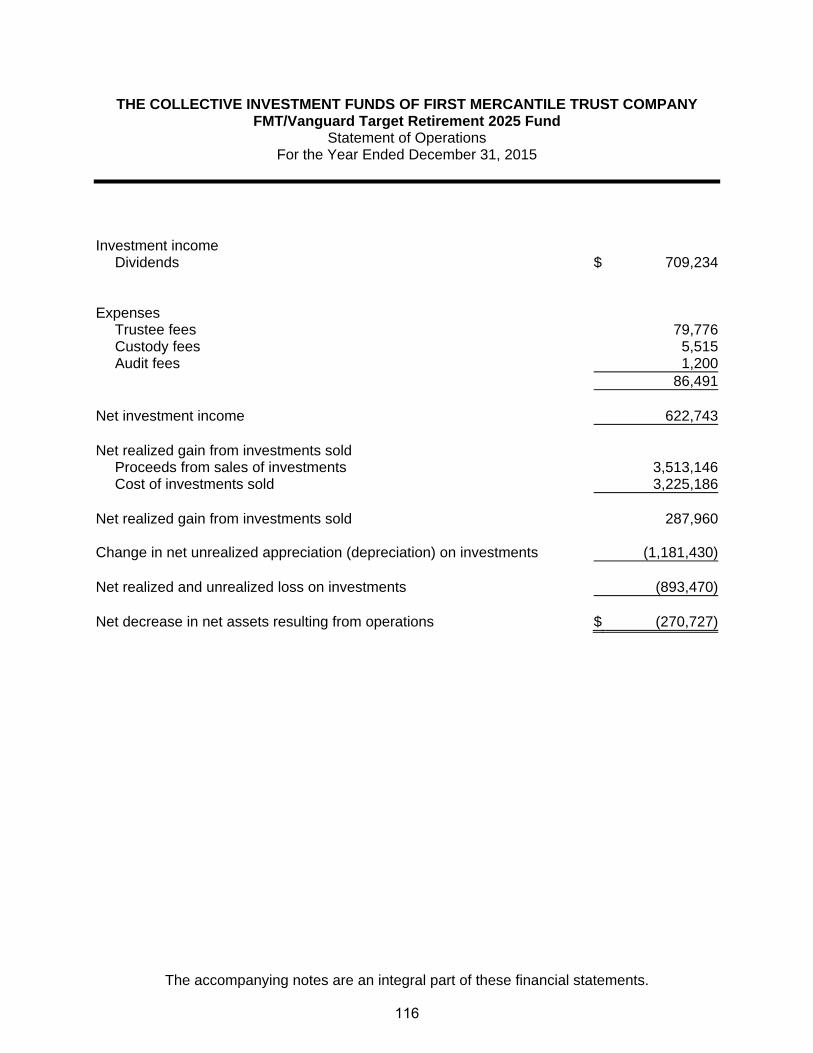
THE COLLECTIVE INVESTMENT FUNDS OF FIRST MERCANTILE TRUST COMPANY FMT/Vanguard Target Retirement 2025 Fund
Statement of Operations For the Year Ended December 31, 2015
The accompanying notes are an integral part of these financial statements.
Investment income
Dividends $ 709,234 Expenses
Trustee fees 79,776Custody fees 5,515Audit fees 1,200
86,491 Net investment income 622,743 Net realized gain from investments sold
Proceeds from sales of investments 3,513,146Cost of investments sold 3,225,186
Net realized gain from investments sold 287,960 Change in net unrealized appreciation (depreciation) on investments (1,181,430) Net realized and unrealized loss on investments (893,470) Net decrease in net assets resulting from operations $ (270,727)
116

THE COLLECTIVE INVESTMENT FUNDS OF FIRST MERCANTILE TRUST COMPANY FMT/Vanguard Target Retirement 2025 Fund
Statement of Changes in Net Assets For the Year Ended December 31, 2015
The accompanying notes are an integral part of these financial statements.
Operations
Net investment income $ 622,743
Net realized gain from investments sold 287,960
Change in net unrealized appreciation (depreciation) on investments (1,181,430)
Net decrease in net assets resulting from operations (270,727) Participant transactions
Proceeds from units purchased 4,070,803Less payments for units redeemed 4,041,118
Increase in net assets from participant transactions 29,685
Total decrease in net assets (241,042) Net assets at beginning of year 15,307,374 Net assets at end of year $ 15,066,332
117
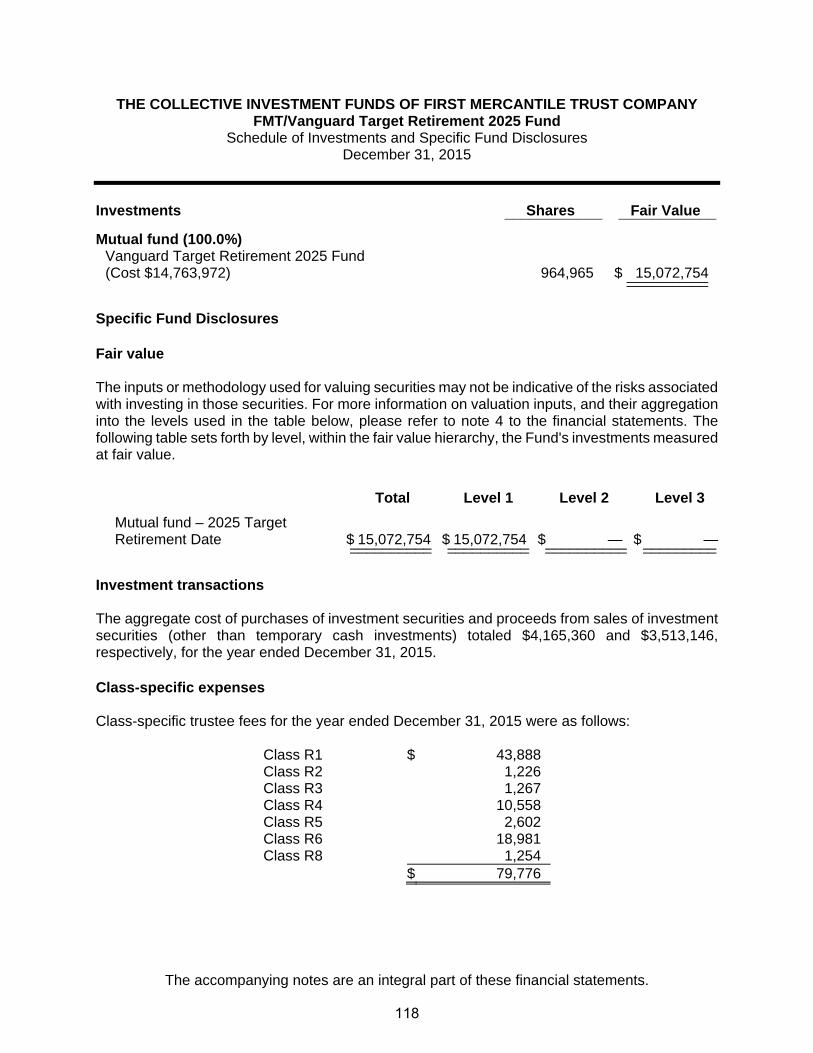
THE COLLECTIVE INVESTMENT FUNDS OF FIRST MERCANTILE TRUST COMPANY FMT/Vanguard Target Retirement 2025 Fund
Schedule of Investments and Specific Fund Disclosures December 31, 2015
The accompanying notes are an integral part of these financial statements.
Investments Shares Fair Value ____________ ____________
Mutual fund (100.0%)
Vanguard Target Retirement 2025 Fund (Cost $14,763,972) 964,965 $ 15,072,754 ____________________
Specific Fund Disclosures Fair value The inputs or methodology used for valuing securities may not be indicative of the risks associated with investing in those securities. For more information on valuation inputs, and their aggregation into the levels used in the table below, please refer to note 4 to the financial statements. The following table sets forth by level, within the fair value hierarchy, the Fund's investments measured at fair value.
Total Level 1 Level 2 Level 3
Mutual fund – 2025 Target Retirement Date $ 15,072,754 $ 15,072,754 $ — $ —__________ __________ __________ ___________________ __________ __________ _________
Investment transactions The aggregate cost of purchases of investment securities and proceeds from sales of investment securities (other than temporary cash investments) totaled $4,165,360 and $3,513,146, respectively, for the year ended December 31, 2015. Class-specific expenses Class-specific trustee fees for the year ended December 31, 2015 were as follows: Class R1 $ 43,888 Class R2 1,226 Class R3 1,267 Class R4 10,558 Class R5 2,602 Class R6 18,981 Class R8 1,254 $ 79,776
118

THE COLLECTIVE INVESTMENT FUNDS OF FIRST MERCANTILE TRUST COMPANY FMT/Vanguard Target Retirement 2025 Fund
Schedule of Participant Transactions December 31, 2015
The accompanying notes are an integral part of these financial statements.
Participant transactions by class for the year ended December 31, 2015 were as follows: Dollars Units Purchases Redemptions Net change Purchases Redemptions Net change Class R1 $ 3,002,081 $ (2,554,270) $ 447,811 217,700 (187,800) 29,900Class R2 24,979 (557,469) (532,490) 2,128 (45,387) (43,259)Class R3 177,306 (10,407) 166,899 16,940 (979) 15,961Class R4 194,891 (703,912) (509,021) 15,296 (57,513) (42,217)Class R5 117,965 (1,498) 116,467 9,062 (114) 8,948Class R6 351,055 (187,245) 163,810 29,052 (15,889) 13,163Class R8 202,526 (26,317) 176,209 20,199 (2,717) 17,482 $ 4,070,803 $ (4,041,118) $ 29,685 310,377 (310,399) (22)
119
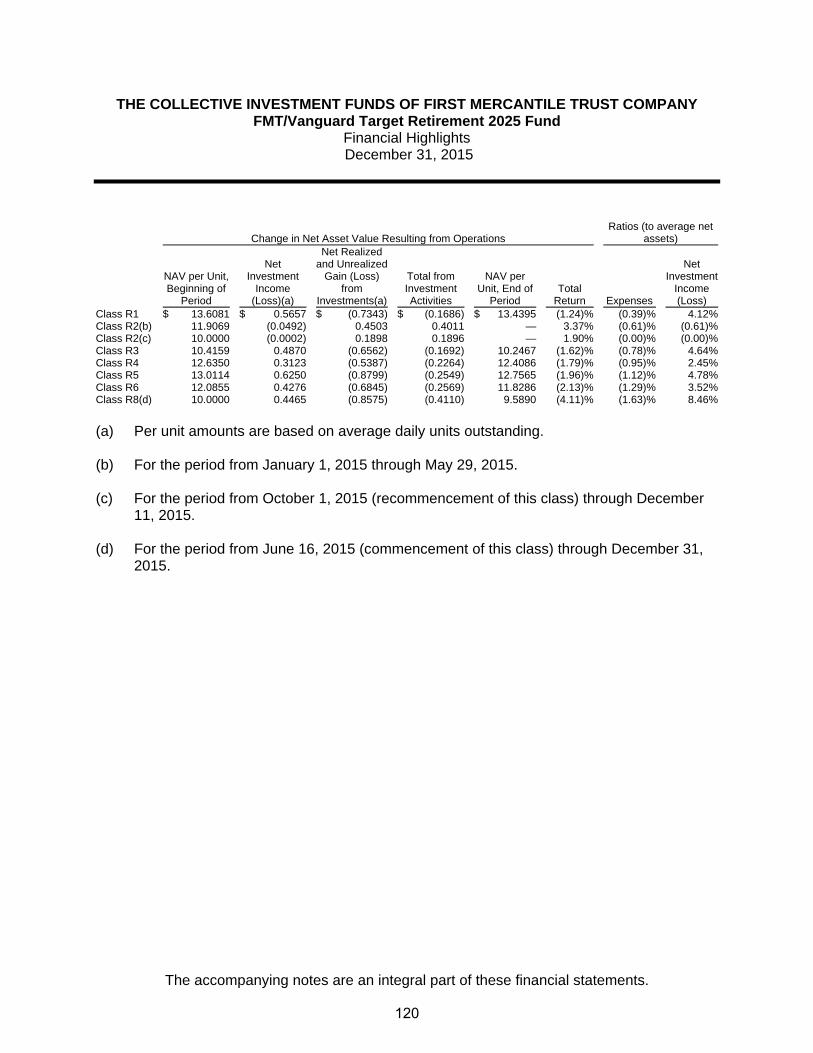
THE COLLECTIVE INVESTMENT FUNDS OF FIRST MERCANTILE TRUST COMPANY FMT/Vanguard Target Retirement 2025 Fund
Financial Highlights December 31, 2015
The accompanying notes are an integral part of these financial statements.
Change in Net Asset Value Resulting from Operations Ratios (to average net
assets)
NAV per Unit, Beginning of
Period
Net Investment
Income (Loss)(a)
Net Realized and Unrealized
Gain (Loss) from
Investments(a)
Total from Investment Activities
NAV per Unit, End of
Period Total
Return Expenses
Net Investment
Income (Loss)
Class R1 $ 13.6081 $ 0.5657 $ (0.7343) $ (0.1686) $ 13.4395 (1.24)% (0.39)% 4.12%Class R2(b) 11.9069 (0.0492) 0.4503 0.4011 — 3.37% (0.61)% (0.61)%Class R2(c) 10.0000 (0.0002) 0.1898 0.1896 — 1.90% (0.00)% (0.00)%Class R3 10.4159 0.4870 (0.6562) (0.1692) 10.2467 (1.62)% (0.78)% 4.64%Class R4 12.6350 0.3123 (0.5387) (0.2264) 12.4086 (1.79)% (0.95)% 2.45%Class R5 13.0114 0.6250 (0.8799) (0.2549) 12.7565 (1.96)% (1.12)% 4.78%Class R6 12.0855 0.4276 (0.6845) (0.2569) 11.8286 (2.13)% (1.29)% 3.52%Class R8(d) 10.0000 0.4465 (0.8575) (0.4110) 9.5890 (4.11)% (1.63)% 8.46%
(a) Per unit amounts are based on average daily units outstanding.
(b) For the period from January 1, 2015 through May 29, 2015.
(c) For the period from October 1, 2015 (recommencement of this class) through December
11, 2015.
(d) For the period from June 16, 2015 (commencement of this class) through December 31, 2015.
120

FMT/Vanguard Target Retirement 2030 Fund

THE COLLECTIVE INVESTMENT FUNDS OF FIRST MERCANTILE TRUST COMPANY FMT/Vanguard Target Retirement 2030 Fund
Statement of Assets and Liabilities December 31, 2015
The accompanying notes are an integral part of these financial statements.
Assets Investments in securities, at fair value $ 38,648,932 Liabilities Trustee fees 17,129 Net assets $ 38,631,803 Components of net assets
Units of
Participation NAV
per Unit Net
Assets Class R1 1,987,296 $ 13.1077 $ 26,048,977Class R2 216,310 $ 11.8935 2,572,685Class R3 358,320 $ 11.0338 3,953,623Class R4 155,984 $ 13.6259 2,125,425Class R5 179,434 $ 13.2308 2,374,059Class R6 76,014 $ 12.4753 948,293Class R7 36,197 $ 11.8446 428,745Class R8 15,423 $ 11.6708 179,996
$ 38,631,803
121

THE COLLECTIVE INVESTMENT FUNDS OF FIRST MERCANTILE TRUST COMPANY FMT/Vanguard Target Retirement 2030 Fund
Statement of Operations For the Year Ended December 31, 2015
The accompanying notes are an integral part of these financial statements.
Investment income
Dividends $ 1,387,238 Expenses
Trustee fees 176,103Custody fees 10,909Audit fees 1,200
188,212 Net investment income 1,199,026 Net realized gain from investments sold
Proceeds from sales of investments 3,590,635Cost of investments sold 3,255,549
Net realized gain from investments sold 335,086 Change in net unrealized appreciation (depreciation) on investments (1,798,572) Net realized and unrealized loss on investments (1,463,486) Net decrease in net assets resulting from operations $ (264,460)
122

THE COLLECTIVE INVESTMENT FUNDS OF FIRST MERCANTILE TRUST COMPANY FMT/Vanguard Target Retirement 2030 Fund
Statement of Changes in Net Assets For the Year Ended December 31, 2015
The accompanying notes are an integral part of these financial statements.
Operations
Net investment income $ 1,199,026
Net realized gain from investments sold 335,086
Change in net unrealized appreciation (depreciation) on investments (1,798,572)
Net decrease in net assets resulting from operations (264,460) Participant transactions
Proceeds from units purchased 13,434,443Less payments for units redeemed 4,753,900
Increase in net assets from participant transactions 8,680,543
Total increase in net assets 8,416,083 Net assets at beginning of year 30,215,720 Net assets at end of year $ 38,631,803
123

THE COLLECTIVE INVESTMENT FUNDS OF FIRST MERCANTILE TRUST COMPANY FMT/Vanguard Target Retirement 2030 Fund
Schedule of Investments and Specific Fund Disclosures December 31, 2015
The accompanying notes are an integral part of these financial statements.
Investments Shares Fair Value ____________ ____________
Mutual fund (100.0%)
Vanguard Target Retirement 2030 Fund (Cost $37,507,104) 1,394,262 $ 38,648,932 ____________________
Specific Fund Disclosures Fair value The inputs or methodology used for valuing securities may not be indicative of the risks associated with investing in those securities. For more information on valuation inputs, and their aggregation into the levels used in the table below, please refer to note 4 to the financial statements. The following table sets forth by level, within the fair value hierarchy, the Fund's investments measured at fair value.
Total Level 1 Level 2 Level 3
Mutual fund – 2030 Target Retirement Date $ 38,648,932 $ 38,648,932 $ — $ —__________ __________ __________ ___________________ __________ __________ _________
Investment transactions The aggregate cost of purchases of investment securities and proceeds from sales of investment securities (other than temporary cash investments) totaled $13,474,029 and $3,590,635, respectively, for the year ended December 31, 2015. Class-specific expenses Class-specific trustee fees for the year ended December 31, 2015 were as follows: Class R1 $ 81,592 Class R2 6,322 Class R3 23,765 Class R4 19,401 Class R5 24,032 Class R6 12,303 Class R7 5,850 Class R8 2,838 $ 176,103
124

THE COLLECTIVE INVESTMENT FUNDS OF FIRST MERCANTILE TRUST COMPANY FMT/Vanguard Target Retirement 2030 Fund
Schedule of Participant Transactions December 31, 2015
The accompanying notes are an integral part of these financial statements.
Participant transactions by class for the year ended December 31, 2015 were as follows: Dollars Units Purchases Redemptions Net change Purchases Redemptions Net change Class R1 $ 7,246,069 $ (2,523,129) $ 4,722,940 559,284 (188,542) 370,742Class R2 2,579,677 (655,013) 1,924,664 221,211 (52,662) 168,549Class R3 2,100,901 (641,080) 1,459,821 191,650 (57,531) 134,119Class R4 277,883 (164,543) 113,340 19,782 (11,713) 8,069Class R5 922,020 (363,237) 558,783 67,050 (26,994) 40,056Class R6 217,960 (362,303) (144,343) 17,035 (27,709) (10,674)Class R7 67,741 (22,206) 45,535 5,673 (1,847) 3,826Class R8 22,192 (22,389) (197) 1,843 (1,865) (22) $ 13,434,443 $ (4,753,900) $ 8,680,543 1,083,528 (368,863) 714,665
125

THE COLLECTIVE INVESTMENT FUNDS OF FIRST MERCANTILE TRUST COMPANY FMT/Vanguard Target Retirement 2030 Fund
Financial Highlights December 31, 2015
The accompanying notes are an integral part of these financial statements.
Change in Net Asset Value Resulting from Operations Ratios (to average net
assets)
NAV per Unit, Beginning of
Period
Net Investment
Income (Loss)(a)
Net Realized and Unrealized
Gain (Loss) from
Investments(a)
Total from Investment Activities
NAV per Unit, End of
Period Total
Return Expenses
Net Investment
Income (Loss)
Class R1 $ 13.2960 $ 0.4868 $ (0.6751) $ (0.1883) $ 13.1077 (1.42)% (0.39)% 3.63%Class R2 12.0910 0.9299 (1.1274) (0.1975) 11.8935 (1.63)% (0.61)% 7.73%Class R3 11.2361 0.4125 (0.6148) (0.2023) 11.0338 (1.80)% (0.78)% 3.64%Class R4 13.8995 0.3685 (0.6421) (0.2736) 13.6259 (1.97)% (0.95)% 2.63%Class R5 13.5195 0.3686 (0.6573) (0.2887) 13.2308 (2.14)% (1.12)% 2.71%Class R6 12.7692 0.2795 (0.5734) (0.2939) 12.4753 (2.30)% (1.29)% 2.17%Class R7 12.1444 0.2784 (0.5782) (0.2998) 11.8446 (2.47)% (1.46)% 2.28%Class R8 11.9866 0.2402 (0.5560) (0.3158) 11.6708 (2.63)% (1.63)% 2.00%
(a) Per unit amounts are based on average daily units outstanding.
126
FMT/Vanguard Target Retirement 2035 Fund
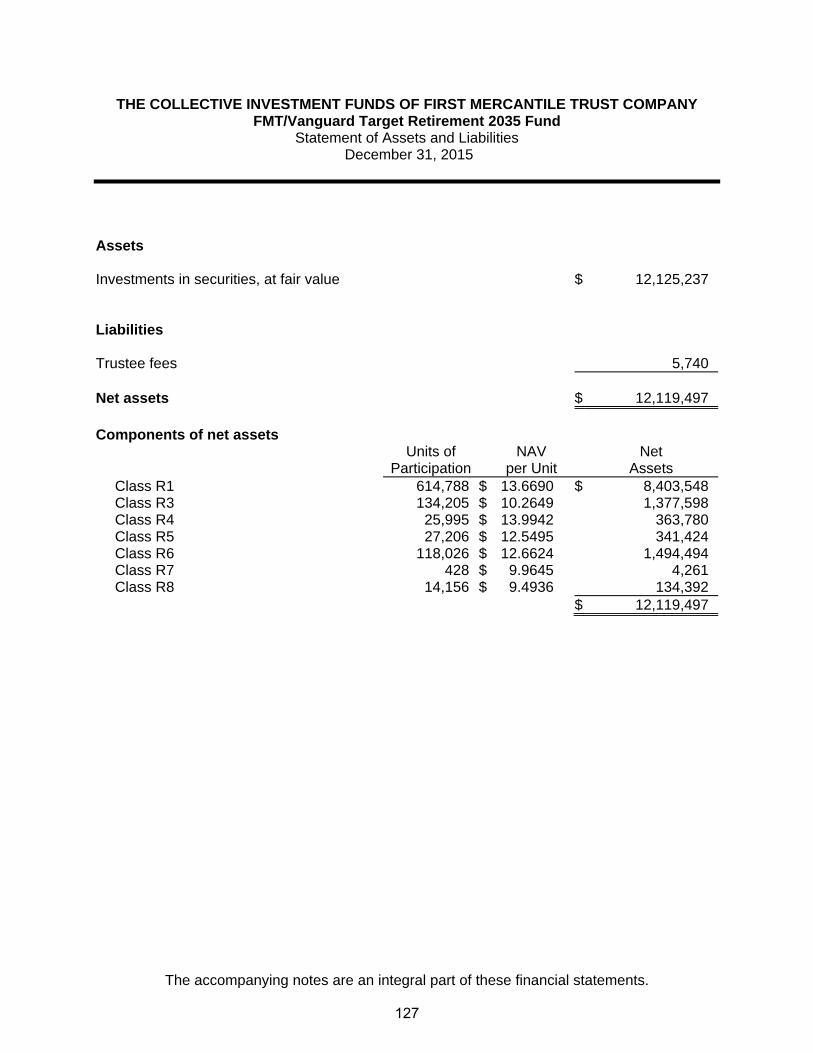
THE COLLECTIVE INVESTMENT FUNDS OF FIRST MERCANTILE TRUST COMPANY FMT/Vanguard Target Retirement 2035 Fund
Statement of Assets and Liabilities December 31, 2015
The accompanying notes are an integral part of these financial statements.
Assets Investments in securities, at fair value $ 12,125,237 Liabilities Trustee fees 5,740 Net assets $ 12,119,497 Components of net assets
Units of
Participation NAV
per Unit Net
Assets Class R1 614,788 $ 13.6690 $ 8,403,548Class R3 134,205 $ 10.2649 1,377,598Class R4 25,995 $ 13.9942 363,780Class R5 27,206 $ 12.5495 341,424Class R6 118,026 $ 12.6624 1,494,494Class R7 428 $ 9.9645 4,261Class R8 14,156 $ 9.4936 134,392
$ 12,119,497
127

THE COLLECTIVE INVESTMENT FUNDS OF FIRST MERCANTILE TRUST COMPANY FMT/Vanguard Target Retirement 2035 Fund
Statement of Operations For the Year Ended December 31, 2015
The accompanying notes are an integral part of these financial statements.
Investment income
Dividends $ 540,651 Expenses
Trustee fees 75,490Custody fees 5,329Audit fees 1,200
82,019 Net investment income 458,632 Net realized gain from investments sold
Proceeds from sales of investments 5,461,220Cost of investments sold 5,007,600
Net realized gain from investments sold 453,620 Change in net unrealized appreciation (depreciation) on investments (1,167,734) Net realized and unrealized loss on investments (714,114) Net decrease in net assets resulting from operations $ (255,482)
128

THE COLLECTIVE INVESTMENT FUNDS OF FIRST MERCANTILE TRUST COMPANY FMT/Vanguard Target Retirement 2035 Fund
Statement of Changes in Net Assets For the Year Ended December 31, 2015
The accompanying notes are an integral part of these financial statements.
Operations
Net investment income $ 458,632
Net realized gain from investments sold 453,620
Change in net unrealized appreciation (depreciation) on investments (1,167,734)
Net decrease in net assets resulting from operations (255,482) Participant transactions
Proceeds from units purchased 3,948,674Less payments for units redeemed 6,134,573
Decrease in net assets from participant transactions (2,185,899)
Total decrease in net assets (2,441,381) Net assets at beginning of year 14,560,878 Net assets at end of year $ 12,119,497
129

THE COLLECTIVE INVESTMENT FUNDS OF FIRST MERCANTILE TRUST COMPANY FMT/Vanguard Target Retirement 2035 Fund
Schedule of Investments and Specific Fund Disclosures December 31, 2015
The accompanying notes are an integral part of these financial statements.
Investments Shares Fair Value ____________ ____________
Mutual fund (100.0%)
Vanguard Target Retirement 2035 Fund (Cost $11,965,444) 720,026 $ 12,125,237 ____________________
Specific Fund Disclosures Fair value The inputs or methodology used for valuing securities may not be indicative of the risks associated with investing in those securities. For more information on valuation inputs, and their aggregation into the levels used in the table below, please refer to note 4 to the financial statements. The following table sets forth by level, within the fair value hierarchy, the Fund's investments measured at fair value.
Total Level 1 Level 2 Level 3
Mutual fund - 2035 Target Retirement Date $ 12,125,237 $ 12,125,237 $ — $ —__________ __________ __________ ___________________ __________ __________ _________
Investment transactions The aggregate cost of purchases of investment securities and proceeds from sales of investment securities (other than temporary cash investments) totaled $3,733,534 and $5,461,220, respectively, for the year ended December 31, 2015. Class-specific expenses Class-specific trustee fees for the year ended December 31, 2015 were as follows: Class R1 $ 40,164 Class R2 938 Class R3 9,050 Class R4 3,311 Class R5 3,970 Class R6 17,049 Class R7 33 Class R8 975 $ 75,490
130

THE COLLECTIVE INVESTMENT FUNDS OF FIRST MERCANTILE TRUST COMPANY FMT/Vanguard Target Retirement 2035 Fund
Schedule of Participant Transactions December 31, 2015
The accompanying notes are an integral part of these financial statements.
Participant transactions by class for the year ended December 31, 2015 were as follows: Dollars Units Purchases Redemptions Net change Purchases Redemptions Net change Class R1 $ 1,716,454 $ (4,997,020) $ (3,280,566) 121,500 (357,126) (235,626)Class R2 50,822 (430,424) (379,602) 4,117 (34,416) (30,299)Class R3 1,247,232 (68,697) 1,178,535 115,342 (6,695) 108,647Class R4 84,606 (81,092) 3,514 5,894 (5,586) 308Class R5 143,385 (360,357) (216,972) 11,047 (27,508) (16,461)Class R6 502,946 (141,875) 361,071 37,943 (10,817) 27,126Class R7 20,487 (16,290) 4,197 2,030 (1,602) 428Class R8 182,742 (38,818) 143,924 18,234 (4,078) 14,156 $ 3,948,674 $ (6,134,573) $ (2,185,899) 316,107 (447,828) (131,721)
131

THE COLLECTIVE INVESTMENT FUNDS OF FIRST MERCANTILE TRUST COMPANY FMT/Vanguard Target Retirement 2035 Fund
Financial Highlights December 31, 2015
The accompanying notes are an integral part of these financial statements.
Change in Net Asset Value Resulting from Operations Ratios (to average net
assets)
NAV per Unit, Beginning of
Period
Net Investment
Income (Loss)(a)
Net Realized and Unrealized
Gain (Loss) from
Investments(a)
Total from Investment Activities
NAV per Unit, End of
Period Total
Return Expenses
Net Investment
Income (Loss)
Class R1 $ 13.8979 $ 0.4042 $ (0.6331) $ (0.2289) $ 13.6690 (1.65)% (0.38)% 2.88%Class R2(b) 12.0265 (0.0312) 0.5118 0.4806 — 4.00% (0.61)% (0.61)%Class R3 10.4777 0.4480 (0.6608) (0.2128) 10.2649 (2.03)% (0.78)% 4.24%Class R4 14.3087 0.5018 (0.8163) (0.3145) 13.9942 (2.20)% (0.95)% 3.48%Class R5 12.8534 0.3910 (0.6949) (0.3039) 12.5495 (2.36)% (1.12)% 3.02%Class R6 12.9912 0.4670 (0.7958) (0.3288) 12.6624 (2.53)% (1.29)% 3.58%Class R7(c) 10.0000 0.6798 (0.7153) (0.0355) 9.9645 (0.36)% (1.49)% 6.77%Class R8(d) 10.0000 0.4334 (0.9398) (0.5064) 9.4936 (5.06)% (1.63)% 8.16%
(a) Per unit amounts are based on average daily units outstanding.
(b) For the period from January 1, 2015 through May 29, 2015.
(c) For the period from January 7, 2015 (commencement of this class) through December 31,
2015. (d) For the period from June 16, 2015 (commencement of this class) through December 31,
2015.
132

FMT/Vanguard Target Retirement 2040 Fund

THE COLLECTIVE INVESTMENT FUNDS OF FIRST MERCANTILE TRUST COMPANY FMT/Vanguard Target Retirement 2040 Fund
Statement of Assets and Liabilities December 31, 2015
The accompanying notes are an integral part of these financial statements.
Assets Investments in securities, at fair value $ 14,979,740 Liabilities Trustee fees 6,993 Net assets $ 14,972,747 Components of net assets
Units of
Participation NAV
per Unit Net
Assets Class R1 640,350 $ 13.7701 $ 8,817,685Class R2 172,944 $ 11.8582 2,050,808Class R3 160,513 $ 11.0750 1,777,673Class R4 42,447 $ 12.2907 521,703Class R5 81,975 $ 12.8033 1,049,557Class R6 25,602 $ 12.9602 331,811Class R7 19,756 $ 12.0876 238,807Class R8 14,725 $ 12.5439 184,703
$ 14,972,747
133

THE COLLECTIVE INVESTMENT FUNDS OF FIRST MERCANTILE TRUST COMPANY FMT/Vanguard Target Retirement 2040 Fund
Statement of Operations For the Year Ended December 31, 2015
The accompanying notes are an integral part of these financial statements.
Investment income
Dividends $ 434,437 Expenses
Trustee fees 64,812Custody fees 3,760Audit fees 1,200
69,772 Net investment income 364,665 Net realized gain from investments sold
Proceeds from sales of investments 1,691,481Cost of investments sold 1,533,931
Net realized gain from investments sold 157,550 Change in net unrealized appreciation (depreciation) on investments (648,015) Net realized and unrealized loss on investments (490,465) Net decrease in net assets resulting from operations $ (125,800)
134

THE COLLECTIVE INVESTMENT FUNDS OF FIRST MERCANTILE TRUST COMPANY FMT/Vanguard Target Retirement 2040 Fund
Statement of Changes in Net Assets For the Year Ended December 31, 2015
The accompanying notes are an integral part of these financial statements.
Operations
Net investment income $ 364,665
Net realized gain from investments sold 157,550
Change in net unrealized appreciation (depreciation) on investments (648,015)
Net decrease in net assets resulting from operations (125,800) Participant transactions
Proceeds from units purchased 7,339,103Less payments for units redeemed 2,526,247
Increase in net assets from participant transactions 4,812,856
Total increase in net assets 4,687,056 Net assets at beginning of year 10,285,691 Net assets at end of year $ 14,972,747
135
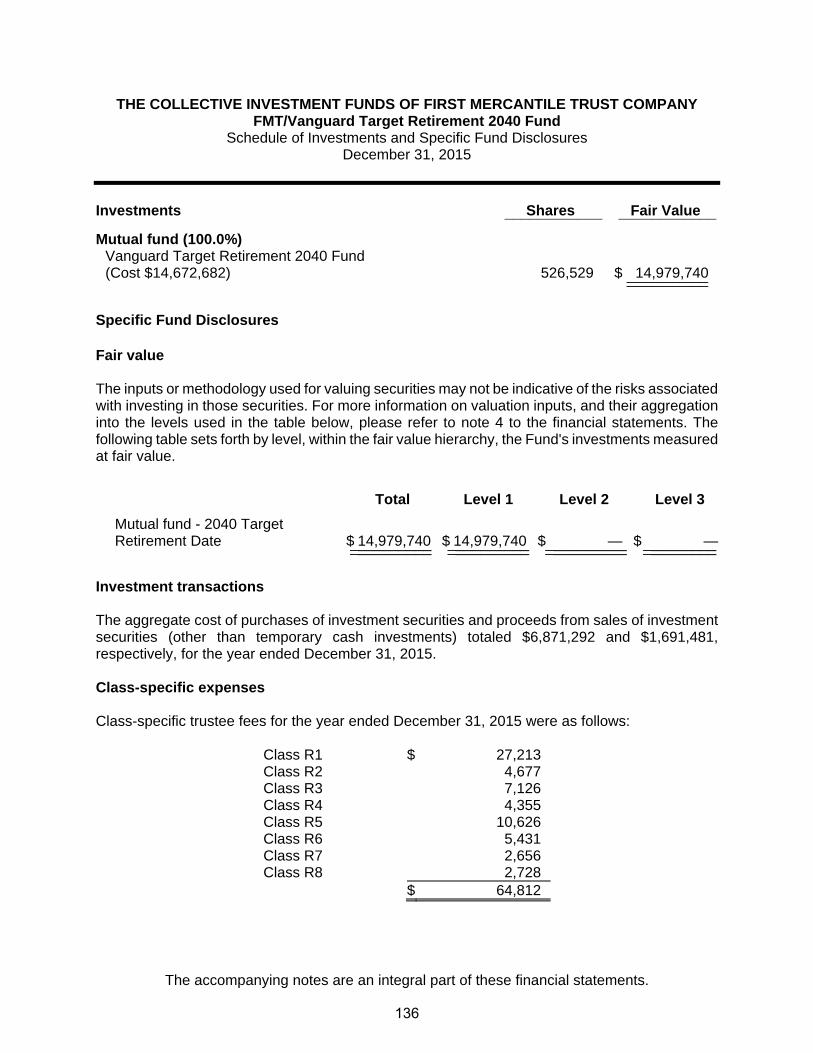
THE COLLECTIVE INVESTMENT FUNDS OF FIRST MERCANTILE TRUST COMPANY FMT/Vanguard Target Retirement 2040 Fund
Schedule of Investments and Specific Fund Disclosures December 31, 2015
The accompanying notes are an integral part of these financial statements.
Investments Shares Fair Value ____________ ____________
Mutual fund (100.0%)
Vanguard Target Retirement 2040 Fund (Cost $14,672,682) 526,529 $ 14,979,740 ____________________
Specific Fund Disclosures Fair value The inputs or methodology used for valuing securities may not be indicative of the risks associated with investing in those securities. For more information on valuation inputs, and their aggregation into the levels used in the table below, please refer to note 4 to the financial statements. The following table sets forth by level, within the fair value hierarchy, the Fund's investments measured at fair value.
Total Level 1 Level 2 Level 3
Mutual fund - 2040 Target Retirement Date $ 14,979,740 $ 14,979,740 $ — $ —__________ __________ __________ ___________________ __________ __________ _________
Investment transactions The aggregate cost of purchases of investment securities and proceeds from sales of investment securities (other than temporary cash investments) totaled $6,871,292 and $1,691,481, respectively, for the year ended December 31, 2015. Class-specific expenses Class-specific trustee fees for the year ended December 31, 2015 were as follows: Class R1 $ 27,213 Class R2 4,677 Class R3 7,126 Class R4 4,355 Class R5 10,626 Class R6 5,431 Class R7 2,656 Class R8 2,728 $ 64,812
136

THE COLLECTIVE INVESTMENT FUNDS OF FIRST MERCANTILE TRUST COMPANY FMT/Vanguard Target Retirement 2040 Fund
Schedule of Participant Transactions December 31, 2015
The accompanying notes are an integral part of these financial statements.
Participant transactions by class for the year ended December 31, 2015 were as follows: Dollars Units Purchases Redemptions Net change Purchases Redemptions Net change Class R1 $ 2,788,332 $ (1,250,665) $ 1,537,667 203,677 (88,441) 115,236Class R2 1,957,067 (406,297) 1,550,770 168,206 (32,563) 135,643Class R3 1,717,136 (49,552) 1,667,584 153,863 (4,385) 149,478Class R4 130,372 (24,118) 106,254 10,275 (1,991) 8,284Class R5 562,785 (410,965) 151,820 41,788 (30,608) 11,180Class R6 52,981 (334,975) (281,994) 3,904 (24,300) (20,396)Class R7 75,316 (1,583) 73,733 6,082 (124) 5,958Class R8 55,114 (48,092) 7,022 4,235 (3,702) 533 $ 7,339,103 $ (2,526,247) $ 4,812,856 592,030 (186,114) 405,916
137

THE COLLECTIVE INVESTMENT FUNDS OF FIRST MERCANTILE TRUST COMPANY FMT/Vanguard Target Retirement 2040 Fund
Financial Highlights December 31, 2015
The accompanying notes are an integral part of these financial statements.
Change in Net Asset Value Resulting from Operations Ratios (to average net
assets)
NAV per Unit,
Beginning of Period
Net Investment
Income (Loss)(a)
Net Realized and Unrealized
Gain (Loss) from
Investments(a)
Total from Investment Activities
NAV per Unit, End of
Period Total
Return Expenses
Net Investment
Income (Loss)
Class R1 $ 14.0474 $ 0.4109 $ (0.6882) $ (0.2773) $ 13.7701 (1.97)% (0.39)% 2.90%Class R2 12.1238 0.7999 (1.0655) (0.2656) 11.8582 (2.19)% (0.61)% 6.64%Class R3 11.3424 0.5205 (0.7879) (0.2674) 11.0750 (2.36)% (0.78)% 4.58%Class R4 12.6090 0.2794 (0.5977) (0.3183) 12.2907 (2.52)% (0.95)% 2.20%Class R5 13.1573 0.2597 (0.6137) (0.3540) 12.8033 (2.69)% (1.12)% 1.97%Class R6 13.3413 0.1245 (0.5056) (0.3811) 12.9602 (2.86)% (1.29)% 0.93%Class R7 12.4643 0.2809 (0.6576) (0.3767) 12.0876 (3.02)% (1.46)% 2.25%Class R8 12.9569 0.1937 (0.6067) (0.4130) 12.5439 (3.19)% (1.63)% 1.49%
(a) Per unit amounts are based on average daily units outstanding.
138

FMT/Vanguard Target Retirement 2045 Fund

THE COLLECTIVE INVESTMENT FUNDS OF FIRST MERCANTILE TRUST COMPANY
FMT/Vanguard Target Retirement 2045 Fund Statement of Assets and Liabilities
December 31, 2015
The accompanying notes are an integral part of these financial statements.
Assets Investments in securities, at fair value $ 8,641,091 Liabilities Trustee fees 3,276
Net assets $ 8,637,815
Components of net assets
Units of
Participation NAV
per Unit Net
Assets Class R1 543,979 $ 13.4553 $ 7,319,394
Class R3 49,205 $ 10.7151 527,236
Class R4 11,065 $ 14.1378 156,434
Class R5 15,953 $ 13.6743 218,149
Class R6 28,620 $ 12.8324 367,263
Class R8 5,231 $ 9.4317 49,339
$ 8,637,815
139

THE COLLECTIVE INVESTMENT FUNDS OF FIRST MERCANTILE TRUST COMPANY
FMT/Vanguard Target Retirement 2045 Fund Statement of Operations
For the Year Ended December 31, 2015
The accompanying notes are an integral part of these financial statements.
Investment income
Dividends $ 275,064
Expenses
Trustee fees 36,961
Custody fees 2,922
Audit fees 1,200
41,083
Net investment income 233,981
Net realized gain from investments sold
Proceeds from sales of investments 1,100,992
Cost of investments sold 931,750
Net realized gain from investments sold 169,242
Change in net unrealized appreciation (depreciation) on investments (595,663)
Net realized and unrealized loss on investments (426,421)
Net decrease in net assets resulting from operations $ (192,440)
140

THE COLLECTIVE INVESTMENT FUNDS OF FIRST MERCANTILE TRUST COMPANY
FMT/Vanguard Target Retirement 2045 Fund Statement of Changes in Net Assets
For the Year Ended December 31, 2015
The accompanying notes are an integral part of these financial statements.
Operations
Net investment income $ 233,981
Net realized gain from investments sold 169,242
Change in net unrealized appreciation (depreciation) on investments (595,663)
Net decrease in net assets resulting from operations (192,440)
Participant transactions
Proceeds from units purchased 2,176,609
Less payments for units redeemed 1,700,871
Increase in net assets from participant transactions 475,738
Total increase in net assets 283,298
Net assets at beginning of year 8,354,517
Net assets at end of year $ 8,637,815
141

THE COLLECTIVE INVESTMENT FUNDS OF FIRST MERCANTILE TRUST COMPANY FMT/Vanguard Target Retirement 2045 Fund
Schedule of Investments and Specific Fund Disclosures December 31, 2015
The accompanying notes are an integral part of these financial statements.
Investments Shares Fair Value ____________ ____________
Mutual fund (100.0%)
Vanguard Target Retirement 2045 Fund (Cost $7,994,420) 486,001 $ 8,641,091 __________ __________
Specific Fund Disclosures
Fair value
The inputs or methodology used for valuing securities may not be indicative of the risks associated with investing in those securities. For more information on valuation inputs, and their aggregation into the levels used in the table below, please refer to note 4 to the financial statements. The following table sets forth by level, within the fair value hierarchy, the Fund's investments measured at fair value.
Total Level 1 Level 2 Level 3
Mutual fund - 2045 Target Retirement Date $ 8,641,091 $ 8,641,091 $ — $ — __________ __________ __________ _________ __________ __________ __________ _________
Investment transactions
The aggregate cost of purchases of investment securities and proceeds from sales of investment securities (other than temporary cash investments) totaled $1,810,845 and $1,100,992, respectively, for the year ended December 31, 2015.
Class-specific expenses Class-specific trustee fees for the year ended December 31, 2015 were as follows: Class R1 $ 25,612 Class R2 238 Class R3 2,940 Class R4 1,150 Class R5 2,096 Class R6 4,600 Class R8 325 $ 36,961
142
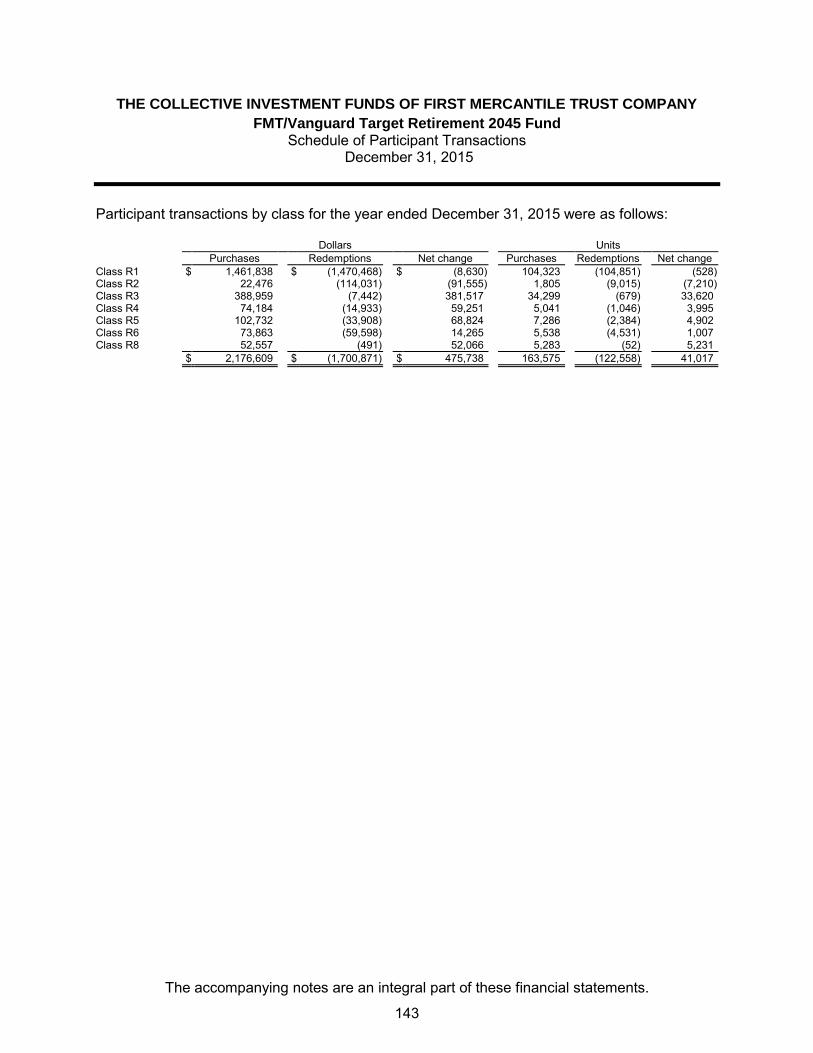
THE COLLECTIVE INVESTMENT FUNDS OF FIRST MERCANTILE TRUST COMPANY
FMT/Vanguard Target Retirement 2045 Fund Schedule of Participant Transactions
December 31, 2015
The accompanying notes are an integral part of these financial statements.
Participant transactions by class for the year ended December 31, 2015 were as follows: Dollars Units Purchases Redemptions Net change Purchases Redemptions Net change Class R1 $ 1,461,838 $ (1,470,468) $ (8,630) 104,323 (104,851) (528) Class R2 22,476 (114,031) (91,555) 1,805 (9,015) (7,210) Class R3 388,959 (7,442) 381,517 34,299 (679) 33,620 Class R4 74,184 (14,933) 59,251 5,041 (1,046) 3,995 Class R5 102,732 (33,908) 68,824 7,286 (2,384) 4,902 Class R6 73,863 (59,598) 14,265 5,538 (4,531) 1,007 Class R8 52,557 (491) 52,066 5,283 (52) 5,231 $ 2,176,609 $ (1,700,871) $ 475,738 163,575 (122,558) 41,017
143
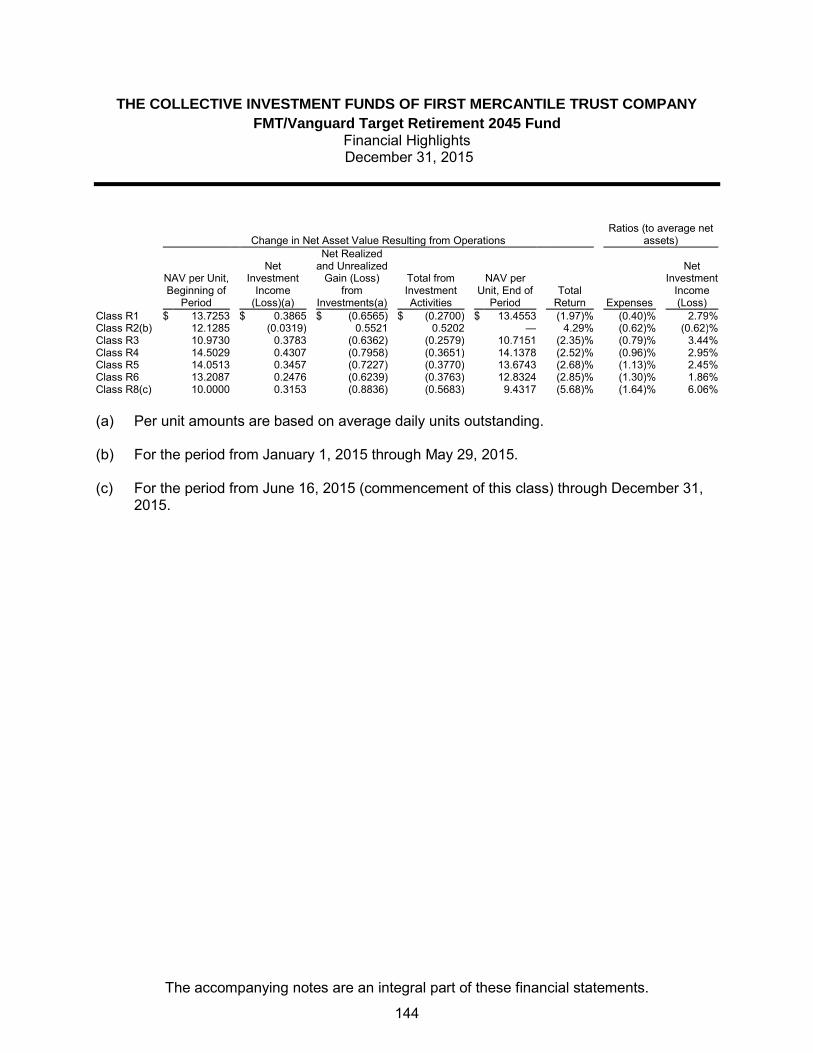
THE COLLECTIVE INVESTMENT FUNDS OF FIRST MERCANTILE TRUST COMPANY
FMT/Vanguard Target Retirement 2045 Fund Financial Highlights December 31, 2015
The accompanying notes are an integral part of these financial statements.
Change in Net Asset Value Resulting from Operations Ratios (to average net
assets)
NAV per Unit, Beginning of
Period
Net Investment
Income (Loss)(a)
Net Realized and Unrealized
Gain (Loss) from
Investments(a)
Total from Investment Activities
NAV per Unit, End of
Period Total
Return Expenses
Net Investment
Income (Loss)
Class R1 $ 13.7253 $ 0.3865 $ (0.6565) $ (0.2700) $ 13.4553 (1.97) % (0.40) % 2.79 % Class R2(b) 12.1285 (0.0319) 0.5521 0.5202 — 4.29 % (0.62) % (0.62) % Class R3 10.9730 0.3783 (0.6362) (0.2579) 10.7151 (2.35) % (0.79) % 3.44 % Class R4 14.5029 0.4307 (0.7958) (0.3651) 14.1378 (2.52) % (0.96) % 2.95 % Class R5 14.0513 0.3457 (0.7227) (0.3770) 13.6743 (2.68) % (1.13) % 2.45 % Class R6 13.2087 0.2476 (0.6239) (0.3763) 12.8324 (2.85) % (1.30) % 1.86 % Class R8(c) 10.0000 0.3153 (0.8836) (0.5683) 9.4317 (5.68) % (1.64) % 6.06 % (a) Per unit amounts are based on average daily units outstanding.
(b) For the period from January 1, 2015 through May 29, 2015.
(c) For the period from June 16, 2015 (commencement of this class) through December 31,
2015.
144

FMT/Vanguard Target Retirement 2050 Fund

THE COLLECTIVE INVESTMENT FUNDS OF FIRST MERCANTILE TRUST COMPANY
FMT/Vanguard Target Retirement 2050 Fund Statement of Assets and Liabilities
December 31, 2015
The accompanying notes are an integral part of these financial statements.
Assets Investments in securities, at fair value $ 4,747,238 Liabilities Trustee fees 2,517
Net assets $ 4,744,721
Components of net assets
Units of
Participation NAV
per Unit Net
Assets Class R1 139,798 $ 13.4466 $ 1,879,808
Class R2 123,569 $ 11.8532 1,464,694
Class R3 19,853 $ 11.8123 234,507
Class R4 27,271 $ 14.1297 385,335
Class R5 45,296 $ 12.7857 579,143
Class R6 5,314 $ 12.9470 68,804
Class R7 3,857 $ 10.3355 39,860
Class R8 8,004 $ 11.5655 92,570
$ 4,744,721
145

THE COLLECTIVE INVESTMENT FUNDS OF FIRST MERCANTILE TRUST COMPANY
FMT/Vanguard Target Retirement 2050 Fund Statement of Operations
For the Year Ended December 31, 2015
The accompanying notes are an integral part of these financial statements.
Investment income
Dividends $ 109,397
Expenses
Trustee fees 21,308
Audit fees 1,200
Custody fees 1,023
23,531
Net investment income 85,866
Net realized gain from investments sold
Proceeds from sales of investments 981,729
Cost of investments sold 900,059
Net realized gain from investments sold 81,670
Change in net unrealized appreciation (depreciation) on investments (170,031)
Net realized and unrealized loss on investments (88,361)
Net decrease in net assets resulting from operations $ (2,495)
146

THE COLLECTIVE INVESTMENT FUNDS OF FIRST MERCANTILE TRUST COMPANY
FMT/Vanguard Target Retirement 2050 Fund Statement of Changes in Net Assets
For the Year Ended December 31, 2015
The accompanying notes are an integral part of these financial statements.
Operations
Net investment income $ 85,866
Net realized gain from investments sold 81,670
Change in net unrealized appreciation (depreciation) on investments (170,031)
Net decrease in net assets resulting from operations (2,495)
Participant transactions
Proceeds from units purchased 3,430,199
Less payments for units redeemed 1,308,531
Increase in net assets from participant transactions 2,121,668
Total increase in net assets 2,119,173
Net assets at beginning of year 2,625,548
Net assets at end of year $ 4,744,721
147

THE COLLECTIVE INVESTMENT FUNDS OF FIRST MERCANTILE TRUST COMPANY FMT/Vanguard Target Retirement 2050 Fund
Schedule of Investments and Specific Fund Disclosures December 31, 2015
The accompanying notes are an integral part of these financial statements.
Investments Shares Fair Value ____________ ____________
Mutual fund (100.1%)
Vanguard Target Retirement 2050 Fund (Cost $4,665,480) 166,628 $ 4,747,238 __________ __________
Specific Fund Disclosures
Fair value
The inputs or methodology used for valuing securities may not be indicative of the risks associated with investing in those securities. For more information on valuation inputs, and their aggregation into the levels used in the table below, please refer to note 4 to the financial statements. The following table sets forth by level, within the fair value hierarchy, the Fund's investments measured at fair value.
Total Level 1 Level 2 Level 3
Mutual fund - Target Retirement Date 2050 $ 4,747,238 $ 4,747,238 $ — $ — __________ __________ __________ _________ __________ __________ __________ _________
Investment transactions
The aggregate cost of purchases of investment securities and proceeds from sales of investment securities (other than temporary cash investments) totaled $3,190,369 and $981,729, respectively, for the year ended December 31, 2015.
Class-specific expenses Class-specific trustee fees for the year ended December 31, 2015 were as follows: Class R1 $ 5,649 Class R2 2,844 Class R3 1,475 Class R4 4,032 Class R5 4,980 Class R6 1,381 Class R7 164 Class R8 783 $ 21,308
148

THE COLLECTIVE INVESTMENT FUNDS OF FIRST MERCANTILE TRUST COMPANY
FMT/Vanguard Target Retirement 2050 Fund Schedule of Participant Transactions
December 31, 2015
The accompanying notes are an integral part of these financial statements.
Participant transactions by class for the year ended December 31, 2015 were as follows: Dollars Units Purchases Redemptions Net change Purchases Redemptions Net change Class R1 $ 1,005,164 $ (529,181) $ 475,983 75,361 (38,581) 36,780 Class R2 1,459,741 (162,242) 1,297,499 126,223 (13,015) 113,208 Class R3 316,339 (111,275) 205,064 26,377 (9,359) 17,018 Class R4 116,079 (279,752) (163,673) 7,939 (18,844) (10,905) Class R5 352,814 (29,763) 323,051 26,327 (2,240) 24,087 Class R6 51,580 (180,712) (129,132) 3,809 (13,134) (9,325) Class R7 38,453 — 38,453 3,641 — 3,641 Class R8 90,029 (15,606) 74,423 7,432 (1,347) 6,085 $ 3,430,199 $ (1,308,531) $ 2,121,668 277,109 (96,520) 180,589
149

THE COLLECTIVE INVESTMENT FUNDS OF FIRST MERCANTILE TRUST COMPANY
FMT/Vanguard Target Retirement 2050 Fund Financial Highlights December 31, 2015
The accompanying notes are an integral part of these financial statements.
Change in Net Asset Value Resulting from Operations Ratios (to average net
assets)
NAV per Unit, Beginning of
Period
Net Investment
Income (Loss)(a)
Net Realized and Unrealized
Gain (Loss) from
Investments(a)
Total from Investment Activities
NAV per Unit, End of
Period Total
Return Expenses
Net Investment
Income (Loss)
Class R1 $ 13.7184 $ 0.3133 $ (0.5851) $ (0.2718) $ 13.4466 (1.98) % (0.42) % 2.27 % Class R2 12.1195 0.7343 (1.0006) (0.2663) 11.8532 (2.20) % (0.63) % 6.15 % Class R3 12.0984 0.2325 (0.5186) (0.2861) 11.8123 (2.36) % (0.81) % 1.91 % Class R4 14.4966 0.1499 (0.5168) (0.3669) 14.1297 (2.53) % (0.98) % 1.03 % Class R5 13.1401 0.2305 (0.5849) (0.3544) 12.7857 (2.70) % (1.15) % 1.75 % Class R6 13.3283 0.0156 (0.3969) (0.3813) 12.9470 (2.86) % (1.32) % 0.12 % Class R7 10.6586 0.6856 (1.0087) (0.3231) 10.3355 (3.03) % (1.48) % 6.52 % Class R8 11.9470 0.3173 (0.6988) (0.3815) 11.5655 (3.19) % (1.65) % 2.69 % (a) Per unit amounts are based on average daily units outstanding.
150
FMT/Vanguard Target Retirement 2055 Fund

THE COLLECTIVE INVESTMENT FUNDS OF FIRST MERCANTILE TRUST COMPANY
FMT/Vanguard Target Retirement 2055 Fund Statement of Assets and Liabilities
December 31, 2015
The accompanying notes are an integral part of these financial statements.
Assets Investments in securities, at fair value $ 3,685,705 Liabilities Trustee fees 1,315
Net assets $ 3,684,390
Components of net assets
Units of
Participation NAV
per Unit Net
Assets Class R1 232,467 $ 14.1887 $ 3,298,404
Class R3 2,093 $ 10.6939 22,388
Class R4 9,510 $ 13.1983 125,512
Class R5 9,476 $ 12.0390 114,077
Class R6 10,057 $ 12.2447 123,139
Class R7 89 $ 9.7912 870
$ 3,684,390
151

THE COLLECTIVE INVESTMENT FUNDS OF FIRST MERCANTILE TRUST COMPANY
FMT/Vanguard Target Retirement 2055 Fund Statement of Operations
For the Year Ended December 31, 2015
The accompanying notes are an integral part of these financial statements.
Investment income
Dividends $ 71,272
Expenses
Trustee fees 13,274
Audit fees 1,200
Custody fees 1,032
15,506
Net investment income 55,766
Net realized gain from investments sold
Proceeds from sales of investments 974,443
Cost of investments sold 906,767
Net realized gain from investments sold 67,676
Change in net unrealized appreciation (depreciation) on investments (261,678)
Net realized and unrealized loss on investments (194,002)
Net decrease in net assets resulting from operations $ (138,236)
152

THE COLLECTIVE INVESTMENT FUNDS OF FIRST MERCANTILE TRUST COMPANY
FMT/Vanguard Target Retirement 2055 Fund Statement of Changes in Net Assets
For the Year Ended December 31, 2015
The accompanying notes are an integral part of these financial statements.
Operations
Net investment income $ 55,766
Net realized gain from investments sold 67,676
Change in net unrealized appreciation (depreciation) on investments (261,678)
Net decrease in net assets resulting from operations (138,236)
Participant transactions
Proceeds from units purchased 2,506,419
Less payments for units redeemed 1,176,339
Increase in net assets from participant transactions 1,330,080
Total increase in net assets 1,191,844
Net assets at beginning of year 2,492,546
Net assets at end of year $ 3,684,390
153

THE COLLECTIVE INVESTMENT FUNDS OF FIRST MERCANTILE TRUST COMPANY FMT/Vanguard Target Retirement 2055 Fund
Schedule of Investments and Specific Fund Disclosures December 31, 2015
The accompanying notes are an integral part of these financial statements.
Investments Shares Fair Value ____________ ____________
Mutual fund (100.0%)
Vanguard Target Retirement 2055 Fund (Cost $3,680,094) 119,549 $ 3,685,705 __________ __________
Specific Fund Disclosures
Fair value
The inputs or methodology used for valuing securities may not be indicative of the risks associated with investing in those securities. For more information on valuation inputs, and their aggregation into the levels used in the table below, please refer to note 4 to the financial statements. The following table sets forth by level, within the fair value hierarchy, the Fund's investments measured at fair value.
Total Level 1 Level 2 Level 3
Mutual fund - 2055 Target Retirement Date $ 3,685,705 $ 3,685,705 $ — $ — __________ __________ __________ _________ __________ __________ __________ _________
Investment transactions
The aggregate cost of purchases of investment securities and proceeds from sales of investment securities (other than temporary cash investments) totaled $2,360,637 and $974,443, respectively, for the year ended December 31, 2015.
Class-specific expenses Class-specific trustee fees for the year ended December 31, 2015 were as follows: Class R1 $ 9,900 Class R2 87 Class R3 124 Class R4 1,201 Class R5 925 Class R6 1,037 $ 13,274
154
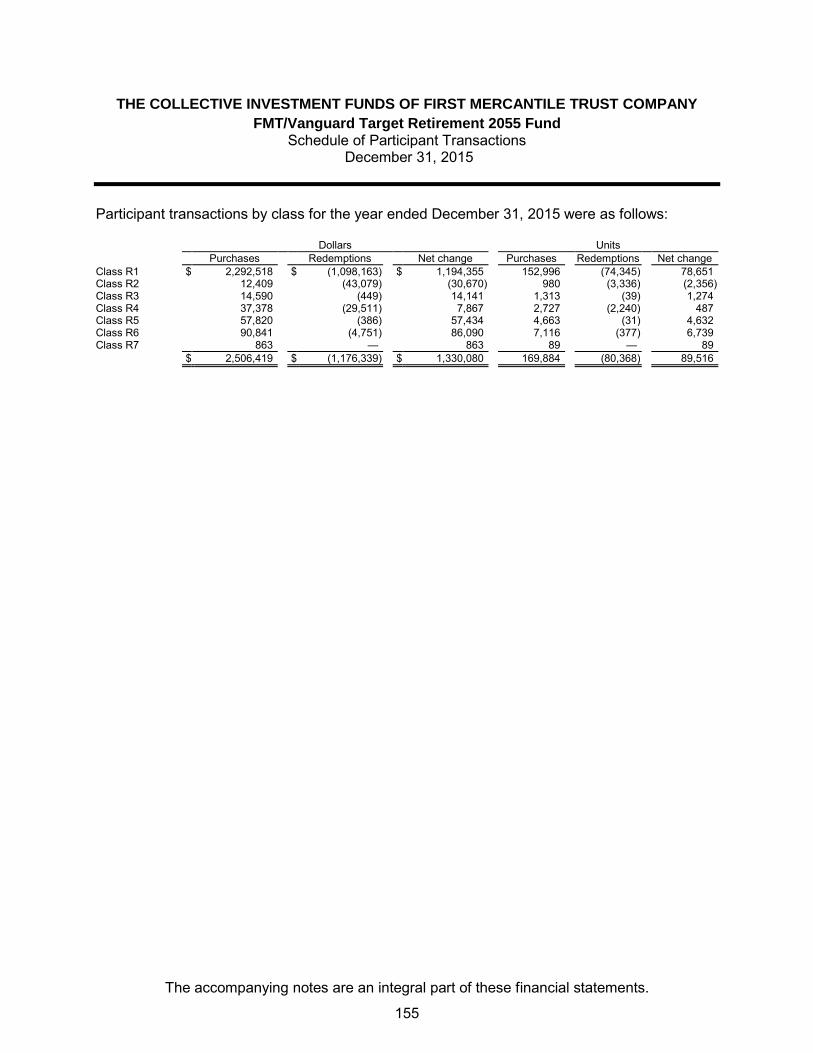
THE COLLECTIVE INVESTMENT FUNDS OF FIRST MERCANTILE TRUST COMPANY
FMT/Vanguard Target Retirement 2055 Fund Schedule of Participant Transactions
December 31, 2015
The accompanying notes are an integral part of these financial statements.
Participant transactions by class for the year ended December 31, 2015 were as follows: Dollars Units Purchases Redemptions Net change Purchases Redemptions Net change Class R1 $ 2,292,518 $ (1,098,163) $ 1,194,355 152,996 (74,345) 78,651 Class R2 12,409 (43,079) (30,670) 980 (3,336) (2,356) Class R3 14,590 (449) 14,141 1,313 (39) 1,274 Class R4 37,378 (29,511) 7,867 2,727 (2,240) 487 Class R5 57,820 (386) 57,434 4,663 (31) 4,632 Class R6 90,841 (4,751) 86,090 7,116 (377) 6,739 Class R7 863 — 863 89 — 89 $ 2,506,419 $ (1,176,339) $ 1,330,080 169,884 (80,368) 89,516
155
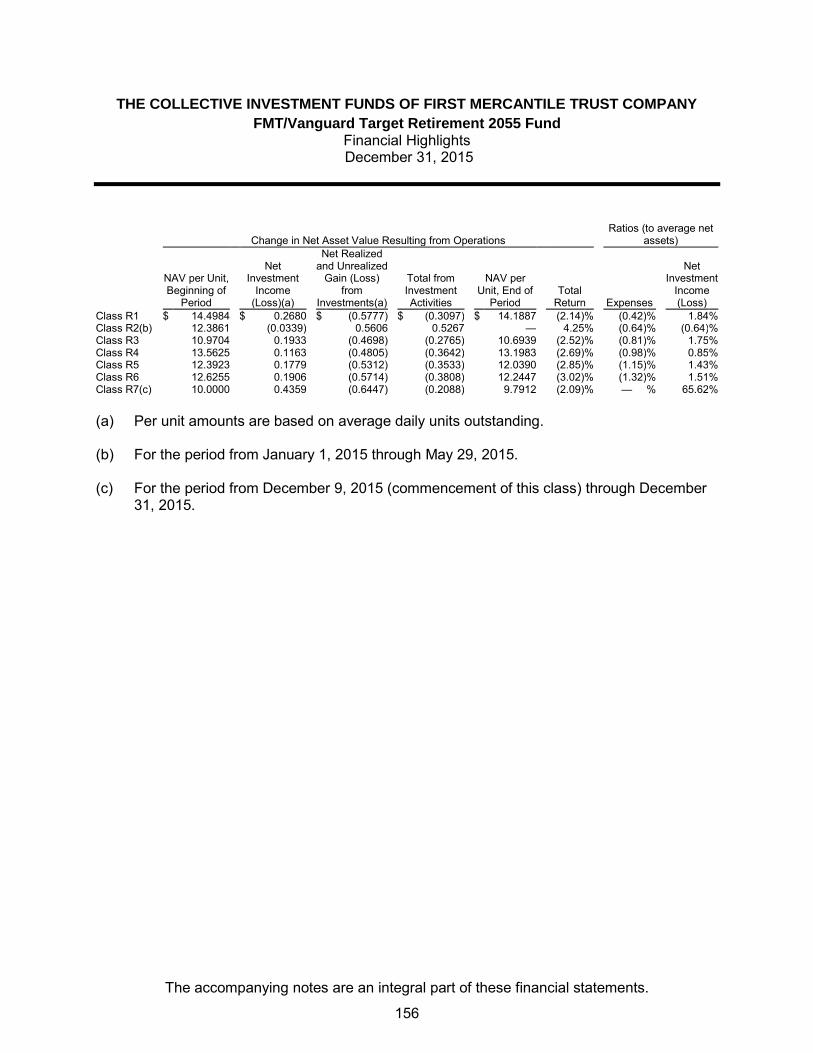
THE COLLECTIVE INVESTMENT FUNDS OF FIRST MERCANTILE TRUST COMPANY
FMT/Vanguard Target Retirement 2055 Fund Financial Highlights December 31, 2015
The accompanying notes are an integral part of these financial statements.
Change in Net Asset Value Resulting from Operations Ratios (to average net
assets)
NAV per Unit, Beginning of
Period
Net Investment
Income (Loss)(a)
Net Realized and Unrealized
Gain (Loss) from
Investments(a)
Total from Investment Activities
NAV per Unit, End of
Period Total
Return Expenses
Net Investment
Income (Loss)
Class R1 $ 14.4984 $ 0.2680 $ (0.5777) $ (0.3097) $ 14.1887 (2.14) % (0.42) % 1.84 % Class R2(b) 12.3861 (0.0339) 0.5606 0.5267 — 4.25 % (0.64) % (0.64) % Class R3 10.9704 0.1933 (0.4698) (0.2765) 10.6939 (2.52) % (0.81) % 1.75 % Class R4 13.5625 0.1163 (0.4805) (0.3642) 13.1983 (2.69) % (0.98) % 0.85 % Class R5 12.3923 0.1779 (0.5312) (0.3533) 12.0390 (2.85) % (1.15) % 1.43 % Class R6 12.6255 0.1906 (0.5714) (0.3808) 12.2447 (3.02) % (1.32) % 1.51 % Class R7(c) 10.0000 0.4359 (0.6447) (0.2088) 9.7912 (2.09) % — % 65.62 % (a) Per unit amounts are based on average daily units outstanding.
(b) For the period from January 1, 2015 through May 29, 2015.
(c) For the period from December 9, 2015 (commencement of this class) through December
31, 2015.
156

FMT/Vanguard Target Retirement 2060 Fund

THE COLLECTIVE INVESTMENT FUNDS OF FIRST MERCANTILE TRUST COMPANY
FMT/Vanguard Target Retirement 2060 Fund Statement of Assets and Liabilities
December 31, 2015
The accompanying notes are an integral part of these financial statements.
Assets Investments in securities, at fair value $ 362,115 Liabilities Trustee fees 276
Net assets $ 361,839
Components of net assets
Units of
Participation NAV
per Unit Net
Assets Class R1 11,551 $ 11.0500 $ 127,644
Class R3 1,959 $ 9.7020 19,004
Class R4 798 $ 10.2441 8,176
Class R5 3,197 $ 9.7507 31,176
Class R6 13,660 $ 10.1974 139,294
Class R7 792 $ 10.1856 8,071
Class R8 3,056 $ 9.3174 28,474
$ 361,839
157
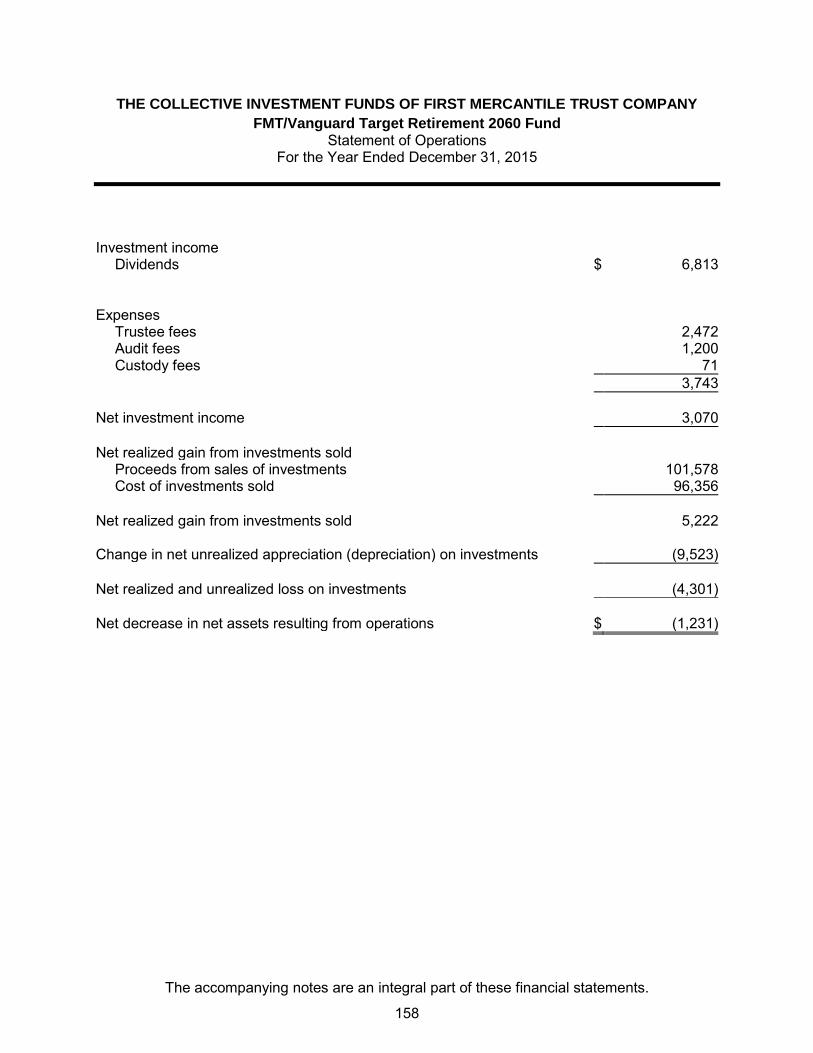
THE COLLECTIVE INVESTMENT FUNDS OF FIRST MERCANTILE TRUST COMPANY
FMT/Vanguard Target Retirement 2060 Fund Statement of Operations
For the Year Ended December 31, 2015
The accompanying notes are an integral part of these financial statements.
Investment income
Dividends $ 6,813
Expenses
Trustee fees 2,472
Audit fees 1,200
Custody fees 71
3,743
Net investment income 3,070
Net realized gain from investments sold
Proceeds from sales of investments 101,578
Cost of investments sold 96,356
Net realized gain from investments sold 5,222
Change in net unrealized appreciation (depreciation) on investments (9,523)
Net realized and unrealized loss on investments (4,301)
Net decrease in net assets resulting from operations $ (1,231)
158

THE COLLECTIVE INVESTMENT FUNDS OF FIRST MERCANTILE TRUST COMPANY
FMT/Vanguard Target Retirement 2060 Fund Statement of Changes in Net Assets
For the Year Ended December 31, 2015
The accompanying notes are an integral part of these financial statements.
Operations
Net investment income $ 3,070
Net realized gain from investments sold 5,222
Change in net unrealized appreciation (depreciation) on investments (9,523)
Net decrease in net assets resulting from operations (1,231)
Participant transactions
Proceeds from units purchased 288,185
Less payments for units redeemed 106,965
Increase in net assets from participant transactions 181,220
Total increase in net assets 179,989
Net assets at beginning of year 181,850
Net assets at end of year $ 361,839
159

THE COLLECTIVE INVESTMENT FUNDS OF FIRST MERCANTILE TRUST COMPANY FMT/Vanguard Target Retirement 2060 Fund
Schedule of Investments and Specific Fund Disclosures December 31, 2015
The accompanying notes are an integral part of these financial statements.
Investments Shares Fair Value ____________ ____________
Mutual fund (100.1%) Vanguard Target Retirement 2060 Fund (Cost $364,046) 13,308 $ 362,115 __________ __________
Specific Fund Disclosures
Fair value
The inputs or methodology used for valuing securities may not be indicative of the risks associated with investing in those securities. For more information on valuation inputs, and their aggregation into the levels used in the table below, please refer to note 4 to the financial statements. The following table sets forth by level, within the fair value hierarchy, the Fund's investments measured at fair value.
Total Level 1 Level 2 Level 3
Mutual fund - 2060 Target Retirement Date $ 362,115 $ 362,115 $ — $ — __________ __________ __________ _________ __________ __________ __________ _________
Investment transactions
The aggregate cost of purchases of investment securities and proceeds from sales of investment securities (other than temporary cash investments) totaled $285,978 and $101,578, respectively, for the year ended December 31, 2015.
Class-specific expenses Class-specific trustee fees for the year ended December 31, 2015 were as follows: Class R1 $ 143 Class R2 69 Class R3 55 Class R4 105 Class R5 272 Class R6 1,578 Class R7 68 Class R8 182 $ 2,472
160

THE COLLECTIVE INVESTMENT FUNDS OF FIRST MERCANTILE TRUST COMPANY
FMT/Vanguard Target Retirement 2060 Fund Schedule of Participant Transactions
December 31, 2015
The accompanying notes are an integral part of these financial statements.
Participant transactions by class for the year ended December 31, 2015 were as follows: Dollars Units Purchases Redemptions Net change Purchases Redemptions Net change Class R1 $ 124,641 $ (7,623) $ 117,018 11,565 (669) 10,896 Class R2 8,786 (34,080) (25,294) 711 (2,709) (1,998) Class R3 29,591 (11,551) 18,040 3,093 (1,160) 1,933 Class R4 12,667 (13,477) (810) 1,192 (1,291) (99) Class R5 32,028 (13,655) 18,373 3,175 (1,358) 1,817 Class R6 44,135 (24,231) 19,904 4,286 (2,256) 2,030 Class R7 5,704 — 5,704 543 — 543 Class R8 30,633 (2,348) 28,285 3,176 (231) 2,945 $ 288,185 $ (106,965) $ 181,220 27,741 (9,674) 18,067
161

THE COLLECTIVE INVESTMENT FUNDS OF FIRST MERCANTILE TRUST COMPANY
FMT/Vanguard Target Retirement 2060 Fund Financial Highlights December 31, 2015
The accompanying notes are an integral part of these financial statements.
Change in Net Asset Value Resulting from Operations Ratios (to average net
assets)
NAV per Unit, Beginning of
Period
Net Investment
Income (Loss)(a)
Net Realized and Unrealized
Gain (Loss) from
Investments(a)
Total from Investment Activities
NAV per Unit, End of
Period Total
Return Expenses
Net Investment
Income (Loss)
Class R1 $ 11.3431 $ 0.5777 $ (0.8708) $ (0.2931) $ 11.0500 (2.58) % (0.79) % 5.14 % Class R2(b) 12.0941 (0.0606) 0.5459 0.4853 — 4.01 % (1.19) % (1.18) % Class R3 9.9970 0.3568 (0.6518) (0.2950) 9.7020 (2.95) % (1.20) % 3.60 % Class R4 10.5753 (0.0297) (0.3015) (0.3312) 10.2441 (3.13) % (1.49) % (0.28) % Class R5 10.0829 0.0707 (0.4029) (0.3322) 9.7507 (3.29) % (1.63) % 0.70 % Class R6 10.5631 0.0296 (0.3953) (0.3657) 10.1974 (3.46) % (1.80) % 0.28 % Class R7 10.5689 0.1291 (0.5124) (0.3833) 10.1856 (3.63) % (1.95) % 1.23 % Class R8 (c) 9.9571 0.0077 0.2748 0.2825 10.2396 2.84 % (0.07) % 0.08 % Class R8(d) 10.0000 0.2331 (0.9157) (0.6826) 9.3174 (6.83) % (2.00) % 2.55 % (a) Per unit amounts are based on average daily units outstanding.
(b) For the period from January 1, 2015 through May 29, 2015.
(c) For the period from January 1, 2015 through April 7, 2015.
(d) For the period from April 20, 2015 (recommencement of this class) through December 31,
2015.
162
FMT/Vanguard Target Retirement Income Fund

THE COLLECTIVE INVESTMENT FUNDS OF FIRST MERCANTILE TRUST COMPANY
FMT/Vanguard Target Retirement Income Fund Statement of Assets and Liabilities
December 31, 2015
The accompanying notes are an integral part of these financial statements.
Assets Investments in securities, at fair value $ 9,191,244 Liabilities Trustee fees 3,817
Net assets $ 9,187,427
Components of net assets
Units of
Participation NAV
per Unit Net
Assets Class R1 545,074 $ 11.4960 $ 6,266,176
Class R2 112,750 $ 11.5471 1,301,934
Class R3 56,552 $ 10.5746 598,016
Class R4 15,055 $ 11.0030 165,646
Class R5 62,210 $ 11.1197 691,754
Class R6 15,012 $ 10.8655 163,111
Class R7 76 $ 10.4253 790
$ 9,187,427
163

THE COLLECTIVE INVESTMENT FUNDS OF FIRST MERCANTILE TRUST COMPANY
FMT/Vanguard Target Retirement Income Fund Statement of Operations
For the Year Ended December 31, 2015
The accompanying notes are an integral part of these financial statements.
Investment income
Dividends $ 301,511
Expenses
Trustee fees 39,405
Custody fees 2,867
Audit fees 1,200
43,472
Net investment income 258,039
Net realized gain from investments sold
Proceeds from sales of investments 2,397,361
Cost of investments sold 2,330,461
Net realized gain from investments sold 66,900
Change in net unrealized appreciation (depreciation) on investments (339,622)
Net realized and unrealized loss on investments (272,722)
Net decrease in net assets resulting from operations $ (14,683)
164

THE COLLECTIVE INVESTMENT FUNDS OF FIRST MERCANTILE TRUST COMPANY
FMT/Vanguard Target Retirement Income Fund Statement of Changes in Net Assets
For the Year Ended December 31, 2015
The accompanying notes are an integral part of these financial statements.
Operations
Net investment income $ 258,039
Net realized gain from investments sold 66,900
Change in net unrealized appreciation (depreciation) on investments (339,622)
Net decrease in net assets resulting from operations (14,683)
Participant transactions
Proceeds from units purchased 3,440,870
Less payments for units redeemed 2,571,100
Increase in net assets from participant transactions 869,770
Total increase in net assets 855,087
Net assets at beginning of year 8,332,340
Net assets at end of year $ 9,187,427
165

THE COLLECTIVE INVESTMENT FUNDS OF FIRST MERCANTILE TRUST COMPANY FMT/Vanguard Target Retirement Income Fund
Schedule of Investments and Specific Fund Disclosures December 31, 2015
The accompanying notes are an integral part of these financial statements.
Investments Shares Fair Value ____________ ____________
Mutual fund (100.0%)
Vanguard Target Retirement Income Fund (Cost $9,349,601) 738,253 $ 9,191,244 __________ __________
Specific Fund Disclosures
Fair value
The inputs or methodology used for valuing securities may not be indicative of the risks associated with investing in those securities. For more information on valuation inputs, and their aggregation into the levels used in the table below, please refer to note 4 to the financial statements. The following table sets forth by level, within the fair value hierarchy, the Fund's investments measured at fair value.
Total Level 1 Level 2 Level 3
Mutual fund - Target Retirement Income $ 9,191,244 $ 9,191,244 $ — $ — __________ __________ __________ _________ __________ __________ __________ _________
Investment transactions
The aggregate cost of purchases of investment securities and proceeds from sales of investment securities (other than temporary cash investments) totaled $3,525,346 and $2,397,361, respectively, for the year ended December 31, 2015.
Class-specific expenses Class-specific trustee fees for the year ended December 31, 2015 were as follows: Class R1 $ 21,976 Class R2 3,219 Class R3 3,798 Class R4 1,538 Class R5 6,502 Class R6 2,362 Class R7 10 $ 39,405
166
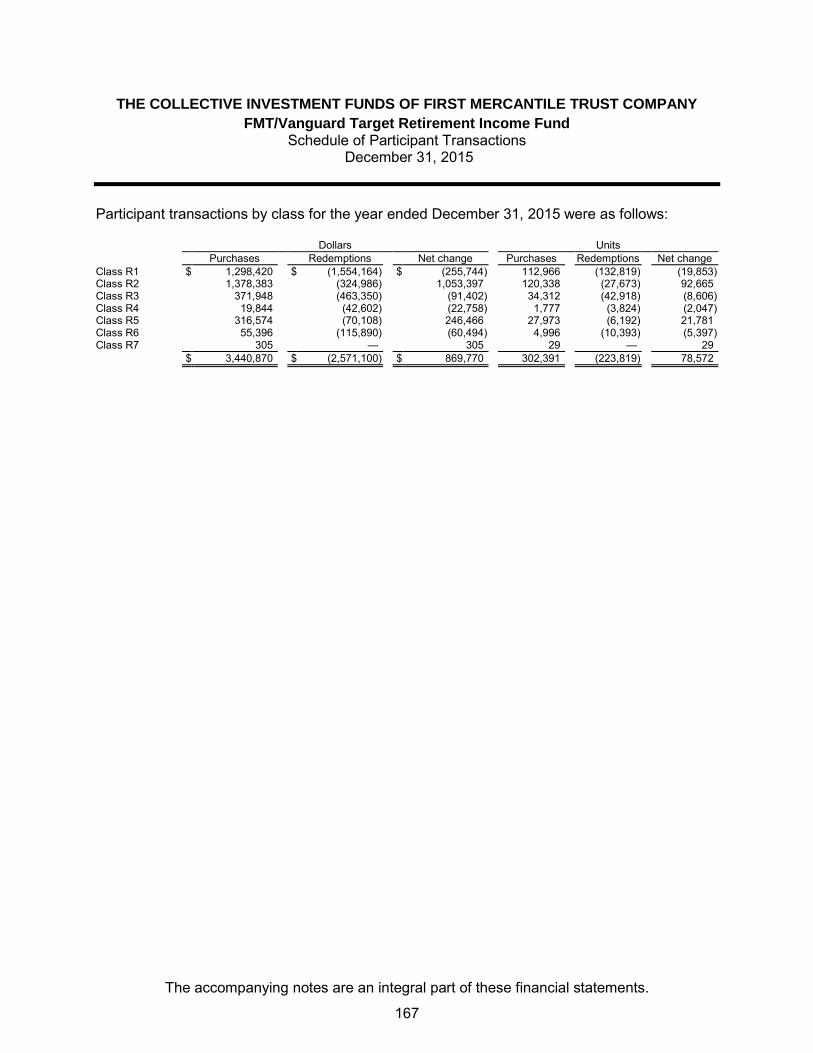
THE COLLECTIVE INVESTMENT FUNDS OF FIRST MERCANTILE TRUST COMPANY
FMT/Vanguard Target Retirement Income Fund Schedule of Participant Transactions
December 31, 2015
The accompanying notes are an integral part of these financial statements.
Participant transactions by class for the year ended December 31, 2015 were as follows: Dollars Units Purchases Redemptions Net change Purchases Redemptions Net change Class R1 $ 1,298,420 $ (1,554,164) $ (255,744) 112,966 (132,819) (19,853) Class R2 1,378,383 (324,986) 1,053,397 120,338 (27,673) 92,665 Class R3 371,948 (463,350) (91,402) 34,312 (42,918) (8,606) Class R4 19,844 (42,602) (22,758) 1,777 (3,824) (2,047) Class R5 316,574 (70,108) 246,466 27,973 (6,192) 21,781 Class R6 55,396 (115,890) (60,494) 4,996 (10,393) (5,397) Class R7 305 — 305 29 — 29 $ 3,440,870 $ (2,571,100) $ 869,770 302,391 (223,819) 78,572
167

THE COLLECTIVE INVESTMENT FUNDS OF FIRST MERCANTILE TRUST COMPANY
FMT/Vanguard Target Retirement Income Fund Financial Highlights December 31, 2015
The accompanying notes are an integral part of these financial statements.
Change in Net Asset Value Resulting from Operations Ratios (to average net
assets)
NAV per Unit, Beginning of
Period
Net Investment
Income (Loss)(a)
Net Realized and Unrealized
Gain (Loss) from
Investments(a)
Total from Investment Activities
NAV per Unit, End of
Period Total
Return Expenses
Net Investment
Income (Loss)
Class R1 $ 11.5619 $ 0.3502 $ (0.4161) $ (0.0659) $ 11.4960 (0.57) % (0.40) % 3.01 % Class R2 11.6387 0.6362 (0.7278) (0.0916) 11.5471 (0.79) % (0.62) % 5.47 % Class R3 10.6766 0.3173 (0.4193) (0.1020) 10.5746 (0.96) % (0.79) % 2.96 % Class R4 11.1282 0.2683 (0.3935) (0.1252) 11.0030 (1.13) % (0.96) % 2.40 % Class R5 11.2654 0.2919 (0.4376) (0.1457) 11.1197 (1.29) % (1.13) % 2.59 % Class R6 11.0266 0.2031 (0.3642) (0.1611) 10.8655 (1.46) % (1.30) % 1.83 % Class R7 10.5997 0.2424 (0.4168) (0.1744) 10.4253 (1.65) % (1.50) % 2.29 % (a) Per unit amounts are based on average daily units outstanding.
168
FMT/SSgA Prime Money Market Fund

THE COLLECTIVE INVESTMENT FUNDS OF FIRST MERCANTILE TRUST COMPANY
FMT/SSgA Prime Money Market Fund Statement of Assets and Liabilities
December 31, 2015
The accompanying notes are an integral part of these financial statements.
Assets Investments in securities, at fair value $ 3,775,665 Receivables
Interest 471
Total assets 3,776,136
Liabilities Trustee fees 1,990
Net assets $ 3,774,146
Components of net assets
Units of
Participation NAV
per Unit Net
Assets Class R1 126,080 $ 9.8748 $ 1,245,016
Class R2 17,720 $ 9.7653 173,043
Class R3 166,149 $ 9.7254 1,615,868
Class R4 24,539 $ 9.6276 236,249
Class R5 26,783 $ 9.5707 256,334
Class R6 19,838 $ 9.5039 188,536
Class R7 1,260 $ 9.4358 11,889
Class R8 5,032 $ 9.3818 47,211
$ 3,774,146
169

THE COLLECTIVE INVESTMENT FUNDS OF FIRST MERCANTILE TRUST COMPANY
FMT/SSgA Prime Money Market Fund Statement of Operations
For the Year Ended December 31, 2015
The accompanying notes are an integral part of these financial statements.
Investment income
Interest $ 2,192
Expenses
Trustee fees 28,354
Custody fees 5,527
Audit fees 1,200
35,081
Net investment loss $ (32,889)
170

THE COLLECTIVE INVESTMENT FUNDS OF FIRST MERCANTILE TRUST COMPANY
FMT/SSgA Prime Money Market Fund Statement of Changes in Net Assets
For the Year Ended December 31, 2015
The accompanying notes are an integral part of these financial statements.
Operations
Net investment loss $ (32,889)
Participant transactions
Proceeds from units purchased 4,654,336
Less payments for units redeemed 6,694,391
Decrease in net assets from participant transactions (2,040,055)
Total decrease in net assets (2,072,944)
Net assets at beginning of year 5,847,090
Net assets at end of year $ 3,774,146
171

THE COLLECTIVE INVESTMENT FUNDS OF FIRST MERCANTILE TRUST COMPANY FMT/SSgA Prime Money Market Fund
Schedule of Investments and Specific Fund Disclosures December 31, 2015
The accompanying notes are an integral part of these financial statements.
Investments
Principal Amount or
Shares Fair Value ____________ ____________
Mutual fund (100.0%) SSgA Prime Money Market Fund (Cost $3,775,665) 3,775,665 $ 3,775,665 __________ __________ Specific Fund Disclosures
Fair value
The inputs or methodology used for valuing securities may not be indicative of the risks associated with investing in those securities. For more information on valuation inputs, and their aggregation into the levels used in the table below, please refer to note 4 to the financial statements. The following table sets forth by level, within the fair value hierarchy, the Fund's investments measured at fair value.
Total Level 1 Level 2 Level 3
Money market fund $ 3,775,665 $ 3,775,665 $ — $ — __________ __________ __________ _________ __________ __________ __________ _________ Class-specific expenses Class-specific trustee fees for the year ended December 31, 2015 were as follows: Class R1 $ 5,625 Class R2 4,210 Class R3 8,133 Class R4 2,221 Class R5 4,319 Class R6 2,294 Class R7 779 Class R8 773 $ 28,354
172

THE COLLECTIVE INVESTMENT FUNDS OF FIRST MERCANTILE TRUST COMPANY
FMT/SSgA Prime Money Market Fund Schedule of Participant Transactions
December 31, 2015
The accompanying notes are an integral part of these financial statements.
Participant transactions by class for the year ended December 31, 2015 were as follows: Dollars Units Purchases Redemptions Net change Purchases Redemptions Net change Class R1 $ 751,495 $ (1,526,721) $ (775,226) 75,924 (154,244) (78,320) Class R2 197,206 (1,751,139) (1,553,933) 20,104 (178,578) (158,474) Class R3 3,252,168 (2,429,346) 822,822 333,319 (248,962) 84,357 Class R4 29,805 (54,444) (24,639) 3,082 (5,623) (2,541) Class R5 241,770 (627,308) (385,538) 25,129 (65,118) (39,989) Class R6 164,539 (122,620) 41,919 17,175 (12,815) 4,360 Class R7 3,535 (127,953) (124,418) 372 (13,427) (13,055) Class R8 13,818 (54,860) (41,042) 1,464 (5,766) (4,302) $ 4,654,336 $ (6,694,391) $ (2,040,055) 476,569 (684,533) (207,964)
173

THE COLLECTIVE INVESTMENT FUNDS OF FIRST MERCANTILE TRUST COMPANY
FMT/SSgA Prime Money Market Fund Financial Highlights December 31, 2015
The accompanying notes are an integral part of these financial statements.
Change in Net Asset Value Resulting from Operations Ratios (to average net
assets)
NAV per Unit, Beginning of
Period
Net Investment
Income (Loss)(a)
Net Realized and Unrealized
Gain (Loss) from
Investments(a)
Total from Investment Activities
NAV per Unit, End of
Period Total
Return Expenses
Net Investment
Income (Loss)
Class R1 $ 9.9192 $ (0.0444) $ — $ (0.0444) $ 9.8748 (0.45) % (0.50) % (0.45) % Class R2 9.8308 (0.0655) — (0.0655) 9.7653 (0.67) % (0.73) % (0.69) % Class R3 9.8073 (0.0819) — (0.0819) 9.7254 (0.84) % (0.89) % (0.83) % Class R4 9.7252 (0.0976) — (0.0976) 9.6276 (1.00) % (1.06) % (1.01) % Class R5 9.6842 (0.1135) — (0.1135) 9.5707 (1.17) % (1.24) % (1.19) % Class R6 9.6330 (0.1291) — (0.1291) 9.5039 (1.34) % (1.40) % (1.34) % Class R7 9.5806 (0.1448) — (0.1448) 9.4358 (1.51) % (1.59) % (1.54) % Class R8 9.5417 (0.1599) — (0.1599) 9.3818 (1.68) % (1.74) % (1.69) % (a) Per unit amounts are based on average daily units outstanding.
174

FMT/SSgA U.S. Treasury Money Market Fund
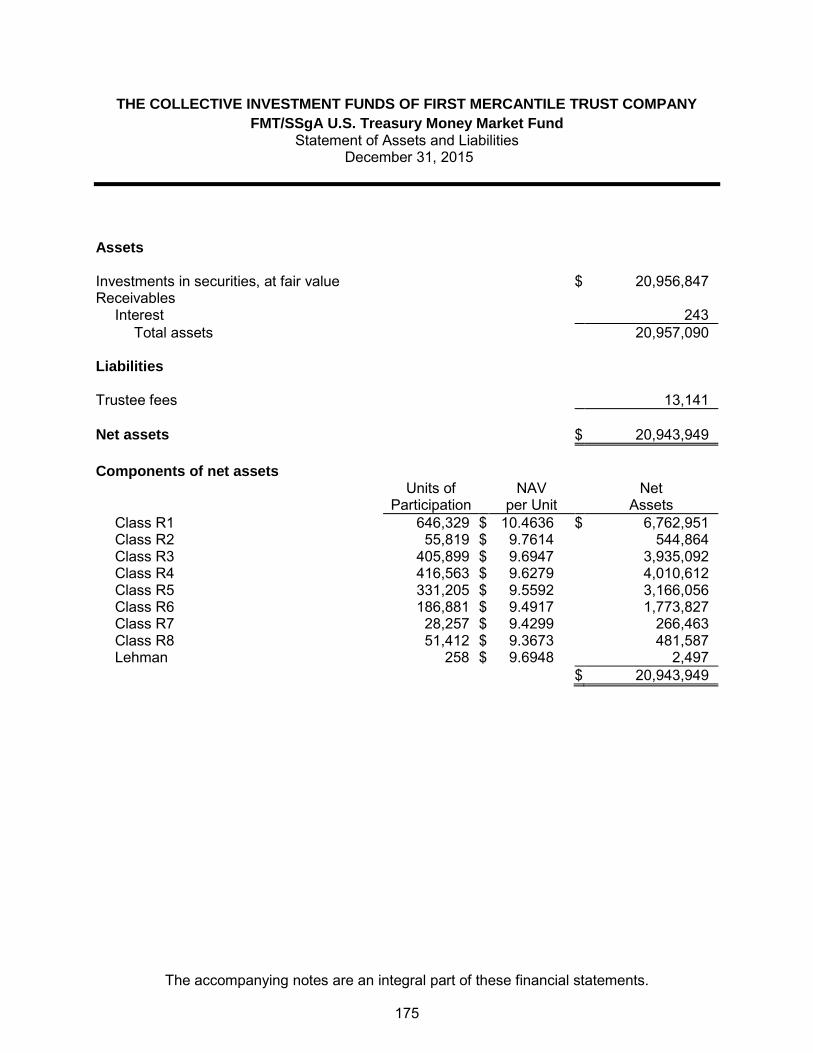
THE COLLECTIVE INVESTMENT FUNDS OF FIRST MERCANTILE TRUST COMPANY
FMT/SSgA U.S. Treasury Money Market Fund Statement of Assets and Liabilities
December 31, 2015
The accompanying notes are an integral part of these financial statements.
Assets Investments in securities, at fair value $ 20,956,847 Receivables
Interest 243
Total assets 20,957,090
Liabilities Trustee fees 13,141
Net assets $ 20,943,949
Components of net assets
Units of
Participation NAV
per Unit Net
Assets Class R1 646,329 $ 10.4636 $ 6,762,951
Class R2 55,819 $ 9.7614 544,864
Class R3 405,899 $ 9.6947 3,935,092
Class R4 416,563 $ 9.6279 4,010,612
Class R5 331,205 $ 9.5592 3,166,056
Class R6 186,881 $ 9.4917 1,773,827
Class R7 28,257 $ 9.4299 266,463
Class R8 51,412 $ 9.3673 481,587
Lehman 258 $ 9.6948 2,497
$ 20,943,949
175

THE COLLECTIVE INVESTMENT FUNDS OF FIRST MERCANTILE TRUST COMPANY
FMT/SSgA U.S. Treasury Money Market Fund Statement of Operations
For the Year Ended December 31, 2015
The accompanying notes are an integral part of these financial statements.
Investment income
Interest $ 1,366
Expenses
Trustee fees 170,123
Custody fees 6,403
Audit fees 1,200
177,726
Net investment loss $ (176,360)
176
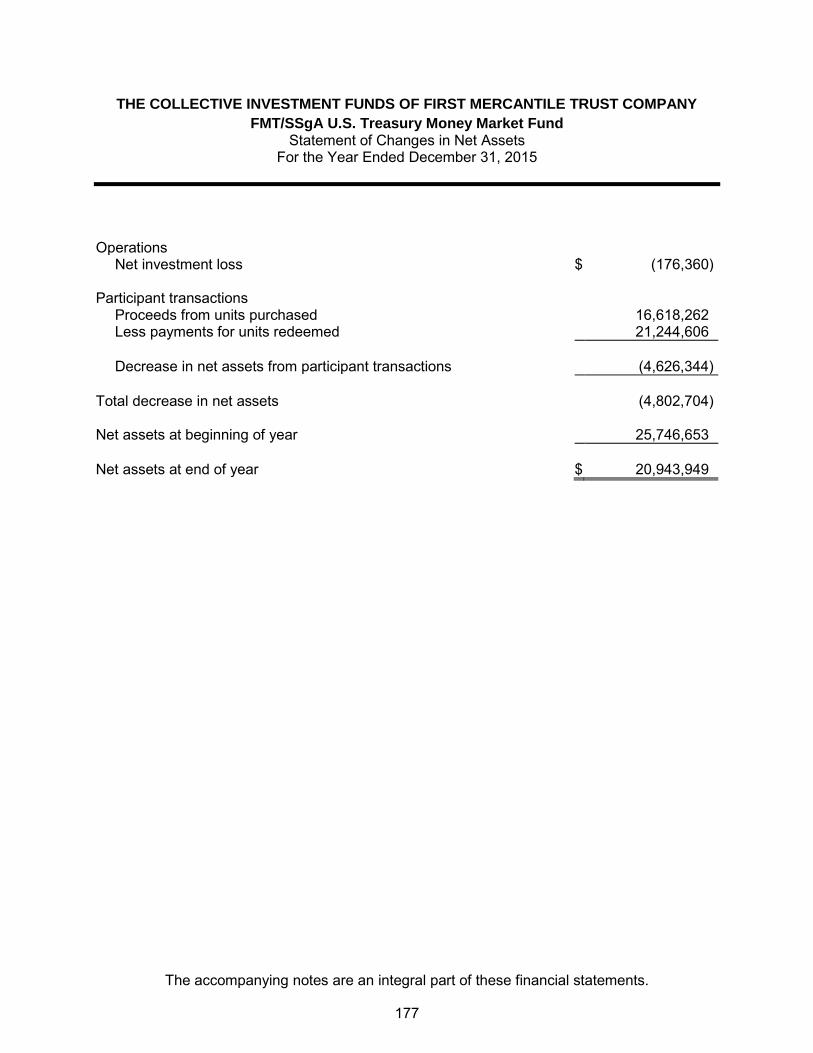
THE COLLECTIVE INVESTMENT FUNDS OF FIRST MERCANTILE TRUST COMPANY
FMT/SSgA U.S. Treasury Money Market Fund Statement of Changes in Net Assets
For the Year Ended December 31, 2015
The accompanying notes are an integral part of these financial statements.
Operations
Net investment loss $ (176,360)
Participant transactions
Proceeds from units purchased 16,618,262
Less payments for units redeemed 21,244,606
Decrease in net assets from participant transactions (4,626,344)
Total decrease in net assets (4,802,704)
Net assets at beginning of year 25,746,653
Net assets at end of year $ 20,943,949
177

THE COLLECTIVE INVESTMENT FUNDS OF FIRST MERCANTILE TRUST COMPANY FMT/SSgA U.S. Treasury Money Market Fund
Schedule of Investments and Specific Fund Disclosures December 31, 2015
The accompanying notes are an integral part of these financial statements.
Investments
Principal Amount or
Shares Fair Value ____________ ____________
Mutual fund (100.1%)
SSgA U.S. Treasury Money Market Fund (Cost $20,956,847) 20,956,847 $ 20,956,847
Specific Fund Disclosures
Fair value
The inputs or methodology used for valuing securities may not be indicative of the risks associated with investing in those securities. For more information on valuation inputs, and their aggregation into the levels used in the table below, please refer to note 4 to the financial statements. The following table sets forth by level, within the fair value hierarchy, the Fund's investments measured at fair value.
Total Level 1 Level 2 Level 3
Money market fund $ 20,956,847 $ 20,956,847 $ — $ — __________ __________ __________ _________ __________ __________ __________ _________ Class-specific expenses Class-specific trustee fees for the year ended December 31, 2015 were as follows: Class R1 $ 28,792 Class R2 4,973 Class R3 17,717 Class R4 44,993 Class R5 37,226 Class R6 19,204 Class R7 11,383 Class R8 5,820 Lehman 15 $ 170,123
178

THE COLLECTIVE INVESTMENT FUNDS OF FIRST MERCANTILE TRUST COMPANY
FMT/SSgA U.S. Treasury Money Market Fund Schedule of Participant Transactions
December 31, 2015
The accompanying notes are an integral part of these financial statements.
Participant transactions by class for the year ended December 31, 2015 were as follows: Dollars Units Purchases Redemptions Net change Purchases Redemptions Net change Class R1 $ 5,228,878 $ (8,986,566) $ (3,757,688) 498,740 (857,039) (358,299) Class R2 682,437 (1,229,698) (547,261) 69,682 (125,612) (55,930) Class R3 4,371,558 (2,819,714) 1,551,844 449,317 (289,241) 160,076 Class R4 3,348,308 (3,930,126) (581,818) 345,852 (406,606) (60,754) Class R5 997,839 (2,307,127) (1,309,288) 103,839 (239,601) (135,762) Class R6 995,148 (346,338) 648,810 104,025 (36,207) 67,818 Class R7 157,592 (1,039,549) (881,957) 16,598 (109,591) (92,993) Class R8 835,321 (585,444) 249,877 88,665 (62,214) 26,451 Lehman 1,181 (44) 1,137 121 (4) 117 $ 16,618,262 $ (21,244,606) $ (4,626,344) 1,676,839 (2,126,115) (449,276)
179

THE COLLECTIVE INVESTMENT FUNDS OF FIRST MERCANTILE TRUST COMPANY
FMT/SSgA U.S. Treasury Money Market Fund Financial Highlights December 31, 2015
The accompanying notes are an integral part of these financial statements.
Change in Net Asset Value Resulting from Operations Ratios (to average net
assets)
NAV per Unit, Beginning of
Period
Net Investment
Income (Loss)(a)
Net Realized and Unrealized
Gain (Loss) from
Investments(a)
Total from Investment Activities
NAV per Unit, End of
Period Total
Return Expenses
Net Investment
Income (Loss)
Class R1 $ 10.5032 $ (0.0396) $ — $ (0.0396) $ 10.4636 (0.38) % (0.38) % (0.38) % Class R2 9.8198 (0.0584) — (0.0584) 9.7614 (0.59) % (0.60) % (0.60) % Class R3 9.7694 (0.0747) — (0.0747) 9.6947 (0.76) % (0.77) % (0.76) % Class R4 9.7185 (0.0906) — (0.0906) 9.6279 (0.93) % (0.94) % (0.94) % Class R5 9.6656 (0.1064) — (0.1064) 9.5592 (1.10) % (1.11) % (1.11) % Class R6 9.6137 (0.1220) — (0.1220) 9.4917 (1.27) % (1.28) % (1.28) % Class R7 9.5674 (0.1375) — (0.1375) 9.4299 (1.44) % (1.45) % (1.45) % Class R8 9.5197 (0.1524) — (0.1524) 9.3673 (1.60) % (1.62) % (1.62) % Lehman 9.7707 (0.0759) — (0.0759) 9.6948 (0.78) % (0.78) % (0.82) % (a) Per unit amounts are based on average daily units outstanding.
180

FMT/FFTW Income Plus Fund

THE COLLECTIVE INVESTMENT FUNDS OF FIRST MERCANTILE TRUST COMPANY
FMT/FFTW Income Plus Fund Statement of Assets and Liabilities
December 31, 2015
The accompanying notes are an integral part of these financial statements.
Assets Investments in securities, at fair value (contract value $127,891,067) $ 128,444,114 Receivables
Dividends 94,848
Total assets 128,538,962
Liabilities Trustee fees 69,279
Sub-advisor fees 15,274
Total liabilities 84,553
Net assets Net assets reflecting investments at fair value 128,454,409
Adjustment from fair value to contract value (553,047)
Net assets (at contract value) $ 127,901,362
Components of net assets
Units of
Participation NAV
per Unit Net
Assets Class R1 4,901,334 $ 11.9962 $ 58,797,428
Class R2 2,495,030 $ 10.1511 25,327,267
Class R3 690,611 $ 10.0808 6,961,937
Class R4 1,461,073 $ 10.0113 14,627,301
Class R5 975,985 $ 9.9427 9,703,922
Class R6 772,741 $ 9.8738 7,629,908
Class R7 244,510 $ 9.8056 2,397,576
Class R8 252,203 $ 9.7383 2,456,023
$ 127,901,362
181
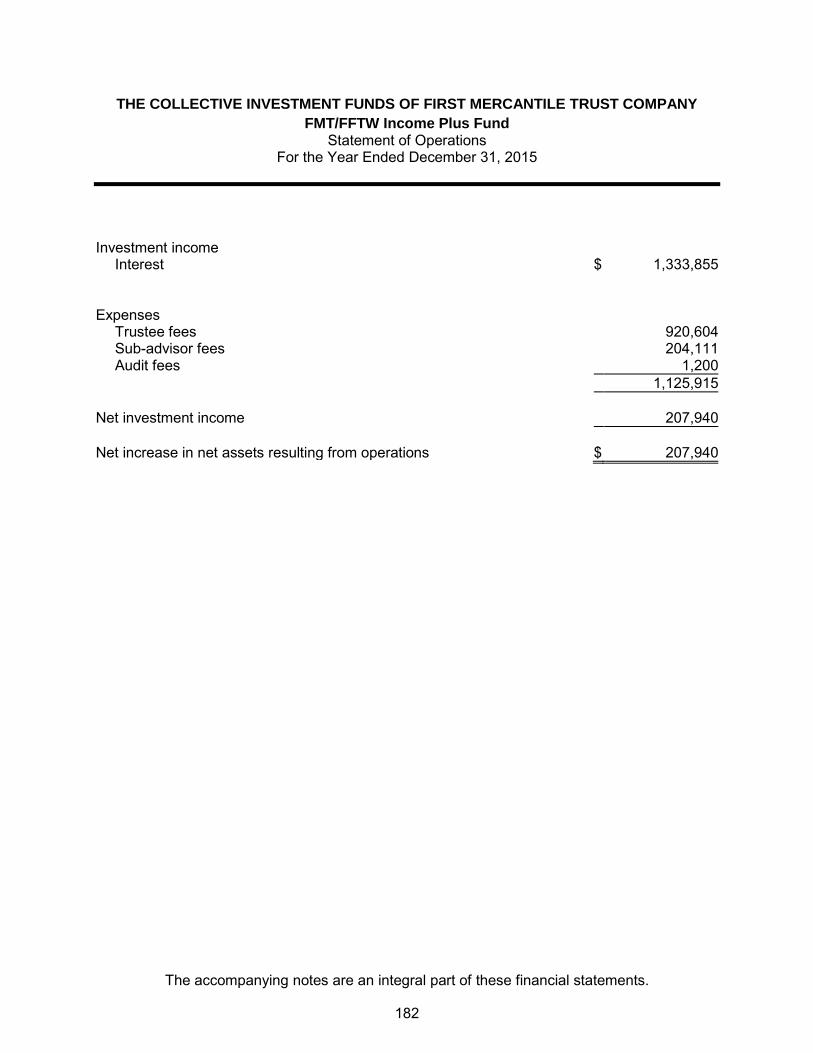
THE COLLECTIVE INVESTMENT FUNDS OF FIRST MERCANTILE TRUST COMPANY
FMT/FFTW Income Plus Fund Statement of Operations
For the Year Ended December 31, 2015
The accompanying notes are an integral part of these financial statements.
Investment income
Interest $ 1,333,855
Expenses
Trustee fees 920,604
Sub-advisor fees 204,111
Audit fees 1,200
1,125,915
Net investment income 207,940
Net increase in net assets resulting from operations $ 207,940
182

THE COLLECTIVE INVESTMENT FUNDS OF FIRST MERCANTILE TRUST COMPANY
FMT/FFTW Income Plus Fund Statement of Changes in Net Assets
For the Year Ended December 31, 2015
The accompanying notes are an integral part of these financial statements.
Operations
Net investment income $ 207,940
Participant transactions
Proceeds from units purchased 45,594,863
Less payments for units redeemed 90,938,660
Decrease in net assets from participant transactions (45,343,797)
Total decrease in net assets (45,135,857)
Net assets at beginning of year 173,037,219
Net assets at end of year $ 127,901,362
183

THE COLLECTIVE INVESTMENT FUNDS OF FIRST MERCANTILE TRUST COMPANY FMT/FFTW Income Plus Fund
Schedule of Investments and Specific Fund Disclosures December 31, 2015
The accompanying notes are an integral part of these financial statements.
Investments Units Fair
Value Contract
Value ____________ ____________ ____________
Collective trust fund (100.0%)
BNP Paribas Investment Partners Pooled Trust Fund for Employee Benefit Plans Income Plus Fund - Class B 127,891,067 $ 128,444,114 127,891,067 __________ __________ __________ __________
Specific Fund Disclosures
Fair value
The inputs or methodology used for valuing securities may not be indicative of the risks associated with investing in those securities. For more information on valuation inputs, and their aggregation into the levels used in the table below, please refer to note 4 to the financial statements. The following table sets forth by level, within the fair value hierarchy, the Fund's investments measured at fair value.
Total Level 1 Level 2 Level 3
Collective trust fund - Stable Value Fund $ 128,444,114 — $ 128,444,114 — __________ __________ __________ _________ __________ __________ __________ _________
The estimated fair value of the underlying collective trust fund is net asset value, exclusive of the adjustment to contract value. The use of net asset value as fair value is deemed appropriate as the collective trust fund does not have a finite life, no unfunded commitments relating to this type of investment, or no significant restrictions on redemptions.
Investment in fully benefit-responsive fund
The FMT/FFTW Income Plus Fund has invested all of its assets in an underlying investment in Class B units of The Income Plus Fund (the "IP Fund"). The IP Fund is a collective trust fund formed under the BNP Paribas Investment Partners Pooled Trust Fund for Employee Benefit Plans. The IP Fund is a fully benefit-responsive investment. The investment objective of the IP Fund is to preserve invested principal while providing a competitive current rate of return. The IP Fund will be invested and reinvested primarily in guaranteed investment contracts ("GICs"), money market funds, money market instruments, repurchase agreements, private placements, bank investment contracts, and synthetic GICs.
184
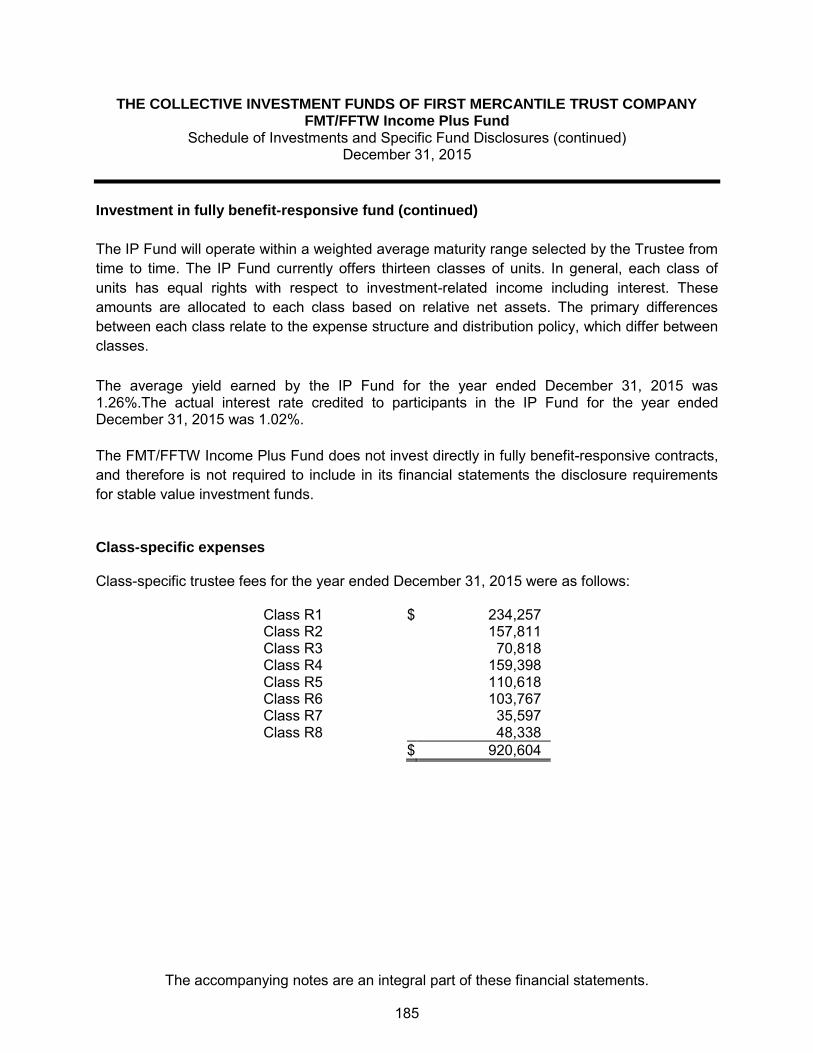
THE COLLECTIVE INVESTMENT FUNDS OF FIRST MERCANTILE TRUST COMPANY FMT/FFTW Income Plus Fund
Schedule of Investments and Specific Fund Disclosures (continued) December 31, 2015
The accompanying notes are an integral part of these financial statements.
Investment in fully benefit-responsive fund (continued)
The IP Fund will operate within a weighted average maturity range selected by the Trustee from time to time. The IP Fund currently offers thirteen classes of units. In general, each class of units has equal rights with respect to investment-related income including interest. These amounts are allocated to each class based on relative net assets. The primary differences between each class relate to the expense structure and distribution policy, which differ between classes.
The average yield earned by the IP Fund for the year ended December 31, 2015 was 1.26%.The actual interest rate credited to participants in the IP Fund for the year ended December 31, 2015 was 1.02%. The FMT/FFTW Income Plus Fund does not invest directly in fully benefit-responsive contracts, and therefore is not required to include in its financial statements the disclosure requirements for stable value investment funds.
Class-specific expenses Class-specific trustee fees for the year ended December 31, 2015 were as follows: Class R1 $ 234,257 Class R2 157,811 Class R3 70,818 Class R4 159,398 Class R5 110,618 Class R6 103,767 Class R7 35,597 Class R8 48,338 $ 920,604
185

THE COLLECTIVE INVESTMENT FUNDS OF FIRST MERCANTILE TRUST COMPANY
FMT/FFTW Income Plus Fund Schedule of Participant Transactions
December 31, 2015
The accompanying notes are an integral part of these financial statements.
Participant transactions by class for the year ended December 31, 2015 were as follows: Dollars Units Purchases Redemptions Net change Purchases Redemptions Net change Class R1 $ 22,866,668 $ (43,584,725) $ (20,718,057) 1,910,362 (3,641,781) (1,731,419) Class R2 8,451,108 (14,362,080) (5,910,972) 833,423 (1,416,428) (583,005) Class R3 3,560,335 (10,140,406) (6,580,071) 353,245 (1,006,099) (652,854) Class R4 4,777,123 (10,326,544) (5,549,421) 476,751 (1,030,688) (553,937) Class R5 3,272,705 (5,935,271) (2,662,566) 328,691 (595,837) (267,146) Class R6 1,671,818 (3,524,167) (1,852,349) 168,941 (355,969) (187,028) Class R7 595,892 (1,589,988) (994,096) 60,597 (161,394) (100,797) Class R8 399,214 (1,475,479) (1,076,265) 40,826 (150,919) (110,093) $ 45,594,863 $ (90,938,660) $ (45,343,797) 4,172,836 (8,359,115) (4,186,279)
186
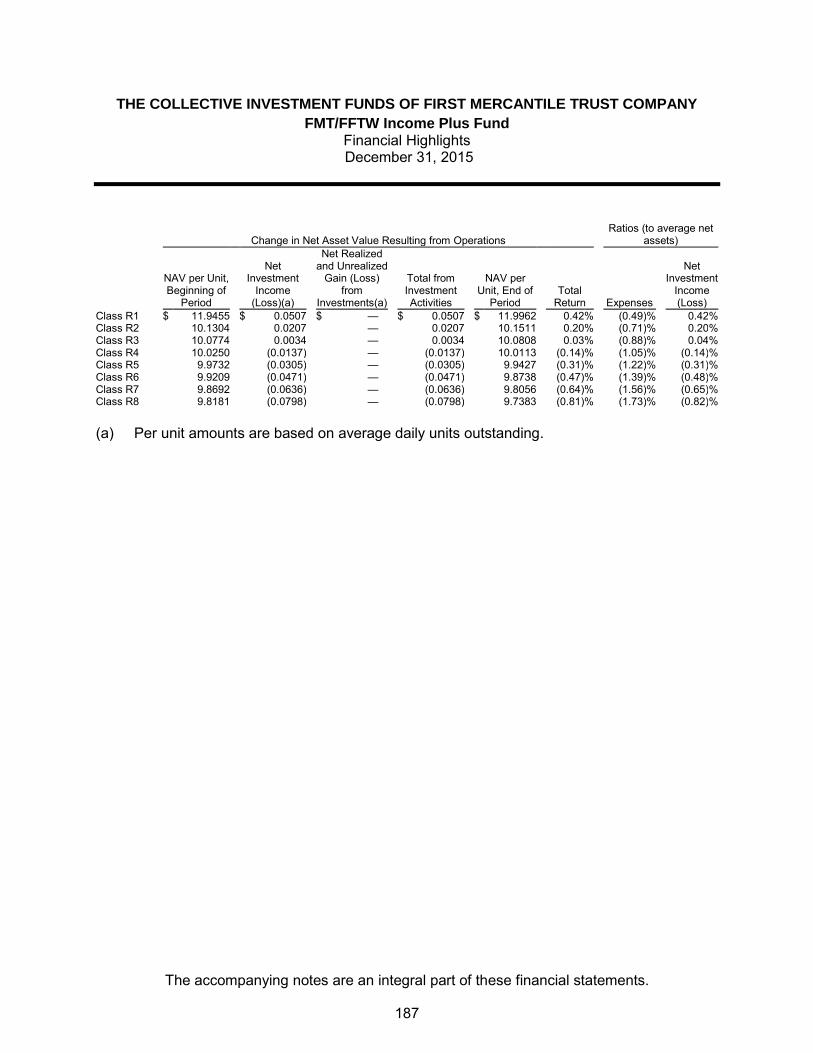
THE COLLECTIVE INVESTMENT FUNDS OF FIRST MERCANTILE TRUST COMPANY
FMT/FFTW Income Plus Fund Financial Highlights December 31, 2015
The accompanying notes are an integral part of these financial statements.
Change in Net Asset Value Resulting from Operations Ratios (to average net
assets)
NAV per Unit, Beginning of
Period
Net Investment
Income (Loss)(a)
Net Realized and Unrealized
Gain (Loss) from
Investments(a)
Total from Investment Activities
NAV per Unit, End of
Period Total
Return Expenses
Net Investment
Income (Loss)
Class R1 $ 11.9455 $ 0.0507 $ — $ 0.0507 $ 11.9962 0.42 % (0.49) % 0.42 % Class R2 10.1304 0.0207 — 0.0207 10.1511 0.20 % (0.71) % 0.20 % Class R3 10.0774 0.0034 — 0.0034 10.0808 0.03 % (0.88) % 0.04 % Class R4 10.0250 (0.0137) — (0.0137) 10.0113 (0.14) % (1.05) % (0.14) % Class R5 9.9732 (0.0305) — (0.0305) 9.9427 (0.31) % (1.22) % (0.31) % Class R6 9.9209 (0.0471) — (0.0471) 9.8738 (0.47) % (1.39) % (0.48) % Class R7 9.8692 (0.0636) — (0.0636) 9.8056 (0.64) % (1.56) % (0.65) % Class R8 9.8181 (0.0798) — (0.0798) 9.7383 (0.81) % (1.73) % (0.82) % (a) Per unit amounts are based on average daily units outstanding.
187

FMT/Wells Fargo Stable Value Fund
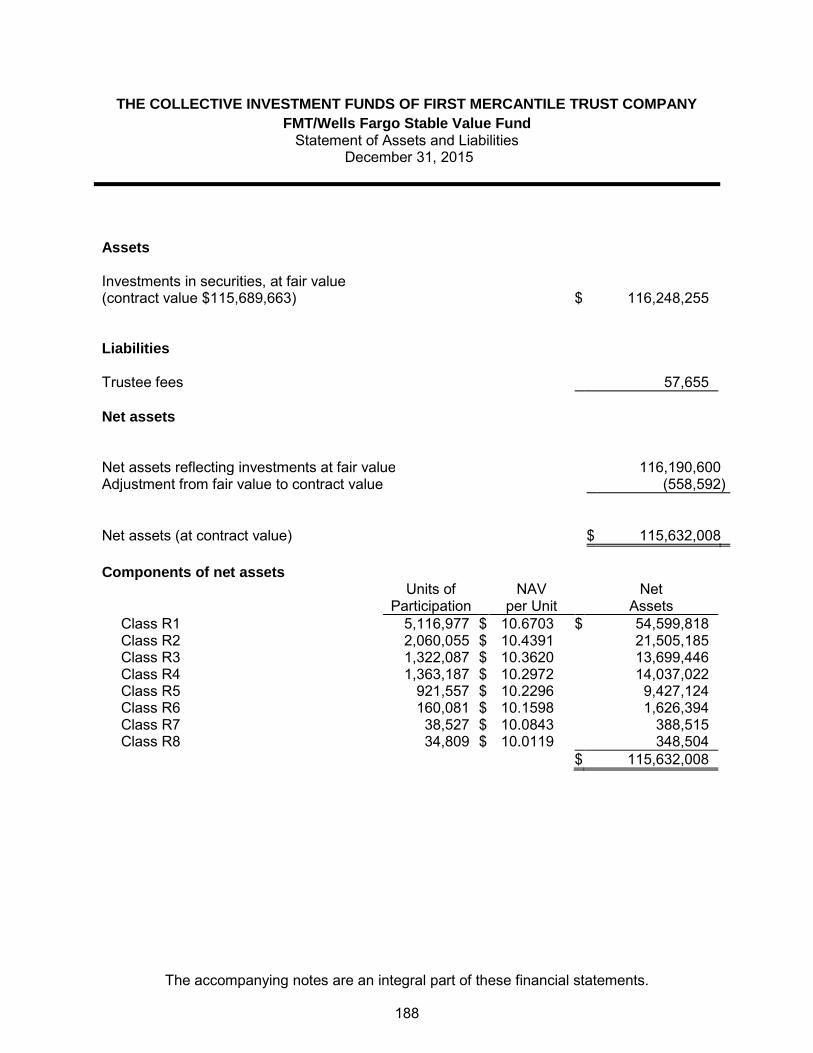
THE COLLECTIVE INVESTMENT FUNDS OF FIRST MERCANTILE TRUST COMPANY
FMT/Wells Fargo Stable Value Fund Statement of Assets and Liabilities
December 31, 2015
The accompanying notes are an integral part of these financial statements.
Assets Investments in securities, at fair value (contract value $115,689,663) $ 116,248,255 Liabilities Trustee fees 57,655
Net assets
Net assets reflecting investments at fair value 116,190,600
Adjustment from fair value to contract value (558,592)
Net assets (at contract value) $ 115,632,008
Components of net assets
Units of
Participation NAV
per Unit Net
Assets Class R1 5,116,977 $ 10.6703 $ 54,599,818
Class R2 2,060,055 $ 10.4391 21,505,185
Class R3 1,322,087 $ 10.3620 13,699,446
Class R4 1,363,187 $ 10.2972 14,037,022
Class R5 921,557 $ 10.2296 9,427,124
Class R6 160,081 $ 10.1598 1,626,394
Class R7 38,527 $ 10.0843 388,515
Class R8 34,809 $ 10.0119 348,504
$ 115,632,008
188

THE COLLECTIVE INVESTMENT FUNDS OF FIRST MERCANTILE TRUST COMPANY
FMT/Wells Fargo Stable Value Fund Statement of Operations
For the Year Ended December 31, 2015
The accompanying notes are an integral part of these financial statements.
Expenses
Trustee fees $ 673,794
Custody fees 38,327
Audit fees 1,200
713,321
Net investment loss (713,321)
Net realized gain from investments sold
Proceeds from sales of investments 24,696,765
Cost of investments sold 24,050,971
Net realized gain from investments sold 645,794
Change in net unrealized appreciation (depreciation) on investments 1,140,318
Net realized and unrealized gain on investments 1,786,112
Net increase in net assets resulting from operations $ 1,072,791
189
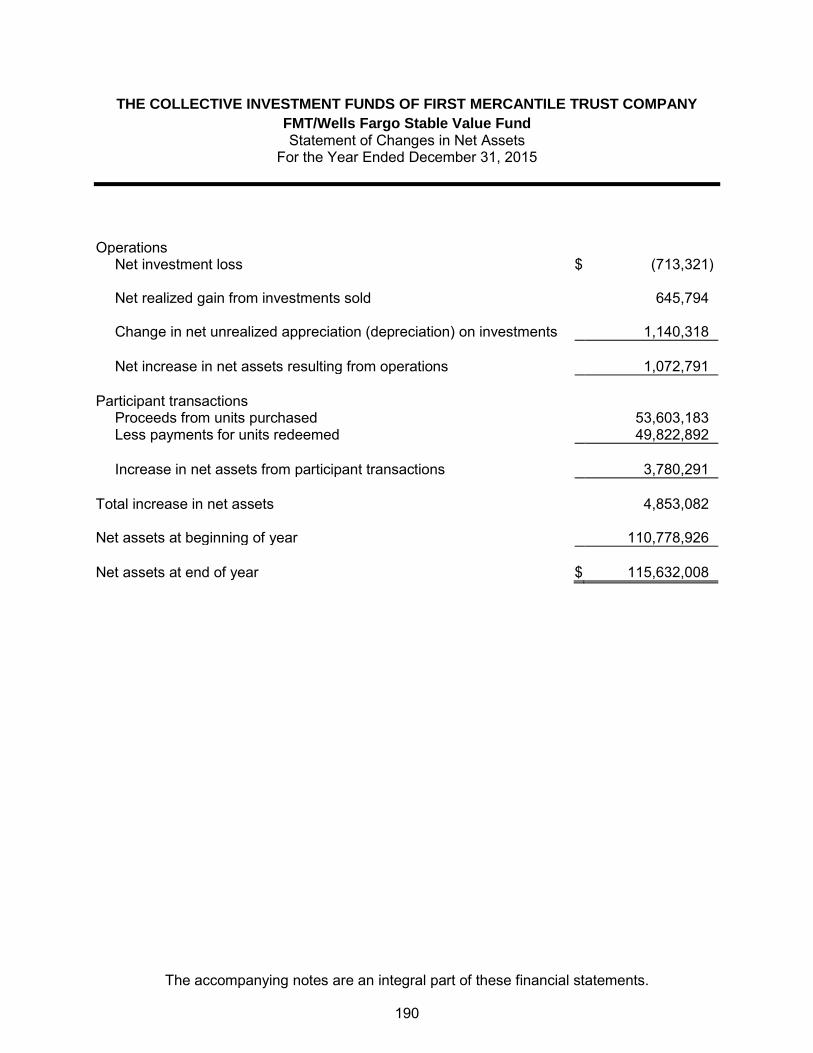
THE COLLECTIVE INVESTMENT FUNDS OF FIRST MERCANTILE TRUST COMPANY
FMT/Wells Fargo Stable Value Fund Statement of Changes in Net Assets
For the Year Ended December 31, 2015
The accompanying notes are an integral part of these financial statements.
Operations
Net investment loss $ (713,321)
Net realized gain from investments sold 645,794
Change in net unrealized appreciation (depreciation) on investments 1,140,318
Net increase in net assets resulting from operations 1,072,791
Participant transactions
Proceeds from units purchased 53,603,183
Less payments for units redeemed 49,822,892
Increase in net assets from participant transactions 3,780,291
Total increase in net assets 4,853,082
Net assets at beginning of year 110,778,926
Net assets at end of year $ 115,632,008
190
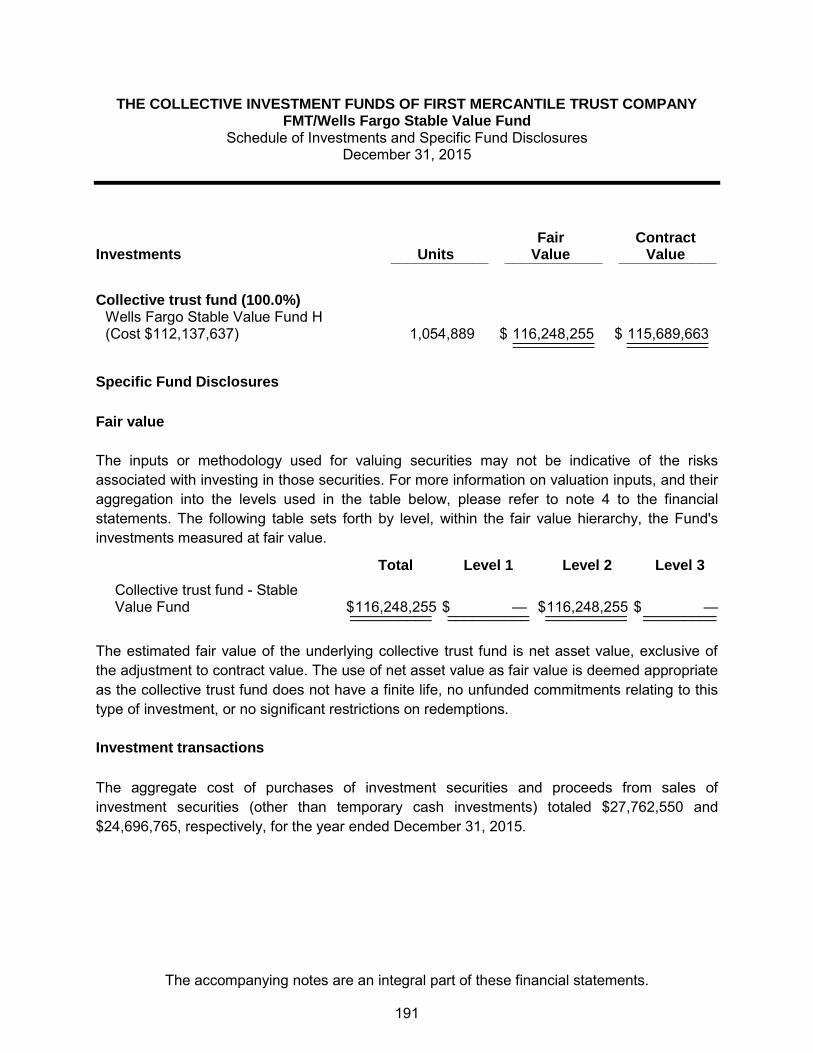
THE COLLECTIVE INVESTMENT FUNDS OF FIRST MERCANTILE TRUST COMPANY FMT/Wells Fargo Stable Value Fund
Schedule of Investments and Specific Fund Disclosures December 31, 2015
The accompanying notes are an integral part of these financial statements.
Investments Units Fair
Value Contract
Value ____________ ____________ ____________
Collective trust fund (100.0%)
Wells Fargo Stable Value Fund H (Cost $112,137,637) 1,054,889 $ 116,248,255 $ 115,689,663 __________ __________ __________ __________
Specific Fund Disclosures
Fair value
The inputs or methodology used for valuing securities may not be indicative of the risks associated with investing in those securities. For more information on valuation inputs, and their aggregation into the levels used in the table below, please refer to note 4 to the financial statements. The following table sets forth by level, within the fair value hierarchy, the Fund's investments measured at fair value.
Total Level 1 Level 2 Level 3
Collective trust fund - Stable Value Fund $ 116,248,255 $ — $ 116,248,255 $ — __________ __________ __________ _________ __________ __________ __________ _________
The estimated fair value of the underlying collective trust fund is net asset value, exclusive of the adjustment to contract value. The use of net asset value as fair value is deemed appropriate as the collective trust fund does not have a finite life, no unfunded commitments relating to this type of investment, or no significant restrictions on redemptions.
Investment transactions
The aggregate cost of purchases of investment securities and proceeds from sales of investment securities (other than temporary cash investments) totaled $27,762,550 and $24,696,765, respectively, for the year ended December 31, 2015.
191

THE COLLECTIVE INVESTMENT FUNDS OF FIRST MERCANTILE TRUST COMPANY FMT/Wells Fargo Stable Value Fund
Schedule of Investments and Specific Fund Disclosures (continued) December 31, 2015
The accompanying notes are an integral part of these financial statements.
Investment in fully benefit-responsive fund
The FMT/Wells Fargo Stable Value Fund has an underlying investment in the Stable Value Fund H (the "SVFH Fund"). The SVFH Fund is a collective trust fund that is sponsored by Wells Fargo Bank, N.A. The SVFH Fund is a fully benefit-responsive investment, and has invested all of its assets in Wells Fargo Stable Return Fund G, a collective trust fund sponsored by Wells Fargo Bank, N.A. The Wells Fargo Stable Return Fund G primarily invests in investment contracts and security-backed contracts (also known as a synthetic GIC or a separate account GIC). An investment contract is a contract issued by a financial institution to provide a stated rate of return to the buyer of the contract for a specified period of time. A security-backed contract has similar characteristics as a traditional investment contract and is comprised of two parts: the first part is a fixed-income security or portfolio of fixed-income securities; the second part is a contract value guarantee (wrapper) provided by a third party. Wrappers provide contract value payments for certain participant-initiated withdrawals and transfers, a floor crediting rate, and return of fully accrued contract value at maturity. The yield earned by the SVFH Fund for the year ended December 31, 2015 was 1.83%. The yield earned by the entire SVFH Fund with an adjustment to reflect the actual interest rate credited to participants in the SVFH Fund for the year ended December 31, 2015 was 1.79%. The FMT/Wells Fargo Stable Value Fund does not invest directly in fully benefit-responsive contracts, and therefore is not required to include in its financial statements the disclosure requirements for stable value investment funds. Class-specific expenses Class-specific trustee fees for the year ended December 31, 2015 were as follows: Class R1 $ 173,445 Class R2 117,522 Class R3 125,261 Class R4 109,168 Class R5 118,682 Class R6 16,728 Class R7 7,412 Class R8 5,576 $ 673,794
192

THE COLLECTIVE INVESTMENT FUNDS OF FIRST MERCANTILE TRUST COMPANY
FMT/Wells Fargo Stable Value Fund Schedule of Participant Transactions
December 31, 2015
The accompanying notes are an integral part of these financial statements.
Participant transactions by class for the year ended December 31, 2015 were as follows: Dollars Units Purchases Redemptions Net change Purchases Redemptions Net change Class R1 $ 22,311,929 $ (14,352,741) $ 7,959,188 2,101,879 (1,352,235) 749,644 Class R2 12,483,105 (8,424,169) 4,058,936 1,202,847 (810,903) 391,944 Class R3 5,751,244 (11,814,595) (6,063,351) 557,955 (1,145,363) (587,408) Class R4 7,732,705 (7,770,677) (37,972) 753,024 (757,967) (4,943) Class R5 3,668,733 (5,948,066) (2,279,333) 359,553 (582,729) (223,176) Class R6 1,052,437 (428,456) 623,981 103,789 (42,267) 61,522 Class R7 404,763 (933,441) (528,678) 40,186 (92,670) (52,484) Class R8 198,267 (150,747) 47,520 19,801 (15,057) 4,744 $ 53,603,183 $ (49,822,892) $ 3,780,291 5,139,034 (4,799,191) 339,843
193

THE COLLECTIVE INVESTMENT FUNDS OF FIRST MERCANTILE TRUST COMPANY
FMT/Wells Fargo Stable Value Fund Financial Highlights December 31, 2015
The accompanying notes are an integral part of these financial statements.
Change in Net Asset Value Resulting from Operations Ratios (to average net
assets)
NAV per Unit, Beginning of
Period
Net Investment
Income (Loss)(a)
Net Realized and Unrealized
Gain (Loss) from
Investments(a)
Total from Investment Activities
NAV per Unit, End of
Period Total
Return Expenses
Net Investment
Income (Loss)
Class R1 $ 10.5425 $ (0.0409) $ 0.1687 $ 0.1278 $ 10.6703 1.21 % (0.39) % (0.39) % Class R2 10.3368 (0.0629) 0.1652 0.1023 10.4391 0.99 % (0.61) % (0.61) % Class R3 10.2779 (0.0800) 0.1641 0.0841 10.3620 0.82 % (0.78) % (0.78) % Class R4 10.2310 (0.0970) 0.1632 0.0662 10.2972 0.65 % (0.95) % (0.95) % Class R5 10.1810 (0.1138) 0.1624 0.0486 10.2296 0.48 % (1.12) % (1.12) % Class R6 10.1288 (0.1304) 0.1614 0.0310 10.1598 0.31 % (1.29) % (1.29) % Class R7 10.0707 (0.1466) 0.1602 0.0136 10.0843 0.14 % (1.46) % (1.46) % Class R8 10.0154 (0.1628) 0.1593 (0.0035) 10.0119 (0.03) % (1.63) % (1.63) % (a) Per unit amounts are based on average daily units outstanding.
194

FMT High Yield Bond (Federated) Fund

THE COLLECTIVE INVESTMENT FUNDS OF FIRST MERCANTILE TRUST COMPANY FMT High Yield Bond (Federated) Fund
Statement of Assets and Liabilities December 31, 2015
The accompanying notes are an integral part of these financial statements.
Assets Investments in securities, at fair value $ 14,267,778 Cash equivalents 267,945
Receivables
Interest 223,811
Total assets 14,759,534
Liabilities Sub-advisor fees 4,687
Trustee fees 1,152
Total liabilities 5,839
Net assets $ 14,753,695
Components of net assets
Units of
Participation NAV
per Unit Net
Assets Class R1 42,662 $ 10.8004 $ 460,764
Class R3 78,506 $ 10.5835 830,874
Class R4 21,870 $ 10.5287 230,258
Class R5 18,854 $ 10.4743 197,486
Class R6 2,650 $ 10.4206 27,610
Class R7 7,460 $ 10.3307 77,071
Class LifeStyle 12,929,632
$ 14,753,695
195
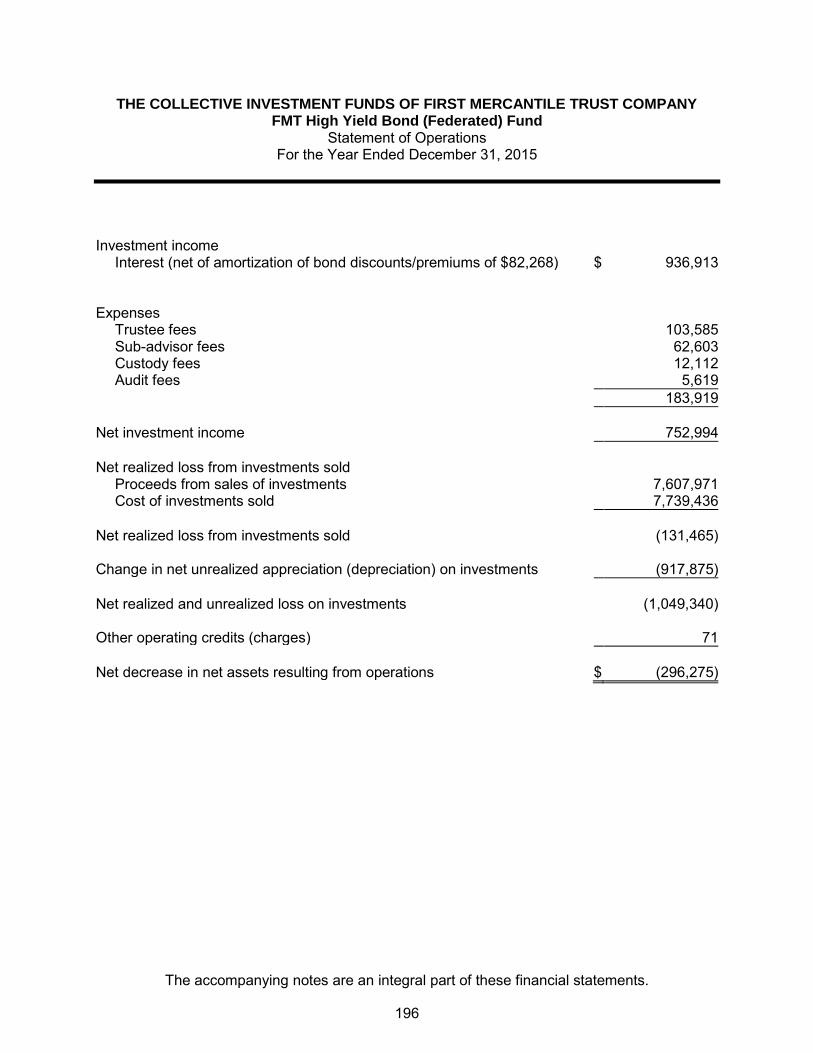
THE COLLECTIVE INVESTMENT FUNDS OF FIRST MERCANTILE TRUST COMPANY FMT High Yield Bond (Federated) Fund
Statement of Operations For the Year Ended December 31, 2015
The accompanying notes are an integral part of these financial statements.
Investment income
Interest (net of amortization of bond discounts/premiums of $82,268) $ 936,913
Expenses
Trustee fees 103,585
Sub-advisor fees 62,603
Custody fees 12,112
Audit fees 5,619
183,919
Net investment income 752,994
Net realized loss from investments sold
Proceeds from sales of investments 7,607,971
Cost of investments sold 7,739,436
Net realized loss from investments sold (131,465)
Change in net unrealized appreciation (depreciation) on investments (917,875)
Net realized and unrealized loss on investments (1,049,340)
Other operating credits (charges) 71
Net decrease in net assets resulting from operations $ (296,275)
196

THE COLLECTIVE INVESTMENT FUNDS OF FIRST MERCANTILE TRUST COMPANY FMT High Yield Bond (Federated) Fund
Statement of Changes in Net Assets For the Year Ended December 31, 2015
The accompanying notes are an integral part of these financial statements.
Operations
Net investment income $ 752,994
Net realized loss from investments sold (131,465)
Change in net unrealized appreciation (depreciation) on investments (917,875)
Other operating credits (charges) 71
Net decrease in net assets resulting from operations (296,275)
Participant transactions
Proceeds from units purchased 4,187,389
Less payments for units redeemed 7,441,151
Decrease in net assets from participant transactions (3,253,762)
Total decrease in net assets (3,550,037)
Net assets at beginning of year 18,303,732
Net assets at end of year $ 14,753,695
197

THE COLLECTIVE INVESTMENT FUNDS OF FIRST MERCANTILE TRUST COMPANY FMT High Yield Bond (Federated) Fund
Schedule of Investments and Specific Fund Disclosures December 31, 2015
The accompanying notes are an integral part of these financial statements.
Investments
Principal Amount or
Shares Fair Value ____________ ____________
Corporate bonds (96.7%)
Basic Materials (5.7%) ArcelorMittal, 6.13%, 06/01/2025 50,000 $ 36,375 Ashland, Inc., 4.75%, 08/15/2022 175,000 170,187 Celanese US Holdings LLC, 4.63%, 11/15/2022 175,000 172,375 Clearwater Paper Corp., 4.50%, 02/01/2023 125,000 117,500 Hexion, Inc., 8.88%, 02/01/2018 100,000 70,500 Huntsman International LLC, 4.88%, 11/15/2020 175,000 159,688 Steel Dynamics, Inc., 5.25%, 04/15/2023 125,000 114,063 __________ 840,688
Communications (19.2%) AMC Networks, Inc., 7.75%, 07/15/2021 75,000 78,750 Cablevision Systems Corp., 5.88%, 09/15/2022 75,000 63,750
CCO Holdings LLC / CCO Holdings Capital Corp., 5.75%, 01/15/2024 250,000 256,875
Clear Channel Worldwide Holdings, Inc. Series B, 6.50%, 11/15/2022 125,000 121,875
CSC Holdings LLC, 5.25%, 06/01/2024 100,000 87,750 DISH DBS Corp., 5.88%, 07/15/2022 125,000 116,562 DISH DBS Corp., 5.88%, 11/15/2024 75,000 66,750 Entercom Radio LLC, 10.50%, 12/01/2019 50,000 51,750 Gray Television, Inc., 7.50%, 10/01/2020 100,000 102,750 iHeartCommunications, Inc., 9.00%, 03/01/2021 50,000 34,875 Intelsat Jackson Holdings S.A., 5.50%, 08/01/2023 50,000 39,250 Intelsat Jackson Holdings S.A., 6.63%, 12/15/2022 200,000 127,500 Lamar Media Corp., 5.88%, 02/01/2022 175,000 183,750 Level 3 Communications, Inc., 5.75%, 12/01/2022 50,000 51,125 LIN Television Corp., 6.38%, 01/15/2021 100,000 104,750 Nexstar Broadcasting, Inc., 6.88%, 11/15/2020 75,000 76,687
Nielsen Finance LLC / Nielsen Finance Co., 4.50%, 10/01/2020 125,000 126,875
Outfront Media Capital LLC / Outfront Media Capital Corp., 5.88%, 03/15/2025 100,000 101,500
Sinclair Television Group, Inc., 6.13%, 10/01/2022 125,000 127,500 Sprint Capital Corp., 6.88%, 11/15/2028 75,000 52,313 Sprint Communications, Inc., 6.00%, 11/15/2022 325,000 229,125 Syniverse Holdings, Inc., 9.13%, 01/15/2019 50,000 22,625 T-Mobile USA, Inc., 6.38%, 03/01/2025 50,000 50,500 T-Mobile USA, Inc., 6.50%, 01/15/2026 50,000 50,475 T-Mobile USA, Inc., 6.63%, 11/15/2020 250,000 259,872
198
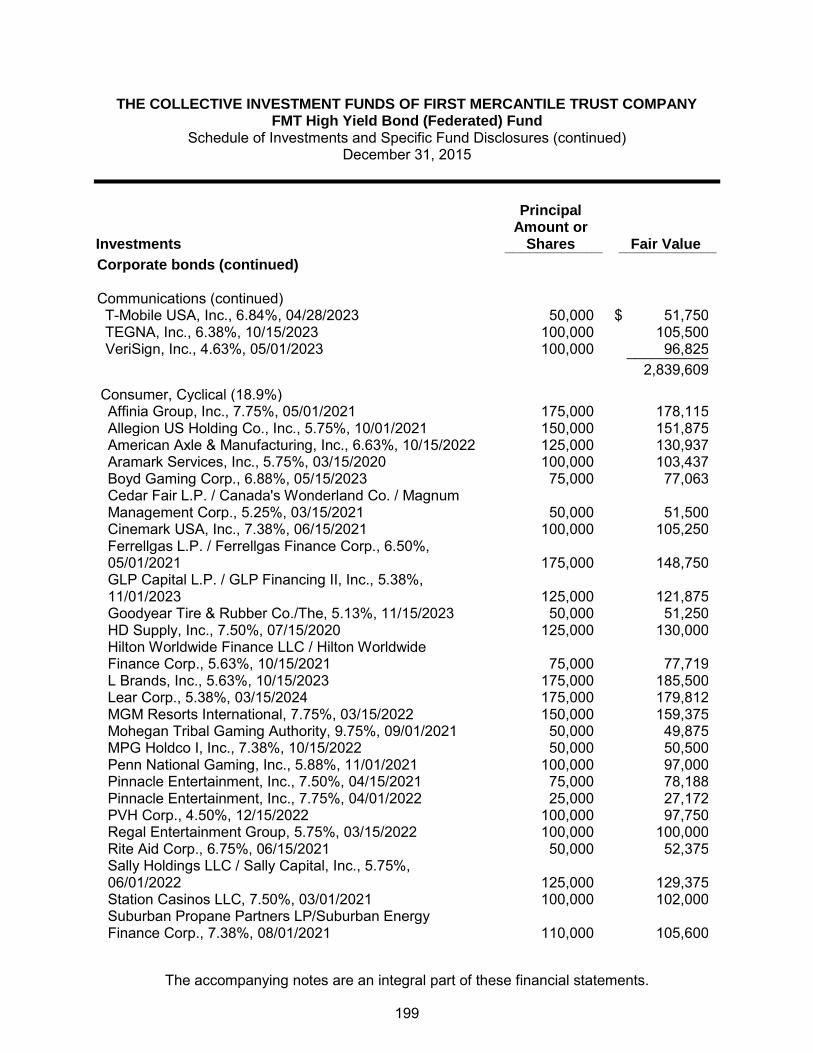
THE COLLECTIVE INVESTMENT FUNDS OF FIRST MERCANTILE TRUST COMPANY FMT High Yield Bond (Federated) Fund
Schedule of Investments and Specific Fund Disclosures (continued) December 31, 2015
The accompanying notes are an integral part of these financial statements.
Investments
Principal Amount or
Shares Fair Value ____________ ____________
Corporate bonds (continued) Communications (continued) T-Mobile USA, Inc., 6.84%, 04/28/2023 50,000 $ 51,750 TEGNA, Inc., 6.38%, 10/15/2023 100,000 105,500 VeriSign, Inc., 4.63%, 05/01/2023 100,000 96,825 __________ 2,839,609
Consumer, Cyclical (18.9%) Affinia Group, Inc., 7.75%, 05/01/2021 175,000 178,115 Allegion US Holding Co., Inc., 5.75%, 10/01/2021 150,000 151,875 American Axle & Manufacturing, Inc., 6.63%, 10/15/2022 125,000 130,937 Aramark Services, Inc., 5.75%, 03/15/2020 100,000 103,437 Boyd Gaming Corp., 6.88%, 05/15/2023 75,000 77,063
Cedar Fair L.P. / Canada's Wonderland Co. / Magnum Management Corp., 5.25%, 03/15/2021 50,000 51,500
Cinemark USA, Inc., 7.38%, 06/15/2021 100,000 105,250
Ferrellgas L.P. / Ferrellgas Finance Corp., 6.50%, 05/01/2021 175,000 148,750
GLP Capital L.P. / GLP Financing II, Inc., 5.38%, 11/01/2023 125,000 121,875
Goodyear Tire & Rubber Co./The, 5.13%, 11/15/2023 50,000 51,250 HD Supply, Inc., 7.50%, 07/15/2020 125,000 130,000
Hilton Worldwide Finance LLC / Hilton Worldwide Finance Corp., 5.63%, 10/15/2021 75,000 77,719
L Brands, Inc., 5.63%, 10/15/2023 175,000 185,500 Lear Corp., 5.38%, 03/15/2024 175,000 179,812 MGM Resorts International, 7.75%, 03/15/2022 150,000 159,375 Mohegan Tribal Gaming Authority, 9.75%, 09/01/2021 50,000 49,875 MPG Holdco I, Inc., 7.38%, 10/15/2022 50,000 50,500 Penn National Gaming, Inc., 5.88%, 11/01/2021 100,000 97,000 Pinnacle Entertainment, Inc., 7.50%, 04/15/2021 75,000 78,188 Pinnacle Entertainment, Inc., 7.75%, 04/01/2022 25,000 27,172 PVH Corp., 4.50%, 12/15/2022 100,000 97,750 Regal Entertainment Group, 5.75%, 03/15/2022 100,000 100,000 Rite Aid Corp., 6.75%, 06/15/2021 50,000 52,375
Sally Holdings LLC / Sally Capital, Inc., 5.75%, 06/01/2022 125,000 129,375
Station Casinos LLC, 7.50%, 03/01/2021 100,000 102,000
Suburban Propane Partners LP/Suburban Energy Finance Corp., 7.38%, 08/01/2021 110,000 105,600
199
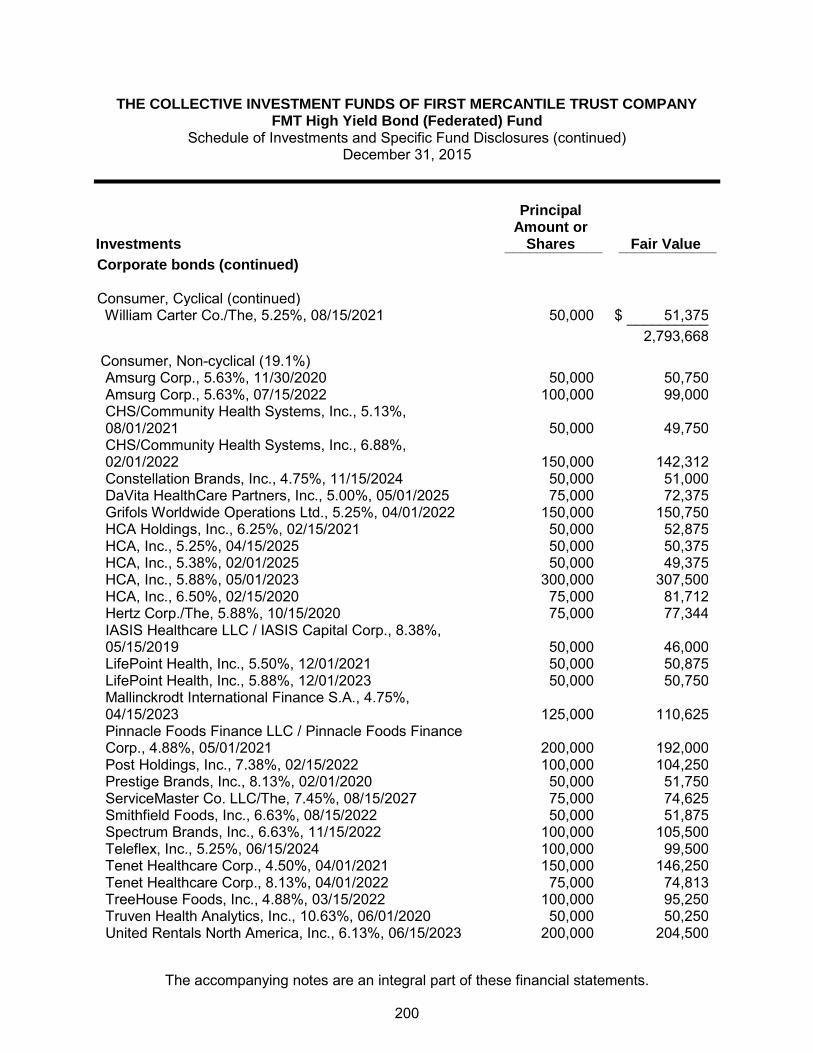
THE COLLECTIVE INVESTMENT FUNDS OF FIRST MERCANTILE TRUST COMPANY FMT High Yield Bond (Federated) Fund
Schedule of Investments and Specific Fund Disclosures (continued) December 31, 2015
The accompanying notes are an integral part of these financial statements.
Investments
Principal Amount or
Shares Fair Value ____________ ____________
Corporate bonds (continued)
Consumer, Cyclical (continued) William Carter Co./The, 5.25%, 08/15/2021 50,000 $ 51,375 __________ 2,793,668
Consumer, Non-cyclical (19.1%) Amsurg Corp., 5.63%, 11/30/2020 50,000 50,750 Amsurg Corp., 5.63%, 07/15/2022 100,000 99,000
CHS/Community Health Systems, Inc., 5.13%, 08/01/2021 50,000 49,750
CHS/Community Health Systems, Inc., 6.88%, 02/01/2022 150,000 142,312
Constellation Brands, Inc., 4.75%, 11/15/2024 50,000 51,000 DaVita HealthCare Partners, Inc., 5.00%, 05/01/2025 75,000 72,375 Grifols Worldwide Operations Ltd., 5.25%, 04/01/2022 150,000 150,750 HCA Holdings, Inc., 6.25%, 02/15/2021 50,000 52,875 HCA, Inc., 5.25%, 04/15/2025 50,000 50,375 HCA, Inc., 5.38%, 02/01/2025 50,000 49,375 HCA, Inc., 5.88%, 05/01/2023 300,000 307,500 HCA, Inc., 6.50%, 02/15/2020 75,000 81,712 Hertz Corp./The, 5.88%, 10/15/2020 75,000 77,344
IASIS Healthcare LLC / IASIS Capital Corp., 8.38%, 05/15/2019 50,000 46,000
LifePoint Health, Inc., 5.50%, 12/01/2021 50,000 50,875 LifePoint Health, Inc., 5.88%, 12/01/2023 50,000 50,750
Mallinckrodt International Finance S.A., 4.75%, 04/15/2023 125,000 110,625
Pinnacle Foods Finance LLC / Pinnacle Foods Finance Corp., 4.88%, 05/01/2021 200,000 192,000
Post Holdings, Inc., 7.38%, 02/15/2022 100,000 104,250 Prestige Brands, Inc., 8.13%, 02/01/2020 50,000 51,750 ServiceMaster Co. LLC/The, 7.45%, 08/15/2027 75,000 74,625 Smithfield Foods, Inc., 6.63%, 08/15/2022 50,000 51,875 Spectrum Brands, Inc., 6.63%, 11/15/2022 100,000 105,500 Teleflex, Inc., 5.25%, 06/15/2024 100,000 99,500 Tenet Healthcare Corp., 4.50%, 04/01/2021 150,000 146,250 Tenet Healthcare Corp., 8.13%, 04/01/2022 75,000 74,813 TreeHouse Foods, Inc., 4.88%, 03/15/2022 100,000 95,250 Truven Health Analytics, Inc., 10.63%, 06/01/2020 50,000 50,250 United Rentals North America, Inc., 6.13%, 06/15/2023 200,000 204,500
200

THE COLLECTIVE INVESTMENT FUNDS OF FIRST MERCANTILE TRUST COMPANY FMT High Yield Bond (Federated) Fund
Schedule of Investments and Specific Fund Disclosures (continued) December 31, 2015
The accompanying notes are an integral part of these financial statements.
Investments
Principal Amount or
Shares Fair Value __________
Corporate bonds (continued) Consumer, Non-cyclical (continued) US Foods, Inc., 8.50%, 06/30/2019 75,000 $ 77,250
__________
2,821,181
Energy (11.8%) Antero Resources Corp., 5.13%, 12/01/2022 75,000 57,000 California Resources Corp., 6.00%, 11/15/2024 100,000 30,500 Carrizo Oil & Gas, Inc., 7.50%, 09/15/2020 50,000 43,687 Chesapeake Energy Corp., 5.38%, 06/15/2021 50,000 13,500 Chesapeake Energy Corp., 6.63%, 08/15/2020 100,000 29,000
Crestwood Midstream Partners L.P. / Crestwood Midstream Finance Corp., 6.13%, 03/01/2022 75,000 52,125
CVR Refining LLC / Coffeyville Finance, Inc., 6.50%, 11/01/2022 50,000 48,500
Energy Transfer Equity L.P., 5.88%, 01/15/2024 200,000 163,000
EP Energy LLC / Everest Acquisition Finance, Inc., 9.38%, 05/01/2020 50,000 31,875
Gulfport Energy Corp., 7.75%, 11/01/2020 50,000 44,750 Laredo Petroleum, Inc., 5.63%, 01/15/2022 25,000 21,750 Laredo Petroleum, Inc., 6.25%, 03/15/2023 50,000 43,500
Legacy Reserves L.P. / Legacy Reserves Finance Corp., 6.63%, 12/01/2021 50,000 10,500
Linn Energy LLC / Linn Energy Finance Corp., 6.50%, 05/15/2019 25,000 4,375
Linn Energy LLC / Linn Energy Finance Corp., 6.50%, 09/15/2021 50,000 6,750
Northern Oil and Gas, Inc., 8.00%, 06/01/2020 75,000 49,875 Oasis Petroleum, Inc., 6.88%, 03/15/2022 75,000 48,000 PDC Energy, Inc., 7.75%, 10/15/2022 25,000 24,000 Range Resources Corp., 5.00%, 03/15/2023 50,000 37,250
Regency Energy Partners L.P. / Regency Energy Finance Corp., 6.50%, 07/15/2021 100,000 100,500
Rice Energy, Inc., 6.25%, 05/01/2022 50,000 36,000
Rose Rock Midstream L.P. / Rose Rock Finance Corp., 5.63%, 07/15/2022 100,000 71,000
Sabine Pass Liquefaction LLC, 5.63%, 02/01/2021 25,000 23,000 Sabine Pass Liquefaction LLC, 5.63%, 04/15/2023 200,000 175,500 SandRidge Energy, Inc., 8.13%, 10/15/2022 50,000 5,500 SM Energy Co., 5.00%, 01/15/2024 50,000 32,500
201

THE COLLECTIVE INVESTMENT FUNDS OF FIRST MERCANTILE TRUST COMPANY FMT High Yield Bond (Federated) Fund
Schedule of Investments and Specific Fund Disclosures (continued) December 31, 2015
The accompanying notes are an integral part of these financial statements.
Investments
Principal Amount or
Shares Fair Value __________ Corporate bonds (continued)
Energy (continued) SM Energy Co., 5.63%, 06/01/2025 50,000 $ 33,000
Summit Midstream Holdings LLC / Summit Midstream Finance Corp., 5.50%, 08/15/2022 125,000 92,500
Targa Resources Partners L.P. / Targa Resources Partners Finance Corp., 5.25%, 05/01/2023 50,000 40,500
Tesoro Corp., 5.13%, 04/01/2024 75,000 74,625
Tesoro Logistics L.P. / Tesoro Logistics Finance Corp., 5.88%, 10/01/2020 78,000 74,490 W&T Offshore, Inc., 8.50%, 06/15/2019 50,000 17,500
Western Refining Logistics L.P. / WNRL Finance Corp., 7.50%, 02/15/2023 75,000 71,625 Whiting Petroleum Corp., 5.75%, 03/15/2021 75,000 54,675
Williams Partners L.P. / ACMP Finance Corp., 4.88%, 03/15/2024 100,000 80,124 __________ 1,742,976
Financial (6.7%)
AerCap Ireland Capital Ltd. / AerCap Global Aviation Trust, 4.63%, 07/01/2022 150,000 151,688
Ally Financial, Inc., 4.13%, 02/13/2022 175,000 173,250 Ally Financial, Inc., 4.63%, 05/19/2022 50,000 50,250 Ally Financial, Inc., 4.63%, 03/30/2025 150,000 148,125 Ally Financial, Inc., 5.75%, 11/20/2025 50,000 50,625 CIT Group, Inc., 5.38%, 05/15/2020 100,000 104,750 International Lease Finance Corp., 4.63%, 04/15/2021 200,000 205,000 Iron Mountain, Inc., 5.75%, 08/15/2024 75,000 72,375
RHP Hotel Properties L.P. / RHP Finance Corp., 5.00%, 04/15/2023 25,000 25,000 __________
981,063
Industrial (10.6%) Anixter, Inc., 5.63%, 05/01/2019 125,000 130,000 Ball Corp., 4.00%, 11/15/2023 175,000 166,906 Berry Plastics Corp., 5.13%, 07/15/2023 50,000 48,625 Berry Plastics Corp., 5.50%, 05/15/2022 150,000 149,438
Crown Americas LLC / Crown Americas Capital Corp. III, 6.25%, 02/01/2021 175,000 180,687
FGI Operating Co. LLC / FGI Finance, Inc., 7.88%, 05/01/2020 50,000 36,000
202

THE COLLECTIVE INVESTMENT FUNDS OF FIRST MERCANTILE TRUST COMPANY FMT High Yield Bond (Federated) Fund
Schedule of Investments and Specific Fund Disclosures (continued) December 31, 2015
The accompanying notes are an integral part of these financial statements.
Investments
Principal Amount or
Shares Fair Value __________ Corporate bonds (continued)
Industrial (continued)
Graphic Packaging International, Inc., 4.75%, 04/15/2021 175,000 $ 178,500 Nortek, Inc., 8.50%, 04/15/2021 50,000 51,880
Reynolds Group Issuer, Inc. / Reynolds Group Issuer LLC, 5.75%, 10/15/2020 100,000 101,719
Reynolds Group Issuer, Inc. / Reynolds Group Issuer LLC, 8.25%, 02/15/2021 50,000 48,125
TransDigm, Inc., 5.50%, 10/15/2020 200,000 193,500 WESCO Distribution, Inc., 5.38%, 12/15/2021 175,000 168,000 Zebra Technologies Corp., 7.25%, 10/15/2022 100,000 104,500 __________ 1,557,880
Technology (3.1%) Advanced Micro Devices, Inc., 7.00%, 07/01/2024 75,000 48,750 CDW LLC / CDW Finance Corp., 5.00%, 09/01/2023 75,000 76,125 CDW LLC / CDW Finance Corp., 5.50%, 12/01/2024 50,000 52,375 CDW LLC / CDW Finance Corp., 6.00%, 08/15/2022 50,000 52,750 Emdeon, Inc., 11.00%, 12/31/2019 100,000 104,250 NCR Corp., 4.63%, 02/15/2021 125,000 119,063 __________ 453,313
Utilities (1.6%) Calpine Corp., 5.75%, 01/15/2025 150,000 132,375 NRG Energy, Inc., 6.25%, 05/01/2024 125,000 105,025 __________ 237,400 __________ Total Investments (Cost $15,448,691) $ 14,267,778 __________ __________
203

THE COLLECTIVE INVESTMENT FUNDS OF FIRST MERCANTILE TRUST COMPANY FMT High Yield Bond (Federated) Fund
Schedule of Investments and Specific Fund Disclosures (continued) December 31, 2015
The accompanying notes are an integral part of these financial statements.
Specific Fund Disclosures Fair value The inputs or methodology used for valuing securities may not be indicative of the risks associated with investing in those securities. For more information on valuation inputs, and their aggregation into the levels used in the table below, please refer to note 4 to the financial statements. The following table sets forth by level, within the fair value hierarchy, the Fund's investments measured at fair value.
Total Level 1 Level 2 Level 3
Corporate bonds $ 14,267,778 $ — $ 14,267,778 $ — __________ __________ __________ _________ __________ __________ __________ _________ Investment transactions The aggregate cost of purchases of investment securities and proceeds from sales of investment securities (other than temporary cash investments) totaled $4,956,532 and $7,607,971, respectively, for the year ended December 31, 2015. Class-specific expenses Class-specific trustee fees for the year ended December 31, 2015 were as follows: Class R1 $ 1,401 Class R2 161 Class R3 5,142 Class R4 1,671 Class R5 2,269 Class R6 315 Class R7 1,141 Class LifeStyle 91,485 $ 103,585
204
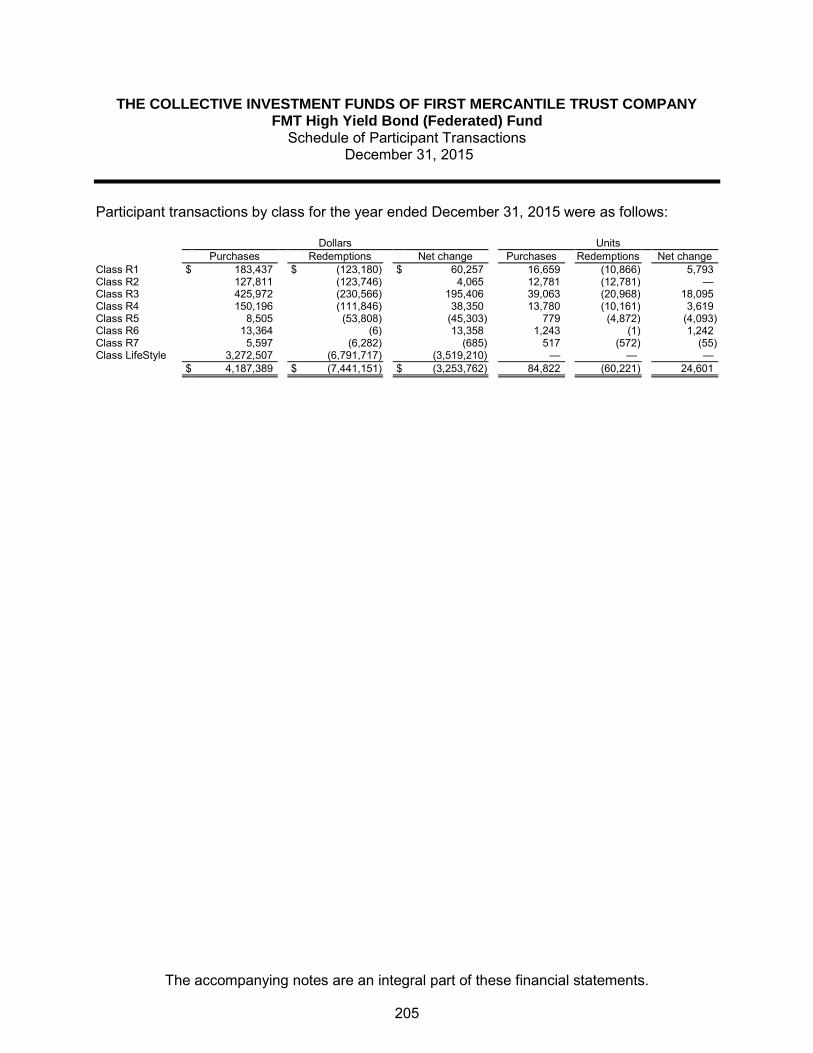
THE COLLECTIVE INVESTMENT FUNDS OF FIRST MERCANTILE TRUST COMPANY FMT High Yield Bond (Federated) Fund
Schedule of Participant Transactions December 31, 2015
The accompanying notes are an integral part of these financial statements.
Participant transactions by class for the year ended December 31, 2015 were as follows: Dollars Units Purchases Redemptions Net change Purchases Redemptions Net change Class R1 $ 183,437 $ (123,180) $ 60,257 16,659 (10,866) 5,793 Class R2 127,811 (123,746) 4,065 12,781 (12,781) — Class R3 425,972 (230,566) 195,406 39,063 (20,968) 18,095 Class R4 150,196 (111,846) 38,350 13,780 (10,161) 3,619 Class R5 8,505 (53,808) (45,303) 779 (4,872) (4,093) Class R6 13,364 (6) 13,358 1,243 (1) 1,242 Class R7 5,597 (6,282) (685) 517 (572) (55) Class LifeStyle 3,272,507 (6,791,717) (3,519,210) — — — $ 4,187,389 $ (7,441,151) $ (3,253,762) 84,822 (60,221) 24,601
205
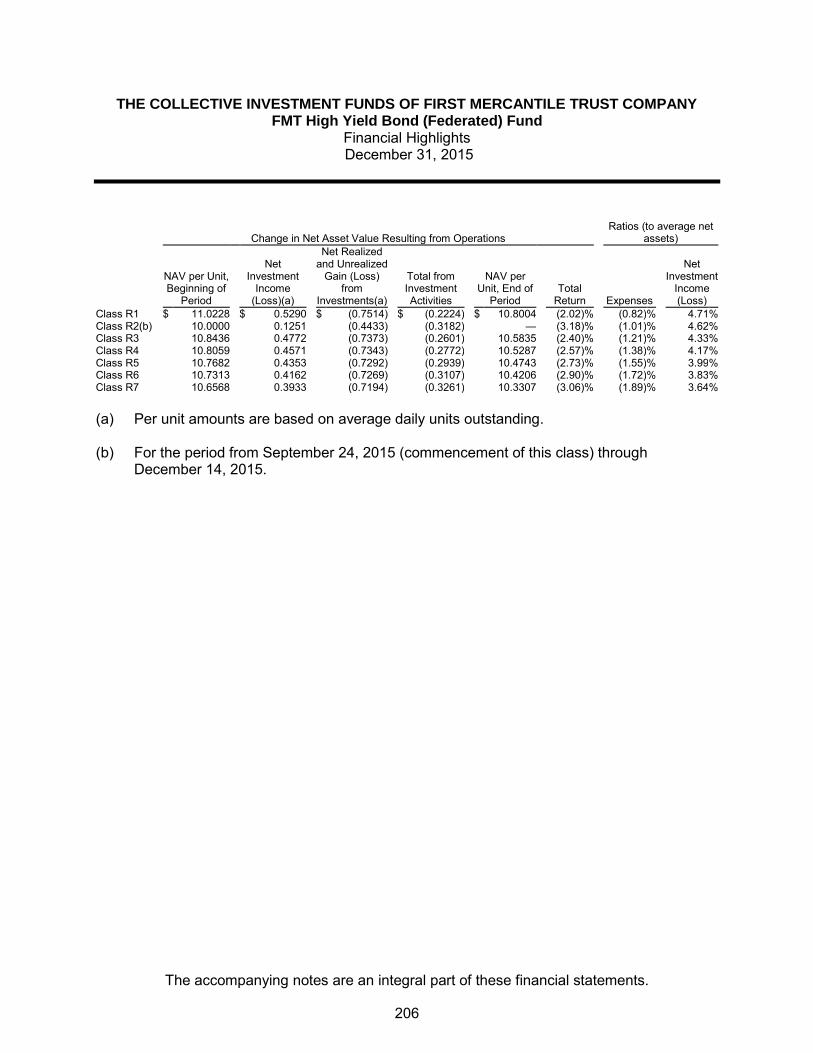
THE COLLECTIVE INVESTMENT FUNDS OF FIRST MERCANTILE TRUST COMPANY FMT High Yield Bond (Federated) Fund
Financial Highlights December 31, 2015
The accompanying notes are an integral part of these financial statements.
Change in Net Asset Value Resulting from Operations Ratios (to average net
assets)
NAV per Unit, Beginning of
Period
Net Investment
Income (Loss)(a)
Net Realized and Unrealized
Gain (Loss) from
Investments(a)
Total from Investment Activities
NAV per Unit, End of
Period Total
Return Expenses
Net Investment
Income (Loss)
Class R1 $ 11.0228 $ 0.5290 $ (0.7514) $ (0.2224) $ 10.8004 (2.02) % (0.82) % 4.71 % Class R2(b) 10.0000 0.1251 (0.4433) (0.3182) — (3.18) % (1.01) % 4.62 % Class R3 10.8436 0.4772 (0.7373) (0.2601) 10.5835 (2.40) % (1.21) % 4.33 % Class R4 10.8059 0.4571 (0.7343) (0.2772) 10.5287 (2.57) % (1.38) % 4.17 % Class R5 10.7682 0.4353 (0.7292) (0.2939) 10.4743 (2.73) % (1.55) % 3.99 % Class R6 10.7313 0.4162 (0.7269) (0.3107) 10.4206 (2.90) % (1.72) % 3.83 % Class R7 10.6568 0.3933 (0.7194) (0.3261) 10.3307 (3.06) % (1.89) % 3.64 % (a) Per unit amounts are based on average daily units outstanding.
(b) For the period from September 24, 2015 (commencement of this class) through
December 14, 2015.
206

FMT U.S. Core Bond (HighMark) Fund

THE COLLECTIVE INVESTMENT FUNDS OF FIRST MERCANTILE TRUST COMPANY FMT U.S. Core Bond (HighMark) Fund
Statement of Assets and Liabilities December 31, 2015
The accompanying notes are an integral part of these financial statements.
Assets Investments in securities, at fair value $ 65,808,957 Cash equivalents 243,725
Receivables
Interest 539,316
Total assets 66,591,998
Liabilities Trustee fees 19,248
Sub-advisor fees 8,571
Total liabilities 27,819
Net assets $ 66,564,179
Components of net assets
Units of
Participation NAV
per Unit Net
Assets Class R1 2,166,052 $ 14.8387 $ 32,141,456
Class R2 56,619 $ 10.7921 611,041
Class R3 308,888 $ 10.7170 3,310,363
Class R4 507,853 $ 10.7171 5,442,708
Class R5 132,321 $ 10.6654 1,411,257
Class R6 82,296 $ 10.5845 871,065
Class R7 36,135 $ 10.4414 377,303
Class R8 15,031 $ 10.4044 156,383
Class LifeStyle 22,242,603
$ 66,564,179
207

THE COLLECTIVE INVESTMENT FUNDS OF FIRST MERCANTILE TRUST COMPANY FMT U.S. Core Bond (HighMark) Fund
Statement of Operations For the Year Ended December 31, 2015
The accompanying notes are an integral part of these financial statements.
Investment income
Interest, net $ 1,811,422
Expenses
Trustee fees 406,252
Sub-advisor fees 109,163
Custody fees 14,258
Audit fees 5,788
535,461
Net investment income 1,275,961
Net realized gain from investments sold
Proceeds from sales of investments 38,352,547
Cost of investments sold 38,188,520
Net realized gain from investments sold 164,027
Change in net unrealized appreciation (depreciation) on investments (1,638,822)
Net realized and unrealized loss on investments (1,474,795)
Other operating credits (charges) 122
Net decrease in net assets resulting from operations $ (198,712)
208

THE COLLECTIVE INVESTMENT FUNDS OF FIRST MERCANTILE TRUST COMPANY FMT U.S. Core Bond (HighMark) Fund
Statement of Changes in Net Assets For the Year Ended December 31, 2015
The accompanying notes are an integral part of these financial statements.
Operations
Net investment income $ 1,275,961
Net realized gain from investments sold 164,027
Change in net unrealized appreciation (depreciation) on investments (1,638,822)
Other operating credits (charges) 122
Net decrease in net assets resulting from operations (198,712)
Participant transactions
Proceeds from units purchased 27,480,884
Less payments for units redeemed 32,583,652
Decrease in net assets from participant transactions (5,102,768)
Total decrease in net assets (5,301,480)
Net assets at beginning of year 71,865,659
Net assets at end of year $ 66,564,179
209
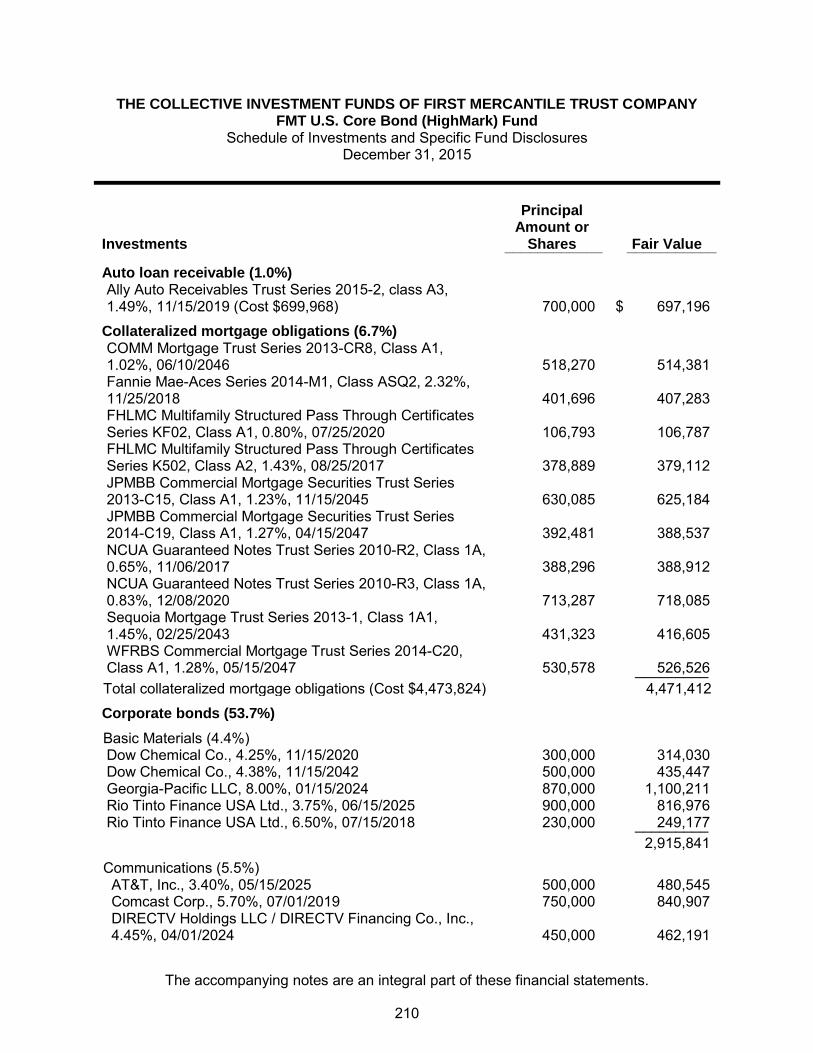
THE COLLECTIVE INVESTMENT FUNDS OF FIRST MERCANTILE TRUST COMPANY FMT U.S. Core Bond (HighMark) Fund
Schedule of Investments and Specific Fund Disclosures December 31, 2015
The accompanying notes are an integral part of these financial statements.
Investments
Principal Amount or
Shares Fair Value ____________ ___________
Auto loan receivable (1.0%)
Ally Auto Receivables Trust Series 2015-2, class A3, 1.49%, 11/15/2019 (Cost $699,968) 700,000 $ 697,196
Collateralized mortgage obligations (6.7%)
COMM Mortgage Trust Series 2013-CR8, Class A1, 1.02%, 06/10/2046 518,270 514,381
Fannie Mae-Aces Series 2014-M1, Class ASQ2, 2.32%, 11/25/2018 401,696 407,283
FHLMC Multifamily Structured Pass Through Certificates Series KF02, Class A1, 0.80%, 07/25/2020 106,793 106,787
FHLMC Multifamily Structured Pass Through Certificates Series K502, Class A2, 1.43%, 08/25/2017 378,889 379,112
JPMBB Commercial Mortgage Securities Trust Series 2013-C15, Class A1, 1.23%, 11/15/2045 630,085 625,184
JPMBB Commercial Mortgage Securities Trust Series 2014-C19, Class A1, 1.27%, 04/15/2047 392,481 388,537
NCUA Guaranteed Notes Trust Series 2010-R2, Class 1A, 0.65%, 11/06/2017 388,296 388,912
NCUA Guaranteed Notes Trust Series 2010-R3, Class 1A, 0.83%, 12/08/2020 713,287 718,085
Sequoia Mortgage Trust Series 2013-1, Class 1A1, 1.45%, 02/25/2043 431,323 416,605
WFRBS Commercial Mortgage Trust Series 2014-C20, Class A1, 1.28%, 05/15/2047 530,578 526,526 _________
Total collateralized mortgage obligations (Cost $4,473,824) 4,471,412
Corporate bonds (53.7%)
Basic Materials (4.4%) Dow Chemical Co., 4.25%, 11/15/2020 300,000 314,030 Dow Chemical Co., 4.38%, 11/15/2042 500,000 435,447 Georgia-Pacific LLC, 8.00%, 01/15/2024 870,000 1,100,211 Rio Tinto Finance USA Ltd., 3.75%, 06/15/2025 900,000 816,976 Rio Tinto Finance USA Ltd., 6.50%, 07/15/2018 230,000 249,177 _________ 2,915,841
Communications (5.5%) AT&T, Inc., 3.40%, 05/15/2025 500,000 480,545 Comcast Corp., 5.70%, 07/01/2019 750,000 840,907
DIRECTV Holdings LLC / DIRECTV Financing Co., Inc., 4.45%, 04/01/2024 450,000 462,191
210
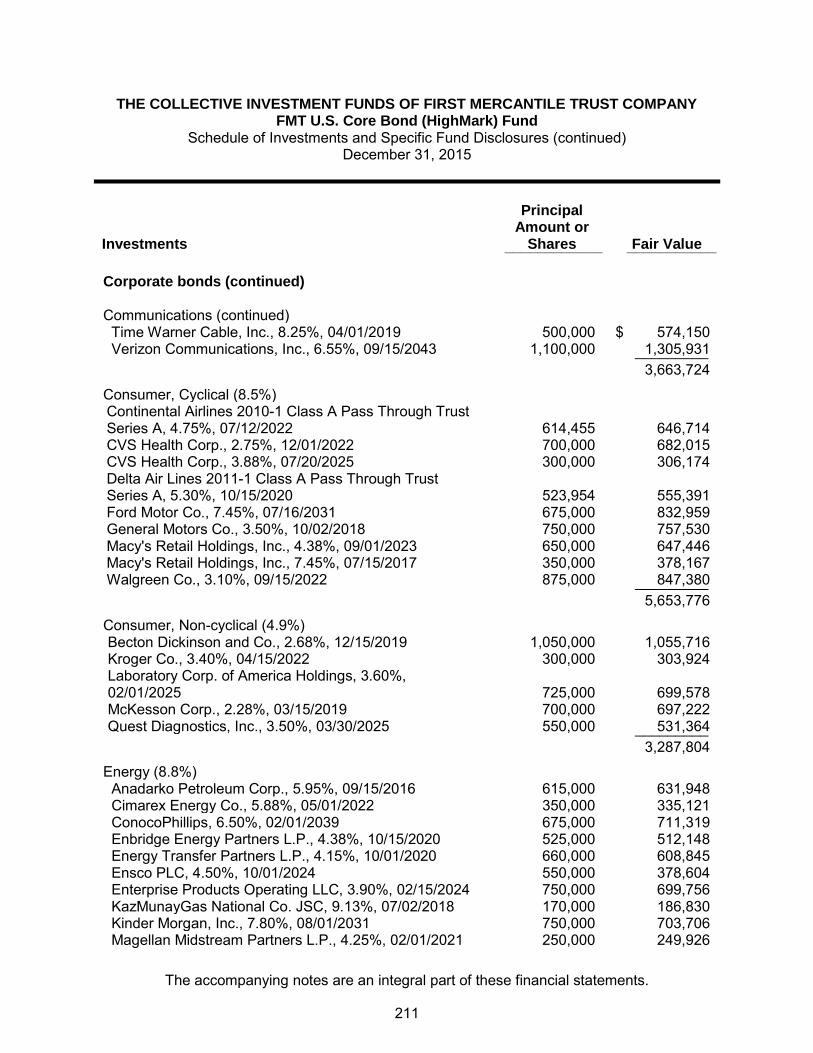
THE COLLECTIVE INVESTMENT FUNDS OF FIRST MERCANTILE TRUST COMPANY FMT U.S. Core Bond (HighMark) Fund
Schedule of Investments and Specific Fund Disclosures (continued) December 31, 2015
The accompanying notes are an integral part of these financial statements.
Investments
Principal Amount or
Shares Fair Value ____________ ___________
Corporate bonds (continued) Communications (continued) Time Warner Cable, Inc., 8.25%, 04/01/2019 500,000 $ 574,150 Verizon Communications, Inc., 6.55%, 09/15/2043 1,100,000 1,305,931 _________ 3,663,724
Consumer, Cyclical (8.5%)
Continental Airlines 2010-1 Class A Pass Through Trust Series A, 4.75%, 07/12/2022 614,455 646,714
CVS Health Corp., 2.75%, 12/01/2022 700,000 682,015 CVS Health Corp., 3.88%, 07/20/2025 300,000 306,174
Delta Air Lines 2011-1 Class A Pass Through Trust Series A, 5.30%, 10/15/2020 523,954 555,391
Ford Motor Co., 7.45%, 07/16/2031 675,000 832,959 General Motors Co., 3.50%, 10/02/2018 750,000 757,530 Macy's Retail Holdings, Inc., 4.38%, 09/01/2023 650,000 647,446 Macy's Retail Holdings, Inc., 7.45%, 07/15/2017 350,000 378,167 Walgreen Co., 3.10%, 09/15/2022 875,000 847,380 _________ 5,653,776
Consumer, Non-cyclical (4.9%) Becton Dickinson and Co., 2.68%, 12/15/2019 1,050,000 1,055,716 Kroger Co., 3.40%, 04/15/2022 300,000 303,924
Laboratory Corp. of America Holdings, 3.60%, 02/01/2025 725,000 699,578
McKesson Corp., 2.28%, 03/15/2019 700,000 697,222 Quest Diagnostics, Inc., 3.50%, 03/30/2025 550,000 531,364 _________ 3,287,804
Energy (8.8%) Anadarko Petroleum Corp., 5.95%, 09/15/2016 615,000 631,948 Cimarex Energy Co., 5.88%, 05/01/2022 350,000 335,121 ConocoPhillips, 6.50%, 02/01/2039 675,000 711,319 Enbridge Energy Partners L.P., 4.38%, 10/15/2020 525,000 512,148 Energy Transfer Partners L.P., 4.15%, 10/01/2020 660,000 608,845 Ensco PLC, 4.50%, 10/01/2024 550,000 378,604 Enterprise Products Operating LLC, 3.90%, 02/15/2024 750,000 699,756 KazMunayGas National Co. JSC, 9.13%, 07/02/2018 170,000 186,830 Kinder Morgan, Inc., 7.80%, 08/01/2031 750,000 703,706 Magellan Midstream Partners L.P., 4.25%, 02/01/2021 250,000 249,926
211

THE COLLECTIVE INVESTMENT FUNDS OF FIRST MERCANTILE TRUST COMPANY FMT U.S. Core Bond (HighMark) Fund
Schedule of Investments and Specific Fund Disclosures (continued) December 31, 2015
The accompanying notes are an integral part of these financial statements.
Investments
Principal Amount or
Shares Fair Value
Corporate bonds (continued)
Energy (continued)
Williams Partners L.P. / ACMP Finance Corp., 4.88%, 05/15/2023 800,000 $ 648,532
Williams Partners L.P. / ACMP Finance Corp., 6.13%, 07/15/2022 175,000 165,544 _________ 5,832,279
Financial (17.7%) American Express Credit Corp., 2.25%, 08/15/2019 700,000 700,122 American International Group, Inc., 2.30%, 07/16/2019 350,000 347,036 AvalonBay Communities, Inc., 3.45%, 06/01/2025 650,000 641,813 Bank of America Corp., 4.00%, 04/01/2024 1,100,000 1,124,986 Bank of New York Mellon Corp., 1.35%, 03/06/2018 850,000 846,972 BB&T Corp., 2.45%, 01/15/2020 1,050,000 1,057,036 Boston Properties L.P., 4.13%, 05/15/2021 725,000 759,365 Capital One NA/Mclean, 2.95%, 07/23/2021 925,000 915,620 Citigroup, Inc., 3.75%, 06/16/2024 285,000 290,117 Citigroup, Inc., 3.88%, 10/25/2023 675,000 697,559 ERP Operating L.P., 2.38%, 07/01/2019 525,000 526,388 Fifth Third Bank, 1.45%, 02/28/2018 900,000 891,841 First Republic Bank, 2.38%, 06/17/2019 400,000 399,155 JPMorgan Chase & Co., 3.20%, 01/25/2023 700,000 697,715 PNC Bank NA, 1.50%, 10/18/2017 175,000 174,685 PNC Bank NA, 2.25%, 07/02/2019 750,000 753,331 SunTrust Bank, 0.80%, 02/15/2017 200,000 199,282 Wells Fargo & Co., 2.55%, 12/07/2020 750,000 746,313 _________ 11,769,336
Industrial (1.6%) Burlington Northern Santa Fe LLC, 4.38%, 09/01/2042 350,000 330,920 L-3 Communications Corp., 3.95%, 11/15/2016 700,000 710,529 _________ 1,041,449
Technology (1.2%) HP, Inc., 4.38%, 09/15/2021 400,000 393,578
International Business Machines Corp., 3.38%, 08/01/2023 435,000 441,713 _________
835,291
212

THE COLLECTIVE INVESTMENT FUNDS OF FIRST MERCANTILE TRUST COMPANY FMT U.S. Core Bond (HighMark) Fund
Schedule of Investments and Specific Fund Disclosures (continued) December 31, 2015
The accompanying notes are an integral part of these financial statements.
Investments
Principal Amount or
Shares Fair Value
Corporate bonds (continued)
Utility (1.1%) Berkshire Hathaway Energy Co., 3.75%, 11/15/2023 700,000 $ 718,326 _________ Total Corporate bonds (Cost $37,011,601) 35,717,826
Mortgage pass throughs (15.4%) FHLMC Pool G18453 FG, 2.50%, 02/01/2028 702,246 714,015 FHLMC Pool Q12837 FG, 3.00%, 11/01/2042 970,934 970,122 FHLMC Pool V60563 FG, 3.00%, 06/01/2029 595,547 615,990 FNMA Pool 254766 FN, 5.00%, 06/01/2033 393,180 434,936 FNMA Pool 725027 FN, 5.00%, 11/01/2033 126,546 139,990 FNMA Pool 725424 FN, 5.50%, 04/01/2034 589,590 663,073 FNMA Pool 725425 FN, 5.50%, 04/01/2034 63,434 71,334 FNMA Pool AB6385 FN, 3.00%, 10/01/2042 690,103 691,953 FNMA Pool AE0138 FN, 4.50%, 03/01/2040 172,596 187,777 FNMA Pool AJ7689 FN, 4.00%, 12/01/2041 269,639 286,068 FNMA Pool AK9437 FN, 3.50%, 03/01/2042 246,665 255,104 FNMA Pool AL2221 FN, 3.00%, 07/01/2027 603,047 624,585 FNMA Pool AL2521 FN, 3.50%, 09/01/2042 344,140 355,756 FNMA Pool AL6825 FN, 3.00%, 05/01/2030 1,034,431 1,067,598 FNMA Pool AO7975 FN, 3.00%, 06/01/2027 245,634 254,406 FNMA Pool AS4786 FN, 3.00%, 04/01/2045 1,059,854 1,061,331 GNMA II Pool 005140 G2, 4.50%, 08/20/2041 150,353 163,782 GNMA II Pool 005175 G2, 4.50%, 09/20/2041 133,525 145,451 GNMA II Pool 005259 G2, 4.00%, 12/20/2041 238,828 255,419 GNMA Pool 711522 GN, 4.50%, 07/15/2040 349,607 384,019 GNMA Pool 734089 GN, 4.00%, 12/15/2040 361,470 385,701 GNMA Pool AA5452 GN, 3.50%, 07/15/2042 485,221 509,697 _________ Total Mortgage pass throughs (Cost $10,211,243) 10,238,107
Municipal bonds (2.7%)
Metropolitan Water District of Southern California, 6.95%, 07/01/2040 435,000 506,527
New Jersey Turnpike Authority, 7.10%, 01/01/2041 500,000 687,230 State of California, 7.55%, 04/01/2039 405,000 588,267 _________ Total Municipal bonds (Cost $1,577,466) 1,782,024
213

THE COLLECTIVE INVESTMENT FUNDS OF FIRST MERCANTILE TRUST COMPANY FMT U.S. Core Bond (HighMark) Fund
Schedule of Investments and Specific Fund Disclosures (continued) December 31, 2015
The accompanying notes are an integral part of these financial statements.
Investments
Principal Amount or
Shares Fair Value Other asset backed bonds (6.9%)
AEP Texas Central Transition Funding III LLC Series 2012-1, Class A1, 0.88%, 12/01/2018 200,604 $ 199,814
Ally Master Owner Trust Series 2014-1, class A1, 0.80%, 01/15/2019 300,000 299,590
American Express Credit Account Master Trust Series 2014-4, Class A, 1.43%, 06/15/2020 1,000,000 998,258
Chase Issuance Trust Series 2014-A7, Class A7, 1.38%, 11/15/2019 850,000 847,570
Citibank Credit Card Issuance Trust Series 2013-A6, Class A6, 1.32%, 09/07/2018 1,000,000 1,001,950
Ford Credit Auto Owner Trust Series 2013-D, Class A3, 0.67%, 04/15/2018 591,183 590,057
Ford Credit Auto Owner Trust Series 2015-C, Class A3, 1.41%, 02/15/2020 515,000 512,670
SLM Student Loan Trust Series 2014-1, Class A2, 0.80%, 07/26/2021 150,000 149,245 _________
Total Other asset backed bonds (Cost $4,613,929) 4,599,154
U.S. treasury & government agencies (12.5%) U.S. Treasury Bond, 4.75%, 02/15/2037 875,000 1,159,785 U.S. Treasury Note, 1.00%, 05/31/2018 1,200,000 1,193,860 U.S. Treasury Note, 1.38%, 05/31/2020 1,000,000 985,625 U.S. Treasury Note, 1.38%, 09/30/2020 350,000 343,957 U.S. Treasury Note, 1.50%, 05/31/2019 2,750,000 2,752,580 U.S. Treasury Note, 1.63%, 06/30/2020 350,000 348,564 U.S. Treasury Note, 2.13%, 06/30/2021 1,500,000 1,518,867 _________
Total U.S. treasury & government agencies (Cost $8,262,441) 8,303,238 _________ Total Investments (Cost $66,850,472) $ 65,808,957 _________ _________
214

THE COLLECTIVE INVESTMENT FUNDS OF FIRST MERCANTILE TRUST COMPANY FMT U.S. Core Bond (HighMark) Fund
Schedule of Investments and Specific Fund Disclosures (continued) December 31, 2015
The accompanying notes are an integral part of these financial statements.
Specific Fund Disclosures Fair value The inputs or methodology used for valuing securities may not be indicative of the risks associated with investing in those securities. For more information on valuation inputs, and their aggregation into the levels used in the table below, please refer to note 4 to the financial statements. The following table sets forth by level, within the fair value hierarchy, the Fund's investments measured at fair value.
Total Level 1 Level 2 Level 3
Auto loan receivable $ 697,196 $ — $ 697,196 $ — Collateralized mortgage obligations 4,471,412 — 4,471,412 — Corporate bonds 35,717,826 — 35,717,826 — Mortgage pass throughs 10,238,107 — 10,238,107 — Municipal bonds 1,782,024 — 1,782,024 — Other asset backed bonds 4,599,154 — 4,599,154 — U.S. treasury & government agencies 8,303,238 — 8,303,238 — __________ __________ __________ _________
$ 65,808,957 $ — $ 65,808,957 $ — __________ __________ __________ _________ __________ __________ __________ _________ Investment transactions The aggregate cost of purchases of investment securities and proceeds from sales of investment securities (other than temporary cash investments) totaled $34,492,558 and $38,352,547, respectively, for the year ended December 31, 2015. Interest income Interest income as reported in the accompanying statement of operations is net of amortization of bond discounts/premiums of $250,786 and mortgage-backed securities paydown losses of $70,347.
215
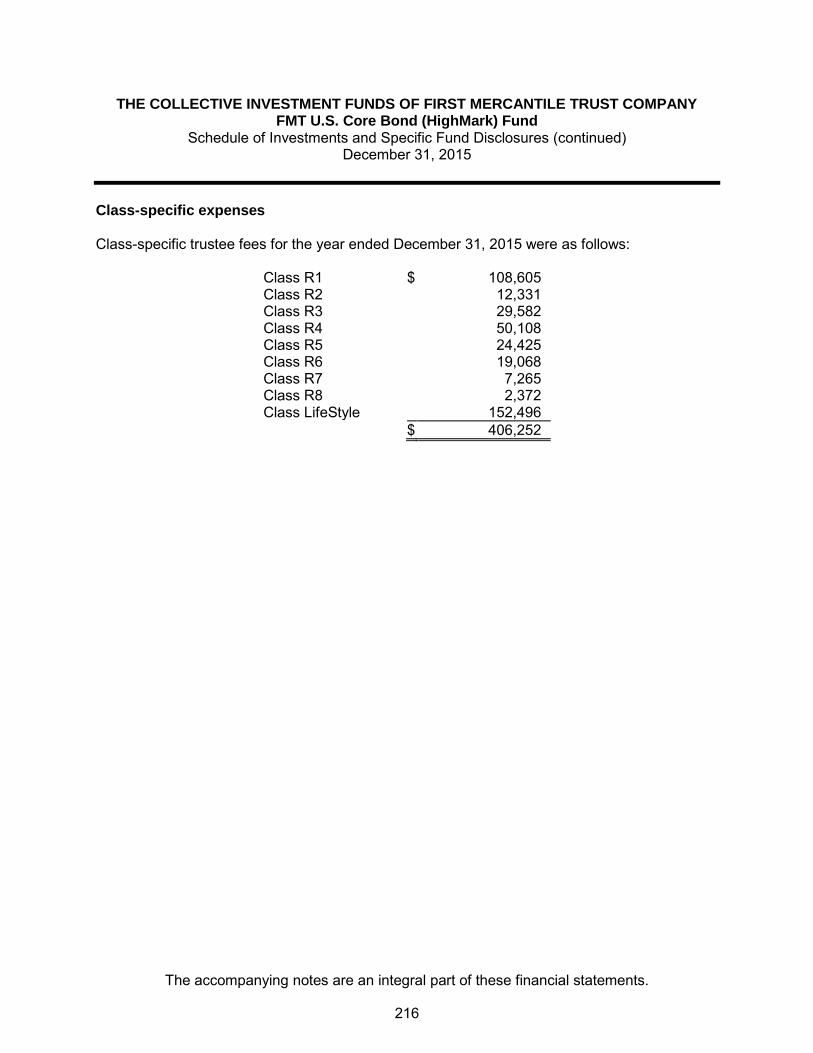
THE COLLECTIVE INVESTMENT FUNDS OF FIRST MERCANTILE TRUST COMPANY FMT U.S. Core Bond (HighMark) Fund
Schedule of Investments and Specific Fund Disclosures (continued) December 31, 2015
The accompanying notes are an integral part of these financial statements.
Class-specific expenses Class-specific trustee fees for the year ended December 31, 2015 were as follows: Class R1 $ 108,605 Class R2 12,331 Class R3 29,582 Class R4 50,108 Class R5 24,425 Class R6 19,068 Class R7 7,265 Class R8 2,372 Class LifeStyle 152,496 $ 406,252
216

THE COLLECTIVE INVESTMENT FUNDS OF FIRST MERCANTILE TRUST COMPANY FMT U.S. Core Bond (HighMark) Fund
Schedule of Participant Transactions December 31, 2015
The accompanying notes are an integral part of these financial statements.
Participant transactions by class for the year ended December 31, 2015 were as follows: Dollars Units Purchases Redemptions Net change Purchases Redemptions Net change Class R1 $ 12,905,121 $ (6,461,867) $ 6,443,254 858,834 (431,633) 427,201 Class R2 963,259 (3,032,444) (2,069,185) 88,230 (279,710) (191,480) Class R3 3,218,003 (4,063,130) (845,127) 298,185 (375,931) (77,746) Class R4 3,287,468 (2,965,893) 321,575 302,482 (272,774) 29,708 Class R5 416,594 (2,352,226) (1,935,632) 38,688 (217,834) (179,146) Class R6 683,286 (1,274,836) (591,550) 63,357 (119,441) (56,084) Class R7 312,074 (746,845) (434,771) 29,376 (70,298) (40,922) Class R8 29,395 (12,516) 16,879 2,791 (1,180) 1,611 Class LifeStyle 5,665,684 (11,673,895) (6,008,211) — — — $ 27,480,884 $ (32,583,652) $ (5,102,768) 1,681,943 (1,768,801) (86,858)
217

THE COLLECTIVE INVESTMENT FUNDS OF FIRST MERCANTILE TRUST COMPANY FMT U.S. Core Bond (HighMark) Fund
Financial Highlights December 31, 2015
The accompanying notes are an integral part of these financial statements.
Change in Net Asset Value Resulting from Operations Ratios (to average net
assets)
NAV per Unit, Beginning of
Period
Net Investment
Income (Loss)(a)
Net Realized and Unrealized
Gain (Loss) from
Investments(a)
Total from Investment Activities
NAV per Unit, End of
Period Total
Return Expenses
Net Investment
Income (Loss)
Class R1 $ 14.8424 $ 0.3017 $ (0.3054) $ (0.0037) $ 14.8387 (0.02) % (0.53) % 2.02 % Class R2 10.8185 0.1915 (0.2179) (0.0264) 10.7921 (0.24) % (0.75) % 1.76 % Class R3 10.7615 0.1750 (0.2195) (0.0445) 10.7170 (0.41) % (0.92) % 1.62 % Class R4 10.7799 0.1575 (0.2203) (0.0628) 10.7171 (0.58) % (1.09) % 1.45 % Class R5 10.7461 0.1368 (0.2175) (0.0807) 10.6654 (0.75) % (1.26) % 1.27 % Class R6 10.6827 0.1172 (0.2154) (0.0982) 10.5845 (0.92) % (1.43) % 1.09 % Class R7 10.5561 0.0988 (0.2135) (0.1147) 10.4414 (1.09) % (1.60) % 0.93 % Class R8 10.5366 0.0921 (0.2243) (0.1322) 10.4044 (1.25) % (1.77) % 0.87 % (a) Per unit amounts are based on average daily units outstanding.
218

FMT U.S. Government Securities (C.S. McKee) Fund
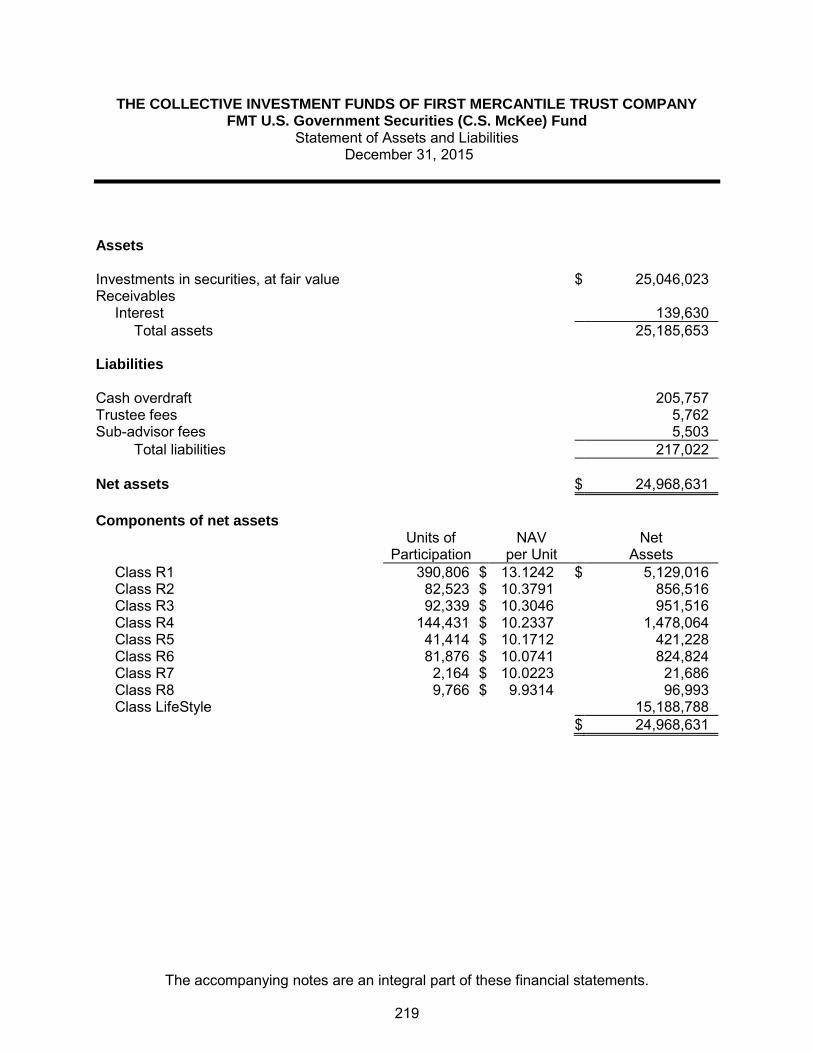
THE COLLECTIVE INVESTMENT FUNDS OF FIRST MERCANTILE TRUST COMPANY FMT U.S. Government Securities (C.S. McKee) Fund
Statement of Assets and Liabilities December 31, 2015
The accompanying notes are an integral part of these financial statements.
Assets Investments in securities, at fair value $ 25,046,023 Receivables
Interest 139,630
Total assets 25,185,653
Liabilities Cash overdraft 205,757
Trustee fees 5,762
Sub-advisor fees 5,503
Total liabilities 217,022
Net assets $ 24,968,631
Components of net assets
Units of
Participation NAV
per Unit Net
Assets Class R1 390,806 $ 13.1242 $ 5,129,016
Class R2 82,523 $ 10.3791 856,516
Class R3 92,339 $ 10.3046 951,516
Class R4 144,431 $ 10.2337 1,478,064
Class R5 41,414 $ 10.1712 421,228
Class R6 81,876 $ 10.0741 824,824
Class R7 2,164 $ 10.0223 21,686
Class R8 9,766 $ 9.9314 96,993
Class LifeStyle 15,188,788
$ 24,968,631
219

THE COLLECTIVE INVESTMENT FUNDS OF FIRST MERCANTILE TRUST COMPANY FMT U.S. Government Securities (C.S. McKee) Fund
Statement of Operations For the Year Ended December 31, 2015
The accompanying notes are an integral part of these financial statements.
Investment income
Interest, net $ 537,634
Expenses
Trustee fees 170,495
Sub-advisor fees 70,270
Custody fees 12,192
Audit fees 5,725
258,682
Net investment income 278,952
Net realized gain from investments sold
Proceeds from sales of investments 77,874,360
Cost of investments sold 77,492,390
Net realized gain from investments sold 381,970
Change in net unrealized appreciation (depreciation) on investments (177,589)
Net realized and unrealized gain on investments 204,381
Other operating credits (charges) (177)
Net increase in net assets resulting from operations $ 483,156
220

THE COLLECTIVE INVESTMENT FUNDS OF FIRST MERCANTILE TRUST COMPANY FMT U.S. Government Securities (C.S. McKee) Fund
Statement of Changes in Net Assets For the Year Ended December 31, 2015
The accompanying notes are an integral part of these financial statements.
Operations
Net investment income $ 278,952
Net realized gain from investments sold 381,970
Change in net unrealized appreciation (depreciation) on investments (177,589)
Other operating credits (charges) (177)
Net increase in net assets resulting from operations 483,156
Participant transactions
Proceeds from units purchased 7,508,967
Less payments for units redeemed 13,589,963
Decrease in net assets from participant transactions (6,080,996)
Total decrease in net assets (5,597,840)
Net assets at beginning of year 30,566,471
Net assets at end of year $ 24,968,631
221
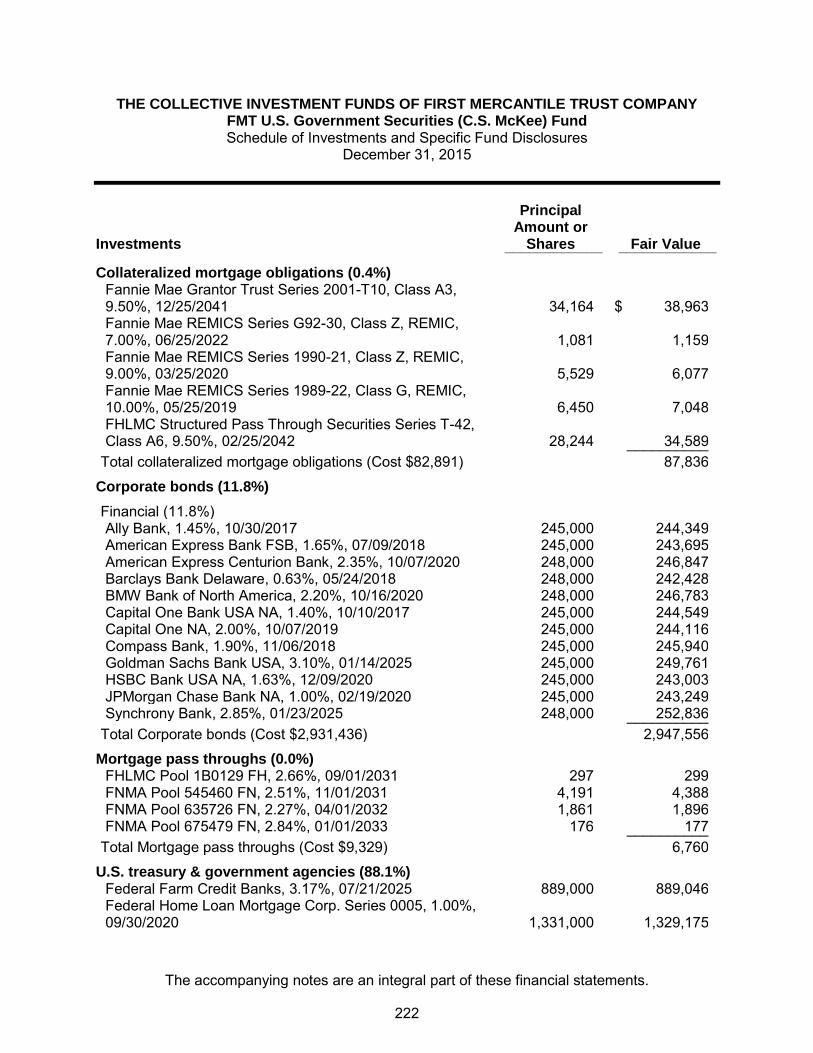
THE COLLECTIVE INVESTMENT FUNDS OF FIRST MERCANTILE TRUST COMPANY FMT U.S. Government Securities (C.S. McKee) Fund Schedule of Investments and Specific Fund Disclosures
December 31, 2015
The accompanying notes are an integral part of these financial statements.
Investments
Principal Amount or
Shares Fair Value ____________ ____________
Collateralized mortgage obligations (0.4%)
Fannie Mae Grantor Trust Series 2001-T10, Class A3, 9.50%, 12/25/2041 34,164 $ 38,963
Fannie Mae REMICS Series G92-30, Class Z, REMIC, 7.00%, 06/25/2022 1,081 1,159
Fannie Mae REMICS Series 1990-21, Class Z, REMIC, 9.00%, 03/25/2020 5,529 6,077
Fannie Mae REMICS Series 1989-22, Class G, REMIC, 10.00%, 05/25/2019 6,450 7,048
FHLMC Structured Pass Through Securities Series T-42, Class A6, 9.50%, 02/25/2042 28,244 34,589 __________
Total collateralized mortgage obligations (Cost $82,891) 87,836
Corporate bonds (11.8%)
Financial (11.8%) Ally Bank, 1.45%, 10/30/2017 245,000 244,349 American Express Bank FSB, 1.65%, 07/09/2018 245,000 243,695 American Express Centurion Bank, 2.35%, 10/07/2020 248,000 246,847 Barclays Bank Delaware, 0.63%, 05/24/2018 248,000 242,428 BMW Bank of North America, 2.20%, 10/16/2020 248,000 246,783 Capital One Bank USA NA, 1.40%, 10/10/2017 245,000 244,549 Capital One NA, 2.00%, 10/07/2019 245,000 244,116 Compass Bank, 1.90%, 11/06/2018 245,000 245,940 Goldman Sachs Bank USA, 3.10%, 01/14/2025 245,000 249,761 HSBC Bank USA NA, 1.63%, 12/09/2020 245,000 243,003 JPMorgan Chase Bank NA, 1.00%, 02/19/2020 245,000 243,249 Synchrony Bank, 2.85%, 01/23/2025 248,000 252,836 __________ Total Corporate bonds (Cost $2,931,436) 2,947,556
Mortgage pass throughs (0.0%) FHLMC Pool 1B0129 FH, 2.66%, 09/01/2031 297 299 FNMA Pool 545460 FN, 2.51%, 11/01/2031 4,191 4,388 FNMA Pool 635726 FN, 2.27%, 04/01/2032 1,861 1,896 FNMA Pool 675479 FN, 2.84%, 01/01/2033 176 177 __________ Total Mortgage pass throughs (Cost $9,329) 6,760
U.S. treasury & government agencies (88.1%) Federal Farm Credit Banks, 3.17%, 07/21/2025 889,000 889,046
Federal Home Loan Mortgage Corp. Series 0005, 1.00%, 09/30/2020 1,331,000 1,329,175
222

THE COLLECTIVE INVESTMENT FUNDS OF FIRST MERCANTILE TRUST COMPANY FMT U.S. Government Securities (C.S. McKee) Fund
Schedule of Investments and Specific Fund Disclosures (continued) December 31, 2015
The accompanying notes are an integral part of these financial statements.
Investments
Principal Amount or
Shares Fair Value ____________ ____________
U.S. treasury & government agencies (continued)
Federal Home Loan Mortgage Corp. Series 0002, 1.00%, 11/25/2020 600,000 $ 599,085
Federal Home Loan Mortgage Corp., 1.25%, 10/02/2019 248,000 244,619 Federal Home Loan Mortgage Corp. Series 0001, 1.25%, 05/27/2020 899,000 898,851
Federal National Mortgage Association, 6.00%, 04/18/2036 1,239,000 1,257,985
Federal National Mortgage Association, 6.21%, 06/05/2036 1,150,000 1,232,794
U.S. Treasury Bond, 3.00%, 05/15/2045 1,295,000 1,289,082 U.S. Treasury Bond, 4.50%, 02/15/2036 1,192,000 1,527,622
U.S. Treasury Inflation Protected Security, 0.13%, 04/15/2016 270,458 269,405
U.S. Treasury Inflation Protected Security, 0.13%, 04/15/2018 635,860 634,635
U.S. Treasury Note, 1.38%, 08/31/2020 1,951,000 1,919,753 U.S. Treasury Note, 1.50%, 12/31/2018 1,564,000 1,571,086 U.S. Treasury Note, 2.00%, 05/31/2021 2,551,000 2,568,240 U.S. Treasury Note, 2.25%, 11/30/2017 1,063,000 1,086,502 U.S. Treasury Note, 2.38%, 08/15/2024 1,837,000 1,856,160 U.S. Treasury Note, 2.50%, 08/15/2023 2,511,000 2,576,228 U.S. Treasury Note, 2.75%, 11/15/2023 243,000 253,603 __________
Total U.S. treasury & government agencies (Cost $21,999,634) 22,003,871 __________
Total Investments (Cost $25,023,290) $ 25,046,023 __________ __________
223

THE COLLECTIVE INVESTMENT FUNDS OF FIRST MERCANTILE TRUST COMPANY FMT U.S. Government Securities (C.S. McKee) Fund
Schedule of Investments and Specific Fund Disclosures (continued) December 31, 2015
The accompanying notes are an integral part of these financial statements.
Specific Fund Disclosures Fair value The inputs or methodology used for valuing securities may not be indicative of the risks associated with investing in those securities. For more information on valuation inputs, and their aggregation into the levels used in the table below, please refer to note 4 to the financial statements. The following table sets forth by level, within the fair value hierarchy, the Fund's investments measured at fair value.
Total Level 1 Level 2 Level 3
Collateralized mortgage obligations $ 87,836 $ — $ 87,836 $ — Corporate bonds 2,947,556 — 2,947,556 — Mortgage pass throughs 6,760 — 6,760 — U.S. treasury & government agencies 22,003,871 — 22,003,871 — __________ __________ __________ _________
$ 25,046,023 $ — $ 25,046,023 $ — __________ __________ __________ _________ __________ __________ __________ _________ Investment transactions The aggregate cost of purchases of investment securities and proceeds from sales of investment securities (other than temporary cash investments) totaled $72,583,371 and $77,874,360 respectively, for the year ended December 31, 2015. Interest income Interest income as reported in the accompanying statement of operations is net of amortization of bond discounts/premiums of $142,457 and mortgage-backed securities paydown losses of $1,651.
224

THE COLLECTIVE INVESTMENT FUNDS OF FIRST MERCANTILE TRUST COMPANY FMT U.S. Government Securities (C.S. McKee) Fund
Schedule of Investments and Specific Fund Disclosures (continued) December 31, 2015
The accompanying notes are an integral part of these financial statements.
Class-specific expenses Class-specific trustee fees for the year ended December 31, 2015 were as follows: Class R1 $ 17,520 Class R2 7,099 Class R3 6,879 Class R4 11,673 Class R5 11,426 Class R6 9,331 Class R7 418 Class R8 1,153 Class LifeStyle 104,996 $ 170,495
225

THE COLLECTIVE INVESTMENT FUNDS OF FIRST MERCANTILE TRUST COMPANY FMT U.S. Government Securities (C.S. McKee) Fund
Schedule of Participant Transactions December 31, 2015
The accompanying notes are an integral part of these financial statements.
Participant transactions by class for the year ended December 31, 2015 were as follows: Dollars Units Purchases Redemptions Net change Purchases Redemptions Net change Class R1 $ 1,198,386 $ (1,038,909) $ 159,477 91,603 (79,173) 12,430 Class R2 86,163 (988,546) (902,383) 8,357 (95,109) (86,752) Class R3 118,793 (85,021) 33,772 11,516 (8,265) 3,251 Class R4 874,871 (512,234) 362,637 85,611 (50,209) 35,402 Class R5 784,304 (1,824,522) (1,040,218) 76,994 (179,872) (102,878) Class R6 162,369 (31,827) 130,542 16,090 (3,152) 12,938 Class R7 5,594 (140,745) (135,151) 557 (13,947) (13,390) Class R8 44,044 (6,038) 38,006 4,420 (605) 3,815 Class LifeStyle 4,234,443 (8,962,121) (4,727,678) — — — $ 7,508,967 $ (13,589,963) $ (6,080,996) 295,148 (430,332) (135,184)
226

THE COLLECTIVE INVESTMENT FUNDS OF FIRST MERCANTILE TRUST COMPANY FMT U.S. Government Securities (C.S. McKee) Fund
Financial Highlights December 31, 2015
The accompanying notes are an integral part of these financial statements.
Change in Net Asset Value Resulting from Operations Ratios (to average net
assets)
NAV per Unit, Beginning of
Period
Net Investment
Income (Loss)(a)
Net Realized and Unrealized
Gain (Loss) from
Investments(a)
Total from Investment Activities
NAV per Unit, End of
Period Total
Return Expenses
Net Investment
Income (Loss)
Class R1 $ 12.8839 $ 0.1629 $ 0.0774 $ 0.2403 $ 13.1242 1.87 % (0.66) % 1.24 % Class R2 10.2114 0.1073 0.0604 0.1677 10.3791 1.64 % (0.89) % 1.04 % Class R3 10.1554 0.0881 0.0611 0.1492 10.3046 1.47 % (1.05) % 0.86 % Class R4 10.1026 0.0697 0.0614 0.1311 10.2337 1.30 % (1.22) % 0.68 % Class R5 10.0580 0.0531 0.0601 0.1132 10.1712 1.13 % (1.39) % 0.52 % Class R6 9.9788 0.0340 0.0613 0.0953 10.0741 0.96 % (1.56) % 0.34 % Class R7 9.9438 0.0184 0.0601 0.0785 10.0223 0.79 % (1.74) % 0.18 % Class R8 9.8709 (0.0005) 0.0610 0.0605 9.9314 0.61 % (1.90) % (0.01) % (a) Per unit amounts are based on average daily units outstanding.
227
FMT/American Funds Bond Fund of America Fund

THE COLLECTIVE INVESTMENT FUNDS OF FIRST MERCANTILE TRUST COMPANY FMT/American Funds Bond Fund of America Fund
Statement of Assets and Liabilities December 31, 2015
The accompanying notes are an integral part of these financial statements.
Assets Investments in securities, at fair value $ 5,758,561 Receivables
Dividends 14,509
Total assets 5,773,070
Liabilities Trustee fees 2,320
Net assets $ 5,770,750
Components of net assets
Units of
Participation NAV
per Unit Net
Assets Class R1 386,131 $ 11.6321 $ 4,491,506
Class R2 14,331 $ 10.8227 155,102
Class R3 23,826 $ 10.7677 256,549
Class R4 52,800 $ 10.5632 557,738
Class R5 23,802 $ 10.4844 249,552
Class R6 4,805 $ 10.5216 50,558
Class R7 156 $ 10.2825 1,607
Class R8 783 $ 10.3962 8,138
$ 5,770,750
228

THE COLLECTIVE INVESTMENT FUNDS OF FIRST MERCANTILE TRUST COMPANY FMT/American Funds Bond Fund of America Fund
Statement of Operations For the Year Ended December 31, 2015
The accompanying notes are an integral part of these financial statements.
Investment income
Dividends $ 161,415
Expenses
Trustee fees 34,484
Custody fees 2,487
Audit fees 1,200
38,171
Net investment income 123,244
Net realized gain from investments sold
Proceeds from sales of investments 4,065,907
Cost of investments sold 4,021,198
Net realized gain from investments sold 44,709
Change in net unrealized appreciation (depreciation) on investments (163,015)
Net realized and unrealized loss on investments (118,306)
Net increase in net assets resulting from operations $ 4,938
229

THE COLLECTIVE INVESTMENT FUNDS OF FIRST MERCANTILE TRUST COMPANY FMT/American Funds Bond Fund of America Fund
Statement of Changes in Net Assets For the Year Ended December 31, 2015
The accompanying notes are an integral part of these financial statements.
Operations
Net investment income $ 123,244
Net realized gain from investments sold 44,709
Change in net unrealized appreciation (depreciation) on investments (163,015)
Net increase in net assets resulting from operations 4,938
Participant transactions
Proceeds from units purchased 3,969,654
Less payments for units redeemed 5,543,220
Decrease in net assets from participant transactions (1,573,566)
Total decrease in net assets (1,568,628)
Net assets at beginning of year 7,339,378
Net assets at end of year $ 5,770,750
230
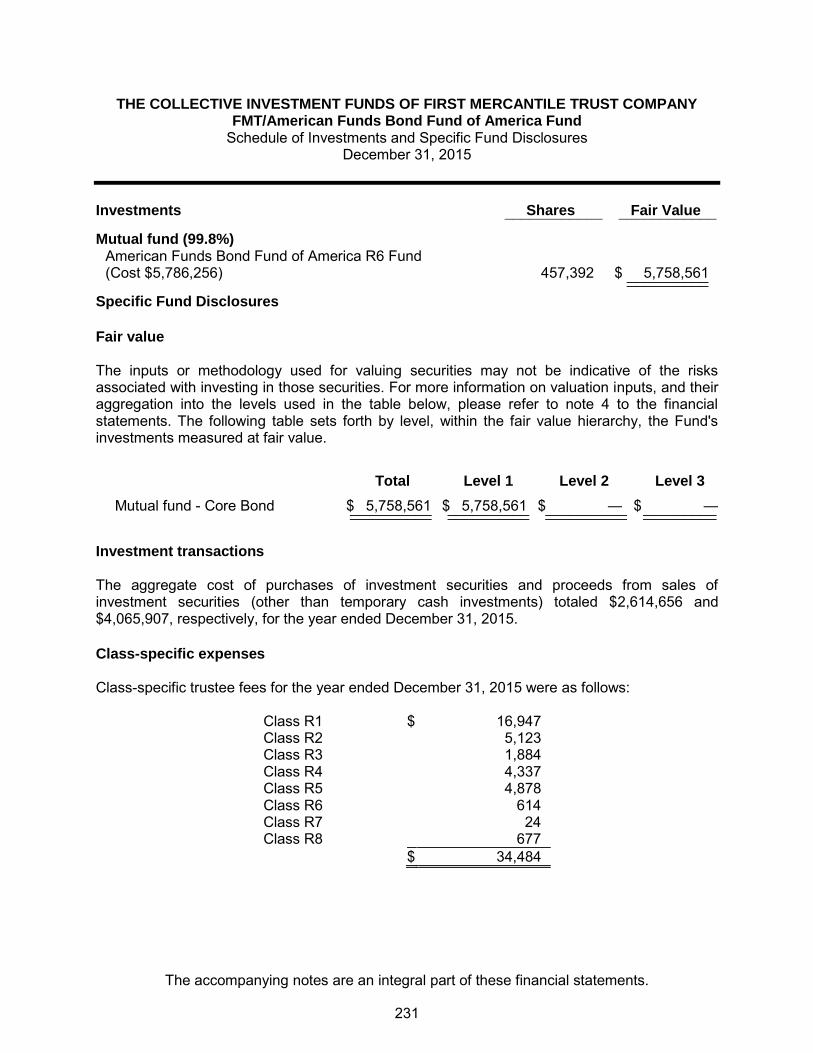
THE COLLECTIVE INVESTMENT FUNDS OF FIRST MERCANTILE TRUST COMPANY FMT/American Funds Bond Fund of America Fund
Schedule of Investments and Specific Fund Disclosures December 31, 2015
The accompanying notes are an integral part of these financial statements.
Investments Shares Fair Value ____________ ____________
Mutual fund (99.8%)
American Funds Bond Fund of America R6 Fund (Cost $5,786,256) 457,392 $ 5,758,561 __________ __________
Specific Fund Disclosures Fair value The inputs or methodology used for valuing securities may not be indicative of the risks associated with investing in those securities. For more information on valuation inputs, and their aggregation into the levels used in the table below, please refer to note 4 to the financial statements. The following table sets forth by level, within the fair value hierarchy, the Fund's investments measured at fair value.
Total Level 1 Level 2 Level 3
Mutual fund - Core Bond $ 5,758,561 $ 5,758,561 $ — $ — __________ __________ __________ _________ __________ __________ __________ _________ Investment transactions The aggregate cost of purchases of investment securities and proceeds from sales of investment securities (other than temporary cash investments) totaled $2,614,656 and $4,065,907, respectively, for the year ended December 31, 2015. Class-specific expenses Class-specific trustee fees for the year ended December 31, 2015 were as follows: Class R1 $ 16,947 Class R2 5,123 Class R3 1,884 Class R4 4,337 Class R5 4,878 Class R6 614 Class R7 24 Class R8 677 $ 34,484
231
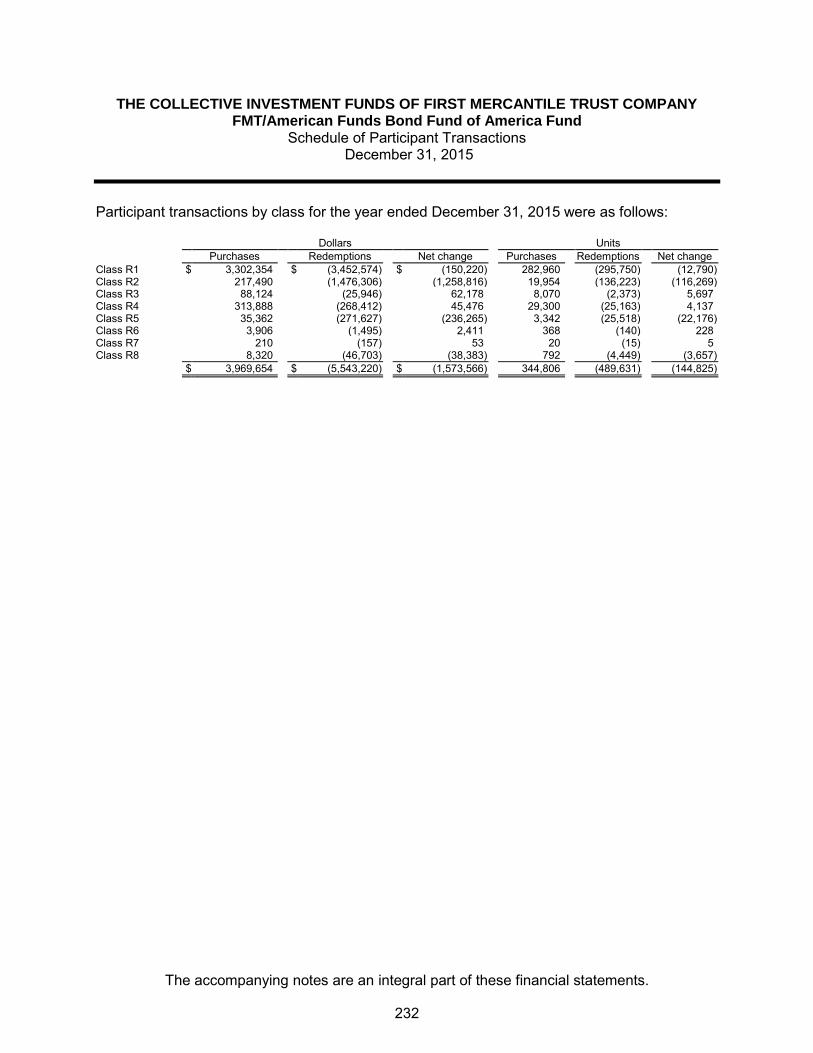
THE COLLECTIVE INVESTMENT FUNDS OF FIRST MERCANTILE TRUST COMPANY FMT/American Funds Bond Fund of America Fund
Schedule of Participant Transactions December 31, 2015
The accompanying notes are an integral part of these financial statements.
Participant transactions by class for the year ended December 31, 2015 were as follows: Dollars Units Purchases Redemptions Net change Purchases Redemptions Net change Class R1 $ 3,302,354 $ (3,452,574) $ (150,220) 282,960 (295,750) (12,790) Class R2 217,490 (1,476,306) (1,258,816) 19,954 (136,223) (116,269) Class R3 88,124 (25,946) 62,178 8,070 (2,373) 5,697 Class R4 313,888 (268,412) 45,476 29,300 (25,163) 4,137 Class R5 35,362 (271,627) (236,265) 3,342 (25,518) (22,176) Class R6 3,906 (1,495) 2,411 368 (140) 228 Class R7 210 (157) 53 20 (15) 5 Class R8 8,320 (46,703) (38,383) 792 (4,449) (3,657) $ 3,969,654 $ (5,543,220) $ (1,573,566) 344,806 (489,631) (144,825)
232

THE COLLECTIVE INVESTMENT FUNDS OF FIRST MERCANTILE TRUST COMPANY FMT/American Funds Bond Fund of America Fund
Financial Highlights December 31, 2015
The accompanying notes are an integral part of these financial statements.
Change in Net Asset Value Resulting from Operations Ratios (to average net
assets)
NAV per Unit, Beginning of
Period
Net Investment
Income (Loss)(a)
Net Realized and Unrealized
Gain (Loss) from
Investments(a)
Total from Investment Activities
NAV per Unit, End of
Period Total
Return Expenses
Net Investment
Income (Loss)
Class R1 $ 11.6118 $ 0.2231 $ (0.2028) $ 0.0203 $ 11.6321 0.17 % (0.40) % 1.91 % Class R2 10.8275 0.1772 (0.1820) (0.0048) 10.8227 (0.04) % (0.61) % 1.62 % Class R3 10.7909 0.1652 (0.1884) (0.0232) 10.7677 (0.22) % (0.80) % 1.52 % Class R4 10.6039 0.1456 (0.1863) (0.0407) 10.5632 (0.38) % (0.97) % 1.37 % Class R5 10.5428 0.1213 (0.1797) (0.0584) 10.4844 (0.55) % (1.13) % 1.15 % Class R6 10.5980 0.1076 (0.1840) (0.0764) 10.5216 (0.72) % (1.31) % 1.01 % Class R7 10.3801 0.0881 (0.1857) (0.0976) 10.2825 (0.94) % (1.52) % 0.85 % Class R8 10.5071 0.0665 (0.1774) (0.1109) 10.3962 (1.06) % (1.64) % 0.63 % (a) Per unit amounts are based on average daily units outstanding.
233

FMT/Delaware High Yield Opportunity Fund

THE COLLECTIVE INVESTMENT FUNDS OF FIRST MERCANTILE TRUST COMPANY FMT/Delaware High Yield Opportunity Fund
Statement of Assets and Liabilities December 31, 2015
The accompanying notes are an integral part of these financial statements.
Assets Investments in securities, at fair value $ 3,755,345 Receivables
Dividends 6,402
Total assets 3,761,747
Liabilities Trustee fees 1,622
Net assets $ 3,760,125
Components of net assets
Units of
Participation NAV
per Unit Net
Assets Class R1 199,169 $ 14.5219 $ 2,892,314
Class R2 3,820 $ 11.6115 44,356
Class R3 9,367 $ 11.2519 105,391
Class R4 31,192 $ 11.3490 353,997
Class R5 21,767 $ 11.6687 253,993
Class R6 5,851 $ 11.2585 65,876
Class R7 3,288 $ 11.5322 37,918
Class R8 583 $ 10.7692 6,280
$ 3,760,125
234

THE COLLECTIVE INVESTMENT FUNDS OF FIRST MERCANTILE TRUST COMPANY FMT/Delaware High Yield Opportunity Fund
Statement of Operations For the Year Ended December 31, 2015
The accompanying notes are an integral part of these financial statements.
Investment income
Dividends $ 295,052
Expenses
Trustee fees 24,185
Custody fees 1,792
Audit fees 1,200
27,177
Net investment income 267,875
Net realized loss from investments sold
Proceeds from sales of investments 2,017,797
Cost of investments sold 2,198,094
Net realized loss from investments sold (180,297)
Change in net unrealized appreciation (depreciation) on investments (396,204)
Net realized and unrealized loss on investments (576,501)
Other operating credits (charges) 21,159
Net decrease in net assets resulting from operations $ (287,467)
235

THE COLLECTIVE INVESTMENT FUNDS OF FIRST MERCANTILE TRUST COMPANY FMT/Delaware High Yield Opportunity Fund
Statement of Changes in Net Assets For the Year Ended December 31, 2015
The accompanying notes are an integral part of these financial statements.
Operations
Net investment income $ 267,875
Net realized loss from investments sold (180,297)
Change in net unrealized appreciation (depreciation) on investments (396,204)
Other operating credits (charges) 21,159
Net decrease in net assets resulting from operations (287,467)
Participant transactions
Proceeds from units purchased 1,897,070
Less payments for units redeemed 3,313,560
Decrease in net assets from participant transactions (1,416,490)
Total decrease in net assets (1,703,957)
Net assets at beginning of year 5,464,082
Net assets at end of year $ 3,760,125
236

THE COLLECTIVE INVESTMENT FUNDS OF FIRST MERCANTILE TRUST COMPANY FMT/Delaware High Yield Opportunity Fund
Schedule of Investments and Specific Fund Disclosures December 31, 2015
The accompanying notes are an integral part of these financial statements.
Investments Shares Fair Value ____________ ____________
Mutual fund (99.9%)
Delaware High Yield Opportunities A Fund (Cost $4,379,406) 1,060,832 $ 3,755,345 __________ __________
Specific Fund Disclosures Fair value The inputs or methodology used for valuing securities may not be indicative of the risks associated with investing in those securities. For more information on valuation inputs, and their aggregation into the levels used in the table below, please refer to note 4 to the financial statements. The following table sets forth by level, within the fair value hierarchy, the Fund's investments measured at fair value.
Total Level 1 Level 2 Level 3
Mutual fund - High Yield Bond $ 3,755,345 $ 3,755,345 $ — $ — __________ __________ __________ _________ __________ __________ __________ _________ Investment transactions The aggregate cost of purchases of investment securities and proceeds from sales of investment securities (other than temporary cash investments) totaled $890,604 and $2,017,796, respectively, for the year ended December 31, 2015. Class-specific expenses Class-specific trustee fees for the year ended December 31, 2015 were as follows: Class R1 $ 12,401 Class R2 2,365 Class R3 1,069 Class R4 2,940 Class R5 3,908 Class R6 912 Class R7 353 Class R8 237 $ 24,185
237

THE COLLECTIVE INVESTMENT FUNDS OF FIRST MERCANTILE TRUST COMPANY FMT/Delaware High Yield Opportunity Fund
Schedule of Participant Transactions December 31, 2015
The accompanying notes are an integral part of these financial statements.
Participant transactions by class for the year ended December 31, 2015 were as follows: Dollars Units Purchases Redemptions Net change Purchases Redemptions Net change Class R1 $ 1,133,706 $ (1,725,823) $ (592,117) 72,520 (112,251) (39,731) Class R2 129,005 (868,522) (739,517) 10,209 (68,842) (58,633) Class R3 39,054 (108,304) (69,250) 3,214 (8,735) (5,521) Class R4 407,052 (143,143) 263,909 32,458 (11,880) 20,578 Class R5 131,517 (326,097) (194,580) 10,442 (25,058) (14,616) Class R6 9,413 (14,113) (4,700) 774 (1,138) (364) Class R7 39,897 (1,122) 38,775 3,227 (91) 3,136 Class R8 7,426 (126,436) (119,010) 638 (10,908) (10,270) $ 1,897,070 $ (3,313,560) $ (1,416,490) 133,482 (238,903) (105,421)
238

THE COLLECTIVE INVESTMENT FUNDS OF FIRST MERCANTILE TRUST COMPANY FMT/Delaware High Yield Opportunity Fund
Financial Highlights December 31, 2015
The accompanying notes are an integral part of these financial statements.
Change in Net Asset Value Resulting from Operations Ratios (to average net
assets)
NAV per Unit, Beginning of
Period
Net Investment
Income (Loss)(a)
Net Realized and Unrealized
Gain (Loss) from
Investments(a)
Total from Investment Activities
NAV per Unit, End of
Period Total
Return Expenses
Net Investment
Income (Loss)
Class R1 $ 15.5473 $ 0.9419 $ (1.9673) $ (1.0254) $ 14.5219 (6.60) % (0.41) % 6.05 % Class R2 12.4588 0.7298 (1.5771) (0.8473) 11.6115 (6.80) % (0.61) % 5.75 % Class R3 12.0935 0.6810 (1.5226) (0.8416) 11.2519 (6.96) % (0.80) % 5.60 % Class R4 12.2187 0.6700 (1.5397) (0.8697) 11.3490 (7.12) % (0.99) % 5.51 % Class R5 12.5843 0.6716 (1.5872) (0.9156) 11.6687 (7.28) % (1.14) % 5.32 % Class R6 12.1625 0.6256 (1.5296) (0.9040) 11.2585 (7.43) % (1.31) % 5.15 % Class R7 12.4802 0.6234 (1.5714) (0.9480) 11.5322 (7.60) % (1.49) % 5.03 % Class R8 11.6730 0.5532 (1.4570) (0.9038) 10.7692 (7.74) % (1.65) % 4.75 % (a) Per unit amounts are based on average daily units outstanding.
239

FMT/DFA 1 Year Fixed Income Fund

THE COLLECTIVE INVESTMENT FUNDS OF FIRST MERCANTILE TRUST COMPANY FMT/DFA 1 Year Fixed Income Fund
Statement of Assets and Liabilities December 31, 2015
The accompanying notes are an integral part of these financial statements.
Assets Investments in securities, at fair value $ 54,627,301 Liabilities Trustee fees 23,568
Net assets $ 54,603,733
Components of net assets
Units of
Participation NAV
per Unit Net
Assets Class R1 807,239 $ 10.0320 $ 8,098,251
Class R2 533,838 $ 9.9379 5,305,229
Class R3 800,013 $ 9.8688 7,895,155
Class R4 703,362 $ 9.8096 6,899,676
Class R5 168,287 $ 9.7365 1,638,521
Class R6 400,606 $ 9.6709 3,874,232
Class R7 131,876 $ 9.5993 1,265,915
Class R8 89,888 $ 9.5349 857,078
Class LifeStyle 18,769,676
$ 54,603,733
240

THE COLLECTIVE INVESTMENT FUNDS OF FIRST MERCANTILE TRUST COMPANY FMT/DFA 1 Year Fixed Income Fund
Statement of Operations For the Year Ended December 31, 2015
The accompanying notes are an integral part of these financial statements.
Investment income
Dividends $ 289,326
Expenses
Trustee fees 409,494
Custody fees 21,281
Audit fees 1,795
432,570
Net investment loss (143,244)
Net realized loss from investments sold
Proceeds from sales of investments 21,185,181
Cost of investments sold 21,214,747
Net realized loss from investments sold (29,566)
Change in net unrealized appreciation (depreciation) on investments (56,393)
Net realized and unrealized loss on investments (85,959)
Other operating credits (charges) 674
Net decrease in net assets resulting from operations $ (228,529)
241

THE COLLECTIVE INVESTMENT FUNDS OF FIRST MERCANTILE TRUST COMPANY FMT/DFA 1 Year Fixed Income Fund Statement of Changes in Net Assets
For the Year Ended December 31, 2015
The accompanying notes are an integral part of these financial statements.
Operations
Net investment loss $ (143,244)
Net realized loss from investments sold (29,566)
Change in net unrealized appreciation (depreciation) on investments (56,393)
Other operating credits (charges) 674
Net decrease in net assets resulting from operations (228,529)
Participant transactions
Proceeds from units purchased 19,476,640
Less payments for units redeemed 32,802,218
Decrease in net assets from participant transactions (13,325,578)
Total decrease in net assets (13,554,107)
Net assets at beginning of year 68,157,840
Net assets at end of year $ 54,603,733
242
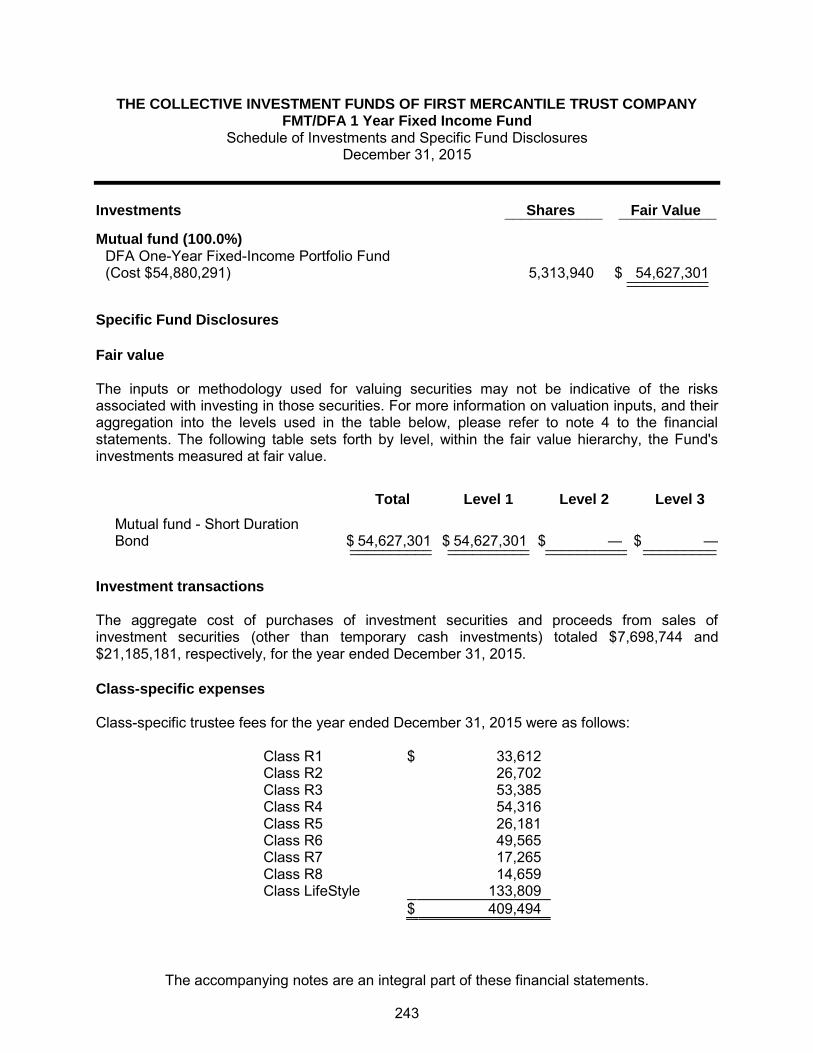
THE COLLECTIVE INVESTMENT FUNDS OF FIRST MERCANTILE TRUST COMPANY FMT/DFA 1 Year Fixed Income Fund
Schedule of Investments and Specific Fund Disclosures December 31, 2015
The accompanying notes are an integral part of these financial statements.
Investments Shares Fair Value ____________ ____________
Mutual fund (100.0%)
DFA One-Year Fixed-Income Portfolio Fund (Cost $54,880,291) 5,313,940 $ 54,627,301 __________ __________
Specific Fund Disclosures Fair value The inputs or methodology used for valuing securities may not be indicative of the risks associated with investing in those securities. For more information on valuation inputs, and their aggregation into the levels used in the table below, please refer to note 4 to the financial statements. The following table sets forth by level, within the fair value hierarchy, the Fund's investments measured at fair value.
Total Level 1 Level 2 Level 3
Mutual fund - Short Duration Bond $ 54,627,301 $ 54,627,301 $ — $ — __________ __________ __________ _________ __________ __________ __________ _________
Investment transactions The aggregate cost of purchases of investment securities and proceeds from sales of investment securities (other than temporary cash investments) totaled $7,698,744 and $21,185,181, respectively, for the year ended December 31, 2015. Class-specific expenses Class-specific trustee fees for the year ended December 31, 2015 were as follows: Class R1 $ 33,612 Class R2 26,702 Class R3 53,385 Class R4 54,316 Class R5 26,181 Class R6 49,565 Class R7 17,265 Class R8 14,659 Class LifeStyle 133,809 $ 409,494
243

THE COLLECTIVE INVESTMENT FUNDS OF FIRST MERCANTILE TRUST COMPANY FMT/DFA 1 Year Fixed Income Fund Schedule of Participant Transactions
December 31, 2015
The accompanying notes are an integral part of these financial statements.
Participant transactions by class for the year ended December 31, 2015 were as follows: Dollars Units Purchases Redemptions Net change Purchases Redemptions Net change Class R1 $ 2,020,169 $ (8,848,046) $ (6,827,877) 200,932 (880,460) (679,528) Class R2 1,627,089 (412,434) 1,214,655 163,225 (41,398) 121,827 Class R3 3,333,995 (2,717,310) 616,685 336,847 (274,204) 62,643 Class R4 2,784,121 (1,310,715) 1,473,406 282,624 (132,983) 149,641 Class R5 385,153 (1,439,882) (1,054,729) 39,269 (147,266) (107,997) Class R6 2,255,566 (837,183) 1,418,383 231,029 (86,111) 144,918 Class R7 725,757 (881,865) (156,108) 74,959 (90,883) (15,924) Class R8 171,106 (228,980) (57,874) 17,800 (23,861) (6,061) Class LifeStyle 6,173,684 (16,125,803) (9,952,119) — — — $ 19,476,640 $ (32,802,218) $ (13,325,578) 1,346,685 (1,677,166) (330,481)
244

THE COLLECTIVE INVESTMENT FUNDS OF FIRST MERCANTILE TRUST COMPANY FMT/DFA 1 Year Fixed Income Fund
Financial Highlights December 31, 2015
The accompanying notes are an integral part of these financial statements.
Change in Net Asset Value Resulting from Operations Ratios (to average net
assets)
NAV per Unit, Beginning of
Period
Net Investment
Income (Loss)(a)
Net Realized and Unrealized
Gain (Loss) from
Investments(a)
Total from Investment Activities
NAV per Unit, End of
Period Total
Return Expenses
Net Investment
Income (Loss)
Class R1 $ 10.0395 $ 0.0094 $ (0.0169) $ (0.0075) $ 10.0320 (0.07) % (0.39) % 0.09 % Class R2 9.9672 (0.0084) (0.0209) (0.0293) 9.9379 (0.29) % (0.61) % (0.08) % Class R3 9.9147 (0.0265) (0.0194) (0.0459) 9.8688 (0.46) % (0.78) % (0.27) % Class R4 9.8720 (0.0413) (0.0211) (0.0624) 9.8096 (0.63) % (0.95) % (0.42) % Class R5 9.8151 (0.0655) (0.0131) (0.0786) 9.7365 (0.80) % (1.12) % (0.67) % Class R6 9.7657 (0.0767) (0.0181) (0.0948) 9.6709 (0.97) % (1.29) % (0.79) % Class R7 9.7098 (0.0916) (0.0189) (0.1105) 9.5993 (1.14) % (1.46) % (0.95) % Class R8 9.6611 (0.1095) (0.0167) (0.1262) 9.5349 (1.31) % (1.63) % (1.14) % (a) Per unit amounts are based on average daily units outstanding.
245

FMT/DFA Five Year Global Fixed Income Fund

THE COLLECTIVE INVESTMENT FUNDS OF FIRST MERCANTILE TRUST COMPANY FMT/DFA Five Year Global Fixed Income Fund
Statement of Assets and Liabilities December 31, 2015
The accompanying notes are an integral part of these financial statements.
Assets Investments in securities, at fair value $ 13,165,783 Liabilities Trustee fees 6,097
Net assets $ 13,159,686
Components of net assets
Units of
Participation NAV
per Unit Net
Assets Class R1 808,263 $ 11.0759 $ 8,952,258
Class R2 67,752 $ 10.6837 723,846
Class R3 83,982 $ 10.5730 887,944
Class R4 87,230 $ 10.4856 914,662
Class R5 94,702 $ 10.4079 985,650
Class R6 37,359 $ 10.3562 386,900
Class R7 25,701 $ 10.3029 264,796
Class R8 4,281 $ 10.1912 43,630
$ 13,159,686
246

THE COLLECTIVE INVESTMENT FUNDS OF FIRST MERCANTILE TRUST COMPANY FMT/DFA Five Year Global Fixed Income Fund
Statement of Operations For the Year Ended December 31, 2015
The accompanying notes are an integral part of these financial statements.
Investment income
Dividends $ 233,178
Expenses
Trustee fees 83,645
Custody fees 5,229
Audit fees 1,200
90,074
Net investment income 143,104
Net realized gain from investments sold
Proceeds from sales of investments 5,121,807
Cost of investments sold 5,106,649
Net realized gain from investments sold 15,158
Change in net unrealized appreciation (depreciation) on investments (19,369)
Net realized and unrealized loss on investments (4,211)
Net increase in net assets resulting from operations $ 138,893
247

THE COLLECTIVE INVESTMENT FUNDS OF FIRST MERCANTILE TRUST COMPANY FMT/DFA Five Year Global Fixed Income Fund
Statement of Changes in Net Assets For the Year Ended December 31, 2015
The accompanying notes are an integral part of these financial statements.
Operations
Net investment income $ 143,104
Net realized gain from investments sold 15,158
Change in net unrealized appreciation (depreciation) on investments (19,369)
Net increase in net assets resulting from operations 138,893
Participant transactions
Proceeds from units purchased 5,243,904
Less payments for units redeemed 7,926,708
Decrease in net assets from participant transactions (2,682,804)
Total decrease in net assets (2,543,911)
Net assets at beginning of year 15,703,597
Net assets at end of year $ 13,159,686
248

THE COLLECTIVE INVESTMENT FUNDS OF FIRST MERCANTILE TRUST COMPANY FMT/DFA Five Year Global Fixed Income Fund
Schedule of Investments and Specific Fund Disclosures December 31, 2015
The accompanying notes are an integral part of these financial statements.
Investments Shares Fair Value ____________ ____________
Mutual fund (100.0%)
DFA Five-Year Global Fixed Income Portfolio Fund (Cost $13,293,472) 1,207,870 $ 13,165,783 __________ __________
Specific Fund Disclosures Fair value The inputs or methodology used for valuing securities may not be indicative of the risks associated with investing in those securities. For more information on valuation inputs, and their aggregation into the levels used in the table below, please refer to note 4 to the financial statements. The following table sets forth by level, within the fair value hierarchy, the Fund's investments measured at fair value.
Total Level 1 Level 2 Level 3
Mutual fund - Global Bond $ 13,165,783 $ 13,165,783 $ — $ — __________ __________ __________ _________ __________ __________ __________ _________ Investment transactions The aggregate cost of purchases of investment securities and proceeds from sales of investment securities (other than temporary cash investments) totaled $2,580,156 and $5,121,807, respectively, for the year ended December 31, 2015. Class-specific expenses Class-specific trustee fees for the year ended December 31, 2015 were as follows: Class R1 $ 30,446 Class R2 4,255 Class R3 18,913 Class R4 7,819 Class R5 10,878 Class R6 6,683 Class R7 3,363 Class R8 1,288 $ 83,645
249

THE COLLECTIVE INVESTMENT FUNDS OF FIRST MERCANTILE TRUST COMPANY FMT/DFA Five Year Global Fixed Income Fund
Schedule of Participant Transactions December 31, 2015
The accompanying notes are an integral part of these financial statements.
Participant transactions by class for the year ended December 31, 2015 were as follows: Dollars Units Purchases Redemptions Net change Purchases Redemptions Net change Class R1 $ 3,667,370 $ (3,841,573) $ (174,203) 329,305 (346,477) (17,172) Class R2 177,057 (214,455) (37,398) 16,547 (20,039) (3,492) Class R3 813,181 (3,221,502) (2,408,321) 76,616 (302,272) (225,656) Class R4 274,727 (54,968) 219,759 26,188 (5,223) 20,965 Class R5 65,259 (90,200) (24,941) 6,241 (8,642) (2,401) Class R6 145,377 (397,186) (251,809) 13,976 (38,071) (24,095) Class R7 92,452 (39,107) 53,345 8,950 (3,778) 5,172 Class R8 8,481 (67,717) (59,236) 828 (6,628) (5,800) $ 5,243,904 $ (7,926,708) $ (2,682,804) 478,651 (731,130) (252,479)
250

THE COLLECTIVE INVESTMENT FUNDS OF FIRST MERCANTILE TRUST COMPANY FMT/DFA Five Year Global Fixed Income Fund
Financial Highlights December 31, 2015
The accompanying notes are an integral part of these financial statements.
Change in Net Asset Value Resulting from Operations Ratios (to average net
assets)
NAV per Unit, Beginning of
Period
Net Investment
Income (Loss)(a)
Net Realized and Unrealized
Gain (Loss) from
Investments(a)
Total from Investment Activities
NAV per Unit, End of
Period Total
Return Expenses
Net Investment
Income (Loss)
Class R1 $ 10.9608 $ 0.1474 $ (0.0323) $ 0.1151 $ 11.0759 1.05 % (0.39) % 1.33 % Class R2 10.5959 0.1108 (0.0230) 0.0878 10.6837 0.83 % (0.61) % 1.04 % Class R3 10.5038 0.0249 0.0443 0.0692 10.5730 0.66 % (0.78) % 0.23 % Class R4 10.4348 0.0837 (0.0329) 0.0508 10.4856 0.49 % (0.95) % 0.80 % Class R5 10.3751 0.0570 (0.0242) 0.0328 10.4079 0.32 % (1.12) % 0.54 % Class R6 10.3410 0.0175 (0.0023) 0.0152 10.3562 0.15 % (1.29) % 0.17 % Class R7 10.3053 0.0359 (0.0383) (0.0024) 10.3029 (0.02) % (1.46) % 0.35 % Class R8 10.2108 (0.0428) 0.0232 (0.0196) 10.1912 (0.19) % (1.63) % (0.42) % (a) Per unit amounts are based on average daily units outstanding.
251

FMT/DFA Intermediate Term Extended Quality Portfolio Fund
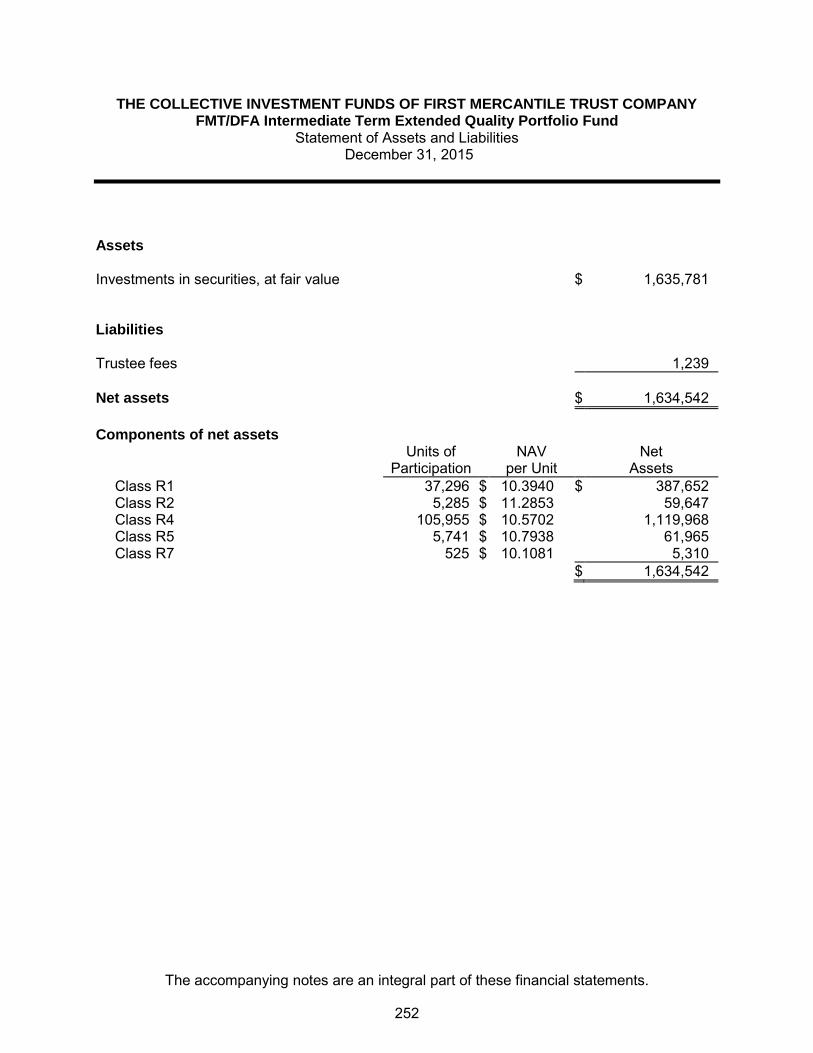
THE COLLECTIVE INVESTMENT FUNDS OF FIRST MERCANTILE TRUST COMPANY FMT/DFA Intermediate Term Extended Quality Portfolio Fund
Statement of Assets and Liabilities December 31, 2015
The accompanying notes are an integral part of these financial statements.
Assets Investments in securities, at fair value $ 1,635,781 Liabilities Trustee fees 1,239
Net assets $ 1,634,542
Components of net assets
Units of
Participation NAV
per Unit Net
Assets Class R1 37,296 $ 10.3940 $ 387,652
Class R2 5,285 $ 11.2853 59,647
Class R4 105,955 $ 10.5702 1,119,968
Class R5 5,741 $ 10.7938 61,965
Class R7 525 $ 10.1081 5,310
$ 1,634,542
252

THE COLLECTIVE INVESTMENT FUNDS OF FIRST MERCANTILE TRUST COMPANY FMT/DFA Intermediate Term Extended Quality Portfolio Fund
Statement of Operations For the Year Ended December 31, 2015
The accompanying notes are an integral part of these financial statements.
Investment income
Dividends $ 95,522
Expenses
Trustee fees 18,333
Audit fees 1,200
Custody fees 1,072
20,605
Net investment income 74,917
Net realized gain from investments sold
Proceeds from sales of investments 2,247,935
Cost of investments sold 2,207,429
Net realized gain from investments sold 40,506
Change in net unrealized appreciation (depreciation) on investments (92,290)
Net realized and unrealized loss on investments (51,784)
Net increase in net assets resulting from operations $ 23,133
253
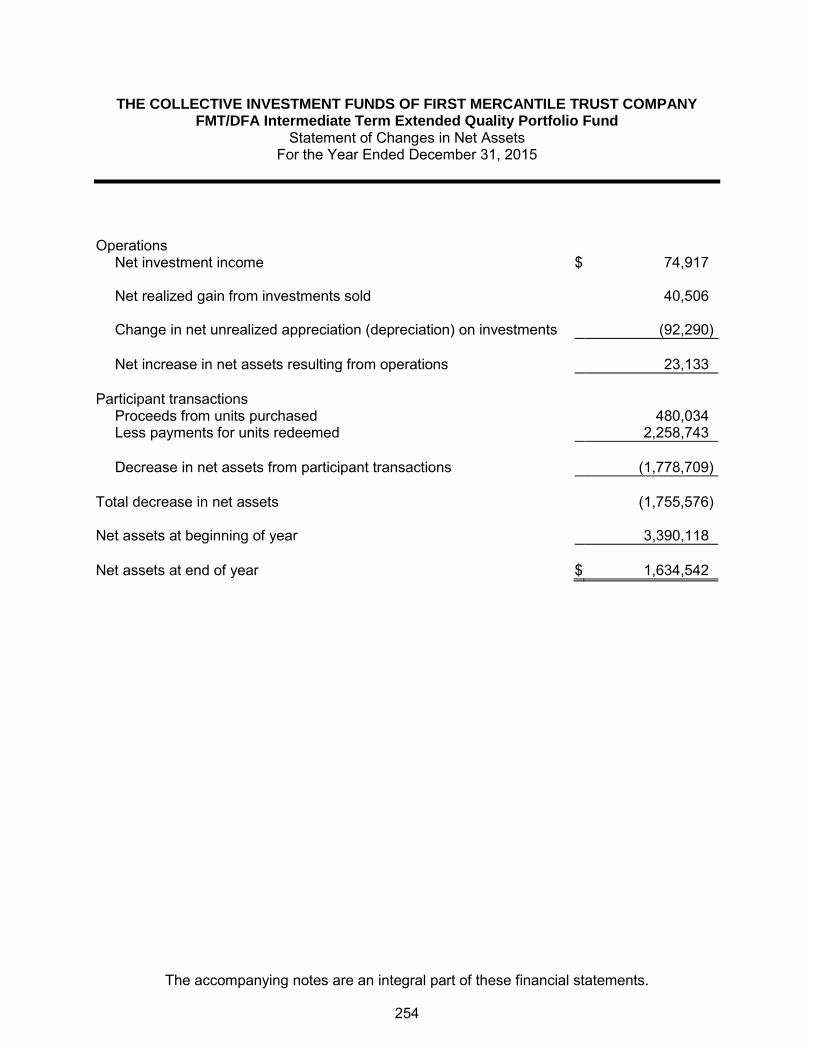
THE COLLECTIVE INVESTMENT FUNDS OF FIRST MERCANTILE TRUST COMPANY FMT/DFA Intermediate Term Extended Quality Portfolio Fund
Statement of Changes in Net Assets For the Year Ended December 31, 2015
The accompanying notes are an integral part of these financial statements.
Operations
Net investment income $ 74,917
Net realized gain from investments sold 40,506
Change in net unrealized appreciation (depreciation) on investments (92,290)
Net increase in net assets resulting from operations 23,133
Participant transactions
Proceeds from units purchased 480,034
Less payments for units redeemed 2,258,743
Decrease in net assets from participant transactions (1,778,709)
Total decrease in net assets (1,755,576)
Net assets at beginning of year 3,390,118
Net assets at end of year $ 1,634,542
254
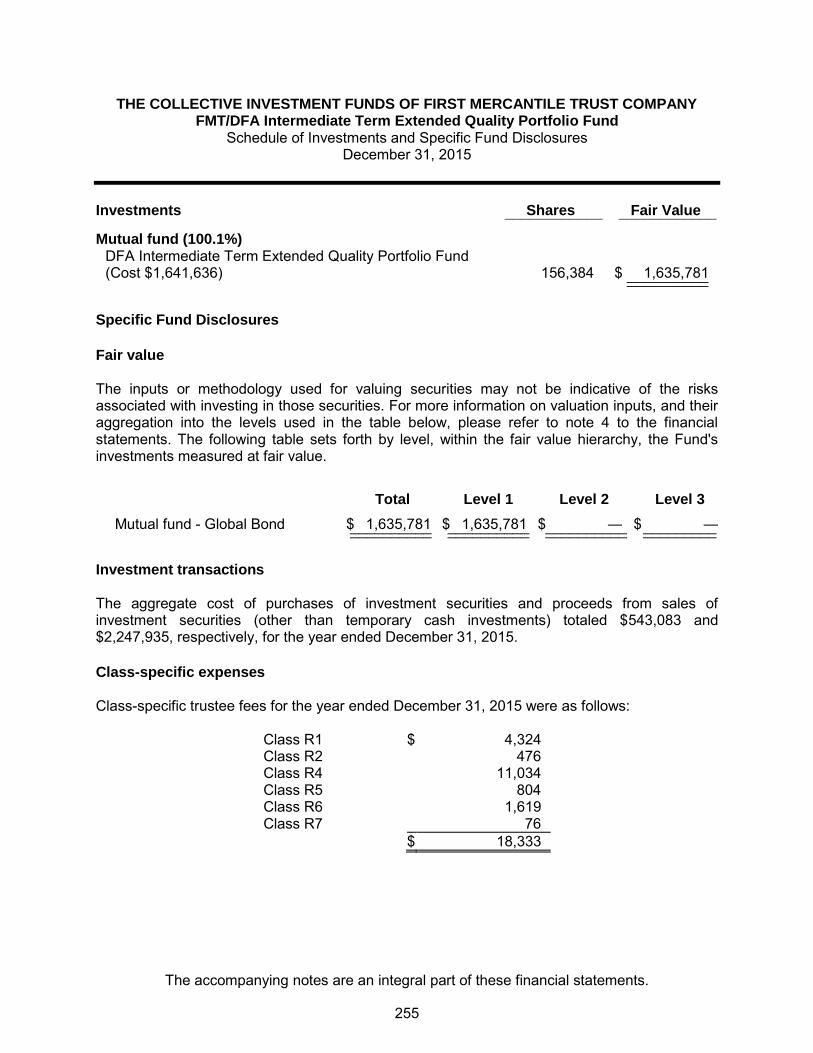
THE COLLECTIVE INVESTMENT FUNDS OF FIRST MERCANTILE TRUST COMPANY FMT/DFA Intermediate Term Extended Quality Portfolio Fund
Schedule of Investments and Specific Fund Disclosures December 31, 2015
The accompanying notes are an integral part of these financial statements.
Investments Shares Fair Value ____________ ____________
Mutual fund (100.1%)
DFA Intermediate Term Extended Quality Portfolio Fund (Cost $1,641,636) 156,384 $ 1,635,781 __________ __________
Specific Fund Disclosures Fair value The inputs or methodology used for valuing securities may not be indicative of the risks associated with investing in those securities. For more information on valuation inputs, and their aggregation into the levels used in the table below, please refer to note 4 to the financial statements. The following table sets forth by level, within the fair value hierarchy, the Fund's investments measured at fair value.
Total Level 1 Level 2 Level 3
Mutual fund - Global Bond $ 1,635,781 $ 1,635,781 $ — $ — __________ __________ __________ _________ __________ __________ __________ _________ Investment transactions The aggregate cost of purchases of investment securities and proceeds from sales of investment securities (other than temporary cash investments) totaled $543,083 and $2,247,935, respectively, for the year ended December 31, 2015. Class-specific expenses Class-specific trustee fees for the year ended December 31, 2015 were as follows: Class R1 $ 4,324 Class R2 476 Class R4 11,034 Class R5 804 Class R6 1,619 Class R7 76 $ 18,333
255

THE COLLECTIVE INVESTMENT FUNDS OF FIRST MERCANTILE TRUST COMPANY FMT/DFA Intermediate Term Extended Quality Portfolio Fund
Schedule of Participant Transactions December 31, 2015
The accompanying notes are an integral part of these financial statements.
Participant transactions by class for the year ended December 31, 2015 were as follows: Dollars Units Purchases Redemptions Net change Purchases Redemptions Net change Class R1 $ 322,456 $ (1,396,732) $ (1,074,276) 30,963 (134,960) (103,997) Class R2 12,654 (104,707) (92,053) 1,116 (9,097) (7,981) Class R4 119,569 (216,098) (96,529) 11,269 (20,374) (9,105) Class R5 8,117 (65,085) (56,968) 747 (5,960) (5,213) Class R6 17,238 (476,121) (458,883) 1,551 (43,090) (41,539) $ 480,034 $ (2,258,743) $ (1,778,709) 45,646 (213,481) (167,835)
256

THE COLLECTIVE INVESTMENT FUNDS OF FIRST MERCANTILE TRUST COMPANY FMT/DFA Intermediate Term Extended Quality Portfolio Fund
Financial Highlights December 31, 2015
The accompanying notes are an integral part of these financial statements.
Change in Net Asset Value Resulting from Operations Ratios (to average net
assets)
NAV per Unit, Beginning of
Period
Net Investment
Income (Loss)(a)
Net Realized and Unrealized
Gain (Loss) from
Investments(a)
Total from Investment Activities
NAV per Unit, End of
Period Total
Return Expenses
Net Investment
Income (Loss)
Class R1 $ 10.3067 $ 0.3091 $ (0.2218) $ 0.0873 $ 10.3940 0.85 % (0.43) % 2.96 % Class R2 11.2151 0.3157 (0.2455) 0.0702 11.2853 0.63 % (0.65) % 2.78 % Class R4 10.5401 0.2829 (0.2528) 0.0301 10.5702 0.29 % (0.99) % 2.66 % Class R5 10.7813 0.2572 (0.2447) 0.0125 10.7938 0.12 % (1.16) % 2.36 % Class R6(b) 10.8069 0.0540 0.1769 0.2309 — 2.14 % (1.34) % 1.50 % Class R7 10.1309 0.2210 (0.2438) (0.0228) 10.1081 (0.23) % (1.50) % 2.16 % (a) Per unit amounts are based on average daily units outstanding.
(b) For the period from January 1, 2015 through April 29, 2015.
257

FMT/DFA Short-Term Extended Quality Institutional Fund

THE COLLECTIVE INVESTMENT FUNDS OF FIRST MERCANTILE TRUST COMPANY FMT/DFA Short-Term Extended Quality Institutional Fund
Statement of Assets and Liabilities December 31, 2015
The accompanying notes are an integral part of these financial statements.
Assets Investments in securities, at fair value $ 4,589,225 Liabilities Trustee fees 2,385
Net assets $ 4,586,840
Components of net assets
Units of
Participation NAV
per Unit Net
Assets Class R1 217,873 $ 10.7435 $ 2,340,714
Class R2 73,046 $ 10.0442 733,685
Class R3 42,086 $ 10.2603 431,808
Class R4 6,122 $ 10.1934 62,402
Class R5 84,877 $ 10.1512 861,602
Class R6 10,225 $ 10.0474 102,731
Class R7 1,083 $ 9.9817 10,810
Class R8 4,341 $ 9.9262 43,088
$ 4,586,840
258

THE COLLECTIVE INVESTMENT FUNDS OF FIRST MERCANTILE TRUST COMPANY FMT/DFA Short-Term Extended Quality Institutional Fund
Statement of Operations For the Year Ended December 31, 2015
The accompanying notes are an integral part of these financial statements.
Investment income
Dividends $ 104,073
Expenses
Trustee fees 34,910
Custody fees 2,308
Audit fees 1,200
38,418
Net investment income 65,655
Net realized gain from investments sold
Proceeds from sales of investments 5,613,642
Cost of investments sold 5,609,901
Net realized gain from investments sold 3,741
Change in net unrealized appreciation (depreciation) on investments (18,056)
Net realized and unrealized loss on investments (14,315)
Net increase in net assets resulting from operations $ 51,340
259

THE COLLECTIVE INVESTMENT FUNDS OF FIRST MERCANTILE TRUST COMPANY FMT/DFA Short-Term Extended Quality Institutional Fund
Statement of Changes in Net Assets For the Year Ended December 31, 2015
The accompanying notes are an integral part of these financial statements.
Operations
Net investment income $ 65,655
Net realized gain from investments sold 3,741
Change in net unrealized appreciation (depreciation) on investments (18,056)
Net increase in net assets resulting from operations 51,340
Participant transactions
Proceeds from units purchased 3,982,673
Less payments for units redeemed 5,794,239
Decrease in net assets from participant transactions (1,811,566)
Total decrease in net assets (1,760,226)
Net assets at beginning of year 6,347,066
Net assets at end of year $ 4,586,840
260

THE COLLECTIVE INVESTMENT FUNDS OF FIRST MERCANTILE TRUST COMPANY FMT/DFA Short-Term Extended Quality Institutional Fund
Schedule of Investments and Specific Fund Disclosures December 31, 2015
The accompanying notes are an integral part of these financial statements.
Investments Shares Fair Value ____________ ____________
Mutual fund (100.1%)
DFA Short-Term Extended Quality Portfolio Fund (Cost $4,634,657) 427,700 $ 4,589,225 ___________ ___________
Specific Fund Disclosures Fair value The inputs or methodology used for valuing securities may not be indicative of the risks associated with investing in those securities. For more information on valuation inputs, and their aggregation into the levels used in the table below, please refer to note 4 to the financial statements. The following table sets forth by level, within the fair value hierarchy, the Fund's investments measured at fair value.
Total Level 1 Level 2 Level 3
Mutual fund - Short Duration Bond $ 4,589,225 $ 4,589,225 $ — $ — __________ __________ __________ _________ __________ __________ __________ _________
Investment transactions The aggregate cost of purchases of investment securities and proceeds from sales of investment securities (other than temporary cash investments) totaled $3,866,764 and $5,613,642, respectively, for the year ended December 31, 2015. Class-specific expenses Class-specific trustee fees for the year ended December 31, 2015 were as follows: Class R1 $ 13,759 Class R2 4,154 Class R3 3,979 Class R4 947 Class R5 9,851 Class R6 1,414 Class R7 146 Class R8 660 $ 34,910
261

THE COLLECTIVE INVESTMENT FUNDS OF FIRST MERCANTILE TRUST COMPANY FMT/DFA Short-Term Extended Quality Institutional Fund
Schedule of Participant Transactions December 31, 2015
The accompanying notes are an integral part of these financial statements.
Participant transactions by class for the year ended December 31, 2015 were as follows: Dollars Units Purchases Redemptions Net change Purchases Redemptions Net change Class R1 $ 3,577,972 $ (4,896,932) $ (1,318,960) 333,796 (455,076) (121,280) Class R2 226,230 (164,493) 61,737 22,474 (16,349) 6,125 Class R3 33,689 (461,486) (427,797) 3,277 (44,789) (41,512) Class R4 38,206 (57,293) (19,087) 3,719 (5,614) (1,895) Class R5 94,435 (185,320) (90,885) 9,255 (18,158) (8,903) Class R6 5,589 (26,785) (21,196) 554 (2,645) (2,091) Class R7 1,883 (1,053) 830 188 (105) 83 Class R8 4,669 (877) 3,792 467 (87) 380 $ 3,982,673 $ (5,794,239) $ (1,811,566) 373,730 (542,823) (169,093)
262

THE COLLECTIVE INVESTMENT FUNDS OF FIRST MERCANTILE TRUST COMPANY FMT/DFA Short-Term Extended Quality Institutional Fund
Financial Highlights December 31, 2015
The accompanying notes are an integral part of these financial statements.
Change in Net Asset Value Resulting from Operations Ratios (to average net
assets)
NAV per Unit, Beginning of
Period
Net Investment
Income (Loss)(a)
Net Realized and Unrealized
Gain (Loss) from
Investments(a)
Total from Investment Activities
NAV per Unit, End of
Period Total
Return Expenses
Net Investment
Income (Loss)
Class R1 $ 10.6641 $ 0.1278 $ (0.0484) $ 0.0794 $ 10.7435 0.74 % (0.40) % 1.19 % Class R2 9.9919 0.1093 (0.0570) 0.0523 10.0442 0.52 % (0.63) % 1.09 % Class R3 10.2242 0.0883 (0.0522) 0.0361 10.2603 0.35 % (0.80) % 0.86 % Class R4 10.1751 0.0828 (0.0645) 0.0183 10.1934 0.18 % (0.96) % 0.81 % Class R5 10.1499 0.0570 (0.0557) 0.0013 10.1512 0.01 % (1.14) % 0.56 % Class R6 10.0632 0.0385 (0.0543) (0.0158) 10.0474 (0.16) % (1.31) % 0.38 % Class R7 10.0147 0.0244 (0.0574) (0.0330) 9.9817 (0.33) % (1.48) % 0.24 % Class R8 9.9757 0.0075 (0.0570) (0.0495) 9.9262 (0.50) % (1.65) % 0.07 % (a) Per unit amounts are based on average daily units outstanding.
263
FMT/DFA Two Year Global Fixed Income Fund

THE COLLECTIVE INVESTMENT FUNDS OF FIRST MERCANTILE TRUST COMPANY FMT/DFA Two Year Global Fixed Income Fund
Statement of Assets and Liabilities December 31, 2015
The accompanying notes are an integral part of these financial statements.
Assets Investments in securities, at fair value $ 13,963,344 Liabilities Trustee fees 9,973
Net assets $ 13,953,371
Components of net assets
Units of
Participation NAV
per Unit Net
Assets Class R1 244,761 $ 10.0623 $ 2,462,862
Class R2 217,065 $ 9.9716 2,164,482
Class R3 251,875 $ 9.9002 2,493,612
Class R4 274,624 $ 9.8393 2,702,108
Class R5 129,212 $ 9.7657 1,261,850
Class R6 168,697 $ 9.7003 1,636,407
Class R7 98,446 $ 9.6330 948,326
Class R8 29,645 $ 9.5706 283,724
$ 13,953,371
264

THE COLLECTIVE INVESTMENT FUNDS OF FIRST MERCANTILE TRUST COMPANY FMT/DFA Two Year Global Fixed Income Fund
Statement of Operations For the Year Ended December 31, 2015
The accompanying notes are an integral part of these financial statements.
Investment income
Dividends $ 3,388
Expenses
Trustee fees 122,708
Custody fees 5,325
Audit fees 1,200
129,233
Net investment loss (125,845)
Net realized loss from investments sold
Proceeds from sales of investments 4,040,784
Cost of investments sold 4,104,252
Net realized loss from investments sold (63,468)
Change in net unrealized appreciation (depreciation) on investments 112,724
Net realized and unrealized gain on investments 49,256
Net decrease in net assets resulting from operations $ (76,589)
265
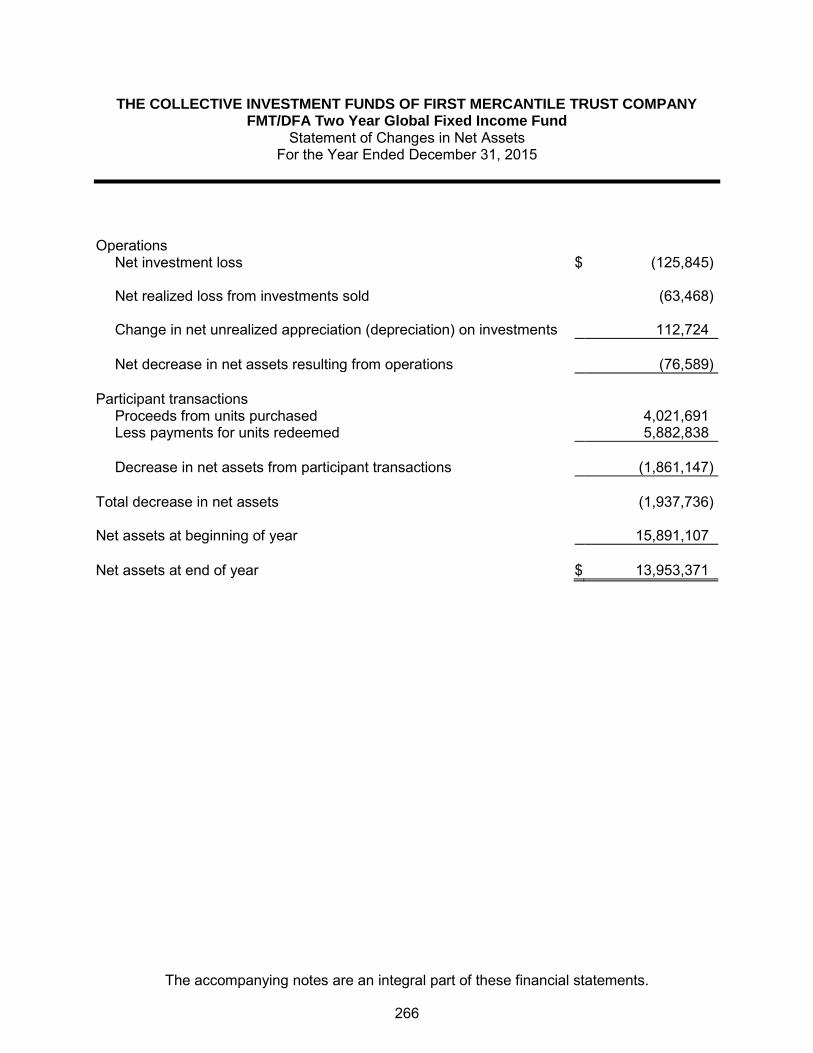
THE COLLECTIVE INVESTMENT FUNDS OF FIRST MERCANTILE TRUST COMPANY FMT/DFA Two Year Global Fixed Income Fund
Statement of Changes in Net Assets For the Year Ended December 31, 2015
The accompanying notes are an integral part of these financial statements.
Operations
Net investment loss $ (125,845)
Net realized loss from investments sold (63,468)
Change in net unrealized appreciation (depreciation) on investments 112,724
Net decrease in net assets resulting from operations (76,589)
Participant transactions
Proceeds from units purchased 4,021,691
Less payments for units redeemed 5,882,838
Decrease in net assets from participant transactions (1,861,147)
Total decrease in net assets (1,937,736)
Net assets at beginning of year 15,891,107
Net assets at end of year $ 13,953,371
266

THE COLLECTIVE INVESTMENT FUNDS OF FIRST MERCANTILE TRUST COMPANY FMT/DFA Two Year Global Fixed Income Fund
Schedule of Investments and Specific Fund Disclosures December 31, 2015
The accompanying notes are an integral part of these financial statements.
Investments Shares Fair Value ____________ ____________
Mutual fund (100.1%)
DFA Two Year Global Fixed Income Portfolio Fund (Cost $14,173,645) 1,406,178 $ 13,963,344 ___________ ___________
Specific Fund Disclosures Fair value The inputs or methodology used for valuing securities may not be indicative of the risks associated with investing in those securities. For more information on valuation inputs, and their aggregation into the levels used in the table below, please refer to note 4 to the financial statements. The following table sets forth by level, within the fair value hierarchy, the Fund's investments measured at fair value.
Total Level 1 Level 2 Level 3
Mutual fund - Global Bond $ 13,963,344 $ 13,963,344 $ — $ — __________ __________ __________ _________ __________ __________ __________ _________ Investment transactions The aggregate cost of purchases of investment securities and proceeds from sales of investment securities (other than temporary cash investments) totaled $2,052,427 and $4,040,784, respectively, for the year ended December 31, 2015. Class-specific expenses Class-specific trustee fees for the year ended December 31, 2015 were as follows: Class R1 $ 11,717 Class R2 11,623 Class R3 19,205 Class R4 22,025 Class R5 16,142 Class R6 23,084 Class R7 12,968 Class R8 5,944 $ 122,708
267
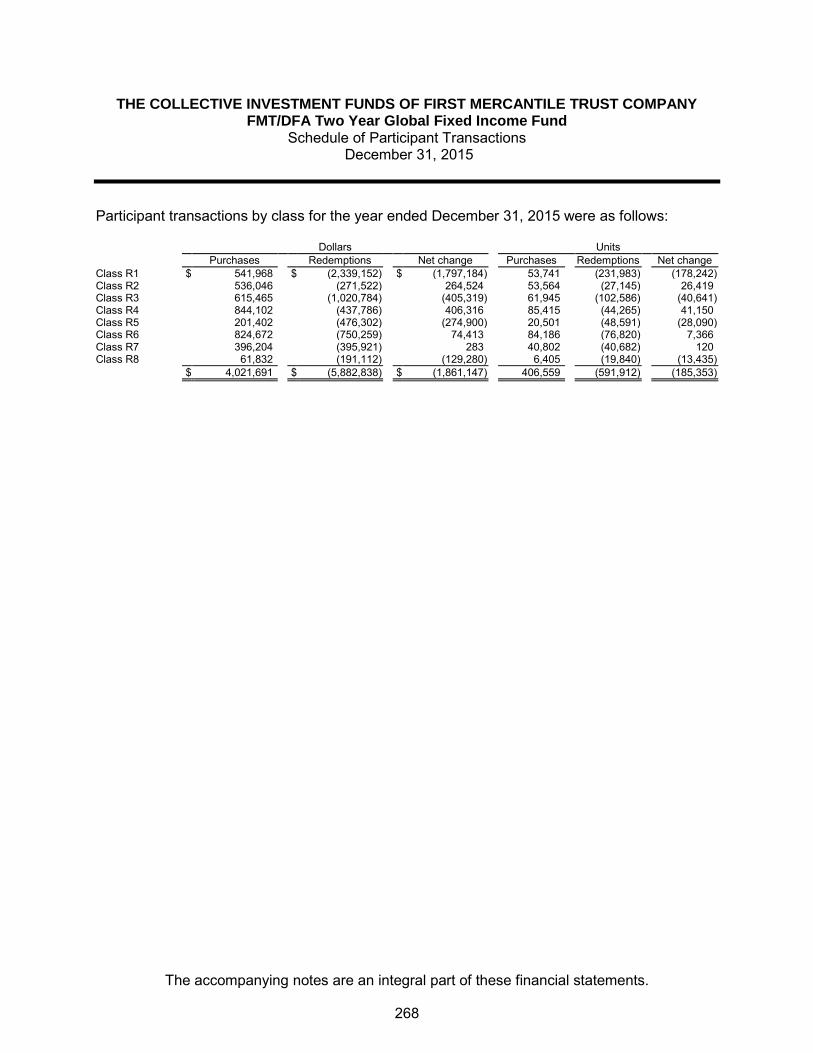
THE COLLECTIVE INVESTMENT FUNDS OF FIRST MERCANTILE TRUST COMPANY FMT/DFA Two Year Global Fixed Income Fund
Schedule of Participant Transactions December 31, 2015
The accompanying notes are an integral part of these financial statements.
Participant transactions by class for the year ended December 31, 2015 were as follows: Dollars Units Purchases Redemptions Net change Purchases Redemptions Net change Class R1 $ 541,968 $ (2,339,152) $ (1,797,184) 53,741 (231,983) (178,242) Class R2 536,046 (271,522) 264,524 53,564 (27,145) 26,419 Class R3 615,465 (1,020,784) (405,319) 61,945 (102,586) (40,641) Class R4 844,102 (437,786) 406,316 85,415 (44,265) 41,150 Class R5 201,402 (476,302) (274,900) 20,501 (48,591) (28,090) Class R6 824,672 (750,259) 74,413 84,186 (76,820) 7,366 Class R7 396,204 (395,921) 283 40,802 (40,682) 120 Class R8 61,832 (191,112) (129,280) 6,405 (19,840) (13,435) $ 4,021,691 $ (5,882,838) $ (1,861,147) 406,559 (591,912) (185,353)
268
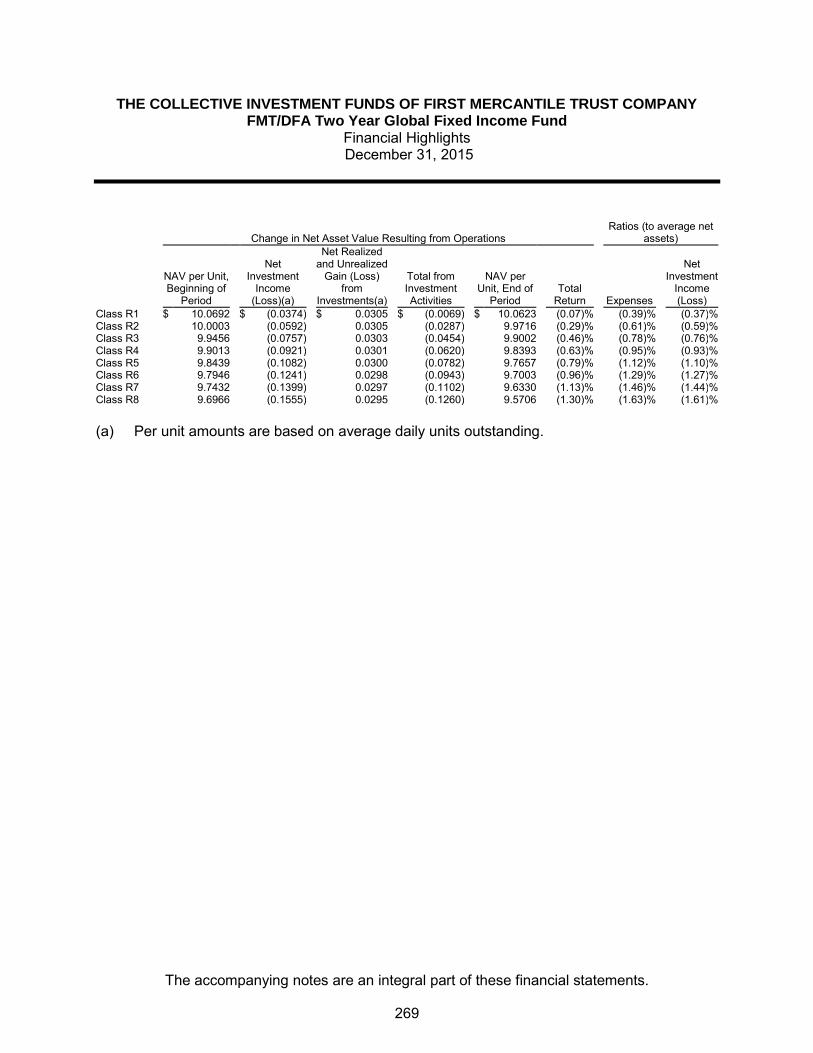
THE COLLECTIVE INVESTMENT FUNDS OF FIRST MERCANTILE TRUST COMPANY FMT/DFA Two Year Global Fixed Income Fund
Financial Highlights December 31, 2015
The accompanying notes are an integral part of these financial statements.
Change in Net Asset Value Resulting from Operations Ratios (to average net
assets)
NAV per Unit, Beginning of
Period
Net Investment
Income (Loss)(a)
Net Realized and Unrealized
Gain (Loss) from
Investments(a)
Total from Investment Activities
NAV per Unit, End of
Period Total
Return Expenses
Net Investment
Income (Loss)
Class R1 $ 10.0692 $ (0.0374) $ 0.0305 $ (0.0069) $ 10.0623 (0.07) % (0.39) % (0.37) % Class R2 10.0003 (0.0592) 0.0305 (0.0287) 9.9716 (0.29) % (0.61) % (0.59) % Class R3 9.9456 (0.0757) 0.0303 (0.0454) 9.9002 (0.46) % (0.78) % (0.76) % Class R4 9.9013 (0.0921) 0.0301 (0.0620) 9.8393 (0.63) % (0.95) % (0.93) % Class R5 9.8439 (0.1082) 0.0300 (0.0782) 9.7657 (0.79) % (1.12) % (1.10) % Class R6 9.7946 (0.1241) 0.0298 (0.0943) 9.7003 (0.96) % (1.29) % (1.27) % Class R7 9.7432 (0.1399) 0.0297 (0.1102) 9.6330 (1.13) % (1.46) % (1.44) % Class R8 9.6966 (0.1555) 0.0295 (0.1260) 9.5706 (1.30) % (1.63) % (1.61) % (a) Per unit amounts are based on average daily units outstanding.
269

FMT/FFTW U.S. TIPS Fund

THE COLLECTIVE INVESTMENT FUNDS OF FIRST MERCANTILE TRUST COMPANY FMT/FFTW U.S. TIPS Fund
Statement of Operations For the Year Ended December 31, 2015
The accompanying notes are an integral part of these financial statements.
Expenses
Trustee fees $ 130,749
Custody fees 7,537
Audit fees 1,450
139,736
Net investment loss (139,736)
Net realized loss from investments sold
Proceeds from sales of investments 25,319,853
Cost of investments sold 26,474,918
Net realized loss from investments sold (1,155,065)
Change in net unrealized appreciation (depreciation) on investments 1,037,880
Net realized and unrealized loss on investments (117,185)
Other operating credits (charges) 112
Net decrease in net assets resulting from operations $ (256,809)
270

THE COLLECTIVE INVESTMENT FUNDS OF FIRST MERCANTILE TRUST COMPANY FMT/FFTW U.S. TIPS Fund
Statement of Changes in Net Assets For the Year Ended December 31, 2015
The accompanying notes are an integral part of these financial statements.
Operations
Net investment loss $ (139,736)
Net realized loss from investments sold (1,155,065)
Change in net unrealized appreciation (depreciation) on investments 1,037,880
Other operating credits (charges) 112
Net decrease in net assets resulting from operations (256,809)
Participant transactions
Proceeds from units purchased 5,110,587
Less payments for units redeemed 29,102,265
Decrease in net assets from participant transactions (23,991,678)
Total decrease in net assets (24,248,487)
Net assets at beginning of year 24,248,487
Net assets at end of year $ —
271
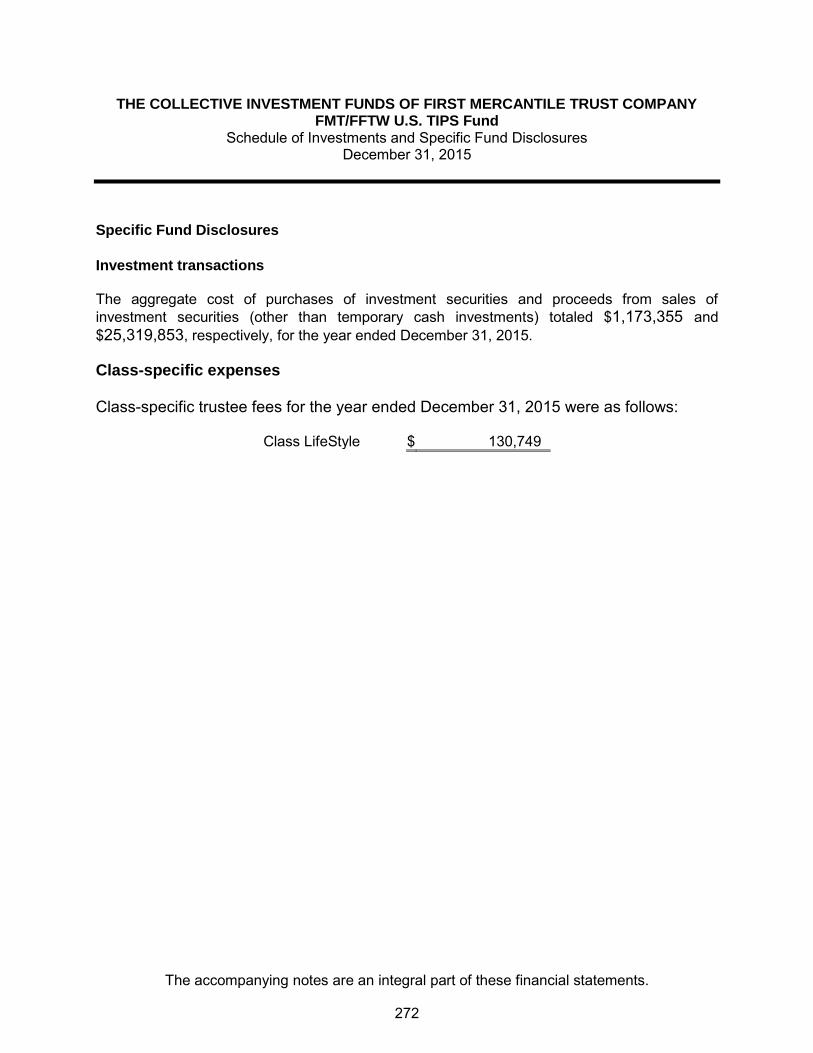
THE COLLECTIVE INVESTMENT FUNDS OF FIRST MERCANTILE TRUST COMPANY FMT/FFTW U.S. TIPS Fund
Schedule of Investments and Specific Fund Disclosures December 31, 2015
The accompanying notes are an integral part of these financial statements.
Specific Fund Disclosures Investment transactions The aggregate cost of purchases of investment securities and proceeds from sales of investment securities (other than temporary cash investments) totaled $1,173,355 and $25,319,853, respectively, for the year ended December 31, 2015. Class-specific expenses Class-specific trustee fees for the year ended December 31, 2015 were as follows:
Class LifeStyle $ 130,749
272
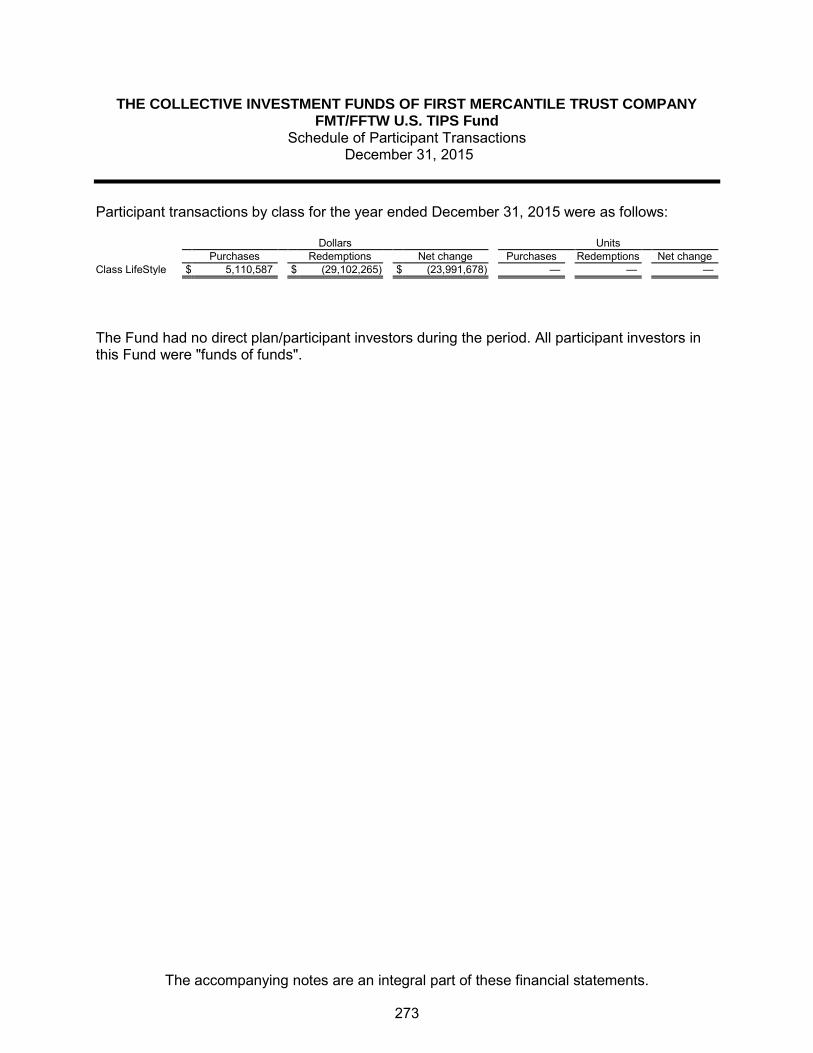
THE COLLECTIVE INVESTMENT FUNDS OF FIRST MERCANTILE TRUST COMPANY FMT/FFTW U.S. TIPS Fund
Schedule of Participant Transactions December 31, 2015
The accompanying notes are an integral part of these financial statements.
Participant transactions by class for the year ended December 31, 2015 were as follows: Dollars Units Purchases Redemptions Net change Purchases Redemptions Net change Class LifeStyle $ 5,110,587 $ (29,102,265) $ (23,991,678) — — —
The Fund had no direct plan/participant investors during the period. All participant investors in this Fund were "funds of funds".
273

FMT/Global Diversified Bond Fund

THE COLLECTIVE INVESTMENT FUNDS OF FIRST MERCANTILE TRUST COMPANY FMT/Global Diversified Bond Fund Statement of Assets and Liabilities
December 31, 2015
The accompanying notes are an integral part of these financial statements.
Assets Investments in securities, at fair value $ 26,509,959 Cash equivalents 1,207,613
Receivables
Dividends and interest 40,057
Total assets 27,757,629
Liabilities Investments purchased 1,171,500
Trustee fees 153
Total liabilities 1,171,653
Net assets $ 26,585,976
Components of net assets
Units of
Participation NAV
per Unit Net
Assets Class R3 31 $ 10.0067 $ 313
Class R4 20,440 $ 9.8157 200,634
Class LifeStyle 26,385,029
$ 26,585,976
274
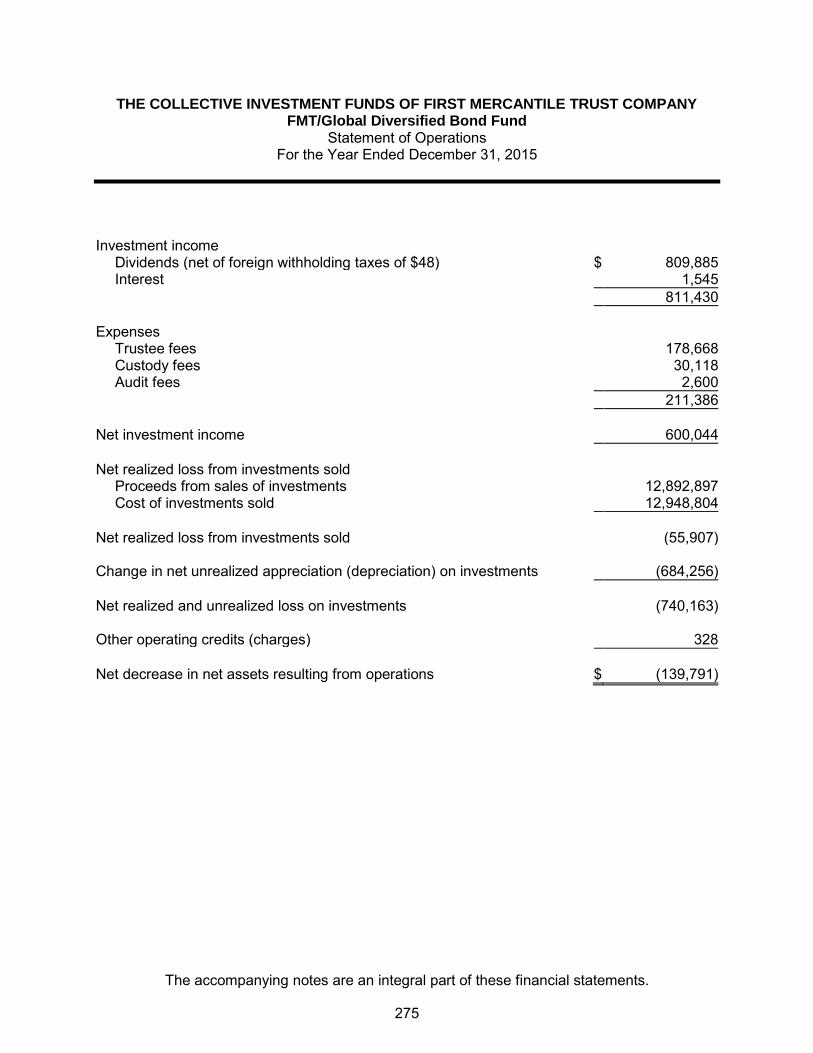
THE COLLECTIVE INVESTMENT FUNDS OF FIRST MERCANTILE TRUST COMPANY FMT/Global Diversified Bond Fund
Statement of Operations For the Year Ended December 31, 2015
The accompanying notes are an integral part of these financial statements.
Investment income
Dividends (net of foreign withholding taxes of $48) $ 809,885
Interest 1,545
811,430
Expenses
Trustee fees 178,668
Custody fees 30,118
Audit fees 2,600
211,386
Net investment income 600,044
Net realized loss from investments sold
Proceeds from sales of investments 12,892,897
Cost of investments sold 12,948,804
Net realized loss from investments sold (55,907)
Change in net unrealized appreciation (depreciation) on investments (684,256)
Net realized and unrealized loss on investments (740,163)
Other operating credits (charges) 328
Net decrease in net assets resulting from operations $ (139,791)
275

THE COLLECTIVE INVESTMENT FUNDS OF FIRST MERCANTILE TRUST COMPANY FMT/Global Diversified Bond Fund Statement of Changes in Net Assets
For the Year Ended December 31, 2015
The accompanying notes are an integral part of these financial statements.
Operations
Net investment income $ 600,044
Net realized loss from investments sold (55,907)
Change in net unrealized appreciation (depreciation) on investments (684,256)
Other operating credits (charges) 328
Net decrease in net assets resulting from operations (139,791)
Participant transactions
Proceeds from units purchased 7,188,283
Less payments for units redeemed 14,580,747
Decrease in net assets from participant transactions (7,392,464)
Total decrease in net assets (7,532,255)
Net assets at beginning of year 34,118,231
Net assets at end of year $ 26,585,976
276

THE COLLECTIVE INVESTMENT FUNDS OF FIRST MERCANTILE TRUST COMPANY FMT/Global Diversified Bond Fund
Schedule of Investments and Specific Fund Disclosures December 31, 2015
The accompanying notes are an integral part of these financial statements.
Investments Shares Fair Value ____________ ____________
Exchange-traded funds (99.7%) Schwab U.S. Aggregate Bond ETF 236,969 $ 12,201,534 SPDR Barclays High Yield Bond ETF 109,275 3,705,515 Vanguard Emerging Markets Government Bond ETF 50,050 3,708,204 Vanguard Total International Bond ETF 130,384 6,894,706 __________ Total Investments (Cost $27,134,360) $ 26,509,959 __________ __________ Specific Fund Disclosures Fair value The inputs or methodology used for valuing securities may not be indicative of the risks associated with investing in those securities. For more information on valuation inputs, and their aggregation into the levels used in the table below, please refer to note 4 to the financial statements. The following table sets forth by level, within the fair value hierarchy, the Fund's investments measured at fair value.
Total Level 1 Level 2 Level 3
Exchange-traded funds - Global Bonds $ 26,509,959 $ 26,509,959 $ — $ — __________ __________ __________ _________ __________ __________ __________ _________
Investment transactions The aggregate cost of purchases of investment securities and proceeds from sales of investment securities (other than temporary cash investments) totaled $7,136,408 and $12,892,897, respectively, for the year ended December 31, 2015. Class-specific expenses Class-specific trustee fees for the year ended December 31, 2015 were as follows: Class R4 $ 1,540 Class LifeStyle 177,128 $ 178,668
277

THE COLLECTIVE INVESTMENT FUNDS OF FIRST MERCANTILE TRUST COMPANY FMT/Global Diversified Bond Fund Schedule of Participant Transactions
December 31, 2015
The accompanying notes are an integral part of these financial statements.
Participant transactions by class for the year ended December 31, 2015 were as follows: Dollars Units Purchases Redemptions Net change Purchases Redemptions Net change Class R3 $ 313 $ — $ 313 31 31 Class R4 204,242 (11) 204,231 20,441 (1) 20,440 Class LifeStyle 6,983,728 (14,580,736) (7,597,008) — — — $ 7,188,283 $ (14,580,747) $ (7,392,464) 20,472 (1) 20,471
278

THE COLLECTIVE INVESTMENT FUNDS OF FIRST MERCANTILE TRUST COMPANY FMT/Global Diversified Bond Fund
Financial Highlights December 31, 2015
The accompanying notes are an integral part of these financial statements.
Change in Net Asset Value Resulting from Operations Ratios (to average net
assets)
NAV per Unit, Beginning of
Period
Net Investment
Income (Loss)(a)
Net Realized and Unrealized
Gain (Loss) from
Investments(a)
Total from Investment Activities
NAV per Unit, End of
Period Total
Return Expenses
Net Investment
Income (Loss)
Class R3(b) $ 10.0000 $ 0.0357 $ (0.0290) $ 0.0067 $ 10.0067 0.07 % (0.73) % 14.58 % Class R4(c) 10.0000 0.1457 (0.3300) (0.1843) 9.8157 (1.84) % (1.01) % 1.66 % (a) Per unit amounts are based on average daily units outstanding.
(b) For the period from December 23, 2015 (commencement of this class) through December
31, 2015.
(c) For the period from February 13, 2015 (commencement of this class) through December 31, 2015.
279
FMT/Loomis Sayles Bond Fund

THE COLLECTIVE INVESTMENT FUNDS OF FIRST MERCANTILE TRUST COMPANY FMT/Loomis Sayles Bond Fund Statement of Assets and Liabilities
December 31, 2015
The accompanying notes are an integral part of these financial statements.
Assets Investments in securities, at fair value $ 441,979 Liabilities Trustee fees 162
Net assets $ 441,817
Components of net assets
Units of
Participation NAV
per Unit Net
Assets Class R1 43,610 $ 9.2398 $ 402,944
Class R6 4,126 $ 9.4204 38,873
$ 441,817
280

THE COLLECTIVE INVESTMENT FUNDS OF FIRST MERCANTILE TRUST COMPANY FMT/Loomis Sayles Bond Fund
Statement of Operations For the Year Ended December 31, 2015
The accompanying notes are an integral part of these financial statements.
Investment income
Dividends $ 22,821
Expenses
Trustee fees 780
Audit fees 600
Custody fees 31
1,411
Net investment income 21,410
Net realized loss from investments sold
Proceeds from sales of investments 26,598
Cost of investments sold 27,254
Net realized loss from investments sold (656)
Change in net unrealized appreciation (depreciation) on investments (38,530)
Net realized and unrealized loss on investments (39,186)
Other operating credits (charges) 191
Net decrease in net assets resulting from operations $ (17,585)
281
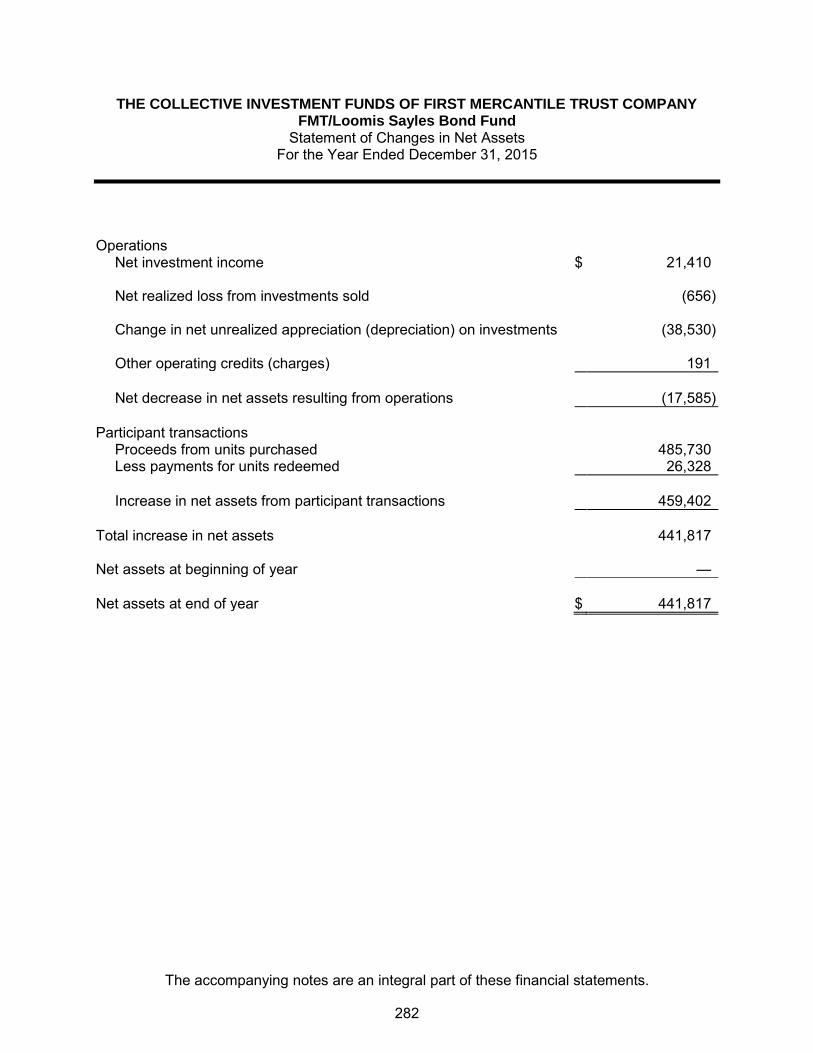
THE COLLECTIVE INVESTMENT FUNDS OF FIRST MERCANTILE TRUST COMPANY FMT/Loomis Sayles Bond Fund
Statement of Changes in Net Assets For the Year Ended December 31, 2015
The accompanying notes are an integral part of these financial statements.
Operations
Net investment income $ 21,410
Net realized loss from investments sold (656)
Change in net unrealized appreciation (depreciation) on investments (38,530)
Other operating credits (charges) 191
Net decrease in net assets resulting from operations (17,585)
Participant transactions
Proceeds from units purchased 485,730
Less payments for units redeemed 26,328
Increase in net assets from participant transactions 459,402
Total increase in net assets 441,817
Net assets at beginning of year —
Net assets at end of year $ 441,817
282

THE COLLECTIVE INVESTMENT FUNDS OF FIRST MERCANTILE TRUST COMPANY FMT/Loomis Sayles Bond Fund
Schedule of Investments and Specific Fund Disclosures December 31, 2015
The accompanying notes are an integral part of these financial statements.
Investments Shares Fair Value ____________ ____________
Mutual fund (100.0%) Loomis Sayles Bond Fund (Cost $480,509) 34,315 $ 441,979 __________ __________ Specific Fund Disclosures Fair value The inputs or methodology used for valuing securities may not be indicative of the risks associated with investing in those securities. For more information on valuation inputs, and their aggregation into the levels used in the table below, please refer to note 4 to the financial statements. The following table sets forth by level, within the fair value hierarchy, the Fund's investments measured at fair value.
Total Level 1 Level 2 Level 3
Core Bond $ 441,979 $ 441,979 $ — $ — __________ __________ __________ _________ __________ __________ __________ _________ Investment transactions The aggregate cost of purchases of investment securities and proceeds from sales of investment securities (other than temporary cash investments) totaled $507,763 and $26,598 respectively, for the year ended December 31, 2015. Class-specific expenses Class-specific trustee fees for the year ended December 31, 2015 were as follows: Class R1 $ 494 Class R6 286 $ 780
283

THE COLLECTIVE INVESTMENT FUNDS OF FIRST MERCANTILE TRUST COMPANY FMT/Loomis Sayles Bond Fund
Schedule of Participant Transactions December 31, 2015
The accompanying notes are an integral part of these financial statements.
Participant transactions by class for the year ended December 31, 2015 were as follows: Dollars Units Purchases Redemptions Net change Purchases Redemptions Net change Class R1 $ 419,016 $ (1,360) $ 417,656 43,753 (143) 43,610 Class R6 66,714 (24,968) 41,746 6,696 (2,570) 4,126 $ 485,730 $ (26,328) $ 459,402 50,449 (2,713) 47,736
284

THE COLLECTIVE INVESTMENT FUNDS OF FIRST MERCANTILE TRUST COMPANY FMT/Loomis Sayles Bond Fund
Financial Highlights December 31, 2015
The accompanying notes are an integral part of these financial statements.
Change in Net Asset Value Resulting from Operations Ratios (to average net
assets)
NAV per Unit, Beginning of
Period
Net Investment
Income (Loss)(a)
Net Realized and Unrealized
Gain (Loss) from
Investments(a)
Total from Investment Activities
NAV per Unit, End of
Period Total
Return Expenses
Net Investment
Income (Loss)
Class R1(b) $ 10.0000 $ 0.8543 $ (1.6145) $ (0.7602) $ 9.2398 (7.60) % (0.73) % 14.03 % Class R6(c) 10.0000 0.3912 (0.9708) (0.5796) 9.4204 (5.80) % (1.67) % 7.94 % (a) Per unit amounts are based on average daily units outstanding.
(b) For the period from May 11, 2015 (commencement of this class) through December 31,
2015.
(c) For the period from June 30, 2015 (commencement of this class) through December 31, 2015.
285

FMT/MetWest Total Return Fund

THE COLLECTIVE INVESTMENT FUNDS OF FIRST MERCANTILE TRUST COMPANY FMT/MetWest Total Return Fund Statement of Assets and Liabilities
December 31, 2015
The accompanying notes are an integral part of these financial statements.
Assets Investments in securities, at fair value $ 49,031,802 Receivables
Dividends 69,695
Total assets 49,101,497
Liabilities Trustee fees 16,005
Net assets $ 49,085,492
Components of net assets
Units of
Participation NAV
per Unit Net
Assets Class R1 679,742 $ 10.0222 $ 6,812,528
Class R2 1,235,387 $ 9.9617 12,306,515
Class R3 131,253 $ 9.9444 1,305,230
Class R4 524,092 $ 9.8862 5,181,291
Class R5 210,014 $ 9.9089 2,081,009
Class R6 63,060 $ 9.8913 623,746
Class R7 33,254 $ 9.8416 327,273
Class R8 12,176 $ 9.8775 120,267
Class LifeStyle 20,327,633
$ 49,085,492
286

THE COLLECTIVE INVESTMENT FUNDS OF FIRST MERCANTILE TRUST COMPANY FMT/MetWest Total Return Fund
Statement of Operations For the Year Ended December 31, 2015
The accompanying notes are an integral part of these financial statements.
Investment income
Dividends $ 1,216,935
Expenses
Trustee fees 260,877
Custody fees 11,674
Audit fees 1,451
274,002
Net investment income 942,933
Net realized loss from investments sold
Proceeds from sales of investments 56,580,344
Cost of investments sold 58,382,244
Net realized loss from investments sold (1,801,900)
Change in net unrealized appreciation (depreciation) on investments (1,823)
Net realized and unrealized loss on investments (1,803,723)
Other operating credits (charges) 120,041
Net decrease in net assets resulting from operations $ (740,749)
287

THE COLLECTIVE INVESTMENT FUNDS OF FIRST MERCANTILE TRUST COMPANY FMT/MetWest Total Return Fund
Statement of Changes in Net Assets For the Year Ended December 31, 2015
The accompanying notes are an integral part of these financial statements.
Operations
Net investment income $ 942,933
Net realized loss from investments sold (1,801,900)
Change in net unrealized appreciation (depreciation) on investments (1,823)
Other operating credits (charges) 120,041
Net decrease in net assets resulting from operations (740,749)
Participant transactions
Proceeds from units purchased 60,609,194
Less payments for units redeemed 15,556,110
Increase in net assets from participant transactions 45,053,084
Total increase in net assets 44,312,335
Net assets at beginning of year 4,773,157
Net assets at end of year $ 49,085,492
288

THE COLLECTIVE INVESTMENT FUNDS OF FIRST MERCANTILE TRUST COMPANY FMT/MetWest Total Return Fund
Schedule of Investments and Specific Fund Disclosures December 31, 2015
The accompanying notes are an integral part of these financial statements.
Investments Shares Fair Value ____________ ____________
Mutual fund (99.9%) MetWest Total Return Bond Fund (Cost $49,031,480) 4,616,931 $ 49,031,802 __________ __________ Specific Fund Disclosures Fair value The inputs or methodology used for valuing securities may not be indicative of the risks associated with investing in those securities. For more information on valuation inputs, and their aggregation into the levels used in the table below, please refer to note 4 to the financial statements. The following table sets forth by level, within the fair value hierarchy, the Fund's investments measured at fair value.
Total Level 1 Level 2 Level 3
Mutual fund - Core Bond $ 49,031,802 $ 49,031,802 $ — $ — __________ __________ __________ _________ __________ __________ __________ _________ Investment transactions The aggregate cost of purchases of investment securities and proceeds from sales of investment securities (other than temporary cash investments) totaled $102,641,252 and $56,580,344, respectively, for the year ended December 31, 2015. Class-specific expenses Class-specific trustee fees for the year ended December 31, 2015 were as follows: Class R1 $ 19,340 Class R2 60,478 Class R3 11,278 Class R4 41,897 Class R5 20,382 Class R6 7,127 Class R7 2,556 Class R8 445 Class LifeStyle 97,374 $ 260,877
289
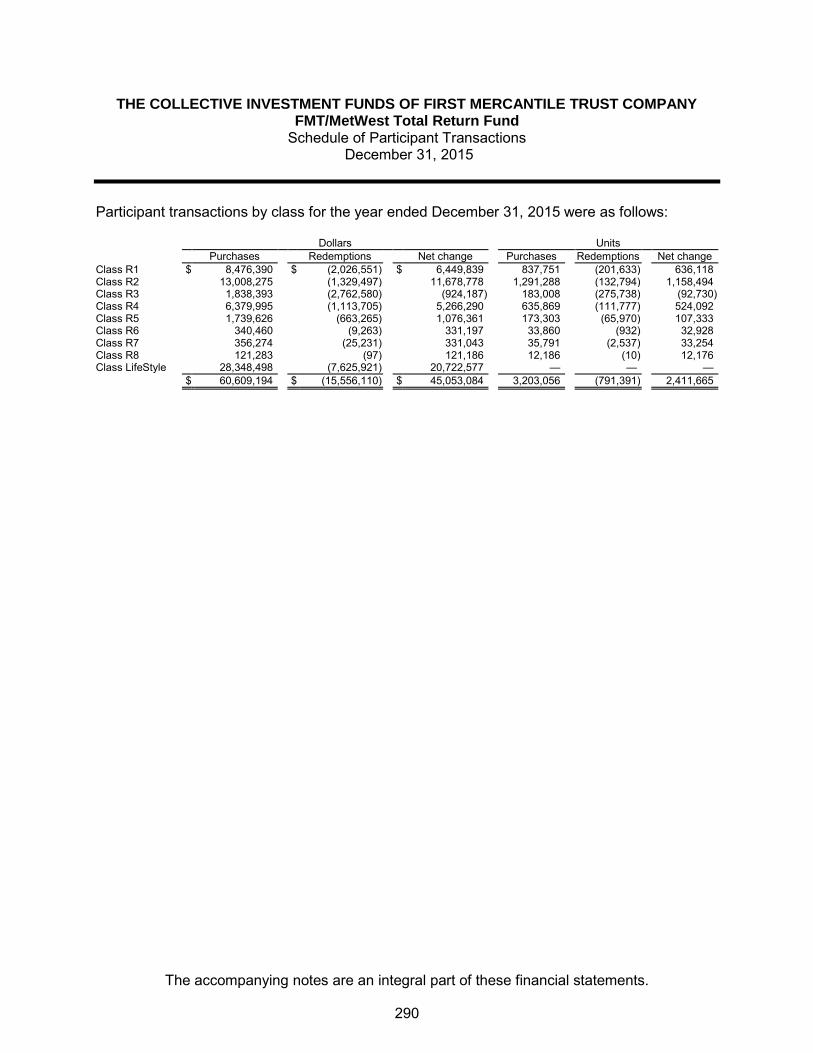
THE COLLECTIVE INVESTMENT FUNDS OF FIRST MERCANTILE TRUST COMPANY FMT/MetWest Total Return Fund
Schedule of Participant Transactions December 31, 2015
The accompanying notes are an integral part of these financial statements.
Participant transactions by class for the year ended December 31, 2015 were as follows: Dollars Units Purchases Redemptions Net change Purchases Redemptions Net change Class R1 $ 8,476,390 $ (2,026,551) $ 6,449,839 837,751 (201,633) 636,118 Class R2 13,008,275 (1,329,497) 11,678,778 1,291,288 (132,794) 1,158,494 Class R3 1,838,393 (2,762,580) (924,187) 183,008 (275,738) (92,730) Class R4 6,379,995 (1,113,705) 5,266,290 635,869 (111,777) 524,092 Class R5 1,739,626 (663,265) 1,076,361 173,303 (65,970) 107,333 Class R6 340,460 (9,263) 331,197 33,860 (932) 32,928 Class R7 356,274 (25,231) 331,043 35,791 (2,537) 33,254 Class R8 121,283 (97) 121,186 12,186 (10) 12,176 Class LifeStyle 28,348,498 (7,625,921) 20,722,577 — — — $ 60,609,194 $ (15,556,110) $ 45,053,084 3,203,056 (791,391) 2,411,665
290

THE COLLECTIVE INVESTMENT FUNDS OF FIRST MERCANTILE TRUST COMPANY FMT/MetWest Total Return Fund
Financial Highlights December 31, 2015
The accompanying notes are an integral part of these financial statements.
Change in Net Asset Value Resulting from Operations Ratios (to average net
assets)
NAV per Unit, Beginning of
Period
Net Investment
Income (Loss)(a)
Net Realized and Unrealized
Gain (Loss) from
Investments(a)
Total from Investment Activities
NAV per Unit, End of
Period Total
Return Expenses
Net Investment
Income (Loss)
Class R1 $ 10.0361 $ 0.2875 $ (0.3014) $ (0.0139) $ 10.0222 (0.14) % (0.38) % 2.85 % Class R2 9.9975 0.2558 (0.2916) (0.0358) 9.9617 (0.36) % (0.60) % 2.55 % Class R3 9.9968 0.1963 (0.2487) (0.0524) 9.9444 (0.52) % (0.77) % 1.95 % Class R4(b) 10.0000 0.2174 (0.3312) (0.1138) 9.8862 (1.14) % (0.94) % 2.21 % Class R5 9.9953 0.1987 (0.2851) (0.0864) 9.9089 (0.86) % (1.11) % 1.99 % Class R6 9.9945 0.1797 (0.2829) (0.1032) 9.8913 (1.03) % (1.28) % 1.80 % Class R7(c) 10.0000 0.1982 (0.3566) (0.1584) 9.8416 (1.58) % (1.45) % 2.40 % Class R8(d) 10.0000 0.2874 (0.4099) (0.1225) 9.8775 (1.23) % (1.61) % 4.96 % (a) Per unit amounts are based on average daily units outstanding.
(b) For the period from January 6, 2015 (commencement of this class) through December 31,
2015.
(c) For the period from March 3, 2015 (commencement of this class) through December 31, 2015.
(d) For the period from June 2, 2015 (commencement of this class) through December 31, 2015.
291
FMT/PIMCO High Yield Fund

THE COLLECTIVE INVESTMENT FUNDS OF FIRST MERCANTILE TRUST COMPANY FMT/PIMCO High Yield Fund
Statement of Assets and Liabilities December 31, 2015
The accompanying notes are an integral part of these financial statements.
Assets Investments in securities, at fair value $ 7,772,104 Receivables
Dividends 39,760
Total assets 7,811,864
Liabilities Trustee fees 4,327
Net assets $ 7,807,537
Components of net assets
Units of
Participation NAV
per Unit Net
Assets Class R1 232,371 $ 19.5099 $ 4,533,523
Class R2 3,645 $ 12.1745 44,374
Class R3 62,653 $ 11.8106 739,973
Class R4 51,808 $ 12.1753 630,783
Class R5 62,195 $ 11.8541 737,271
Class R6 41,818 $ 11.7420 491,030
Class R7 37,067 $ 11.7588 435,866
Class R8 17,054 $ 11.4178 194,717
$ 7,807,537
292

THE COLLECTIVE INVESTMENT FUNDS OF FIRST MERCANTILE TRUST COMPANY FMT/PIMCO High Yield Fund
Statement of Operations For the Year Ended December 31, 2015
The accompanying notes are an integral part of these financial statements.
Investment income
Dividends $ 676,014
Expenses
Trustee fees 56,124
Custody fees 3,056
Audit fees 1,200
60,380
Net investment income 615,634
Net realized loss from investments sold
Proceeds from sales of investments 3,277,945
Cost of investments sold 3,353,791
Net realized loss from investments sold (75,846)
Change in net unrealized appreciation (depreciation) on investments (726,324)
Net realized and unrealized loss on investments (802,170)
Net decrease in net assets resulting from operations $ (186,536)
293

THE COLLECTIVE INVESTMENT FUNDS OF FIRST MERCANTILE TRUST COMPANY FMT/PIMCO High Yield Fund
Statement of Changes in Net Assets For the Year Ended December 31, 2015
The accompanying notes are an integral part of these financial statements.
Operations
Net investment income $ 615,634
Net realized loss from investments sold (75,846)
Change in net unrealized appreciation (depreciation) on investments (726,324)
Net decrease in net assets resulting from operations (186,536)
Participant transactions
Proceeds from units purchased 3,040,664
Less payments for units redeemed 4,226,079
Decrease in net assets from participant transactions (1,185,415)
Total decrease in net assets (1,371,951)
Net assets at beginning of year 9,179,488
Net assets at end of year $ 7,807,537
294

THE COLLECTIVE INVESTMENT FUNDS OF FIRST MERCANTILE TRUST COMPANY FMT/PIMCO High Yield Fund
Schedule of Investments and Specific Fund Disclosures December 31, 2015
The accompanying notes are an integral part of these financial statements.
Investments Shares Fair Value ____________ ____________
Mutual fund (99.5%) PIMCO High Yield Institutional Fund (Cost $8,694,304) 940,933 $ 7,772,104 __________ __________ Specific Fund Disclosures Fair value The inputs or methodology used for valuing securities may not be indicative of the risks associated with investing in those securities. For more information on valuation inputs, and their aggregation into the levels used in the table below, please refer to note 4 to the financial statements. The following table sets forth by level, within the fair value hierarchy, the Fund's investments measured at fair value.
Total Level 1 Level 2 Level 3
Mutual fund - High Yield Bond $ 7,772,104 $ 7,772,104 $ — $ — __________ __________ __________ _________ __________ __________ __________ _________ Investment transactions The aggregate cost of purchases of investment securities and proceeds from sales of investment securities (other than temporary cash investments) totaled $2,718,169 and $3,277,945, respectively, for the year ended December 31, 2015. Class-specific expenses Class-specific trustee fees for the year ended December 31, 2015 were as follows: Class R1 $ 17,069 Class R2 534 Class R3 6,102 Class R4 6,251 Class R5 8,598 Class R6 5,988 Class R7 8,026 Class R8 3,556 $ 56,124
295
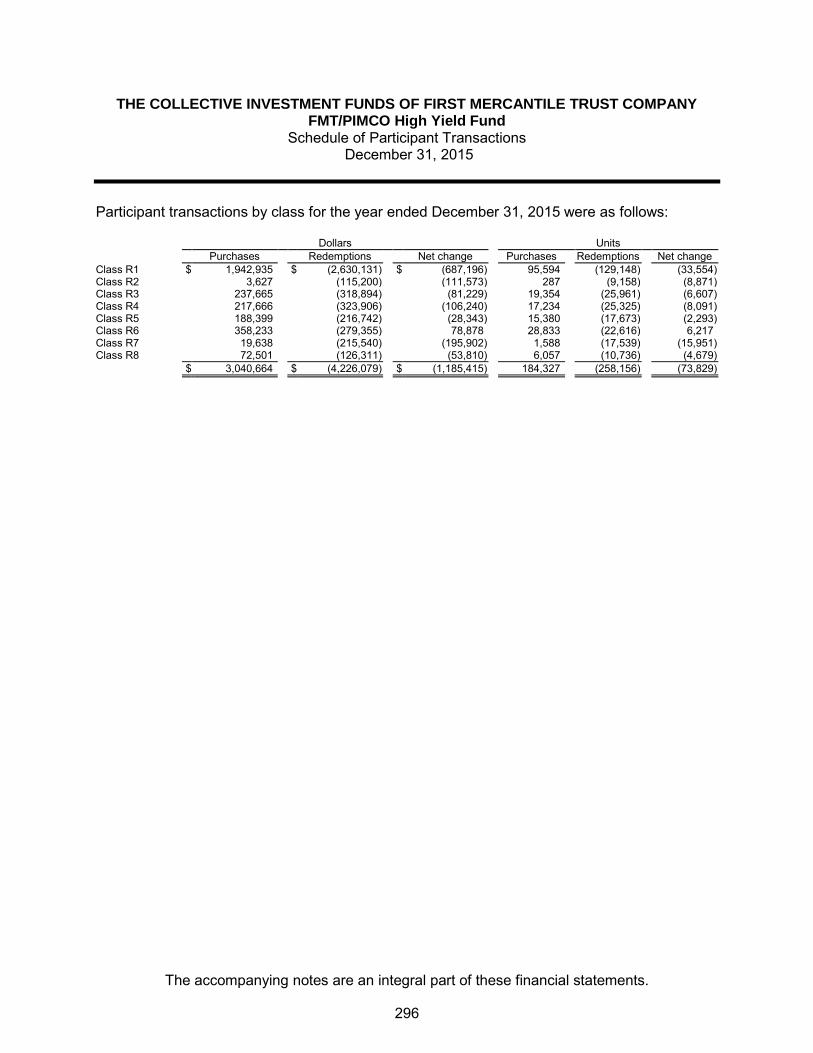
THE COLLECTIVE INVESTMENT FUNDS OF FIRST MERCANTILE TRUST COMPANY FMT/PIMCO High Yield Fund
Schedule of Participant Transactions December 31, 2015
The accompanying notes are an integral part of these financial statements.
Participant transactions by class for the year ended December 31, 2015 were as follows: Dollars Units Purchases Redemptions Net change Purchases Redemptions Net change Class R1 $ 1,942,935 $ (2,630,131) $ (687,196) 95,594 (129,148) (33,554) Class R2 3,627 (115,200) (111,573) 287 (9,158) (8,871) Class R3 237,665 (318,894) (81,229) 19,354 (25,961) (6,607) Class R4 217,666 (323,906) (106,240) 17,234 (25,325) (8,091) Class R5 188,399 (216,742) (28,343) 15,380 (17,673) (2,293) Class R6 358,233 (279,355) 78,878 28,833 (22,616) 6,217 Class R7 19,638 (215,540) (195,902) 1,588 (17,539) (15,951) Class R8 72,501 (126,311) (53,810) 6,057 (10,736) (4,679) $ 3,040,664 $ (4,226,079) $ (1,185,415) 184,327 (258,156) (73,829)
296

THE COLLECTIVE INVESTMENT FUNDS OF FIRST MERCANTILE TRUST COMPANY FMT/PIMCO High Yield Fund
Financial Highlights December 31, 2015
The accompanying notes are an integral part of these financial statements.
Change in Net Asset Value Resulting from Operations Ratios (to average net
assets)
NAV per Unit, Beginning of
Period
Net Investment
Income (Loss)(a)
Net Realized and Unrealized
Gain (Loss) from
Investments(a)
Total from Investment Activities
NAV per Unit, End of
Period Total
Return Expenses
Net Investment
Income (Loss)
Class R1 $ 19.9684 $ 1.5301 $ (1.9886) $ (0.4585) $ 19.5099 (2.30) % (0.40) % 7.55 % Class R2 12.4881 0.7881 (1.1017) (0.3136) 12.1745 (2.51) % (0.62) % 6.22 % Class R3 12.1355 0.8655 (1.1904) (0.3249) 11.8106 (2.68) % (0.79) % 7.04 % Class R4 12.5315 0.8852 (1.2414) (0.3562) 12.1753 (2.84) % (0.96) % 6.98 % Class R5 12.2216 0.8454 (1.2129) (0.3675) 11.8541 (3.01) % (1.13) % 6.85 % Class R6 12.1267 0.8427 (1.2274) (0.3847) 11.7420 (3.17) % (1.30) % 6.89 % Class R7 12.1647 0.7457 (1.1516) (0.4059) 11.7588 (3.34) % (1.47) % 6.07 % Class R8 11.8320 0.7330 (1.1472) (0.4142) 11.4178 (3.50) % (1.64) % 6.15 % (a) Per unit amounts are based on average daily units outstanding.
297

FMT/PIMCO Total Return Institutional Fund

THE COLLECTIVE INVESTMENT FUNDS OF FIRST MERCANTILE TRUST COMPANY FMT/PIMCO Total Return Institutional Fund
Statement of Assets and Liabilities December 31, 2015
The accompanying notes are an integral part of these financial statements.
Assets Investments in securities, at fair value $ 80,657,959 Receivables
Dividends 230,719
Total assets 80,888,678
Liabilities Trustee fees 39,490
Net assets $ 80,849,188
Components of net assets
Units of
Participation NAV
per Unit Net
Assets Class R1 1,985,603 $ 16.9265 $ 33,609,276
Class R2 505,258 $ 11.2722 5,695,387
Class R3 782,491 $ 11.1837 8,751,124
Class R4 891,680 $ 11.1940 9,981,499
Class R5 488,693 $ 11.1174 5,433,015
Class R6 376,509 $ 11.0085 4,144,795
Class R7 85,643 $ 10.8685 930,814
Class R8 163,883 $ 10.7910 1,768,463
Class LifeStyle 10,534,815
$ 80,849,188
298
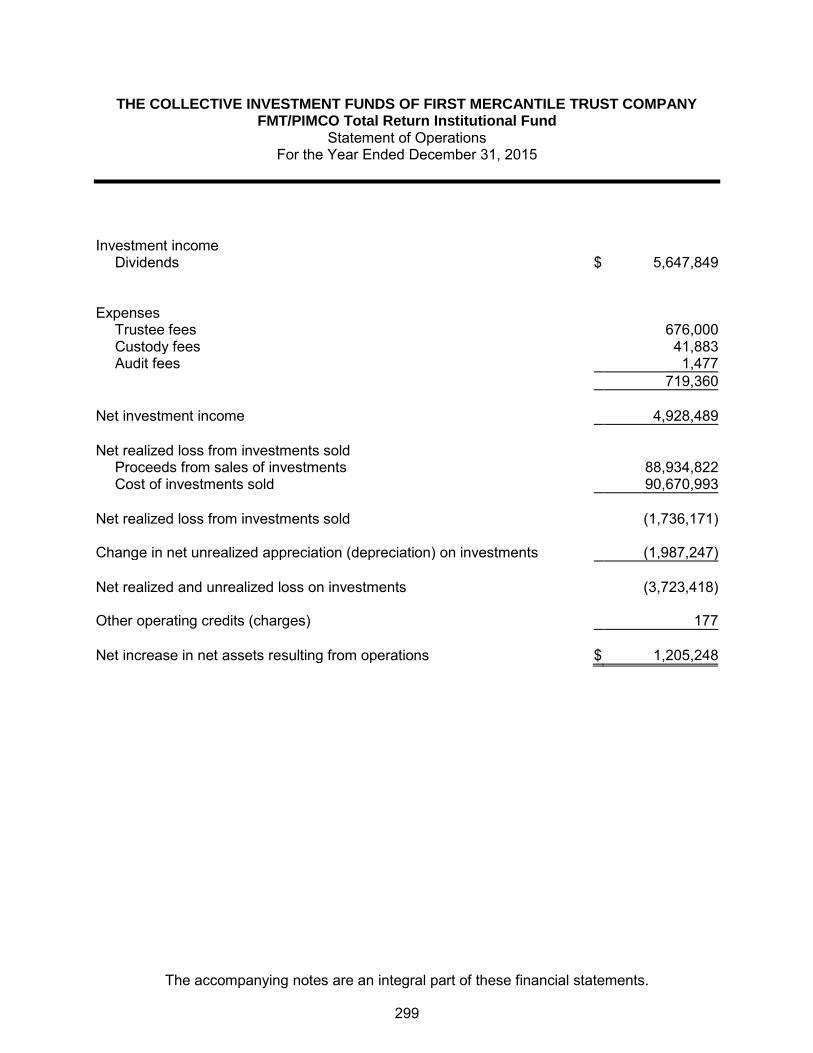
THE COLLECTIVE INVESTMENT FUNDS OF FIRST MERCANTILE TRUST COMPANY FMT/PIMCO Total Return Institutional Fund
Statement of Operations For the Year Ended December 31, 2015
The accompanying notes are an integral part of these financial statements.
Investment income
Dividends $ 5,647,849
Expenses
Trustee fees 676,000
Custody fees 41,883
Audit fees 1,477
719,360
Net investment income 4,928,489
Net realized loss from investments sold
Proceeds from sales of investments 88,934,822
Cost of investments sold 90,670,993
Net realized loss from investments sold (1,736,171)
Change in net unrealized appreciation (depreciation) on investments (1,987,247)
Net realized and unrealized loss on investments (3,723,418)
Other operating credits (charges) 177
Net increase in net assets resulting from operations $ 1,205,248
299
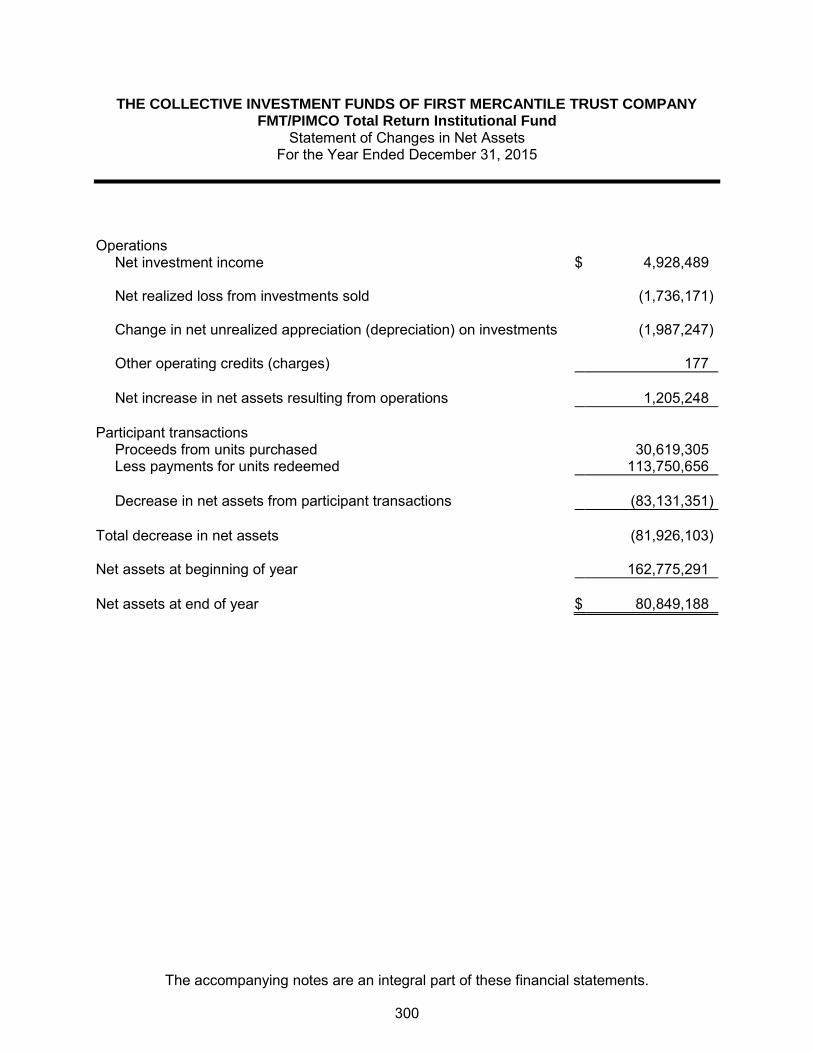
THE COLLECTIVE INVESTMENT FUNDS OF FIRST MERCANTILE TRUST COMPANY FMT/PIMCO Total Return Institutional Fund
Statement of Changes in Net Assets For the Year Ended December 31, 2015
The accompanying notes are an integral part of these financial statements.
Operations
Net investment income $ 4,928,489
Net realized loss from investments sold (1,736,171)
Change in net unrealized appreciation (depreciation) on investments (1,987,247)
Other operating credits (charges) 177
Net increase in net assets resulting from operations 1,205,248
Participant transactions
Proceeds from units purchased 30,619,305
Less payments for units redeemed 113,750,656
Decrease in net assets from participant transactions (83,131,351)
Total decrease in net assets (81,926,103)
Net assets at beginning of year 162,775,291
Net assets at end of year $ 80,849,188
300

THE COLLECTIVE INVESTMENT FUNDS OF FIRST MERCANTILE TRUST COMPANY FMT/PIMCO Total Return Institutional Fund
Schedule of Investments and Specific Fund Disclosures December 31, 2015
The accompanying notes are an integral part of these financial statements.
Investments Shares Fair Value ____________ ____________
Mutual fund (99.8%)
PIMCO Total Return Institutional Fund (Cost $87,476,556) 8,009,728 $ 80,657,959 __________ __________
Specific Fund Disclosures Fair value The inputs or methodology used for valuing securities may not be indicative of the risks associated with investing in those securities. For more information on valuation inputs, and their aggregation into the levels used in the table below, please refer to note 4 to the financial statements. The following table sets forth by level, within the fair value hierarchy, the Fund's investments measured at fair value.
Total Level 1 Level 2 Level 3
Mutual fund - Core Bond $ 80,657,959 $ 80,657,959 $ — $ — __________ __________ __________ _________ __________ __________ __________ _________ Investment transactions The aggregate cost of purchases of investment securities and proceeds from sales of investment securities (other than temporary cash investments) totaled $10,825,380 and $88,934,822 respectively, for the year ended December 31, 2015. Class-specific expenses Class-specific trustee fees for the year ended December 31, 2015 were as follows: Class R1 $ 148,898 Class R2 38,326 Class R3 67,002 Class R4 105,473 Class R5 89,259 Class R6 62,813 Class R7 18,553 Class R8 32,937 Class LifeStyle 112,739 $ 676,000
301

THE COLLECTIVE INVESTMENT FUNDS OF FIRST MERCANTILE TRUST COMPANY FMT/PIMCO Total Return Institutional Fund
Schedule of Participant Transactions December 31, 2015
The accompanying notes are an integral part of these financial statements.
Participant transactions by class for the year ended December 31, 2015 were as follows: Dollars Units Purchases Redemptions Net change Purchases Redemptions Net change Class R1 $ 9,104,693 $ (33,548,368) $ (24,443,675) 534,050 (1,962,711) (1,428,661) Class R2 2,559,420 (14,543,345) (11,983,925) 225,560 (1,274,661) (1,049,101) Class R3 4,674,408 (5,724,343) (1,049,935) 414,793 (507,674) (92,881) Class R4 7,141,982 (12,907,913) (5,765,931) 630,919 (1,137,408) (506,489) Class R5 1,456,266 (8,102,327) (6,646,061) 129,366 (722,253) (592,887) Class R6 961,585 (2,947,979) (1,986,394) 86,375 (264,536) (178,161) Class R7 207,260 (1,216,101) (1,008,841) 18,802 (110,279) (91,477) Class R8 418,925 (1,605,317) (1,186,392) 38,303 (146,007) (107,704) Class LifeStyle 4,094,766 (33,154,963) (29,060,197) — — — $ 30,619,305 $ (113,750,656) $ (83,131,351) 2,078,168 (6,125,529) (4,047,361)
302
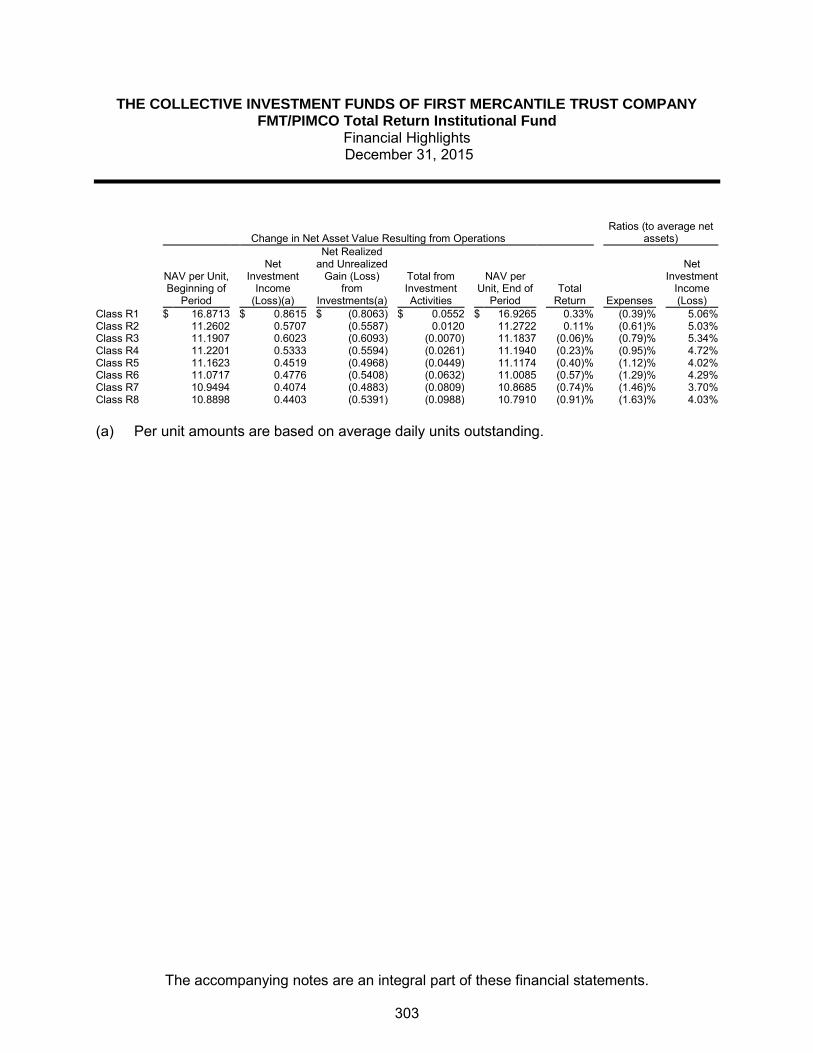
THE COLLECTIVE INVESTMENT FUNDS OF FIRST MERCANTILE TRUST COMPANY FMT/PIMCO Total Return Institutional Fund
Financial Highlights December 31, 2015
The accompanying notes are an integral part of these financial statements.
Change in Net Asset Value Resulting from Operations Ratios (to average net
assets)
NAV per Unit, Beginning of
Period
Net Investment
Income (Loss)(a)
Net Realized and Unrealized
Gain (Loss) from
Investments(a)
Total from Investment Activities
NAV per Unit, End of
Period Total
Return Expenses
Net Investment
Income (Loss)
Class R1 $ 16.8713 $ 0.8615 $ (0.8063) $ 0.0552 $ 16.9265 0.33 % (0.39) % 5.06 % Class R2 11.2602 0.5707 (0.5587) 0.0120 11.2722 0.11 % (0.61) % 5.03 % Class R3 11.1907 0.6023 (0.6093) (0.0070) 11.1837 (0.06) % (0.79) % 5.34 % Class R4 11.2201 0.5333 (0.5594) (0.0261) 11.1940 (0.23) % (0.95) % 4.72 % Class R5 11.1623 0.4519 (0.4968) (0.0449) 11.1174 (0.40) % (1.12) % 4.02 % Class R6 11.0717 0.4776 (0.5408) (0.0632) 11.0085 (0.57) % (1.29) % 4.29 % Class R7 10.9494 0.4074 (0.4883) (0.0809) 10.8685 (0.74) % (1.46) % 3.70 % Class R8 10.8898 0.4403 (0.5391) (0.0988) 10.7910 (0.91) % (1.63) % 4.03 % (a) Per unit amounts are based on average daily units outstanding.
303

FMT/T. Rowe Price International Bond Fund

THE COLLECTIVE INVESTMENT FUNDS OF FIRST MERCANTILE TRUST COMPANY
FMT/T. Rowe Price International Bond Fund Statement of Assets and Liabilities
December 31, 2015
The accompanying notes are an integral part of these financial statements.
Assets Investments in securities, at fair value $ 2,369,947 Receivables
Dividends 3,094
Total assets 2,373,041
Liabilities Trustee fees 1,116
Net assets $ 2,371,925
Components of net assets
Units of
Participation NAV
per Unit Net
Assets Class R1 128,786 $ 10.3023 $ 1,326,782
Class R2 37,027 $ 8.9558 331,607
Class R3 34,881 $ 9.0811 316,752
Class R4 19,938 $ 9.0467 180,371
Class R5 10,477 $ 8.9459 93,727
Class R6 11,595 $ 8.9158 103,382
Class R7 2,115 $ 8.8412 18,701
Class R8 70 $ 8.6180 603
$ 2,371,925
304

THE COLLECTIVE INVESTMENT FUNDS OF FIRST MERCANTILE TRUST COMPANY
FMT/T. Rowe Price International Bond Fund Statement of Operations
For the Year Ended December 31, 2015
The accompanying notes are an integral part of these financial statements.
Investment income
Dividends $ 63,940
Expenses
Trustee fees 17,659
Custody fees 1,304
Audit fees 1,200
20,163
Net investment income 43,777
Net realized loss from investments sold
Proceeds from sales of investments 2,653,554
Cost of investments sold 3,009,739
Net realized loss from investments sold (356,185)
Change in net unrealized appreciation (depreciation) on investments 64,723
Net realized and unrealized loss on investments (291,462)
Other operating credits (charges) 5,658
Net decrease in net assets resulting from operations $ (242,027)
305
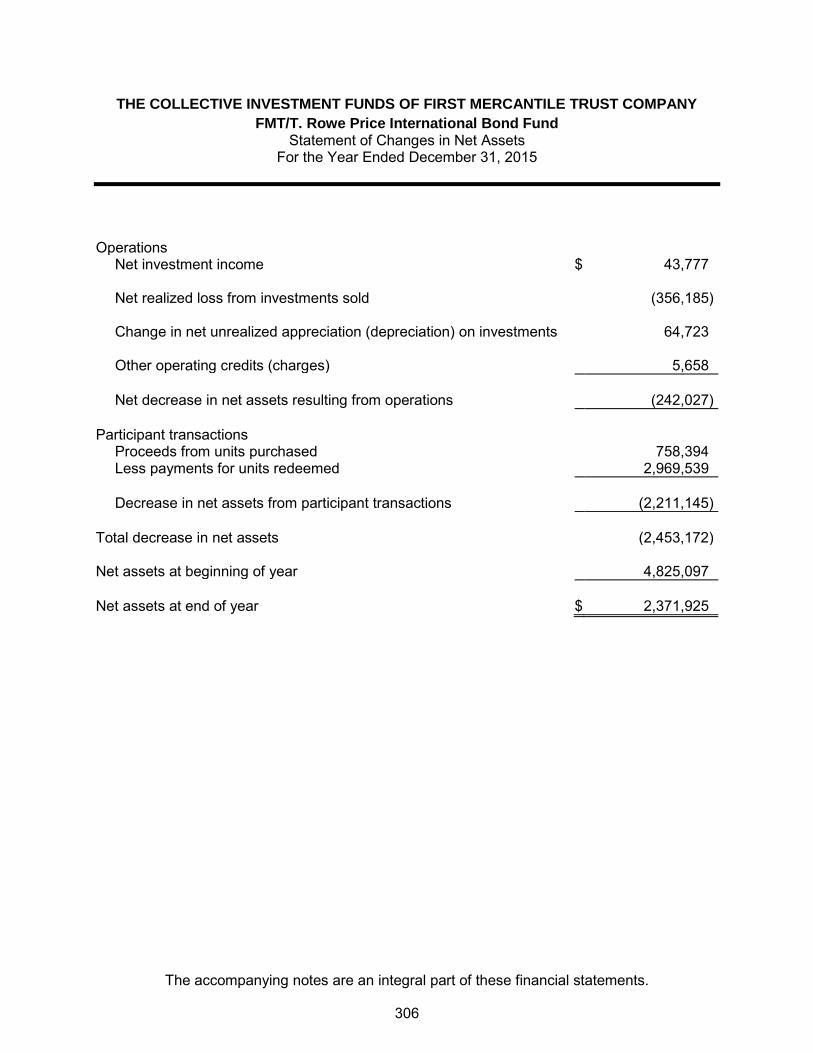
THE COLLECTIVE INVESTMENT FUNDS OF FIRST MERCANTILE TRUST COMPANY
FMT/T. Rowe Price International Bond Fund Statement of Changes in Net Assets
For the Year Ended December 31, 2015
The accompanying notes are an integral part of these financial statements.
Operations
Net investment income $ 43,777
Net realized loss from investments sold (356,185)
Change in net unrealized appreciation (depreciation) on investments 64,723
Other operating credits (charges) 5,658
Net decrease in net assets resulting from operations (242,027)
Participant transactions
Proceeds from units purchased 758,394
Less payments for units redeemed 2,969,539
Decrease in net assets from participant transactions (2,211,145)
Total decrease in net assets (2,453,172)
Net assets at beginning of year 4,825,097
Net assets at end of year $ 2,371,925
306
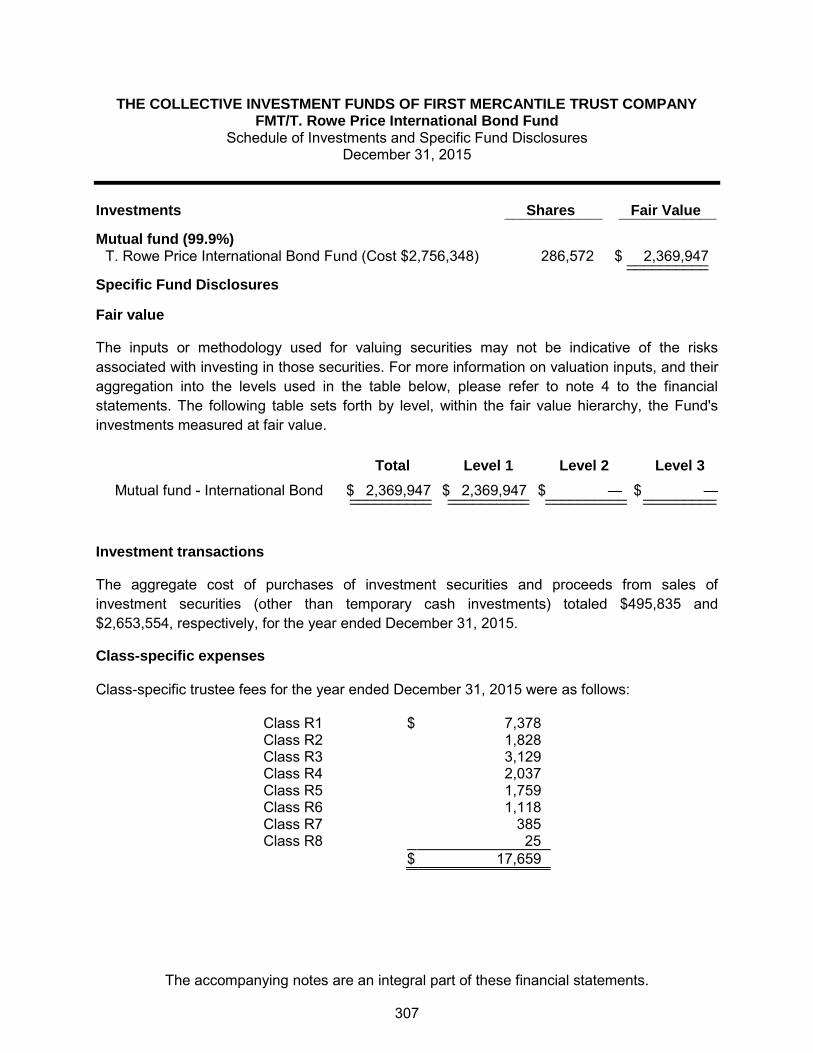
THE COLLECTIVE INVESTMENT FUNDS OF FIRST MERCANTILE TRUST COMPANY FMT/T. Rowe Price International Bond Fund
Schedule of Investments and Specific Fund Disclosures December 31, 2015
The accompanying notes are an integral part of these financial statements.
Investments Shares Fair Value ____________ ____________
Mutual fund (99.9%) T. Rowe Price International Bond Fund (Cost $2,756,348) 286,572 $ 2,369,947 __________ __________ Specific Fund Disclosures
Fair value
The inputs or methodology used for valuing securities may not be indicative of the risks associated with investing in those securities. For more information on valuation inputs, and their aggregation into the levels used in the table below, please refer to note 4 to the financial statements. The following table sets forth by level, within the fair value hierarchy, the Fund's investments measured at fair value.
Total Level 1 Level 2 Level 3
Mutual fund - International Bond $ 2,369,947 $ 2,369,947 $ — $ — __________ __________ __________ _________ __________ __________ __________ _________
Investment transactions
The aggregate cost of purchases of investment securities and proceeds from sales of investment securities (other than temporary cash investments) totaled $495,835 and $2,653,554, respectively, for the year ended December 31, 2015.
Class-specific expenses Class-specific trustee fees for the year ended December 31, 2015 were as follows: Class R1 $ 7,378 Class R2 1,828 Class R3 3,129 Class R4 2,037 Class R5 1,759 Class R6 1,118 Class R7 385 Class R8 25 $ 17,659
307

THE COLLECTIVE INVESTMENT FUNDS OF FIRST MERCANTILE TRUST COMPANY
FMT/T. Rowe Price International Bond Fund Schedule of Participant Transactions
December 31, 2015
The accompanying notes are an integral part of these financial statements.
Participant transactions by class for the year ended December 31, 2015 were as follows: Dollars Units Purchases Redemptions Net change Purchases Redemptions Net change Class R1 $ 366,614 $ (2,020,797) $ (1,654,183) 34,287 (191,793) (157,506) Class R2 58,223 (15,332) 42,891 6,316 (1,677) 4,639 Class R3 83,286 (337,893) (254,607) 8,810 (35,927) (27,117) Class R4 161,722 (154,595) 7,127 17,194 (16,889) 305 Class R5 48,266 (362,112) (313,846) 5,272 (38,570) (33,298) Class R6 38,835 (20,517) 18,318 4,282 (2,201) 2,081 Class R7 1,093 (46,604) (45,511) 118 (4,989) (4,871) Class R8 355 (11,689) (11,334) 39 (1,270) (1,231) $ 758,394 $ (2,969,539) $ (2,211,145) 76,318 (293,316) (216,998)
308

THE COLLECTIVE INVESTMENT FUNDS OF FIRST MERCANTILE TRUST COMPANY
FMT/T. Rowe Price International Bond Fund Financial Highlights December 31, 2015
The accompanying notes are an integral part of these financial statements.
Change in Net Asset Value Resulting from Operations Ratios (to average net
assets)
NAV per Unit, Beginning of
Period
Net Investment
Income (Loss)(a)
Net Realized and Unrealized
Gain (Loss) from
Investments(a)
Total from Investment Activities
NAV per Unit, End of
Period Total
Return Expenses
Net Investment
Income (Loss)
Class R1 $ 10.9544 $ 0.1749 $ (0.8270) $ (0.6521) $ 10.3023 (5.95) % (0.42) % 1.65 % Class R2 9.5437 0.1299 (0.7178) (0.5879) 8.9558 (6.16) % (0.64) % 1.42 % Class R3 9.6937 0.1173 (0.7299) (0.6126) 9.0811 (6.32) % (0.81) % 1.26 % Class R4 9.6735 0.1007 (0.7275) (0.6268) 9.0467 (6.48) % (0.98) % 1.09 % Class R5 9.5822 0.0858 (0.7221) (0.6363) 8.9459 (6.64) % (1.15) % 0.92 % Class R6 9.5661 0.0668 (0.7171) (0.6503) 8.9158 (6.80) % (1.32) % 0.73 % Class R7 9.5022 0.0531 (0.7141) (0.6610) 8.8412 (6.96) % (1.49) % 0.58 % Class R8 9.2783 0.0341 (0.6944) (0.6603) 8.6180 (7.12) % (1.67) % 0.38 % (a) Per unit amounts are based on average daily units outstanding.
309
FMT/Templeton International Bond Fund

THE COLLECTIVE INVESTMENT FUNDS OF FIRST MERCANTILE TRUST COMPANY
FMT/Templeton International Bond Fund Statement of Assets and Liabilities
December 31, 2015
The accompanying notes are an integral part of these financial statements.
Assets Investments in securities, at fair value $ 18,718,993 Liabilities Trustee fees 2,754
Net assets $ 18,716,239
Components of net assets
Units of
Participation NAV
per Unit Net
Assets Class R1 374,747 $ 9.6632 $ 3,621,247
Class R2 30,993 $ 10.3197 319,839
Class R3 73,172 $ 9.6867 708,795
Class R4 42,138 $ 10.1351 427,075
Class R5 27,980 $ 9.9943 279,639
Class R6 37,662 $ 9.9256 373,814
Class R7 8,234 $ 9.8941 81,464
Class R8 47 $ 12.5711 596
Class LifeStyle 12,903,770
$ 18,716,239
310

THE COLLECTIVE INVESTMENT FUNDS OF FIRST MERCANTILE TRUST COMPANY
FMT/Templeton International Bond Fund Statement of Operations
For the Year Ended December 31, 2015
The accompanying notes are an integral part of these financial statements.
Investment income
Dividends $ 553,724
Expenses
Trustee fees 122,534
Custody fees 7,379
Audit fees 1,419
131,332
Net investment income 422,392
Net realized loss from investments sold
Proceeds from sales of investments 5,745,246
Cost of investments sold 6,293,623
Net realized loss from investments sold (548,377)
Change in net unrealized appreciation (depreciation) on investments (1,287,101)
Net realized and unrealized loss on investments (1,835,478)
Other operating credits (charges) 138,257
Net decrease in net assets resulting from operations $ (1,274,829)
311

THE COLLECTIVE INVESTMENT FUNDS OF FIRST MERCANTILE TRUST COMPANY
FMT/Templeton International Bond Fund Statement of Changes in Net Assets
For the Year Ended December 31, 2015
The accompanying notes are an integral part of these financial statements.
Operations
Net investment income $ 422,392
Net realized loss from investments sold (548,377)
Change in net unrealized appreciation (depreciation) on investments (1,287,101)
Other operating credits (charges) 138,257
Net decrease in net assets resulting from operations (1,274,829)
Participant transactions
Proceeds from units purchased 8,524,747
Less payments for units redeemed 10,445,447
Decrease in net assets from participant transactions (1,920,700)
Total decrease in net assets (3,195,529)
Net assets at beginning of year 21,911,768
Net assets at end of year $ 18,716,239
312

THE COLLECTIVE INVESTMENT FUNDS OF FIRST MERCANTILE TRUST COMPANY FMT/Templeton International Bond Fund
Schedule of Investments and Specific Fund Disclosures December 31, 2015
The accompanying notes are an integral part of these financial statements.
Investments Shares Fair Value ____________ ____________
Mutual fund (100.0%) Templeton International Bond A Fund (Cost $21,218,189) 1,871,899 $ 18,718,993 __________ __________ Specific Fund Disclosures
Fair value
The inputs or methodology used for valuing securities may not be indicative of the risks associated with investing in those securities. For more information on valuation inputs, and their aggregation into the levels used in the table below, please refer to note 4 to the financial statements. The following table sets forth by level, within the fair value hierarchy, the Fund's investments measured at fair value.
Total Level 1 Level 2 Level 3
Mutual fund - International Bond $ 18,718,993 $ 18,718,993 $ — $ — __________ __________ __________ _________ __________ __________ __________ _________
Investment transactions
The aggregate cost of purchases of investment securities and proceeds from sales of investment securities (other than temporary cash investments) totaled $4,374,864 and $5,745,246, respectively, for the year ended December 31, 2015. Class-specific expenses Class-specific trustee fees for the year ended December 31, 2015 were as follows: Class R1 $ 10,984 Class R2 3,840 Class R3 5,574 Class R4 4,187 Class R5 3,747 Class R6 4,515 Class R7 1,027 Class R8 1 Class LifeStyle 88,659 $ 122,534
313

THE COLLECTIVE INVESTMENT FUNDS OF FIRST MERCANTILE TRUST COMPANY
FMT/Templeton International Bond Fund Schedule of Participant Transactions
December 31, 2015
The accompanying notes are an integral part of these financial statements.
Participant transactions by class for the year ended December 31, 2015 were as follows: Dollars Units Purchases Redemptions Net change Purchases Redemptions Net change Class R1 $ 2,718,247 $ (1,846,352) $ 871,895 269,963 (182,649) 87,314 Class R2 327,534 (822,970) (495,436) 30,191 (76,503) (46,312) Class R3 357,867 (388,427) (30,560) 35,574 (38,329) (2,755) Class R4 407,156 (395,773) 11,383 38,492 (37,708) 784 Class R5 194,016 (311,802) (117,786) 18,333 (29,682) (11,349) Class R6 94,524 (58,416) 36,108 9,114 (5,566) 3,548 Class R7 55,926 (44,961) 10,965 5,369 (4,283) 1,086 Class R8 507 (57,231) (56,724) 47 (5,555) (5,508) Class LifeStyle 4,368,970 (6,519,515) (2,150,545) — — — $ 8,524,747 $ (10,445,447) $ (1,920,700) 407,083 (380,275) 26,808
314

THE COLLECTIVE INVESTMENT FUNDS OF FIRST MERCANTILE TRUST COMPANY
FMT/Templeton International Bond Fund Financial Highlights December 31, 2015
The accompanying notes are an integral part of these financial statements.
Change in Net Asset Value Resulting from Operations Ratios (to average net
assets)
NAV per Unit, Beginning of
Period
Net Investment Income
(Loss)(a)
Net Realized and Unrealized
Gain (Loss) from
Investments(a)
Total from Investment Activities
NAV per Unit, End of
Period Total
Return Expenses
Net Investment
Income (Loss)
Class R1 $ 10.2465 $ 0.2929 $ (0.8762) $ (0.5833) $ 9.6632 (5.69) % (0.39) % 2.95 % Class R2 10.9669 0.2966 (0.9438) (0.6472) 10.3197 (5.90) % (0.61) % 2.75 % Class R3 10.3117 0.2577 (0.8827) (0.6250) 9.6867 (6.06) % (0.78) % 2.56 % Class R4 10.8074 0.2503 (0.9226) (0.6723) 10.1351 (6.22) % (0.95) % 2.40 % Class R5 10.6755 0.2314 (0.9126) (0.6812) 9.9943 (6.38) % (1.12) % 2.22 % Class R6 10.6201 0.2108 (0.9053) (0.6945) 9.9256 (6.54) % (1.29) % 2.05 % Class R7 10.6046 0.1904 (0.9009) (0.7105) 9.8941 (6.70) % (1.46) % 1.85 % Class R8(b) 10.3026 0.0000 0.0000 0.0000 10.3026 (0.00) % 0.00 % 0.00 % Class R8(c) 10.0000 0.0000 2.5711 2.5711 12.5711 25.71 % (1.60) % 0.00 % (a) Per unit amounts are based on average daily units outstanding.
(b) For the period from January 1, 2015 through January 2, 2015.
(c) For the period from December 4, 2015 (recommencement of this class) through December
31, 2015.
315

FMT/Vanguard GNMA Fund

THE COLLECTIVE INVESTMENT FUNDS OF FIRST MERCANTILE TRUST COMPANY
FMT/Vanguard GNMA Fund Statement of Assets and Liabilities
December 31, 2015
The accompanying notes are an integral part of these financial statements.
Assets Investments in securities, at fair value $ 23,347,398 Receivables
Dividends 50,432
Total assets 23,397,830
Liabilities Investments purchased 60,869
Trustee fees 13,821
Total liabilities 74,690
Net assets $ 23,323,140
Components of net assets
Units of
Participation NAV
per Unit Net
Assets Class R1 438,003 $ 14.5081 $ 6,354,580
Class R2 303,711 $ 10.5699 3,210,203
Class R3 748,925 $ 10.4847 7,852,209
Class R4 228,274 $ 10.4615 2,388,087
Class R5 181,185 $ 10.3902 1,882,556
Class R6 83,936 $ 10.2659 861,682
Class R7 26,367 $ 10.2473 270,190
Class R8 49,543 $ 10.1655 503,633
$ 23,323,140
316

THE COLLECTIVE INVESTMENT FUNDS OF FIRST MERCANTILE TRUST COMPANY
FMT/Vanguard GNMA Fund Statement of Operations
For the Year Ended December 31, 2015
The accompanying notes are an integral part of these financial statements.
Investment income
Dividends $ 677,518
Expenses
Trustee fees 158,064
Custody fees 8,096
Audit fees 1,200
167,360
Net investment income 510,158
Net realized loss from investments sold
Proceeds from sales of investments 8,476,576
Cost of investments sold 8,501,225
Net realized loss from investments sold (24,649)
Change in net unrealized appreciation (depreciation) on investments (348,567)
Net realized and unrealized loss on investments (373,216)
Net increase in net assets resulting from operations $ 136,942
317

THE COLLECTIVE INVESTMENT FUNDS OF FIRST MERCANTILE TRUST COMPANY
FMT/Vanguard GNMA Fund Statement of Changes in Net Assets
For the Year Ended December 31, 2015
The accompanying notes are an integral part of these financial statements.
Operations
Net investment income $ 510,158
Net realized loss from investments sold (24,649)
Change in net unrealized appreciation (depreciation) on investments (348,567)
Net increase in net assets resulting from operations 136,942
Participant transactions
Proceeds from units purchased 11,221,015
Less payments for units redeemed 11,604,892
Decrease in net assets from participant transactions (383,877)
Total decrease in net assets (246,935)
Net assets at beginning of year 23,570,075
Net assets at end of year $ 23,323,140
318
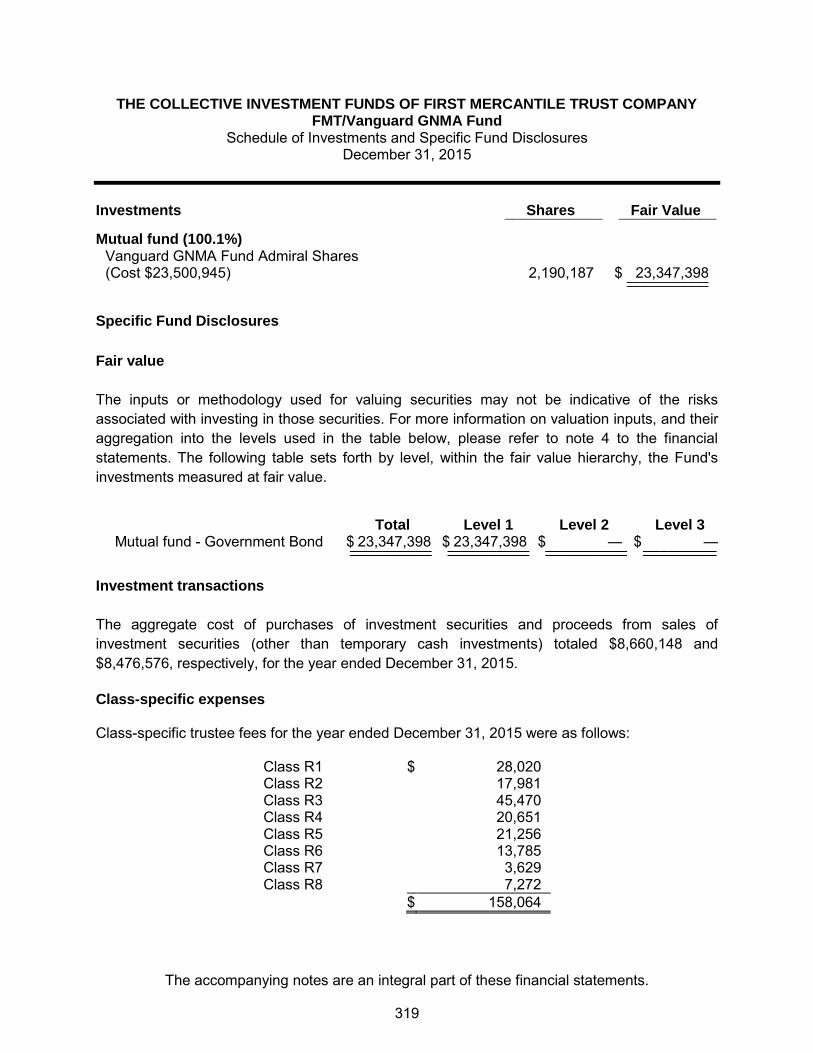
THE COLLECTIVE INVESTMENT FUNDS OF FIRST MERCANTILE TRUST COMPANY FMT/Vanguard GNMA Fund
Schedule of Investments and Specific Fund Disclosures December 31, 2015
The accompanying notes are an integral part of these financial statements.
Investments Shares Fair Value ____________ ____________
Mutual fund (100.1%)
Vanguard GNMA Fund Admiral Shares (Cost $23,500,945) 2,190,187 $ 23,347,398 __________ __________
Specific Fund Disclosures
Fair value
The inputs or methodology used for valuing securities may not be indicative of the risks associated with investing in those securities. For more information on valuation inputs, and their aggregation into the levels used in the table below, please refer to note 4 to the financial statements. The following table sets forth by level, within the fair value hierarchy, the Fund's investments measured at fair value.
Total Level 1 Level 2 Level 3 Mutual fund - Government Bond $ 23,347,398 $ 23,347,398 $ — $ — __________ __________ __________ _________ __________ __________ __________ _________
Investment transactions
The aggregate cost of purchases of investment securities and proceeds from sales of investment securities (other than temporary cash investments) totaled $8,660,148 and $8,476,576, respectively, for the year ended December 31, 2015. Class-specific expenses Class-specific trustee fees for the year ended December 31, 2015 were as follows: Class R1 $ 28,020 Class R2 17,981 Class R3 45,470 Class R4 20,651 Class R5 21,256 Class R6 13,785 Class R7 3,629 Class R8 7,272 $ 158,064
319

THE COLLECTIVE INVESTMENT FUNDS OF FIRST MERCANTILE TRUST COMPANY
FMT/Vanguard GNMA Fund Schedule of Participant Transactions
December 31, 2015
The accompanying notes are an integral part of these financial statements.
Participant transactions by class for the year ended December 31, 2015 were as follows: Dollars Units Purchases Redemptions Net change Purchases Redemptions Net change Class R1 $ 3,811,239 $ (7,334,686) $ (3,523,447) 263,810 (508,312) (244,502) Class R2 669,731 (500,385) 169,346 63,493 (47,418) 16,075 Class R3 4,212,5 (1,042,446) 3,170,053 402,089 (99,900) 302,189 Class R4 1,306,944 (862,780) 444,164 124,958 (82,457) 42,501 Class R5 696,317 (826,759) (130,442) 66,644 (79,573) (12,929) Class R6 292,567 (900,958) (608,391) 28,480 (87,426) (58,946) Class R7 71,276 (50,404) 20,872 6,949 (4,916) 2,033 Class R8 160,442 (86,474) 73,968 15,757 (8,490) 7,267 $ 11,221,015 $ (11,604,892) $ (383,877) 972,180 (918,492) 53,688
320

THE COLLECTIVE INVESTMENT FUNDS OF FIRST MERCANTILE TRUST COMPANY
FMT/Vanguard GNMA Fund Financial Highlights December 31, 2015
The accompanying notes are an integral part of these financial statements.
Change in Net Asset Value Resulting from Operations Ratios (to average net
assets)
NAV per Unit, Beginning of
Period
Net Investment Income
(Loss)(a)
Net Realized and Unrealized
Gain (Loss) from
Investments(a)
Total from Investment Activities
NAV per Unit, End of
Period Total
Return Expenses
Net Investment
Income (Loss)
Class R1 $ 14.3654 $ 0.3664 $ (0.2237) $ 0.1427 $ 14.5081 0.99 % (0.39) % 2.53 % Class R2 10.4890 0.2411 (0.1602) 0.0809 10.5699 0.77 % (0.61) % 2.29 % Class R3 10.4221 0.2189 (0.1563) 0.0626 10.4847 0.60 % (0.78) % 2.09 % Class R4 10.4167 0.2039 (0.1591) 0.0448 10.4615 0.43 % (0.95) % 1.95 % Class R5 10.3633 0.1850 (0.1581) 0.0269 10.3902 0.26 % (1.12) % 1.78 % Class R6 10.2568 0.1681 (0.1590) 0.0091 10.2659 0.09 % (1.29) % 1.63 % Class R7 10.2555 0.1470 (0.1552) (0.0082) 10.2473 (0.08) % (1.46) % 1.43 % Class R8 10.1910 0.1284 (0.1539) (0.0255) 10.1655 (0.25) % (1.63) % 1.26 % (a) Per unit amounts are based on average daily units outstanding.
321
FMT/Vanguard Inflation Protected Securities Fund

THE COLLECTIVE INVESTMENT FUNDS OF FIRST MERCANTILE TRUST COMPANY
FMT/Vanguard Inflation Protected Securities Fund Statement of Assets and Liabilities
December 31, 2015
The accompanying notes are an integral part of these financial statements.
Assets Investments in securities, at fair value $ 40,013,613 Liabilities Trustee fees 11,872
Cash overdraft 468
Total liabilities 12,340
Net assets $ 40,001,273
Components of net assets
Units of
Participation NAV
per Unit Net
Assets Class R1 575,593 $ 12.2456 $ 7,048,506
Class R2 238,575 $ 9.6604 2,304,723
Class R3 354,749 $ 9.5884 3,401,467
Class R4 353,593 $ 9.5396 3,373,124
Class R5 134,375 $ 9.4889 1,275,071
Class R6 147,091 $ 9.4143 1,384,754
Class R7 56,534 $ 9.3586 529,078
Class R8 47,635 $ 9.2736 441,745
Class LifeStyle 20,242,805
$ 40,001,273
322

THE COLLECTIVE INVESTMENT FUNDS OF FIRST MERCANTILE TRUST COMPANY
FMT/Vanguard Inflation Protected Securities Fund Statement of Operations
For the Year Ended December 31, 2015
The accompanying notes are an integral part of these financial statements.
Investment income
Dividends $ 347,931
Expenses
Trustee fees 155,245
Custody fees 8,639
Audit fees 1,627
165,511
Net investment income 182,420
Net realized loss from investments sold
Proceeds from sales of investments 7,021,619
Cost of investments sold 7,226,027
Net realized loss from investments sold (204,408)
Change in net unrealized appreciation (depreciation) on investments (631,311)
Net realized and unrealized loss on investments (835,719)
Other operating credits (charges) 59
Net decrease in net assets resulting from operations $ (653,240)
323

THE COLLECTIVE INVESTMENT FUNDS OF FIRST MERCANTILE TRUST COMPANY
FMT/Vanguard Inflation Protected Securities Fund Statement of Changes in Net Assets
For the Year Ended December 31, 2015
The accompanying notes are an integral part of these financial statements.
Operations
Net investment income $ 182,420
Net realized loss from investments sold (204,408)
Change in net unrealized appreciation (depreciation) on investments (631,311)
Other operating credits (charges) 59
Net decrease in net assets resulting from operations (653,240)
Participant transactions
Proceeds from units purchased 28,618,359
Less payments for units redeemed 11,867,407
Increase in net assets from participant transactions 16,750,952
Total increase in net assets 16,097,712
Net assets at beginning of year 23,903,561
Net assets at end of year $ 40,001,273
324
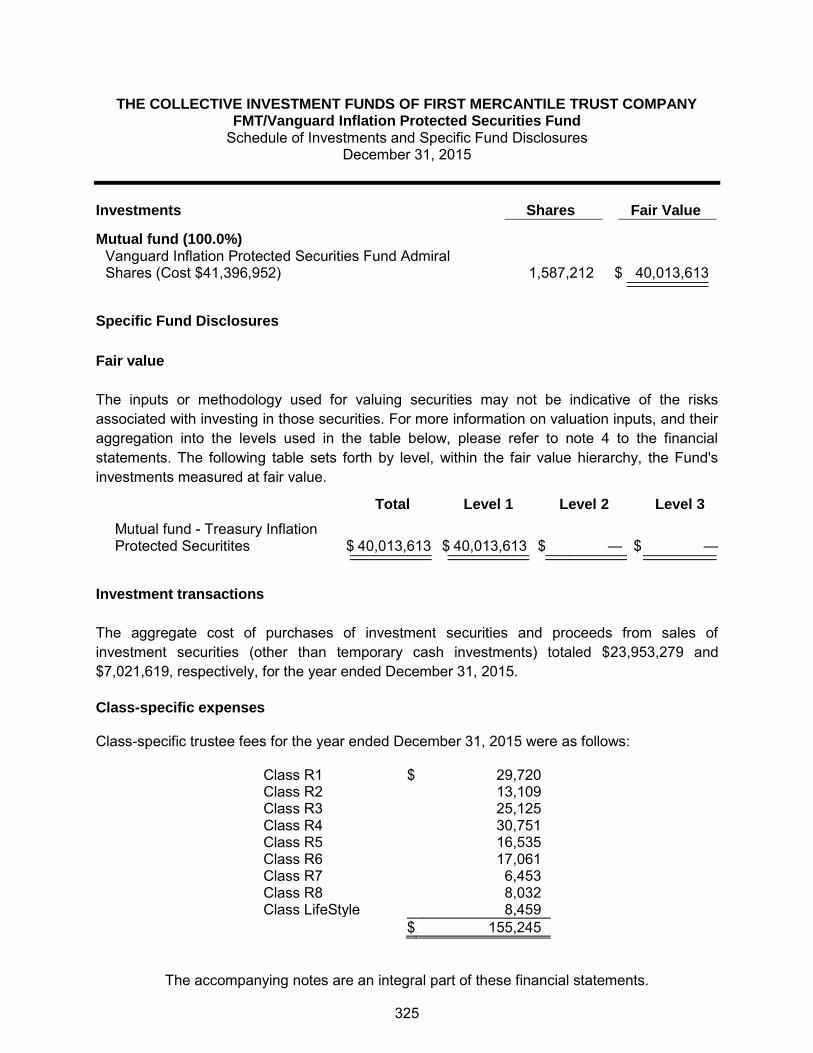
THE COLLECTIVE INVESTMENT FUNDS OF FIRST MERCANTILE TRUST COMPANY FMT/Vanguard Inflation Protected Securities Fund
Schedule of Investments and Specific Fund Disclosures December 31, 2015
The accompanying notes are an integral part of these financial statements.
Investments Shares Fair Value ____________ ____________
Mutual fund (100.0%)
Vanguard Inflation Protected Securities Fund Admiral Shares (Cost $41,396,952) 1,587,212 $ 40,013,613 __________ __________
Specific Fund Disclosures
Fair value
The inputs or methodology used for valuing securities may not be indicative of the risks associated with investing in those securities. For more information on valuation inputs, and their aggregation into the levels used in the table below, please refer to note 4 to the financial statements. The following table sets forth by level, within the fair value hierarchy, the Fund's investments measured at fair value.
Total Level 1 Level 2 Level 3
Mutual fund - Treasury Inflation Protected Securitites $ 40,013,613 $ 40,013,613 $ — $ — __________ __________ __________ _________ __________ __________ __________ _________
Investment transactions
The aggregate cost of purchases of investment securities and proceeds from sales of investment securities (other than temporary cash investments) totaled $23,953,279 and $7,021,619, respectively, for the year ended December 31, 2015. Class-specific expenses Class-specific trustee fees for the year ended December 31, 2015 were as follows: Class R1 $ 29,720 Class R2 13,109 Class R3 25,125 Class R4 30,751 Class R5 16,535 Class R6 17,061 Class R7 6,453 Class R8 8,032 Class LifeStyle 8,459 $ 155,245
325

THE COLLECTIVE INVESTMENT FUNDS OF FIRST MERCANTILE TRUST COMPANY
FMT/Vanguard Inflation Protected Securities Fund Schedule of Participant Transactions
December 31, 2015
The accompanying notes are an integral part of these financial statements.
Participant transactions by class for the year ended December 31, 2015 were as follows: Dollars Units Purchases Redemptions Net change Purchases Redemptions Net change Class R1 $ 3,305,622 $ (5,166,322) $ (1,860,700) 264,280 (414,869) (150,589) Class R2 861,009 (698,507) 162,502 87,175 (70,817) 16,358 Class R3 899,518 (892,733) 6,785 92,275 (90,913) 1,362 Class R4 1,731,998 (1,436,483) 295,515 178,070 (147,269) 30,801 Class R5 530,781 (1,100,093) (569,312) 54,579 (113,622) (59,043) Class R6 1,013,540 (676,447) 337,093 103,631 (69,436) 34,195 Class R7 358,066 (323,682) 34,384 37,155 (32,875) 4,280 Class R8 129,615 (253,202) (123,587) 13,646 (26,612) (12,966) Class LifeStyle 19,788,210 (1,319,938) 18,468,272 — — — $ 28,618,359 $ (11,867,407) $ 16,750,952 830,811 (966,413) (135,602)
326

THE COLLECTIVE INVESTMENT FUNDS OF FIRST MERCANTILE TRUST COMPANY
FMT/Vanguard Inflation Protected Securities Fund Financial Highlights December 31, 2015
The accompanying notes are an integral part of these financial statements.
Change in Net Asset Value Resulting from Operations Ratios (to average net
assets)
NAV per Unit, Beginning of
Period
Net Investment
Income (Loss)(a)
Net Realized and Unrealized
Gain (Loss) from
Investments(a)
Total from Investment Activities
NAV per Unit, End of
Period Total
Return Expenses
Net Investment
Income (Loss)
Class R1 $ 12.5064 $ 0.0460 $ (0.3068) $ (0.2608) $ 12.2456 (2.09) % (0.39) % 0.37 % Class R2 9.8878 0.0238 (0.2512) (0.2274) 9.6604 (2.30) % (0.61) % 0.24 % Class R3 9.8307 0.0099 (0.2522) (0.2423) 9.5884 (2.46) % (0.78) % 0.10 % Class R4 9.7973 (0.0072) (0.2505) (0.2577) 9.5396 (2.63) % (0.95) % (0.07) % Class R5 9.7618 (0.0340) (0.2389) (0.2729) 9.4889 (2.80) % (1.12) % (0.35) % Class R6 9.7015 (0.0391) (0.2481) (0.2872) 9.4143 (2.96) % (1.29) % (0.41) % Class R7 9.6606 (0.0431) (0.2589) (0.3020) 9.3586 (3.13) % (1.46) % (0.45) % Class R8 9.5890 (0.0824) (0.2330) (0.3154) 9.2736 (3.29) % (1.63) % (0.86) % (a) Per unit amounts are based on average daily units outstanding.
327

FMT/Vanguard Total Bond Market Index Fund

THE COLLECTIVE INVESTMENT FUNDS OF FIRST MERCANTILE TRUST COMPANY
FMT/Vanguard Total Bond Market Index Fund Statement of Assets and Liabilities
December 31, 2015
The accompanying notes are an integral part of these financial statements.
Assets Investments in securities, at fair value $ 48,085,942 Receivables
Dividends 83,961
Total assets 48,169,903
Liabilities Trustee fees 22,816
Net assets $ 48,147,087
Components of net assets
Units of
Participation NAV
per Unit Net
Assets Class R1 1,621,456 $ 12.4936 $ 20,257,836
Class R2 284,890 $ 10.6330 3,029,225
Class R3 1,157,186 $ 10.5598 12,219,700
Class R4 188,736 $ 10.4979 1,981,336
Class R5 289,336 $ 10.4570 3,025,580
Class R6 190,491 $ 10.3482 1,971,243
Class R7 67,154 $ 10.2831 690,549
Class R8 46,701 $ 10.1805 475,444
Class LifeStyle 4,496,174
$ 48,147,087
328

THE COLLECTIVE INVESTMENT FUNDS OF FIRST MERCANTILE TRUST COMPANY
FMT/Vanguard Total Bond Market Index Fund Statement of Operations
For the Year Ended December 31, 2015
The accompanying notes are an integral part of these financial statements.
Investment income
Dividends $ 1,255,239
Expenses
Trustee fees 307,832
Custody fees 17,737
Audit fees 2,310
327,879
Net investment income 927,360
Net realized gain from investments sold
Proceeds from sales of investments 15,379,014
Cost of investments sold 15,197,143
Net realized gain from investments sold 181,871
Change in net unrealized appreciation (depreciation) on investments (1,220,199)
Net realized and unrealized loss on investments (1,038,328)
Other operating credits (charges) 584
Net decrease in net assets resulting from operations $ (110,384)
329
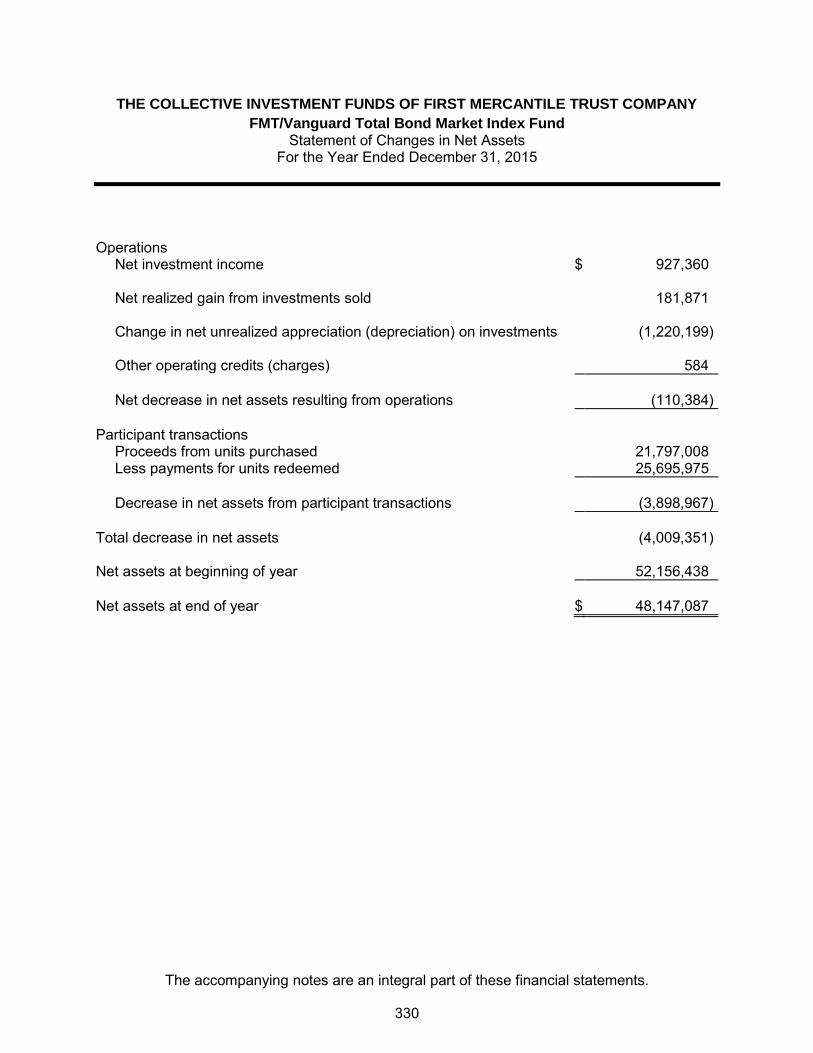
THE COLLECTIVE INVESTMENT FUNDS OF FIRST MERCANTILE TRUST COMPANY
FMT/Vanguard Total Bond Market Index Fund Statement of Changes in Net Assets
For the Year Ended December 31, 2015
The accompanying notes are an integral part of these financial statements.
Operations
Net investment income $ 927,360
Net realized gain from investments sold 181,871
Change in net unrealized appreciation (depreciation) on investments (1,220,199)
Other operating credits (charges) 584
Net decrease in net assets resulting from operations (110,384)
Participant transactions
Proceeds from units purchased 21,797,008
Less payments for units redeemed 25,695,975
Decrease in net assets from participant transactions (3,898,967)
Total decrease in net assets (4,009,351)
Net assets at beginning of year 52,156,438
Net assets at end of year $ 48,147,087
330

THE COLLECTIVE INVESTMENT FUNDS OF FIRST MERCANTILE TRUST COMPANY
FMT/Vanguard Total Bond Market Index Fund Schedule of Investments and Specific Fund Disclosures
December 31, 2015
The accompanying notes are an integral part of these financial statements.
Investments Shares Fair Value ____________ ____________
Mutual fund (99.9%)
Vanguard Total Bond Market Index Fund Admiral Shares (Cost $48,503,452) 4,519,355 $ 48,085,942 __________ __________
Specific Fund Disclosures
Fair value
The inputs or methodology used for valuing securities may not be indicative of the risks associated with investing in those securities. For more information on valuation inputs, and their aggregation into the levels used in the table below, please refer to note 4 to the financial statements. The following table sets forth by level, within the fair value hierarchy, the Fund's investments measured at fair value.
Total Level 1 Level 2 Level 3
Mutual fund - Core Bond $ 48,085,942 $ 48,085,942 $ — $ — __________ __________ __________ _________ __________ __________ __________ _________
Investment transactions
The aggregate cost of purchases of investment securities and proceeds from sales of investment securities (other than temporary cash investments) totaled $12,429,572 and $15,379,014, respectively, for the year ended December 31, 2015. Class-specific expenses Class-specific trustee fees for the year ended December 31, 2015 were as follows: Class R1 $ 72,960 Class R2 26,277 Class R3 87,693 Class R4 19,276 Class R5 30,973 Class R6 25,285 Class R7 8,011 Class R8 9,658 Class LifeStyle 27,699 $ 307,832
331

THE COLLECTIVE INVESTMENT FUNDS OF FIRST MERCANTILE TRUST COMPANY
FMT/Vanguard Total Bond Market Index Fund Schedule of Participant Transactions
December 31, 2015
The accompanying notes are an integral part of these financial statements.
Participant transactions by class for the year ended December 31, 2015 were as follows: Dollars Units Purchases Redemptions Net change Purchases Redemptions Net change Class R1 $ 7,077,655 $ (8,403,046) $ (1,325,391) 563,369 (668,760) (105,391) Class R2 4,280,751 (5,337,653) (1,056,902) 399,485 (499,263) (99,778) Class R3 5,809,674 (3,962,350) 1,847,324 545,632 (371,304) 174,328 Class R4 971,590 (2,006,460) (1,034,870) 91,423 (189,034) (97,611) Class R5 1,217,126 (1,239,914) (22,788) 115,590 (117,102) (1,512) Class R6 594,706 (544,117) 50,589 56,763 (52,035) 4,728 Class R7 413,269 (122,228) 291,041 39,754 (11,819) 27,935 Class R8 158,863 (837,647) (678,784) 15,436 (81,261) (65,825) Class LifeStyle 1,273,374 (3,242,560) (1,969,186) — — — $ 21,797,008 $ (25,695,975) $ (3,898,967) 1,827,452 (1,990,578) (163,126)
332

THE COLLECTIVE INVESTMENT FUNDS OF FIRST MERCANTILE TRUST COMPANY
FMT/Vanguard Total Bond Market Index Fund Financial Highlights December 31, 2015
The accompanying notes are an integral part of these financial statements.
Change in Net Asset Value Resulting from Operations Ratios (to average net
assets)
NAV per Unit, Beginning of
Period
Net Investment
Income (Loss)(a)
Net Realized and Unrealized
Gain (Loss) from
Investments(a)
Total from Investment Activities
NAV per Unit, End of
Period Total
Return Expenses
Net Investment
Income (Loss)
Class R1 $ 12.4978 $ 0.2601 $ (0.2643) $ (0.0042) $ 12.4936 (0.03) % (0.39) % 2.07 % Class R2 10.6599 0.1961 (0.2230) (0.0269) 10.6330 (0.25) % (0.61) % 1.83 % Class R3 10.6046 0.1793 (0.2241) (0.0448) 10.5598 (0.42) % (0.78) % 1.68 % Class R4 10.5603 0.1598 (0.2222) (0.0624) 10.4979 (0.59) % (0.95) % 1.51 % Class R5 10.5370 0.1361 (0.2161) (0.0800) 10.4570 (0.76) % (1.12) % 1.29 % Class R6 10.4451 0.1221 (0.2190) (0.0969) 10.3482 (0.93) % (1.29) % 1.17 % Class R7 10.3970 0.1069 (0.2208) (0.1139) 10.2831 (1.10) % (1.46) % 1.03 % Class R8 10.3107 0.0828 (0.2130) (0.1302) 10.1805 (1.26) % (1.63) % 0.80 % (a) Per unit amounts are based on average daily units outstanding.
333
FMT Balanced Opportunities (Aristotle) Fund

THE COLLECTIVE INVESTMENT FUNDS OF FIRST MERCANTILE TRUST COMPANY
FMT Balanced Opportunities (Aristotle) Fund Statement of Assets and Liabilities
December 31, 2015
The accompanying notes are an integral part of these financial statements.
Assets Investments in securities, at fair value $ 1,997,365 Cash equivalents 117,508
Receivables
Dividends and interest 5,928
Investments sold 1,642
Dividend tax reclaim 364
Total assets 2,122,807
Liabilities Investments purchased 1,430
Trustee fees 1,331
Sub-advisor fees 908
Total liabilities 3,669
Net assets $ 2,119,138
Components of net assets
Units of
Participation NAV
per Unit Net
Assets Class R1 65,457 $ 14.5752 $ 954,046
Class R2 20,860 $ 9.8760 206,014
Class R4 16,324 $ 11.0663 180,645
Class R5 11,785 $ 13.6295 160,625
Class R6 46,032 $ 13.4212 617,808
$ 2,119,138
334
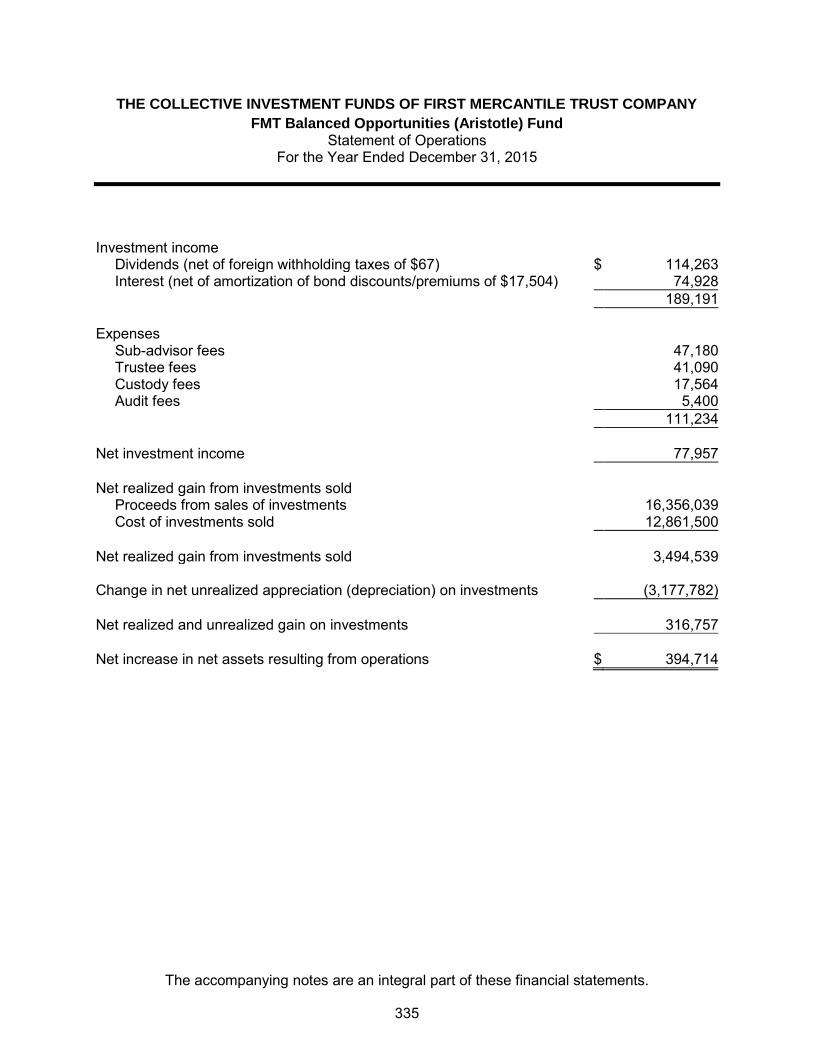
THE COLLECTIVE INVESTMENT FUNDS OF FIRST MERCANTILE TRUST COMPANY
FMT Balanced Opportunities (Aristotle) Fund Statement of Operations
For the Year Ended December 31, 2015
The accompanying notes are an integral part of these financial statements.
Investment income
Dividends (net of foreign withholding taxes of $67) $ 114,263
Interest (net of amortization of bond discounts/premiums of $17,504) 74,928
189,191
Expenses
Sub-advisor fees 47,180
Trustee fees 41,090
Custody fees 17,564
Audit fees 5,400
111,234
Net investment income 77,957
Net realized gain from investments sold
Proceeds from sales of investments 16,356,039
Cost of investments sold 12,861,500
Net realized gain from investments sold 3,494,539
Change in net unrealized appreciation (depreciation) on investments (3,177,782)
Net realized and unrealized gain on investments 316,757
Net increase in net assets resulting from operations $ 394,714
335

THE COLLECTIVE INVESTMENT FUNDS OF FIRST MERCANTILE TRUST COMPANY
FMT Balanced Opportunities (Aristotle) Fund Statement of Changes in Net Assets
For the Year Ended December 31, 2015
The accompanying notes are an integral part of these financial statements.
Operations
Net investment income $ 77,957
Net realized gain from investments sold 3,494,539
Change in net unrealized appreciation (depreciation) on investments (3,177,782)
Net increase in net assets resulting from operations 394,714
Participant transactions
Proceeds from units purchased 2,474,650
Less payments for units redeemed 16,736,235
Decrease in net assets from participant transactions (14,261,585)
Total decrease in net assets (13,866,871)
Net assets at beginning of year 15,986,009
Net assets at end of year $ 2,119,138
336

THE COLLECTIVE INVESTMENT FUNDS OF FIRST MERCANTILE TRUST COMPANY FMT Balanced Opportunities (Aristotle) Fund
Schedule of Investments and Specific Fund Disclosures December 31, 2015
The accompanying notes are an integral part of these financial statements.
Investments
Principal Amount or
Shares Fair Value ____________ ____________
Common stocks (50.2%)
Basic Material (1.5%) Dow Chemical Co./The 600 $ 30,888
Communication (1.4%) Time Warner, Inc. 450 29,102
Consumer, Cyclical (5.6%) Lennar Corp. Class A 700 34,237 Lowe's Cos., Inc. 600 45,624 Walgreens Boots Alliance, Inc. 450 38,320 __________ 118,181
Consumer, Non-cyclical (10.5%) AbbVie, Inc. 550 32,582 Archer-Daniels-Midland Co. 675 24,759 Baxter International, Inc. 1,002 38,226 Coty, Inc. Class A 750 19,223 Hershey Co./The 200 17,854 Medtronic PLC 500 38,460 Mondelez International, Inc. Class A 700 31,388 PayPal Holdings, Inc. 550 19,910 __________ 222,402
Energy (3.4%) Halliburton Co. 600 20,424 Phillips 66 400 32,720 Pioneer Natural Resources Co. 150 18,807 __________ 71,951
Financial (8.2%) ACE Ltd. 277 32,367 Bank of America Corp. 2,200 37,026 BOK Financial Corp. 300 17,937 First Republic Bank/CA 450 29,727 JPMorgan Chase & Co. 500 33,015 M&T Bank Corp. 200 24,236 __________ 174,308
Industrial (8.0%) Deere & Co. 250 19,067 General Dynamics Corp. 250 34,340
337

THE COLLECTIVE INVESTMENT FUNDS OF FIRST MERCANTILE TRUST COMPANY FMT Balanced Opportunities (Aristotle) Fund
Schedule of Investments and Specific Fund Disclosures (continued) December 31, 2015
The accompanying notes are an integral part of these financial statements.
Investments
Principal Amount or
Shares Fair Value ____________ ____________
Common stocks (continued)
Industrial (continued) General Electric Co. 1,100 $ 34,265 Illinois Tool Works, Inc. 300 27,804 Martin Marietta Materials, Inc. 200 27,316 Oshkosh Corp. 700 27,328 __________ 170,120
Technology (8.2%) Adobe Systems, Inc. 450 42,273 EMC Corp./MA 1,100 28,248 Microsoft Corp. 800 44,384 Oracle Corp. 700 25,571 Texas Instruments, Inc. 600 32,886 __________ 173,362
Utilities (3.4%) AES Corp. 1,900 18,183 ITC Holdings Corp. 900 35,325 National Fuel Gas Co. 450 19,238 __________ 72,746 __________ Total Common stocks (Cost $748,598) 1,063,060
Corporate bonds (13.5%)
Communications (6.3%) AT&T, Inc., 4.45%, 05/15/2021 75,000 79,826 Verizon Communications, Inc., 3.65%, 09/14/2018 50,000 52,285 __________ 132,111
Financial (2.5%) General Electric Capital Corp., 5.63%, 09/15/2017 50,000 53,314
Technology (4.7%) HP, Inc., 2.75%, 01/14/2019 100,000 99,940 __________ Total Corporate bonds (Cost $285,943) 285,365
Depository receipts (4.7%)
Consumer, Non-cyclical (3.7%) Diageo PLC ADR 200 21,814 Novartis AG ADR 300 25,812
338

THE COLLECTIVE INVESTMENT FUNDS OF FIRST MERCANTILE TRUST COMPANY FMT Balanced Opportunities (Aristotle) Fund
Schedule of Investments and Specific Fund Disclosures (continued) December 31, 2015
The accompanying notes are an integral part of these financial statements.
Investments
Principal Amount or
Shares Fair Value
Depository receipts (continued) Consumer, Non-cyclical (continued) Unilever N.V. 700 $ 30,324 __________ 77,950
Financial (1.0%) Mitsubishi UFJ Financial Group, Inc. ADR 3,500 21,770 __________ Total Depository receipts (Cost $92,009) 99,720
Mortgage pass throughs (11.8%) GNMA Pool 778794 GN, 3.50%, 01/15/2042 127,011 132,289 GNMA Pool 779398 GN, 3.50%, 06/15/2042 112,729 117,394 __________ Total Mortgage pass throughs (Cost $245,719) 249,683
U.S. treasury & government agencies (14.1%) U.S. Treasury Note, 0.38%, 01/15/2016 150,000 150,006 U.S. Treasury Note, 0.75%, 06/30/2017 150,000 149,531 __________ Total U.S. treasury & government agencies (Cost $299,446) 299,537 __________ Total Investments (Cost $1,671,715) $ 1,997,365 __________ __________
339
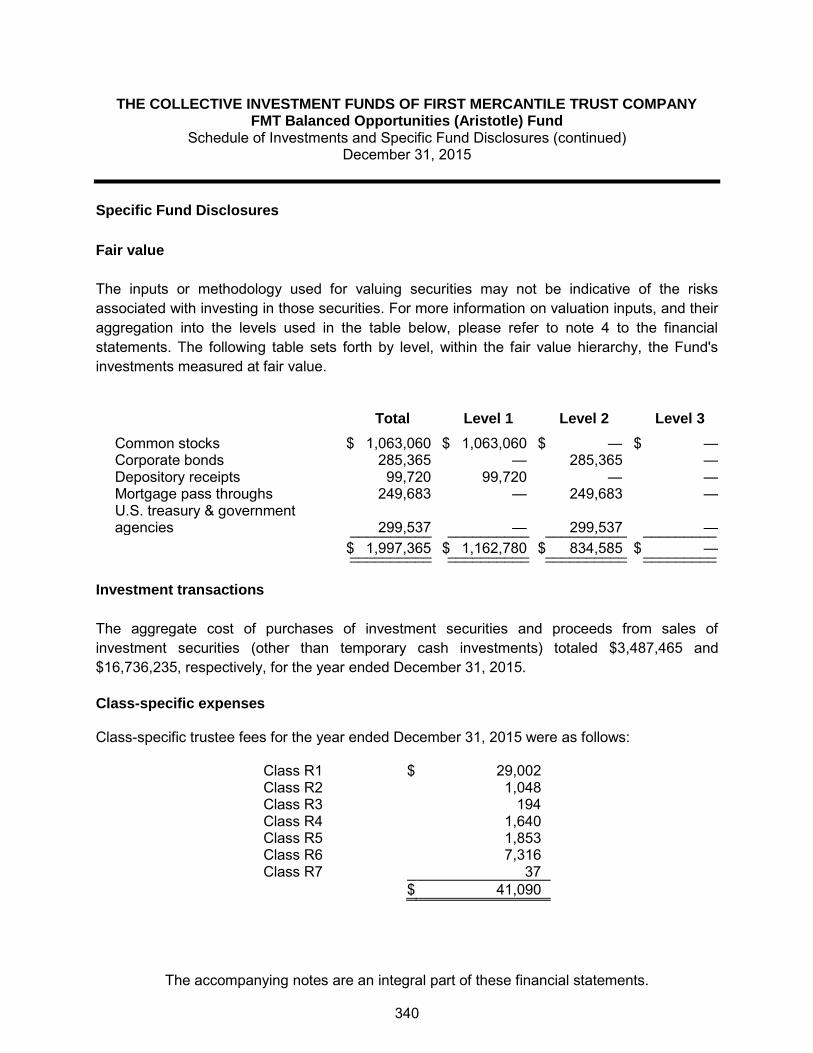
THE COLLECTIVE INVESTMENT FUNDS OF FIRST MERCANTILE TRUST COMPANY FMT Balanced Opportunities (Aristotle) Fund
Schedule of Investments and Specific Fund Disclosures (continued) December 31, 2015
The accompanying notes are an integral part of these financial statements.
Specific Fund Disclosures
Fair value
The inputs or methodology used for valuing securities may not be indicative of the risks associated with investing in those securities. For more information on valuation inputs, and their aggregation into the levels used in the table below, please refer to note 4 to the financial statements. The following table sets forth by level, within the fair value hierarchy, the Fund's investments measured at fair value.
Total Level 1 Level 2 Level 3
Common stocks $ 1,063,060 $ 1,063,060 $ — $ — Corporate bonds 285,365 — 285,365 — Depository receipts 99,720 99,720 — — Mortgage pass throughs 249,683 — 249,683 — U.S. treasury & government agencies 299,537 — 299,537 — __________ __________ __________ _________
$ 1,997,365 $ 1,162,780 $ 834,585 $ — __________ __________ __________ _________ __________ __________ __________ _________ Investment transactions
The aggregate cost of purchases of investment securities and proceeds from sales of investment securities (other than temporary cash investments) totaled $3,487,465 and $16,736,235, respectively, for the year ended December 31, 2015. Class-specific expenses Class-specific trustee fees for the year ended December 31, 2015 were as follows: Class R1 $ 29,002 Class R2 1,048 Class R3 194 Class R4 1,640 Class R5 1,853 Class R6 7,316 Class R7 37 $ 41,090
340
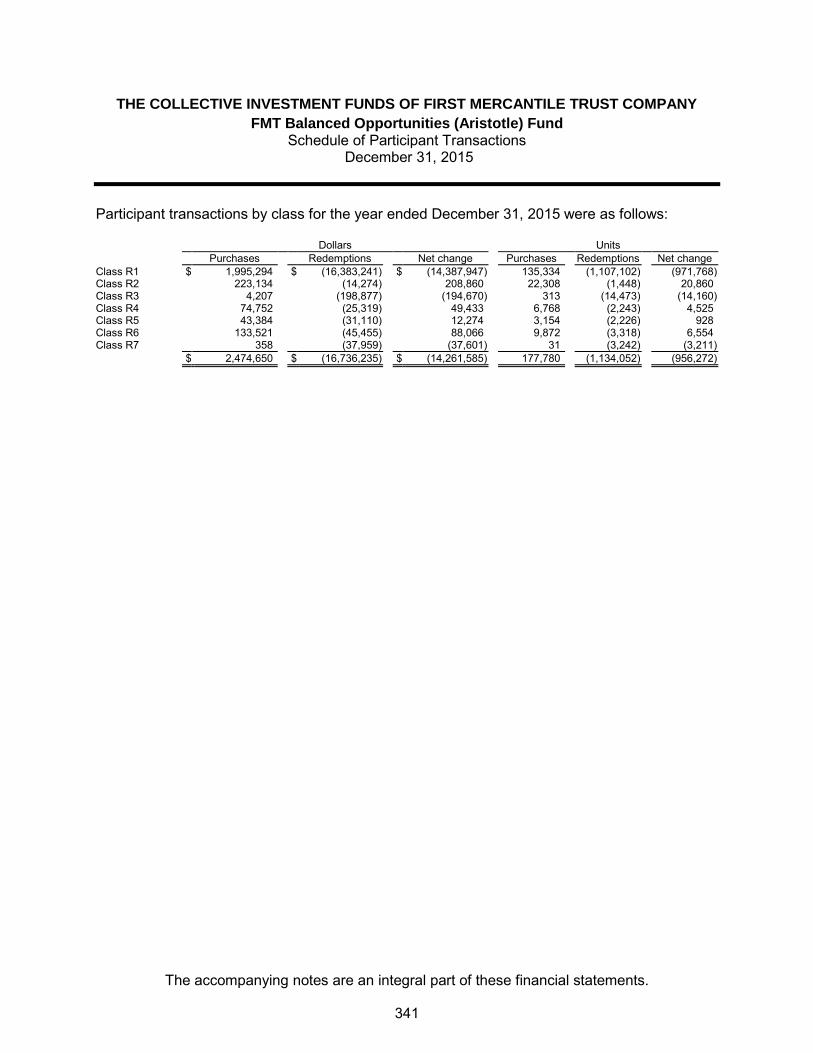
THE COLLECTIVE INVESTMENT FUNDS OF FIRST MERCANTILE TRUST COMPANY
FMT Balanced Opportunities (Aristotle) Fund Schedule of Participant Transactions
December 31, 2015
The accompanying notes are an integral part of these financial statements.
Participant transactions by class for the year ended December 31, 2015 were as follows: Dollars Units Purchases Redemptions Net change Purchases Redemptions Net change Class R1 $ 1,995,294 $ (16,383,241) $ (14,387,947) 135,334 (1,107,102) (971,768) Class R2 223,134 (14,274) 208,860 22,308 (1,448) 20,860 Class R3 4,207 (198,877) (194,670) 313 (14,473) (14,160) Class R4 74,752 (25,319) 49,433 6,768 (2,243) 4,525 Class R5 43,384 (31,110) 12,274 3,154 (2,226) 928 Class R6 133,521 (45,455) 88,066 9,872 (3,318) 6,554 Class R7 358 (37,959) (37,601) 31 (3,242) (3,211) $ 2,474,650 $ (16,736,235) $ (14,261,585) 177,780 (1,134,052) (956,272)
341

THE COLLECTIVE INVESTMENT FUNDS OF FIRST MERCANTILE TRUST COMPANY
FMT Balanced Opportunities (Aristotle) Fund Financial Highlights December 31, 2015
The accompanying notes are an integral part of these financial statements.
Change in Net Asset Value Resulting from Operations Ratios (to average net
assets)
NAV per Unit, Beginning of
Period
Net Investment
Income (Loss)(a)
Net Realized and Unrealized
Gain (Loss) from
Investments(a)
Total from Investment Activities
NAV per Unit, End of
Period Total
Return Expenses
Net Investment
Income (Loss)
Class R1 $ 14.4150 $ 0.1336 $ 0.0266 $ 0.1602 $ 14.5752 1.11 % (1.10) % 0.91 % Class R2(b) 10.0000 0.0618 (0.1858) (0.1240) 9.8760 (1.24) % (1.30) % 0.72 % Class R3(c) 13.4536 0.0094 0.2779 0.2873 — 2.14 % — % — % Class R4 11.0058 0.0417 0.0188 0.0605 11.0663 0.55 % (1.64) % 0.37 % Class R5 13.5782 0.0277 0.0236 0.0513 13.6295 0.38 % (1.81) % 0.20 % Class R6 13.3934 0.0044 0.0234 0.0278 13.4212 0.21 % (1.98) % 0.03 % Class R7(d) 11.7904 (0.0015) (0.0790) (0.0805) — (0.68) % — % — % (a) Per unit amounts are based on average daily units outstanding.
(b) For the period from February 20, 2015 (commencement of this class) through December
31, 2015.
(c) For the period from January 1, 2015 through February 19, 2015. (d) For the period from January 1, 2015 through January 23, 2015.
342

FMT/American Funds Capital Income Builder Fund

THE COLLECTIVE INVESTMENT FUNDS OF FIRST MERCANTILE TRUST COMPANY
FMT/American Funds Capital Income Builder Fund Statement of Assets and Liabilities
December 31, 2015
The accompanying notes are an integral part of these financial statements.
Assets Investments in securities, at fair value $ 6,496,552 Liabilities Trustee fees 3,386
Net assets $ 6,493,166
Components of net assets
Units of
Participation NAV
per Unit Net
Assets Class R1 283,996 $ 12.0515 $ 3,422,573
Class R2 67,598 $ 13.0913 884,938
Class R3 39,806 $ 13.1036 521,607
Class R4 90,725 $ 12.9140 1,171,626
Class R5 34,816 $ 12.8270 446,591
Class R6 41 $ 9.3101 377
Class R7 4,784 $ 9.5014 45,454
$ 6,493,166
343

THE COLLECTIVE INVESTMENT FUNDS OF FIRST MERCANTILE TRUST COMPANY
FMT/American Funds Capital Income Builder Fund Statement of Operations
For the Year Ended December 31, 2015
The accompanying notes are an integral part of these financial statements.
Investment income
Dividends $ 265,468
Expenses
Trustee fees 40,864
Custody fees 2,499
Audit fees 1,200
44,563
Net investment income 220,905
Net realized gain from investments sold
Proceeds from sales of investments 1,975,485
Cost of investments sold 1,808,020
Net realized gain from investments sold 167,465
Change in net unrealized appreciation (depreciation) on investments (604,945)
Net realized and unrealized loss on investments (437,480)
Net decrease in net assets resulting from operations $ (216,575)
344

THE COLLECTIVE INVESTMENT FUNDS OF FIRST MERCANTILE TRUST COMPANY
FMT/American Funds Capital Income Builder Fund Statement of Changes in Net Assets
For the Year Ended December 31, 2015
The accompanying notes are an integral part of these financial statements.
Operations
Net investment income $ 220,905
Net realized gain from investments sold 167,465
Change in net unrealized appreciation (depreciation) on investments (604,945)
Net decrease in net assets resulting from operations (216,575)
Participant transactions
Proceeds from units purchased 2,549,468
Less payments for units redeemed 3,121,191
Decrease in net assets from participant transactions (571,723)
Total decrease in net assets (788,298)
Net assets at beginning of year 7,281,464
Net assets at end of year $ 6,493,166
345
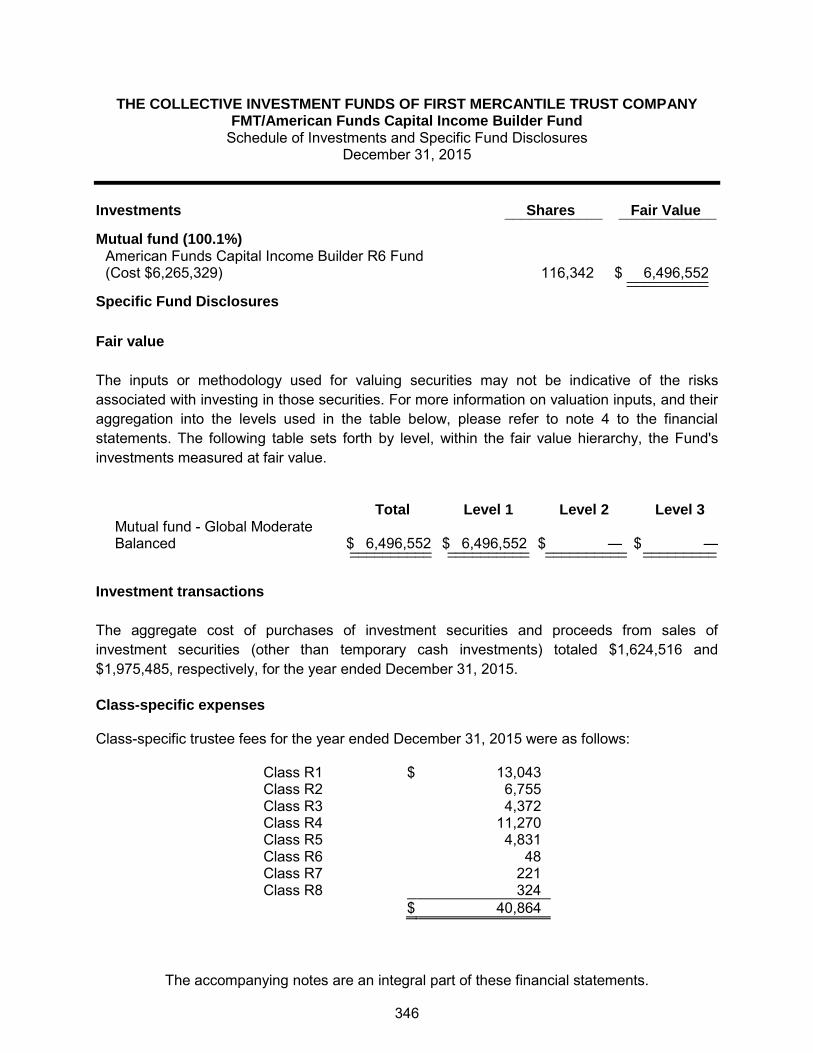
THE COLLECTIVE INVESTMENT FUNDS OF FIRST MERCANTILE TRUST COMPANY FMT/American Funds Capital Income Builder Fund
Schedule of Investments and Specific Fund Disclosures December 31, 2015
The accompanying notes are an integral part of these financial statements.
Investments Shares Fair Value ____________ ____________
Mutual fund (100.1%)
American Funds Capital Income Builder R6 Fund (Cost $6,265,329) 116,342 $ 6,496,552 __________ __________
Specific Fund Disclosures
Fair value
The inputs or methodology used for valuing securities may not be indicative of the risks associated with investing in those securities. For more information on valuation inputs, and their aggregation into the levels used in the table below, please refer to note 4 to the financial statements. The following table sets forth by level, within the fair value hierarchy, the Fund's investments measured at fair value.
Total Level 1 Level 2 Level 3 Mutual fund - Global Moderate Balanced $ 6,496,552 $ 6,496,552 $ — $ — __________ __________ __________ _________ __________ __________ __________ _________
Investment transactions
The aggregate cost of purchases of investment securities and proceeds from sales of investment securities (other than temporary cash investments) totaled $1,624,516 and $1,975,485, respectively, for the year ended December 31, 2015. Class-specific expenses Class-specific trustee fees for the year ended December 31, 2015 were as follows: Class R1 $ 13,043 Class R2 6,755 Class R3 4,372 Class R4 11,270 Class R5 4,831 Class R6 48 Class R7 221 Class R8 324 $ 40,864
346

THE COLLECTIVE INVESTMENT FUNDS OF FIRST MERCANTILE TRUST COMPANY
FMT/American Funds Capital Income Builder Fund Schedule of Participant Transactions
December 31, 2015
The accompanying notes are an integral part of these financial statements.
Participant transactions by class for the year ended December 31, 2015 were as follows: Dollars Units Purchases Redemptions Net change Purchases Redemptions Net change Class R1 $ 668,498 $ (1,083,707) $ (415,209) 53,696 (85,519) (31,823) Class R2 694,839 (483,753) 211,086 50,788 (36,603) 14,185 Class R3 328,781 (532,270) (203,489) 23,957 (38,719) (14,762) Class R4 703,291 (725,112) (21,821) 53,080 (54,805) (1,725) Class R5 101,598 (210,174) (108,576) 7,552 (15,833) (8,281) Class R6 404 (13,636) (13,232) 41 (1,144) (1,103) Class R7 49,356 (37,963) 11,393 4,988 (2,901) 2,087 Class R8 2,701 (34,576) (31,875) 206 (2,626) (2,420) $ 2,549,468 $ (3,121,191) $ (571,723) 194,308 (238,150) (43,842)
347
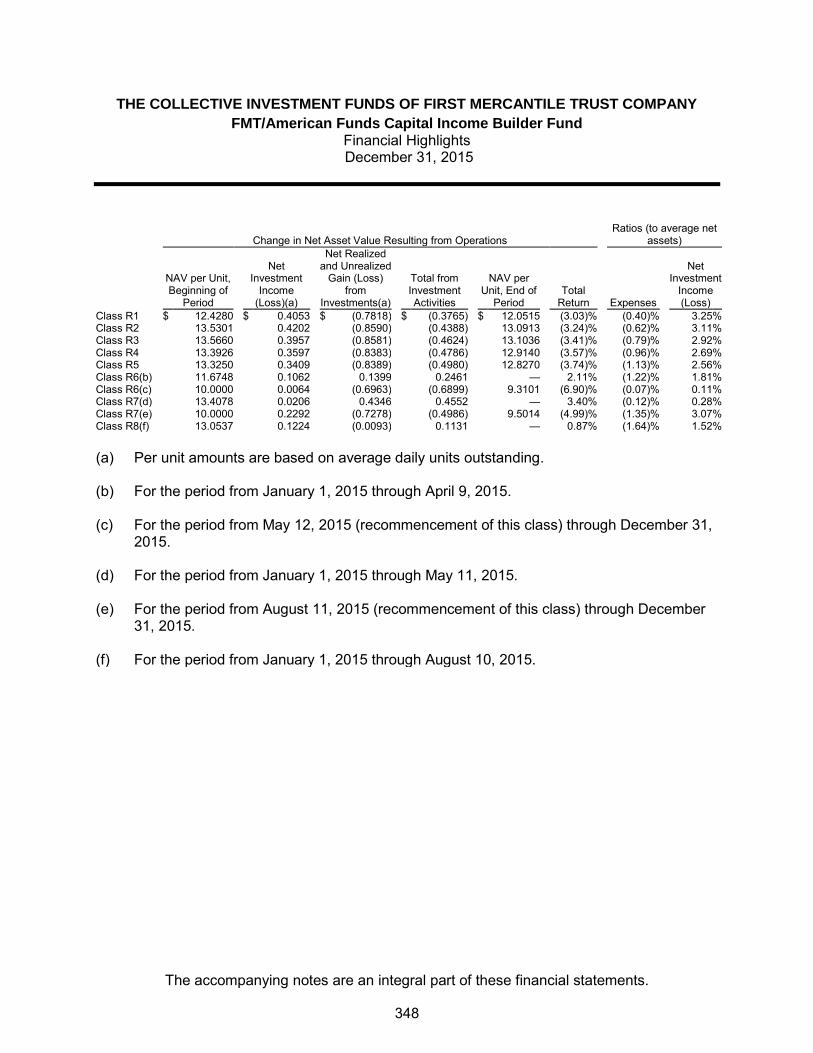
THE COLLECTIVE INVESTMENT FUNDS OF FIRST MERCANTILE TRUST COMPANY
FMT/American Funds Capital Income Builder Fund Financial Highlights December 31, 2015
The accompanying notes are an integral part of these financial statements.
Change in Net Asset Value Resulting from Operations Ratios (to average net
assets)
NAV per Unit, Beginning of
Period
Net Investment
Income (Loss)(a)
Net Realized and Unrealized
Gain (Loss) from
Investments(a)
Total from Investment Activities
NAV per Unit, End of
Period Total
Return Expenses
Net Investment
Income (Loss)
Class R1 $ 12.4280 $ 0.4053 $ (0.7818) $ (0.3765) $ 12.0515 (3.03) % (0.40) % 3.25 % Class R2 13.5301 0.4202 (0.8590) (0.4388) 13.0913 (3.24) % (0.62) % 3.11 % Class R3 13.5660 0.3957 (0.8581) (0.4624) 13.1036 (3.41) % (0.79) % 2.92 % Class R4 13.3926 0.3597 (0.8383) (0.4786) 12.9140 (3.57) % (0.96) % 2.69 % Class R5 13.3250 0.3409 (0.8389) (0.4980) 12.8270 (3.74) % (1.13) % 2.56 % Class R6(b) 11.6748 0.1062 0.1399 0.2461 — 2.11 % (1.22) % 1.81 % Class R6(c) 10.0000 0.0064 (0.6963) (0.6899) 9.3101 (6.90) % (0.07) % 0.11 % Class R7(d) 13.4078 0.0206 0.4346 0.4552 — 3.40 % (0.12) % 0.28 % Class R7(e) 10.0000 0.2292 (0.7278) (0.4986) 9.5014 (4.99) % (1.35) % 3.07 % Class R8(f) 13.0537 0.1224 (0.0093) 0.1131 — 0.87 % (1.64) % 1.52 % (a) Per unit amounts are based on average daily units outstanding.
(b) For the period from January 1, 2015 through April 9, 2015. (c) For the period from May 12, 2015 (recommencement of this class) through December 31,
2015.
(d) For the period from January 1, 2015 through May 11, 2015. (e) For the period from August 11, 2015 (recommencement of this class) through December
31, 2015. (f) For the period from January 1, 2015 through August 10, 2015.
348

FMT/DFA Global 60/40 Fund
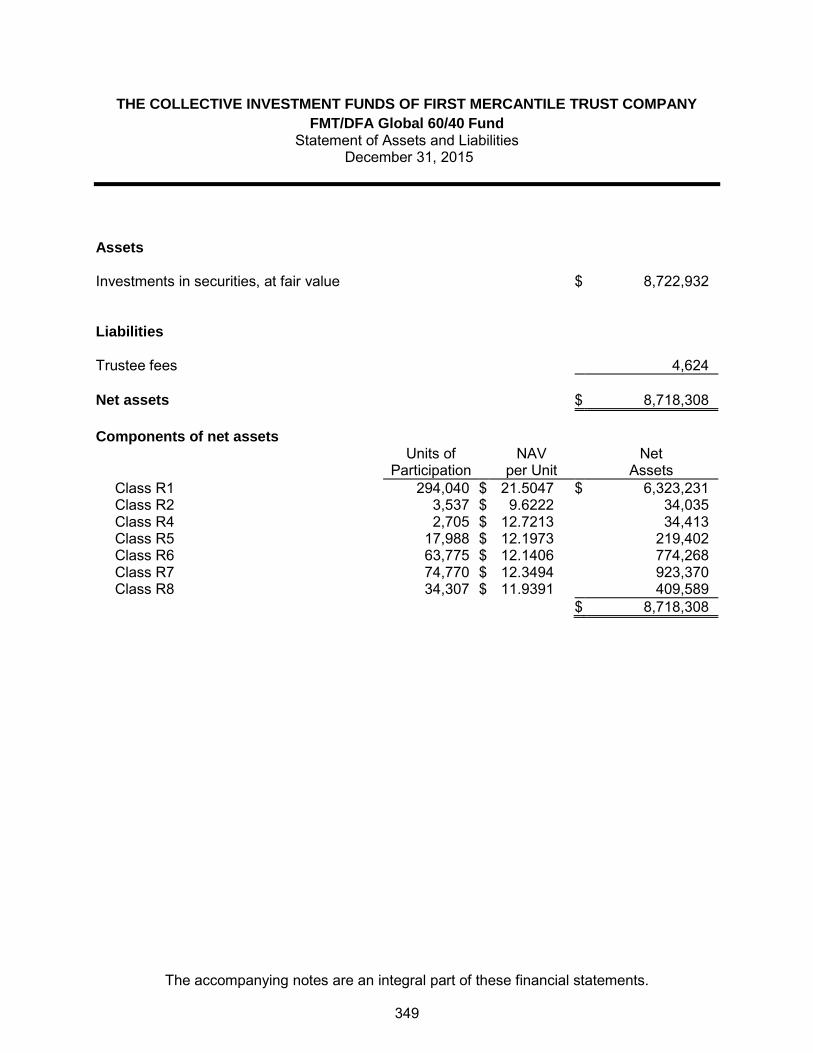
THE COLLECTIVE INVESTMENT FUNDS OF FIRST MERCANTILE TRUST COMPANY
FMT/DFA Global 60/40 Fund Statement of Assets and Liabilities
December 31, 2015
The accompanying notes are an integral part of these financial statements.
Assets Investments in securities, at fair value $ 8,722,932 Liabilities Trustee fees 4,624
Net assets $ 8,718,308
Components of net assets
Units of
Participation NAV
per Unit Net
Assets Class R1 294,040 $ 21.5047 $ 6,323,231
Class R2 3,537 $ 9.6222 34,035
Class R4 2,705 $ 12.7213 34,413
Class R5 17,988 $ 12.1973 219,402
Class R6 63,775 $ 12.1406 774,268
Class R7 74,770 $ 12.3494 923,370
Class R8 34,307 $ 11.9391 409,589
$ 8,718,308
349

THE COLLECTIVE INVESTMENT FUNDS OF FIRST MERCANTILE TRUST COMPANY
FMT/DFA Global 60/40 Fund Statement of Operations
For the Year Ended December 31, 2015
The accompanying notes are an integral part of these financial statements.
Investment income
Dividends $ 162,501
Expenses
Trustee fees 58,107
Custody fees 2,965
Audit fees 1,200
62,272
Net investment income 100,229
Net realized gain from investments sold
Proceeds from sales of investments 595,413
Cost of investments sold 567,044
Net realized gain from investments sold 28,369
Change in net unrealized appreciation (depreciation) on investments (354,307)
Net realized and unrealized loss on investments (325,938)
Net decrease in net assets resulting from operations $ (225,709)
350

THE COLLECTIVE INVESTMENT FUNDS OF FIRST MERCANTILE TRUST COMPANY
FMT/DFA Global 60/40 Fund Statement of Changes in Net Assets
For the Year Ended December 31, 2015
The accompanying notes are an integral part of these financial statements.
Operations
Net investment income $ 100,229
Net realized gain from investments sold 28,369
Change in net unrealized appreciation (depreciation) on investments (354,307)
Net decrease in net assets resulting from operations (225,709)
Participant transactions
Proceeds from units purchased 4,896,202
Less payments for units redeemed 4,284,923
Increase in net assets from participant transactions 611,279
Total increase in net assets 385,570
Net assets at beginning of year 8,332,738
Net assets at end of year $ 8,718,308
351
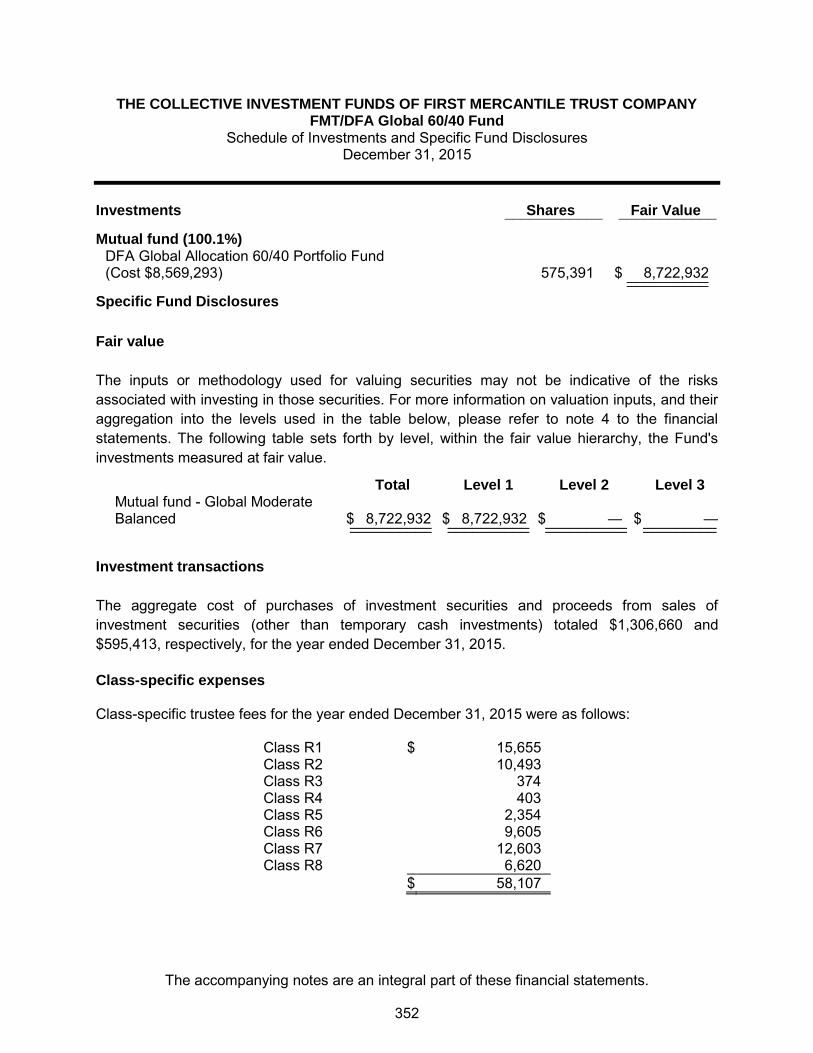
THE COLLECTIVE INVESTMENT FUNDS OF FIRST MERCANTILE TRUST COMPANY FMT/DFA Global 60/40 Fund
Schedule of Investments and Specific Fund Disclosures December 31, 2015
The accompanying notes are an integral part of these financial statements.
Investments Shares Fair Value ____________ ____________
Mutual fund (100.1%)
DFA Global Allocation 60/40 Portfolio Fund (Cost $8,569,293) 575,391 $ 8,722,932 __________ __________
Specific Fund Disclosures
Fair value
The inputs or methodology used for valuing securities may not be indicative of the risks associated with investing in those securities. For more information on valuation inputs, and their aggregation into the levels used in the table below, please refer to note 4 to the financial statements. The following table sets forth by level, within the fair value hierarchy, the Fund's investments measured at fair value.
Total Level 1 Level 2 Level 3 Mutual fund - Global Moderate Balanced $ 8,722,932 $ 8,722,932 $ — $ — __________ __________ __________ _________ __________ __________ __________ _________
Investment transactions
The aggregate cost of purchases of investment securities and proceeds from sales of investment securities (other than temporary cash investments) totaled $1,306,660 and $595,413, respectively, for the year ended December 31, 2015. Class-specific expenses Class-specific trustee fees for the year ended December 31, 2015 were as follows: Class R1 $ 15,655 Class R2 10,493 Class R3 374 Class R4 403 Class R5 2,354 Class R6 9,605 Class R7 12,603 Class R8 6,620 $ 58,107
352

THE COLLECTIVE INVESTMENT FUNDS OF FIRST MERCANTILE TRUST COMPANY
FMT/DFA Global 60/40 Fund Schedule of Participant Transactions
December 31, 2015
The accompanying notes are an integral part of these financial statements.
Participant transactions by class for the year ended December 31, 2015 were as follows: Dollars Units Purchases Redemptions Net change Purchases Redemptions Net change Class R1 $ 3,924,522 $ (368,064) $ 3,556,458 175,979 (17,074) 158,905 Class R2 389,424 (3,516,554) (3,127,130) 38,960 (350,903) (311,943) Class R3 58,742 (89,559) (30,817) 4,413 (6,867) (2,454) Class R4 8,310 (14,288) (5,978) 637 (1,118) (481) Class R5 18,436 (22,819) (4,383) 1,474 (1,836) (362) Class R6 229,237 (184,487) 44,750 18,255 (14,683) 3,572 Class R7 224,943 (46,461) 178,482 17,585 (3,568) 14,017 Class R8 42,588 (42,691) (103) 3,445 (3,341) 104 $ 4,896,202 $ (4,284,923) $ 611,279 260,748 (399,390) (138,642)
353
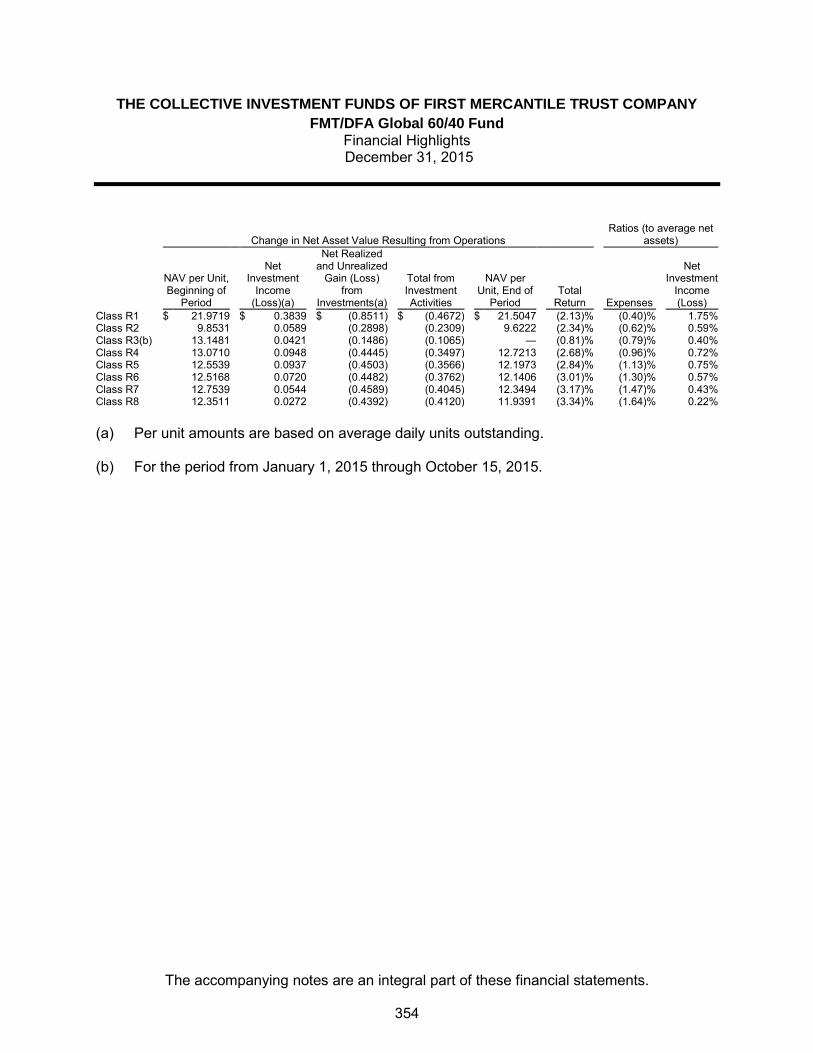
THE COLLECTIVE INVESTMENT FUNDS OF FIRST MERCANTILE TRUST COMPANY
FMT/DFA Global 60/40 Fund Financial Highlights December 31, 2015
The accompanying notes are an integral part of these financial statements.
Change in Net Asset Value Resulting from Operations Ratios (to average net
assets)
NAV per Unit, Beginning of
Period
Net Investment
Income (Loss)(a)
Net Realized and Unrealized
Gain (Loss) from
Investments(a)
Total from Investment Activities
NAV per Unit, End of
Period Total
Return Expenses
Net Investment
Income (Loss)
Class R1 $ 21.9719 $ 0.3839 $ (0.8511) $ (0.4672) $ 21.5047 (2.13) % (0.40) % 1.75 % Class R2 9.8531 0.0589 (0.2898) (0.2309) 9.6222 (2.34) % (0.62) % 0.59 % Class R3(b) 13.1481 0.0421 (0.1486) (0.1065) — (0.81) % (0.79) % 0.40 % Class R4 13.0710 0.0948 (0.4445) (0.3497) 12.7213 (2.68) % (0.96) % 0.72 % Class R5 12.5539 0.0937 (0.4503) (0.3566) 12.1973 (2.84) % (1.13) % 0.75 % Class R6 12.5168 0.0720 (0.4482) (0.3762) 12.1406 (3.01) % (1.30) % 0.57 % Class R7 12.7539 0.0544 (0.4589) (0.4045) 12.3494 (3.17) % (1.47) % 0.43 % Class R8 12.3511 0.0272 (0.4392) (0.4120) 11.9391 (3.34) % (1.64) % 0.22 % (a) Per unit amounts are based on average daily units outstanding.
(b) For the period from January 1, 2015 through October 15, 2015.
354

FMT/Dodge & Cox Balanced Fund

THE COLLECTIVE INVESTMENT FUNDS OF FIRST MERCANTILE TRUST COMPANY
FMT/Dodge & Cox Balanced Fund Statement of Assets and Liabilities
December 31, 2015
The accompanying notes are an integral part of these financial statements.
Assets Investments in securities, at fair value $ 40,214,384 Liabilities Trustee fees 22,689
Net assets $ 40,191,695
Components of net assets
Units of
Participation NAV
per Unit Net
Assets Class R1 1,075,309 $ 15.1391 $ 16,279,259
Class R2 442,993 $ 16.0949 7,129,941
Class R3 310,677 $ 15.3505 4,769,039
Class R4 303,285 $ 15.5564 4,718,016
Class R5 218,933 $ 15.7681 3,452,153
Class R6 186,485 $ 16.0660 2,996,071
Class R7 16,589 $ 14.9197 247,499
Class R8 41,601 $ 14.4159 599,717
$ 40,191,695
355

THE COLLECTIVE INVESTMENT FUNDS OF FIRST MERCANTILE TRUST COMPANY
FMT/Dodge & Cox Balanced Fund Statement of Operations
For the Year Ended December 31, 2015
The accompanying notes are an integral part of these financial statements.
Investment income
Dividends $ 2,216,531
Expenses
Trustee fees 295,000
Custody fees 15,644
Audit fees 1,200
311,844
Net investment income 1,904,687
Net realized gain from investments sold
Proceeds from sales of investments 9,582,885
Cost of investments sold 7,659,969
Net realized gain from investments sold 1,922,916
Change in net unrealized appreciation (depreciation) on investments (5,337,778)
Net realized and unrealized loss on investments (3,414,862)
Other operating credits (charges) 34,775
Net decrease in net assets resulting from operations $ (1,475,400)
356

THE COLLECTIVE INVESTMENT FUNDS OF FIRST MERCANTILE TRUST COMPANY
FMT/Dodge & Cox Balanced Fund Statement of Changes in Net Assets
For the Year Ended December 31, 2015
The accompanying notes are an integral part of these financial statements.
Operations
Net investment income $ 1,904,687
Net realized gain from investments sold 1,922,916
Change in net unrealized appreciation (depreciation) on investments (5,337,778)
Other operating credits (charges) 34,775
Net decrease in net assets resulting from operations (1,475,400)
Participant transactions
Proceeds from units purchased 9,473,154
Less payments for units redeemed 14,815,986
Decrease in net assets from participant transactions (5,342,832)
Total decrease in net assets (6,818,232)
Net assets at beginning of year 47,009,927
Net assets at end of year $ 40,191,695
357

THE COLLECTIVE INVESTMENT FUNDS OF FIRST MERCANTILE TRUST COMPANY FMT/Dodge & Cox Balanced Fund
Schedule of Investments and Specific Fund Disclosures December 31, 2015
The accompanying notes are an integral part of these financial statements.
Investments Shares Fair Value ____________ ____________
Mutual fund (100.1%) Dodge and Cox Balanced Fund (Cost $34,727,960) 425,910 $ 40,214,384 __________ __________ Specific Fund Disclosures
Fair value
The inputs or methodology used for valuing securities may not be indicative of the risks associated with investing in those securities. For more information on valuation inputs, and their aggregation into the levels used in the table below, please refer to note 4 to the financial statements. The following table sets forth by level, within the fair value hierarchy, the Fund's investments measured at fair value.
Total Level 1 Level 2 Level 3
Mutual fund - U.S. Moderate Balanced $ 40,214,384 $ 40,214,384 $ — $ — __________ __________ __________ _________ __________ __________ __________ _________
Investment transactions
The aggregate cost of purchases of investment securities and proceeds from sales of investment securities (other than temporary cash investments) totaled $6,176,380 and $9,582,885, respectively, for the year ended December 31, 2015. Class-specific expenses Class-specific trustee fees for the year ended December 31, 2015 were as follows: Class R1 $ 62,005 Class R2 42,751 Class R3 45,748 Class R4 43,758 Class R5 44,606 Class R6 40,442 Class R7 5,956 Class R8 9,734 $ 295,000
358

THE COLLECTIVE INVESTMENT FUNDS OF FIRST MERCANTILE TRUST COMPANY
FMT/Dodge & Cox Balanced Fund Schedule of Participant Transactions
December 31, 2015
The accompanying notes are an integral part of these financial statements.
Participant transactions by class for the year ended December 31, 2015 were as follows: Dollars Units Purchases Redemptions Net change Purchases Redemptions Net change Class R1 $ 3,479,665 $ (6,521,792) $ (3,042,127) 221,954 (417,378) (195,424) Class R2 975,616 (1,090,877) (115,261) 58,876 (65,741) (6,865) Class R3 2,273,013 (3,077,788) (804,775) 143,850 (194,971) (51,121) Class R4 1,848,192 (1,870,968) (22,776) 113,994 (114,858) (864) Class R5 543,319 (1,516,124) (972,805) 33,728 (93,293) (59,565) Class R6 215,291 (401,907) (186,616) 12,973 (24,492) (11,519) Class R7 61,507 (283,085) (221,578) 3,994 (18,836) (14,842) Class R8 76,551 (53,445) 23,106 5,100 (3,580) 1,520 $ 9,473,154 $ (14,815,986) $ (5,342,832) 594,469 (933,149) (338,680)
359

THE COLLECTIVE INVESTMENT FUNDS OF FIRST MERCANTILE TRUST COMPANY
FMT/Dodge & Cox Balanced Fund Financial Highlights December 31, 2015
The accompanying notes are an integral part of these financial statements.
Change in Net Asset Value Resulting from Operations Ratios (to average net
assets)
NAV per Unit, Beginning of
Period
Net Investment
Income (Loss)(a)
Net Realized and Unrealized
Gain (Loss) from
Investments(a)
Total from Investment Activities
NAV per Unit, End of
Period Total
Return Expenses
Net Investment
Income (Loss)
Class R1 $ 15.6344 $ 0.7310 $ (1.2263) $ (0.4953) $ 15.1391 (3.17) % (0.39) % 4.69 % Class R2 16.6582 0.7598 (1.3231) (0.5633) 16.0949 (3.38) % (0.61) % 4.58 % Class R3 15.9148 0.6221 (1.1864) (0.5643) 15.3505 (3.55) % (0.78) % 3.93 % Class R4 16.1559 0.6913 (1.2908) (0.5995) 15.5564 (3.71) % (0.95) % 4.31 % Class R5 16.4037 0.6157 (1.2513) (0.6356) 15.7681 (3.87) % (1.12) % 3.78 % Class R6 16.7423 0.6342 (1.3105) (0.6763) 16.0660 (4.04) % (1.29) % 3.82 % Class R7 15.5742 0.4522 (1.1067) (0.6545) 14.9197 (4.20) % (1.46) % 2.93 % Class R8 15.0740 0.5390 (1.1971) (0.6581) 14.4159 (4.37) % (1.63) % 3.61 % (a) Per unit amounts are based on average daily units outstanding.
360

FMT/Vanguard Balanced Index Fund
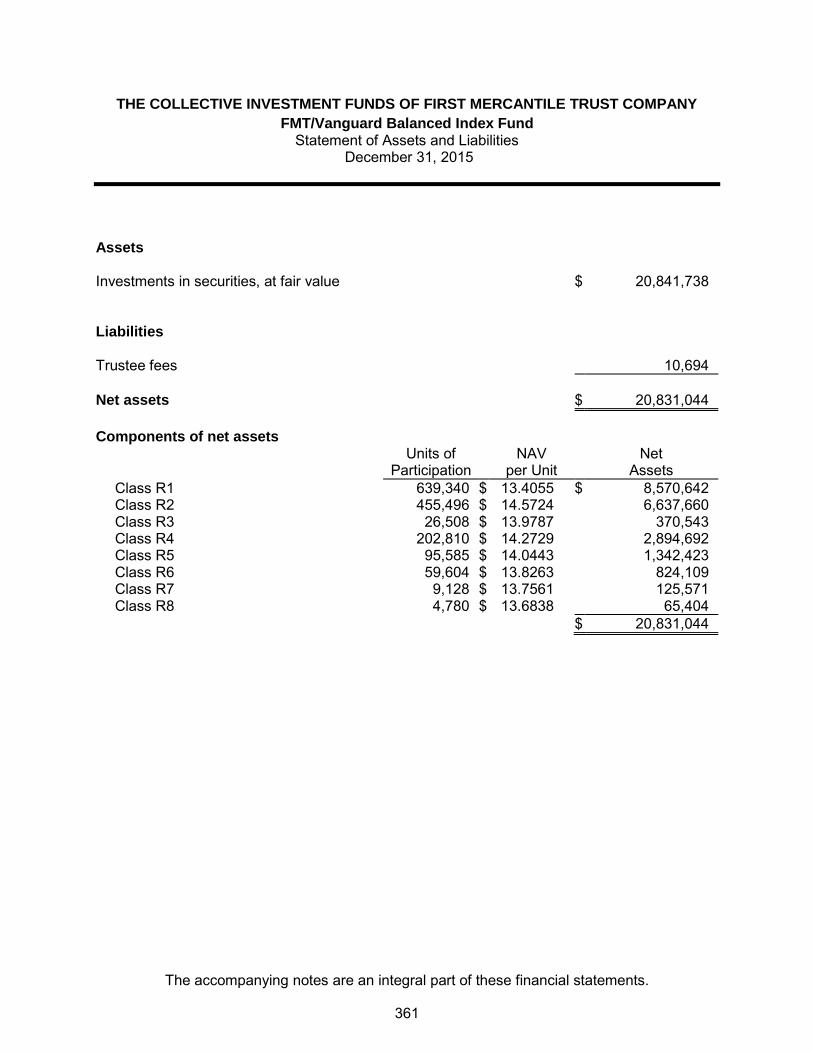
THE COLLECTIVE INVESTMENT FUNDS OF FIRST MERCANTILE TRUST COMPANY
FMT/Vanguard Balanced Index Fund Statement of Assets and Liabilities
December 31, 2015
The accompanying notes are an integral part of these financial statements.
Assets Investments in securities, at fair value $ 20,841,738 Liabilities Trustee fees 10,694
Net assets $ 20,831,044
Components of net assets
Units of
Participation NAV
per Unit Net
Assets Class R1 639,340 $ 13.4055 $ 8,570,642
Class R2 455,496 $ 14.5724 6,637,660
Class R3 26,508 $ 13.9787 370,543
Class R4 202,810 $ 14.2729 2,894,692
Class R5 95,585 $ 14.0443 1,342,423
Class R6 59,604 $ 13.8263 824,109
Class R7 9,128 $ 13.7561 125,571
Class R8 4,780 $ 13.6838 65,404
$ 20,831,044
361

THE COLLECTIVE INVESTMENT FUNDS OF FIRST MERCANTILE TRUST COMPANY
FMT/Vanguard Balanced Index Fund Statement of Operations
For the Year Ended December 31, 2015
The accompanying notes are an integral part of these financial statements.
Investment income
Dividends $ 432,423
Expenses
Trustee fees 128,356
Custody fees 7,181
Audit fees 1,200
136,737
Net investment income 295,686
Net realized gain from investments sold
Proceeds from sales of investments 4,351,049
Cost of investments sold 3,608,024
Net realized gain from investments sold 743,025
Change in net unrealized appreciation (depreciation) on investments (1,067,634)
Net realized and unrealized loss on investments (324,609)
Net decrease in net assets resulting from operations $ (28,923)
362

THE COLLECTIVE INVESTMENT FUNDS OF FIRST MERCANTILE TRUST COMPANY
FMT/Vanguard Balanced Index Fund Statement of Changes in Net Assets
For the Year Ended December 31, 2015
The accompanying notes are an integral part of these financial statements.
Operations
Net investment income $ 295,686
Net realized gain from investments sold 743,025
Change in net unrealized appreciation (depreciation) on investments (1,067,634)
Net decrease in net assets resulting from operations (28,923)
Participant transactions
Proceeds from units purchased 6,417,851
Less payments for units redeemed 5,842,466
Increase in net assets from participant transactions 575,385
Total increase in net assets 546,462
Net assets at beginning of year 20,284,582
Net assets at end of year $ 20,831,044
363

THE COLLECTIVE INVESTMENT FUNDS OF FIRST MERCANTILE TRUST COMPANY FMT/Vanguard Balanced Index Fund
Schedule of Investments and Specific Fund Disclosures December 31, 2015
The accompanying notes are an integral part of these financial statements.
Investments Shares Fair Value ____________ ____________
Mutual fund (100.1%)
Vanguard Balanced Index Fund Admiral Shares (Cost $18,048,896) 713,270 $ 20,841,738 __________ __________
Specific Fund Disclosures
Fair value
The inputs or methodology used for valuing securities may not be indicative of the risks associated with investing in those securities. For more information on valuation inputs, and their aggregation into the levels used in the table below, please refer to note 4 to the financial statements. The following table sets forth by level, within the fair value hierarchy, the Fund's investments measured at fair value.
Total Level 1 Level 2 Level 3
Mutual fund - U.S. Moderate Balanced $ 20,841,738 $ 20,841,738 $ — $ — __________ __________ __________ _________ __________ __________ __________ _________
Investment transactions
The aggregate cost of purchases of investment securities and proceeds from sales of investment securities (other than temporary cash investments) totaled $5,221,950 and $4,351,049, respectively, for the year ended December 31, 2015. Class-specific expenses Class-specific trustee fees for the year ended December 31, 2015 were as follows: Class R1 $ 28,851 Class R2 38,986 Class R3 4,636 Class R4 26,039 Class R5 11,590 Class R6 10,192 Class R7 5,331 Class R8 2,731 $ 128,356
364
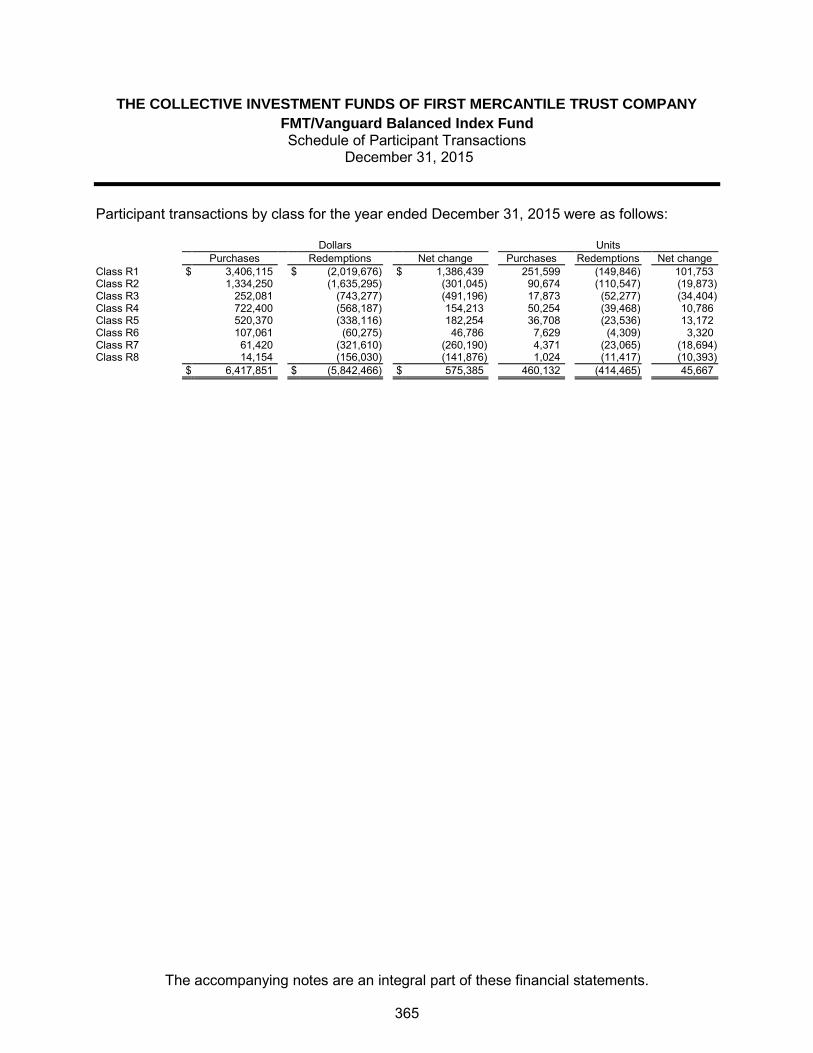
THE COLLECTIVE INVESTMENT FUNDS OF FIRST MERCANTILE TRUST COMPANY
FMT/Vanguard Balanced Index Fund Schedule of Participant Transactions
December 31, 2015
The accompanying notes are an integral part of these financial statements.
Participant transactions by class for the year ended December 31, 2015 were as follows: Dollars Units Purchases Redemptions Net change Purchases Redemptions Net change Class R1 $ 3,406,115 $ (2,019,676) $ 1,386,439 251,599 (149,846) 101,753 Class R2 1,334,250 (1,635,295) (301,045) 90,674 (110,547) (19,873) Class R3 252,081 (743,277) (491,196) 17,873 (52,277) (34,404) Class R4 722,400 (568,187) 154,213 50,254 (39,468) 10,786 Class R5 520,370 (338,116) 182,254 36,708 (23,536) 13,172 Class R6 107,061 (60,275) 46,786 7,629 (4,309) 3,320 Class R7 61,420 (321,610) (260,190) 4,371 (23,065) (18,694) Class R8 14,154 (156,030) (141,876) 1,024 (11,417) (10,393) $ 6,417,851 $ (5,842,466) $ 575,385 460,132 (414,465) 45,667
365

THE COLLECTIVE INVESTMENT FUNDS OF FIRST MERCANTILE TRUST COMPANY
FMT/Vanguard Balanced Index Fund Financial Highlights December 31, 2015
The accompanying notes are an integral part of these financial statements.
Change in Net Asset Value Resulting from Operations Ratios (to average net
assets)
NAV per Unit, Beginning of
Period
Net Investment
Income (Loss)(a)
Net Realized and Unrealized
Gain (Loss) from
Investments(a)
Total from Investment Activities
NAV per Unit, End of
Period Total
Return Expenses
Net Investment
Income (Loss)
Class R1 $ 13.3898 $ 0.2283 $ (0.2126) $ 0.0157 $ 13.4055 0.12 % (0.39) % 1.69 % Class R2 14.5875 0.2114 (0.2265) (0.0151) 14.5724 (0.10) % (0.61) % 1.44 % Class R3 14.0170 0.1600 (0.1983) (0.0383) 13.9787 (0.27) % (0.78) % 1.13 % Class R4 14.3364 0.1604 (0.2239) (0.0635) 14.2729 (0.44) % (0.95) % 1.11 % Class R5 14.1308 0.1487 (0.2352) (0.0865) 14.0443 (0.61) % (1.12) % 1.05 % Class R6 13.9352 0.1083 (0.2172) (0.1089) 13.8263 (0.78) % (1.29) % 0.77 % Class R7 13.8882 0.0445 (0.1766) (0.1321) 13.7561 (0.95) % (1.46) % 0.32 % Class R8 13.8386 0.0282 (0.1830) (0.1548) 13.6838 (1.12) % (1.63) % 0.20 % (a) Per unit amounts are based on average daily units outstanding.
366

FMT/Vanguard Wellesley Income Fund

THE COLLECTIVE INVESTMENT FUNDS OF FIRST MERCANTILE TRUST COMPANY
FMT/Vanguard Wellesley Income Fund Statement of Assets and Liabilities
December 31, 2015
The accompanying notes are an integral part of these financial statements.
Assets Investments in securities, at fair value $ 42,629,923 Liabilities Trustee fees 26,279
Net assets $ 42,603,644
Components of net assets
Units of
Participation NAV
per Unit Net
Assets Class R1 871,841 $ 12.5791 $ 10,967,000
Class R2 215,158 $ 12.9835 2,793,499
Class R3 1,455,953 $ 12.7479 18,560,408
Class R4 388,136 $ 12.9234 5,016,024
Class R5 195,059 $ 12.6449 2,466,505
Class R6 40,177 $ 12.4292 499,366
Class R7 22,227 $ 12.4743 277,260
Class R8 168,112 $ 12.0371 2,023,582
$ 42,603,644
367

THE COLLECTIVE INVESTMENT FUNDS OF FIRST MERCANTILE TRUST COMPANY
FMT/Vanguard Wellesley Income Fund Statement of Operations
For the Year Ended December 31, 2015
The accompanying notes are an integral part of these financial statements.
Investment income
Dividends $ 2,116,651
Expenses
Trustee fees 222,904
Custody fees 10,730
Audit fees 1,200
234,834
Net investment income 1,881,817
Net realized gain from investments sold
Proceeds from sales of investments 8,352,715
Cost of investments sold 7,930,256
Net realized gain from investments sold 422,459
Change in net unrealized appreciation (depreciation) on investments (2,032,259)
Net realized and unrealized loss on investments (1,609,800)
Net increase in net assets resulting from operations $ 272,017
368

THE COLLECTIVE INVESTMENT FUNDS OF FIRST MERCANTILE TRUST COMPANY
FMT/Vanguard Wellesley Income Fund Statement of Changes in Net Assets
For the Year Ended December 31, 2015
The accompanying notes are an integral part of these financial statements.
Operations
Net investment income $ 1,881,817
Net realized gain from investments sold 422,459
Change in net unrealized appreciation (depreciation) on investments (2,032,259)
Net increase in net assets resulting from operations 272,017
Participant transactions
Proceeds from units purchased 26,598,232
Less payments for units redeemed 12,267,758
Increase in net assets from participant transactions 14,330,474
Total increase in net assets 14,602,491
Net assets at beginning of year 28,001,153
Net assets at end of year $ 42,603,644
369

THE COLLECTIVE INVESTMENT FUNDS OF FIRST MERCANTILE TRUST COMPANY FMT/Vanguard Wellesley Income Fund
Schedule of Investments and Specific Fund Disclosures December 31, 2015
The accompanying notes are an integral part of these financial statements.
Investments Shares Fair Value ____________ ____________
Mutual fund (100.1%)
Vanguard Wellesley Income Fund Admiral Shares (Cost $42,165,532) 717,675 $ 42,629,923 __________ __________
Specific Fund Disclosures
Fair value
The inputs or methodology used for valuing securities may not be indicative of the risks associated with investing in those securities. For more information on valuation inputs, and their aggregation into the levels used in the table below, please refer to note 4 to the financial statements. The following table sets forth by level, within the fair value hierarchy, the Fund's investments measured at fair value.
Total Level 1 Level 2 Level 3
Mutual fund - U.S. Conservative Balanced $ 42,629,923 $ 42,629,923 $ — $ — __________ __________ __________ _________ __________ __________ __________ _________
Investment transactions
The aggregate cost of purchases of investment securities and proceeds from sales of investment securities (other than temporary cash investments) totaled $24,575,348 and $8,352,715, respectively, for the year ended December 31, 2015.
Class-specific expenses Class-specific trustee fees for the year ended December 31, 2015 were as follows: Class R1 $ 40,142 Class R2 15,329 Class R3 81,995 Class R4 45,354 Class R5 21,902 Class R6 8,555 Class R7 3,876 Class R8 5,751 $ 222,904
370

THE COLLECTIVE INVESTMENT FUNDS OF FIRST MERCANTILE TRUST COMPANY
FMT/Vanguard Wellesley Income Fund Schedule of Participant Transactions
December 31, 2015
The accompanying notes are an integral part of these financial statements.
Participant transactions by class for the year ended December 31, 2015 were as follows: Dollars Units Purchases Redemptions Net change Purchases Redemptions Net change Class R1 $ 4,615,713 $ (4,000,090) $ 615,623 368,129 (320,832) 47,297 Class R2 545,105 (445,933) 99,172 42,050 (34,464) 7,586 Class R3 15,084,701 (3,639,992) 11,444,709 1,197,014 (290,566) 906,448 Class R4 2,597,367 (2,171,549) 425,818 200,802 (168,986) 31,816 Class R5 1,485,592 (1,018,891) 466,701 116,941 (80,222) 36,719 Class R6 230,550 (922,141) (691,591) 18,776 (73,455) (54,679) Class R7 67,425 (34,943) 32,482 5,374 (2,803) 2,571 Class R8 1,971,779 (34,219) 1,937,560 164,433 (2,827) 161,606 $ 26,598,232 $ (12,267,758) $ 14,330,474 2,113,519 (974,155) 1,139,364
371

THE COLLECTIVE INVESTMENT FUNDS OF FIRST MERCANTILE TRUST COMPANY
FMT/Vanguard Wellesley Income Fund Financial Highlights December 31, 2015
The accompanying notes are an integral part of these financial statements.
Change in Net Asset Value Resulting from Operations Ratios (to average net
assets)
NAV per Unit, Beginning of
Period
Net Investment
Income (Loss)(a)
Net Realized and Unrealized
Gain (Loss) from
Investments(a)
Total from Investment Activities
NAV per Unit, End of
Period Total
Return Expenses
Net Investment
Income (Loss)
Class R1 $ 12.4596 $ 0.6197 $ (0.5002) $ 0.1195 $ 12.5791 0.96 % (0.39) % 4.94 % Class R2 12.8884 0.6388 (0.5437) 0.0951 12.9835 0.74 % (0.61) % 4.93 % Class R3 12.6762 0.8459 (0.7742) 0.0717 12.7479 0.57 % (0.78) % 6.65 % Class R4 12.8724 0.6023 (0.5513) 0.0510 12.9234 0.40 % (0.95) % 4.66 % Class R5 12.6165 0.7228 (0.6944) 0.0284 12.6449 0.23 % (1.12) % 5.72 % Class R6 12.4223 0.4199 (0.4130) 0.0069 12.4292 0.06 % (1.29) % 3.36 % Class R7 12.4886 0.5141 (0.5284) (0.0143) 12.4743 (0.11) % (1.46) % 4.12 % Class R8 12.0715 2.0977 (2.1321) (0.0344) 12.0371 (0.29) % (1.63) % 17.37 % (a) Per unit amounts are based on average daily units outstanding.
372

FMT Aggressive International Growth (WCM) Fund

THE COLLECTIVE INVESTMENT FUNDS OF FIRST MERCANTILE TRUST COMPANY FMT Aggressive International Growth (WCM) Fund
Statement of Assets and Liabilities December 31, 2015
The accompanying notes are an integral part of these financial statements.
Assets Investments in securities, at fair value $ 33,047,551 Cash equivalents 702,752Receivables
Dividend tax reclaim 74,551Dividends and interest 22,048
Total assets 33,846,902 Liabilities Sub-advisor fees 18,802Trustee fees 293
Total liabilities 19,095 Net assets $ 33,827,807 Components of net assets
Units of
Participation NAV
per Unit Net
Assets Class R1 62,273 $ 9.4276 $ 587,079Class R2 529 $ 11.5072 6,083Class R3 4,101 $ 9.9871 40,953Class R4 2,806 $ 9.6065 26,958Class R5 270 $ 12.8235 3,460Class R6 134 $ 12.8860 1,723Class R7 3,860 $ 12.4542 48,070Class R8 272 $ 12.2131 3,317Class LifeStyle 33,110,164
$ 33,827,807
373

THE COLLECTIVE INVESTMENT FUNDS OF FIRST MERCANTILE TRUST COMPANY FMT Aggressive International Growth (WCM) Fund
Statement of Operations For the Year Ended December 31, 2015
The accompanying notes are an integral part of these financial statements.
Investment income
Dividends (net of foreign withholding taxes of $20,387) $ 672,561Interest 988
673,549 Expenses
Sub-advisor fees 245,429Trustee fees 219,767Custody fees 37,002Audit fees 6,212
508,410 Net investment income 165,139 Net realized gain from investments sold
Proceeds from sales of investments 22,761,549Cost of investments sold 20,491,629
Net realized gain from investments sold 2,269,920 Change in net unrealized appreciation (depreciation) on investments (187,434) Net realized and unrealized gain on investments 2,082,486 Other operating credits (charges) 229 Net increase in net assets resulting from operations $ 2,247,854
374

THE COLLECTIVE INVESTMENT FUNDS OF FIRST MERCANTILE TRUST COMPANY FMT Aggressive International Growth (WCM) Fund
Statement of Changes in Net Assets For the Year Ended December 31, 2015
The accompanying notes are an integral part of these financial statements.
Operations
Net investment income $ 165,139
Net realized gain from investments sold 2,269,920
Change in net unrealized appreciation (depreciation) on investments (187,434)
Other operating credits (charges) 229
Net increase in net assets resulting from operations 2,247,854 Participant transactions
Proceeds from units purchased 7,281,618Less payments for units redeemed 16,955,772
Decrease in net assets from participant transactions (9,674,154)
Total decrease in net assets (7,426,300) Net assets at beginning of year 41,254,107 Net assets at end of year $ 33,827,807
375

THE COLLECTIVE INVESTMENT FUNDS OF FIRST MERCANTILE TRUST COMPANY FMT Aggressive International Growth (WCM) Fund
Schedule of Investments and Specific Fund Disclosures December 31, 2015
The accompanying notes are an integral part of these financial statements.
Investments
Principal Amount or
Shares Fair Value ____________ ____________
Common stocks (76.7%)
Basic Material (3.3%) Novozymes A/S B Shares 23,082 $ 1,110,290
Communications (5.4%) Tencent Holdings Ltd. 61,195 1,205,614 Yandex N.V. Class A 38,675 607,971 __________ 1,813,585
Consumer, Cyclical (10.4%) Compass Group PLC 59,700 1,034,290 Industria de Diseno Textil S.A. 15,825 544,547 LVMH Moet Hennessy Louis Vuitton SE 5,525 869,301 Swatch Group AG/The BR 1,270 443,933 Wal-Mart de Mexico S.A.B. de C.V. 253,410 640,929 __________ 3,533,000
Consumer, Non-cyclical (38.3%) CHR Hansen Holding A/S 20,135 1,264,718 Coloplast A/S Class B 14,910 1,208,350 CSL Ltd. 14,680 1,126,534 Experian PLC 56,865 1,006,974 ICON PLC 15,215 1,182,206 Nestle S.A. 19,839 1,476,266 Perrigo Co. PLC 6,345 918,122 Reckitt Benckiser Group PLC 14,905 1,380,355 SGS S.A. 488 930,846 Shoprite Holdings Ltd. 37,860 350,523 Sysmex Corp. 22,650 1,474,533 Unicharm Corp. 31,300 644,607 __________ 12,964,034
Energy (3.3%) Core Laboratories N.V. 10,100 1,098,274
Financial (4.4%) ACE Ltd. 12,620 1,474,647
Industrial (8.9%)
Canadian Pacific Railway Ltd. 7,265 927,014Keyence Corp. 1,800 1,003,899
376

THE COLLECTIVE INVESTMENT FUNDS OF FIRST MERCANTILE TRUST COMPANY FMT Aggressive International Growth (WCM) Fund
Schedule of Investments and Specific Fund Disclosures (continued) December 31, 2015
The accompanying notes are an integral part of these financial statements.
Investments
Principal Amount or
Shares Fair Value
Common stocks (continued) Industrial (continued) Sensata Technologies Holding N.V. 23,600 $ 1,087,016 __________
3,017,929
Technology (2.7%) Constellation Software, Inc. 2,220 925,509 __________ Total Common stocks (Cost $23,774,580) 25,937,268
Depository receipts (18.5%)
Communication (3.4%) Ctrip.com International Ltd. ADR 24,870 1,152,227
Consumer, Non-cyclical (4.6%) Novo Nordisk A/S ADR 26,810 1,557,125
Financial (2.0%) HDFC Bank Ltd. ADR 11,115 684,684
Technology (8.5%) ARM Holdings PLC ADR 23,075 1,043,913 Taiwan Semiconductor Manufacturing Co. Ltd. ADR 79,825 1,816,019 __________ 2,859,932 __________ Total Depository receipts (Cost $5,287,475) 6,253,968
Limited partnership (2.5%) Lazard Ltd. Class A (Cost $739,102) 19,025 856,315 __________Total Investments (Cost $29,801,157) $ 33,047,551 ____________________
377

THE COLLECTIVE INVESTMENT FUNDS OF FIRST MERCANTILE TRUST COMPANY FMT Aggressive International Growth (WCM) Fund
Schedule of Investments and Specific Fund Disclosures (continued) December 31, 2015
The accompanying notes are an integral part of these financial statements.
Specific Fund Disclosures Fair value The inputs or methodology used for valuing securities may not be indicative of the risks associated with investing in those securities. For more information on valuation inputs, and their aggregation into the levels used in the table below, please refer to note 4 to the financial statements. The following table sets forth by level, within the fair value hierarchy, the Fund's investments measured at fair value.
Total Level 1 Level 2 Level 3
Common stocks $ 25,937,268 $ 25,937,268 $ — $ —Depository receipts 6,253,968 6,253,968 — —Limited partnership 856,315 856,315 — —__________ __________ __________ _________
$ 33,047,551 $ 33,047,551 $ — $ —__________ __________ __________ ___________________ __________ __________ _________ Investment transactions The aggregate cost of purchases of investment securities and proceeds from sales of investment securities (other than temporary cash investments) totaled $12,018,941 and $22,761,549, respectively, for the year ended December 31, 2015. Proceeds from sales of investments Proceeds from sales of investments as reported in the accompanying statement of operations is net of foreign currency losses of $20,862. Class-specific expenses Class-specific trustee fees for the year ended December 31, 2015 were as follows: Class R1 $ 2,186 Class R2 30 Class R3 152 Class R4 175 Class R5 36 Class R6 20 Class R7 794 Class R8 107 Class LifeStyle 216,267 $ 219,767
378

THE COLLECTIVE INVESTMENT FUNDS OF FIRST MERCANTILE TRUST COMPANY FMT Aggressive International Growth (WCM) Fund
Schedule of Participant Transactions December 31, 2015
The accompanying notes are an integral part of these financial statements.
Participant transactions by class for the year ended December 31, 2015 were as follows: Dollars Units Purchases Redemptions Net change Purchases Redemptions Net change Class R1 $ 199,765 $ (227,882) $ (28,117) 21,182 (24,359) (3,177)Class R2 3,249 — 3,249 272 — 272Class R3 41,006 — 41,006 4,101 — 4,101Class R4 30,225 (2,151) 28,074 3,025 (219) 2,806Class R5 243 (8) 235 20 (1) 19Class R6 291 (12) 279 23 (1) 22Class R7 4,923 (36,621) (31,698) 400 (3,054) (2,654)Class R8 230 (3,826) (3,596) 20 (320) (300)Class LifeStyle 7,001,686 (16,685,272) (9,683,586) — — — $ 7,281,618 $ (16,955,772) $ (9,674,154) 29,043 (27,954) 1,089
379

THE COLLECTIVE INVESTMENT FUNDS OF FIRST MERCANTILE TRUST COMPANY FMT Aggressive International Growth (WCM) Fund
Financial Highlights December 31, 2015
The accompanying notes are an integral part of these financial statements.
Change in Net Asset Value Resulting from Operations Ratios (to average net
assets)
NAV per Unit, Beginning of
Period
Net Investment
Income (Loss)(a)
Net Realized and Unrealized
Gain (Loss) from
Investments(a)
Total from Investment Activities
NAV per Unit, End of
Period Total
Return Expenses
Net Investment
Income (Loss)
Class R1 $ 8.8860 $ 0.0626 $ 0.4790 $ 0.5416 $ 9.4276 6.10% (1.11)% 0.67%Class R2 10.8714 0.0486 0.5872 0.6358 11.5072 5.85% (1.34)% 0.42%Class R3(b) 10.0000 0.0117 (0.0246) (0.0129) 9.9871 (0.13)% (1.49)% 0.23%Class R4(c) 10.0000 0.0064 (0.3999) (0.3935) 9.6065 (3.94)% (1.67)% 0.09%Class R5 12.1746 (0.0116) 0.6605 0.6489 12.8235 5.33% (1.87)% (0.09)%Class R6 12.2592 (0.0242) 0.6510 0.6268 12.8860 5.11% (2.04)% (0.19)%Class R7 11.8652 (0.0490) 0.6380 0.5890 12.4542 4.96% (2.18)% (0.40)%Class R8 11.6554 (0.0668) 0.6245 0.5577 12.2131 4.78% (2.36)% (0.55)%
(a) Per unit amounts are based on average daily units outstanding.
(b) For the period from June 30, 2015 (commencement of this class) through December 31,
2015.
(c) For the period from April 17, 2015 (commencement of this class) through December 31, 2015.
380

FMT Diversified International (Thomas White) Fund

THE COLLECTIVE INVESTMENT FUNDS OF FIRST MERCANTILE TRUST COMPANY FMT Diversified International (Thomas White) Fund
Statement of Assets and Liabilities December 31, 2015
The accompanying notes are an integral part of these financial statements.
Assets Investments in securities, at fair value $ 36,721,581 Cash equivalents, including foreign currencies of $1,086 493,073
Receivables Dividend tax reclaim 58,893Dividends and interest 32,093
Total assets 37,305,640 Liabilities Sub-advisor fees 20,761Trustee fees 4,467
Total liabilities 25,228 Net assets $ 37,280,412 Components of net assets
Units of
Participation NAV
per Unit Net
Assets Class R1 183,010 $ 11.8330 $ 2,165,553Class R2 148,245 $ 11.8949 1,763,366Class R3 25,033 $ 11.0930 277,695Class R4 163,756 $ 11.4707 1,878,403Class R5 29,293 $ 10.4470 306,021Class R6 77,917 $ 10.5588 822,709Class R7 1,288 $ 11.0620 14,249Class R8 5,190 $ 11.5317 59,853Class LifeStyle 29,992,563
$ 37,280,412
381

THE COLLECTIVE INVESTMENT FUNDS OF FIRST MERCANTILE TRUST COMPANY FMT Diversified International (Thomas White) Fund
Statement of Operations For the Year Ended December 31, 2015
The accompanying notes are an integral part of these financial statements.
Investment income
Dividends (net of foreign withholding taxes of $60,478) $ 1,221,528Interest 329
1,221,857 Expenses
Sub-advisor fees 312,563Trustee fees 278,991Custody fees 32,521Audit fees 6,024
630,099 Net investment income 591,758 Net realized loss from investments sold
Proceeds from sales of investments 38,533,534Cost of investments sold 41,300,423
Net realized loss from investments sold (2,766,889) Change in net unrealized appreciation (depreciation) on investments (2,485) Net realized and unrealized loss on investments (2,769,374) Other operating credits (charges) 161 Net decrease in net assets resulting from operations $ (2,177,455)
382

THE COLLECTIVE INVESTMENT FUNDS OF FIRST MERCANTILE TRUST COMPANY FMT Diversified International (Thomas White) Fund
Statement of Changes in Net Assets For the Year Ended December 31, 2015
The accompanying notes are an integral part of these financial statements.
Operations
Net investment income $ 591,758
Net realized loss from investments sold (2,766,889)
Change in net unrealized appreciation (depreciation) on investments (2,485)
Other operating credits (charges) 161
Net decrease in net assets resulting from operations (2,177,455) Participant transactions
Proceeds from units purchased 17,114,474Less payments for units redeemed 26,715,661
Decrease in net assets from participant transactions (9,601,187)
Total decrease in net assets (11,778,642) Net assets at beginning of year 49,059,054 Net assets at end of year $ 37,280,412
383

THE COLLECTIVE INVESTMENT FUNDS OF FIRST MERCANTILE TRUST COMPANY FMT Diversified International (Thomas White) Fund Schedule of Investments and Specific Fund Disclosures
December 31, 2015
The accompanying notes are an integral part of these financial statements.
Investments
Principal Amount or
Shares Fair Value ____________ ____________
Common stocks (89.5%)
Basic Materials (1.7%) Arkema S.A. 2,700 $ 189,365 Kansai Paint Co. Ltd. 18,900 289,923 Mondi Ltd. 7,200 142,976 __________ 622,264
Communications (6.1%) BT Group PLC 95,000 660,723 China Unicom Hong Kong Ltd. 162,000 197,724 Nippon Telegraph & Telephone Corp. 10,000 402,079 SK Telecom Co. Ltd. 1,000 183,787 SoftBank Group Corp. 9,100 464,476 Tencent Holdings Ltd. 18,200 358,562 __________ 2,267,351
Consumer, Cyclical (24.1%) Christian Dior SE 2,432 413,943 Cie Generale des Etablissements Michelin 3,638 347,233 CK Hutchison Holdings Ltd. 69,876 941,200 Continental AG 1,300 316,976 easyJet PLC 12,600 323,259 Haier Electronics Group Co. Ltd. 100,000 202,818 Honda Motor Co. Ltd. 12,900 419,364 International Consolidated Airlines Group S.A. 40,200 361,861 ITOCHU Corp. 44,500 533,519 Magna International, Inc. 11,000 446,121 Next PLC 1,750 188,103 Nissan Motor Co. Ltd. 38,400 408,504 Pandora A/S 7,800 989,626 Ryanair Holdings PLC 30,600 498,737 Sekisui House Ltd. 25,400 432,186 Steinhoff International Holdings N.V. 35,800 181,643 Sundrug Co. Ltd. 11,000 715,194 Taylor Wimpey PLC 70,800 212,018 Tofas Turk Otomobil Fabrikasi A/S 22,400 145,664 WH Smith PLC 35,524 926,573 __________ 9,004,542
Consumer, Non-cyclical (19.1%) Astellas Pharma, Inc. 26,800 385,817
384
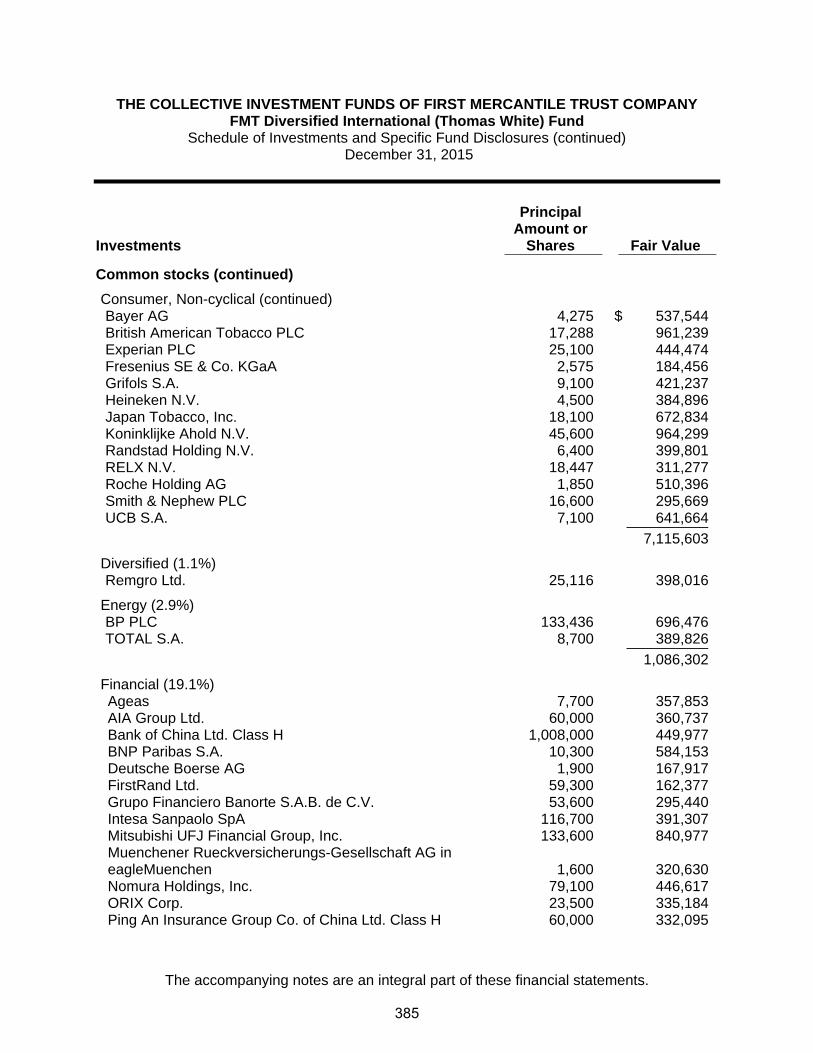
THE COLLECTIVE INVESTMENT FUNDS OF FIRST MERCANTILE TRUST COMPANY FMT Diversified International (Thomas White) Fund
Schedule of Investments and Specific Fund Disclosures (continued) December 31, 2015
The accompanying notes are an integral part of these financial statements.
Investments
Principal Amount or
Shares Fair Value ____________ ____________
Common stocks (continued)
Consumer, Non-cyclical (continued) Bayer AG 4,275 $ 537,544 British American Tobacco PLC 17,288 961,239 Experian PLC 25,100 444,474 Fresenius SE & Co. KGaA 2,575 184,456 Grifols S.A. 9,100 421,237 Heineken N.V. 4,500 384,896 Japan Tobacco, Inc. 18,100 672,834 Koninklijke Ahold N.V. 45,600 964,299 Randstad Holding N.V. 6,400 399,801 RELX N.V. 18,447 311,277 Roche Holding AG 1,850 510,396 Smith & Nephew PLC 16,600 295,669 UCB S.A. 7,100 641,664 __________ 7,115,603
Diversified (1.1%) Remgro Ltd. 25,116 398,016
Energy (2.9%) BP PLC 133,436 696,476 TOTAL S.A. 8,700 389,826 __________ 1,086,302
Financial (19.1%) Ageas 7,700 357,853 AIA Group Ltd. 60,000 360,737 Bank of China Ltd. Class H 1,008,000 449,977 BNP Paribas S.A. 10,300 584,153 Deutsche Boerse AG 1,900 167,917 FirstRand Ltd. 59,300 162,377 Grupo Financiero Banorte S.A.B. de C.V. 53,600 295,440 Intesa Sanpaolo SpA 116,700 391,307 Mitsubishi UFJ Financial Group, Inc. 133,600 840,977
Muenchener Rueckversicherungs-Gesellschaft AG in eagleMuenchen 1,600 320,630
Nomura Holdings, Inc. 79,100 446,617 ORIX Corp. 23,500 335,184 Ping An Insurance Group Co. of China Ltd. Class H 60,000 332,095
385
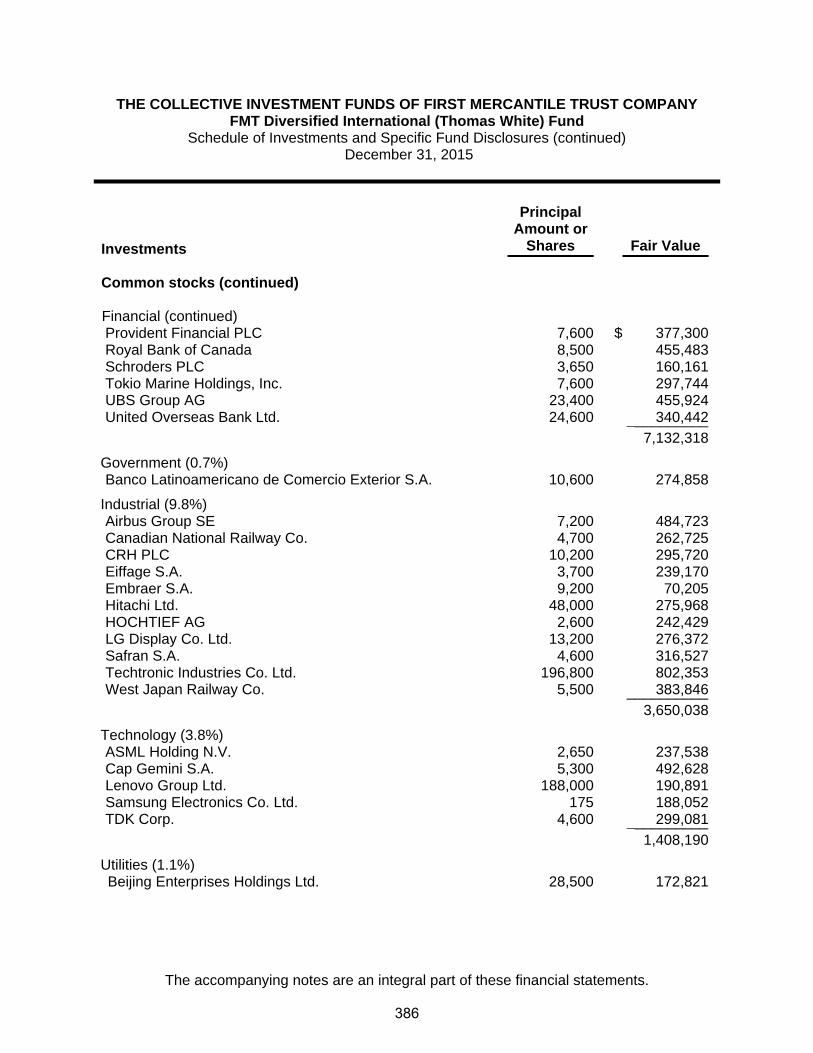
THE COLLECTIVE INVESTMENT FUNDS OF FIRST MERCANTILE TRUST COMPANY FMT Diversified International (Thomas White) Fund
Schedule of Investments and Specific Fund Disclosures (continued) December 31, 2015
The accompanying notes are an integral part of these financial statements.
Investments
Principal Amount or
Shares Fair Value
Common stocks (continued) Financial (continued)
Provident Financial PLC 7,600 $ 377,300 Royal Bank of Canada 8,500 455,483 Schroders PLC 3,650 160,161 Tokio Marine Holdings, Inc. 7,600 297,744 UBS Group AG 23,400 455,924 United Overseas Bank Ltd. 24,600 340,442 __________ 7,132,318
Government (0.7%) Banco Latinoamericano de Comercio Exterior S.A. 10,600 274,858
Industrial (9.8%) Airbus Group SE 7,200 484,723 Canadian National Railway Co. 4,700 262,725 CRH PLC 10,200 295,720 Eiffage S.A. 3,700 239,170 Embraer S.A. 9,200 70,205 Hitachi Ltd. 48,000 275,968 HOCHTIEF AG 2,600 242,429 LG Display Co. Ltd. 13,200 276,372 Safran S.A. 4,600 316,527 Techtronic Industries Co. Ltd. 196,800 802,353 West Japan Railway Co. 5,500 383,846 __________ 3,650,038
Technology (3.8%) ASML Holding N.V. 2,650 237,538 Cap Gemini S.A. 5,300 492,628 Lenovo Group Ltd. 188,000 190,891 Samsung Electronics Co. Ltd. 175 188,052 TDK Corp. 4,600 299,081 __________ 1,408,190
Utilities (1.1%) Beijing Enterprises Holdings Ltd. 28,500 172,821
386
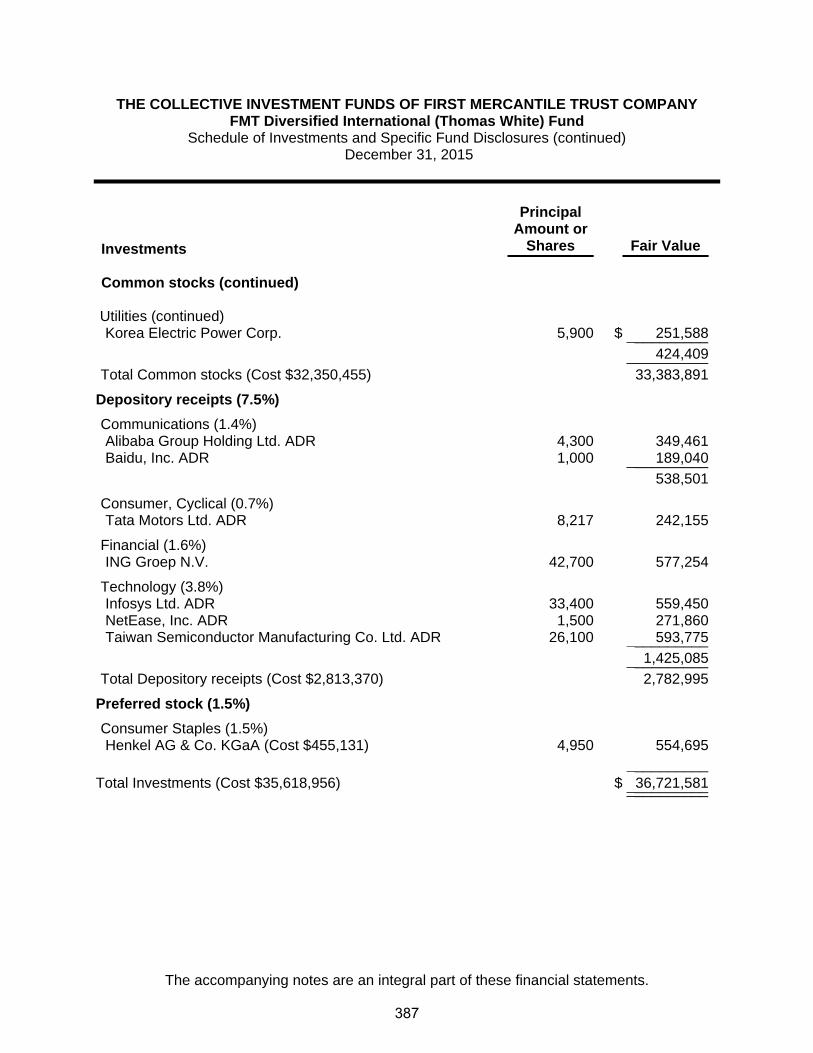
THE COLLECTIVE INVESTMENT FUNDS OF FIRST MERCANTILE TRUST COMPANY FMT Diversified International (Thomas White) Fund
Schedule of Investments and Specific Fund Disclosures (continued) December 31, 2015
The accompanying notes are an integral part of these financial statements.
Investments
Principal Amount or
Shares Fair Value
Common stocks (continued) Utilities (continued) Korea Electric Power Corp. 5,900 $ 251,588 __________ 424,409 __________ Total Common stocks (Cost $32,350,455) 33,383,891
Depository receipts (7.5%)
Communications (1.4%) Alibaba Group Holding Ltd. ADR 4,300 349,461 Baidu, Inc. ADR 1,000 189,040 __________ 538,501
Consumer, Cyclical (0.7%) Tata Motors Ltd. ADR 8,217 242,155
Financial (1.6%) ING Groep N.V. 42,700 577,254
Technology (3.8%) Infosys Ltd. ADR 33,400 559,450 NetEase, Inc. ADR 1,500 271,860 Taiwan Semiconductor Manufacturing Co. Ltd. ADR 26,100 593,775 __________ 1,425,085 __________ Total Depository receipts (Cost $2,813,370) 2,782,995
Preferred stock (1.5%)
Consumer Staples (1.5%) Henkel AG & Co. KGaA (Cost $455,131) 4,950 554,695 __________Total Investments (Cost $35,618,956) $ 36,721,581 ____________________
387

THE COLLECTIVE INVESTMENT FUNDS OF FIRST MERCANTILE TRUST COMPANY FMT Diversified International (Thomas White) Fund
Schedule of Investments and Specific Fund Disclosures (continued) December 31, 2015
The accompanying notes are an integral part of these financial statements.
Specific Fund Disclosures Fair value The inputs or methodology used for valuing securities may not be indicative of the risks associated with investing in those securities. For more information on valuation inputs, and their aggregation into the levels used in the table below, please refer to note 4 to the financial statements. The following table sets forth by level, within the fair value hierarchy, the Fund's investments measured at fair value.
Total Level 1 Level 2 Level 3
Common stocks $ 33,383,891 $ 33,383,891 $ — $ —Depository receipts 2,782,995 2,782,995 — —Preferred stock 554,695 554,695 — —__________ __________ __________ _________
$ 36,721,581 $ 36,721,581 $ — $ —__________ __________ __________ ___________________ __________ __________ _________ Investment transactions The aggregate cost of purchases of investment securities and proceeds from sales of investment securities (other than temporary cash investments) totaled $28,602,862 and $38,533,534, respectively, for the year ended December 31, 2015. Proceeds from sales of investments Proceeds from sales of investments as reported in the accompanying statement of operations is net of foreign currency losses of $47,522. Class-specific expenses Class-specific trustee fees for the year ended December 31, 2015 were as follows: Class R1 $ 30,701 Class R2 14,556 Class R3 3,734 Class R4 17,737 Class R5 8,349 Class R6 11,017 Class R7 295 Class R8 906 Class LifeStyle 191,696 $ 278,991
388

THE COLLECTIVE INVESTMENT FUNDS OF FIRST MERCANTILE TRUST COMPANY FMT Diversified International (Thomas White) Fund
Schedule of Participant Transactions December 31, 2015
The accompanying notes are an integral part of these financial statements.
Participant transactions by class for the year ended December 31, 2015 were as follows: Dollars Units Purchases Redemptions Net change Purchases Redemptions Net change Class R1 $ 1,141,101 $ (10,045,193) $ (8,904,092) 90,895 (866,578) (775,683)Class R2 1,420,854 (1,426,108) (5,254) 111,995 (117,407) (5,412)Class R3 131,468 (1,271,169) (1,139,701) 11,564 (107,284) (95,720)Class R4 435,769 (568,882) (133,113) 36,102 (46,803) (10,701)Class R5 85,936 (776,384) (690,448) 7,838 (70,002) (62,164)Class R6 147,670 (135,610) 12,060 13,536 (12,553) 983Class R7 1,256 (57,297) (56,041) 108 (4,869) (4,761)Class R8 11,258 (21,089) (9,831) 951 (1,721) (770)Class LifeStyle 13,739,162 (12,413,929) 1,325,233 — — — $ 17,114,474 $ (26,715,661) $ (9,601,187) 272,989 (1,227,217) (954,228)
389

THE COLLECTIVE INVESTMENT FUNDS OF FIRST MERCANTILE TRUST COMPANY FMT Diversified International (Thomas White) Fund
Financial Highlights December 31, 2015
The accompanying notes are an integral part of these financial statements.
Change in Net Asset Value Resulting from Operations Ratios (to average net
assets)
NAV per Unit, Beginning of
Period
Net Investment
Income (Loss)(a)
Net Realized and Unrealized
Gain (Loss) from
Investments(a)
Total from Investment Activities
NAV per Unit, End of
Period Total
Return Expenses
Net Investment
Income (Loss)
Class R1 $ 12.2088 $ 0.1757 $ (0.5515) $ (0.3758) $ 11.8330 (3.08)% (1.08)% 1.58%Class R2 12.3000 0.1495 (0.5546) (0.4051) 11.8949 (3.29)% (1.30)% 1.26%Class R3 11.4900 0.1213 (0.5183) (0.3970) 11.0930 (3.46)% (1.47)% 1.12%Class R4 11.9018 0.1022 (0.5333) (0.4311) 11.4707 (3.62)% (1.64)% 0.85%Class R5 10.8583 0.0794 (0.4907) (0.4113) 10.4470 (3.79)% (1.81)% 0.76%Class R6 10.9931 0.0569 (0.4912) (0.4343) 10.5588 (3.95)% (1.98)% 0.52%Class R7 11.5366 0.0442 (0.5188) (0.4746) 11.0620 (4.11)% (2.15)% 0.40%Class R8 12.0469 0.0181 (0.5333) (0.5152) 11.5317 (4.28)% (2.30)% 0.15%
(a) Per unit amounts are based on average daily units outstanding.
390

FMT Equity Income (Sterling) Fund

THE COLLECTIVE INVESTMENT FUNDS OF FIRST MERCANTILE TRUST COMPANY FMT Equity Income (Sterling) Fund
Statement of Assets and Liabilities December 31, 2015
The accompanying notes are an integral part of these financial statements.
Assets Investments in securities, at fair value $ 1,509,287 Cash equivalents 202,208Receivables
Investments sold 10,429 Dividends and interest 2,938
Total assets 1,724,862 Liabilities Investments purchased 22,481Sub-advisor fees 945Trustee fees 662
Total liabilities 24,088 Net assets $ 1,700,774 Components of net assets
Units of
Participation NAV
per Unit Net
Assets Class R1 136,127 $ 12.4941 $ 1,700,774
391

THE COLLECTIVE INVESTMENT FUNDS OF FIRST MERCANTILE TRUST COMPANY FMT Equity Income (Sterling) Fund
Statement of Operations For the Year Ended December 31, 2015
The accompanying notes are an integral part of these financial statements.
Investment income
Dividends $ 73,633 Expenses
Sub-advisor fees 11,969Custody fees 10,011Trustee fees 8,378Audit fees 5,400
35,758 Net investment income 37,875 Net realized gain from investments sold
Proceeds from sales of investments 1,515,082Cost of investments sold 1,354,906
Net realized gain from investments sold 160,176 Change in net unrealized appreciation (depreciation) on investments (299,059) Net realized and unrealized loss on investments (138,883) Net decrease in net assets resulting from operations $ (101,008)
392

THE COLLECTIVE INVESTMENT FUNDS OF FIRST MERCANTILE TRUST COMPANY FMT Equity Income (Sterling) Fund Statement of Changes in Net Assets
For the Year Ended December 31, 2015
The accompanying notes are an integral part of these financial statements.
Operations
Net investment income $ 37,875
Net realized gain from investments sold 160,176
Change in net unrealized appreciation (depreciation) on investments (299,059)
Net decrease in net assets resulting from operations (101,008) Participant transactions
Proceeds from units purchased 213,479Less payments for units redeemed 1,001,149
Decrease in net assets from participant transactions (787,670)
Total decrease in net assets (888,678) Net assets at beginning of year 2,589,452 Net assets at end of year $ 1,700,774
393
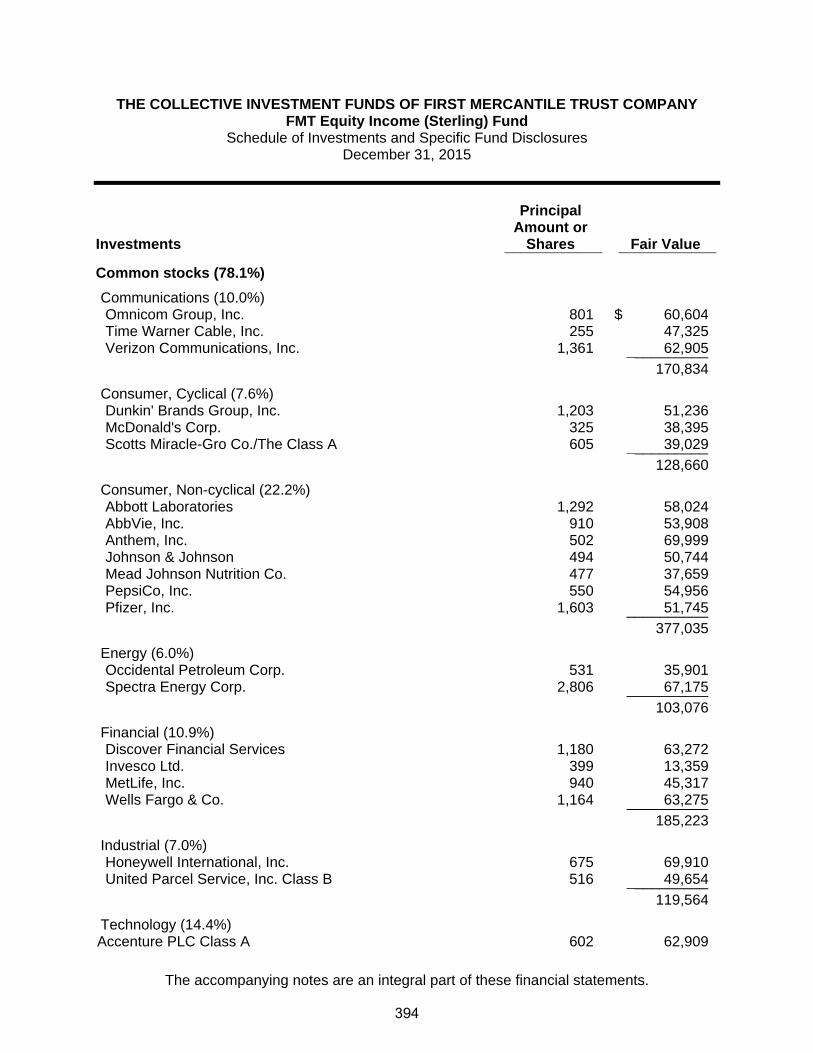
THE COLLECTIVE INVESTMENT FUNDS OF FIRST MERCANTILE TRUST COMPANY FMT Equity Income (Sterling) Fund
Schedule of Investments and Specific Fund Disclosures December 31, 2015
The accompanying notes are an integral part of these financial statements.
Investments
Principal Amount or
Shares Fair Value ____________ ____________
Common stocks (78.1%)
Communications (10.0%) Omnicom Group, Inc. 801 $ 60,604 Time Warner Cable, Inc. 255 47,325 Verizon Communications, Inc. 1,361 62,905 __________ 170,834
Consumer, Cyclical (7.6%) Dunkin' Brands Group, Inc. 1,203 51,236 McDonald's Corp. 325 38,395 Scotts Miracle-Gro Co./The Class A 605 39,029 __________ 128,660
Consumer, Non-cyclical (22.2%) Abbott Laboratories 1,292 58,024 AbbVie, Inc. 910 53,908 Anthem, Inc. 502 69,999 Johnson & Johnson 494 50,744 Mead Johnson Nutrition Co. 477 37,659 PepsiCo, Inc. 550 54,956 Pfizer, Inc. 1,603 51,745 __________ 377,035
Energy (6.0%) Occidental Petroleum Corp. 531 35,901 Spectra Energy Corp. 2,806 67,175 __________ 103,076
Financial (10.9%) Discover Financial Services 1,180 63,272 Invesco Ltd. 399 13,359 MetLife, Inc. 940 45,317 Wells Fargo & Co. 1,164 63,275 __________ 185,223
Industrial (7.0%) Honeywell International, Inc. 675 69,910 United Parcel Service, Inc. Class B 516 49,654 __________ 119,564
Technology (14.4%) Accenture PLC Class A 602 62,909
394

THE COLLECTIVE INVESTMENT FUNDS OF FIRST MERCANTILE TRUST COMPANY FMT Equity Income (Sterling) Fund
Schedule of Investments and Specific Fund Disclosures (continued) December 31, 2015
The accompanying notes are an integral part of these financial statements.
Investments
Principal Amount or
Shares Fair Value
Common stocks (continued) Technology (continued) Maxim Integrated Products, Inc. 1,169 $ 44,422 Microsoft Corp. 631 35,008 QUALCOMM, Inc. 1,328 66,380 Western Digital Corp. 597 35,850 __________ 244,569 __________ Total Common stocks (Cost $1,098,400) 1,328,961
Depository receipts (7.6%)
Consumer, Non-cyclical (7.6%) Novartis AG ADR 739 63,584 Unilever PLC ADR 1,527 65,844 __________ Total Depository receipts (Cost $86,375) 129,428
Real estate investment trust (3.0%) Host Hotels & Resorts, Inc. (Cost $66,189) 3,318 50,898 __________Total Investments (Cost $1,250,964) $ 1,509,287 ____________________
395
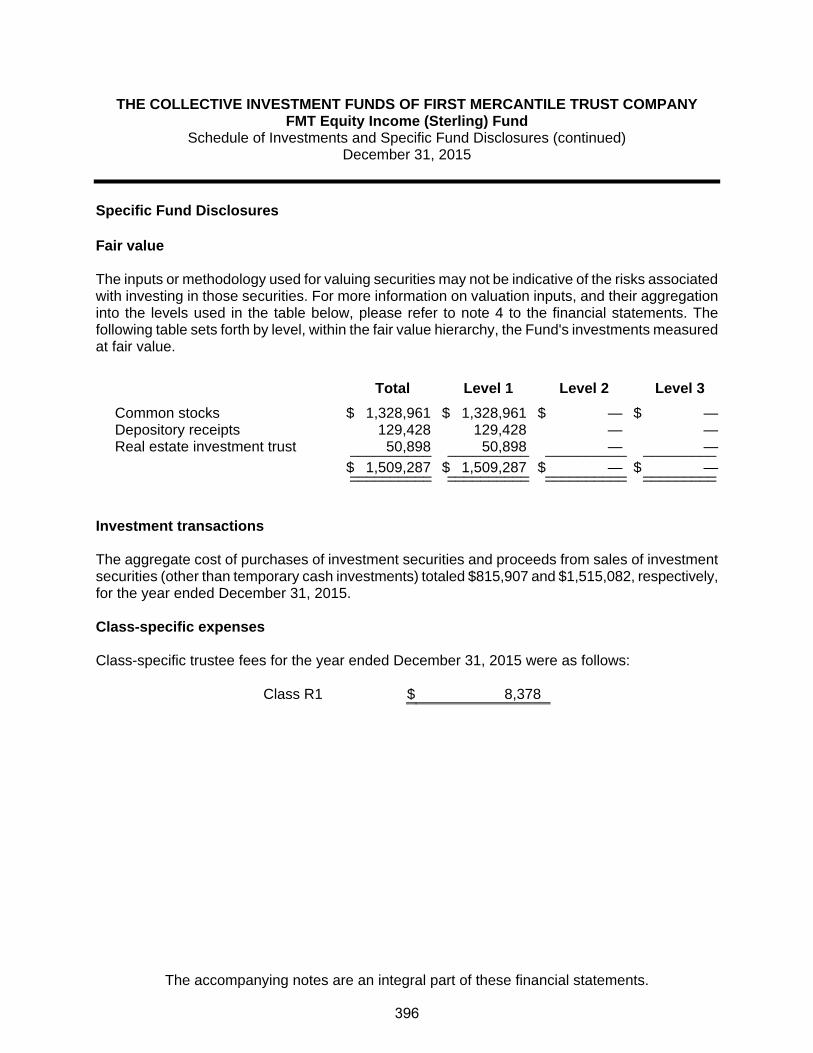
THE COLLECTIVE INVESTMENT FUNDS OF FIRST MERCANTILE TRUST COMPANY FMT Equity Income (Sterling) Fund
Schedule of Investments and Specific Fund Disclosures (continued) December 31, 2015
The accompanying notes are an integral part of these financial statements.
Specific Fund Disclosures Fair value The inputs or methodology used for valuing securities may not be indicative of the risks associated with investing in those securities. For more information on valuation inputs, and their aggregation into the levels used in the table below, please refer to note 4 to the financial statements. The following table sets forth by level, within the fair value hierarchy, the Fund's investments measured at fair value.
Total Level 1 Level 2 Level 3
Common stocks $ 1,328,961 $ 1,328,961 $ — $ —Depository receipts 129,428 129,428 — —Real estate investment trust 50,898 50,898 — —__________ __________ __________ _________
$ 1,509,287 $ 1,509,287 $ — $ —__________ __________ __________ ___________________ __________ __________ _________ Investment transactions The aggregate cost of purchases of investment securities and proceeds from sales of investment securities (other than temporary cash investments) totaled $815,907 and $1,515,082, respectively, for the year ended December 31, 2015. Class-specific expenses Class-specific trustee fees for the year ended December 31, 2015 were as follows: Class R1 $ 8,378
396

THE COLLECTIVE INVESTMENT FUNDS OF FIRST MERCANTILE TRUST COMPANY FMT Equity Income (Sterling) Fund Schedule of Participant Transactions
December 31, 2015
The accompanying notes are an integral part of these financial statements.
Participant transactions by class for the year ended December 31, 2015 were as follows: Dollars Units Purchases Redemptions Net change Purchases Redemptions Net change Class R1 $ 213,479 $ (1,001,149) $ (787,670) 16,228 (78,245) (62,017)
397

THE COLLECTIVE INVESTMENT FUNDS OF FIRST MERCANTILE TRUST COMPANY FMT Equity Income (Sterling) Fund
Financial Highlights December 31, 2015
The accompanying notes are an integral part of these financial statements.
Change in Net Asset Value Resulting from Operations Ratios (to average net
assets)
NAV per Unit, Beginning of
Period
Net Investment
Income (Loss)(a)
Net Realized and Unrealized
Gain (Loss) from
Investments(a)
Total from Investment Activities
NAV per Unit, End of
Period Total
Return Expenses
Net Investment
Income (Loss)
Class R1 $ 13.0685 $ 0.2078 $ (0.7822) $ (0.5744) $ 12.4941 (4.40)% (1.49)% 1.58%
(a) Per unit amounts are based on average daily units outstanding.
398
FMT Global Diversified Equity Fund

THE COLLECTIVE INVESTMENT FUNDS OF FIRST MERCANTILE TRUST COMPANY FMT Global Diversified Equity Fund
Statement of Assets and Liabilities December 31, 2015
The accompanying notes are an integral part of these financial statements.
Assets Investments in securities, at fair value $ 6,958,185 Liabilities Trustee fees 3,906 Net assets $ 6,954,279 Components of net assets
Units of
Participation NAV
per Unit Net
Assets Class R1 LifeStyle 4,346 $ 932.8271 $ 4,054,279Class R2 LifeStyle 1,105 $ 2.3069 2,550Class R3 LifeStyle 53,443 $ 13.4474 718,675Class R4 LifeStyle 45,475 $ 13.0367 592,839Class R5 LifeStyle 30,336 $ 13.5434 410,856Class R6 LifeStyle 40,225 $ 12.5725 505,727Class R7 LifeStyle 21,457 $ 13.7960 296,022Class R8 LifeStyle 28,075 $ 13.2978 373,331
$ 6,954,279
399

THE COLLECTIVE INVESTMENT FUNDS OF FIRST MERCANTILE TRUST COMPANY FMT Global Diversified Equity Fund
Statement of Operations For the Year Ended December 31, 2015
The accompanying notes are an integral part of these financial statements.
Expenses
Trustee fees $ 7,771Audit fees 150
7,921 Net investment loss (7,921) Net realized loss from investments sold
Proceeds from sales of investments 2,325,261Cost of investments sold 2,563,834
Net realized loss from investments sold (238,573) Change in net unrealized appreciation (depreciation) on investments 84,092 Net realized and unrealized loss on investments (154,481) Net decrease in net assets resulting from operations $ (162,402)
400

THE COLLECTIVE INVESTMENT FUNDS OF FIRST MERCANTILE TRUST COMPANY FMT Global Diversified Equity Fund Statement of Changes in Net Assets
For the Year Ended December 31, 2015
The accompanying notes are an integral part of these financial statements.
Operations
Net investment loss $ (7,921)
Net realized loss from investments sold (238,573)
Change in net unrealized appreciation (depreciation) on investments 84,092
Net decrease in net assets resulting from operations (162,402) Participant transactions
Proceeds from units purchased 1,517,477Less payments for units redeemed 2,347,169
Decrease in net assets from participant transactions (829,692)
Total decrease in net assets (992,094) Net assets at beginning of year 7,946,373 Net assets at end of year $ 6,954,279
401

THE COLLECTIVE INVESTMENT FUNDS OF FIRST MERCANTILE TRUST COMPANY FMT Global Diversified Equity Fund
Schedule of Investments and Specific Fund Disclosures December 31, 2015
The accompanying notes are an integral part of these financial statements.
Investments Cost Fair Value ____________ ____________
Collective trust funds (100.1%)
Emerging Markets (4.1%) FMT/DFA Emerging Markets Value Fund $ 409,311 $ 287,377
Foreign Large Blend Equity (14.7%) FMT Diversified International (Thomas White) Fund 1,278,078 1,022,976
International Core Equity (7.1%) FMT/International Equity Index Fund 613,660 490,353
International Growth Equity (18.1%) FMT Aggressive International Growth (WCM) Fund 1,277,891 1,107,516 FMT U.S. Growth Opportunities (Zevenbergen) Fund 170,388 151,065 __________ __________ 1,448,279 1,258,581
International Value Equity (17.2%)
FMT International Value Opportunities (Tradewinds) Fund 1,022,451 823,382
FMT/Dodge and Cox International Fund 511,605 371,114 __________ __________ 1,534,056 1,194,496
Large Cap Core Equity (3.8%) FMT Large Cap Opportunities (Smith Group) Fund 309,319 265,298
Large Cap Core/Blend Equity (5.9%) FMT Large Cap Concentrated Equity (Cornerstone) Fund 515,723 407,203
Large Cap Growth Equity (8.0%) FMT Large Cap Focus Growth (Jackson Square) Fund 206,204 182,298 FMT Large Cap Fundamental Growth (Wellington) Fund 412,358 372,500 __________ __________ 618,562 554,798
Large Cap Value Equity (7.5%) FMT Large Cap Classic Value (C.S. McKee) Fund 206,266 168,410 FMT Large Cap Intrinsic Value (MetWest) Fund 412,456 351,219 __________ __________ 618,722 519,629
Mid Cap Growth Equity (1.2%)
FMT Mid Cap Growth (Disciplined Growth Investors) Fund 104,827 83,742
Mid Cap Value Equity (2.1%) FMT Mid Cap Value (NewSouth) Fund 124,428 103,496 FMT/American Century Mid Cap Value Fund 47,719 39,888 __________ __________ 172,147 143,384
402

THE COLLECTIVE INVESTMENT FUNDS OF FIRST MERCANTILE TRUST COMPANY FMT Global Diversified Equity Fund
Schedule of Investments and Specific Fund Disclosures (continued) December 31, 2015
The accompanying notes are an integral part of these financial statements.
Investments Cost Fair Value
Collective trust funds (continued) Small Cap Core Equity (0.8%) FMT Small Cap Diversified Equity (Delaware) Fund $ 69,887 $ 57,520
Small Cap Growth Equity (2.0%) FMT Small Cap Aggressive Growth (CCI/Cupps) Fund 181,539 142,305
Small Cap Value Equity (2.7%) FMT Small Cap Intrinsic Value (MetWest) Fund 167,911 133,176 FMT Small Cap Value (Opus) Fund 69,888 57,026 __________ __________ 237,799 190,202
SMID Cap Growth - Equity (2.8%) FMT SMID Diversified Growth (Frontier/Geneva) Fund 235,204 194,575
SMID Cap Value - Equity (2.1%) FMT SMID Value (Fisher Investments) Fund 174,684 145,746 __________ __________ Total Investments $ 8,521,797 $ 6,958,185 __________ ____________________ __________
403

THE COLLECTIVE INVESTMENT FUNDS OF FIRST MERCANTILE TRUST COMPANY FMT Global Diversified Equity Fund
Schedule of Investments and Specific Fund Disclosures (continued) December 31, 2015
The accompanying notes are an integral part of these financial statements.
Specific Fund Disclosures Fair value The inputs or methodology used for valuing securities may not be indicative of the risks associated with investing in those securities. For more information on valuation inputs, and their aggregation into the levels used in the table below, please refer to note 4 to the financial statements. The following table sets forth by level, within the fair value hierarchy, the Fund's investments measured at fair value.
Total Level 1 Level 2 Level 3
Collective trust funds Emerging Markets $ 287,377 $ — $ 287,377 $ —Foreign Large Blend Equity 1,022,976 — 1,022,976 —International Core Equity 490,353 — 490,353 —International Growth Equity 1,258,581 — 1,258,581 —International Value Equity 1,194,496 — 1,194,496 —Large Cap Core Equity 265,298 — 265,298 —Large Cap Core/Blend Equity 407,203 — 407,203 —Large Cap Growth Equity 554,798 — 554,798 —Large Cap Value Equity 519,629 — 519,629 —Mid Cap Growth Equity 83,742 — 83,742 —Mid Cap Value Equity 143,384 — 143,384 —Small Cap Core Equity 57,520 — 57,520 —Small Cap Growth Equity 142,305 — 142,305 —Small Cap Value Equity 190,202 — 190,202 —SMID Cap Growth - Equity 194,575 — 194,575 —SMID Cap Value - Equity 145,746 — 145,746 —__________ __________ __________ _________
$ 6,958,185 $ — $ 6,958,185 $ —__________ __________ __________ ___________________ __________ __________ _________ The estimated fair value of the underlying collective trust funds is net asset value. The use of net asset value as fair value is deemed appropriate as the collective trust funds do not have a finite life, no unfunded commitments relating to this type of investment, or no significant restrictions on redemptions.
404

THE COLLECTIVE INVESTMENT FUNDS OF FIRST MERCANTILE TRUST COMPANY FMT Global Diversified Equity Fund
Schedule of Investments and Specific Fund Disclosures (continued) December 31, 2015
The accompanying notes are an integral part of these financial statements.
Investment transactions The aggregate cost of purchases of investment securities and proceeds from sales of investment securities (other than temporary cash investments) totaled $1,491,555 and $2,325,261, respectively, for the year ended December 31, 2015. Class-specific expenses Class-specific trustee fees for the year ended December 31, 2015 were as follows: Class R1 LifeStyle $ 2,714 Class R2 LifeStyle 3 Class R3 LifeStyle 883 Class R4 LifeStyle 877 Class R5 LifeStyle 710 Class R6 LifeStyle 996 Class R7 LifeStyle 659 Class R8 LifeStyle 929 $ 7,771
405

THE COLLECTIVE INVESTMENT FUNDS OF FIRST MERCANTILE TRUST COMPANY FMT Global Diversified Equity Fund Schedule of Participant Transactions
December 31, 2015
The accompanying notes are an integral part of these financial statements.
Participant transactions by class for the year ended December 31, 2015 were as follows: Dollars Units Purchases Redemptions Net change Purchases Redemptions Net change Class R1 LifeStyle $ 831,645 $ (1,542,291) $ (710,646) 841 (1,605) (764)Class R2 LifeStyle 1,966 — 1,966 843 — 843Class R3 LifeStyle 90,954 (27,775) 63,179 6,515 (1,919) 4,596Class R4 LifeStyle 236,601 (524,291) (287,690) 17,259 (37,377) (20,118)Class R5 LifeStyle 192,666 (138,403) 54,263 13,612 (9,448) 4,164Class R6 LifeStyle 74,678 (15,578) 59,100 5,684 (1,169) 4,515Class R7 LifeStyle 54,263 (92,736) (38,473) 3,717 (6,378) (2,661)Class R8 LifeStyle 34,704 (6,095) 28,609 2,510 (444) 2,066 $ 1,517,477 $ (2,347,169) $ (829,692) 50,981 (58,340) (7,359)
406
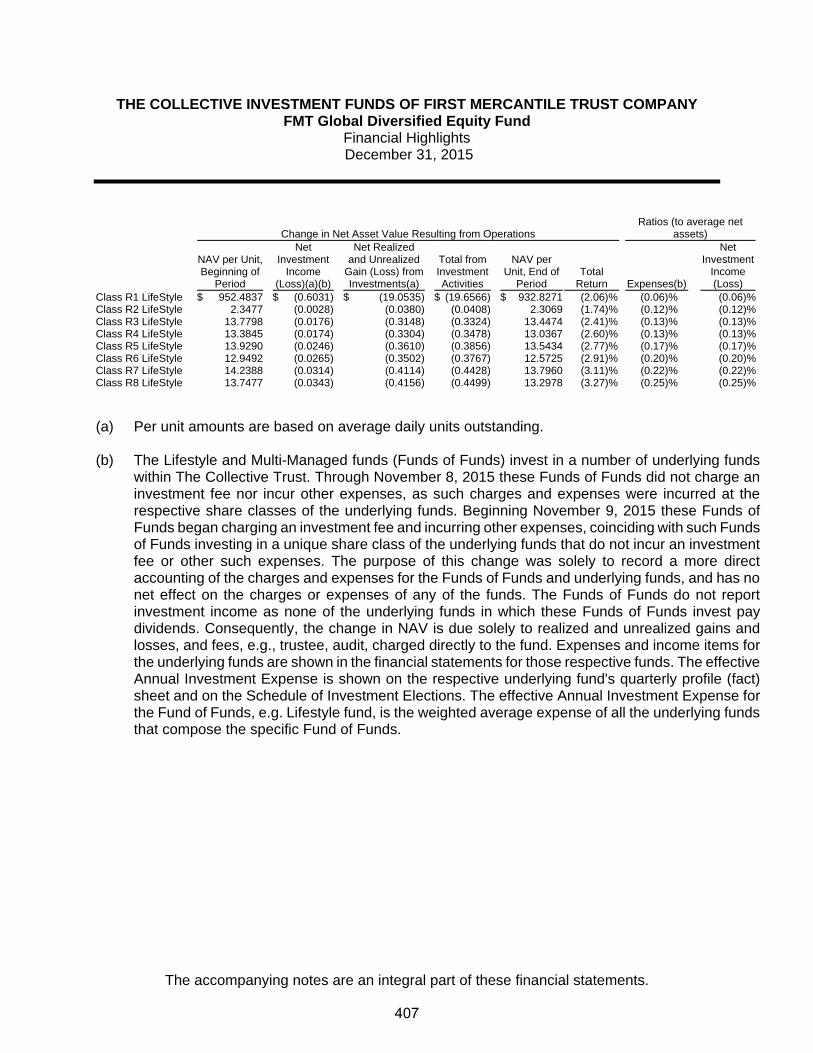
THE COLLECTIVE INVESTMENT FUNDS OF FIRST MERCANTILE TRUST COMPANY FMT Global Diversified Equity Fund
Financial Highlights December 31, 2015
The accompanying notes are an integral part of these financial statements.
Change in Net Asset Value Resulting from Operations Ratios (to average net
assets)
NAV per Unit, Beginning of
Period
Net Investment
Income (Loss)(a)(b)
Net Realized and Unrealized
Gain (Loss) from Investments(a)
Total from Investment Activities
NAV per Unit, End of
Period Total
Return Expenses(b)
Net Investment
Income (Loss)
Class R1 LifeStyle $ 952.4837 $ (0.6031) $ (19.0535) $ (19.6566) $ 932.8271 (2.06)% (0.06)% (0.06)%Class R2 LifeStyle 2.3477 (0.0028) (0.0380) (0.0408) 2.3069 (1.74)% (0.12)% (0.12)%Class R3 LifeStyle 13.7798 (0.0176) (0.3148) (0.3324) 13.4474 (2.41)% (0.13)% (0.13)%Class R4 LifeStyle 13.3845 (0.0174) (0.3304) (0.3478) 13.0367 (2.60)% (0.13)% (0.13)%Class R5 LifeStyle 13.9290 (0.0246) (0.3610) (0.3856) 13.5434 (2.77)% (0.17)% (0.17)%Class R6 LifeStyle 12.9492 (0.0265) (0.3502) (0.3767) 12.5725 (2.91)% (0.20)% (0.20)%Class R7 LifeStyle 14.2388 (0.0314) (0.4114) (0.4428) 13.7960 (3.11)% (0.22)% (0.22)%Class R8 LifeStyle 13.7477 (0.0343) (0.4156) (0.4499) 13.2978 (3.27)% (0.25)% (0.25)%
(a) Per unit amounts are based on average daily units outstanding.
(b) The Lifestyle and Multi-Managed funds (Funds of Funds) invest in a number of underlying funds
within The Collective Trust. Through November 8, 2015 these Funds of Funds did not charge an investment fee nor incur other expenses, as such charges and expenses were incurred at the respective share classes of the underlying funds. Beginning November 9, 2015 these Funds of Funds began charging an investment fee and incurring other expenses, coinciding with such Funds of Funds investing in a unique share class of the underlying funds that do not incur an investment fee or other such expenses. The purpose of this change was solely to record a more direct accounting of the charges and expenses for the Funds of Funds and underlying funds, and has no net effect on the charges or expenses of any of the funds. The Funds of Funds do not report investment income as none of the underlying funds in which these Funds of Funds invest pay dividends. Consequently, the change in NAV is due solely to realized and unrealized gains and losses, and fees, e.g., trustee, audit, charged directly to the fund. Expenses and income items for the underlying funds are shown in the financial statements for those respective funds. The effective Annual Investment Expense is shown on the respective underlying fund's quarterly profile (fact) sheet and on the Schedule of Investment Elections. The effective Annual Investment Expense for the Fund of Funds, e.g. Lifestyle fund, is the weighted average expense of all the underlying funds that compose the specific Fund of Funds.
407
FMT International Growth (WCM) Fund
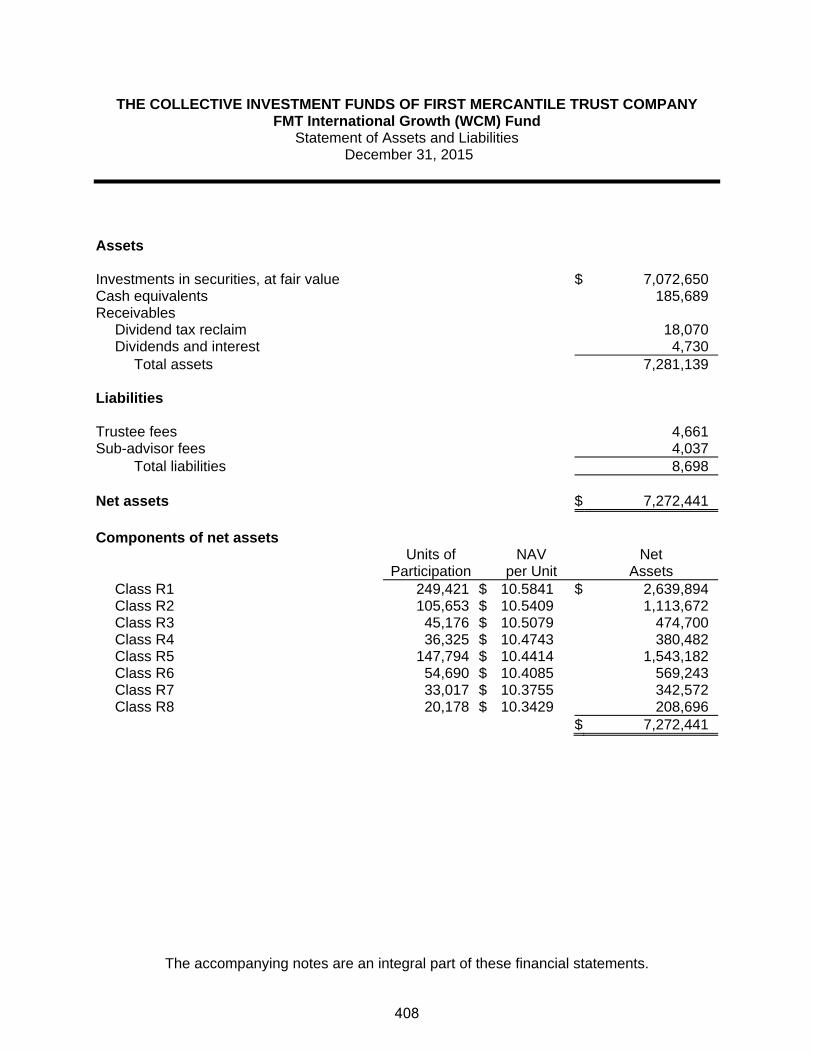
THE COLLECTIVE INVESTMENT FUNDS OF FIRST MERCANTILE TRUST COMPANY FMT International Growth (WCM) Fund
Statement of Assets and Liabilities December 31, 2015
The accompanying notes are an integral part of these financial statements.
Assets Investments in securities, at fair value $ 7,072,650 Cash equivalents 185,689Receivables
Dividend tax reclaim 18,070Dividends and interest 4,730
Total assets 7,281,139 Liabilities Trustee fees 4,661Sub-advisor fees 4,037
Total liabilities 8,698 Net assets $ 7,272,441 Components of net assets
Units of
Participation NAV
per Unit Net
Assets Class R1 249,421 $ 10.5841 $ 2,639,894Class R2 105,653 $ 10.5409 1,113,672Class R3 45,176 $ 10.5079 474,700Class R4 36,325 $ 10.4743 380,482Class R5 147,794 $ 10.4414 1,543,182Class R6 54,690 $ 10.4085 569,243Class R7 33,017 $ 10.3755 342,572Class R8 20,178 $ 10.3429 208,696
$ 7,272,441
408
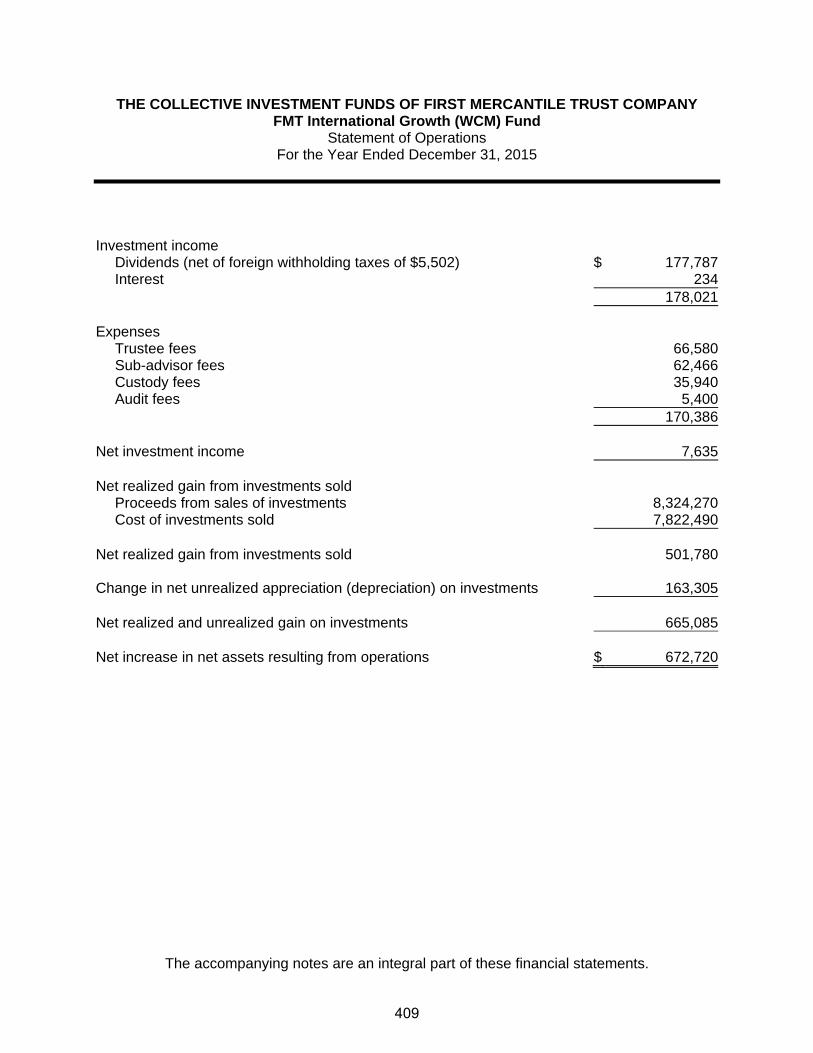
THE COLLECTIVE INVESTMENT FUNDS OF FIRST MERCANTILE TRUST COMPANY FMT International Growth (WCM) Fund
Statement of Operations For the Year Ended December 31, 2015
The accompanying notes are an integral part of these financial statements.
Investment income
Dividends (net of foreign withholding taxes of $5,502) $ 177,787Interest 234
178,021 Expenses
Trustee fees 66,580Sub-advisor fees 62,466Custody fees 35,940Audit fees 5,400
170,386 Net investment income 7,635 Net realized gain from investments sold
Proceeds from sales of investments 8,324,270Cost of investments sold 7,822,490
Net realized gain from investments sold 501,780 Change in net unrealized appreciation (depreciation) on investments 163,305 Net realized and unrealized gain on investments 665,085 Net increase in net assets resulting from operations $ 672,720
409
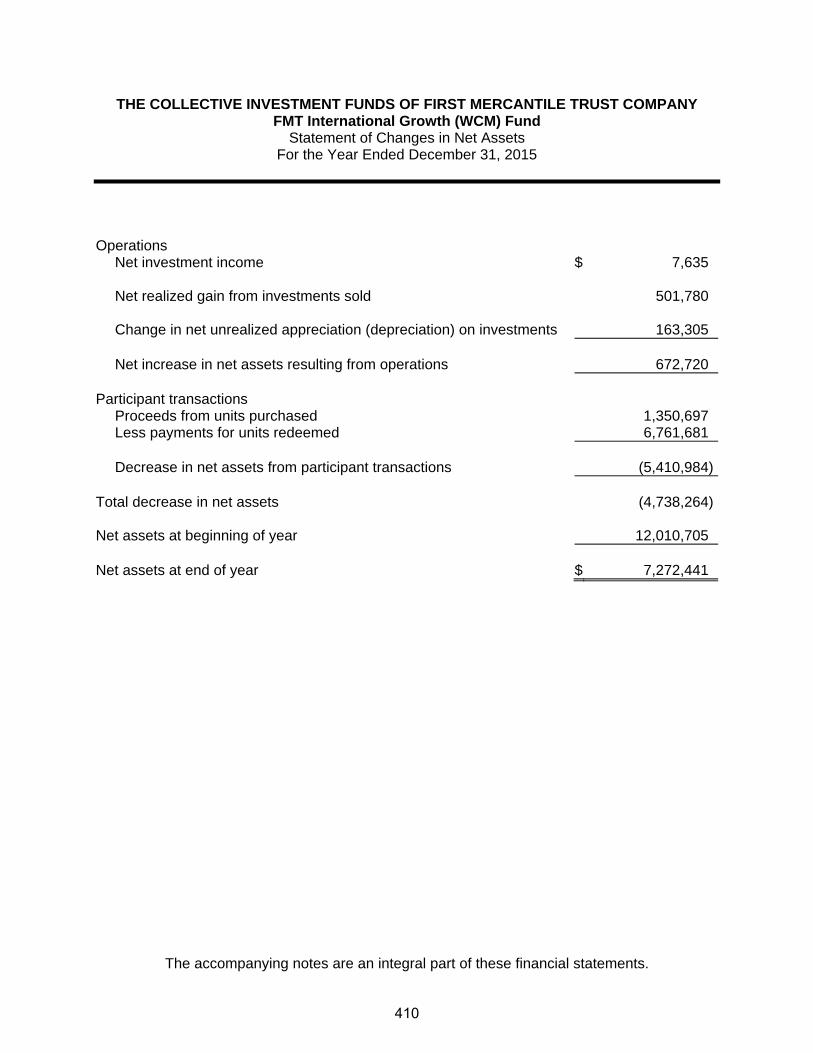
THE COLLECTIVE INVESTMENT FUNDS OF FIRST MERCANTILE TRUST COMPANY FMT International Growth (WCM) Fund
Statement of Changes in Net Assets For the Year Ended December 31, 2015
The accompanying notes are an integral part of these financial statements.
Operations
Net investment income $ 7,635
Net realized gain from investments sold 501,780
Change in net unrealized appreciation (depreciation) on investments 163,305
Net increase in net assets resulting from operations 672,720 Participant transactions
Proceeds from units purchased 1,350,697Less payments for units redeemed 6,761,681
Decrease in net assets from participant transactions (5,410,984)
Total decrease in net assets (4,738,264) Net assets at beginning of year 12,010,705 Net assets at end of year $ 7,272,441
410
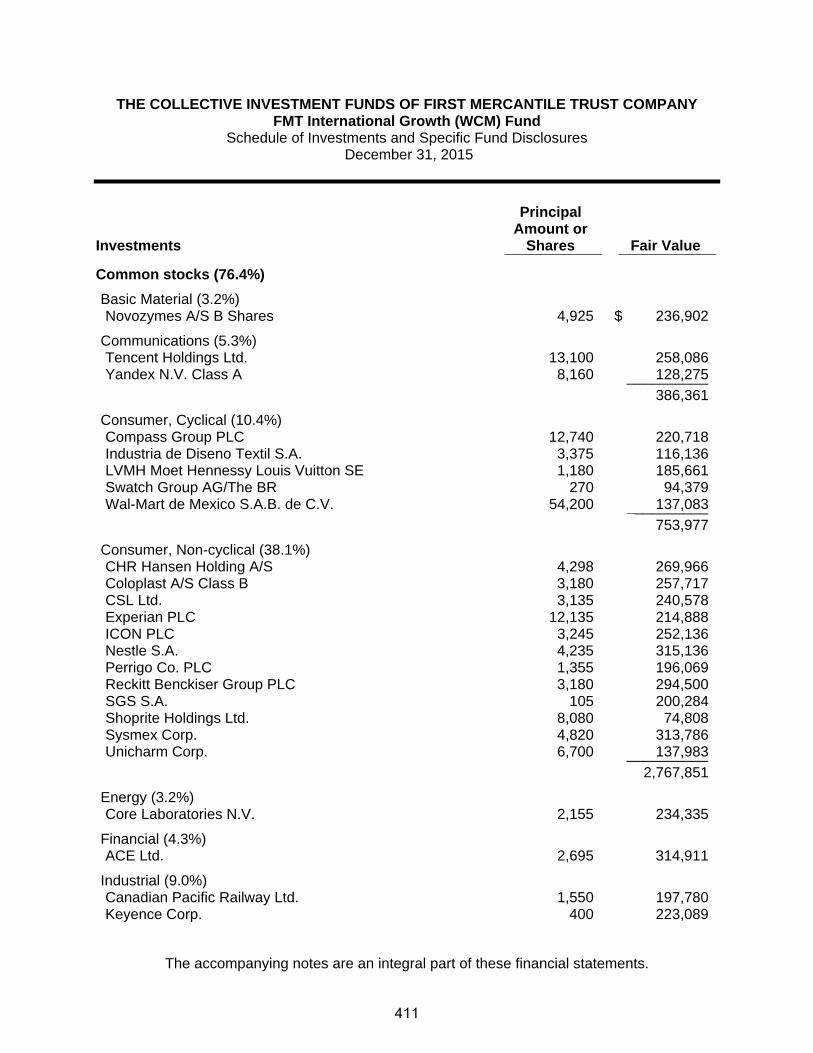
THE COLLECTIVE INVESTMENT FUNDS OF FIRST MERCANTILE TRUST COMPANY FMT International Growth (WCM) Fund
Schedule of Investments and Specific Fund Disclosures December 31, 2015
The accompanying notes are an integral part of these financial statements.
Investments
Principal Amount or
Shares Fair Value ____________ ____________
Common stocks (76.4%)
Basic Material (3.2%) Novozymes A/S B Shares 4,925 $ 236,902
Communications (5.3%) Tencent Holdings Ltd. 13,100 258,086 Yandex N.V. Class A 8,160 128,275 __________ 386,361
Consumer, Cyclical (10.4%) Compass Group PLC 12,740 220,718 Industria de Diseno Textil S.A. 3,375 116,136 LVMH Moet Hennessy Louis Vuitton SE 1,180 185,661 Swatch Group AG/The BR 270 94,379 Wal-Mart de Mexico S.A.B. de C.V. 54,200 137,083 __________ 753,977
Consumer, Non-cyclical (38.1%) CHR Hansen Holding A/S 4,298 269,966 Coloplast A/S Class B 3,180 257,717 CSL Ltd. 3,135 240,578 Experian PLC 12,135 214,888 ICON PLC 3,245 252,136 Nestle S.A. 4,235 315,136 Perrigo Co. PLC 1,355 196,069 Reckitt Benckiser Group PLC 3,180 294,500 SGS S.A. 105 200,284 Shoprite Holdings Ltd. 8,080 74,808 Sysmex Corp. 4,820 313,786 Unicharm Corp. 6,700 137,983 __________ 2,767,851
Energy (3.2%) Core Laboratories N.V. 2,155 234,335
Financial (4.3%) ACE Ltd. 2,695 314,911
Industrial (9.0%) Canadian Pacific Railway Ltd. 1,550 197,780 Keyence Corp. 400 223,089
411

THE COLLECTIVE INVESTMENT FUNDS OF FIRST MERCANTILE TRUST COMPANY FMT International Growth (WCM) Fund
Schedule of Investments and Specific Fund Disclosures (continued) December 31, 2015
The accompanying notes are an integral part of these financial statements.
Investments
Principal Amount or
Shares Fair Value ____________ ____________
Common stocks (continued)
Industrial (continued)
Sensata Technologies Holding N.V. 5,035 $ 231,912
652,781
Technology (2.9%)
Constellation Software, Inc. 500 208,448 __________ Total Common stocks (Cost $5,255,972) 5,555,566
Depository receipts (18.4%)
Communication (3.4%) Ctrip.com International Ltd. ADR 5,305 245,781
Consumer, Non-cyclical (4.6%) Novo Nordisk A/S ADR 5,720 332,217
Financial (2.0%) HDFC Bank Ltd. ADR 2,370 145,992
Technology (8.4%) ARM Holdings PLC ADR 4,925 222,807 Taiwan Semiconductor Manufacturing Co. Ltd. ADR 17,035 387,546 __________ 610,353 __________ Total Depository receipts (Cost $1,175,872) 1,334,343
Limited partnership (2.5%) Lazard Ltd. Class A (Cost $181,069) 4,060 182,741 __________Total Investments (Cost $6,612,913) $ 7,072,650 ____________________
412

THE COLLECTIVE INVESTMENT FUNDS OF FIRST MERCANTILE TRUST COMPANY FMT International Growth (WCM) Fund
Schedule of Investments and Specific Fund Disclosures (continued) December 31, 2015
The accompanying notes are an integral part of these financial statements.
Specific Fund Disclosures Fair value The inputs or methodology used for valuing securities may not be indicative of the risks associated with investing in those securities. For more information on valuation inputs, and their aggregation into the levels used in the table below, please refer to note 4 to the financial statements. The following table sets forth by level, within the fair value hierarchy, the Fund's investments measured at fair value.
Total Level 1 Level 2 Level 3
Common stocks $ 5,555,566 $ 5,555,566 $ — $ —Depository receipts 1,334,343 1,334,343 — —Limited partnership 182,741 182,741 — —__________ __________ __________ _________
$ 7,072,650 $ 7,072,650 $ — $ —__________ __________ __________ ___________________ __________ __________ _________ Investment transactions The aggregate cost of purchases of investment securities and proceeds from sales of investment securities (other than temporary cash investments) totaled $3,013,818 and $8,324,270, respectively, for the year ended December 31, 2015. Proceeds from sales of investments Proceeds from sales of investments as reported in the accompanying statement of operations is net of foreign currency losses of $9,981. Class-specific expenses Class-specific trustee fees for the year ended December 31, 2015 were as follows: Class R1 $ 14,594 Class R2 8,334 Class R3 3,941 Class R4 4,710 Class R5 17,789 Class R6 9,024 Class R7 4,865 Class R8 3,323 $ 66,580
413

THE COLLECTIVE INVESTMENT FUNDS OF FIRST MERCANTILE TRUST COMPANY FMT International Growth (WCM) Fund
Schedule of Participant Transactions December 31, 2015
The accompanying notes are an integral part of these financial statements.
Participant transactions by class for the year ended December 31, 2015 were as follows: Dollars Units Purchases Redemptions Net change Purchases Redemptions Net change Class R1 $ 443,635 $ (3,815,222) $ (3,371,587) 41,956 (359,951) (317,995)Class R2 123,926 (1,131,249) (1,007,323) 11,778 (104,551) (92,773)Class R3 232,096 (287,792) (55,696) 22,880 (27,094) (4,214)Class R4 112,965 (569,349) (456,384) 10,741 (54,723) (43,982)Class R5 283,640 (600,790) (317,150) 27,105 (58,106) (31,001)Class R6 91,040 (299,727) (208,687) 8,739 (29,554) (20,815)Class R7 41,875 (34,848) 7,027 3,974 (3,457) 517Class R8 21,520 (22,704) (1,184) 2,090 (2,275) (185) $ 1,350,697 $ (6,761,681) $ (5,410,984) 129,263 (639,711) (510,448)
414

THE COLLECTIVE INVESTMENT FUNDS OF FIRST MERCANTILE TRUST COMPANY FMT International Growth (WCM) Fund
Financial Highlights December 31, 2015
The accompanying notes are an integral part of these financial statements.
Change in Net Asset Value Resulting from Operations Ratios (to average net
assets)
NAV per Unit, Beginning of
Period
Net Investment
Income (Loss)(a)
Net Realized and Unrealized
Gain (Loss) from
Investments(a)
Total from Investment Activities
NAV per Unit, End of
Period Total
Return Expenses
Net Investment
Income (Loss)
Class R1 $ 10.0125 $ 0.0446 $ 0.5270 $ 0.5716 $ 10.5841 5.71% (1.44)% 0.42%Class R2 9.9936 0.0212 0.5261 0.5473 10.5409 5.48% (1.65)% 0.20%Class R3 9.9793 0.0034 0.5252 0.5286 10.5079 5.30% (1.82)% 0.03%Class R4 9.9645 (0.0144) 0.5242 0.5098 10.4743 5.12% (1.99)% (0.14)%Class R5 9.9500 (0.0320) 0.5234 0.4914 10.4414 4.94% (2.15)% (0.31)%Class R6 9.9355 (0.0495) 0.5225 0.4730 10.4085 4.76% (2.33)% (0.48)%Class R7 9.9209 (0.0671) 0.5217 0.4546 10.3755 4.58% (2.49)% (0.65)%Class R8 9.9065 (0.0847) 0.5211 0.4364 10.3429 4.41% (2.66)% (0.82)%
(a) Per unit amounts are based on average daily units outstanding.
415

FMT International Value Opportunities (Harris) Fund

THE COLLECTIVE INVESTMENT FUNDS OF FIRST MERCANTILE TRUST COMPANY FMT International Value Opportunities (Harris) Fund
Statement of Assets and Liabilities December 31, 2015
The accompanying notes are an integral part of these financial statements.
Assets Investments in securities, at fair value $ 50,505,632 Cash equivalents 2,405,165
Receivables
Dividend tax reclaim 81,150
Dividends and interest 54,663
Investments sold 29,310
Total assets 53,075,920
Liabilities Investments purchased 77,793
Sub-advisor fees 26,863
Trustee fees 16,633
Total liabilities 121,289
Net assets $ 52,954,631
Components of net assets
Units of
Participation NAV
per Unit Net
Assets Class R1 1,158,908 $ 10.7164 $ 12,419,285
Class R2 195,053 $ 11.1900 2,182,637
Class R3 279,007 $ 11.0489 3,082,718
Class R4 380,279 $ 10.9729 4,172,775
Class R5 287,408 $ 11.4418 3,288,476
Class R6 196,884 $ 10.8974 2,145,521
Class R7 41,142 $ 11.0420 454,292
Class R8 40,292 $ 10.8809 438,411
Class LifeStyle 24,770,516
$ 52,954,631
416

THE COLLECTIVE INVESTMENT FUNDS OF FIRST MERCANTILE TRUST COMPANY FMT International Value Opportunities (Harris) Fund
Statement of Operations For the Year Ended December 31, 2015
The accompanying notes are an integral part of these financial statements.
Investment income
Dividends (net of foreign withholding taxes of $73,139) $ 1,603,097
Interest 650
1,603,747
Expenses
Sub-advisor fees 403,584
Trustee fees 401,728
Custody fees 49,394
Audit fees 6,080
860,786
Net investment income 742,961
Net realized gain from investments sold
Proceeds from sales of investments 80,342,582
Cost of investments sold 77,868,678
Net realized gain from investments sold 2,473,904
Change in net unrealized appreciation (depreciation) on investments (1,922,399)
Net realized and unrealized gain on investments 551,505
Other operating credits (charges) 422
Net increase in net assets resulting from operations $ 1,294,888
417

THE COLLECTIVE INVESTMENT FUNDS OF FIRST MERCANTILE TRUST COMPANY FMT International Value Opportunities (Harris) Fund
Statement of Changes in Net Assets For the Year Ended December 31, 2015
The accompanying notes are an integral part of these financial statements.
Operations
Net investment income $ 742,961
Net realized gain from investments sold 2,473,904
Change in net unrealized appreciation (depreciation) on investments (1,922,399)
Other operating credits (charges) 422
Net increase in net assets resulting from operations 1,294,888
Participant transactions
Proceeds from units purchased 14,590,612
Less payments for units redeemed 31,092,240
Decrease in net assets from participant transactions (16,501,628)
Total decrease in net assets (15,206,740)
Net assets at beginning of year 68,161,371
Net assets at end of year $ 52,954,631
418

THE COLLECTIVE INVESTMENT FUNDS OF FIRST MERCANTILE TRUST COMPANY FMT International Value Opportunities (Harris) Fund Schedule of Investments and Specific Fund Disclosures
December 31, 2015
The accompanying notes are an integral part of these financial statements.
Investments
Principal Amount or
Shares Fair Value ____________ ____________
Common stocks (91.0%)
Basic Materials (3.0%) Akzo Nobel N.V. 2,000 $ 133,950 Glencore PLC 1,073,300 1,431,871 __________ 1,565,821
Communication (0.2%) WPP PLC 4,800 110,619
Consumer, Cyclical (25.8%) Bayerische Motoren Werke AG 14,400 1,526,565 Burberry Group PLC 30,300 533,876 Cie Financiere Richemont S.A. 16,700 1,201,847 Daimler AG 20,690 1,742,930 Hennes & Mauritz AB Class B 14,800 529,175 Honda Motor Co. Ltd. 61,100 1,986,290 Kering 7,900 1,354,928 LVMH Moet Hennessy Louis Vuitton SE 4,400 692,294 Prada SpA 295,100 917,571 Swatch Group AG/The BR 2,600 908,839 Toyota Motor Corp. 27,800 1,730,754 Valeo S.A. 2,700 417,927 Wolseley PLC 1,900 103,402 __________ 13,646,398
Consumer, Non-cyclical (10.5%) Ashtead Group PLC 20,800 343,181 Bureau Veritas S.A. 57,600 1,150,201 Danone S.A. 11,710 791,909 Diageo PLC 32,700 895,102 Experian PLC 45,200 800,408 G4S PLC 134,500 447,197 GlaxoSmithKline PLC 5,500 111,343 Nestle S.A. 1,500 111,619 Olympus Corp. 2,800 111,744 Pernod Ricard S.A. 4,900 559,734 Secom Co. Ltd. 1,600 109,615 Swedish Match AB 3,200 113,697 __________ 5,545,750
Financial (29.0%) Allianz SE 9,200 1,633,834
419

THE COLLECTIVE INVESTMENT FUNDS OF FIRST MERCANTILE TRUST COMPANY FMT International Value Opportunities (Harris) Fund
Schedule of Investments and Specific Fund Disclosures (continued) December 31, 2015
The accompanying notes are an integral part of these financial statements.
Investments
Principal Amount or
Shares Fair Value ____________ ____________
Common stocks (continued)
Financial (continued) AMP Ltd. 191,500 $ 813,553 BNP Paribas S.A. 33,800 1,916,930 Credit Suisse Group AG 115,600 2,502,734 Daiwa Securities Group, Inc. 132,000 817,407 EXOR SpA 22,500 1,028,327 Intesa Sanpaolo SpA 271,500 910,367 Lloyds Banking Group PLC 1,146,600 1,235,325 Nomura Holdings, Inc. 428,100 2,417,150 Schroders PLC 9,500 416,856 Sumitomo Mitsui Financial Group, Inc. 15,000 574,434 Willis Group Holdings PLC 22,800 1,107,396 __________ 15,374,313
Industrial (19.8%) Atlas Copco AB Class B 16,600 383,705 CNH Industrial N.V. 211,600 1,456,715 Komatsu Ltd. 74,000 1,225,591 Koninklijke Philips N.V. 45,400 1,161,450 Kuehne + Nagel International AG 3,000 412,637 LafargeHolcim Ltd. 27,100 1,360,613 Meggitt PLC 96,500 533,140 Omron Corp. 38,900 1,314,724 Orica Ltd. 82,700 934,084 Safran S.A. 1,900 130,739 Schindler Holding AG 700 117,383 SKF AB Class B 53,800 873,622 Smiths Group PLC 43,500 602,582 __________ 10,506,985
Technology (2.7%) Check Point Software Technologies Ltd. 1,300 105,794 Samsung Electronics Co. Ltd. 1,240 1,332,481 __________ 1,438,275 __________ Total Common stocks (Cost $49,417,982) 48,188,161
420

THE COLLECTIVE INVESTMENT FUNDS OF FIRST MERCANTILE TRUST COMPANY FMT International Value Opportunities (Harris) Fund
Schedule of Investments and Specific Fund Disclosures (continued) December 31, 2015
The accompanying notes are an integral part of these financial statements.
Investments
Principal Amount or
Shares Fair Value
Depository receipts (4.4%) Communications (2.4%)
Baidu, Inc. ADR 4,000 $ 756,160 Grupo Televisa S.A.B. ADR 19,100 519,711 __________ 1,275,871
Consumer, Cyclical (2.0%) Melco Crown Entertainment Ltd. ADR 62,000 1,041,600 __________ Total Depository receipts (Cost $2,321,277) 2,317,471 __________ Total Investments (Cost $51,739,259) $ 50,505,632 __________ __________ Specific Fund Disclosures Fair value The inputs or methodology used for valuing securities may not be indicative of the risks associated with investing in those securities. For more information on valuation inputs, and their aggregation into the levels used in the table below, please refer to note 4 to the financial statements. The following table sets forth by level, within the fair value hierarchy, the Fund's investments measured at fair value.
Total Level 1 Level 2 Level 3
Common stocks $ 48,188,161 $ 48,188,161 $ — $ — Depository receipts 2,317,471 2,317,471 — — __________ __________ __________ _________
$ 50,505,632 $ 50,505,632 $ — $ — __________ __________ __________ _________ __________ __________ __________ _________
421

THE COLLECTIVE INVESTMENT FUNDS OF FIRST MERCANTILE TRUST COMPANY FMT International Value Opportunities (Harris) Fund
Schedule of Investments and Specific Fund Disclosures (continued) December 31, 2015
The accompanying notes are an integral part of these financial statements.
Investment transactions The aggregate cost of purchases of investment securities and proceeds from sales of investment securities (other than temporary cash investments) totaled $69,058,491 and $80,342,582, respectively, for the year ended December 31, 2015. Proceeds from sales of investments Proceeds from sales of investments as reported in the accompanying statement of operations is net of foreign currency losses of $17,086. Class-specific expenses Class-specific trustee fees for the year ended December 31, 2015 were as follows: Class R1 $ 55,611 Class R2 12,320 Class R3 26,511 Class R4 44,879 Class R5 44,489 Class R6 32,748 Class R7 7,684 Class R8 7,063 Class LifeStyle 170,423 $ 401,728
422
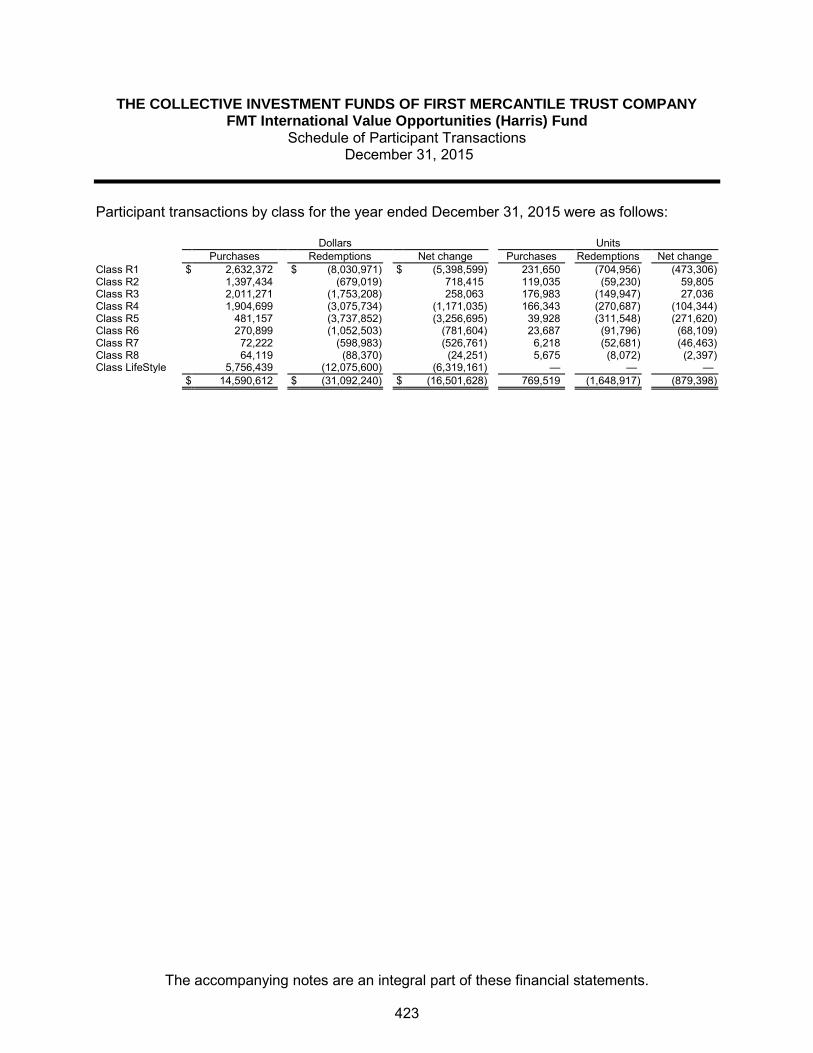
THE COLLECTIVE INVESTMENT FUNDS OF FIRST MERCANTILE TRUST COMPANY FMT International Value Opportunities (Harris) Fund
Schedule of Participant Transactions December 31, 2015
The accompanying notes are an integral part of these financial statements.
Participant transactions by class for the year ended December 31, 2015 were as follows: Dollars Units Purchases Redemptions Net change Purchases Redemptions Net change Class R1 $ 2,632,372 $ (8,030,971) $ (5,398,599) 231,650 (704,956) (473,306) Class R2 1,397,434 (679,019) 718,415 119,035 (59,230) 59,805 Class R3 2,011,271 (1,753,208) 258,063 176,983 (149,947) 27,036 Class R4 1,904,699 (3,075,734) (1,171,035) 166,343 (270,687) (104,344) Class R5 481,157 (3,737,852) (3,256,695) 39,928 (311,548) (271,620) Class R6 270,899 (1,052,503) (781,604) 23,687 (91,796) (68,109) Class R7 72,222 (598,983) (526,761) 6,218 (52,681) (46,463) Class R8 64,119 (88,370) (24,251) 5,675 (8,072) (2,397) Class LifeStyle 5,756,439 (12,075,600) (6,319,161) — — — $ 14,590,612 $ (31,092,240) $ (16,501,628) 769,519 (1,648,917) (879,398)
423

THE COLLECTIVE INVESTMENT FUNDS OF FIRST MERCANTILE TRUST COMPANY FMT International Value Opportunities (Harris) Fund
Financial Highlights December 31, 2015
The accompanying notes are an integral part of these financial statements.
Change in Net Asset Value Resulting from Operations Ratios (to average net
assets)
NAV per Unit, Beginning of
Period
Net Investment
Income (Loss)(a)
Net Realized and Unrealized
Gain (Loss) from
Investments(a)
Total from Investment Activities
NAV per Unit, End of
Period Total
Return Expenses
Net Investment
Income (Loss)
Class R1 $ 10.6086 $ 0.1649 $ (0.0571) $ 0.1078 $ 10.7164 1.02 % (1.08) % 1.46 % Class R2 11.1019 0.1449 (0.0568) 0.0881 11.1900 0.79 % (1.29) % 1.23 % Class R3 10.9806 0.1243 (0.0560) 0.0683 11.0489 0.62 % (1.46) % 1.07 % Class R4 10.9237 0.1039 (0.0547) 0.0492 10.9729 0.45 % (1.63) % 0.90 % Class R5 11.4099 0.0880 (0.0561) 0.0319 11.4418 0.28 % (1.80) % 0.73 % Class R6 10.8855 0.0644 (0.0525) 0.0119 10.8974 0.11 % (1.97) % 0.56 % Class R7 11.0487 0.0452 (0.0519) (0.0067) 11.0420 (0.06) % (2.14) % 0.39 % Class R8 10.9060 0.0241 (0.0492) (0.0251) 10.8809 (0.23) % (2.31) % 0.21 % (a) Per unit amounts are based on average daily units outstanding.
424
FMT Large Cap Classic Value (C.S. McKee) Fund
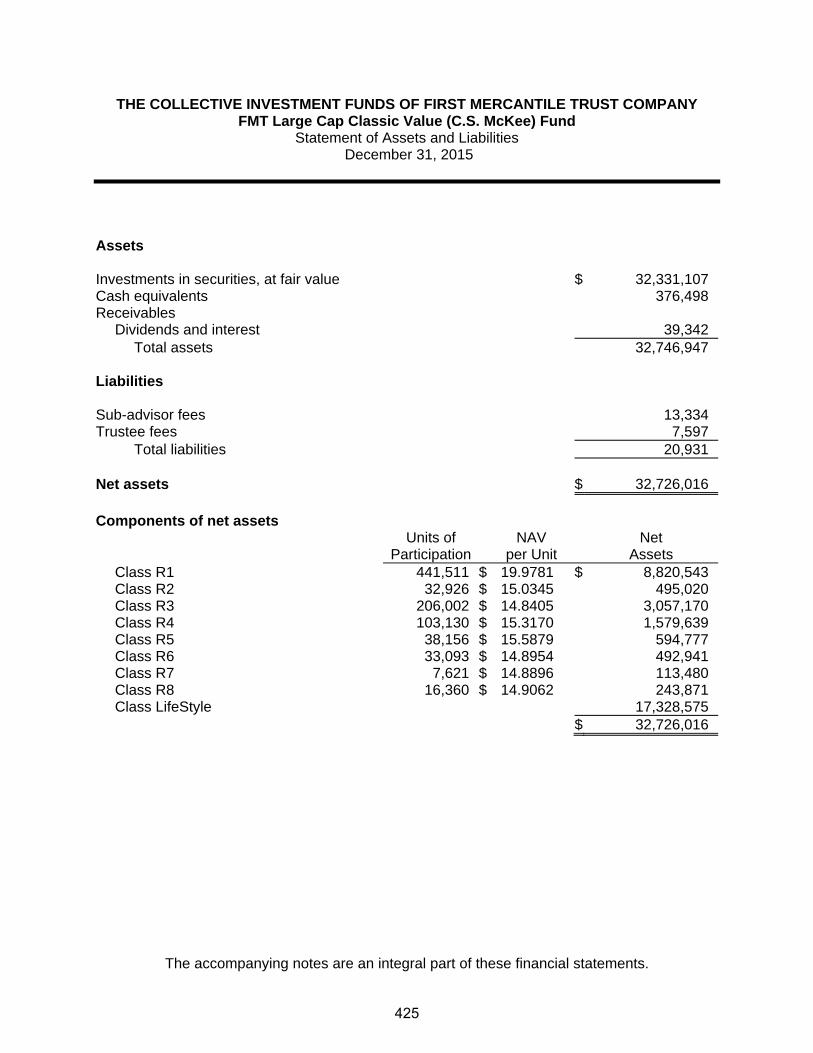
THE COLLECTIVE INVESTMENT FUNDS OF FIRST MERCANTILE TRUST COMPANY FMT Large Cap Classic Value (C.S. McKee) Fund
Statement of Assets and Liabilities December 31, 2015
The accompanying notes are an integral part of these financial statements.
Assets Investments in securities, at fair value $ 32,331,107 Cash equivalents 376,498Receivables
Dividends and interest 39,342Total assets 32,746,947
Liabilities Sub-advisor fees 13,334Trustee fees 7,597
Total liabilities 20,931 Net assets $ 32,726,016 Components of net assets
Units of
Participation NAV
per Unit Net
Assets Class R1 441,511 $ 19.9781 $ 8,820,543Class R2 32,926 $ 15.0345 495,020Class R3 206,002 $ 14.8405 3,057,170Class R4 103,130 $ 15.3170 1,579,639Class R5 38,156 $ 15.5879 594,777Class R6 33,093 $ 14.8954 492,941Class R7 7,621 $ 14.8896 113,480Class R8 16,360 $ 14.9062 243,871Class LifeStyle 17,328,575
$ 32,726,016
425

THE COLLECTIVE INVESTMENT FUNDS OF FIRST MERCANTILE TRUST COMPANY FMT Large Cap Classic Value (C.S. McKee) Fund
Statement of Operations For the Year Ended December 31, 2015
The accompanying notes are an integral part of these financial statements.
Investment income
Dividends $ 782,550Interest 649
783,199 Expenses
Trustee fees 218,911Sub-advisor fees 174,190Custody fees 12,834Audit fees 5,810
411,745 Net investment income 371,454 Net realized gain from investments sold
Proceeds from sales of investments 12,389,312Cost of investments sold 10,490,250
Net realized gain from investments sold 1,899,062 Change in net unrealized appreciation (depreciation) on investments (4,553,147) Net realized and unrealized loss on investments (2,654,085) Other operating credits (charges) (680) Net decrease in net assets resulting from operations $ (2,283,311)
426

THE COLLECTIVE INVESTMENT FUNDS OF FIRST MERCANTILE TRUST COMPANY FMT Large Cap Classic Value (C.S. McKee) Fund
Statement of Changes in Net Assets For the Year Ended December 31, 2015
The accompanying notes are an integral part of these financial statements.
Operations
Net investment income $ 371,454
Net realized gain from investments sold 1,899,062
Change in net unrealized appreciation (depreciation) on investments (4,553,147)
Other operating credits (charges) (680)
Net decrease in net assets resulting from operations (2,283,311) Participant transactions
Proceeds from units purchased 10,000,568Less payments for units redeemed 15,226,615
Decrease in net assets from participant transactions (5,226,047)
Total decrease in net assets (7,509,358) Net assets at beginning of year 40,235,374 Net assets at end of year $ 32,726,016
427
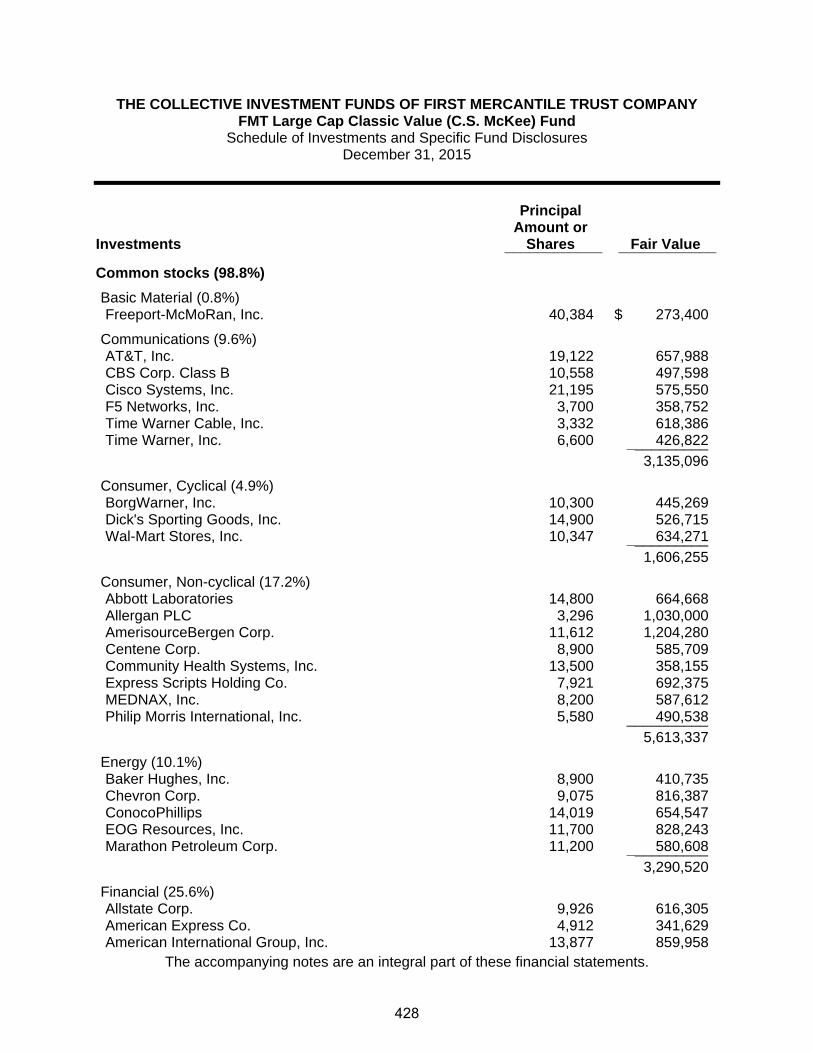
THE COLLECTIVE INVESTMENT FUNDS OF FIRST MERCANTILE TRUST COMPANY FMT Large Cap Classic Value (C.S. McKee) Fund
Schedule of Investments and Specific Fund Disclosures December 31, 2015
The accompanying notes are an integral part of these financial statements.
Investments
Principal Amount or
Shares Fair Value ____________ ____________
Common stocks (98.8%)
Basic Material (0.8%) Freeport-McMoRan, Inc. 40,384 $ 273,400
Communications (9.6%) AT&T, Inc. 19,122 657,988 CBS Corp. Class B 10,558 497,598 Cisco Systems, Inc. 21,195 575,550 F5 Networks, Inc. 3,700 358,752 Time Warner Cable, Inc. 3,332 618,386 Time Warner, Inc. 6,600 426,822 __________ 3,135,096
Consumer, Cyclical (4.9%) BorgWarner, Inc. 10,300 445,269 Dick's Sporting Goods, Inc. 14,900 526,715 Wal-Mart Stores, Inc. 10,347 634,271 __________ 1,606,255
Consumer, Non-cyclical (17.2%) Abbott Laboratories 14,800 664,668 Allergan PLC 3,296 1,030,000 AmerisourceBergen Corp. 11,612 1,204,280 Centene Corp. 8,900 585,709 Community Health Systems, Inc. 13,500 358,155 Express Scripts Holding Co. 7,921 692,375 MEDNAX, Inc. 8,200 587,612 Philip Morris International, Inc. 5,580 490,538 __________ 5,613,337
Energy (10.1%) Baker Hughes, Inc. 8,900 410,735 Chevron Corp. 9,075 816,387 ConocoPhillips 14,019 654,547 EOG Resources, Inc. 11,700 828,243 Marathon Petroleum Corp. 11,200 580,608 __________ 3,290,520
Financial (25.6%) Allstate Corp. 9,926 616,305 American Express Co. 4,912 341,629 American International Group, Inc. 13,877 859,958
428

THE COLLECTIVE INVESTMENT FUNDS OF FIRST MERCANTILE TRUST COMPANY FMT Large Cap Classic Value (C.S. McKee) Fund
Schedule of Investments and Specific Fund Disclosures (continued) December 31, 2015
The accompanying notes are an integral part of these financial statements.
Investments
Principal Amount or
Shares Fair Value ____________ ____________
Common stocks (continued)
Financial (continued) Bank of New York Mellon Corp. 16,368 $ 674,689 Discover Financial Services 15,700 841,834 Federated Investors, Inc. Class B 13,500 386,775 Goldman Sachs Group, Inc. 3,181 573,312 JPMorgan Chase & Co. 22,174 1,464,149 T Rowe Price Group, Inc. 8,600 614,814 US Bancorp 11,825 504,573 Wells Fargo & Co. 27,859 1,514,415 __________ 8,392,453
Industrial (13.6%) Agilent Technologies, Inc. 8,883 371,398 Deere & Co. 6,036 460,366 Dover Corp. 9,457 579,809 General Electric Co. 49,565 1,543,950 Honeywell International, Inc. 8,813 912,762 United Technologies Corp. 6,143 590,158 __________ 4,458,443
Technology (12.6%) Apple, Inc. 7,280 766,293 EMC Corp./MA 18,410 472,769 Intel Corp. 29,899 1,030,020 Microsoft Corp. 10,764 597,187 Oracle Corp. 13,120 479,274 SanDisk Corp. 10,163 772,286 __________ 4,117,829
Utilities (4.4%) NextEra Energy, Inc. 7,619 791,538 Public Service Enterprise Group, Inc. 16,858 652,236 __________ 1,443,774 __________Total Investments (Cost $29,510,300) $ 32,331,107 ____________________
429
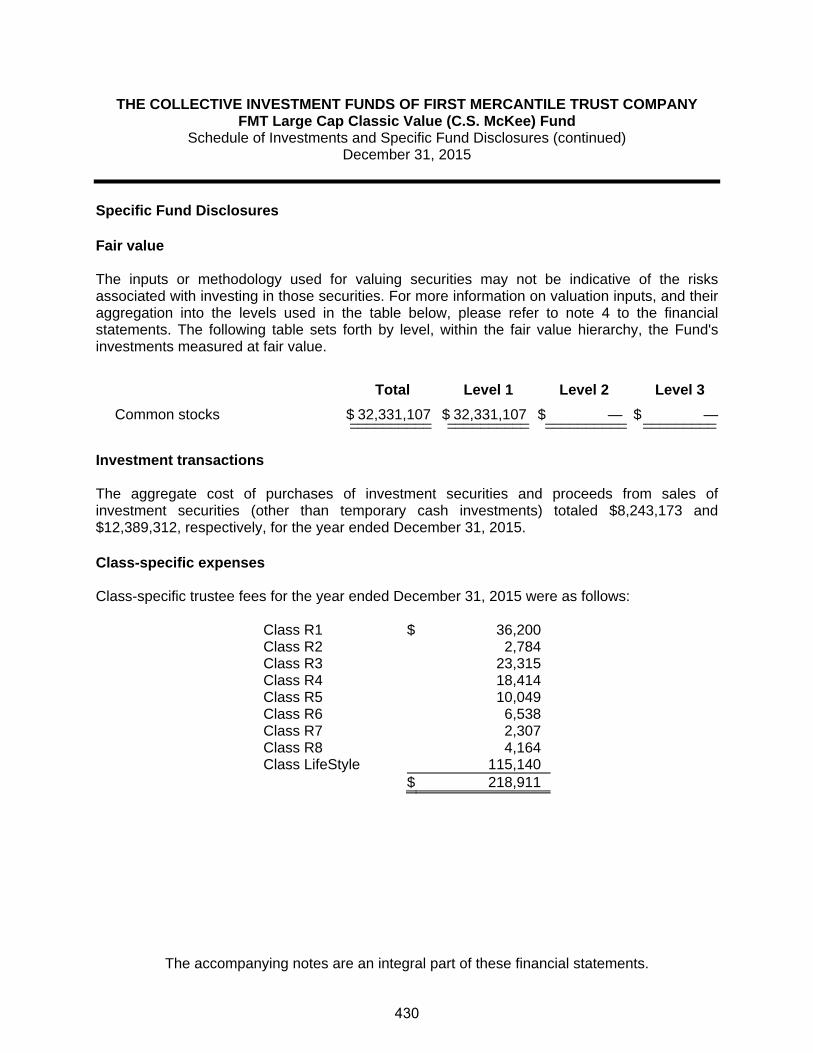
THE COLLECTIVE INVESTMENT FUNDS OF FIRST MERCANTILE TRUST COMPANY FMT Large Cap Classic Value (C.S. McKee) Fund
Schedule of Investments and Specific Fund Disclosures (continued) December 31, 2015
The accompanying notes are an integral part of these financial statements.
Specific Fund Disclosures Fair value The inputs or methodology used for valuing securities may not be indicative of the risks associated with investing in those securities. For more information on valuation inputs, and their aggregation into the levels used in the table below, please refer to note 4 to the financial statements. The following table sets forth by level, within the fair value hierarchy, the Fund's investments measured at fair value.
Total Level 1 Level 2 Level 3
Common stocks $ 32,331,107 $ 32,331,107 $ — $ —__________ __________ __________ ___________________ __________ __________ _________ Investment transactions The aggregate cost of purchases of investment securities and proceeds from sales of investment securities (other than temporary cash investments) totaled $8,243,173 and $12,389,312, respectively, for the year ended December 31, 2015. Class-specific expenses Class-specific trustee fees for the year ended December 31, 2015 were as follows: Class R1 $ 36,200 Class R2 2,784 Class R3 23,315 Class R4 18,414 Class R5 10,049 Class R6 6,538 Class R7 2,307 Class R8 4,164 Class LifeStyle 115,140 $ 218,911
430
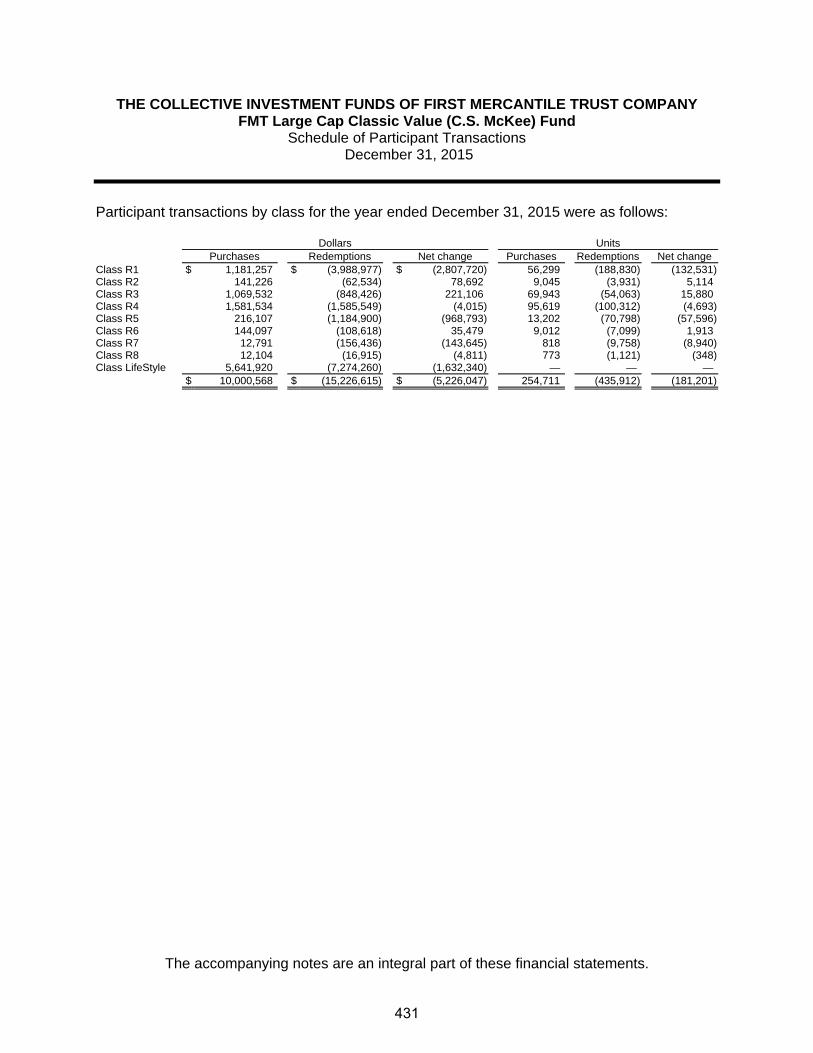
THE COLLECTIVE INVESTMENT FUNDS OF FIRST MERCANTILE TRUST COMPANY FMT Large Cap Classic Value (C.S. McKee) Fund
Schedule of Participant Transactions December 31, 2015
The accompanying notes are an integral part of these financial statements.
Participant transactions by class for the year ended December 31, 2015 were as follows: Dollars Units Purchases Redemptions Net change Purchases Redemptions Net change Class R1 $ 1,181,257 $ (3,988,977) $ (2,807,720) 56,299 (188,830) (132,531)Class R2 141,226 (62,534) 78,692 9,045 (3,931) 5,114Class R3 1,069,532 (848,426) 221,106 69,943 (54,063) 15,880Class R4 1,581,534 (1,585,549) (4,015) 95,619 (100,312) (4,693)Class R5 216,107 (1,184,900) (968,793) 13,202 (70,798) (57,596)Class R6 144,097 (108,618) 35,479 9,012 (7,099) 1,913Class R7 12,791 (156,436) (143,645) 818 (9,758) (8,940)Class R8 12,104 (16,915) (4,811) 773 (1,121) (348)Class LifeStyle 5,641,920 (7,274,260) (1,632,340) — — — $ 10,000,568 $ (15,226,615) $ (5,226,047) 254,711 (435,912) (181,201)
431

THE COLLECTIVE INVESTMENT FUNDS OF FIRST MERCANTILE TRUST COMPANY FMT Large Cap Classic Value (C.S. McKee) Fund
Financial Highlights December 31, 2015
The accompanying notes are an integral part of these financial statements.
Change in Net Asset Value Resulting from Operations Ratios (to average net
assets)
NAV per Unit, Beginning of
Period
Net Investment
Income (Loss)(a)
Net Realized and Unrealized
Gain (Loss) from
Investments(a)
Total from Investment Activities
NAV per Unit, End of
Period Total
Return Expenses
Net Investment
Income (Loss)
Class R1 $ 21.2438 $ 0.2563 $ (1.5220) $ (1.2657) $ 19.9781 (5.96)% (0.87)% 1.23%Class R2 16.0224 0.1585 (1.1464) (0.9879) 15.0345 (6.17)% (1.09)% 1.01%Class R3 15.8428 0.1302 (1.1325) (1.0023) 14.8405 (6.33)% (1.26)% 0.84%Class R4 16.3794 0.1070 (1.1694) (1.0624) 15.3170 (6.49)% (1.43)% 0.67%Class R5 16.6978 0.0814 (1.1913) (1.1099) 15.5879 (6.65)% (1.60)% 0.50%Class R6 15.9833 0.0512 (1.1391) (1.0879) 14.8954 (6.81)% (1.77)% 0.33%Class R7 16.0043 0.0243 (1.1390) (1.1147) 14.8896 (6.97)% (1.94)% 0.15%Class R8 16.0496 (0.0019) (1.1415) (1.1434) 14.9062 (7.12)% (2.11)% (0.01)%
(a) Per unit amounts are based on average daily units outstanding.
432

FMT Large Cap Concentrated Equity (Cornerstone) Fund

THE COLLECTIVE INVESTMENT FUNDS OF FIRST MERCANTILE TRUST COMPANY FMT Large Cap Concentrated Equity (Cornerstone) Fund
Statement of Assets and Liabilities December 31, 2015
The accompanying notes are an integral part of these financial statements.
Assets Investments in securities, at fair value $ 41,296,968 Cash equivalents 1,559,113Receivables
Dividends and interest 32,567 Dividend tax reclaim 2,742
Total assets 42,891,390 Liabilities Investments purchased 124,155Sub-advisor fees 15,477Trustee fees 1,108
Total liabilities 140,740 Net assets $ 42,750,650 Components of net assets
Units of
Participation NAV
per Unit Net
Assets Class R1 270,571 $ 13.5310 $ 3,661,076Class LifeStyle 39,089,574
$ 42,750,650
433

THE COLLECTIVE INVESTMENT FUNDS OF FIRST MERCANTILE TRUST COMPANY FMT Large Cap Concentrated Equity (Cornerstone) Fund
Statement of Operations For the Year Ended December 31, 2015
The accompanying notes are an integral part of these financial statements.
Investment income
Dividends (net of foreign withholding taxes of $584) $ 1,125,061Interest 2,163
1,127,224 Expenses
Trustee fees 287,615Sub-advisor fees 205,823Custody fees 27,408Audit fees 6,506
527,352 Net investment income 599,872 Net realized gain from investments sold
Proceeds from sales of investments 32,803,540Cost of investments sold 31,052,300
Net realized gain from investments sold 1,751,240 Change in net unrealized appreciation (depreciation) on investments (10,361,480) Net realized and unrealized loss on investments (8,610,240) Other operating credits (charges) (1,680) Net decrease in net assets resulting from operations $ (8,012,048)
434
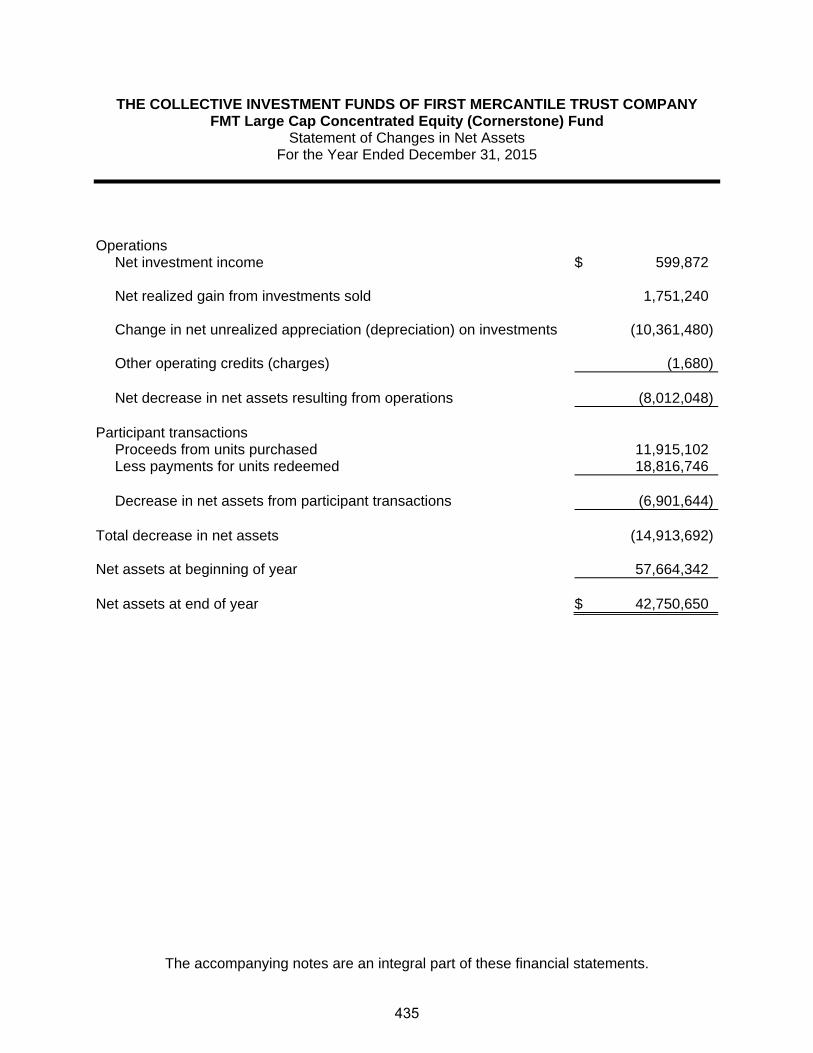
THE COLLECTIVE INVESTMENT FUNDS OF FIRST MERCANTILE TRUST COMPANY FMT Large Cap Concentrated Equity (Cornerstone) Fund
Statement of Changes in Net Assets For the Year Ended December 31, 2015
The accompanying notes are an integral part of these financial statements.
Operations
Net investment income $ 599,872
Net realized gain from investments sold 1,751,240
Change in net unrealized appreciation (depreciation) on investments (10,361,480)
Other operating credits (charges) (1,680)
Net decrease in net assets resulting from operations (8,012,048) Participant transactions
Proceeds from units purchased 11,915,102Less payments for units redeemed 18,816,746
Decrease in net assets from participant transactions (6,901,644)
Total decrease in net assets (14,913,692) Net assets at beginning of year 57,664,342 Net assets at end of year $ 42,750,650
435

THE COLLECTIVE INVESTMENT FUNDS OF FIRST MERCANTILE TRUST COMPANY FMT Large Cap Concentrated Equity (Cornerstone) Fund
Schedule of Investments and Specific Fund Disclosures December 31, 2015
The accompanying notes are an integral part of these financial statements.
Investments
Principal Amount or
Shares Fair Value ____________ ____________
Common stocks (94.5%)
Communications (7.6%) Alphabet, Inc. Class A 1,770 $ 1,377,078 Cisco Systems, Inc. 68,650 1,864,191 __________ 3,241,269
Consumer, Cyclical (17.0%) BorgWarner, Inc. 34,175 1,477,385 Dollar General Corp. 14,650 1,052,896 Gap, Inc. 48,075 1,187,452 Magna International, Inc. 32,475 1,317,186 VF Corp. 20,275 1,262,119 WW Grainger, Inc. 4,765 965,341 __________ 7,262,379
Consumer, Non-cyclical (8.1%) Johnson & Johnson 19,275 1,979,928 Tyson Foods, Inc. Class A 27,425 1,462,575 __________ 3,442,503
Energy (5.2%) Chevron Corp. 17,050 1,533,818 Ensco PLC Class A 45,575 701,399 __________ 2,235,217
Financial (28.3%) ACE Ltd. 11,800 1,378,830 Capital One Financial Corp. 24,000 1,732,320 Citigroup, Inc. 34,400 1,780,200 JPMorgan Chase & Co. 32,025 2,114,612 Lincoln National Corp. 24,700 1,241,422 PNC Financial Services Group, Inc. 14,250 1,358,167 State Street Corp. 18,500 1,227,660 US Bancorp 30,100 1,284,367 __________ 12,117,578
Industrial (15.4%) Boeing Co. 9,100 1,315,769 Cummins, Inc. 13,875 1,221,139 Honeywell International, Inc. 15,775 1,633,817 Norfolk Southern Corp. 9,400 795,146
436

THE COLLECTIVE INVESTMENT FUNDS OF FIRST MERCANTILE TRUST COMPANY FMT Large Cap Concentrated Equity (Cornerstone) Fund
Schedule of Investments and Specific Fund Disclosures (continued) December 31, 2015
The accompanying notes are an integral part of these financial statements.
Investments
Principal Amount or
Shares Fair Value ____________ ____________
Common stocks (continued)
Industrial (continued) Parker-Hannifin Corp. 16,675 $ 1,617,141 6,583,012
Technology (12.9%) Apple, Inc. 7,650 805,239 Microsoft Corp. 38,100 2,113,788 Oracle Corp. 48,200 1,760,746 Western Digital Corp. 14,275 857,214
5,536,987
Total Common stocks (Cost $41,540,342) 40,418,945
Depository receipt (2.1%)
Energy (2.1%) Royal Dutch Shell PLC Class A, ADR (Cost $1,288,267) 19,175 878,023
Total Investments (Cost $42,828,609) $ 41,296,968
437
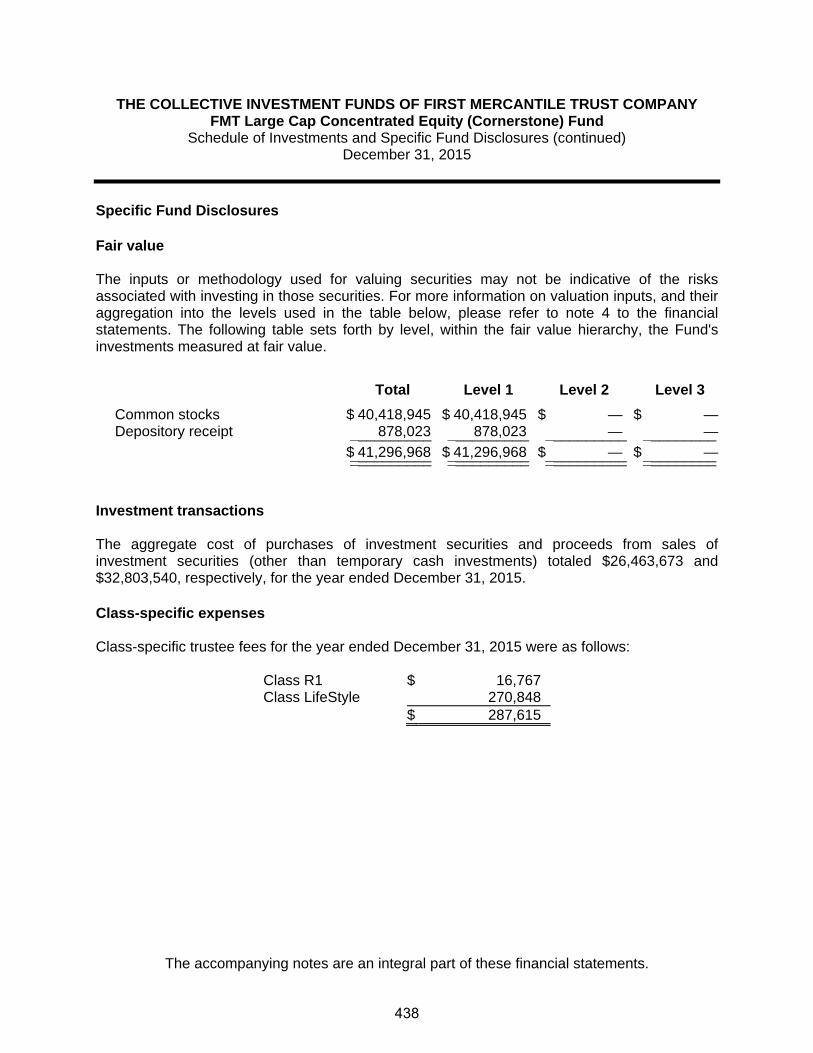
THE COLLECTIVE INVESTMENT FUNDS OF FIRST MERCANTILE TRUST COMPANY FMT Large Cap Concentrated Equity (Cornerstone) Fund
Schedule of Investments and Specific Fund Disclosures (continued) December 31, 2015
The accompanying notes are an integral part of these financial statements.
Specific Fund Disclosures Fair value The inputs or methodology used for valuing securities may not be indicative of the risks associated with investing in those securities. For more information on valuation inputs, and their aggregation into the levels used in the table below, please refer to note 4 to the financial statements. The following table sets forth by level, within the fair value hierarchy, the Fund's investments measured at fair value.
Total Level 1 Level 2 Level 3
Common stocks $ 40,418,945 $ 40,418,945 $ — $ —Depository receipt 878,023 878,023 — —__________ __________ __________ _________
$ 41,296,968 $ 41,296,968 $ — $ —__________ __________ __________ ___________________ __________ __________ _________ Investment transactions The aggregate cost of purchases of investment securities and proceeds from sales of investment securities (other than temporary cash investments) totaled $26,463,673 and $32,803,540, respectively, for the year ended December 31, 2015. Class-specific expenses Class-specific trustee fees for the year ended December 31, 2015 were as follows: Class R1 $ 16,767 Class LifeStyle 270,848 $ 287,615
438

THE COLLECTIVE INVESTMENT FUNDS OF FIRST MERCANTILE TRUST COMPANY FMT Large Cap Concentrated Equity (Cornerstone) Fund
Schedule of Participant Transactions December 31, 2015
The accompanying notes are an integral part of these financial statements.
Participant transactions by class for the year ended December 31, 2015 were as follows: Dollars Units Purchases Redemptions Net change Purchases Redemptions Net change Class R1 $ 555,678 $ (1,624,666) $ (1,068,988) 37,312 (117,546) (80,234)Class LifeStyle 11,359,424 (17,192,080) (5,832,656) — — — $ 11,915,102 $ (18,816,746) $ (6,901,644) 37,312 (117,546) (80,234)
439

THE COLLECTIVE INVESTMENT FUNDS OF FIRST MERCANTILE TRUST COMPANY FMT Large Cap Concentrated Equity (Cornerstone) Fund
Financial Highlights December 31, 2015
The accompanying notes are an integral part of these financial statements.
Change in Net Asset Value Resulting from Operations Ratios (to average net
assets)
NAV per Unit, Beginning of
Period
Net Investment
Income (Loss)(a)
Net Realized and Unrealized
Gain (Loss) from
Investments(a)
Total from Investment Activities
NAV per Unit, End of
Period Total
Return Expenses
Net Investment
Income (Loss)
Class R1 $ 15.7791 $ 0.2045 $ (2.4526) $ (2.2481) $ 13.5310 (14.25)% (0.83)% 1.40%
(a) Per unit amounts are based on average daily units outstanding.
440

FMT Large Cap Diversified Equity Fund

THE COLLECTIVE INVESTMENT FUNDS OF FIRST MERCANTILE TRUST COMPANY FMT Large Cap Diversified Equity Fund
Statement of Assets and Liabilities December 31, 2015
The accompanying notes are an integral part of these financial statements.
Assets Investments in securities, at fair value $ 20,312,503 Liabilities Trustee fees 12,342 Net assets $ 20,300,161 Components of net assets
Units of
Participation NAV
per Unit Net
Assets Class R1 LifeStyle 601,637 $ 15.9697 $ 9,607,954Class R2 LifeStyle 15,506 $ 40.2187 623,632Class R3 LifeStyle 150,242 $ 15.6058 2,344,658Class R4 LifeStyle 187,531 $ 15.2322 2,856,517Class R5 LifeStyle 98,166 $ 15.8561 1,556,534Class R6 LifeStyle 70,334 $ 14.8469 1,044,239Class R7 LifeStyle 119,065 $ 15.6224 1,860,075Class R8 LifeStyle 25,912 $ 15.6899 406,552
$ 20,300,161
441

THE COLLECTIVE INVESTMENT FUNDS OF FIRST MERCANTILE TRUST COMPANY FMT Large Cap Diversified Equity Fund
Statement of Operations For the Year Ended December 31, 2015
The accompanying notes are an integral part of these financial statements.
Expenses
Trustee fees $ 24,726Audit fees 150
24,876 Net investment loss (24,876) Net realized gain from investments sold
Proceeds from sales of investments 7,054,438Cost of investments sold 6,378,744
Net realized gain from investments sold 675,694 Change in net unrealized appreciation (depreciation) on investments (1,209,691) Net realized and unrealized loss on investments (533,997) Net decrease in net assets resulting from operations $ (558,873)
442

THE COLLECTIVE INVESTMENT FUNDS OF FIRST MERCANTILE TRUST COMPANY FMT Large Cap Diversified Equity Fund
Statement of Changes in Net Assets For the Year Ended December 31, 2015
The accompanying notes are an integral part of these financial statements.
Operations
Net investment loss $ (24,876)
Net realized gain from investments sold 675,694
Change in net unrealized appreciation (depreciation) on investments (1,209,691)
Net decrease in net assets resulting from operations (558,873) Participant transactions
Proceeds from units purchased 2,305,337Less payments for units redeemed 7,302,894
Decrease in net assets from participant transactions (4,997,557)
Total decrease in net assets (5,556,430) Net assets at beginning of year 25,856,591 Net assets at end of year $ 20,300,161
443
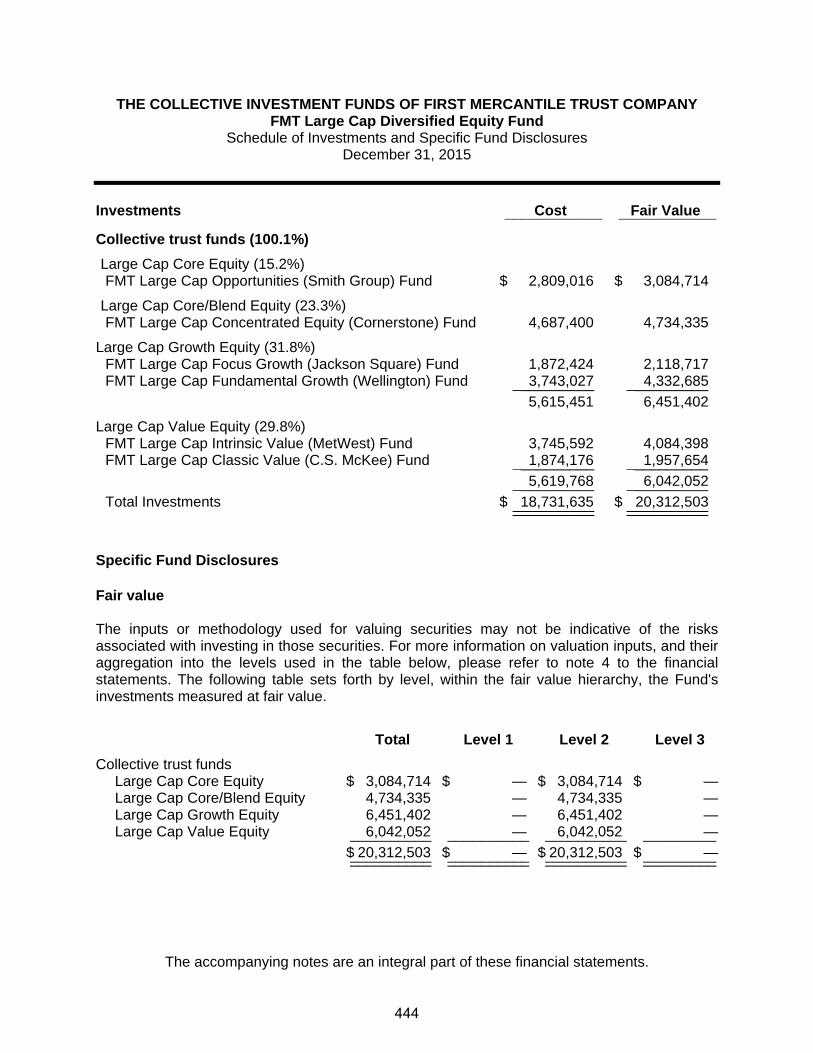
THE COLLECTIVE INVESTMENT FUNDS OF FIRST MERCANTILE TRUST COMPANY FMT Large Cap Diversified Equity Fund
Schedule of Investments and Specific Fund Disclosures December 31, 2015
The accompanying notes are an integral part of these financial statements.
Investments Cost Fair Value ____________ ____________
Collective trust funds (100.1%)
Large Cap Core Equity (15.2%) FMT Large Cap Opportunities (Smith Group) Fund $ 2,809,016 $ 3,084,714
Large Cap Core/Blend Equity (23.3%) FMT Large Cap Concentrated Equity (Cornerstone) Fund 4,687,400 4,734,335
Large Cap Growth Equity (31.8%) FMT Large Cap Focus Growth (Jackson Square) Fund 1,872,424 2,118,717 FMT Large Cap Fundamental Growth (Wellington) Fund 3,743,027 4,332,685 __________ __________ 5,615,451 6,451,402
Large Cap Value Equity (29.8%) FMT Large Cap Intrinsic Value (MetWest) Fund 3,745,592 4,084,398 FMT Large Cap Classic Value (C.S. McKee) Fund 1,874,176 1,957,654 __________ __________ 5,619,768 6,042,052 __________ __________ Total Investments $ 18,731,635 $ 20,312,503 __________ ____________________ __________ Specific Fund Disclosures Fair value The inputs or methodology used for valuing securities may not be indicative of the risks associated with investing in those securities. For more information on valuation inputs, and their aggregation into the levels used in the table below, please refer to note 4 to the financial statements. The following table sets forth by level, within the fair value hierarchy, the Fund's investments measured at fair value.
Total Level 1 Level 2 Level 3
Collective trust funds Large Cap Core Equity $ 3,084,714 $ — $ 3,084,714 $ —Large Cap Core/Blend Equity 4,734,335 — 4,734,335 —Large Cap Growth Equity 6,451,402 — 6,451,402 —Large Cap Value Equity 6,042,052 — 6,042,052 —__________ __________ __________ _________
$ 20,312,503 $ — $ 20,312,503 $ —__________ __________ __________ ___________________ __________ __________ _________
444

THE COLLECTIVE INVESTMENT FUNDS OF FIRST MERCANTILE TRUST COMPANY FMT Large Cap Diversified Equity Fund
Schedule of Investments and Specific Fund Disclosures (continued) December 31, 2015
The accompanying notes are an integral part of these financial statements.
The estimated fair value of the underlying collective trust funds is net asset value. The use of net asset value as fair value is deemed appropriate as the collective trust funds do not have a finite life, no unfunded commitments relating to this type of investment, or no significant restrictions on redemptions. Investment transactions The aggregate cost of purchases of investment securities and proceeds from sales of investment securities (other than temporary cash investments) totaled $2,044,347 and $7,054,438, respectively, for the year ended December 31, 2015. Class-specific expenses Class-specific trustee fees for the year ended December 31, 2015 were as follows: Class R1 LifeStyle $ 6,520 Class R2 LifeStyle 622 Class R3 LifeStyle 2,944 Class R4 LifeStyle 4,304 Class R5 LifeStyle 2,730 Class R6 LifeStyle 2,072 Class R7 LifeStyle 4,189 Class R8 LifeStyle 1,345 $ 24,726
445

THE COLLECTIVE INVESTMENT FUNDS OF FIRST MERCANTILE TRUST COMPANY FMT Large Cap Diversified Equity Fund
Schedule of Participant Transactions December 31, 2015
The accompanying notes are an integral part of these financial statements.
Participant transactions by class for the year ended December 31, 2015 were as follows: Dollars Units Purchases Redemptions Net change Purchases Redemptions Net change Class R1 LifeStyle $ 904,051 $ (2,524,627) $ (1,620,576) 55,600 (154,802) (99,202)Class R2 LifeStyle 76,184 (100,033) (23,849) 1,843 (2,433) (590)Class R3 LifeStyle 225,202 (346,669) (121,467) 14,190 (21,763) (7,573)Class R4 LifeStyle 542,080 (1,964,531) (1,422,451) 34,360 (126,497) (92,137)Class R5 LifeStyle 199,929 (1,091,777) (891,848) 12,323 (65,892) (53,569)Class R6 LifeStyle 166,272 (360,962) (194,690) 10,927 (23,730) (12,803)Class R7 LifeStyle 131,474 (437,852) (306,378) 8,244 (26,949) (18,705)Class R8 LifeStyle 60,145 (476,443) (416,298) 3,729 (29,952) (26,223) $ 2,305,337 $ (7,302,894) $ (4,997,557) 141,216 (452,018) (310,802)
446
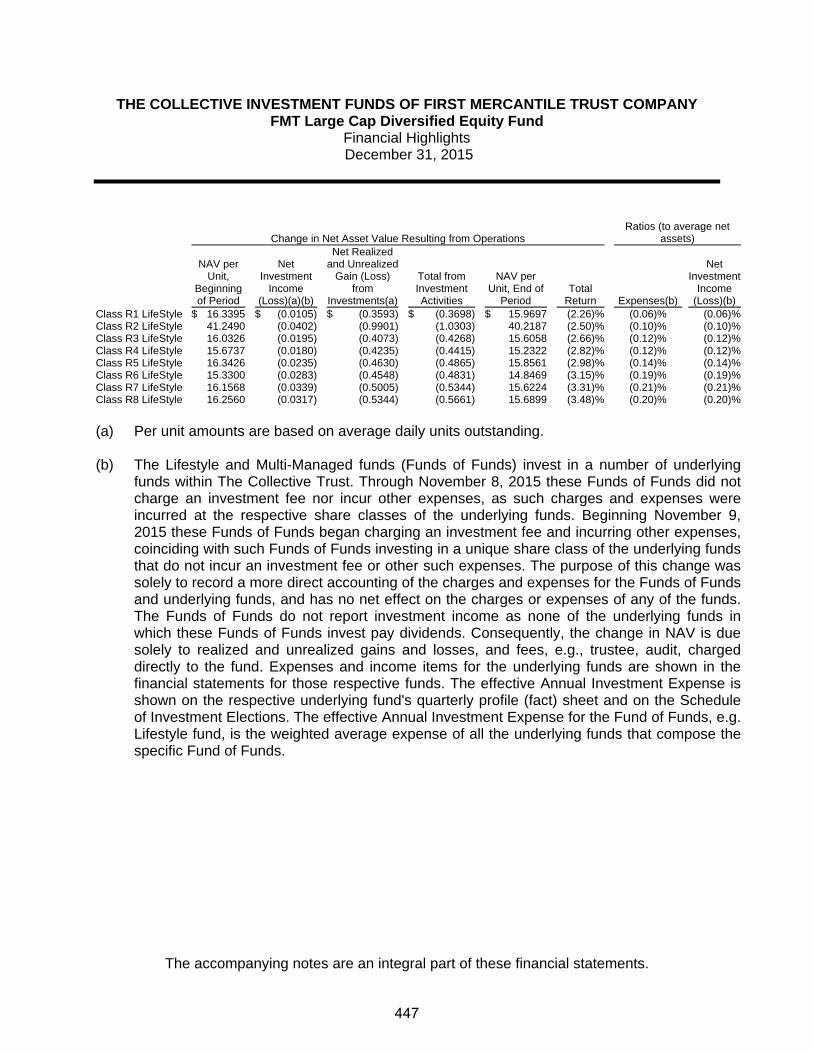
THE COLLECTIVE INVESTMENT FUNDS OF FIRST MERCANTILE TRUST COMPANY FMT Large Cap Diversified Equity Fund
Financial Highlights December 31, 2015
The accompanying notes are an integral part of these financial statements.
Change in Net Asset Value Resulting from Operations Ratios (to average net
assets)
NAV per Unit,
Beginning of Period
Net Investment
Income (Loss)(a)(b)
Net Realized and Unrealized
Gain (Loss) from
Investments(a)
Total from Investment Activities
NAV per Unit, End of
Period Total
Return Expenses(b)
Net Investment
Income (Loss)(b)
Class R1 LifeStyle $ 16.3395 $ (0.0105) $ (0.3593) $ (0.3698) $ 15.9697 (2.26)% (0.06)% (0.06)%Class R2 LifeStyle 41.2490 (0.0402) (0.9901) (1.0303) 40.2187 (2.50)% (0.10)% (0.10)%Class R3 LifeStyle 16.0326 (0.0195) (0.4073) (0.4268) 15.6058 (2.66)% (0.12)% (0.12)%Class R4 LifeStyle 15.6737 (0.0180) (0.4235) (0.4415) 15.2322 (2.82)% (0.12)% (0.12)%Class R5 LifeStyle 16.3426 (0.0235) (0.4630) (0.4865) 15.8561 (2.98)% (0.14)% (0.14)%Class R6 LifeStyle 15.3300 (0.0283) (0.4548) (0.4831) 14.8469 (3.15)% (0.19)% (0.19)%Class R7 LifeStyle 16.1568 (0.0339) (0.5005) (0.5344) 15.6224 (3.31)% (0.21)% (0.21)%Class R8 LifeStyle 16.2560 (0.0317) (0.5344) (0.5661) 15.6899 (3.48)% (0.20)% (0.20)%
(a) Per unit amounts are based on average daily units outstanding.
(b) The Lifestyle and Multi-Managed funds (Funds of Funds) invest in a number of underlying
funds within The Collective Trust. Through November 8, 2015 these Funds of Funds did notcharge an investment fee nor incur other expenses, as such charges and expenses wereincurred at the respective share classes of the underlying funds. Beginning November 9, 2015 these Funds of Funds began charging an investment fee and incurring other expenses,coinciding with such Funds of Funds investing in a unique share class of the underlying fundsthat do not incur an investment fee or other such expenses. The purpose of this change was solely to record a more direct accounting of the charges and expenses for the Funds of Fundsand underlying funds, and has no net effect on the charges or expenses of any of the funds.The Funds of Funds do not report investment income as none of the underlying funds in which these Funds of Funds invest pay dividends. Consequently, the change in NAV is due solely to realized and unrealized gains and losses, and fees, e.g., trustee, audit, chargeddirectly to the fund. Expenses and income items for the underlying funds are shown in thefinancial statements for those respective funds. The effective Annual Investment Expense isshown on the respective underlying fund's quarterly profile (fact) sheet and on the Scheduleof Investment Elections. The effective Annual Investment Expense for the Fund of Funds, e.g.Lifestyle fund, is the weighted average expense of all the underlying funds that compose thespecific Fund of Funds.
447

FMT Large Cap Focus Growth (Jackson Square) Fund
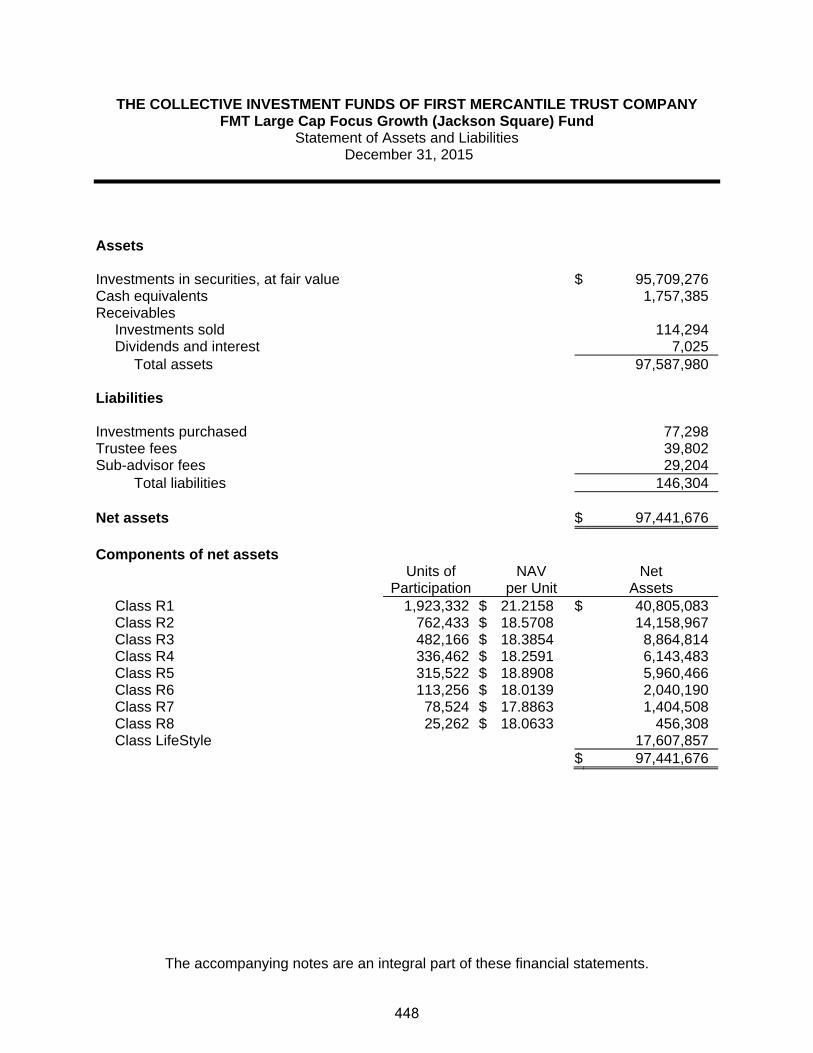
THE COLLECTIVE INVESTMENT FUNDS OF FIRST MERCANTILE TRUST COMPANY FMT Large Cap Focus Growth (Jackson Square) Fund
Statement of Assets and Liabilities December 31, 2015
The accompanying notes are an integral part of these financial statements.
Assets Investments in securities, at fair value $ 95,709,276 Cash equivalents 1,757,385Receivables
Investments sold 114,294 Dividends and interest 7,025
Total assets 97,587,980 Liabilities Investments purchased 77,298Trustee fees 39,802Sub-advisor fees 29,204
Total liabilities 146,304 Net assets $ 97,441,676 Components of net assets
Units of
Participation NAV
per Unit Net
Assets Class R1 1,923,332 $ 21.2158 $ 40,805,083Class R2 762,433 $ 18.5708 14,158,967Class R3 482,166 $ 18.3854 8,864,814Class R4 336,462 $ 18.2591 6,143,483Class R5 315,522 $ 18.8908 5,960,466Class R6 113,256 $ 18.0139 2,040,190Class R7 78,524 $ 17.8863 1,404,508Class R8 25,262 $ 18.0633 456,308Class LifeStyle 17,607,857
$ 97,441,676
448

THE COLLECTIVE INVESTMENT FUNDS OF FIRST MERCANTILE TRUST COMPANY FMT Large Cap Focus Growth (Jackson Square) Fund
Statement of Operations For the Year Ended December 31, 2015
The accompanying notes are an integral part of these financial statements.
Investment income
Dividends (net of foreign withholding taxes of $81) $ 1,368,170Interest 652
1,368,822 Expenses
Trustee fees 617,263Sub-advisor fees 362,315Custody fees 26,123Audit fees 5,882
1,011,583 Net investment income 357,239 Net realized gain from investments sold
Proceeds from sales of investments 54,667,526Cost of investments sold 36,651,809
Net realized gain from investments sold 18,015,717 Change in net unrealized appreciation (depreciation) on investments (13,245,706) Net realized and unrealized gain on investments 4,770,011 Other operating credits (charges) (6,208) Net increase in net assets resulting from operations $ 5,121,042
449

THE COLLECTIVE INVESTMENT FUNDS OF FIRST MERCANTILE TRUST COMPANY FMT Large Cap Focus Growth (Jackson Square) Fund
Statement of Changes in Net Assets For the Year Ended December 31, 2015
The accompanying notes are an integral part of these financial statements.
Operations
Net investment income $ 357,239
Net realized gain from investments sold 18,015,717
Change in net unrealized appreciation (depreciation) on investments (13,245,706)
Other operating credits (charges) (6,208)
Net increase in net assets resulting from operations 5,121,042 Participant transactions
Proceeds from units purchased 28,945,121Less payments for units redeemed 44,802,329
Decrease in net assets from participant transactions (15,857,208)
Total decrease in net assets (10,736,166) Net assets at beginning of year 108,177,842 Net assets at end of year $ 97,441,676
450
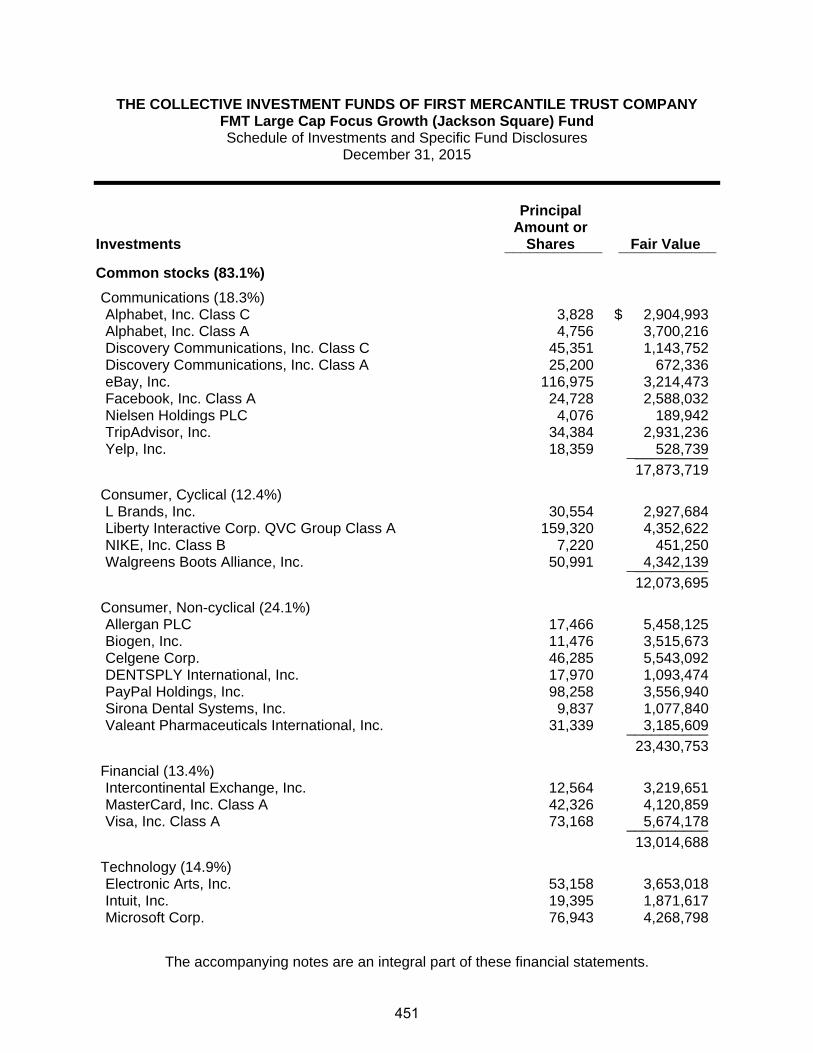
THE COLLECTIVE INVESTMENT FUNDS OF FIRST MERCANTILE TRUST COMPANY FMT Large Cap Focus Growth (Jackson Square) Fund Schedule of Investments and Specific Fund Disclosures
December 31, 2015
The accompanying notes are an integral part of these financial statements.
Investments
Principal Amount or
Shares Fair Value ____________ ____________
Common stocks (83.1%)
Communications (18.3%) Alphabet, Inc. Class C 3,828 $ 2,904,993 Alphabet, Inc. Class A 4,756 3,700,216 Discovery Communications, Inc. Class C 45,351 1,143,752 Discovery Communications, Inc. Class A 25,200 672,336 eBay, Inc. 116,975 3,214,473 Facebook, Inc. Class A 24,728 2,588,032 Nielsen Holdings PLC 4,076 189,942 TripAdvisor, Inc. 34,384 2,931,236 Yelp, Inc. 18,359 528,739 __________ 17,873,719
Consumer, Cyclical (12.4%) L Brands, Inc. 30,554 2,927,684 Liberty Interactive Corp. QVC Group Class A 159,320 4,352,622 NIKE, Inc. Class B 7,220 451,250 Walgreens Boots Alliance, Inc. 50,991 4,342,139 __________ 12,073,695
Consumer, Non-cyclical (24.1%) Allergan PLC 17,466 5,458,125 Biogen, Inc. 11,476 3,515,673 Celgene Corp. 46,285 5,543,092 DENTSPLY International, Inc. 17,970 1,093,474 PayPal Holdings, Inc. 98,258 3,556,940 Sirona Dental Systems, Inc. 9,837 1,077,840 Valeant Pharmaceuticals International, Inc. 31,339 3,185,609 __________ 23,430,753
Financial (13.4%) Intercontinental Exchange, Inc. 12,564 3,219,651 MasterCard, Inc. Class A 42,326 4,120,859 Visa, Inc. Class A 73,168 5,674,178 __________ 13,014,688
Technology (14.9%) Electronic Arts, Inc. 53,158 3,653,018 Intuit, Inc. 19,395 1,871,617 Microsoft Corp. 76,943 4,268,798
451

THE COLLECTIVE INVESTMENT FUNDS OF FIRST MERCANTILE TRUST COMPANY FMT Large Cap Focus Growth (Jackson Square) Fund
Schedule of Investments and Specific Fund Disclosures (continued) December 31, 2015
The accompanying notes are an integral part of these financial statements.
Investments
Principal Amount or
Shares Fair Value ____________ ____________
Common stocks (continued)
Technology (continued) QUALCOMM, Inc. 95,405 $ 4,768,819 14,562,252 Total Common stocks (Cost $61,916,324) 80,955,107
Depository receipts (6.4%) Communication (3.0% Baidu, Inc. ADR 15,547 2,939,005
Consumer, Non-cyclical (3.4%) Novo Nordisk A/S ADR 57,318 3,329,029 __________ Total Depository receipts (Cost $4,129,005) 6,268,034
Real estate investment trusts (8.7%) Crown Castle International Corp. 48,652 4,205,965 Equinix, Inc. 14,154 4,280,170 __________ Total Real estate investment trusts (Cost $5,519,862) 8,486,135 __________Total Investments (Cost $71,565,191) $ 95,709,276 ____________________
452

THE COLLECTIVE INVESTMENT FUNDS OF FIRST MERCANTILE TRUST COMPANY FMT Large Cap Focus Growth (Jackson Square) Fund
Schedule of Investments and Specific Fund Disclosures (continued) December 31, 2015
The accompanying notes are an integral part of these financial statements.
Specific Fund Disclosures Fair value The inputs or methodology used for valuing securities may not be indicative of the risks associated with investing in those securities. For more information on valuation inputs, and their aggregation into the levels used in the table below, please refer to note 4 to the financial statements. The following table sets forth by level, within the fair value hierarchy, the Fund's investments measured at fair value.
Total Level 1 Level 2 Level 3
Common stocks $ 80,955,107 $ 80,955,107 $ — $ —Depository receipts 6,268,034 6,268,034 — —Real estate investment trusts 8,486,135 8,486,135 — —__________ __________ __________ _________
$ 95,709,276 $ 95,709,276 $ — $ —__________ __________ __________ ___________________ __________ __________ _________ Investment transactions The aggregate cost of purchases of investment securities and proceeds from sales of investment securities (other than temporary cash investments) totaled $38,055,108 and $54,667,526, respectively, for the year ended December 31, 2015. Class-specific expenses Class-specific trustee fees for the year ended December 31, 2015 were as follows: Class R1 $ 141,300 Class R2 80,396 Class R3 76,085 Class R4 74,591 Class R5 76,452 Class R6 26,357 Class R7 20,664 Class R8 6,460 Class LifeStyle 114,958 $ 617,263
453

THE COLLECTIVE INVESTMENT FUNDS OF FIRST MERCANTILE TRUST COMPANY FMT Large Cap Focus Growth (Jackson Square) Fund
Schedule of Participant Transactions December 31, 2015
The accompanying notes are an integral part of these financial statements.
Participant transactions by class for the year ended December 31, 2015 were as follows: Dollars Units Purchases Redemptions Net change Purchases Redemptions Net change Class R1 $ 10,493,871 $ (10,116,813) $ 377,058 495,103 (486,414) 8,689Class R2 7,171,317 (6,973,333) 197,984 396,301 (370,917) 25,384Class R3 3,901,720 (6,377,197) (2,475,477) 217,879 (351,845) (133,966)Class R4 2,692,263 (7,908,011) (5,215,748) 148,629 (439,661) (291,032)Class R5 716,571 (3,622,894) (2,906,323) 38,604 (194,032) (155,428)Class R6 218,167 (495,725) (277,558) 12,292 (27,881) (15,589)Class R7 234,894 (381,083) (146,189) 13,255 (21,568) (8,313)Class R8 145,097 (389,546) (244,449) 8,021 (22,542) (14,521)Class LifeStyle 3,371,221 (8,537,727) (5,166,506) — — — $ 28,945,121 $ (44,802,329) $ (15,857,208) 1,330,084 (1,914,860) (584,776)
454

THE COLLECTIVE INVESTMENT FUNDS OF FIRST MERCANTILE TRUST COMPANY FMT Large Cap Focus Growth (Jackson Square) Fund
Financial Highlights December 31, 2015
The accompanying notes are an integral part of these financial statements.
Change in Net Asset Value Resulting from Operations Ratios (to average net
assets)
NAV per Unit, Beginning of
Period
Net Investment
Income (Loss)(a)
Net Realized and Unrealized
Gain (Loss) from
Investments(a)
Total from Investment Activities
NAV per Unit, End of
Period Total
Return Expenses
Net Investment
Income (Loss)
Class R1 $ 20.1690 $ 0.1224 $ 0.9244 $ 1.0468 $ 21.2158 5.19% (0.73)% 0.59%Class R2 17.6936 0.0669 0.8103 0.8772 18.5708 4.96% (0.95)% 0.37%Class R3 17.5469 0.0354 0.8031 0.8385 18.3854 4.78% (1.12)% 0.20%Class R4 17.4562 0.0037 0.7992 0.8029 18.2591 4.60% (1.29)% 0.02%Class R5 18.0910 (0.0270) 0.8268 0.7998 18.8908 4.42% (1.46)% (0.15)%Class R6 17.2807 (0.0558) 0.7890 0.7332 18.0139 4.24% (1.63)% (0.31)%Class R7 17.1876 (0.0858) 0.7845 0.6987 17.8863 4.07% (1.80)% (0.49)%Class R8 17.3873 (0.1163) 0.7923 0.6760 18.0633 3.89% (1.97)% (0.65)%
(a) Per unit amounts are based on average daily units outstanding.
455

FMT Large Cap Fundamental Growth (Wellington) Fund
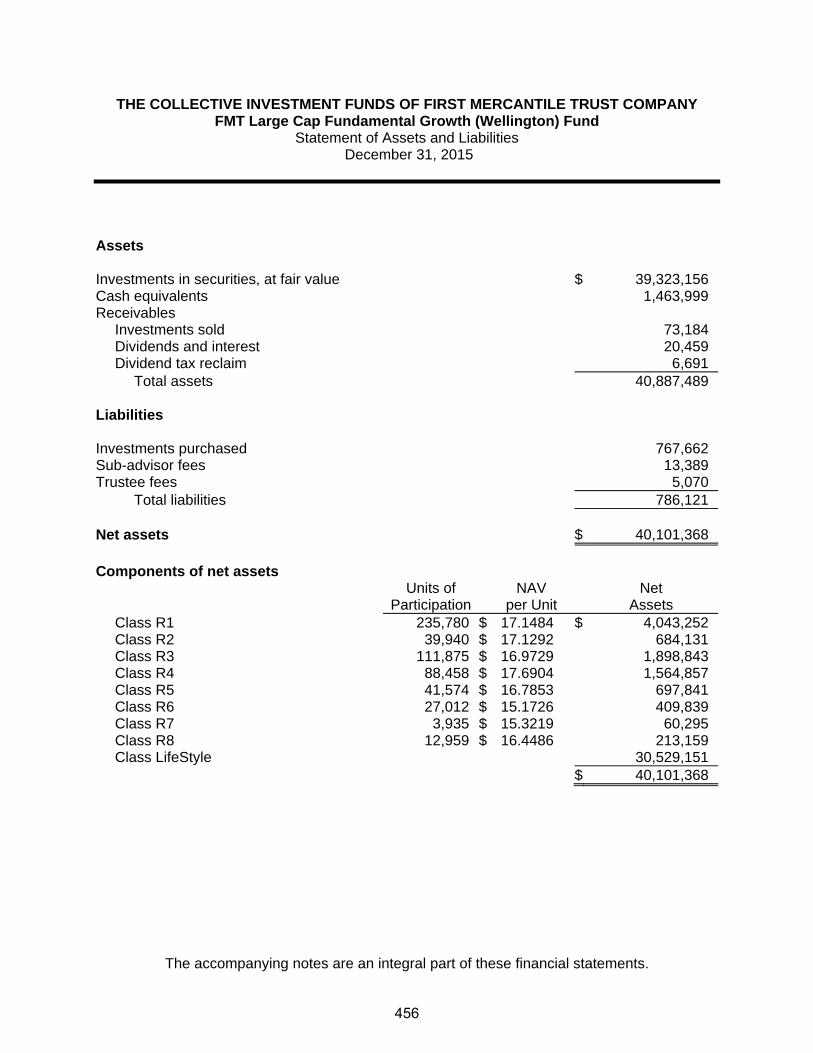
THE COLLECTIVE INVESTMENT FUNDS OF FIRST MERCANTILE TRUST COMPANY FMT Large Cap Fundamental Growth (Wellington) Fund
Statement of Assets and Liabilities December 31, 2015
The accompanying notes are an integral part of these financial statements.
Assets Investments in securities, at fair value $ 39,323,156 Cash equivalents 1,463,999Receivables
Investments sold 73,184Dividends and interest 20,459Dividend tax reclaim 6,691
Total assets 40,887,489 Liabilities Investments purchased 767,662Sub-advisor fees 13,389Trustee fees 5,070
Total liabilities 786,121 Net assets $ 40,101,368 Components of net assets
Units of
Participation NAV
per Unit Net
Assets Class R1 235,780 $ 17.1484 $ 4,043,252Class R2 39,940 $ 17.1292 684,131Class R3 111,875 $ 16.9729 1,898,843Class R4 88,458 $ 17.6904 1,564,857Class R5 41,574 $ 16.7853 697,841Class R6 27,012 $ 15.1726 409,839Class R7 3,935 $ 15.3219 60,295Class R8 12,959 $ 16.4486 213,159Class LifeStyle 30,529,151
$ 40,101,368
456

THE COLLECTIVE INVESTMENT FUNDS OF FIRST MERCANTILE TRUST COMPANY FMT Large Cap Fundamental Growth (Wellington) Fund
Statement of Operations For the Year Ended December 31, 2015
The accompanying notes are an integral part of these financial statements.
Investment income
Dividends (net of foreign withholding tax refunds of $2,392) $ 647,160Interest 153
647,313 Expenses
Trustee fees 270,885Sub-advisor fees 176,401Custody fees 55,731Audit fees 6,151
509,168 Net investment income 138,145 Net realized gain from investments sold
Proceeds from sales of investments 36,326,238Cost of investments sold 30,907,254
Net realized gain from investments sold 5,418,984 Change in net unrealized appreciation (depreciation) on investments (2,987,854) Net realized and unrealized gain on investments 2,431,130 Other operating credits (charges) 478 Net increase in net assets resulting from operations $ 2,569,753
457

THE COLLECTIVE INVESTMENT FUNDS OF FIRST MERCANTILE TRUST COMPANY FMT Large Cap Fundamental Growth (Wellington) Fund
Statement of Changes in Net Assets For the Year Ended December 31, 2015
The accompanying notes are an integral part of these financial statements.
Operations
Net investment income $ 138,145
Net realized gain from investments sold 5,418,984
Change in net unrealized appreciation (depreciation) on investments (2,987,854)
Other operating credits (charges) 478
Net increase in net assets resulting from operations 2,569,753 Participant transactions
Proceeds from units purchased 9,958,836Less payments for units redeemed 24,402,944
Decrease in net assets from participant transactions (14,444,108)
Total decrease in net assets (11,874,355) Net assets at beginning of year 51,975,723 Net assets at end of year $ 40,101,368
458
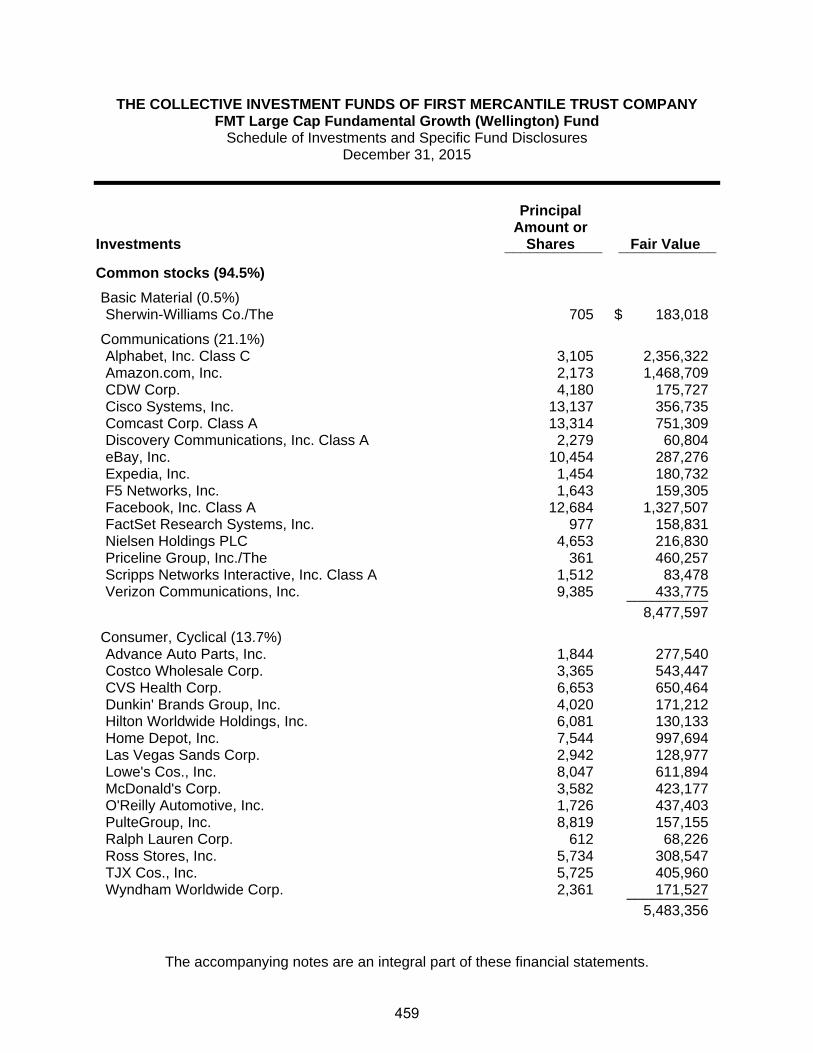
THE COLLECTIVE INVESTMENT FUNDS OF FIRST MERCANTILE TRUST COMPANY FMT Large Cap Fundamental Growth (Wellington) Fund
Schedule of Investments and Specific Fund Disclosures December 31, 2015
The accompanying notes are an integral part of these financial statements.
Investments
Principal Amount or
Shares Fair Value ____________ ____________
Common stocks (94.5%)
Basic Material (0.5%) Sherwin-Williams Co./The 705 $ 183,018
Communications (21.1%) Alphabet, Inc. Class C 3,105 2,356,322 Amazon.com, Inc. 2,173 1,468,709 CDW Corp. 4,180 175,727 Cisco Systems, Inc. 13,137 356,735 Comcast Corp. Class A 13,314 751,309 Discovery Communications, Inc. Class A 2,279 60,804 eBay, Inc. 10,454 287,276 Expedia, Inc. 1,454 180,732 F5 Networks, Inc. 1,643 159,305 Facebook, Inc. Class A 12,684 1,327,507 FactSet Research Systems, Inc. 977 158,831 Nielsen Holdings PLC 4,653 216,830 Priceline Group, Inc./The 361 460,257 Scripps Networks Interactive, Inc. Class A 1,512 83,478 Verizon Communications, Inc. 9,385 433,775 __________ 8,477,597
Consumer, Cyclical (13.7%) Advance Auto Parts, Inc. 1,844 277,540 Costco Wholesale Corp. 3,365 543,447 CVS Health Corp. 6,653 650,464 Dunkin' Brands Group, Inc. 4,020 171,212 Hilton Worldwide Holdings, Inc. 6,081 130,133 Home Depot, Inc. 7,544 997,694 Las Vegas Sands Corp. 2,942 128,977 Lowe's Cos., Inc. 8,047 611,894 McDonald's Corp. 3,582 423,177 O'Reilly Automotive, Inc. 1,726 437,403 PulteGroup, Inc. 8,819 157,155 Ralph Lauren Corp. 612 68,226 Ross Stores, Inc. 5,734 308,547 TJX Cos., Inc. 5,725 405,960 Wyndham Worldwide Corp. 2,361 171,527 __________ 5,483,356
459
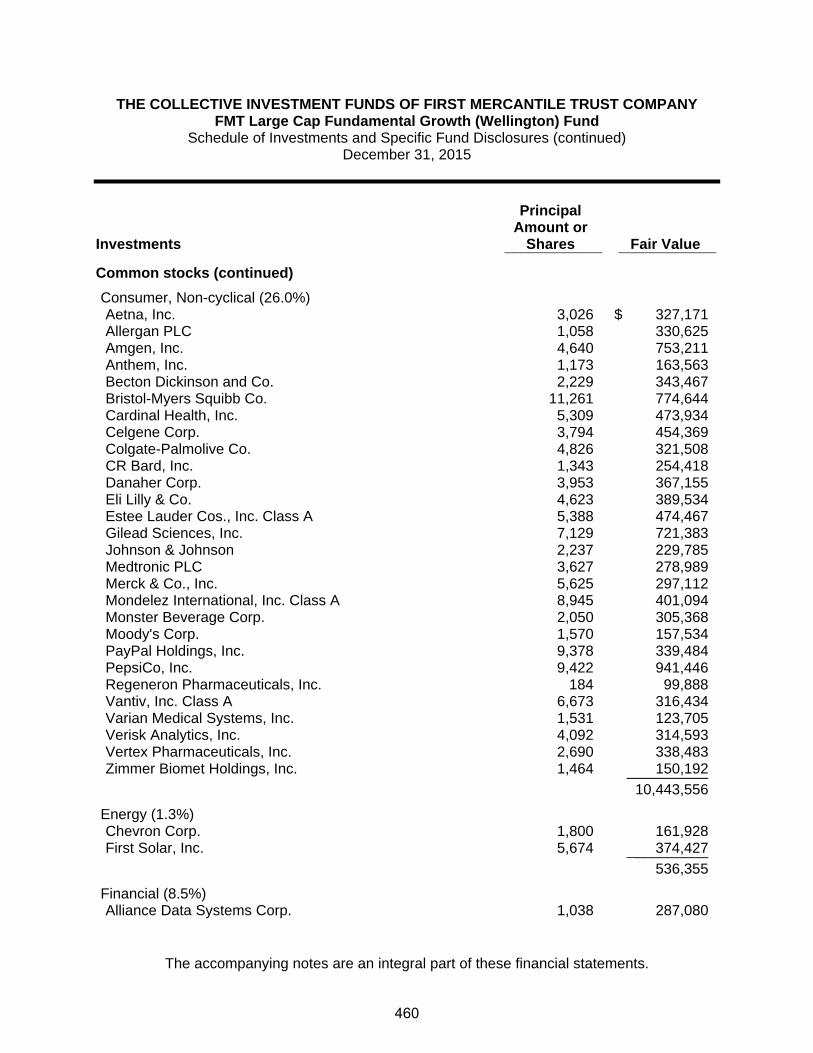
THE COLLECTIVE INVESTMENT FUNDS OF FIRST MERCANTILE TRUST COMPANY FMT Large Cap Fundamental Growth (Wellington) Fund
Schedule of Investments and Specific Fund Disclosures (continued) December 31, 2015
The accompanying notes are an integral part of these financial statements.
Investments
Principal Amount or
Shares Fair Value ____________ ____________
Common stocks (continued)
Consumer, Non-cyclical (26.0%) Aetna, Inc. 3,026 $ 327,171 Allergan PLC 1,058 330,625 Amgen, Inc. 4,640 753,211 Anthem, Inc. 1,173 163,563 Becton Dickinson and Co. 2,229 343,467 Bristol-Myers Squibb Co. 11,261 774,644 Cardinal Health, Inc. 5,309 473,934 Celgene Corp. 3,794 454,369 Colgate-Palmolive Co. 4,826 321,508 CR Bard, Inc. 1,343 254,418 Danaher Corp. 3,953 367,155 Eli Lilly & Co. 4,623 389,534 Estee Lauder Cos., Inc. Class A 5,388 474,467 Gilead Sciences, Inc. 7,129 721,383 Johnson & Johnson 2,237 229,785 Medtronic PLC 3,627 278,989 Merck & Co., Inc. 5,625 297,112 Mondelez International, Inc. Class A 8,945 401,094 Monster Beverage Corp. 2,050 305,368 Moody's Corp. 1,570 157,534 PayPal Holdings, Inc. 9,378 339,484 PepsiCo, Inc. 9,422 941,446 Regeneron Pharmaceuticals, Inc. 184 99,888 Vantiv, Inc. Class A 6,673 316,434 Varian Medical Systems, Inc. 1,531 123,705 Verisk Analytics, Inc. 4,092 314,593 Vertex Pharmaceuticals, Inc. 2,690 338,483 Zimmer Biomet Holdings, Inc. 1,464 150,192 __________ 10,443,556
Energy (1.3%) Chevron Corp. 1,800 161,928 First Solar, Inc. 5,674 374,427 __________ 536,355
Financial (8.5%) Alliance Data Systems Corp. 1,038 287,080
460

THE COLLECTIVE INVESTMENT FUNDS OF FIRST MERCANTILE TRUST COMPANY FMT Large Cap Fundamental Growth (Wellington) Fund
Schedule of Investments and Specific Fund Disclosures (continued) December 31, 2015
The accompanying notes are an integral part of these financial statements.
Investments
Principal Amount or
Shares Fair Value ____________ ____________
Common stocks (continued)
Financial (continued) American International Group, Inc. 5,648 $ 350,006 Bank of America Corp. 20,677 347,994 Goldman Sachs Group, Inc. 1,565 282,060 Intercontinental Exchange, Inc. 1,743 446,661 JPMorgan Chase & Co. 4,972 328,301 MasterCard, Inc. Class A 5,250 511,140 Visa, Inc. Class A 11,152 864,838 3,418,080
Industrial (2.5%) Boeing Co./The 3,388 489,871
Honeywell International, Inc. 3,610 373,888 Rockwell Automation, Inc. 1,224 125,594 __________ 989,353
Technology (20.9%) Activision Blizzard, Inc. 5,296 205,008 Amdocs Ltd. 3,318 181,063 Apple, Inc. 19,728 2,076,569 Broadcom Corp. Class A 2,305 133,275 Check Point Software Technologies Ltd. 7,184 584,634 Fiserv, Inc. 3,609 330,079 IHS, Inc. Class A 3,446 408,110 Intuit, Inc. 1,534 148,031 Jack Henry & Associates, Inc. 2,497 194,916 Linear Technology Corp. 6,308 267,901 Maxim Integrated Products, Inc. 8,441 320,758 Microsoft Corp. 23,806 1,320,757 Oracle Corp. 31,559 1,152,850 Paychex, Inc. 7,977 421,904 QUALCOMM, Inc. 3,162 158,053 salesforce.com, Inc. 5,973 468,283 __________ 8,372,191 __________ Total Common stocks (Cost $30,508,424) 37,903,506
461

THE COLLECTIVE INVESTMENT FUNDS OF FIRST MERCANTILE TRUST COMPANY FMT Large Cap Fundamental Growth (Wellington) Fund
Schedule of Investments and Specific Fund Disclosures (continued) December 31, 2015
The accompanying notes are an integral part of these financial statements.
Investments
Principal Amount or
Shares Fair Value ____________ ____________
Depository receipts (2.5%)
Communications (1.2%) Alibaba Group Holding Ltd. ADR 2,869 $ 233,164 Baidu, Inc. ADR 1,276 241,215 __________ 474,379
Consumer, Non-cyclical (0.9%) Anheuser-Busch InBev S.A. ADR 946 118,250 AstraZeneca PLC ADR 6,770 229,842 __________ 348,092
Energy (0.4%) BP PLC ADR 5,744 179,557 __________ Total Depository receipts (Cost $1,037,960) 1,002,028
Real estate investment trust (1.0%) Public Storage (Cost $321,514) 1,686 417,622 __________ Total Investments (Cost $31,867,898) $ 39,323,156 ____________________
462

THE COLLECTIVE INVESTMENT FUNDS OF FIRST MERCANTILE TRUST COMPANY FMT Large Cap Fundamental Growth (Wellington) Fund
Schedule of Investments and Specific Fund Disclosures (continued) December 31, 2015
The accompanying notes are an integral part of these financial statements.
Specific Fund Disclosures Fair value The inputs or methodology used for valuing securities may not be indicative of the risks associated with investing in those securities. For more information on valuation inputs, and their aggregation into the levels used in the table below, please refer to note 4 to the financial statements. The following table sets forth by level, within the fair value hierarchy, the Fund's investments measured at fair value.
Total Level 1 Level 2 Level 3
Common stocks $ 37,903,506 $ 37,903,506 $ — $ —Depository receipts 1,002,028 1,002,028 — —Real estate investment trust 417,622 417,622 — —__________ __________ __________ _________
$ 39,323,156 $ 39,323,156 $ — $ —__________ __________ __________ ___________________ __________ __________ _________ Investment transactions The aggregate cost of purchases of investment securities and proceeds from sales of investment securities (other than temporary cash investments) totaled $21,226,921 and $36,326,238, respectively, for the year ended December 31, 2015. Class-specific expenses Class-specific trustee fees for the year ended December 31, 2015 were as follows: Class R1 $ 10,710 Class R2 6,959 Class R3 17,391 Class R4 15,929 Class R5 7,187 Class R6 4,851 Class R7 1,125 Class R8 3,347 Class LifeStyle 203,386 $ 270,885
463

THE COLLECTIVE INVESTMENT FUNDS OF FIRST MERCANTILE TRUST COMPANY FMT Large Cap Fundamental Growth (Wellington) Fund
Schedule of Participant Transactions December 31, 2015
The accompanying notes are an integral part of these financial statements.
Participant transactions by class for the year ended December 31, 2015 were as follows: Dollars Units Purchases Redemptions Net change Purchases Redemptions Net change Class R1 $ 1,847,161 $ (1,254,030) $ 593,131 107,958 (75,424) 32,534Class R2 973,037 (1,514,630) (541,593) 57,788 (94,623) (36,835)Class R3 566,458 (1,450,650) (884,192) 34,783 (87,608) (52,825)Class R4 566,049 (635,511) (69,462) 33,342 (36,670) (3,328)Class R5 57,433 (299,654) (242,221) 3,482 (18,879) (15,397)Class R6 158,809 (174,834) (16,025) 10,925 (12,254) (1,329)Class R7 4,071 (263,730) (259,659) 276 (18,119) (17,843)Class R8 2,971 (4,875) (1,904) 185 (298) (113)Class LifeStyle 5,782,847 (18,805,030) (13,022,183) — — — $ 9,958,836 $ (24,402,944) $ (14,444,108) 248,739 (343,875) (95,136)
464

THE COLLECTIVE INVESTMENT FUNDS OF FIRST MERCANTILE TRUST COMPANY FMT Large Cap Fundamental Growth (Wellington) Fund
Financial Highlights December 31, 2015
The accompanying notes are an integral part of these financial statements.
Change in Net Asset Value Resulting from Operations Ratios (to average net
assets)
NAV per Unit, Beginning of
Period
Net Investment
Income (Loss)(a)
Net Realized and Unrealized
Gain (Loss) from
Investments(a)
Total from Investment Activities
NAV per Unit, End of
Period Total
Return Expenses
Net Investment
Income (Loss)
Class R1 $ 16.0970 $ 0.0975 $ 0.9539 $ 1.0514 $ 17.1484 6.53% (0.88)% 0.58%Class R2 16.1144 0.0580 0.9568 1.0148 17.1292 6.30% (1.12)% 0.35%Class R3 15.9947 0.0306 0.9476 0.9782 16.9729 6.12% (1.28)% 0.19%Class R4 16.6992 0.0032 0.9880 0.9912 17.6904 5.94% (1.45)% 0.02%Class R5 15.8719 (0.0244) 0.9378 0.9134 16.7853 5.75% (1.61)% (0.15)%Class R6 14.3713 (0.0473) 0.8486 0.8013 15.1726 5.58% (1.78)% (0.32)%Class R7 14.5385 (0.0739) 0.8573 0.7834 15.3219 5.39% (1.96)% (0.50)%Class R8 15.6333 (0.1062) 0.9215 0.8153 16.4486 5.22% (2.12)% (0.66)%
(a) Per unit amounts are based on average daily units outstanding.
465
FMT Large Cap GARP (Argent) Fund
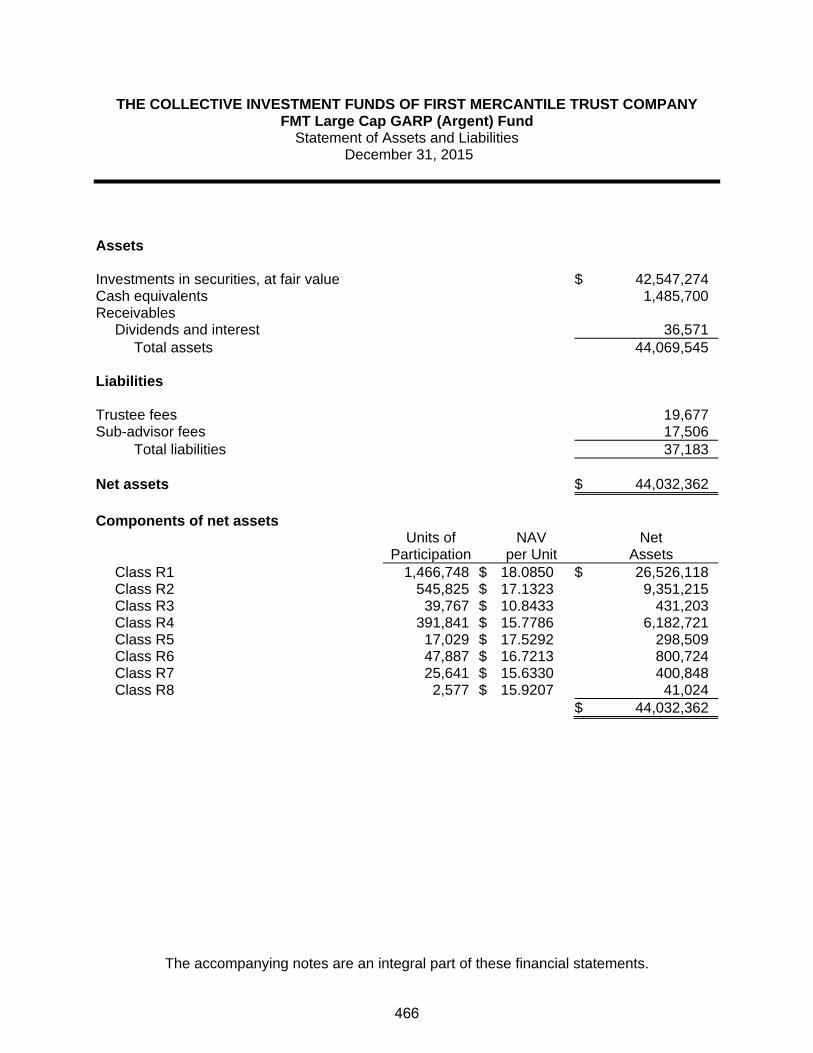
THE COLLECTIVE INVESTMENT FUNDS OF FIRST MERCANTILE TRUST COMPANY FMT Large Cap GARP (Argent) Fund
Statement of Assets and Liabilities December 31, 2015
The accompanying notes are an integral part of these financial statements.
Assets Investments in securities, at fair value $ 42,547,274 Cash equivalents 1,485,700Receivables
Dividends and interest 36,571Total assets 44,069,545
Liabilities Trustee fees 19,677Sub-advisor fees 17,506
Total liabilities 37,183 Net assets $ 44,032,362 Components of net assets
Units of
Participation NAV
per Unit Net
Assets Class R1 1,466,748 $ 18.0850 $ 26,526,118Class R2 545,825 $ 17.1323 9,351,215Class R3 39,767 $ 10.8433 431,203Class R4 391,841 $ 15.7786 6,182,721Class R5 17,029 $ 17.5292 298,509Class R6 47,887 $ 16.7213 800,724Class R7 25,641 $ 15.6330 400,848Class R8 2,577 $ 15.9207 41,024
$ 44,032,362
466
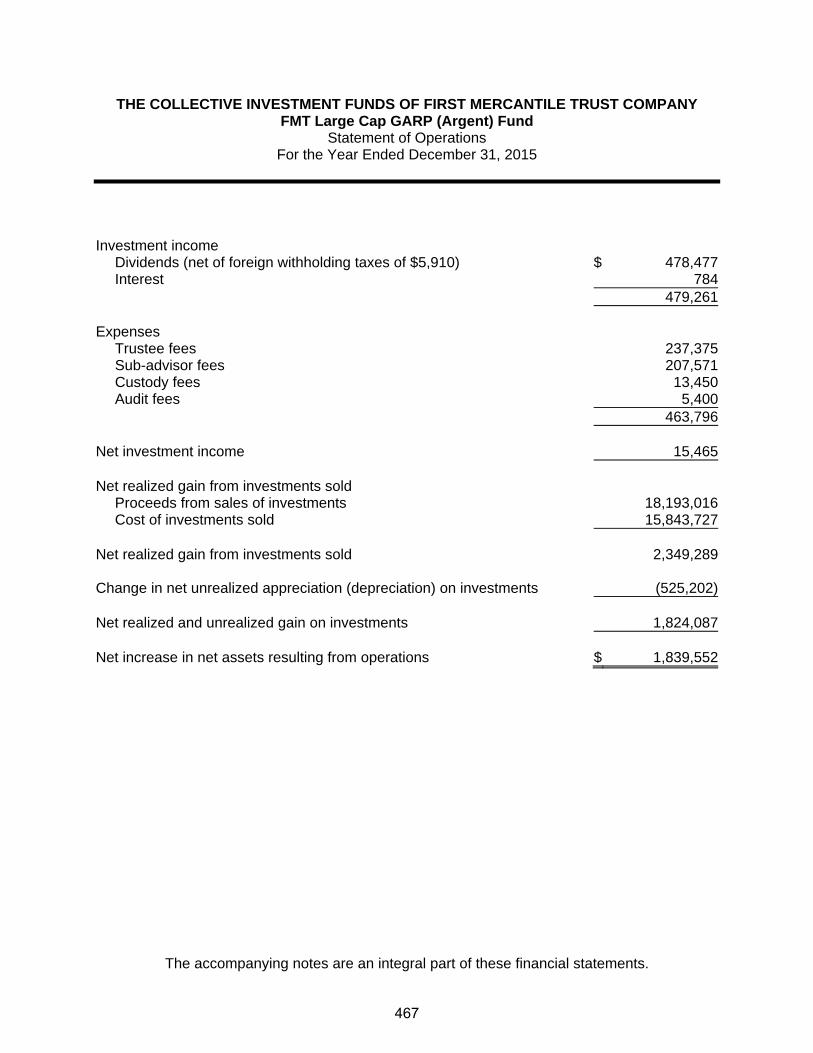
THE COLLECTIVE INVESTMENT FUNDS OF FIRST MERCANTILE TRUST COMPANY FMT Large Cap GARP (Argent) Fund
Statement of Operations For the Year Ended December 31, 2015
The accompanying notes are an integral part of these financial statements.
Investment income
Dividends (net of foreign withholding taxes of $5,910) $ 478,477Interest 784
479,261 Expenses
Trustee fees 237,375Sub-advisor fees 207,571Custody fees 13,450Audit fees 5,400
463,796 Net investment income 15,465 Net realized gain from investments sold
Proceeds from sales of investments 18,193,016Cost of investments sold 15,843,727
Net realized gain from investments sold 2,349,289 Change in net unrealized appreciation (depreciation) on investments (525,202) Net realized and unrealized gain on investments 1,824,087 Net increase in net assets resulting from operations $ 1,839,552
467

THE COLLECTIVE INVESTMENT FUNDS OF FIRST MERCANTILE TRUST COMPANY FMT Large Cap GARP (Argent) Fund
Statement of Changes in Net Assets For the Year Ended December 31, 2015
The accompanying notes are an integral part of these financial statements.
Operations
Net investment income $ 15,465
Net realized gain from investments sold 2,349,289
Change in net unrealized appreciation (depreciation) on investments (525,202)
Net increase in net assets resulting from operations 1,839,552 Participant transactions
Proceeds from units purchased 6,863,350Less payments for units redeemed 8,932,165
Decrease in net assets from participant transactions (2,068,815)
Total decrease in net assets (229,263) Net assets at beginning of year 44,261,625 Net assets at end of year $ 44,032,362
468

THE COLLECTIVE INVESTMENT FUNDS OF FIRST MERCANTILE TRUST COMPANY FMT Large Cap GARP (Argent) Fund
Schedule of Investments and Specific Fund Disclosures December 31, 2015
The accompanying notes are an integral part of these financial statements.
Investments
Principal Amount or
Shares Fair Value ____________ ____________
Common stocks (93.2%)
Basic Material (3.3%) Dow Chemical Co./The 27,900 $ 1,436,292
Communications (21.6%) Alphabet, Inc. Class C 1,675 1,271,124 Alphabet, Inc. Class A 2,290 1,781,643 CBS Corp. Class B 29,050 1,369,127 Ciena Corp. 47,900 991,051 Expedia, Inc. 12,900 1,603,470 LinkedIn Corp. Class A 6,490 1,460,769 TEGNA, Inc. 40,450 1,032,284 __________ 9,509,468
Consumer, Cyclical (8.0%) Darden Restaurants, Inc. 16,750 1,065,970 Lowe's Cos., Inc. 19,150 1,456,166 Tempur Sealy International, Inc. 14,500 1,021,670 __________ 3,543,806
Consumer, Non-cyclical (26.0%) Allergan PLC 4,650 1,453,125 Baxter International, Inc. 30,200 1,152,130 Boston Scientific Corp. 61,000 1,124,840 ConAgra Foods, Inc. 40,300 1,699,048 Danaher Corp. 19,600 1,820,448 Hain Celestial Group, Inc. 21,700 876,463 Post Holdings, Inc. 36,150 2,230,455 Procter & Gamble Co./The 13,950 1,107,769 __________ 11,464,278
Energy (2.1%) Schlumberger Ltd. 13,200 920,700
Financial (14.1%) E*TRADE Financial Corp. 30,550 905,502 JPMorgan Chase & Co. 22,150 1,462,564 Lincoln National Corp. 27,200 1,367,072 MasterCard, Inc. Class A 12,950 1,260,812 SunTrust Banks, Inc. 28,400 1,216,656 __________ 6,212,606
469

THE COLLECTIVE INVESTMENT FUNDS OF FIRST MERCANTILE TRUST COMPANY FMT Large Cap GARP (Argent) Fund
Schedule of Investments and Specific Fund Disclosures (continued) December 31, 2015
The accompanying notes are an integral part of these financial statements.
Investments
Principal Amount or
Shares Fair Value ____________ ____________
Common stocks (continued)
Industrial (4.8%) CH Robinson Worldwide, Inc. 19,950 $ 1,237,299 Masco Corp. 31,000 877,300 2,114,599
Technology (13.3%) Electronic Arts, Inc. 26,150 1,797,028
ON Semiconductor Corp. 130,100 1,274,980 Red Hat, Inc. 15,150 1,254,572 Skyworks Solutions, Inc. 19,900 1,528,917 __________ 5,855,497 __________ Total Common stocks (Cost $30,216,580) 41,057,246
Depository receipt (3.4%)
Consumer, Non-cyclical (3.4%)
Teva Pharmaceutical Industries Ltd. ADR (Cost $1,201,441) 22,700 1,490,028 __________
Total Investments (Cost $31,418,021) $ 42,547,274 ____________________
470

THE COLLECTIVE INVESTMENT FUNDS OF FIRST MERCANTILE TRUST COMPANY FMT Large Cap GARP (Argent) Fund
Schedule of Investments and Specific Fund Disclosures (continued) December 31, 2015
The accompanying notes are an integral part of these financial statements.
Specific Fund Disclosures Fair value The inputs or methodology used for valuing securities may not be indicative of the risks associated with investing in those securities. For more information on valuation inputs, and their aggregation into the levels used in the table below, please refer to note 4 to the financial statements. The following table sets forth by level, within the fair value hierarchy, the Fund's investments measured at fair value.
Total Level 1 Level 2 Level 3
Common stocks $ 41,057,246 $ 41,057,246 $ — $ —Depository receipt 1,490,028 1,490,028 — —__________ __________ __________ _________
$ 42,547,274 $ 42,547,274 $ — $ —__________ __________ __________ ___________________ __________ __________ _________ Investment transactions The aggregate cost of purchases of investment securities and proceeds from sales of investment securities (other than temporary cash investments) totaled $15,066,373 and $18,193,016, respectively, for the year ended December 31, 2015. Class-specific expenses Class-specific trustee fees for the year ended December 31, 2015 were as follows: Class R1 $ 95,678 Class R2 53,947 Class R3 5,259 Class R4 54,727 Class R5 10,369 Class R6 10,891 Class R7 5,881 Class R8 623 $ 237,375
471

THE COLLECTIVE INVESTMENT FUNDS OF FIRST MERCANTILE TRUST COMPANY FMT Large Cap GARP (Argent) Fund Schedule of Participant Transactions
December 31, 2015
The accompanying notes are an integral part of these financial statements.
Participant transactions by class for the year ended December 31, 2015 were as follows: Dollars Units Purchases Redemptions Net change Purchases Redemptions Net change Class R1 $ 4,015,458 $ (4,110,301) $ (94,843) 220,608 (226,767) (6,159)Class R2 1,361,475 (1,424,426) (62,951) 79,604 (83,469) (3,865)Class R3 76,599 (457,945) (381,346) 6,959 (43,142) (36,183)Class R4 1,170,489 (1,559,835) (389,346) 73,750 (101,310) (27,560)Class R5 48,739 (950,551) (901,812) 2,767 (53,126) (50,359)Class R6 134,619 (176,434) (41,815) 7,972 (10,334) (2,362)Class R7 50,622 (38,005) 12,617 3,172 (2,509) 663Class R8 5,349 (214,668) (209,319) 334 (13,913) (13,579) $ 6,863,350 $ (8,932,165) $ (2,068,815) 395,166 (534,570) (139,404)
472

THE COLLECTIVE INVESTMENT FUNDS OF FIRST MERCANTILE TRUST COMPANY FMT Large Cap GARP (Argent) Fund
Financial Highlights December 31, 2015
The accompanying notes are an integral part of these financial statements.
Change in Net Asset Value Resulting from Operations Ratios (to average net
assets)
NAV per Unit, Beginning of
Period
Net Investment
Income (Loss)(a)
Net Realized and Unrealized
Gain (Loss) from
Investments(a)
Total from Investment Activities
NAV per Unit, End of
Period Total
Return Expenses
Net Investment
Income (Loss)
Class R1 $ 17.3074 $ 0.0367 $ 0.7409 $ 0.7776 $ 18.0850 4.49% (0.84)% 0.20%Class R2 16.4318 (0.0031) 0.7036 0.7005 17.1323 4.26% (1.06)% (0.02)%Class R3 10.4177 (0.0205) 0.4461 0.4256 10.8433 4.09% (1.24)% (0.19)%Class R4 15.1852 (0.0571) 0.6505 0.5934 15.7786 3.91% (1.40)% (0.36)%Class R5 16.8986 (0.0931) 0.7237 0.6306 17.5292 3.73% (1.58)% (0.53)%Class R6 16.1473 (0.1179) 0.6919 0.5740 16.7213 3.55% (1.74)% (0.70)%Class R7 15.1221 (0.1373) 0.6482 0.5109 15.6330 3.38% (1.91)% (0.87)%Class R8 15.4265 (0.1676) 0.6618 0.4942 15.9207 3.20% (2.08)% (1.04)%
(a) Per unit amounts are based on average daily units outstanding.
473
FMT Large Cap Intrinsic Value (MetWest) Fund

THE COLLECTIVE INVESTMENT FUNDS OF FIRST MERCANTILE TRUST COMPANY FMT Large Cap Intrinsic Value (MetWest) Fund
Statement of Assets and Liabilities December 31, 2015
The accompanying notes are an integral part of these financial statements.
Assets Investments in securities, at fair value $ 157,609,430 Cash equivalents 5,288,031
Receivables
Dividends and interest 170,670
Dividend tax reclaim 53,009
Total assets 163,121,140
Liabilities Investments purchased 318,400
Trustee fees 70,962
Sub-advisor fees 52,683
Total liabilities 442,045
Net assets $ 162,679,095
Components of net assets
Units of
Participation NAV
per Unit Net
Assets Class R1 3,024,420 $ 18.4507 $ 55,802,705
Class R2 769,377 $ 17.0944 13,152,033
Class R3 1,311,411 $ 16.7297 21,939,558
Class R4 882,070 $ 16.6148 14,655,426
Class R5 528,986 $ 17.3776 9,192,482
Class R6 337,804 $ 16.6179 5,613,608
Class R7 184,592 $ 16.5145 3,048,452
Class R8 160,345 $ 16.4688 2,640,689
Class LifeStyle 36,634,142
$ 162,679,095
474

THE COLLECTIVE INVESTMENT FUNDS OF FIRST MERCANTILE TRUST COMPANY FMT Large Cap Intrinsic Value (MetWest) Fund
Statement of Operations For the Year Ended December 31, 2015
The accompanying notes are an integral part of these financial statements.
Investment income
Dividends (net of foreign withholding taxes of $11,700) $ 3,627,788
Interest 3,431
3,631,219
Expenses
Trustee fees 1,140,742
Sub-advisor fees 663,385
Custody fees 23,820
Audit fees 6,336
1,834,283
Net investment income 1,796,936
Net realized gain from investments sold
Proceeds from sales of investments 86,766,778
Cost of investments sold 61,891,522
Net realized gain from investments sold 24,875,256
Change in net unrealized appreciation (depreciation) on investments (27,955,140)
Net realized and unrealized loss on investments (3,079,884)
Other operating credits (charges) (650)
Net decrease in net assets resulting from operations $ (1,283,598)
475

THE COLLECTIVE INVESTMENT FUNDS OF FIRST MERCANTILE TRUST COMPANY FMT Large Cap Intrinsic Value (MetWest) Fund
Statement of Changes in Net Assets For the Year Ended December 31, 2015
The accompanying notes are an integral part of these financial statements.
Operations
Net investment income $ 1,796,936
Net realized gain from investments sold 24,875,256
Change in net unrealized appreciation (depreciation) on investments (27,955,140)
Other operating credits (charges) (650)
Net decrease in net assets resulting from operations (1,283,598)
Participant transactions
Proceeds from units purchased 53,441,087
Less payments for units redeemed 78,002,892
Decrease in net assets from participant transactions (24,561,805)
Total decrease in net assets (25,845,403)
Net assets at beginning of year 188,524,498
Net assets at end of year $ 162,679,095
476

THE COLLECTIVE INVESTMENT FUNDS OF FIRST MERCANTILE TRUST COMPANY FMT Large Cap Intrinsic Value (MetWest) Fund
Schedule of Investments and Specific Fund Disclosures December 31, 2015
The accompanying notes are an integral part of these financial statements.
Investments
Principal Amount or
Shares Fair Value ____________ ____________
Common stocks (91.1%)
Communications (11.6%) Alphabet, Inc. Class C 5,380 $ 4,082,774 Cisco Systems, Inc. 132,519 3,598,554 Motorola Solutions, Inc. 58,728 4,019,932 Verizon Communications, Inc. 66,429 3,070,348 Walt Disney Co. 38,727 4,069,433 __________ 18,841,041
Consumer, Cyclical (4.6%) Marriott International, Inc. Class A 46,707 3,131,237 TJX Cos., Inc. 62,379 4,423,295 __________ 7,554,532
Consumer, Non-cyclical (18.7%) Abbott Laboratories 92,107 4,136,525 Cigna Corp. 28,125 4,115,531 Express Scripts Holding Co. 43,525 3,804,520 Gilead Sciences, Inc. 38,163 3,861,714 Merck & Co., Inc. 69,869 3,690,481 PepsiCo, Inc. 37,601 3,757,092 Procter & Gamble Co./The 48,914 3,884,261 Western Union Co. 178,688 3,200,302 __________ 30,450,426
Energy (6.2%) EOG Resources, Inc. 47,075 3,332,439 FMC Technologies, Inc. 75,434 2,188,341 Occidental Petroleum Corp. 23,407 1,582,547 Schlumberger Ltd. 41,614 2,902,577 __________ 10,005,904
Financial (21.4%) AerCap Holdings N.V. 91,548 3,951,212 Allstate Corp. 61,688 3,830,208 BB&T Corp. 137,136 5,185,112 Charles Schwab Corp./The 92,643 3,050,734 CIT Group, Inc. 91,270 3,623,419 Goldman Sachs Group, Inc. 26,600 4,794,118 SunTrust Banks, Inc. 92,084 3,944,878 Synchrony Financial 112,769 3,429,305
477

THE COLLECTIVE INVESTMENT FUNDS OF FIRST MERCANTILE TRUST COMPANY FMT Large Cap Intrinsic Value (MetWest) Fund
Schedule of Investments and Specific Fund Disclosures (continued) December 31, 2015
The accompanying notes are an integral part of these financial statements.
Investments
Principal Amount or
Shares Fair Value Common stocks (continued)
Financial (continued) UBS Group AG 155,575 $ 3,013,488 __________ 34,822,474
Industrial (12.4%) Boeing Co./The 26,209 3,789,559 Honeywell International, Inc. 40,972 4,243,470 Lockheed Martin Corp. 22,190 4,818,559 Sensata Technologies Holding N.V. 85,916 3,957,291 United Parcel Service, Inc. Class B 34,749 3,343,896 __________ 20,152,775
Technology (11.9%) Accenture PLC Class A 37,459 3,914,466 Apple, Inc. 28,843 3,036,014 Microsoft Corp. 87,787 4,870,423 Oracle Corp. 91,848 3,355,207 QUALCOMM, Inc. 15,448 772,168 Texas Instruments, Inc. 63,659 3,489,150 __________ 19,437,428
Utilities (4.3%) NextEra Energy, Inc. 38,989 4,050,567 WEC Energy Group, Inc. 57,365 2,943,398 __________ 6,993,965 __________ Total Common stocks (Cost $126,399,062) 148,258,545
Depository receipts (3.9%)
Consumer, Non-cyclical (3.9%) Anheuser-Busch InBev S.A. ADR 37,761 4,720,125 Diageo PLC ADR 14,824 1,616,854 __________ Total Depository receipts (Cost $4,983,219) 6,336,979
Real estate investment trust (1.9%) Crown Castle International Corp. (Cost $2,727,309) 34,863 3,013,906 __________ Total Investments (Cost $134,109,590) $ 157,609,430 __________ __________
478
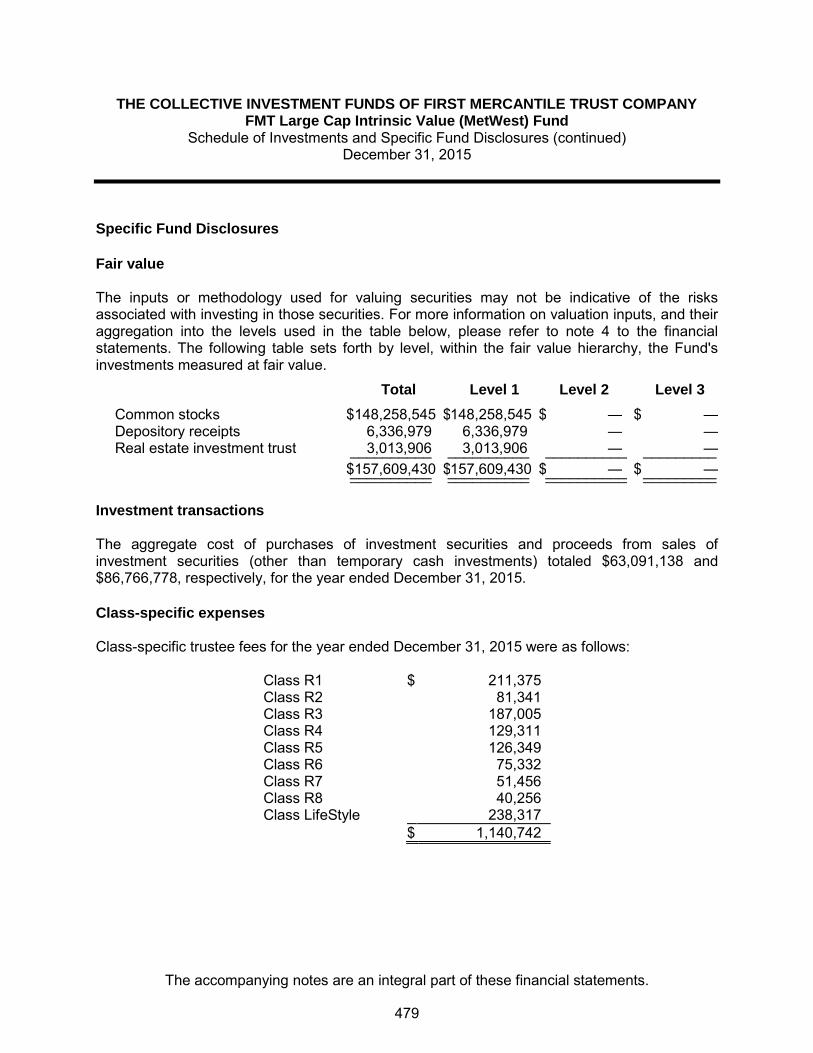
THE COLLECTIVE INVESTMENT FUNDS OF FIRST MERCANTILE TRUST COMPANY FMT Large Cap Intrinsic Value (MetWest) Fund
Schedule of Investments and Specific Fund Disclosures (continued) December 31, 2015
The accompanying notes are an integral part of these financial statements.
Specific Fund Disclosures Fair value The inputs or methodology used for valuing securities may not be indicative of the risks associated with investing in those securities. For more information on valuation inputs, and their aggregation into the levels used in the table below, please refer to note 4 to the financial statements. The following table sets forth by level, within the fair value hierarchy, the Fund's investments measured at fair value.
Total Level 1 Level 2 Level 3
Common stocks $ 148,258,545 $ 148,258,545 $ — $ — Depository receipts 6,336,979 6,336,979 — — Real estate investment trust 3,013,906 3,013,906 — — __________ __________ __________ _________
$ 157,609,430 $ 157,609,430 $ — $ — __________ __________ __________ _________ __________ __________ __________ _________ Investment transactions The aggregate cost of purchases of investment securities and proceeds from sales of investment securities (other than temporary cash investments) totaled $63,091,138 and $86,766,778, respectively, for the year ended December 31, 2015. Class-specific expenses Class-specific trustee fees for the year ended December 31, 2015 were as follows: Class R1 $ 211,375 Class R2 81,341 Class R3 187,005 Class R4 129,311 Class R5 126,349 Class R6 75,332 Class R7 51,456 Class R8 40,256 Class LifeStyle 238,317 $ 1,140,742
479
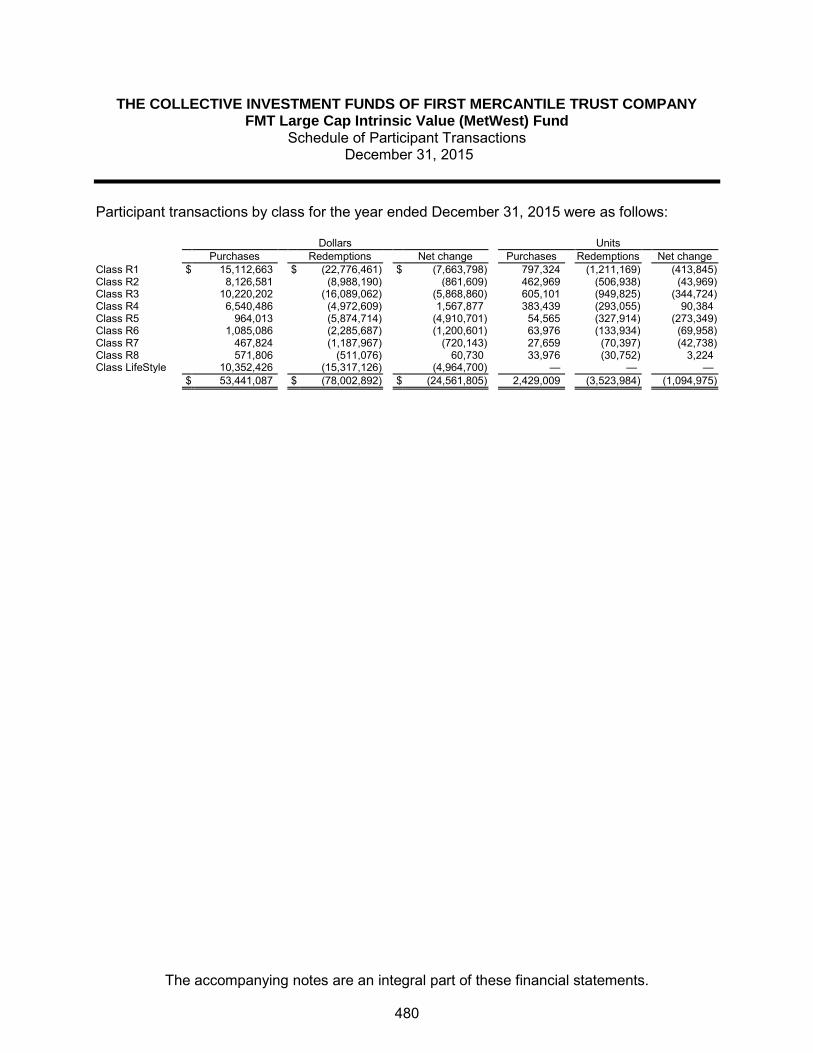
THE COLLECTIVE INVESTMENT FUNDS OF FIRST MERCANTILE TRUST COMPANY FMT Large Cap Intrinsic Value (MetWest) Fund
Schedule of Participant Transactions December 31, 2015
The accompanying notes are an integral part of these financial statements.
Participant transactions by class for the year ended December 31, 2015 were as follows: Dollars Units Purchases Redemptions Net change Purchases Redemptions Net change Class R1 $ 15,112,663 $ (22,776,461) $ (7,663,798) 797,324 (1,211,169) (413,845) Class R2 8,126,581 (8,988,190) (861,609) 462,969 (506,938) (43,969) Class R3 10,220,202 (16,089,062) (5,868,860) 605,101 (949,825) (344,724) Class R4 6,540,486 (4,972,609) 1,567,877 383,439 (293,055) 90,384 Class R5 964,013 (5,874,714) (4,910,701) 54,565 (327,914) (273,349) Class R6 1,085,086 (2,285,687) (1,200,601) 63,976 (133,934) (69,958) Class R7 467,824 (1,187,967) (720,143) 27,659 (70,397) (42,738) Class R8 571,806 (511,076) 60,730 33,976 (30,752) 3,224 Class LifeStyle 10,352,426 (15,317,126) (4,964,700) — — — $ 53,441,087 $ (78,002,892) $ (24,561,805) 2,429,009 (3,523,984) (1,094,975)
480

THE COLLECTIVE INVESTMENT FUNDS OF FIRST MERCANTILE TRUST COMPANY FMT Large Cap Intrinsic Value (MetWest) Fund
Financial Highlights December 31, 2015
The accompanying notes are an integral part of these financial statements.
Change in Net Asset Value Resulting from Operations Ratios (to average net
assets)
NAV per Unit, Beginning of
Period
Net Investment
Income (Loss)(a)
Net Realized and Unrealized
Gain (Loss) from
Investments(a)
Total from Investment Activities
NAV per Unit, End of
Period Total
Return Expenses
Net Investment
Income (Loss)
Class R1 $ 18.5643 $ 0.2429 $ (0.3565) $ (0.1136) $ 18.4507 (0.61) % (0.74) % 1.30 % Class R2 17.2377 0.1871 (0.3304) (0.1433) 17.0944 (0.83) % (0.96) % 1.07 % Class R3 16.8988 0.1536 (0.3227) (0.1691) 16.7297 (1.00) % (1.13) % 0.90 % Class R4 16.8114 0.1250 (0.3216) (0.1966) 16.6148 (1.17) % (1.30) % 0.74 % Class R5 17.6132 0.0998 (0.3354) (0.2356) 17.3776 (1.34) % (1.47) % 0.56 % Class R6 16.8720 0.0669 (0.3210) (0.2541) 16.6179 (1.51) % (1.64) % 0.39 % Class R7 16.7957 0.0378 (0.3190) (0.2812) 16.5145 (1.67) % (1.81) % 0.22 % Class R8 16.7779 0.0101 (0.3192) (0.3091) 16.4688 (1.84) % (1.98) % 0.06 % (a) Per unit amounts are based on average daily units outstanding.
481
FMT Large Cap Opportunities (Smith Group) Fund

THE COLLECTIVE INVESTMENT FUNDS OF FIRST MERCANTILE TRUST COMPANY FMT Large Cap Opportunities (Smith Group) Fund
Statement of Assets and Liabilities December 31, 2015
The accompanying notes are an integral part of these financial statements.
Assets Investments in securities, at fair value $ 46,634,674 Cash equivalents 941,413Receivables
Dividends and interest 14,676Total assets 47,590,763
Liabilities Sub-advisor fees 16,455Trustee fees 13,923
Total liabilities 30,378 Net assets $ 47,560,385 Components of net assets
Units of
Participation NAV
per Unit Net
Assets Class R1 591,612 $ 15.9481 $ 9,435,110Class R2 7,488 $ 10.2392 76,669Class R3 238,191 $ 16.9866 4,046,048Class R4 97,531 $ 16.5919 1,618,223Class R5 230,373 $ 16.2512 3,743,841Class R6 144,886 $ 16.5686 2,400,553Class R7 11,359 $ 17.3241 196,783Class R8 34,761 $ 17.0793 593,688Class LifeStyle 25,449,470
$ 47,560,385
482

THE COLLECTIVE INVESTMENT FUNDS OF FIRST MERCANTILE TRUST COMPANY FMT Large Cap Opportunities (Smith Group) Fund
Statement of Operations For the Year Ended December 31, 2015
The accompanying notes are an integral part of these financial statements.
Investment income
Dividends $ 875,051Interest 492
875,543 Expenses
Trustee fees 342,052Sub-advisor fees 210,305Custody fees 13,421Audit fees 6,081
571,859 Net investment income 303,684 Net realized gain from investments sold
Proceeds from sales of investments 34,008,429Cost of investments sold 27,897,946
Net realized gain from investments sold 6,110,483 Change in net unrealized appreciation (depreciation) on investments (5,312,686) Net realized and unrealized gain on investments 797,797 Other operating credits (charges) 1,789 Net increase in net assets resulting from operations $ 1,103,270
483

THE COLLECTIVE INVESTMENT FUNDS OF FIRST MERCANTILE TRUST COMPANY FMT Large Cap Opportunities (Smith Group) Fund
Statement of Changes in Net Assets For the Year Ended December 31, 2015
The accompanying notes are an integral part of these financial statements.
Operations
Net investment income $ 303,684
Net realized gain from investments sold 6,110,483
Change in net unrealized appreciation (depreciation) on investments (5,312,686)
Other operating credits (charges) 1,789
Net increase in net assets resulting from operations 1,103,270 Participant transactions
Proceeds from units purchased 12,261,702Less payments for units redeemed 22,552,171
Decrease in net assets from participant transactions (10,290,469)
Total decrease in net assets (9,187,199) Net assets at beginning of year 56,747,584 Net assets at end of year $ 47,560,385
484
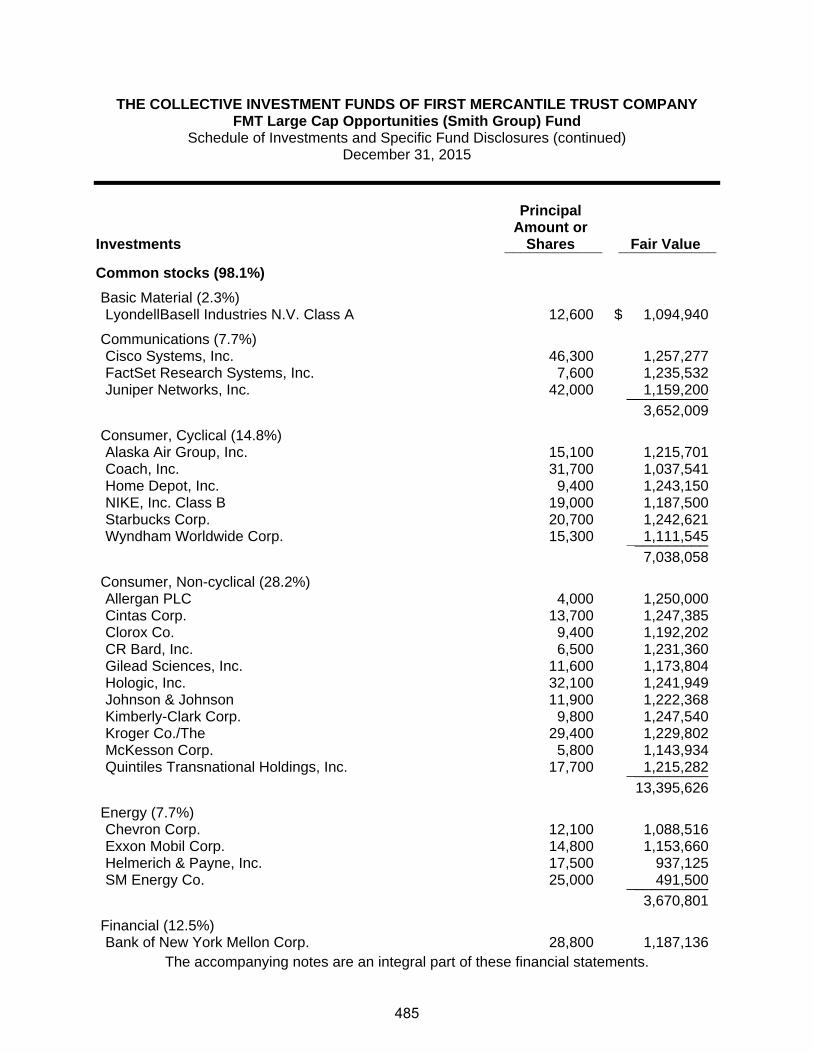
THE COLLECTIVE INVESTMENT FUNDS OF FIRST MERCANTILE TRUST COMPANY FMT Large Cap Opportunities (Smith Group) Fund
Schedule of Investments and Specific Fund Disclosures (continued) December 31, 2015
The accompanying notes are an integral part of these financial statements.
Investments
Principal Amount or
Shares Fair Value ____________ ____________
Common stocks (98.1%)
Basic Material (2.3%) LyondellBasell Industries N.V. Class A 12,600 $ 1,094,940
Communications (7.7%) Cisco Systems, Inc. 46,300 1,257,277 FactSet Research Systems, Inc. 7,600 1,235,532 Juniper Networks, Inc. 42,000 1,159,200 __________ 3,652,009
Consumer, Cyclical (14.8%) Alaska Air Group, Inc. 15,100 1,215,701 Coach, Inc. 31,700 1,037,541 Home Depot, Inc. 9,400 1,243,150 NIKE, Inc. Class B 19,000 1,187,500 Starbucks Corp. 20,700 1,242,621 Wyndham Worldwide Corp. 15,300 1,111,545 __________ 7,038,058
Consumer, Non-cyclical (28.2%) Allergan PLC 4,000 1,250,000 Cintas Corp. 13,700 1,247,385 Clorox Co. 9,400 1,192,202 CR Bard, Inc. 6,500 1,231,360 Gilead Sciences, Inc. 11,600 1,173,804 Hologic, Inc. 32,100 1,241,949 Johnson & Johnson 11,900 1,222,368 Kimberly-Clark Corp. 9,800 1,247,540 Kroger Co./The 29,400 1,229,802 McKesson Corp. 5,800 1,143,934 Quintiles Transnational Holdings, Inc. 17,700 1,215,282 __________ 13,395,626
Energy (7.7%) Chevron Corp. 12,100 1,088,516 Exxon Mobil Corp. 14,800 1,153,660 Helmerich & Payne, Inc. 17,500 937,125 SM Energy Co. 25,000 491,500 __________ 3,670,801
Financial (12.5%) Bank of New York Mellon Corp. 28,800 1,187,136
485

THE COLLECTIVE INVESTMENT FUNDS OF FIRST MERCANTILE TRUST COMPANY FMT Large Cap Opportunities (Smith Group) Fund
Schedule of Investments and Specific Fund Disclosures (continued) December 31, 2015
The accompanying notes are an integral part of these financial statements.
Investments
Principal Amount or
Shares Fair Value ____________ ____________
Common stocks (continued)
Financial (continued) Discover Financial Services 21,700 $ 1,163,554 Intercontinental Exchange, Inc. 5,000 1,281,300 Travelers Cos., Inc. 10,900 1,230,174 Voya Financial, Inc. 29,100 1,074,081 __________ 5,936,245
Industrial (12.4%) Boeing Co./The 8,500 1,229,015 CH Robinson Worldwide, Inc. 17,800 1,103,956 General Dynamics Corp. 8,900 1,222,504 Gentex Corp. 74,800 1,197,548 Jabil Circuit, Inc. 49,100 1,143,539 __________ 5,896,562
Technology (12.5%) Apple, Inc. 10,900 1,147,334 Aspen Technology, Inc. 30,100 1,136,576 Citrix Systems, Inc. 15,000 1,134,750 Microsoft Corp. 22,200 1,231,656 Red Hat, Inc. 15,700 1,300,117 __________ 5,950,433 __________Total Investments (Cost $39,080,044) $ 46,634,674 ____________________
486

THE COLLECTIVE INVESTMENT FUNDS OF FIRST MERCANTILE TRUST COMPANY FMT Large Cap Opportunities (Smith Group) Fund
Schedule of Investments and Specific Fund Disclosures (continued) December 31, 2015
The accompanying notes are an integral part of these financial statements.
Specific Fund Disclosures Fair value The inputs or methodology used for valuing securities may not be indicative of the risks associated with investing in those securities. For more information on valuation inputs, and their aggregation into the levels used in the table below, please refer to note 4 to the financial statements. The following table sets forth by level, within the fair value hierarchy, the Fund's investments measured at fair value.
Total Level 1 Level 2 Level 3
Common stocks $ 46,634,674 $ 46,634,674 $ — $ —__________ __________ __________ ___________________ __________ __________ _________ Investment transactions The aggregate cost of purchases of investment securities and proceeds from sales of investment securities (other than temporary cash investments) totaled $24,195,799 and $34,008,429, respectively, for the year ended December 31, 2015. Class-specific expenses Class-specific trustee fees for the year ended December 31, 2015 were as follows: Class R1 $ 36,962 Class R2 476 Class R3 30,201 Class R4 19,049 Class R5 42,977 Class R6 30,654 Class R7 2,836 Class R8 9,389 Class LifeStyle 169,508 $ 342,052
487

THE COLLECTIVE INVESTMENT FUNDS OF FIRST MERCANTILE TRUST COMPANY FMT Large Cap Opportunities (Smith Group) Fund
Schedule of Participant Transactions December 31, 2015
The accompanying notes are an integral part of these financial statements.
Participant transactions by class for the year ended December 31, 2015 were as follows: Dollars Units Purchases Redemptions Net change Purchases Redemptions Net change Class R1 $ 2,320,730 $ (4,397,638) $ (2,076,908) 143,573 (273,875) (130,302)Class R2 125,030 (48,604) 76,426 12,133 (4,645) 7,488Class R3 2,617,547 (1,822,689) 794,858 157,071 (108,789) 48,282Class R4 1,195,994 (2,068,418) (872,424) 71,020 (125,220) (54,200)Class R5 613,402 (1,750,200) (1,136,798) 37,885 (105,680) (67,795)Class R6 249,190 (214,810) 34,380 14,921 (12,947) 1,974Class R7 26,238 (126,444) (100,206) 1,493 (7,394) (5,901)Class R8 103,405 (41,007) 62,398 6,001 (2,401) 3,600Class LifeStyle 5,010,166 (12,082,361) (7,072,195) — — — $ 12,261,702 $ (22,552,171) $ (10,290,469) 444,097 (640,951) (196,854)
488
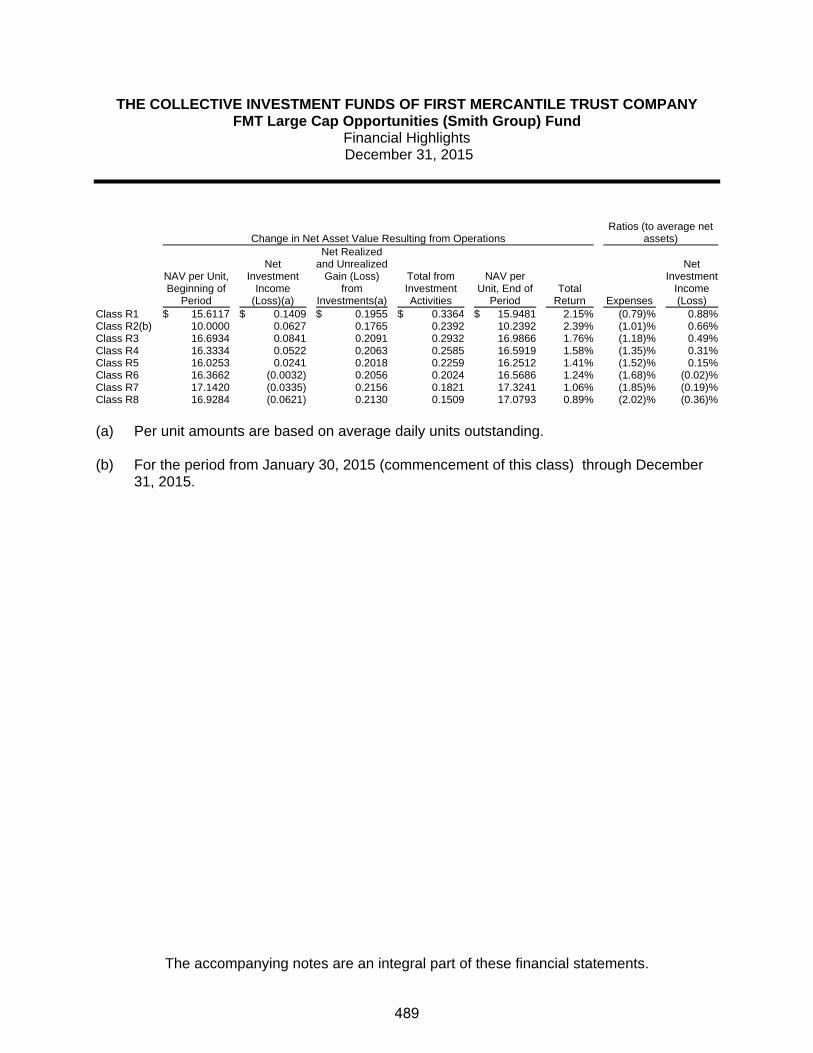
THE COLLECTIVE INVESTMENT FUNDS OF FIRST MERCANTILE TRUST COMPANY FMT Large Cap Opportunities (Smith Group) Fund
Financial Highlights December 31, 2015
The accompanying notes are an integral part of these financial statements.
Change in Net Asset Value Resulting from Operations Ratios (to average net
assets)
NAV per Unit, Beginning of
Period
Net Investment
Income (Loss)(a)
Net Realized and Unrealized
Gain (Loss) from
Investments(a)
Total from Investment Activities
NAV per Unit, End of
Period Total
Return Expenses
Net Investment
Income (Loss)
Class R1 $ 15.6117 $ 0.1409 $ 0.1955 $ 0.3364 $ 15.9481 2.15% (0.79)% 0.88%Class R2(b) 10.0000 0.0627 0.1765 0.2392 10.2392 2.39% (1.01)% 0.66%Class R3 16.6934 0.0841 0.2091 0.2932 16.9866 1.76% (1.18)% 0.49%Class R4 16.3334 0.0522 0.2063 0.2585 16.5919 1.58% (1.35)% 0.31%Class R5 16.0253 0.0241 0.2018 0.2259 16.2512 1.41% (1.52)% 0.15%Class R6 16.3662 (0.0032) 0.2056 0.2024 16.5686 1.24% (1.68)% (0.02)%Class R7 17.1420 (0.0335) 0.2156 0.1821 17.3241 1.06% (1.85)% (0.19)%Class R8 16.9284 (0.0621) 0.2130 0.1509 17.0793 0.89% (2.02)% (0.36)%
(a) Per unit amounts are based on average daily units outstanding.
(b) For the period from January 30, 2015 (commencement of this class) through December
31, 2015.
489
FMT Mid Cap Growth (Disciplined Growth Investors) Fund

THE COLLECTIVE INVESTMENT FUNDS OF FIRST MERCANTILE TRUST COMPANY FMT Mid Cap Growth (Disciplined Growth Investors) Fund
Statement of Assets and Liabilities December 31, 2015
The accompanying notes are an integral part of these financial statements.
Assets Investments in securities, at fair value $ 19,501,618 Cash equivalents 106,459Receivables
Investments sold 79,779 Dividends and interest 3,968Dividend tax reclaim 2,988
Total assets 19,694,812 Liabilities Sub-advisor fees 10,199Trustee fees 7,209
Total liabilities 17,408 Net assets $ 19,677,404 Components of net assets
Units of
Participation NAV
per Unit Net
Assets Class R1 345,033 $ 15.8947 $ 5,484,212Class R2 29,429 $ 14.1916 417,640Class R3 46,352 $ 15.9291 738,338Class R4 80,639 $ 16.4214 1,324,211Class R5 124,123 $ 16.3113 2,024,597Class R6 80,363 $ 15.1463 1,217,201Class R7 30,177 $ 16.2835 491,383Class R8 2,475 $ 16.1732 40,033Class LifeStyle 7,939,789
$ 19,677,404
490

THE COLLECTIVE INVESTMENT FUNDS OF FIRST MERCANTILE TRUST COMPANY FMT Mid Cap Growth (Disciplined Growth Investors) Fund
Statement of Operations For the Year Ended December 31, 2015
The accompanying notes are an integral part of these financial statements.
Investment income
Dividends $ 351,138Interest 135
351,273 Expenses
Trustee fees 191,607Sub-advisor fees 176,941Custody fees 12,161Audit fees 5,660
386,369 Net investment loss (35,096) Net realized gain from investments sold
Proceeds from sales of investments 22,791,181Cost of investments sold 12,862,501
Net realized gain from investments sold 9,928,680 Change in net unrealized appreciation (depreciation) on investments (11,483,297) Net realized and unrealized loss on investments (1,554,617) Other operating credits (charges) 76 Net decrease in net assets resulting from operations $ (1,589,637)
491

THE COLLECTIVE INVESTMENT FUNDS OF FIRST MERCANTILE TRUST COMPANY FMT Mid Cap Growth (Disciplined Growth Investors) Fund
Statement of Changes in Net Assets For the Year Ended December 31, 2015
The accompanying notes are an integral part of these financial statements.
Operations
Net investment loss $ (35,096)
Net realized gain from investments sold 9,928,680
Change in net unrealized appreciation (depreciation) on investments (11,483,297)
Other operating credits (charges) 76
Net decrease in net assets resulting from operations (1,589,637) Participant transactions
Proceeds from units purchased 7,411,444Less payments for units redeemed 27,307,430
Decrease in net assets from participant transactions (19,895,986)
Total decrease in net assets (21,485,623) Net assets at beginning of year 41,163,027 Net assets at end of year $ 19,677,404
492

THE COLLECTIVE INVESTMENT FUNDS OF FIRST MERCANTILE TRUST COMPANY FMT Mid Cap Growth (Disciplined Growth Investors) Fund
Schedule of Investments and Specific Fund Disclosures December 31, 2015
The accompanying notes are an integral part of these financial statements.
Investments
Principal Amount or
Shares Fair Value ____________ ____________
Common stocks (98.1%)
Communications (11.0%) FactSet Research Systems, Inc. 3,445 $ 560,054 Plantronics, Inc. 9,830 466,138 TripAdvisor, Inc. 2,900 247,225 Ubiquiti Networks, Inc. 8,400 266,196 ViaSat, Inc. 2,610 159,236 Yahoo!, Inc. 14,230 473,290 __________ 2,172,139
Consumer, Cyclical (24.7%) Cabela's, Inc. 10,555 493,235 Cheesecake Factory, Inc./The 6,425 296,257 Dolby Laboratories, Inc. Class A 6,265 210,817 Ethan Allen Interiors, Inc. 17,875 497,282 JetBlue Airways Corp. 24,275 549,829 L Brands, Inc. 6,585 630,975 Ralph Lauren Corp. 3,045 339,457 Royal Caribbean Cruises Ltd. 6,110 618,393 Select Comfort Corp. 18,280 391,375 TJX Cos., Inc. 9,630 682,863 Urban Outfitters, Inc. 6,600 150,150 __________ 4,860,633
Consumer, Non-cyclical (16.0%) Align Technology, Inc. 5,335 351,310 CEB, Inc. 6,350 389,826 Edwards Lifesciences Corp. 8,370 661,062 Intuitive Surgical, Inc. 1,180 644,469 Myriad Genetics, Inc. 8,210 354,344 Tumi Holdings, Inc. 16,225 269,822 Varian Medical Systems, Inc. 5,985 483,588 __________ 3,154,421
Energy (3.2%) Core Laboratories N.V. 2,125 231,072 Noble Corp. PLC 14,590 153,925 Southwestern Energy Co. 12,700 90,297 Ultra Petroleum Corp. 58,080 145,200 __________ 620,494
493

THE COLLECTIVE INVESTMENT FUNDS OF FIRST MERCANTILE TRUST COMPANY FMT Mid Cap Growth (Disciplined Growth Investors) Fund
Schedule of Investments and Specific Fund Disclosures (continued) December 31, 2015
The accompanying notes are an integral part of these financial statements.
Investments
Principal Amount or
Shares Fair Value ____________ ____________
Common stocks (continued)
Financial (2.7%) E*TRADE Financial Corp. 9,325 $ 276,393 TCF Financial Corp. 17,310 244,417 520,810 Industrial (15.2%) 5,700 192,489 Garmin Ltd. 10,940 406,640 Gentex Corp. 31,880 510,399 Graco, Inc. 3,810 274,587 Landstar System, Inc. 7,090 415,829 Middleby Corp./The 5,875 633,736 Plexus Corp. 16,060 560,815 __________ 2,994,495
Technology (25.3%) Akamai Technologies, Inc. 9,705 510,774 Autodesk, Inc. 9,770 595,286 IHS, Inc. Class A 1,465 173,500 Intuit, Inc. 6,800 656,200 Microchip Technology, Inc. 5,835 271,561 Open Text Corp. 12,620 604,877 Paychex, Inc. 4,035 213,411 Power Integrations, Inc. 5,075 246,797 Qlik Technologies, Inc. 10,175 322,140 RealPage, Inc. 12,700 285,115 Seagate Technology PLC 13,353 489,521 Super Micro Computer, Inc. 14,000 343,140 Synaptics, Inc. 3,425 275,165 __________ 4,987,487 __________ Total Common stocks (Cost $12,118,366) 19,310,479
Depository receipt (1.0%)
Technology (1.0%) ARM Holdings PLC ADR (Cost $51,938) 4,225 191,139 __________Total Investments (Cost $12,170,304) $ 19,501,618 ____________________
494

THE COLLECTIVE INVESTMENT FUNDS OF FIRST MERCANTILE TRUST COMPANY FMT Mid Cap Growth (Disciplined Growth Investors) Fund
Schedule of Investments and Specific Fund Disclosures (continued) December 31, 2015
The accompanying notes are an integral part of these financial statements.
Specific Fund Disclosures Fair value The inputs or methodology used for valuing securities may not be indicative of the risks associated with investing in those securities. For more information on valuation inputs, and their aggregation into the levels used in the table below, please refer to note 4 to the financial statements. The following table sets forth by level, within the fair value hierarchy, the Fund's investments measured at fair value.
Total Level 1 Level 2 Level 3
Common stocks $ 19,310,479 $ 19,310,479 $ — $ —Depository receipt 191,139 191,139 — —__________ __________ __________ _________
$ 19,501,618 $ 19,501,618 $ — $ —__________ __________ __________ ___________________ __________ __________ _________ Investment transactions The aggregate cost of purchases of investment securities and proceeds from sales of investment securities (other than temporary cash investments) totaled $2,989,951 and $22,791,181, respectively, for the year ended December 31, 2015. Class-specific expenses Class-specific trustee fees for the year ended December 31, 2015 were as follows: Class R1 $ 19,222 Class R2 42,431 Class R3 5,475 Class R4 19,712 Class R5 22,799 Class R6 16,440 Class R7 8,815 Class R8 761 Class LifeStyle 55,952 $ 191,607
495
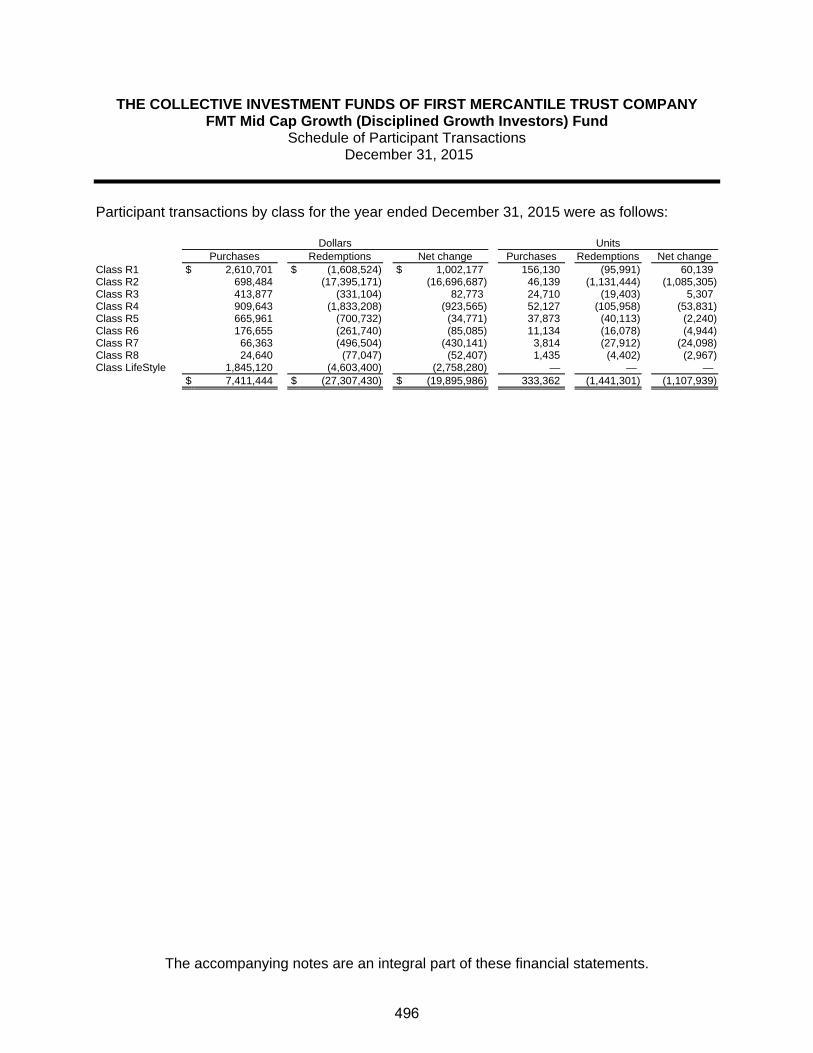
THE COLLECTIVE INVESTMENT FUNDS OF FIRST MERCANTILE TRUST COMPANY FMT Mid Cap Growth (Disciplined Growth Investors) Fund
Schedule of Participant Transactions December 31, 2015
The accompanying notes are an integral part of these financial statements.
Participant transactions by class for the year ended December 31, 2015 were as follows: Dollars Units Purchases Redemptions Net change Purchases Redemptions Net change Class R1 $ 2,610,701 $ (1,608,524) $ 1,002,177 156,130 (95,991) 60,139Class R2 698,484 (17,395,171) (16,696,687) 46,139 (1,131,444) (1,085,305)Class R3 413,877 (331,104) 82,773 24,710 (19,403) 5,307Class R4 909,643 (1,833,208) (923,565) 52,127 (105,958) (53,831)Class R5 665,961 (700,732) (34,771) 37,873 (40,113) (2,240)Class R6 176,655 (261,740) (85,085) 11,134 (16,078) (4,944)Class R7 66,363 (496,504) (430,141) 3,814 (27,912) (24,098)Class R8 24,640 (77,047) (52,407) 1,435 (4,402) (2,967)Class LifeStyle 1,845,120 (4,603,400) (2,758,280) — — — $ 7,411,444 $ (27,307,430) $ (19,895,986) 333,362 (1,441,301) (1,107,939)
496

THE COLLECTIVE INVESTMENT FUNDS OF FIRST MERCANTILE TRUST COMPANY FMT Mid Cap Growth (Disciplined Growth Investors) Fund
Financial Highlights December 31, 2015
The accompanying notes are an integral part of these financial statements.
Change in Net Asset Value Resulting from Operations Ratios (to average net
assets)
NAV per Unit, Beginning of
Period
Net Investment
Income (Loss)(a)
Net Realized and Unrealized
Gain (Loss) from
Investments(a)
Total from Investment Activities
NAV per Unit, End of
Period Total
Return Expenses
Net Investment
Income (Loss)
Class R1 $ 17.1315 $ 0.0284 $ (1.2652) $ (1.2368) $ 15.8947 (7.22)% (1.01)% 0.17%Class R2 15.3296 (0.0027) (1.1353) (1.1380) 14.1916 (7.42)% (1.24)% (0.02)%Class R3 17.2362 (0.0370) (1.2701) (1.3071) 15.9291 (7.58)% (1.40)% (0.22)%Class R4 17.7995 (0.0660) (1.3121) (1.3781) 16.4214 (7.74)% (1.57)% (0.38)%Class R5 17.7104 (0.0967) (1.3024) (1.3991) 16.3113 (7.90)% (1.74)% (0.56)%Class R6 16.4738 (0.1172) (1.2103) (1.3275) 15.1463 (8.06)% (1.91)% (0.73)%Class R7 17.7409 (0.1547) (1.3027) (1.4574) 16.2835 (8.21)% (2.08)% (0.89)%Class R8 17.6513 (0.1839) (1.2942) (1.4781) 16.1732 (8.37)% (2.25)% (1.07)%
(a) Per unit amounts are based on average daily units outstanding.
497

FMT Mid Cap Value (NewSouth) Fund
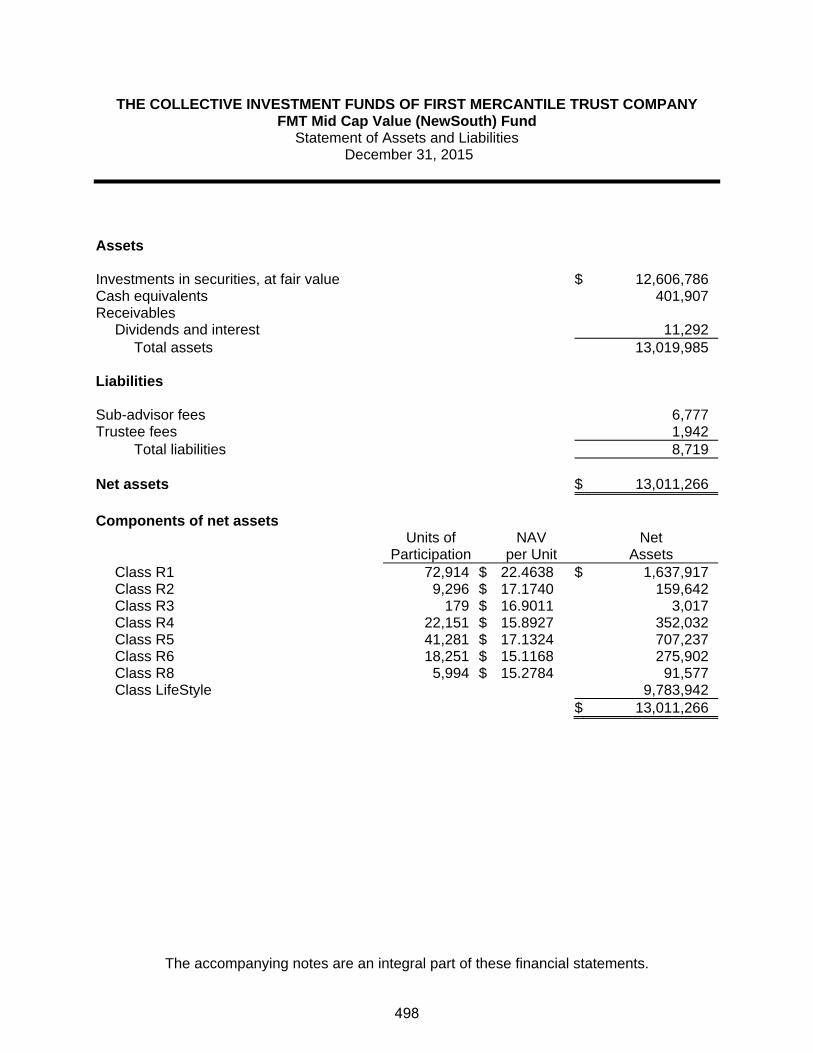
THE COLLECTIVE INVESTMENT FUNDS OF FIRST MERCANTILE TRUST COMPANY FMT Mid Cap Value (NewSouth) Fund
Statement of Assets and Liabilities December 31, 2015
The accompanying notes are an integral part of these financial statements.
Assets Investments in securities, at fair value $ 12,606,786 Cash equivalents 401,907Receivables
Dividends and interest 11,292Total assets 13,019,985
Liabilities Sub-advisor fees 6,777Trustee fees 1,942
Total liabilities 8,719 Net assets $ 13,011,266 Components of net assets
Units of
Participation NAV
per Unit Net
Assets Class R1 72,914 $ 22.4638 $ 1,637,917Class R2 9,296 $ 17.1740 159,642Class R3 179 $ 16.9011 3,017Class R4 22,151 $ 15.8927 352,032Class R5 41,281 $ 17.1324 707,237Class R6 18,251 $ 15.1168 275,902Class R8 5,994 $ 15.2784 91,577Class LifeStyle 9,783,942
$ 13,011,266
498
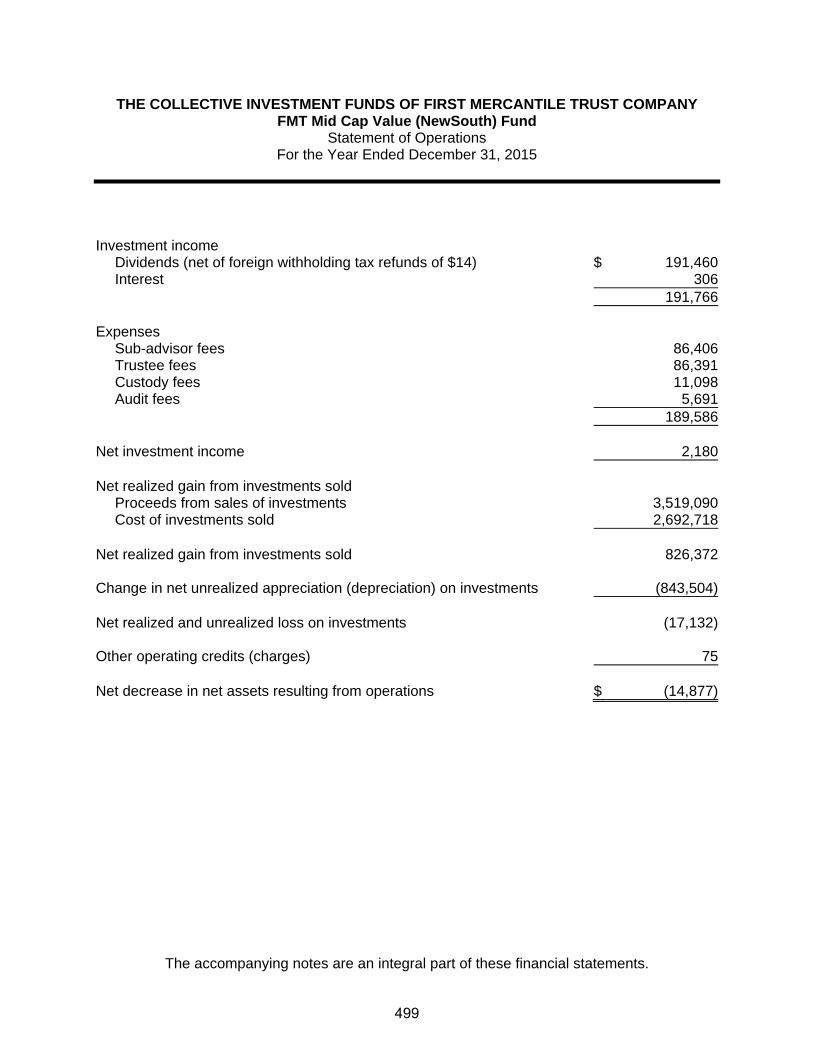
THE COLLECTIVE INVESTMENT FUNDS OF FIRST MERCANTILE TRUST COMPANY FMT Mid Cap Value (NewSouth) Fund
Statement of Operations For the Year Ended December 31, 2015
The accompanying notes are an integral part of these financial statements.
Investment income
Dividends (net of foreign withholding tax refunds of $14) $ 191,460Interest 306
191,766 Expenses
Sub-advisor fees 86,406Trustee fees 86,391Custody fees 11,098Audit fees 5,691
189,586 Net investment income 2,180 Net realized gain from investments sold
Proceeds from sales of investments 3,519,090Cost of investments sold 2,692,718
Net realized gain from investments sold 826,372 Change in net unrealized appreciation (depreciation) on investments (843,504) Net realized and unrealized loss on investments (17,132) Other operating credits (charges) 75 Net decrease in net assets resulting from operations $ (14,877)
499

THE COLLECTIVE INVESTMENT FUNDS OF FIRST MERCANTILE TRUST COMPANY FMT Mid Cap Value (NewSouth) Fund
Statement of Changes in Net Assets For the Year Ended December 31, 2015
The accompanying notes are an integral part of these financial statements.
Operations
Net investment income $ 2,180
Net realized gain from investments sold 826,372
Change in net unrealized appreciation (depreciation) on investments (843,504)
Other operating credits (charges) 75
Net decrease in net assets resulting from operations (14,877) Participant transactions
Proceeds from units purchased 4,176,907Less payments for units redeemed 5,120,988
Decrease in net assets from participant transactions (944,081)
Total decrease in net assets (958,958) Net assets at beginning of year 13,970,224 Net assets at end of year $ 13,011,266
500

THE COLLECTIVE INVESTMENT FUNDS OF FIRST MERCANTILE TRUST COMPANY FMT Mid Cap Value (NewSouth) Fund
Schedule of Investments and Specific Fund Disclosures (continued) December 31, 2015
The accompanying notes are an integral part of these financial statements.
Investments
Principal Amount or
Shares Fair Value ____________ ____________
Common stocks (96.9%)
Basic Material (2.1%) FMC Corp. 6,835 $ 267,454
Communications (20.2%) Discovery Communications, Inc. Class A 15,270 407,404 Gannett Co., Inc. 11,080 180,493 Liberty Ventures Series A 4,480 202,093 Scripps Networks Interactive, Inc. Class A 4,640 256,174 Sirius XM Holdings, Inc. 145,285 591,310 TEGNA, Inc. 26,775 683,298 Tribune Media Co. Class A 9,245 312,573 __________ 2,633,345
Consumer, Cyclical (11.4%) AutoZone, Inc. 860 638,043 Liberty Interactive Corp. QVC Group Class A 17,250 471,270 MSC Industrial Direct Co., Inc. Class A 6,660 374,758 __________ 1,484,071
Consumer, Non-cyclical (12.4%) Jarden Corp. 9,875 564,060 Service Corp. International/US 18,865 490,867 Teleflex, Inc. 2,570 337,827 Western Union Co. 12,430 222,621 __________ 1,615,375
Financial (6.7%) Brookfield Asset Management, Inc. Class A 13,660 430,700 Willis Group Holdings PLC 8,960 435,187 __________ 865,887
Industrial (21.0%) FedEx Corp. 2,260 336,717 Flowserve Corp. 8,825 371,356 Stanley Black & Decker, Inc. 3,700 394,901 Thermo Fisher Scientific, Inc. 4,815 683,008 Xylem, Inc. 11,085 404,603 Zebra Technologies Corp. Class A 7,725 538,046 __________ 2,728,631
501

THE COLLECTIVE INVESTMENT FUNDS OF FIRST MERCANTILE TRUST COMPANY FMT Mid Cap Value (NewSouth) Fund
Schedule of Investments and Specific Fund Disclosures (continued) December 31, 2015
The accompanying notes are an integral part of these financial statements.
Investments
Principal Amount or
Shares Fair Value ____________ ____________
Common stocks (continued)
Technology (23.1%) Amdocs Ltd. 9,015 $ 491,948 CGI Group, Inc. Class A 14,720 589,242 Dun & Bradstreet Corp. 4,305 447,419 Fiserv, Inc. 8,610 787,470 Open Text Corp. 14,520 695,944 __________ 3,012,023 __________Total Investments (Cost $10,502,940) $ 12,606,786 ____________________
502

THE COLLECTIVE INVESTMENT FUNDS OF FIRST MERCANTILE TRUST COMPANY FMT Mid Cap Value (NewSouth) Fund
Schedule of Investments and Specific Fund Disclosures (continued) December 31, 2015
The accompanying notes are an integral part of these financial statements.
Specific Fund Disclosures Fair value The inputs or methodology used for valuing securities may not be indicative of the risks associated with investing in those securities. For more information on valuation inputs, and their aggregation into the levels used in the table below, please refer to note 4 to the financial statements. The following table sets forth by level, within the fair value hierarchy, the Fund's investments measured at fair value.
Total Level 1 Level 2 Level 3
Common stocks $ 12,606,786 $ 12,606,786 $ — $ —__________ __________ __________ ___________________ __________ __________ _________ Investment transactions The aggregate cost of purchases of investment securities and proceeds from sales of investment securities (other than temporary cash investments) totaled $2,851,071 and $3,519,090, respectively, for the year ended December 31, 2015. Class-specific expenses Class-specific trustee fees for the year ended December 31, 2015 were as follows: Class R1 $ 6,830 Class R2 776 Class R3 15 Class R4 2,949 Class R5 7,846 Class R6 3,431 Class R7 63 Class R8 1,512 Class LifeStyle 62,969 $ 86,391
503

THE COLLECTIVE INVESTMENT FUNDS OF FIRST MERCANTILE TRUST COMPANY FMT Mid Cap Value (NewSouth) Fund
Schedule of Participant Transactions December 31, 2015
The accompanying notes are an integral part of these financial statements.
Participant transactions by class for the year ended December 31, 2015 were as follows: Dollars Units Purchases Redemptions Net change Purchases Redemptions Net change Class R1 $ 458,348 $ (722,734) $ (264,386) 20,044 (31,342) (11,298)Class R2 119,853 (46,874) 72,979 6,958 (2,596) 4,362Class R3 1,927 — 1,927 108 — 108Class R4 193,460 (35,777) 157,683 11,466 (2,303) 9,163Class R5 45,171 (35,450) 9,721 2,567 (2,018) 549Class R6 25,218 (7,357) 17,861 1,627 (485) 1,142Class R7 2,375 (6,016) (3,641) 147 (371) (224)Class R8 8,021 (10,545) (2,524) 516 (696) (180)Class LifeStyle 3,322,534 (4,256,235) (933,701) — — — $ 4,176,907 $ (5,120,988) $ (944,081) 43,433 (39,811) 3,622
504

THE COLLECTIVE INVESTMENT FUNDS OF FIRST MERCANTILE TRUST COMPANY FMT Mid Cap Value (NewSouth) Fund
Financial Highlights December 31, 2015
The accompanying notes are an integral part of these financial statements.
Change in Net Asset Value Resulting from Operations Ratios (to average net
assets)
NAV per Unit, Beginning of
Period
Net Investment
Income (Loss)(a)
Net Realized and Unrealized
Gain (Loss) from
Investments(a)
Total from Investment Activities
NAV per Unit, End of
Period Total
Return Expenses
Net Investment
Income (Loss)
Class R1 $ 22.3941 $ 0.0620 $ 0.0077 $ 0.0697 $ 22.4638 0.31% (1.07)% 0.27%Class R2 17.1585 0.0106 0.0049 0.0155 17.1740 0.09% (1.28)% 0.06%Class R3 16.9084 (0.0081) 0.0008 (0.0073) 16.9011 (0.04)% (1.43)% (0.05)%Class R4 15.9326 (0.0465) 0.0066 (0.0399) 15.8927 (0.25)% (1.62)% (0.28)%Class R5 17.2048 (0.0812) 0.0088 (0.0724) 17.1324 (0.42)% (1.80)% (0.46)%Class R6 15.2066 (0.0979) 0.0081 (0.0898) 15.1168 (0.59)% (1.97)% (0.63)%Class R7(b) 15.8150 (0.1413) 0.5393 0.3980 — 2.52% (2.31)% (0.88)%Class R8 15.4218 (0.1536) 0.0102 (0.1434) 15.2784 (0.93)% (1.30)% (0.98)%
(a) Per unit amounts are based on average daily units outstanding.
(b) For the period from January 1, 2015 through November 20, 2015.
505

FMT Small Cap Aggressive Growth (CCI/Cupps) Fund

THE COLLECTIVE INVESTMENT FUNDS OF FIRST MERCANTILE TRUST COMPANY FMT Small Cap Aggressive Growth (CCI/Cupps) Fund
Statement of Assets and Liabilities December 31, 2015
The accompanying notes are an integral part of these financial statements.
Assets Investments in securities, at fair value $ 45,607,490 Cash equivalents 217,880
Receivables
Dividends and interest 4,218
Investments sold 348,031
Total assets 46,177,619
Liabilities Investments purchased 118,821
Sub-advisor fees 26,093
Trustee fees 19,977
Total liabilities 164,891
Net assets $ 46,012,728
Components of net assets
Units of
Participation NAV
per Unit Net
Assets Class R1 701,951 $ 23.0605 $ 16,187,320
Class R2 184,107 $ 13.4245 2,471,547
Class R3 200,563 $ 13.2752 2,662,504
Class R4 268,297 $ 13.4086 3,597,483
Class R5 367,995 $ 13.1473 4,838,128
Class R6 91,661 $ 13.0648 1,197,543
Class R7 115,938 $ 12.7717 1,480,731
Class R8 82,417 $ 13.0446 1,075,092
Class LifeStyle 12,502,380
$ 46,012,728
506

THE COLLECTIVE INVESTMENT FUNDS OF FIRST MERCANTILE TRUST COMPANY FMT Small Cap Aggressive Growth (CCI/Cupps) Fund
Statement of Operations For the Year Ended December 31, 2015
The accompanying notes are an integral part of these financial statements.
Investment income
Dividends $ 172,040
Interest 587
172,627
Expenses
Sub-advisor fees 437,995
Trustee fees 416,168
Custody fees 61,685
Audit fees 5,734
921,582
Net investment loss (748,955)
Net realized gain from investments sold
Proceeds from sales of investments 130,788,100
Cost of investments sold 124,194,930
Net realized gain from investments sold 6,593,170
Change in net unrealized appreciation (depreciation) on investments (10,100,602)
Net realized and unrealized loss on investments (3,507,432)
Other operating credits (charges) 26,808
Net decrease in net assets resulting from operations $ (4,229,579)
507

THE COLLECTIVE INVESTMENT FUNDS OF FIRST MERCANTILE TRUST COMPANY FMT Small Cap Aggressive Growth (CCI/Cupps) Fund
Statement of Changes in Net Assets For the Year Ended December 31, 2015
The accompanying notes are an integral part of these financial statements.
Operations
Net investment loss $ (748,955)
Net realized gain from investments sold 6,593,170
Change in net unrealized appreciation (depreciation) on investments (10,100,602)
Other operating credits (charges) 26,808
Net decrease in net assets resulting from operations (4,229,579)
Participant transactions
Proceeds from units purchased 12,659,045
Less payments for units redeemed 42,350,818
Decrease in net assets from participant transactions (29,691,773)
Total decrease in net assets (33,921,352)
Net assets at beginning of year 79,934,080
Net assets at end of year $ 46,012,728
508

THE COLLECTIVE INVESTMENT FUNDS OF FIRST MERCANTILE TRUST COMPANY FMT Small Cap Aggressive Growth (CCI/Cupps) Fund Schedule of Investments and Specific Fund Disclosures
December 31, 2015
The accompanying notes are an integral part of these financial statements.
Investments
Principal Amount or
Shares Fair Value ____________ ____________
Common stocks (97.1%)
Basic Material (0.1%) Balchem Corp. 932 $ 56,666
Communications (14.2%) 8x8, Inc. 24,988 286,113 AMC Networks, Inc. Class A 6,100 455,548 ARRIS Group, Inc. 3,800 116,166 Bankrate, Inc. 17,200 228,760 Ciena Corp. 31,400 649,666 CommScope Holding Co., Inc. 20,700 535,923 comScore, Inc. 2,647 108,924 GoDaddy, Inc. Class A 2,815 90,249 Gogo, Inc. 17,200 306,160 Gray Television, Inc. 16,500 268,950 Infinera Corp. 51,208 927,889 LogMeIn, Inc. 8,248 553,441 MDC Partners, Inc. Class A 17,870 388,136 RingCentral, Inc. Class A 40,000 943,200 Wayfair, Inc. Class A 6,799 323,768 Zendesk, Inc. 13,200 349,008 __________ 6,531,901
Consumer, Cyclical (17.3%) American Eagle Outfitters, Inc. 51,500 798,250 Beacon Roofing Supply, Inc. 2,165 89,155 Burlington Stores, Inc. 3,800 163,020 CalAtlantic Group, Inc. 14,006 531,107 Callaway Golf Co. 11,983 112,880 Chuy's Holdings, Inc. 10,180 319,041 ClubCorp Holdings, Inc. 7,270 132,823 Columbia Sportswear Co. 7,000 341,320 Dave & Buster's Entertainment, Inc. 14,200 592,708 Diamond Resorts International, Inc. 5,045 128,698 Five Below, Inc. 14,000 449,400 Francesca's Holdings Corp. 9,983 173,804 G-III Apparel Group Ltd. 15,147 670,406 Gentherm, Inc. 4,375 207,375 Interface, Inc. 21,700 415,338 JetBlue Airways Corp. 4,975 112,684 Oxford Industries, Inc. 8,430 538,002
509
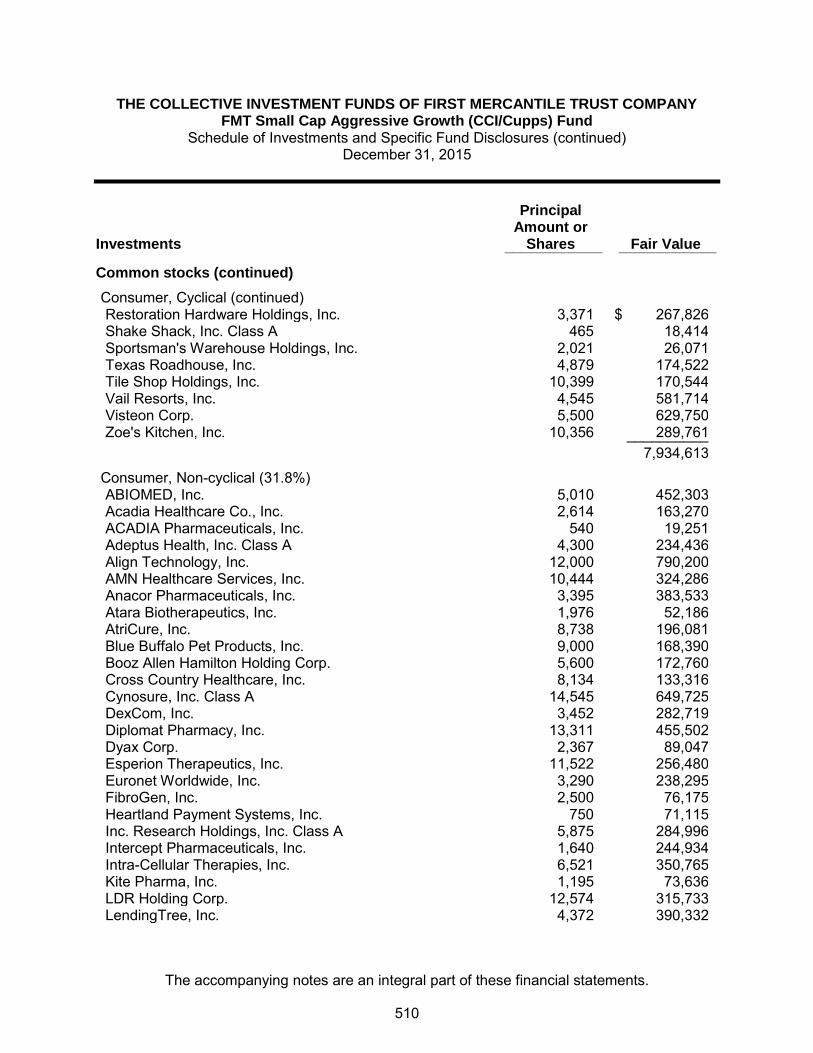
THE COLLECTIVE INVESTMENT FUNDS OF FIRST MERCANTILE TRUST COMPANY FMT Small Cap Aggressive Growth (CCI/Cupps) Fund
Schedule of Investments and Specific Fund Disclosures (continued) December 31, 2015
The accompanying notes are an integral part of these financial statements.
Investments
Principal Amount or
Shares Fair Value ____________ ____________
Common stocks (continued)
Consumer, Cyclical (continued) Restoration Hardware Holdings, Inc. 3,371 $ 267,826 Shake Shack, Inc. Class A 465 18,414 Sportsman's Warehouse Holdings, Inc. 2,021 26,071 Texas Roadhouse, Inc. 4,879 174,522 Tile Shop Holdings, Inc. 10,399 170,544 Vail Resorts, Inc. 4,545 581,714 Visteon Corp. 5,500 629,750 Zoe's Kitchen, Inc. 10,356 289,761 __________ 7,934,613
Consumer, Non-cyclical (31.8%) ABIOMED, Inc. 5,010 452,303 Acadia Healthcare Co., Inc. 2,614 163,270 ACADIA Pharmaceuticals, Inc. 540 19,251 Adeptus Health, Inc. Class A 4,300 234,436 Align Technology, Inc. 12,000 790,200 AMN Healthcare Services, Inc. 10,444 324,286 Anacor Pharmaceuticals, Inc. 3,395 383,533 Atara Biotherapeutics, Inc. 1,976 52,186 AtriCure, Inc. 8,738 196,081 Blue Buffalo Pet Products, Inc. 9,000 168,390 Booz Allen Hamilton Holding Corp. 5,600 172,760 Cross Country Healthcare, Inc. 8,134 133,316 Cynosure, Inc. Class A 14,545 649,725 DexCom, Inc. 3,452 282,719 Diplomat Pharmacy, Inc. 13,311 455,502 Dyax Corp. 2,367 89,047 Esperion Therapeutics, Inc. 11,522 256,480 Euronet Worldwide, Inc. 3,290 238,295 FibroGen, Inc. 2,500 76,175 Heartland Payment Systems, Inc. 750 71,115 Inc. Research Holdings, Inc. Class A 5,875 284,996 Intercept Pharmaceuticals, Inc. 1,640 244,934 Intra-Cellular Therapies, Inc. 6,521 350,765 Kite Pharma, Inc. 1,195 73,636 LDR Holding Corp. 12,574 315,733 LendingTree, Inc. 4,372 390,332
510

THE COLLECTIVE INVESTMENT FUNDS OF FIRST MERCANTILE TRUST COMPANY FMT Small Cap Aggressive Growth (CCI/Cupps) Fund
Schedule of Investments and Specific Fund Disclosures (continued) December 31, 2015
The accompanying notes are an integral part of these financial statements.
Investments
Principal Amount or
Shares Fair Value ____________ ____________
Common stocks (continued)
Consumer, Non-cyclical (continued) Lexicon Pharmaceuticals, Inc. 13,400 $ 178,354 Molina Healthcare, Inc. 2,928 176,061 Nektar Therapeutics 8,013 135,019 Neurocrine Biosciences, Inc. 11,920 674,314 Nevro Corp. 14,904 1,006,169 Nutrisystem, Inc. 11,300 244,532 NuVasive, Inc. 14,353 776,641 Ophthotech Corp. 1,125 88,346 Pacira Pharmaceuticals, Inc. 10,303 791,167 PharMerica Corp. 7,300 255,500 Portola Pharmaceuticals, Inc. 2,505 128,882 Prothena Corp. PLC 3,868 263,450 PTC Therapeutics, Inc. 9,102 294,905 Repligen Corp. 9,207 260,466 STERIS PLC 6,700 504,778 Ultragenyx Pharmaceutical, Inc. 4,400 493,592 VCA, Inc. 13,300 731,500 WellCare Health Plans, Inc. 5,600 437,976 Zeltiq Aesthetics, Inc. 10,686 304,872 __________ 14,615,990
Energy (1.1%) Canadian Solar, Inc. 8,600 249,056 Diamondback Energy, Inc. 3,500 234,150 Matador Resources Co. 1,980 39,145 __________ 522,351
Financial (5.4%) Bank of the Ozarks, Inc. 13,535 669,441 Cathay General Bancorp 17,400 545,142 Home BancShares, Inc. 3,175 128,651 Interactive Brokers Group, Inc. Class A 6,823 297,483 PrivateBancorp, Inc. 19,750 810,145 WisdomTree Investments, Inc. 2,716 42,587 __________ 2,493,449
Industrial (6.7%) Berry Plastics Group, Inc. 4,225 152,860
511

THE COLLECTIVE INVESTMENT FUNDS OF FIRST MERCANTILE TRUST COMPANY FMT Small Cap Aggressive Growth (CCI/Cupps) Fund
Schedule of Investments and Specific Fund Disclosures (continued) December 31, 2015
The accompanying notes are an integral part of these financial statements.
Investments
Principal Amount or
Shares Fair Value
Common stocks (continued) Industrial (continued)
Dycom Industries, Inc. 7,600 $ 531,696 Forward Air Corp. 4,300 184,943 Headwaters, Inc. 6,110 103,076 IMAX Corp. 6,200 220,348 Orbital ATK, Inc. 5,400 482,436 OSI Systems, Inc. 4,000 354,640 Smith & Wesson Holding Corp. 8,300 182,434 Universal Display Corp. 14,633 796,620 XPO Logistics, Inc. 3,451 94,040 __________ 3,103,093
Technology (20.5%) 2U, Inc. 13,863 387,887 Blackbaud, Inc. 2,870 189,018 Callidus Software, Inc. 7,435 138,068 Cavium, Inc. 14,273 937,879 Cvent, Inc. 5,455 190,434 CyberArk Software Ltd. 5,540 250,076 Electronics For Imaging, Inc. 12,700 593,598 Envestnet, Inc. 3,799 113,400 Hortonworks, Inc. 7,003 153,366 HubSpot, Inc. 2,970 167,241 Imperva, Inc. 9,300 588,783 Integrated Device Technology, Inc. 54,558 1,437,603 Luxoft Holding, Inc. 2,625 202,466 M/A-COM Technology Solutions Holdings, Inc. 7,605 310,968 MaxLinear, Inc. Class A 15,695 231,187 Medidata Solutions, Inc. 2,967 146,243 NetSuite, Inc. 174 14,724 New Relic, Inc. 9,504 346,231 Nuance Communications, Inc. 37,700 749,853 Paycom Software, Inc. 5,780 217,501 Proofpoint, Inc. 18,375 1,194,559 Rackspace Hosting, Inc. 13,311 337,035 Tower Semiconductor Ltd. 10,025 140,952 Tyler Technologies, Inc. 1,195 208,312
512

THE COLLECTIVE INVESTMENT FUNDS OF FIRST MERCANTILE TRUST COMPANY FMT Small Cap Aggressive Growth (CCI/Cupps) Fund
Schedule of Investments and Specific Fund Disclosures (continued) December 31, 2015
The accompanying notes are an integral part of these financial statements.
Investments
Principal Amount or
Shares Fair Value
Common stocks (continued)
Technology (continued) Ultimate Software Group, Inc./The 914 $ 178,696 __________ 9,426,080 __________ Total Common stocks (Cost $42,422,003) 44,684,143
Depository receipts (2.0%)
Communication (1.2%) Criteo S.A. ADR 13,800 546,480
Technology (0.8%) Silicon Motion Technology Corp. ADR 8,800 275,968 WNS Holdings Ltd. ADR 3,235 100,899 __________ 376,867 __________ Total Depository receipts (Cost $1,017,965) 923,347 __________ Total Investments (Cost $43,439,968) $ 45,607,490 __________ __________ Specific Fund Disclosures Fair value The inputs or methodology used for valuing securities may not be indicative of the risks associated with investing in those securities. For more information on valuation inputs, and their aggregation into the levels used in the table below, please refer to note 4 to the financial statements. The following table sets forth by level, within the fair value hierarchy, the Fund's investments measured at fair value.
Total Level 1 Level 2 Level 3
Common stocks $ 44,684,143 $ 44,684,143 $ — $ — Depository receipts 923,347 923,347 — — __________ __________ __________ _________
$ 45,607,490 $ 45,607,490 $ — $ — __________ __________ __________ _________ __________ __________ __________ _________
513

THE COLLECTIVE INVESTMENT FUNDS OF FIRST MERCANTILE TRUST COMPANY FMT Small Cap Aggressive Growth (CCI/Cupps) Fund
Schedule of Investments and Specific Fund Disclosures (continued) December 31, 2015
The accompanying notes are an integral part of these financial statements.
Investment transactions The aggregate cost of purchases of investment securities and proceeds from sales of investment securities (other than temporary cash investments) totaled $101,882,737 and $130,788,100, respectively, for the year ended December 31, 2015. Class-specific expenses Class-specific trustee fees for the year ended December 31, 2015 were as follows: Class R1 $ 100,248 Class R2 18,815 Class R3 24,066 Class R4 46,587 Class R5 70,275 Class R6 18,931 Class R7 25,073 Class R8 20,040 Class LifeStyle 92,133 $ 416,168
514

THE COLLECTIVE INVESTMENT FUNDS OF FIRST MERCANTILE TRUST COMPANY FMT Small Cap Aggressive Growth (CCI/Cupps) Fund
Schedule of Participant Transactions December 31, 2015
The accompanying notes are an integral part of these financial statements.
Participant transactions by class for the year ended December 31, 2015 were as follows: Dollars Units Purchases Redemptions Net change Purchases Redemptions Net change Class R1 $ 3,776,750 $ (21,066,949) $ (17,290,199) 147,564 (861,438) (713,874) Class R2 1,296,589 (1,754,810) (458,221) 86,925 (123,708) (36,783) Class R3 1,139,478 (2,001,291) (861,813) 80,167 (135,077) (54,910) Class R4 2,001,224 (4,193,091) (2,191,867) 134,791 (289,657) (154,866) Class R5 805,785 (3,850,771) (3,044,986) 55,850 (264,635) (208,785) Class R6 222,917 (455,616) (232,699) 15,869 (33,143) (17,274) Class R7 208,850 (729,214) (520,364) 15,037 (52,265) (37,228) Class R8 254,238 (538,949) (284,711) 17,825 (38,854) (21,029) Class LifeStyle 2,953,214 (7,760,127) (4,806,913) — — — $ 12,659,045 $ (42,350,818) $ (29,691,773) 554,028 (1,798,777) (1,244,749)
515

THE COLLECTIVE INVESTMENT FUNDS OF FIRST MERCANTILE TRUST COMPANY FMT Small Cap Aggressive Growth (CCI/Cupps) Fund
Financial Highlights December 31, 2015
The accompanying notes are an integral part of these financial statements.
Change in Net Asset Value Resulting from Operations Ratios (to average net
assets)
NAV per Unit, Beginning of
Period
Net Investment
Income (Loss)(a)
Net Realized and Unrealized
Gain (Loss) from
Investments
Total from Investment Activities
NAV per Unit, End of
Period Total
Return Expenses
Net Investment
Income (Loss)
Class R1 $ 24.8709 $ (0.2049) $ (1.6055) $ (1.8104) $ 23.0605 (7.28) % (1.11) % (0.81) % Class R2 14.5092 (0.1510) (0.9337) (1.0847) 13.4245 (7.48) % (1.32) % (1.03) % Class R3 14.3741 (0.1737) (0.9252) (1.0989) 13.2752 (7.65) % (1.49) % (1.20) % Class R4 14.5438 (0.2010) (0.9342) (1.1352) 13.4086 (7.81) % (1.67) % (1.37) % Class R5 14.2846 (0.2211) (0.9162) (1.1373) 13.1473 (7.96) % (1.83) % (1.54) % Class R6 14.2195 (0.2437) (0.9110) (1.1547) 13.0648 (8.12) % (2.00) % (1.71) % Class R7 13.9245 (0.2626) (0.8902) (1.1528) 12.7717 (8.28) % (2.17) % (1.88) % Class R8 14.2464 (0.2924) (0.9094) (1.2018) 13.0446 (8.44) % (2.34) % (2.05) % (a) Per unit amounts are based on average daily units outstanding.
516
FMT Small Cap Diversified Equity (Delaware) Fund

THE COLLECTIVE INVESTMENT FUNDS OF FIRST MERCANTILE TRUST COMPANY FMT Small Cap Diversified Equity (Delaware) Fund
Statement of Assets and Liabilities December 31, 2015
The accompanying notes are an integral part of these financial statements.
Assets Investments in securities, at fair value $ 16,543,024 Cash equivalents 391,895Receivables
Dividends and interest 13,714Total assets 16,948,633
Liabilities Trustee fees 8,221Sub-advisor fees 7,335
Total liabilities 15,556 Net assets $ 16,933,077 Components of net assets
Units of
Participation NAV
per Unit Net
Assets Class R1 55,375 $ 19.6958 $ 1,090,659Class R2 532,695 $ 10.1451 5,404,220Class R3 61,202 $ 16.3050 997,897Class R4 66,300 $ 16.9343 1,122,752Class R5 50,987 $ 17.9430 914,867Class R6 143,141 $ 15.9221 2,279,100Class R7 18,452 $ 17.4620 322,205Class LifeStyle 4,801,377
$ 16,933,077
517

THE COLLECTIVE INVESTMENT FUNDS OF FIRST MERCANTILE TRUST COMPANY FMT Small Cap Diversified Equity (Delaware) Fund
Statement of Operations For the Year Ended December 31, 2015
The accompanying notes are an integral part of these financial statements.
Investment income
Dividends $ 172,284Interest 591
172,875 Expenses
Trustee fees 114,226Sub-advisor fees 77,788Custody fees 28,735Audit fees 5,478
226,227 Net investment loss (53,352) Net realized gain from investments sold
Proceeds from sales of investments 7,511,479Cost of investments sold 6,216,273
Net realized gain from investments sold 1,295,206 Change in net unrealized appreciation (depreciation) on investments (1,616,619) Net realized and unrealized loss on investments (321,413) Other operating credits (charges) 28 Net decrease in net assets resulting from operations $ (374,737)
518

THE COLLECTIVE INVESTMENT FUNDS OF FIRST MERCANTILE TRUST COMPANY FMT Small Cap Diversified Equity (Delaware) Fund
Statement of Changes in Net Assets For the Year Ended December 31, 2015
The accompanying notes are an integral part of these financial statements.
Operations
Net investment loss $ (53,352)
Net realized gain from investments sold 1,295,206
Change in net unrealized appreciation (depreciation) on investments (1,616,619)
Other operating credits (charges) 28
Net decrease in net assets resulting from operations (374,737) Participant transactions
Proceeds from units purchased 8,642,428Less payments for units redeemed 6,390,498
Increase in net assets from participant transactions 2,251,930
Total increase in net assets 1,877,193 Net assets at beginning of year 15,055,884 Net assets at end of year $ 16,933,077
519
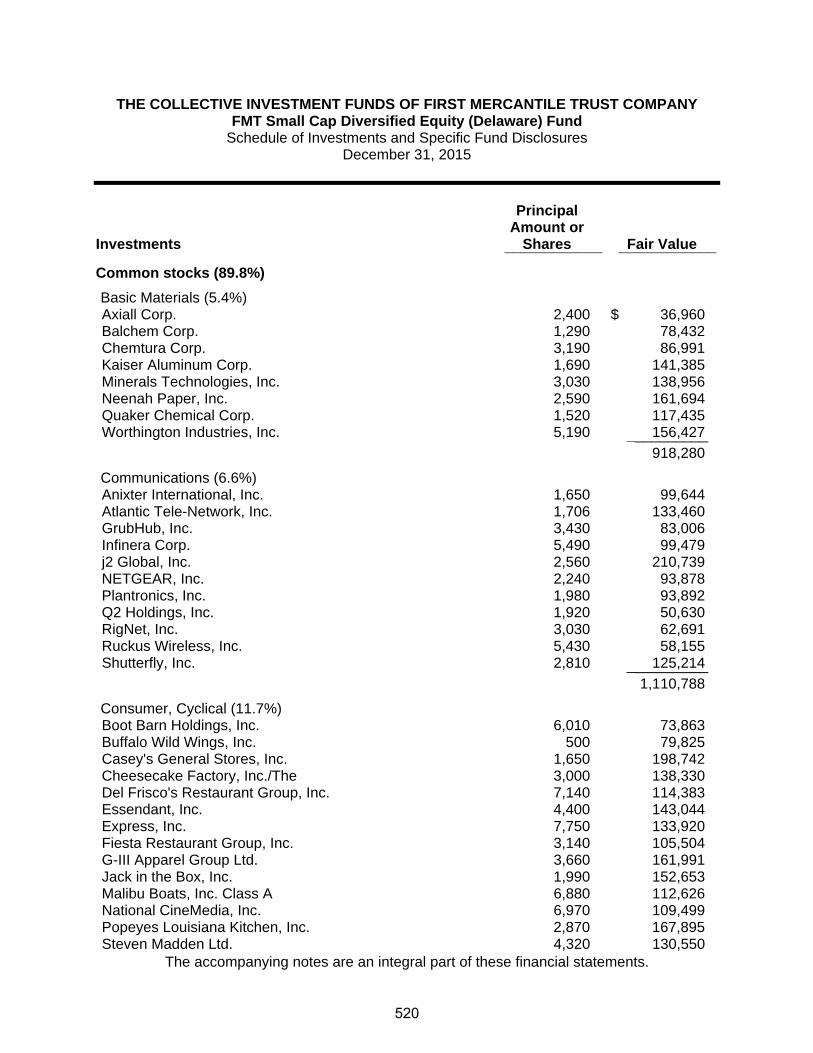
THE COLLECTIVE INVESTMENT FUNDS OF FIRST MERCANTILE TRUST COMPANY FMT Small Cap Diversified Equity (Delaware) Fund
Schedule of Investments and Specific Fund Disclosures December 31, 2015
The accompanying notes are an integral part of these financial statements.
Investments
Principal Amount or
Shares Fair Value ____________ ____________
Common stocks (89.8%)
Basic Materials (5.4%) Axiall Corp. 2,400 $ 36,960 Balchem Corp. 1,290 78,432 Chemtura Corp. 3,190 86,991 Kaiser Aluminum Corp. 1,690 141,385 Minerals Technologies, Inc. 3,030 138,956 Neenah Paper, Inc. 2,590 161,694 Quaker Chemical Corp. 1,520 117,435 Worthington Industries, Inc. 5,190 156,427 __________ 918,280
Communications (6.6%) Anixter International, Inc. 1,650 99,644 Atlantic Tele-Network, Inc. 1,706 133,460 GrubHub, Inc. 3,430 83,006 Infinera Corp. 5,490 99,479 j2 Global, Inc. 2,560 210,739 NETGEAR, Inc. 2,240 93,878 Plantronics, Inc. 1,980 93,892 Q2 Holdings, Inc. 1,920 50,630 RigNet, Inc. 3,030 62,691 Ruckus Wireless, Inc. 5,430 58,155 Shutterfly, Inc. 2,810 125,214 __________ 1,110,788
Consumer, Cyclical (11.7%) Boot Barn Holdings, Inc. 6,010 73,863 Buffalo Wild Wings, Inc. 500 79,825 Casey's General Stores, Inc. 1,650 198,742 Cheesecake Factory, Inc./The 3,000 138,330 Del Frisco's Restaurant Group, Inc. 7,140 114,383 Essendant, Inc. 4,400 143,044 Express, Inc. 7,750 133,920 Fiesta Restaurant Group, Inc. 3,140 105,504 G-III Apparel Group Ltd. 3,660 161,991 Jack in the Box, Inc. 1,990 152,653 Malibu Boats, Inc. Class A 6,880 112,626 National CineMedia, Inc. 6,970 109,499 Popeyes Louisiana Kitchen, Inc. 2,870 167,895 Steven Madden Ltd. 4,320 130,550
520
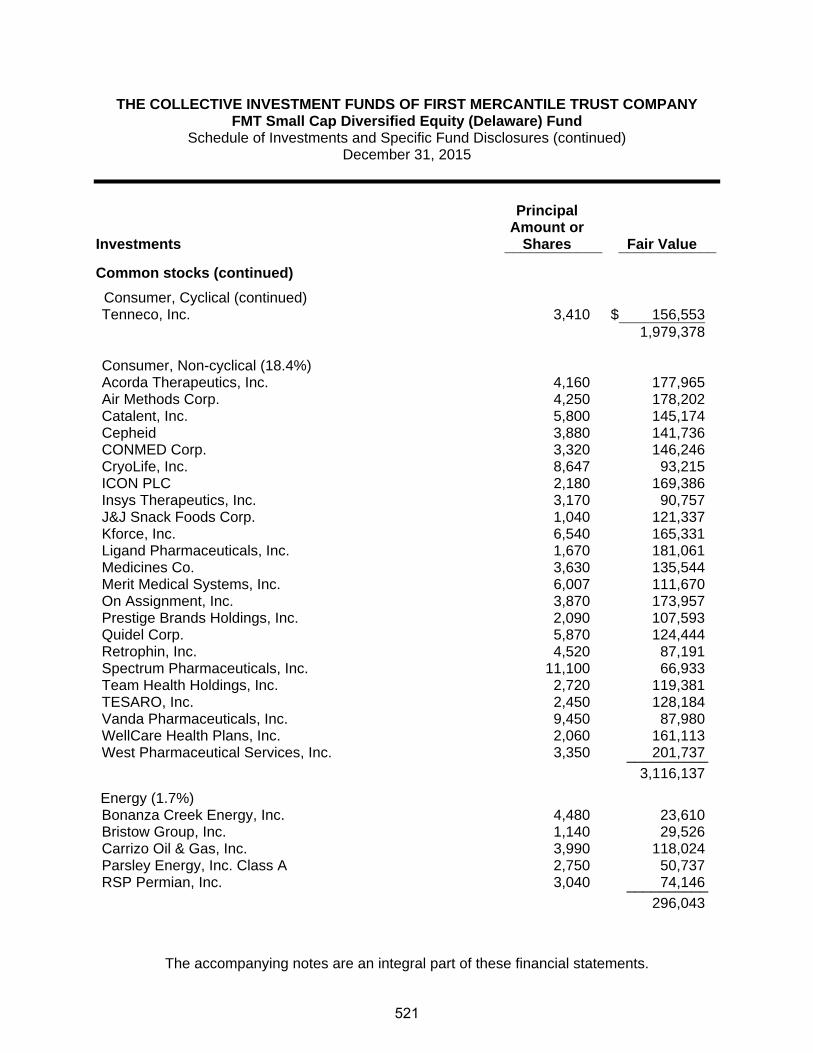
THE COLLECTIVE INVESTMENT FUNDS OF FIRST MERCANTILE TRUST COMPANY FMT Small Cap Diversified Equity (Delaware) Fund
Schedule of Investments and Specific Fund Disclosures (continued) December 31, 2015
The accompanying notes are an integral part of these financial statements.
Investments
Principal Amount or
Shares Fair Value ____________ ____________
Common stocks (continued)
Consumer, Cyclical (continued) Tenneco, Inc. 3,410 $ 156,553 1,979,378
Consumer, Non-cyclical (18.4%) Acorda Therapeutics, Inc. 4,160 177,965
Air Methods Corp. 4,250 178,202 Catalent, Inc. 5,800 145,174 Cepheid 3,880 141,736 CONMED Corp. 3,320 146,246 CryoLife, Inc. 8,647 93,215 ICON PLC 2,180 169,386 Insys Therapeutics, Inc. 3,170 90,757 J&J Snack Foods Corp. 1,040 121,337 Kforce, Inc. 6,540 165,331 Ligand Pharmaceuticals, Inc. 1,670 181,061 Medicines Co. 3,630 135,544 Merit Medical Systems, Inc. 6,007 111,670 On Assignment, Inc. 3,870 173,957 Prestige Brands Holdings, Inc. 2,090 107,593 Quidel Corp. 5,870 124,444 Retrophin, Inc. 4,520 87,191 Spectrum Pharmaceuticals, Inc. 11,100 66,933 Team Health Holdings, Inc. 2,720 119,381 TESARO, Inc. 2,450 128,184 Vanda Pharmaceuticals, Inc. 9,450 87,980 WellCare Health Plans, Inc. 2,060 161,113 West Pharmaceutical Services, Inc. 3,350 201,737 __________ 3,116,137
Energy (1.7%) Bonanza Creek Energy, Inc. 4,480 23,610 Bristow Group, Inc. 1,140 29,526 Carrizo Oil & Gas, Inc. 3,990 118,024 Parsley Energy, Inc. Class A 2,750 50,737 RSP Permian, Inc. 3,040 74,146 __________ 296,043
521

THE COLLECTIVE INVESTMENT FUNDS OF FIRST MERCANTILE TRUST COMPANY FMT Small Cap Diversified Equity (Delaware) Fund
Schedule of Investments and Specific Fund Disclosures (continued) December 31, 2015
The accompanying notes are an integral part of these financial statements.
Investments
Principal Amount or
Shares Fair Value ____________ ____________
Common stocks (continued)
Financial (18.6%) American Equity Investment Life Holding Co. 5,160 $ 123,995 BBCN Bancorp, Inc. 7,950 136,899 Bryn Mawr Bank Corp. 1,530 43,942 Cardinal Financial Corp. 5,050 114,888 City Holding Co. 2,991 136,509 CoBiz Financial, Inc. 5,630 75,555 Evercore Partners, Inc. Class A 2,870 155,181 First NBC Bank Holding Co. 2,990 111,796 FirstMerit Corp. 8,530 159,084 Flushing Financial Corp. 5,310 114,908 Great Western Bancorp, Inc. 5,090 147,712 Houlihan Lokey, Inc. 2,850 74,699 Independent Bank Corp. 2,220 103,274 Infinity Property & Casualty Corp. 1,270 104,432 Old National Bancorp 10,280 139,397 Primerica, Inc. 3,340 157,748 Prosperity Bancshares, Inc. 3,300 157,938 Selective Insurance Group, Inc. 4,190 140,700 Sterling Bancorp 11,160 181,015 Stifel Financial Corp. 3,780 160,121 Texas Capital Bancshares, Inc. 1,870 92,415 United Fire Group, Inc. 2,470 94,626 WageWorks, Inc. 2,950 133,842 Webster Financial Corp. 3,560 132,396 Western Alliance Bancorp 4,250 152,405 __________ 3,145,477
Industrial (12.0%) AAON, Inc. 6,788 157,617 Actuant Corp. Class A 3,230 77,391 Applied Industrial Technologies, Inc. 3,630 146,979 Barnes Group, Inc. 4,870 172,349 Boise Cascade Co. 3,170 80,930 Columbus McKinnon Corp. 6,664 125,950 Continental Building Products, Inc. 7,410 129,379 ESCO Technologies, Inc. 4,215 152,330 Esterline Technologies Corp. 540 43,740
522

THE COLLECTIVE INVESTMENT FUNDS OF FIRST MERCANTILE TRUST COMPANY FMT Small Cap Diversified Equity (Delaware) Fund
Schedule of Investments and Specific Fund Disclosures (continued) December 31, 2015
The accompanying notes are an integral part of these financial statements.
Investments
Principal Amount or
Shares Fair Value
Common stocks (continued) Industrial (continued)
Federal Signal Corp. 6,240 $ 98,904 Granite Construction, Inc. 4,020 172,498 Kadant, Inc. 3,700 150,257 KLX, Inc. 2,260 69,586 MYR Group, Inc. 3,830 78,936 Rofin-Sinar Technologies, Inc. 1,240 33,207 Swift Transportation Co. 3,460 47,817 Tetra Tech, Inc. 4,340 112,927 US Ecology, Inc. 1,710 62,312 XPO Logistics, Inc. 4,120 112,270 __________ 2,025,379
Technology (13.4%) Applied Micro Circuits Corp. 17,510 111,539 Callidus Software, Inc. 8,110 150,603 Convergys Corp. 6,510 162,034 ExlService Holdings, Inc. 3,510 157,704 Guidewire Software, Inc. 2,910 175,066 inContact, Inc. 14,840 141,574 InterXion Holding N.V. 3,220 97,083 MaxLinear, Inc. Class A 5,160 76,007 Microsemi Corp. 2,460 80,171 Proofpoint, Inc. 2,620 170,326 Qlik Technologies, Inc. 4,140 131,072 SciQuest, Inc. 7,380 95,719 Semtech Corp. 7,850 148,522 Silicon Laboratories, Inc. 1,530 74,266 Synaptics, Inc. 2,330 187,192 TeleTech Holdings, Inc. 4,010 111,919 Tyler Technologies, Inc. 1,170 203,954 __________ 2,274,751
Utilities (2.0%) Cleco Corp. 2,580 134,702 NorthWestern Corp. 3,010 163,292
523
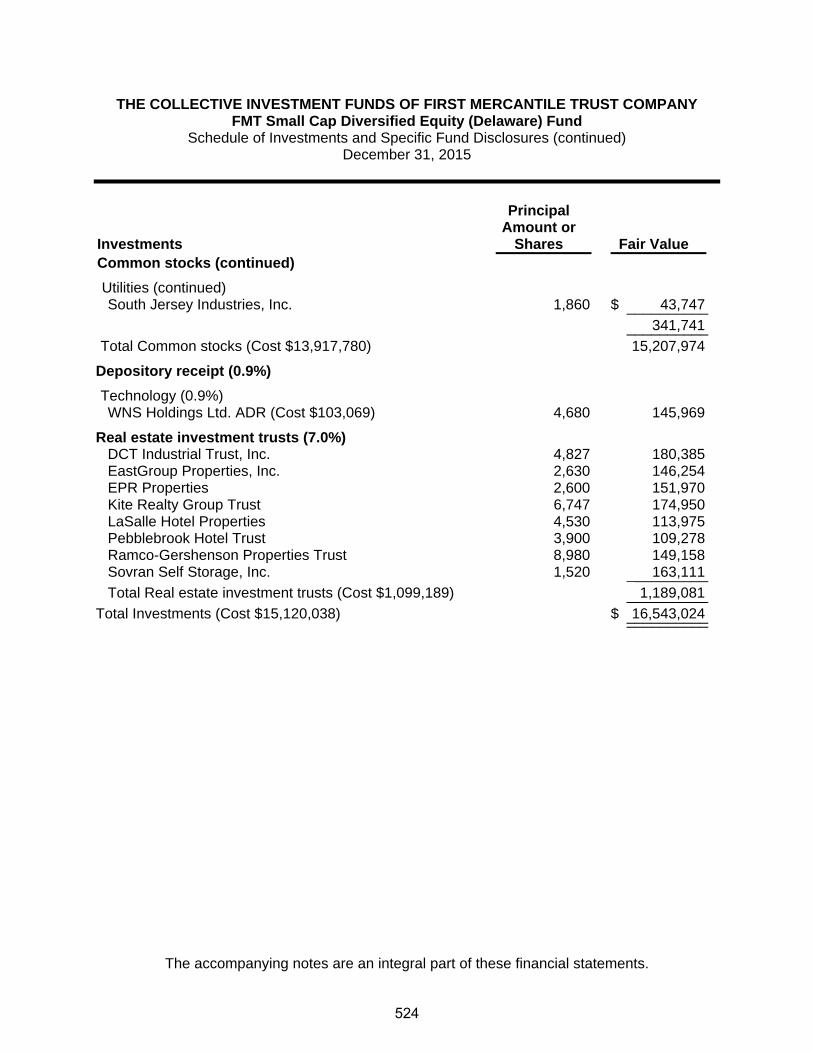
THE COLLECTIVE INVESTMENT FUNDS OF FIRST MERCANTILE TRUST COMPANY FMT Small Cap Diversified Equity (Delaware) Fund
Schedule of Investments and Specific Fund Disclosures (continued) December 31, 2015
The accompanying notes are an integral part of these financial statements.
Investments
Principal Amount or
Shares Fair Value Common stocks (continued)
Utilities (continued) South Jersey Industries, Inc. 1,860 $ 43,747 __________ 341,741 __________ Total Common stocks (Cost $13,917,780) 15,207,974
Depository receipt (0.9%)
Technology (0.9%) WNS Holdings Ltd. ADR (Cost $103,069) 4,680 145,969
Real estate investment trusts (7.0%) DCT Industrial Trust, Inc. 4,827 180,385 EastGroup Properties, Inc. 2,630 146,254 EPR Properties 2,600 151,970 Kite Realty Group Trust 6,747 174,950 LaSalle Hotel Properties 4,530 113,975 Pebblebrook Hotel Trust 3,900 109,278 Ramco-Gershenson Properties Trust 8,980 149,158 Sovran Self Storage, Inc. 1,520 163,111 __________ Total Real estate investment trusts (Cost $1,099,189) 1,189,081 __________Total Investments (Cost $15,120,038) $ 16,543,024 ____________________
524

THE COLLECTIVE INVESTMENT FUNDS OF FIRST MERCANTILE TRUST COMPANY FMT Small Cap Diversified Equity (Delaware) Fund
Schedule of Investments and Specific Fund Disclosures (continued) December 31, 2015
The accompanying notes are an integral part of these financial statements.
Specific Fund Disclosures Fair value The inputs or methodology used for valuing securities may not be indicative of the risks associated with investing in those securities. For more information on valuation inputs, and their aggregation into the levels used in the table below, please refer to note 4 to the financial statements. The following table sets forth by level, within the fair value hierarchy, the Fund's investments measured at fair value.
Total Level 1 Level 2 Level 3
Common stocks $ 15,207,974 $ 15,207,974 $ — $ —Depository receipt 145,969 145,969 — —Real estate investment trusts 1,189,081 1,189,081 — —__________ __________ __________ _________
$ 16,543,024 $ 16,543,024 $ — $ —__________ __________ __________ ___________________ __________ __________ _________ Investment transactions The aggregate cost of purchases of investment securities and proceeds from sales of investment securities (other than temporary cash investments) totaled $9,706,492 and $7,511,479, respectively, for the year ended December 31, 2015. Class-specific expenses Class-specific trustee fees for the year ended December 31, 2015 were as follows: Class R1 $ 8,704 Class R2 10,463 Class R3 4,728 Class R4 12,352 Class R5 10,581 Class R6 30,483 Class R7 4,592 Class R8 12 Class LifeStyle 32,311 $ 114,226
525

THE COLLECTIVE INVESTMENT FUNDS OF FIRST MERCANTILE TRUST COMPANY FMT Small Cap Diversified Equity (Delaware) Fund
Schedule of Participant Transactions December 31, 2015
The accompanying notes are an integral part of these financial statements.
Participant transactions by class for the year ended December 31, 2015 were as follows: Dollars Units Purchases Redemptions Net change Purchases Redemptions Net change Class R1 $ 513,910 $ (2,598,750) $ (2,084,840) 25,214 (126,629) (101,415)Class R2 5,425,726 (260,105) 5,165,621 542,515 (18,917) 523,598Class R3 693,490 (27,493) 665,997 41,457 (1,671) 39,786Class R4 451,414 (831,036) (379,622) 26,227 (47,361) (21,134)Class R5 81,721 (130,091) (48,370) 4,378 (6,864) (2,486)Class R6 284,984 (358,995) (74,011) 17,215 (22,316) (5,101)Class R7 27,367 (5,589) 21,778 1,526 (308) 1,218Class R8 — (71,070) (71,070) — (4,577) (4,577)Class LifeStyle 1,163,816 (2,107,369) (943,553) — — — $ 8,642,428 $ (6,390,498) $ 2,251,930 658,532 (228,643) 429,889
526
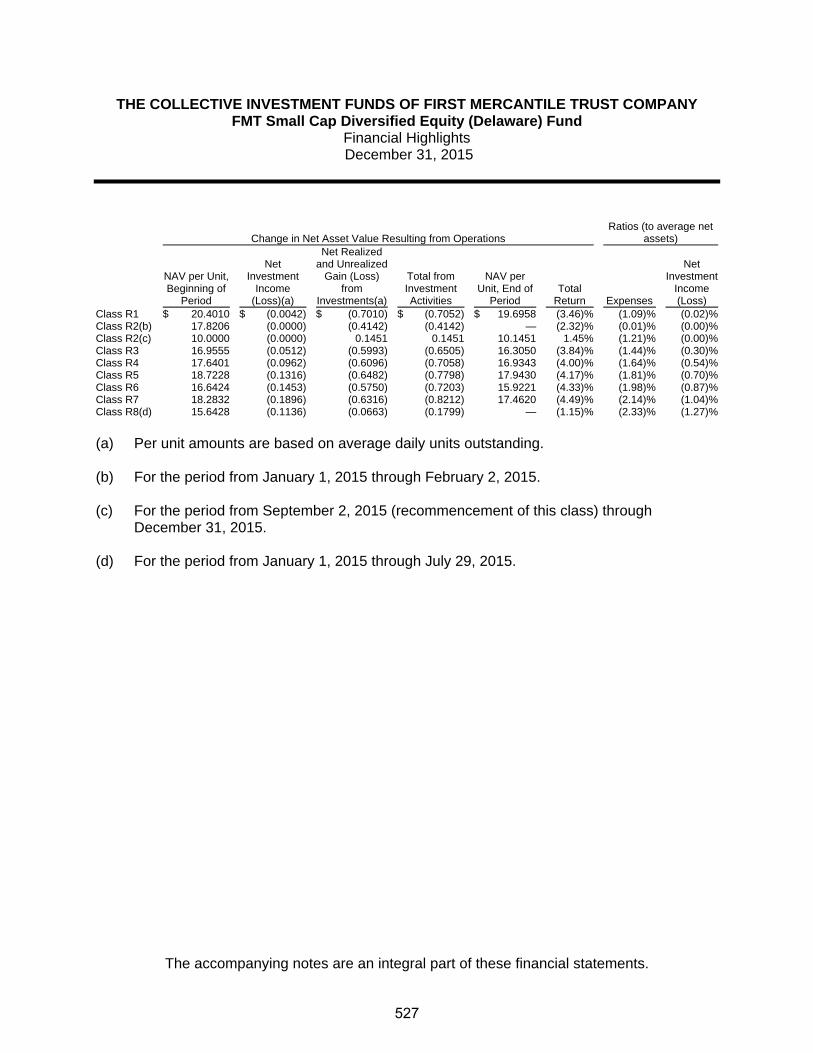
THE COLLECTIVE INVESTMENT FUNDS OF FIRST MERCANTILE TRUST COMPANY FMT Small Cap Diversified Equity (Delaware) Fund
Financial Highlights December 31, 2015
The accompanying notes are an integral part of these financial statements.
Change in Net Asset Value Resulting from Operations Ratios (to average net
assets)
NAV per Unit, Beginning of
Period
Net Investment
Income (Loss)(a)
Net Realized and Unrealized
Gain (Loss) from
Investments(a)
Total from Investment Activities
NAV per Unit, End of
Period Total
Return Expenses
Net Investment
Income (Loss)
Class R1 $ 20.4010 $ (0.0042) $ (0.7010) $ (0.7052) $ 19.6958 (3.46)% (1.09)% (0.02)%Class R2(b) 17.8206 (0.0000) (0.4142) (0.4142) — (2.32)% (0.01)% (0.00)%Class R2(c) 10.0000 (0.0000) 0.1451 0.1451 10.1451 1.45% (1.21)% (0.00)%Class R3 16.9555 (0.0512) (0.5993) (0.6505) 16.3050 (3.84)% (1.44)% (0.30)%Class R4 17.6401 (0.0962) (0.6096) (0.7058) 16.9343 (4.00)% (1.64)% (0.54)%Class R5 18.7228 (0.1316) (0.6482) (0.7798) 17.9430 (4.17)% (1.81)% (0.70)%Class R6 16.6424 (0.1453) (0.5750) (0.7203) 15.9221 (4.33)% (1.98)% (0.87)%Class R7 18.2832 (0.1896) (0.6316) (0.8212) 17.4620 (4.49)% (2.14)% (1.04)%Class R8(d) 15.6428 (0.1136) (0.0663) (0.1799) — (1.15)% (2.33)% (1.27)%
(a) Per unit amounts are based on average daily units outstanding.
(b) For the period from January 1, 2015 through February 2, 2015.
(c) For the period from September 2, 2015 (recommencement of this class) through
December 31, 2015.
(d) For the period from January 1, 2015 through July 29, 2015.
527

FMT Small Cap Intrinsic Value (MetWest) Fund
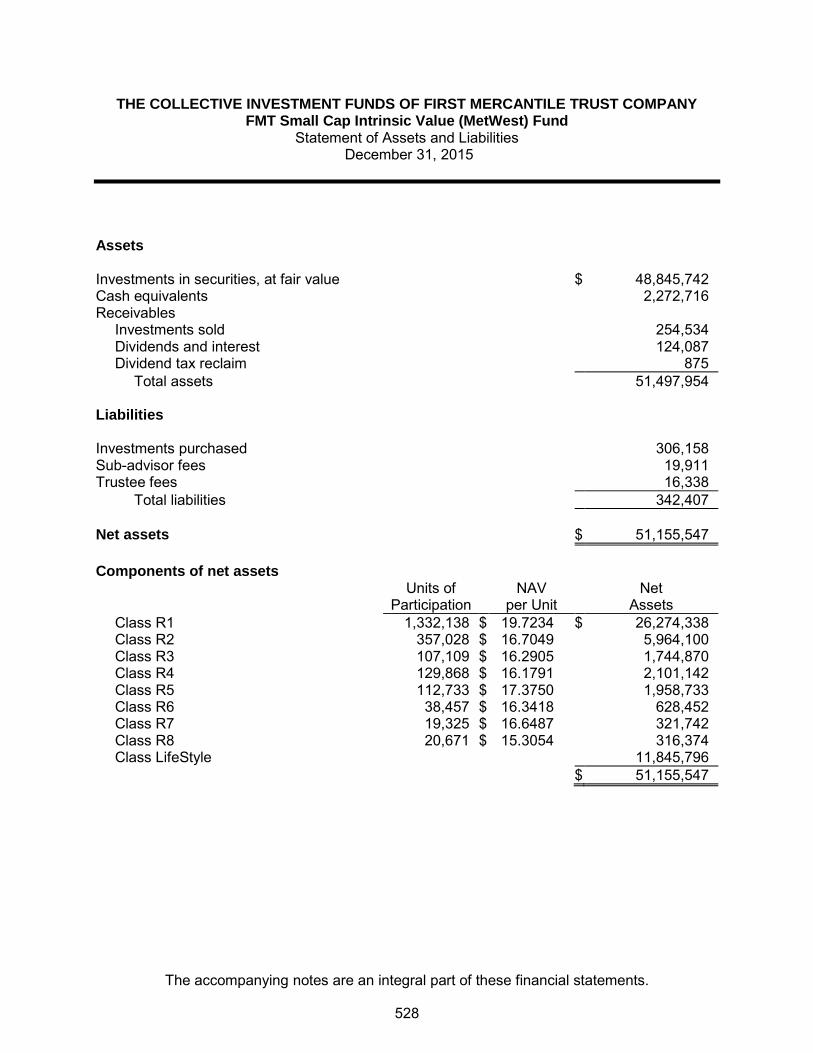
THE COLLECTIVE INVESTMENT FUNDS OF FIRST MERCANTILE TRUST COMPANY FMT Small Cap Intrinsic Value (MetWest) Fund
Statement of Assets and Liabilities December 31, 2015
The accompanying notes are an integral part of these financial statements.
Assets Investments in securities, at fair value $ 48,845,742 Cash equivalents 2,272,716
Receivables
Investments sold 254,534
Dividends and interest 124,087
Dividend tax reclaim 875
Total assets 51,497,954
Liabilities Investments purchased 306,158
Sub-advisor fees 19,911
Trustee fees 16,338
Total liabilities 342,407
Net assets $ 51,155,547
Components of net assets
Units of
Participation NAV
per Unit Net
Assets Class R1 1,332,138 $ 19.7234 $ 26,274,338
Class R2 357,028 $ 16.7049 5,964,100
Class R3 107,109 $ 16.2905 1,744,870
Class R4 129,868 $ 16.1791 2,101,142
Class R5 112,733 $ 17.3750 1,958,733
Class R6 38,457 $ 16.3418 628,452
Class R7 19,325 $ 16.6487 321,742
Class R8 20,671 $ 15.3054 316,374
Class LifeStyle 11,845,796
$ 51,155,547
528

THE COLLECTIVE INVESTMENT FUNDS OF FIRST MERCANTILE TRUST COMPANY FMT Small Cap Intrinsic Value (MetWest) Fund
Statement of Operations For the Year Ended December 31, 2015
The accompanying notes are an integral part of these financial statements.
Investment income
Dividends (net of foreign withholding taxes of $3,683) $ 1,099,996
Interest 2,438
1,102,434
Expenses
Trustee fees 309,482
Sub-advisor fees 274,477
Custody fees 23,238
Audit fees 5,723
612,920
Net investment income 489,514
Net realized gain from investments sold
Proceeds from sales of investments 84,680,670
Cost of investments sold 76,894,271
Net realized gain from investments sold 7,786,399
Change in net unrealized appreciation (depreciation) on investments (11,522,893) Net realized and unrealized loss on investments (3,736,494) Other operating credits (charges) 2,554
Net decrease in net assets resulting from operations $ (3,244,426)
529

THE COLLECTIVE INVESTMENT FUNDS OF FIRST MERCANTILE TRUST COMPANY FMT Small Cap Intrinsic Value (MetWest) Fund
Statement of Changes in Net Assets For the Year Ended December 31, 2015
The accompanying notes are an integral part of these financial statements.
Operations
Net investment income $ 489,514
Net realized gain from investments sold 7,786,399
Change in net unrealized appreciation (depreciation) on investments (11,522,893)
Other operating credits (charges) 2,554
Net decrease in net assets resulting from operations (3,244,426)
Participant transactions
Proceeds from units purchased 15,744,773
Less payments for units redeemed 22,225,787
Decrease in net assets from participant transactions (6,481,014)
Total decrease in net assets (9,725,440)
Net assets at beginning of year 60,880,987
Net assets at end of year $ 51,155,547
530
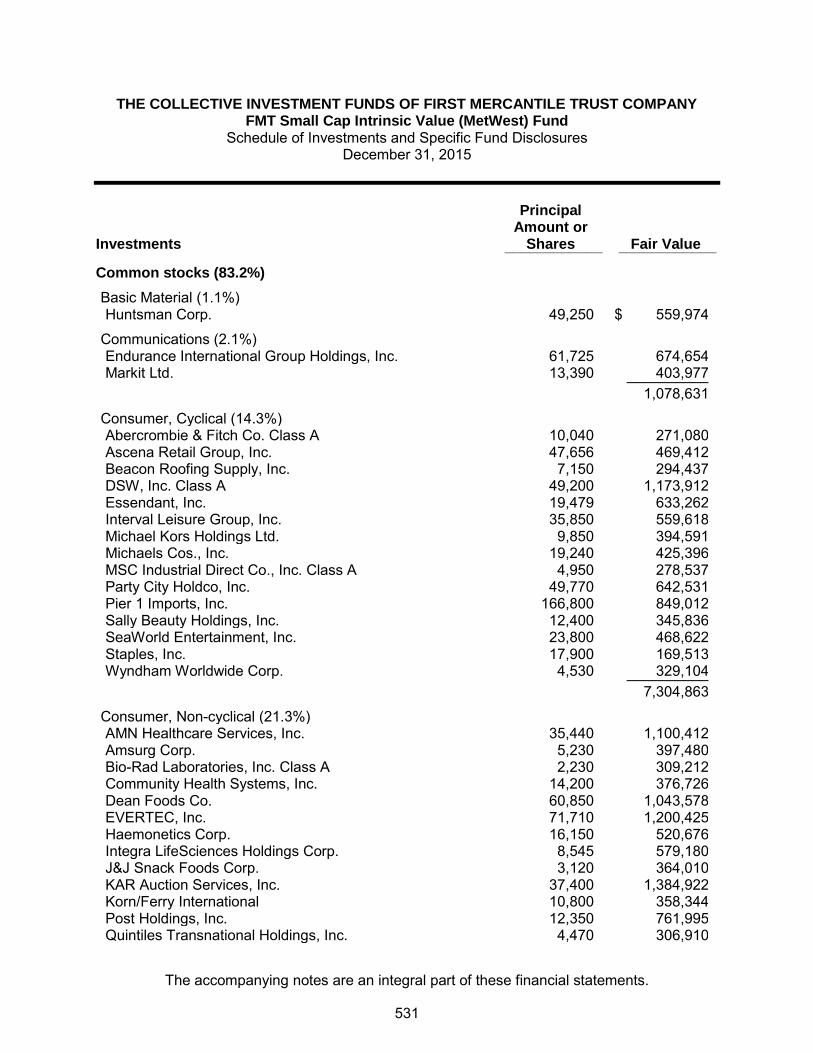
THE COLLECTIVE INVESTMENT FUNDS OF FIRST MERCANTILE TRUST COMPANY FMT Small Cap Intrinsic Value (MetWest) Fund
Schedule of Investments and Specific Fund Disclosures December 31, 2015
The accompanying notes are an integral part of these financial statements.
Investments
Principal Amount or
Shares Fair Value ____________ ____________
Common stocks (83.2%)
Basic Material (1.1%) Huntsman Corp. 49,250 $ 559,974
Communications (2.1%) Endurance International Group Holdings, Inc. 61,725 674,654 Markit Ltd. 13,390 403,977 __________ 1,078,631
Consumer, Cyclical (14.3%) Abercrombie & Fitch Co. Class A 10,040 271,080 Ascena Retail Group, Inc. 47,656 469,412 Beacon Roofing Supply, Inc. 7,150 294,437 DSW, Inc. Class A 49,200 1,173,912 Essendant, Inc. 19,479 633,262 Interval Leisure Group, Inc. 35,850 559,618 Michael Kors Holdings Ltd. 9,850 394,591 Michaels Cos., Inc. 19,240 425,396 MSC Industrial Direct Co., Inc. Class A 4,950 278,537 Party City Holdco, Inc. 49,770 642,531 Pier 1 Imports, Inc. 166,800 849,012 Sally Beauty Holdings, Inc. 12,400 345,836 SeaWorld Entertainment, Inc. 23,800 468,622 Staples, Inc. 17,900 169,513 Wyndham Worldwide Corp. 4,530 329,104 __________ 7,304,863
Consumer, Non-cyclical (21.3%) AMN Healthcare Services, Inc. 35,440 1,100,412 Amsurg Corp. 5,230 397,480 Bio-Rad Laboratories, Inc. Class A 2,230 309,212 Community Health Systems, Inc. 14,200 376,726 Dean Foods Co. 60,850 1,043,578 EVERTEC, Inc. 71,710 1,200,425 Haemonetics Corp. 16,150 520,676 Integra LifeSciences Holdings Corp. 8,545 579,180 J&J Snack Foods Corp. 3,120 364,010 KAR Auction Services, Inc. 37,400 1,384,922 Korn/Ferry International 10,800 358,344 Post Holdings, Inc. 12,350 761,995 Quintiles Transnational Holdings, Inc. 4,470 306,910
531

THE COLLECTIVE INVESTMENT FUNDS OF FIRST MERCANTILE TRUST COMPANY FMT Small Cap Intrinsic Value (MetWest) Fund
Schedule of Investments and Specific Fund Disclosures (continued) December 31, 2015
The accompanying notes are an integral part of these financial statements.
Investments
Principal Amount or
Shares Fair Value ____________ ____________
Common stocks (continued)
Consumer, Non-cyclical (continued) Resources Connection, Inc. 32,100 $ 524,514 Sabre Corp. 15,750 440,528 STERIS PLC 12,983 978,139 Treasury Wine Estates Ltd. 45,200 273,379 __________ 10,920,430
Energy (8.4%) Cobalt International Energy, Inc. 47,051 254,075 Core Laboratories N.V. 3,230 351,230 Diamondback Energy, Inc. 13,610 910,509 Dril-Quip, Inc. 7,200 426,456 Encana Corp. 49,520 252,057 FMC Technologies, Inc. 8,250 239,333 Forum Energy Technologies, Inc. 26,000 323,960 Laredo Petroleum, Inc. 45,800 365,942 Oasis Petroleum, Inc. 72,470 534,104 RSP Permian, Inc. 16,350 398,776 Weatherford International PLC 28,150 236,179 __________ 4,292,621
Financial (21.9%) AerCap Holdings N.V. 9,750 420,810 Affiliated Managers Group, Inc. 2,230 356,265 Artisan Partners Asset Management, Inc. Class A 21,450 773,487 Associated Banc-Corp 17,200 322,500 CIT Group, Inc. 10,130 402,161 CoreLogic, Inc. 15,096 511,151 Encore Capital Group, Inc. 14,950 434,746 Endurance Specialty Holdings Ltd. 15,250 975,847 Essent Group Ltd. 41,300 904,057 FirstMerit Corp. 35,300 658,345 Hancock Holding Co. 20,100 505,917 Ocwen Financial Corp. 149,800 1,044,106 OneMain Holdings, Inc. 6,420 266,687 Sterling Bancorp 34,650 562,023 Stifel Financial Corp. 8,040 340,574 Umpqua Holdings Corp. 40,000 636,000 Virtus Investment Partners, Inc. 4,770 560,284
532

THE COLLECTIVE INVESTMENT FUNDS OF FIRST MERCANTILE TRUST COMPANY FMT Small Cap Intrinsic Value (MetWest) Fund
Schedule of Investments and Specific Fund Disclosures (continued) December 31, 2015
The accompanying notes are an integral part of these financial statements.
Investments
Principal Amount or
Shares Fair Value
Common stocks (continued) Financial (continued)
Webster Financial Corp. 10,450 $ 388,636 Zions Bancorp 41,400 1,130,220 __________ 11,193,816
Industrial (10.7%) Actuant Corp. Class A 17,076 409,141 AMETEK, Inc. 7,380 395,494 IDEX Corp. 5,880 450,467 Jabil Circuit, Inc. 17,600 409,904 Kirby Corp. 9,245 486,472 Landstar System, Inc. 13,740 805,851 Manitowoc Co., Inc. 66,350 1,018,472 Silgan Holdings, Inc. 19,450 1,044,854 Tetra Tech, Inc. 16,500 429,330 __________ 5,449,985
Technology (1.4%) Avid Technology, Inc. 46,800 341,172 Citrix Systems, Inc. 5,200 393,380 __________ 734,552
Utility (2.0%) Westar Energy, Inc. 24,250 1,028,442 __________ Total Common stocks (Cost $46,380,812) 42,563,314
Depository receipts (1.8%)
Consumer, Non-cyclical (0.9%) Treasury Wine Estates Ltd. ADR 78,154 468,924
Technology (0.9%) Wincor Nixdorf AG ADR 46,500 474,300 __________ Total Depository receipts (Cost $694,906) 943,224
Exchange-traded fund (0.7%) iShares Russell 2000 Value ETF (Cost $350,816) 3,648 335,652
533

THE COLLECTIVE INVESTMENT FUNDS OF FIRST MERCANTILE TRUST COMPANY FMT Small Cap Intrinsic Value (MetWest) Fund
Schedule of Investments and Specific Fund Disclosures (continued) December 31, 2015
The accompanying notes are an integral part of these financial statements.
Investments
Principal Amount or
Shares Fair Value
Real estate investment trusts (9.8%) Financial Equity Commonwealth 13,091 363,014 Ladder Capital Corp. 26,300 326,646 Mack-Cali Realty Corp. 36,380 849,473 New Residential Investment Corp. 72,490 881,478 Parkway Properties Inc. 65,400 1,022,202 PennyMac Mortgage Investment Trust 39,650 605,059 Redwood Trust, Inc. 72,400 955,680 __________ Total Real estate investment trusts (Cost $5,888,300) 5,003,552 __________ Total Investments (Cost $53,314,834) $ 48,845,742 __________ __________ Specific Fund Disclosures Fair value The inputs or methodology used for valuing securities may not be indicative of the risks associated with investing in those securities. For more information on valuation inputs, and their aggregation into the levels used in the table below, please refer to note 4 to the financial statements. The following table sets forth by level, within the fair value hierarchy, the Fund's investments measured at fair value.
Total Level 1 Level 2 Level 3
Common stocks $ 42,563,314 $ 42,563,314 $ — $ — Depository receipts 943,224 943,224 — — Exchange-traded fund 335,652 335,652 — — Real estate investment trusts 5,003,552 5,003,552 — — __________ __________ __________ _________
$ 48,845,742 $ 48,845,742 $ — $ — __________ __________ __________ _________ __________ __________ __________ _________ Investment transactions The aggregate cost of purchases of investment securities and proceeds from sales of investment securities (other than temporary cash investments) totaled $78,769,818 and $84,680,670, respectively, for the year ended December 31, 2015.
534

THE COLLECTIVE INVESTMENT FUNDS OF FIRST MERCANTILE TRUST COMPANY FMT Small Cap Intrinsic Value (MetWest) Fund
Schedule of Investments and Specific Fund Disclosures (continued) December 31, 2015
The accompanying notes are an integral part of these financial statements.
Class-specific expenses Class-specific trustee fees for the year ended December 31, 2015 were as follows: Class R1 $ 102,592 Class R2 38,199 Class R3 20,190 Class R4 20,813 Class R5 30,248 Class R6 8,609 Class R7 5,420 Class R8 5,278 Class LifeStyle 78,133 $ 309,482
535

THE COLLECTIVE INVESTMENT FUNDS OF FIRST MERCANTILE TRUST COMPANY FMT Small Cap Intrinsic Value (MetWest) Fund
Schedule of Participant Transactions December 31, 2015
The accompanying notes are an integral part of these financial statements.
Participant transactions by class for the year ended December 31, 2015 were as follows: Dollars Units Purchases Redemptions Net change Purchases Redemptions Net change Class R1 $ 5,499,883 $ (8,561,579) $ (3,061,696) 260,261 (401,224) (140,963) Class R2 1,542,565 (2,434,655) (892,090) 88,182 (135,631) (47,449) Class R3 1,752,684 (3,052,526) (1,299,842) 101,900 (175,310) (73,410) Class R4 1,052,090 (1,197,757) (145,667) 61,544 (68,261) (6,717) Class R5 281,731 (1,343,836) (1,062,105) 15,066 (72,944) (57,878) Class R6 77,222 (89,526) (12,304) 4,432 (5,289) (857) Class R7 62,484 (114,501) (52,017) 3,488 (6,319) (2,831) Class R8 55,033 (211,206) (156,173) 3,366 (13,159) (9,793) Class LifeStyle 5,421,081 (5,220,201) 200,880 — — — $ 15,744,773 $ (22,225,787) $ (6,481,014) 538,239 (878,137) (339,898)
536

THE COLLECTIVE INVESTMENT FUNDS OF FIRST MERCANTILE TRUST COMPANY FMT Small Cap Intrinsic Value (MetWest) Fund
Financial Highlights December 31, 2015
The accompanying notes are an integral part of these financial statements.
Change in Net Asset Value Resulting from Operations Ratios (to average net
assets)
NAV per Unit, Beginning of
Period
Net Investment
Income (Loss)(a)
Net Realized and Unrealized
Gain (Loss) from
Investments(a)
Total from Investment Activities
NAV per Unit, End of
Period Total
Return Expenses
Net Investment
Income (Loss)
Class R1 $ 20.9792 $ 0.2155 $ (1.4713) $ (1.2558) $ 19.7234 (5.99) % (0.86) % 1.02 % Class R2 17.8078 0.1435 (1.2464) (1.1029) 16.7049 (6.19) % (1.08) % 0.80 % Class R3 17.3961 0.0991 (1.2047) (1.1056) 16.2905 (6.36) % (1.26) % 0.56 % Class R4 17.3068 0.0802 (1.2079) (1.1277) 16.1791 (6.52) % (1.43) % 0.46 % Class R5 18.6161 0.0475 (1.2886) (1.2411) 17.3750 (6.67) % (1.60) % 0.25 % Class R6 17.5407 0.0235 (1.2224) (1.1989) 16.3418 (6.84) % (1.76) % 0.13 % Class R7 17.9007 (0.0113) (1.2407) (1.2520) 16.6487 (6.99) % (1.94) % (0.06) % Class R8 16.4847 (0.0347) (1.1446) (1.1793) 15.3054 (7.15) % (2.10) % (0.21) % (a) Per unit amounts are based on average daily units outstanding.
537
FMT Small Cap Value (Opus) Fund
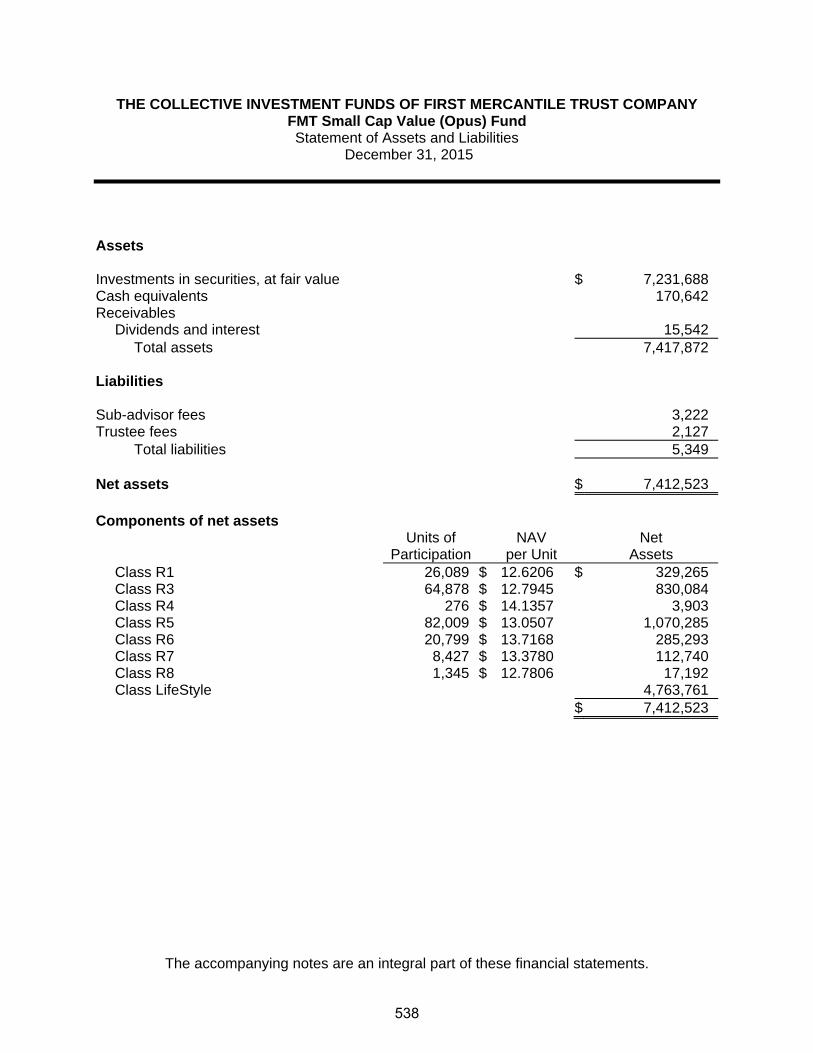
THE COLLECTIVE INVESTMENT FUNDS OF FIRST MERCANTILE TRUST COMPANY FMT Small Cap Value (Opus) Fund Statement of Assets and Liabilities
December 31, 2015
The accompanying notes are an integral part of these financial statements.
Assets Investments in securities, at fair value $ 7,231,688 Cash equivalents 170,642Receivables
Dividends and interest 15,542Total assets 7,417,872
Liabilities Sub-advisor fees 3,222Trustee fees 2,127
Total liabilities 5,349 Net assets $ 7,412,523 Components of net assets
Units of
Participation NAV
per Unit Net
Assets Class R1 26,089 $ 12.6206 $ 329,265Class R3 64,878 $ 12.7945 830,084Class R4 276 $ 14.1357 3,903Class R5 82,009 $ 13.0507 1,070,285Class R6 20,799 $ 13.7168 285,293Class R7 8,427 $ 13.3780 112,740Class R8 1,345 $ 12.7806 17,192Class LifeStyle 4,763,761
$ 7,412,523
538

THE COLLECTIVE INVESTMENT FUNDS OF FIRST MERCANTILE TRUST COMPANY FMT Small Cap Value (Opus) Fund
Statement of Operations For the Year Ended December 31, 2015
The accompanying notes are an integral part of these financial statements.
Investment income
Dividends $ 144,592Interest 180
144,772 Expenses
Trustee fees 59,410Sub-advisor fees 43,129Custody fees 14,574Audit fees 5,478
122,591 Net investment income 22,181 Net realized gain from investments sold
Proceeds from sales of investments 7,644,646Cost of investments sold 7,224,414
Net realized gain from investments sold 420,232 Change in net unrealized appreciation (depreciation) on investments (736,407) Net realized and unrealized loss on investments (316,175) Other operating credits (charges) 29 Net decrease in net assets resulting from operations $ (293,965)
539

THE COLLECTIVE INVESTMENT FUNDS OF FIRST MERCANTILE TRUST COMPANY FMT Small Cap Value (Opus) Fund Statement of Changes in Net Assets
For the Year Ended December 31, 2015
The accompanying notes are an integral part of these financial statements.
Operations
Net investment income $ 22,181
Net realized gain from investments sold 420,232
Change in net unrealized appreciation (depreciation) on investments (736,407)
Other operating credits (charges) 29
Net decrease in net assets resulting from operations (293,965) Participant transactions
Proceeds from units purchased 2,030,726Less payments for units redeemed 3,450,223
Decrease in net assets from participant transactions (1,419,497)
Total decrease in net assets (1,713,462) Net assets at beginning of year 9,125,985 Net assets at end of year $ 7,412,523
540

THE COLLECTIVE INVESTMENT FUNDS OF FIRST MERCANTILE TRUST COMPANY FMT Small Cap Value (Opus) Fund
Schedule of Investments and Specific Fund Disclosures December 31, 2015
The accompanying notes are an integral part of these financial statements.
Investments
Principal Amount or
Shares Fair Value ____________ ____________
Common stocks (87.0%)
Basic Material (1.8%) Innospec, Inc. 2,500 $ 135,775
Communication (1.3%) Alliance Fiber Optic Products, Inc. 6,100 92,476
Consumer, Cyclical (12.9%) Caleres, Inc. 3,300 88,506 Cooper Tire & Rubber Co. 2,850 107,873 Express, Inc. 5,650 97,632 Finish Line, Inc./The Class A 4,100 74,128 Knoll, Inc. 4,650 87,420 Ruth's Hospitality Group, Inc. 6,250 99,500 ScanSource, Inc. 3,000 96,660 Thor Industries, Inc. 1,900 106,685 UniFirst Corp. 1,000 104,200 Wabash National Corp. 8,200 97,006 __________ 959,610
Consumer, Non-cyclical (17.4%) Aaron's, Inc. 2,900 64,931 ACCO Brands Corp. 12,750 90,907 Analogic Corp. 950 78,470 Barrett Business Services, Inc. 2,350 102,319 Deluxe Corp. 1,650 89,991 Ensign Group, Inc./The 3,000 67,890 Helen of Troy Ltd. 700 65,975 Kforce, Inc. 3,400 85,952 Lannett Co., Inc. 1,250 50,150 LifePoint Health, Inc. 1,350 99,090 Navigant Consulting, Inc. 7,450 119,647 PharMerica Corp. 3,950 138,250 Providence Service Corp./The 2,750 129,030 TrueBlue, Inc. 4,150 106,904 __________ 1,289,506
Energy (2.3%) Par Pacific Holdings, Inc. 4,500 105,930 Western Refining, Inc. 1,900 67,678 __________ 173,608
541

THE COLLECTIVE INVESTMENT FUNDS OF FIRST MERCANTILE TRUST COMPANY FMT Small Cap Value (Opus) Fund
Schedule of Investments and Specific Fund Disclosures (continued) December 31, 2015
The accompanying notes are an integral part of these financial statements.
Investments
Principal Amount or
Shares Fair Value ____________ ____________
Common stocks (continued)
Financial (22.7%) AMERISAFE, Inc. 2,550 $ 129,795 Ares Capital Corp. 7,770 110,722 Banc of California, Inc. 6,650 97,223 BBCN Bancorp, Inc. 6,050 104,181 Cardinal Financial Corp. 4,500 102,375 Customers Bancorp, Inc. 4,150 112,963 Employers Holdings, Inc. 3,850 105,105 Endurance Specialty Holdings Ltd. 1,350 86,387 Enstar Group Ltd. 820 123,033 Federated National Holding Co. 3,450 101,982 First NBC Bank Holding Co. 2,850 106,561 Great Southern Bancorp, Inc. 2,200 99,572 Horace Mann Educators Corp. 2,500 82,950 Lakeland Financial Corp. 2,050 95,571 Navigators Group, Inc./The 796 68,289 RMR Group, Inc./The Class A 64 922 State Bank Financial Corp. 7,462 156,926 __________ 1,684,557
Government (1.3%) Banco Latinoamericano de Comercio Exterior S.A. 3,600 93,348
Industrial (16.1%) Advanced Energy Industries, Inc. 4,150 117,154 Alamo Group, Inc. 1,800 93,780 Argan, Inc. 2,750 89,100 Atlas Air Worldwide Holdings, Inc. 2,500 103,350 Barnes Group, Inc. 1,910 67,595 Benchmark Electronics, Inc. 4,250 87,848 Federal Signal Corp. 7,650 121,252 Greenbrier Cos., Inc./The 1,950 63,609 Patrick Industries, Inc. 2,900 126,150 Tech Data Corp. 1,450 96,251 Teekay Tankers Ltd. Class A 10,950 75,336 Trinity Industries, Inc. 3,050 73,261 ZAGG, Inc. 7,000 76,580 __________ 1,191,266
542

THE COLLECTIVE INVESTMENT FUNDS OF FIRST MERCANTILE TRUST COMPANY FMT Small Cap Value (Opus) Fund
Schedule of Investments and Specific Fund Disclosures (continued) December 31, 2015
The accompanying notes are an integral part of these financial statements.
Investments
Principal Amount or
Shares Fair Value
Common stocks (continued) Technology (9.3%)
Brocade Communications Systems, Inc. 9,850 $ 90,423 CACI International, Inc. Class A 1,550 143,809 CSG Systems International, Inc. 4,150 149,317 Insight Enterprises, Inc. 3,850 96,712 Sykes Enterprises, Inc. 3,850 118,503 Teradyne, Inc. 4,250 87,848 __________ 686,612
Utility (1.9%) Laclede Group, Inc./The 2,400 142,584 __________ Total Common stocks (Cost $6,130,130) 6,449,342
Real estate investment trusts (10.6%) Apollo Commercial Real Estate Finance, Inc. 4,200 72,366 CareTrust REIT, Inc. 9,284 101,660 Chatham Lodging Trust 5,690 116,531 Colony Capital, Inc. Class A 3,510 68,375 EPR Properties 1,850 108,132 Hospitality Properties Trust 3,900 101,985 RLJ Lodging Trust 3,800 82,194 Sabra Health Care REIT, Inc. 3,950 79,909 Starwood Property Trust, Inc. 2,490 51,194 __________ Total Real estate investment trusts (Cost $832,988) 782,346 __________Total Investments (Cost $6,963,118) $ 7,231,688 ____________________
543
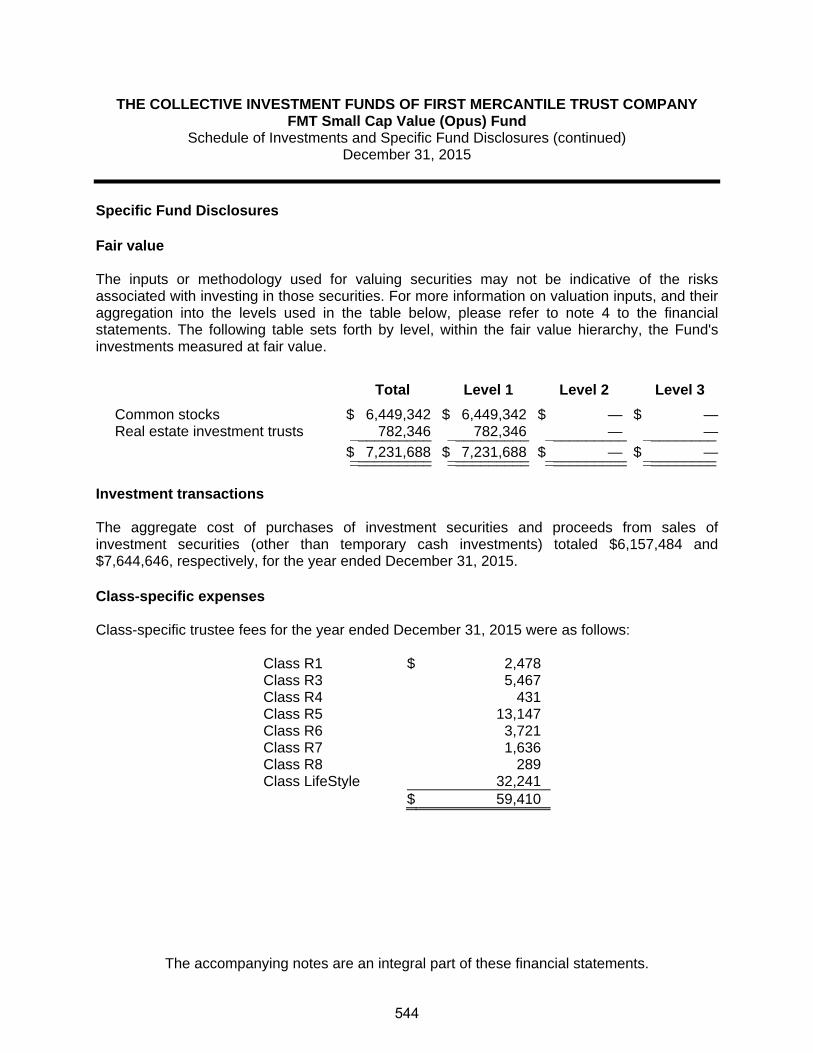
THE COLLECTIVE INVESTMENT FUNDS OF FIRST MERCANTILE TRUST COMPANY FMT Small Cap Value (Opus) Fund
Schedule of Investments and Specific Fund Disclosures (continued) December 31, 2015
The accompanying notes are an integral part of these financial statements.
Specific Fund Disclosures Fair value The inputs or methodology used for valuing securities may not be indicative of the risks associated with investing in those securities. For more information on valuation inputs, and their aggregation into the levels used in the table below, please refer to note 4 to the financial statements. The following table sets forth by level, within the fair value hierarchy, the Fund's investments measured at fair value.
Total Level 1 Level 2 Level 3
Common stocks $ 6,449,342 $ 6,449,342 $ — $ —Real estate investment trusts 782,346 782,346 — —__________ __________ __________ _________
$ 7,231,688 $ 7,231,688 $ — $ —__________ __________ __________ ___________________ __________ __________ _________ Investment transactions The aggregate cost of purchases of investment securities and proceeds from sales of investment securities (other than temporary cash investments) totaled $6,157,484 and $7,644,646, respectively, for the year ended December 31, 2015. Class-specific expenses Class-specific trustee fees for the year ended December 31, 2015 were as follows: Class R1 $ 2,478 Class R3 5,467 Class R4 431 Class R5 13,147 Class R6 3,721 Class R7 1,636 Class R8 289 Class LifeStyle 32,241 $ 59,410
544
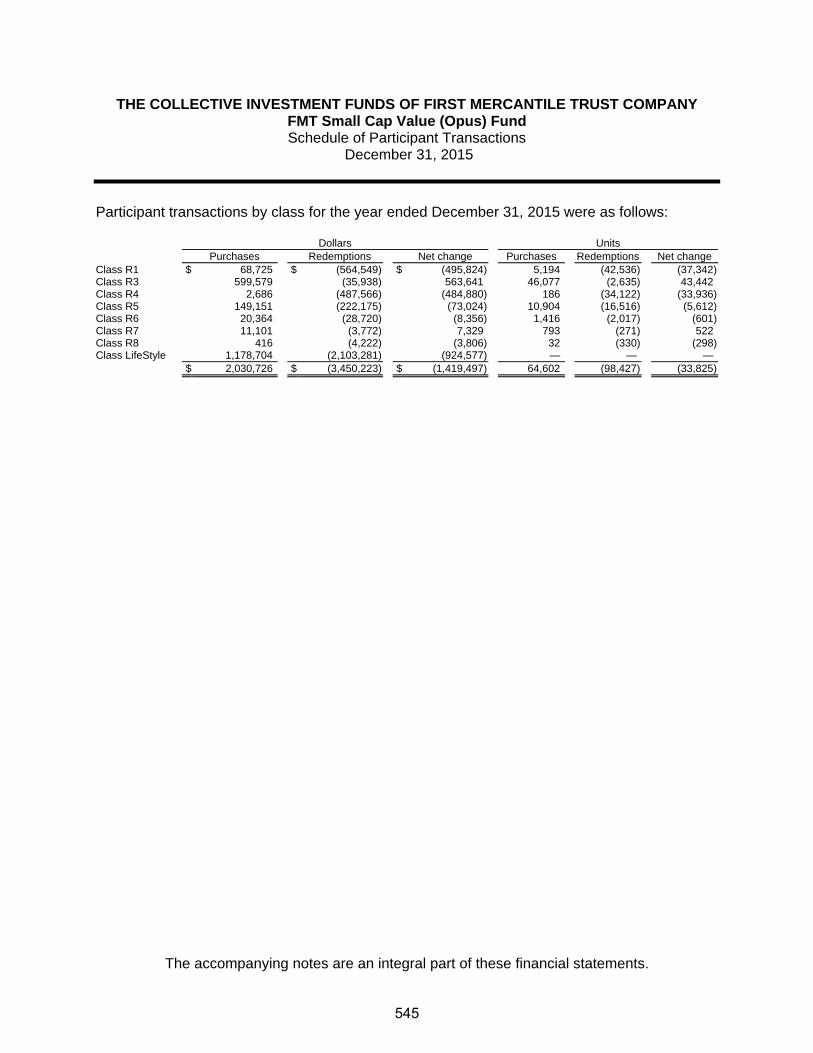
THE COLLECTIVE INVESTMENT FUNDS OF FIRST MERCANTILE TRUST COMPANY FMT Small Cap Value (Opus) Fund Schedule of Participant Transactions
December 31, 2015
The accompanying notes are an integral part of these financial statements.
Participant transactions by class for the year ended December 31, 2015 were as follows: Dollars Units Purchases Redemptions Net change Purchases Redemptions Net change Class R1 $ 68,725 $ (564,549) $ (495,824) 5,194 (42,536) (37,342)Class R3 599,579 (35,938) 563,641 46,077 (2,635) 43,442Class R4 2,686 (487,566) (484,880) 186 (34,122) (33,936)Class R5 149,151 (222,175) (73,024) 10,904 (16,516) (5,612)Class R6 20,364 (28,720) (8,356) 1,416 (2,017) (601)Class R7 11,101 (3,772) 7,329 793 (271) 522Class R8 416 (4,222) (3,806) 32 (330) (298)Class LifeStyle 1,178,704 (2,103,281) (924,577) — — — $ 2,030,726 $ (3,450,223) $ (1,419,497) 64,602 (98,427) (33,825)
545

THE COLLECTIVE INVESTMENT FUNDS OF FIRST MERCANTILE TRUST COMPANY FMT Small Cap Value (Opus) Fund
Financial Highlights December 31, 2015
The accompanying notes are an integral part of these financial statements.
Change in Net Asset Value Resulting from Operations Ratios (to average net
assets)
NAV per Unit, Beginning of
Period
Net Investment
Income (Loss)(a)
Net Realized and Unrealized
Gain (Loss) from
Investments(a)
Total from Investment Activities
NAV per Unit, End of
Period Total
Return Expenses
Net Investment
Income (Loss)
Class R1 $ 13.0780 $ 0.0637 $ (0.5211) $ (0.4574) $ 12.6206 (3.50)% (1.09)% 0.48%Class R3 13.3102 0.0370 (0.5527) (0.5157) 12.7945 (3.87)% (1.46)% 0.28%Class R4 14.7200 (0.0263) (0.5580) (0.5843) 14.1357 (3.97)% (1.67)% (0.18)%Class R5 13.6233 (0.0163) (0.5563) (0.5726) 13.0507 (4.20)% (1.81)% (0.12)%Class R6 14.3430 (0.0403) (0.5859) (0.6262) 13.7168 (4.37)% (1.98)% (0.28)%Class R7 14.0126 (0.0625) (0.5721) (0.6346) 13.3780 (4.53)% (2.15)% (0.44)%Class R8 13.4099 (0.0843) (0.5450) (0.6293) 12.7806 (4.69)% (2.32)% (0.63)%
(a) Per unit amounts are based on average daily units outstanding.
546

FMT SMID Diversified Growth (Frontier/Geneva) Fund

THE COLLECTIVE INVESTMENT FUNDS OF FIRST MERCANTILE TRUST COMPANY FMT SMID Diversified Growth (Frontier/Geneva) Fund
Statement of Assets and Liabilities December 31, 2015
The accompanying notes are an integral part of these financial statements.
Assets Investments in securities, at fair value $ 85,882,271 Cash equivalents 2,263,670
Receivables
Dividends and interest 30,571
Investments sold 3,628
Total assets 88,180,140
Liabilities Sub-advisor fees 43,926
Trustee fees 38,142
Investments purchased 1,567
Total liabilities 83,635
Net assets $ 88,096,505
Components of net assets
Units of
Participation NAV
per Unit Net
Assets Class R1 1,844,520 $ 20.1592 $ 37,184,118
Class R2 408,706 $ 17.2943 7,068,301
Class R3 420,530 $ 16.9187 7,114,829
Class R4 594,018 $ 16.8025 9,980,973
Class R5 214,943 $ 17.8951 3,846,425
Class R6 207,343 $ 17.0414 3,533,421
Class R7 111,813 $ 16.6642 1,863,279
Class R8 54,311 $ 16.9368 919,849
Class LifeStyle 16,585,310
$ 88,096,505
547

THE COLLECTIVE INVESTMENT FUNDS OF FIRST MERCANTILE TRUST COMPANY FMT SMID Diversified Growth (Frontier/Geneva) Fund
Statement of Operations For the Year Ended December 31, 2015
The accompanying notes are an integral part of these financial statements.
Investment income
Dividends (net of foreign withholding taxes of $415) $ 462,764
Interest 1,109
463,873
Expenses
Trustee fees 578,385
Sub-advisor fees 520,443
Custody fees 33,282
Audit fees 5,664
1,137,774
Net investment loss (673,901)
Net realized gain from investments sold
Proceeds from sales of investments 27,898,061
Cost of investments sold 18,777,106
Net realized gain from investments sold 9,120,955
Change in net unrealized appreciation (depreciation) on investments (7,200,034) Net realized and unrealized gain on investments 1,920,921 Other operating credits (charges) 5,834
Net increase in net assets resulting from operations $ 1,252,854
548

THE COLLECTIVE INVESTMENT FUNDS OF FIRST MERCANTILE TRUST COMPANY FMT SMID Diversified Growth (Frontier/Geneva) Fund
Statement of Changes in Net Assets For the Year Ended December 31, 2015
The accompanying notes are an integral part of these financial statements.
Operations
Net investment loss $ (673,901)
Net realized gain from investments sold 9,120,955
Change in net unrealized appreciation (depreciation) on investments (7,200,034)
Other operating credits (charges) 5,834
Net increase in net assets resulting from operations 1,252,854
Participant transactions
Proceeds from units purchased 31,930,362
Less payments for units redeemed 36,247,670
Decrease in net assets from participant transactions (4,317,308)
Total decrease in net assets (3,064,454)
Net assets at beginning of year 91,160,959
Net assets at end of year $ 88,096,505
549

THE COLLECTIVE INVESTMENT FUNDS OF FIRST MERCANTILE TRUST COMPANY FMT SMID Diversified Growth (Frontier/Geneva) Fund Schedule of Investments and Specific Fund Disclosures
December 31, 2015
The accompanying notes are an integral part of these financial statements.
Investments
Principal Amount or
Shares Fair Value ____________ ____________
Common stocks (96.5%)
Basic Materials (4.8%) Agnico Eagle Mines Ltd. 9,903 $ 260,251 Albemarle Corp. 4,326 242,299 Allegheny Technologies, Inc. 48,559 546,289 Balchem Corp. 14,534 883,667 Cabot Corp. 5,551 226,925 Clearwater Paper Corp. 483 21,991 Coeur Mining, Inc. 54,496 135,150 Ferroglobe PLC 26,676 286,767 FMC Corp. 7,967 311,749 Horsehead Holding Corp. 16,238 33,288 Kraton Performance Polymers, Inc. 18,972 315,125 Sensient Technologies Corp. 14,005 879,794 Tronox Ltd. Class A 29,878 116,823 __________ 4,260,118
Communications (3.3%) Cogent Communications Holdings, Inc. 21,483 745,245 ePlus, Inc. 2,632 245,460 FactSet Research Systems, Inc. 4,256 691,898 Global Eagle Entertainment, Inc. 51,879 512,046 Gogo, Inc. 28,316 504,025 QuinStreet, Inc. 18,915 81,146 Web.com Group, Inc. 5,818 116,418 __________ 2,896,238
Consumer, Cyclical (14.4%) Allegiant Travel Co. 5,831 978,617 American Airlines Group, Inc. 7,583 321,140 Beacon Roofing Supply, Inc. 24,852 1,023,405 BMC Stock Holdings, Inc. 16,076 269,273 Chico's FAS, Inc. 10,184 108,663 Chuy's Holdings, Inc. 19,358 606,680 Dana Holding Corp. 9,151 126,284 Dorman Products, Inc. 12,002 569,735 DTS, Inc. 16,243 366,767 Fox Factory Holding Corp. 21,672 358,238 G-III Apparel Group Ltd. 14,913 660,049 Gentherm, Inc. 6,179 292,885 Harman International Industries, Inc. 4,469 421,024
550

THE COLLECTIVE INVESTMENT FUNDS OF FIRST MERCANTILE TRUST COMPANY FMT SMID Diversified Growth (Frontier/Geneva) Fund
Schedule of Investments and Specific Fund Disclosures (continued) December 31, 2015
The accompanying notes are an integral part of these financial statements.
Investments
Principal Amount or
Shares Fair Value ____________ ____________
Common stocks (continued)
Consumer, Cyclical (continued) Hawaiian Holdings, Inc. 3,635 $ 128,425 Hibbett Sports, Inc. 10,586 320,121 JetBlue Airways Corp. 20,329 460,452 Lions Gate Entertainment Corp. 10,186 329,924 LKQ Corp. 14,145 419,116 MarineMax, Inc. 14,725 271,234 Meritor, Inc. 26,025 217,309 Modine Manufacturing Co. 12,471 112,863 Panera Bread Co. Class A 3,519 685,431 Red Robin Gourmet Burgers, Inc. 6,370 393,284 Tenneco, Inc. 1,658 76,119 TiVo, Inc. 41,172 355,314 United Continental Holdings, Inc. 36,924 2,115,745 Universal Electronics, Inc. 1,403 72,044 Wabash National Corp. 3,708 43,866 WABCO Holdings, Inc. 1,615 165,150 Watsco, Inc. 3,332 390,277 __________ 12,659,434
Consumer, Non-cyclical (22.2%) ABIOMED, Inc. 14,623 1,320,165 Advisory Board Co./The 11,992 594,923 Amplify Snack Brands, Inc. 9,254 106,606 Bio-Techne Corp. 9,779 880,110 BioMarin Pharmaceutical, Inc. 1,370 143,521 Bright Horizons Family Solutions, Inc. 16,757 1,119,368 Cantel Medical Corp. 23,077 1,434,005 Career Education Corp. 40,870 148,358 Cooper Cos., Inc./The 4,751 637,584 DexCom, Inc. 8,228 673,873 Edwards Lifesciences Corp. 5,768 455,557 Global Payments, Inc. 4,038 260,491 Globus Medical, Inc. Class A 27,792 773,173 Green Dot Corp. Class A 14,861 244,018 Healthcare Services Group, Inc. 28,430 991,354 HeartWare International, Inc. 7,477 376,841 Illumina, Inc. 2,963 568,733
551

THE COLLECTIVE INVESTMENT FUNDS OF FIRST MERCANTILE TRUST COMPANY FMT SMID Diversified Growth (Frontier/Geneva) Fund
Schedule of Investments and Specific Fund Disclosures (continued) December 31, 2015
The accompanying notes are an integral part of these financial statements.
Investments
Principal Amount or
Shares Fair Value ____________ ____________
Common stocks (continued)
Consumer, Non-cyclical (continued) Insulet Corp. 21,727 $ 821,498 J&J Snack Foods Corp. 7,237 844,341 KAR Auction Services, Inc. 7,382 273,356 Masimo Corp. 25,728 1,067,969 Medivation, Inc. 1,670 80,728 MEDNAX, Inc. 6,207 444,794 Monro Muffler Brake, Inc. 18,152 1,202,025 Myriad Genetics, Inc. 7,930 342,259 Natus Medical, Inc. 13,168 632,722 Neogen Corp. 18,033 1,019,225 PAREXEL International Corp. 16,378 1,115,669 QIAGEN N.V. 6,849 189,375 Sangamo BioSciences, Inc. 9,606 87,703 Tandem Diabetes Care, Inc. 21,557 254,588 Team, Inc. 13,168 420,849 __________ 19,525,781
Diversified (0.2%) Leucadia National Corp. 11,226 195,220
Energy (2.5%) Carrizo Oil & Gas, Inc. 16,076 475,528 Dril-Quip, Inc. 10,045 594,965 Gulfport Energy Corp. 10,766 264,521 InterOil Corp. 12,708 399,285 McDermott International, Inc. 64,320 215,472 MRC Global, Inc. 14,066 181,451 WPX Energy, Inc. 21,390 122,779 __________ 2,254,001
Financial (9.3%) Artisan Partners Asset Management, Inc. Class A 3,716 133,999 Bank of the Ozarks, Inc. 27,692 1,369,646 BofI Holding, Inc. 31,021 652,992 E*TRADE Financial Corp. 9,011 267,086 Ellie Mae, Inc. 5,191 312,654 Everest Re Group Ltd. 2,379 435,571 Greenhill & Co., Inc. 3,608 103,225
552
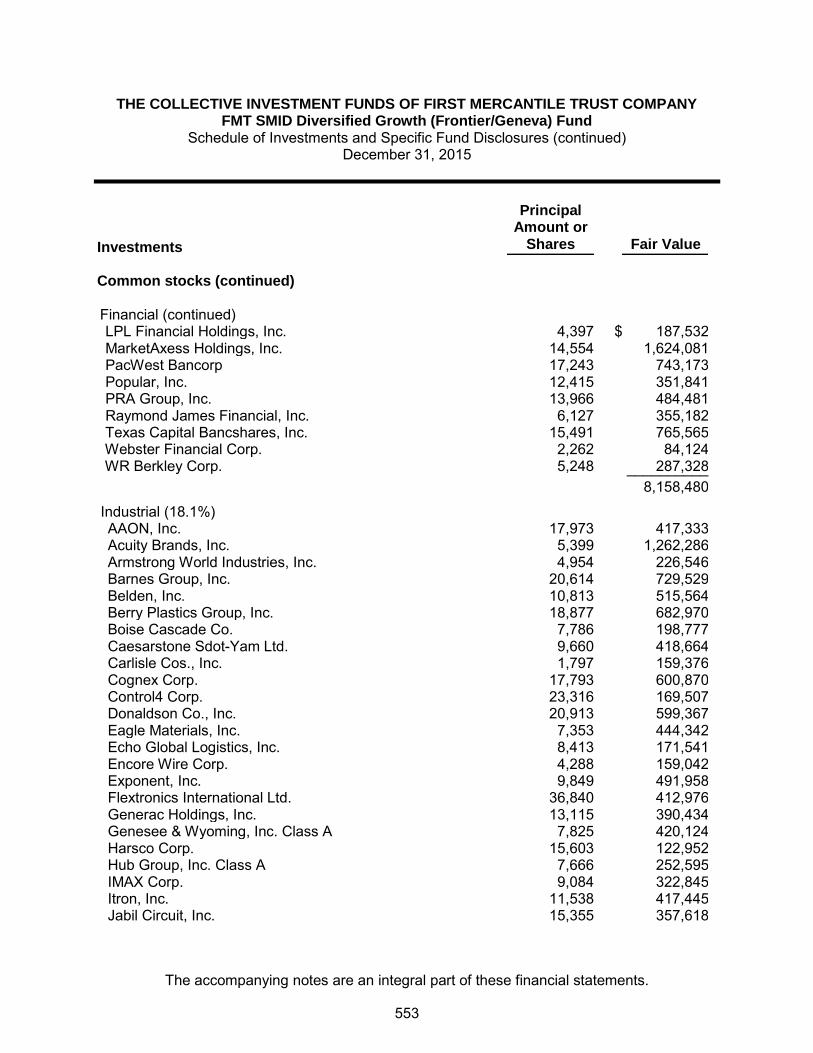
THE COLLECTIVE INVESTMENT FUNDS OF FIRST MERCANTILE TRUST COMPANY FMT SMID Diversified Growth (Frontier/Geneva) Fund
Schedule of Investments and Specific Fund Disclosures (continued) December 31, 2015
The accompanying notes are an integral part of these financial statements.
Investments
Principal Amount or
Shares Fair Value
Common stocks (continued) Financial (continued) LPL Financial Holdings, Inc. 4,397 $ 187,532 MarketAxess Holdings, Inc. 14,554 1,624,081 PacWest Bancorp 17,243 743,173 Popular, Inc. 12,415 351,841 PRA Group, Inc. 13,966 484,481 Raymond James Financial, Inc. 6,127 355,182 Texas Capital Bancshares, Inc. 15,491 765,565 Webster Financial Corp. 2,262 84,124 WR Berkley Corp. 5,248 287,328 __________ 8,158,480
Industrial (18.1%) AAON, Inc. 17,973 417,333 Acuity Brands, Inc. 5,399 1,262,286 Armstrong World Industries, Inc. 4,954 226,546 Barnes Group, Inc. 20,614 729,529 Belden, Inc. 10,813 515,564 Berry Plastics Group, Inc. 18,877 682,970 Boise Cascade Co. 7,786 198,777 Caesarstone Sdot-Yam Ltd. 9,660 418,664 Carlisle Cos., Inc. 1,797 159,376 Cognex Corp. 17,793 600,870 Control4 Corp. 23,316 169,507 Donaldson Co., Inc. 20,913 599,367 Eagle Materials, Inc. 7,353 444,342 Echo Global Logistics, Inc. 8,413 171,541 Encore Wire Corp. 4,288 159,042 Exponent, Inc. 9,849 491,958 Flextronics International Ltd. 36,840 412,976 Generac Holdings, Inc. 13,115 390,434 Genesee & Wyoming, Inc. Class A 7,825 420,124 Harsco Corp. 15,603 122,952 Hub Group, Inc. Class A 7,666 252,595 IMAX Corp. 9,084 322,845 Itron, Inc. 11,538 417,445 Jabil Circuit, Inc. 15,355 357,618
553

THE COLLECTIVE INVESTMENT FUNDS OF FIRST MERCANTILE TRUST COMPANY FMT SMID Diversified Growth (Frontier/Geneva) Fund
Schedule of Investments and Specific Fund Disclosures (continued) December 31, 2015
The accompanying notes are an integral part of these financial statements.
Investments
Principal Amount or
Shares Fair Value
Common stocks (continued) Industrial (continued) Kirby Corp. 3,532 $ 185,854 Lennox International, Inc. 2,730 340,977 Louisiana-Pacific Corp. 32,225 580,372 Marten Transport Ltd. 23,256 411,631 Martin Marietta Materials, Inc. 1,658 226,450 MasTec, Inc. 22,272 387,087 Middleby Corp./The 10,995 1,186,031 Primoris Services Corp. 5,222 115,041 Proto Labs, Inc. 9,490 604,418 RBC Bearings, Inc. 12,799 826,687 Rogers Corp. 7,722 398,223 Swift Transportation Co. 11,348 156,829 Trex Co., Inc. 5,587 212,529 Universal Display Corp. 7,281 396,378 __________ 15,973,168
Technology (21.7%) 2U, Inc. 10,094 282,430 Akamai Technologies, Inc. 3,317 174,574 Allscripts Healthcare Solutions, Inc. 12,253 188,451 Atmel Corp. 17,440 150,158 Blackbaud, Inc. 17,415 1,146,952 Bottomline Technologies de, Inc. 20,335 604,559 Brightcove, Inc. 43,886 272,093 Cree, Inc. 12,156 324,200 Cypress Semiconductor Corp. 32,979 323,524 Electronic Arts, Inc. 8,675 596,146 Envestnet, Inc. 18,063 539,181 Fair Isaac Corp. 7,745 729,424 Fairchild Semiconductor International, Inc. 21,555 446,404 Fleetmatics Group PLC 11,030 560,214 Fortinet, Inc. 10,958 341,561 Integrated Device Technology, Inc. 14,231 374,987 Mattson Technology, Inc. 63,122 222,821 Maxim Integrated Products, Inc. 9,372 356,136
554

THE COLLECTIVE INVESTMENT FUNDS OF FIRST MERCANTILE TRUST COMPANY FMT SMID Diversified Growth (Frontier/Geneva) Fund
Schedule of Investments and Specific Fund Disclosures (continued) December 31, 2015
The accompanying notes are an integral part of these financial statements.
Investments
Principal Amount or
Shares Fair Value
Common stocks (continued) Technology (continued) Medidata Solutions, Inc. 16,906 $ 833,297 Monolithic Power Systems, Inc. 9,594 611,234 Nuance Communications, Inc. 11,821 235,120 Omnicell, Inc. 14,175 440,559 ON Semiconductor Corp. 22,564 221,127 QLogic Corp. 24,439 298,156 Qorvo, Inc. 13,991 712,142 QuickLogic Corp. 96,540 109,090 Rovi Corp. 52,755 878,898 Seachange International, Inc. 34,486 232,436 Semtech Corp. 5,624 106,406 Silicon Laboratories, Inc. 2,740 133,000 Silver Spring Networks, Inc. 23,137 333,404 Skyworks Solutions, Inc. 9,137 701,996 Synaptics, Inc. 5,047 405,476 Tessera Technologies, Inc. 13,120 393,731 Tyler Technologies, Inc. 9,081 1,583,000 Ultimate Software Group, Inc./The 6,988 1,366,224 Ultratech, Inc. 24,887 493,260 Veeco Instruments, Inc. 23,752 488,341 VeriFone Systems, Inc. 4,254 119,197 Virtusa Corp. 11,085 458,254 Zynga, Inc. Class A 112,680 301,982 __________ 19,090,145 __________ Total Common stocks (Cost $65,057,459) 85,012,585
Depository receipt (1.0%)
Consumer, Cyclical (1.0%)
Controladora Vuela Cia de Aviacion S.A.B. de C.V. ADR (Cost $545,668) 50,681 869,686 __________
Total Investments (Cost $65,603,127) $ 85,882,271 __________ __________
555
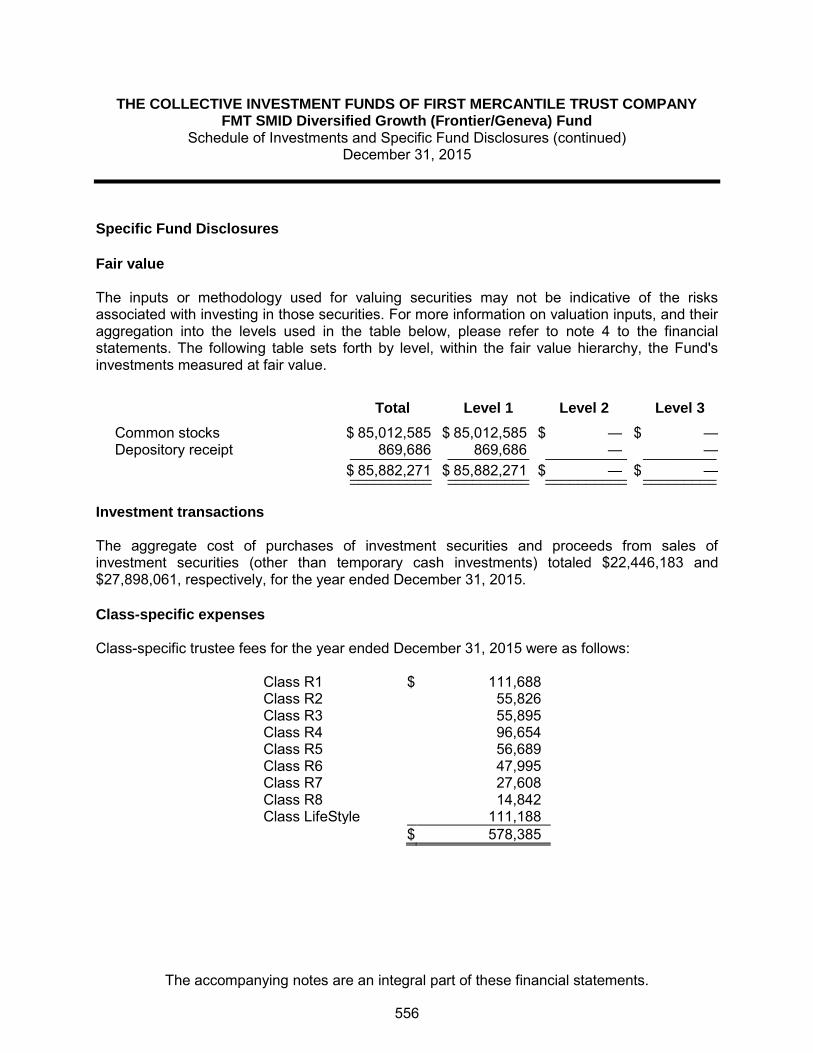
THE COLLECTIVE INVESTMENT FUNDS OF FIRST MERCANTILE TRUST COMPANY FMT SMID Diversified Growth (Frontier/Geneva) Fund
Schedule of Investments and Specific Fund Disclosures (continued) December 31, 2015
The accompanying notes are an integral part of these financial statements.
Specific Fund Disclosures Fair value The inputs or methodology used for valuing securities may not be indicative of the risks associated with investing in those securities. For more information on valuation inputs, and their aggregation into the levels used in the table below, please refer to note 4 to the financial statements. The following table sets forth by level, within the fair value hierarchy, the Fund's investments measured at fair value.
Total Level 1 Level 2 Level 3
Common stocks $ 85,012,585 $ 85,012,585 $ — $ — Depository receipt 869,686 869,686 — — __________ __________ __________ _________
$ 85,882,271 $ 85,882,271 $ — $ — __________ __________ __________ _________ __________ __________ __________ _________ Investment transactions The aggregate cost of purchases of investment securities and proceeds from sales of investment securities (other than temporary cash investments) totaled $22,446,183 and $27,898,061, respectively, for the year ended December 31, 2015. Class-specific expenses Class-specific trustee fees for the year ended December 31, 2015 were as follows: Class R1 $ 111,688 Class R2 55,826 Class R3 55,895 Class R4 96,654 Class R5 56,689 Class R6 47,995 Class R7 27,608 Class R8 14,842 Class LifeStyle 111,188 $ 578,385
556

THE COLLECTIVE INVESTMENT FUNDS OF FIRST MERCANTILE TRUST COMPANY FMT SMID Diversified Growth (Frontier/Geneva) Fund
Schedule of Participant Transactions December 31, 2015
The accompanying notes are an integral part of these financial statements.
Participant transactions by class for the year ended December 31, 2015 were as follows: Dollars Units Purchases Redemptions Net change Purchases Redemptions Net change Class R1 $ 17,086,725 $ (10,285,746) $ 6,800,979 857,359 (500,253) 357,106 Class R2 2,455,432 (5,561,996) (3,106,564) 137,661 (325,705) (188,044) Class R3 3,842,168 (2,963,981) 878,187 221,004 (169,610) 51,394 Class R4 3,502,036 (4,724,306) (1,222,270) 201,369 (274,506) (73,137) Class R5 680,955 (4,093,013) (3,412,058) 36,747 (221,043) (184,296) Class R6 373,882 (908,614) (534,732) 21,082 (51,994) (30,912) Class R7 175,426 (402,118) (226,692) 10,178 (23,664) (13,486) Class R8 84,877 (35,536) 49,341 4,856 (2,055) 2,801 Class LifeStyle 3,728,861 (7,272,360) (3,543,499) — — — $ 31,930,362 $ (36,247,670) $ (4,317,308) 1,490,256 (1,568,830) (78,574)
557
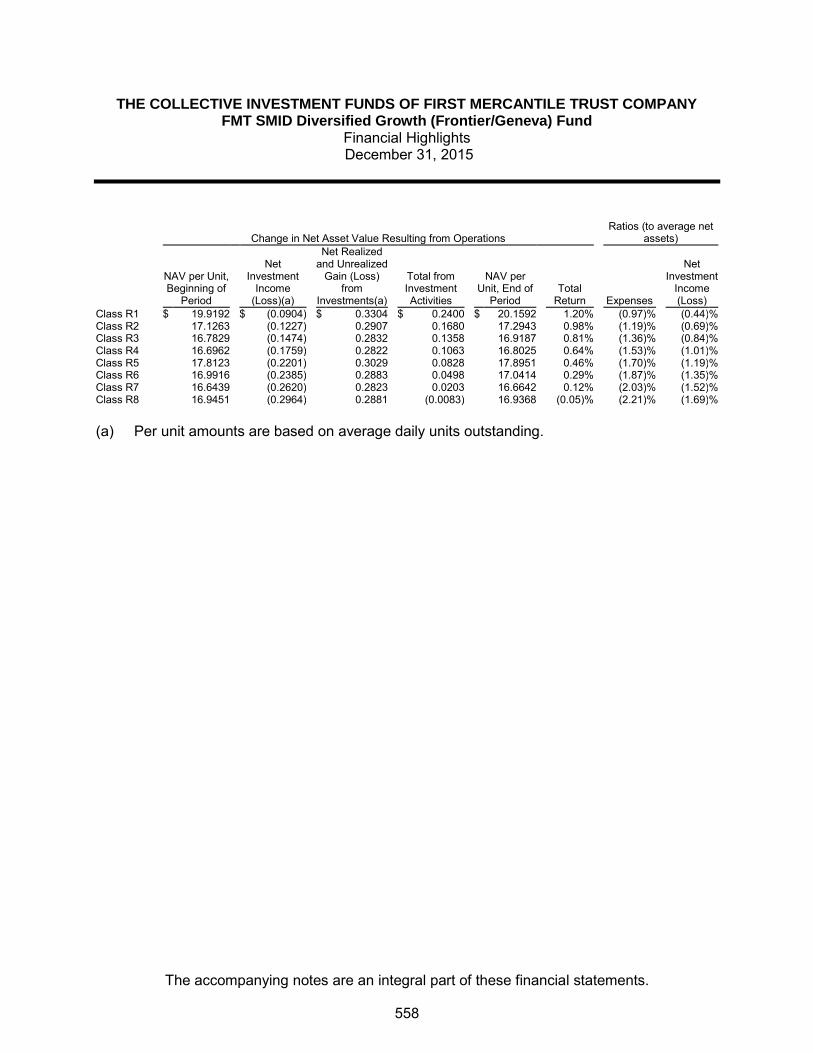
THE COLLECTIVE INVESTMENT FUNDS OF FIRST MERCANTILE TRUST COMPANY FMT SMID Diversified Growth (Frontier/Geneva) Fund
Financial Highlights December 31, 2015
The accompanying notes are an integral part of these financial statements.
Change in Net Asset Value Resulting from Operations Ratios (to average net
assets)
NAV per Unit, Beginning of
Period
Net Investment
Income (Loss)(a)
Net Realized and Unrealized
Gain (Loss) from
Investments(a)
Total from Investment Activities
NAV per Unit, End of
Period Total
Return Expenses
Net Investment
Income (Loss)
Class R1 $ 19.9192 $ (0.0904) $ 0.3304 $ 0.2400 $ 20.1592 1.20 % (0.97) % (0.44) % Class R2 17.1263 (0.1227) 0.2907 0.1680 17.2943 0.98 % (1.19) % (0.69) % Class R3 16.7829 (0.1474) 0.2832 0.1358 16.9187 0.81 % (1.36) % (0.84) % Class R4 16.6962 (0.1759) 0.2822 0.1063 16.8025 0.64 % (1.53) % (1.01) % Class R5 17.8123 (0.2201) 0.3029 0.0828 17.8951 0.46 % (1.70) % (1.19) % Class R6 16.9916 (0.2385) 0.2883 0.0498 17.0414 0.29 % (1.87) % (1.35) % Class R7 16.6439 (0.2620) 0.2823 0.0203 16.6642 0.12 % (2.03) % (1.52) % Class R8 16.9451 (0.2964) 0.2881 (0.0083) 16.9368 (0.05) % (2.21) % (1.69) % (a) Per unit amounts are based on average daily units outstanding.
558

FMT SMID Value (Fisher Investments) Fund

THE COLLECTIVE INVESTMENT FUNDS OF FIRST MERCANTILE TRUST COMPANY FMT SMID Value (Fisher Investments) Fund
Statement of Assets and Liabilities December 31, 2015
The accompanying notes are an integral part of these financial statements.
Assets Investments in securities, at fair value $ 42,241,094 Receivables
Investments sold 293,815 Dividends and interest 40,003
Total assets 42,574,912 Liabilities Cash overdraft 137,517Sub-advisor fees 27,186Trustee fees 18,222
Total liabilities 182,925 Net assets $ 42,391,987 Components of net assets
Units of
Participation NAV
per Unit Net
Assets Class R1 638,718 $ 15.9903 $ 10,213,282Class R2 264,209 $ 15.9488 4,213,822Class R3 266,567 $ 15.6386 4,168,744Class R4 417,124 $ 15.5336 6,479,427Class R5 85,249 $ 15.6220 1,331,760Class R6 139,214 $ 15.5520 2,165,052Class R7 63,152 $ 15.0538 950,675Class R8 23,234 $ 15.5395 361,047Class LifeStyle 12,508,178
$ 42,391,987
559
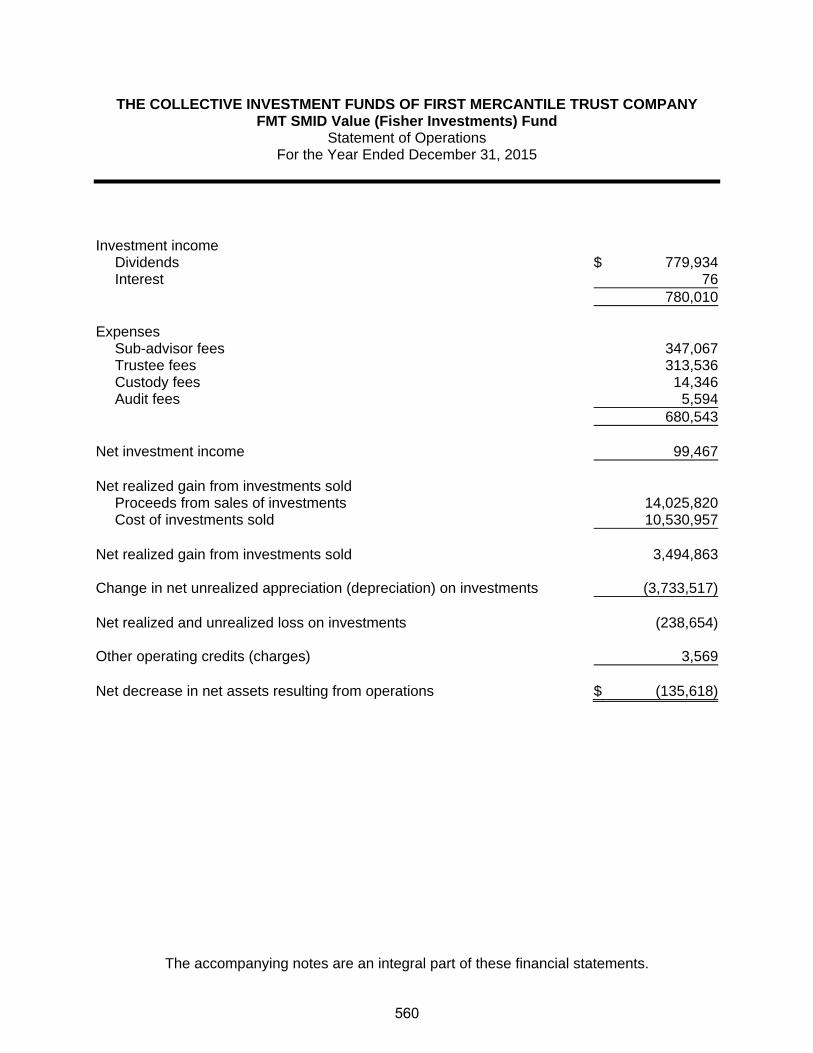
THE COLLECTIVE INVESTMENT FUNDS OF FIRST MERCANTILE TRUST COMPANY FMT SMID Value (Fisher Investments) Fund
Statement of Operations For the Year Ended December 31, 2015
The accompanying notes are an integral part of these financial statements.
Investment income
Dividends $ 779,934Interest 76
780,010 Expenses
Sub-advisor fees 347,067Trustee fees 313,536Custody fees 14,346Audit fees 5,594
680,543 Net investment income 99,467 Net realized gain from investments sold
Proceeds from sales of investments 14,025,820Cost of investments sold 10,530,957
Net realized gain from investments sold 3,494,863 Change in net unrealized appreciation (depreciation) on investments (3,733,517) Net realized and unrealized loss on investments (238,654) Other operating credits (charges) 3,569 Net decrease in net assets resulting from operations $ (135,618)
560

THE COLLECTIVE INVESTMENT FUNDS OF FIRST MERCANTILE TRUST COMPANY FMT SMID Value (Fisher Investments) Fund
Statement of Changes in Net Assets For the Year Ended December 31, 2015
The accompanying notes are an integral part of these financial statements.
Operations
Net investment income $ 99,467
Net realized gain from investments sold 3,494,863
Change in net unrealized appreciation (depreciation) on investments (3,733,517)
Other operating credits (charges) 3,569
Net decrease in net assets resulting from operations (135,618) Participant transactions
Proceeds from units purchased 12,026,923Less payments for units redeemed 18,999,854
Decrease in net assets from participant transactions (6,972,931)
Total decrease in net assets (7,108,549) Net assets at beginning of year 49,500,536 Net assets at end of year $ 42,391,987
561

THE COLLECTIVE INVESTMENT FUNDS OF FIRST MERCANTILE TRUST COMPANY FMT SMID Value (Fisher Investments) Fund
Schedule of Investments and Specific Fund Disclosures December 31, 2015
The accompanying notes are an integral part of these financial statements.
Investments
Principal Amount or
Shares Fair Value ____________ ____________
Common stocks (88.8%)
Basic Materials (1.4%) CF Industries Holdings, Inc. 9,120 $ 372,187 Nucor Corp. 5,181 208,795 __________ 580,982
Communications (4.6%) Discovery Communications, Inc. Class A 15,634 417,115 Juniper Networks, Inc. 21,813 602,039 NeuStar, Inc. Class A 11,000 263,670 Omnicom Group, Inc. 8,875 671,483 __________ 1,954,307
Consumer, Cyclical (12.4%) BorgWarner, Inc. 11,492 496,799 Cabela's, Inc. 6,905 322,671 Dana Holding Corp. 21,300 293,940 DR Horton, Inc. 20,000 640,600 Harley-Davidson, Inc. 6,851 310,967 MSC Industrial Direct Co., Inc. Class A 5,798 326,253 Polaris Industries, Inc. 6,730 578,444 Ross Stores, Inc. 14,270 767,869 Scotts Miracle-Gro Co./The Class A 5,785 373,190 Starwood Hotels & Resorts Worldwide, Inc. 8,855 613,474 Toll Brothers, Inc. 15,707 523,043 __________ 5,247,250
Consumer, Non-cyclical (21.4%) AmerisourceBergen Corp. 10,574 1,096,629 Charles River Laboratories International, Inc. 9,100 731,549 Equifax, Inc. 9,913 1,104,011 Henry Schein, Inc. 6,220 983,942 Kroger Co./The 37,800 1,581,174 PAREXEL International Corp. 13,450 916,214 Perrigo Co. PLC 2,069 299,384 St Jude Medical, Inc. 12,000 741,240 Total System Services, Inc. 16,200 806,760 Zimmer Biomet Holdings, Inc. 7,910 811,487 __________ 9,072,390
562

THE COLLECTIVE INVESTMENT FUNDS OF FIRST MERCANTILE TRUST COMPANY FMT SMID Value (Fisher Investments) Fund
Schedule of Investments and Specific Fund Disclosures (continued) December 31, 2015
The accompanying notes are an integral part of these financial statements.
Investments
Principal Amount or
Shares Fair Value ____________ ____________
Common stocks (continued)
Energy (2.9%) FMC Technologies, Inc. 7,009 $ 203,331 Helmerich & Payne, Inc. 3,245 173,770 Oceaneering International, Inc. 4,153 155,820 Valero Energy Corp. 10,042 710,070 __________ 1,242,991
Financial (24.0%) Ameriprise Financial, Inc. 8,680 923,726 Cincinnati Financial Corp. 7,628 451,349 CoreLogic, Inc. 8,000 270,880 Cullen/Frost Bankers, Inc. 9,250 555,000 East West Bancorp, Inc. 15,633 649,707 First Republic Bank/CA 14,600 964,476 Hancock Holding Co. 15,075 379,438 M&T Bank Corp. 4,744 574,878 Northern Trust Corp. 7,705 555,453 Primerica, Inc. 9,100 429,793 Progressive Corp./The 13,911 442,370 Raymond James Financial, Inc. 16,339 947,172 Regions Financial Corp. 58,800 564,480 SVB Financial Group 7,845 932,770 T Rowe Price Group, Inc. 8,771 627,039 Torchmark Corp. 9,013 515,183 Unum Group 12,131 403,841 __________ 10,187,555
Industrial (7.6%) B/E Aerospace, Inc. 5,600 237,272 Kansas City Southern 6,746 503,724 Lincoln Electric Holdings, Inc. 6,591 342,007 Owens Corning 8,375 393,876 PerkinElmer, Inc. 16,175 866,495 Rockwell Automation, Inc. 6,290 645,417 Terex Corp. 13,025 240,702 __________ 3,229,493
Technology (14.5%) Amdocs Ltd. 12,800 698,496
563
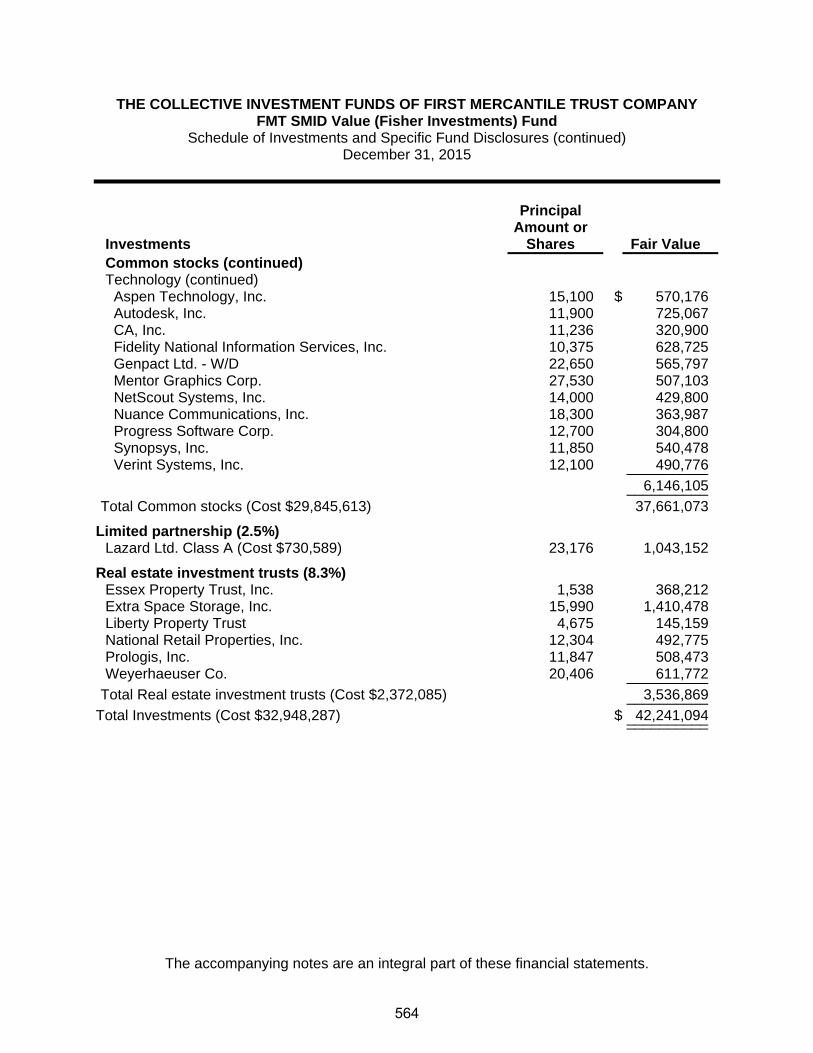
THE COLLECTIVE INVESTMENT FUNDS OF FIRST MERCANTILE TRUST COMPANY FMT SMID Value (Fisher Investments) Fund
Schedule of Investments and Specific Fund Disclosures (continued) December 31, 2015
The accompanying notes are an integral part of these financial statements.
Investments
Principal Amount or
Shares Fair Value
Common stocks (continued) Technology (continued)
Aspen Technology, Inc. 15,100 $ 570,176 Autodesk, Inc. 11,900 725,067 CA, Inc. 11,236 320,900 Fidelity National Information Services, Inc. 10,375 628,725 Genpact Ltd. - W/D 22,650 565,797 Mentor Graphics Corp. 27,530 507,103 NetScout Systems, Inc. 14,000 429,800 Nuance Communications, Inc. 18,300 363,987 Progress Software Corp. 12,700 304,800 Synopsys, Inc. 11,850 540,478 Verint Systems, Inc. 12,100 490,776 __________ 6,146,105 __________ Total Common stocks (Cost $29,845,613) 37,661,073
Limited partnership (2.5%) Lazard Ltd. Class A (Cost $730,589) 23,176 1,043,152
Real estate investment trusts (8.3%) Essex Property Trust, Inc. 1,538 368,212 Extra Space Storage, Inc. 15,990 1,410,478 Liberty Property Trust 4,675 145,159 National Retail Properties, Inc. 12,304 492,775 Prologis, Inc. 11,847 508,473 Weyerhaeuser Co. 20,406 611,772 __________ Total Real estate investment trusts (Cost $2,372,085) 3,536,869 __________Total Investments (Cost $32,948,287) $ 42,241,094 ____________________
564
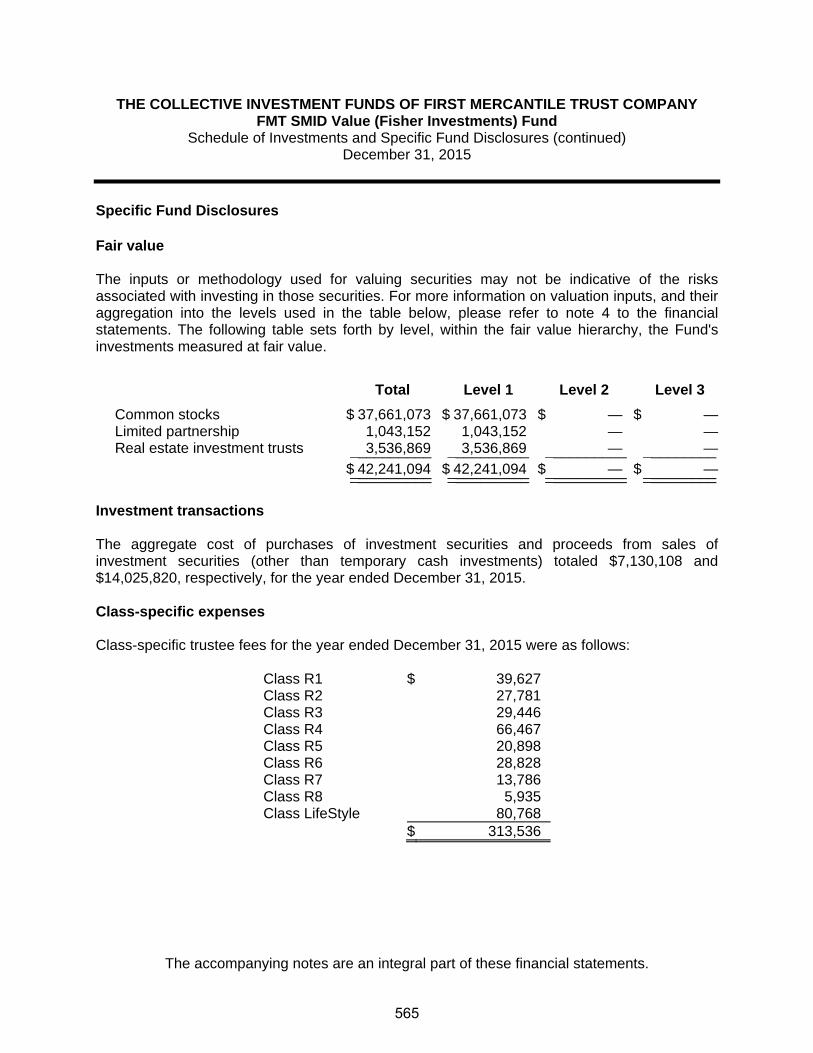
THE COLLECTIVE INVESTMENT FUNDS OF FIRST MERCANTILE TRUST COMPANY FMT SMID Value (Fisher Investments) Fund
Schedule of Investments and Specific Fund Disclosures (continued) December 31, 2015
The accompanying notes are an integral part of these financial statements.
Specific Fund Disclosures Fair value The inputs or methodology used for valuing securities may not be indicative of the risks associated with investing in those securities. For more information on valuation inputs, and their aggregation into the levels used in the table below, please refer to note 4 to the financial statements. The following table sets forth by level, within the fair value hierarchy, the Fund's investments measured at fair value.
Total Level 1 Level 2 Level 3
Common stocks $ 37,661,073 $ 37,661,073 $ — $ —Limited partnership 1,043,152 1,043,152 — —Real estate investment trusts 3,536,869 3,536,869 — —__________ __________ __________ _________
$ 42,241,094 $ 42,241,094 $ — $ —__________ __________ __________ ___________________ __________ __________ _________ Investment transactions The aggregate cost of purchases of investment securities and proceeds from sales of investment securities (other than temporary cash investments) totaled $7,130,108 and $14,025,820, respectively, for the year ended December 31, 2015. Class-specific expenses Class-specific trustee fees for the year ended December 31, 2015 were as follows: Class R1 $ 39,627 Class R2 27,781 Class R3 29,446 Class R4 66,467 Class R5 20,898 Class R6 28,828 Class R7 13,786 Class R8 5,935 Class LifeStyle 80,768 $ 313,536
565

THE COLLECTIVE INVESTMENT FUNDS OF FIRST MERCANTILE TRUST COMPANY FMT SMID Value (Fisher Investments) Fund
Schedule of Participant Transactions December 31, 2015
The accompanying notes are an integral part of these financial statements.
Participant transactions by class for the year ended December 31, 2015 were as follows: Dollars Units Purchases Redemptions Net change Purchases Redemptions Net change Class R1 $ 2,067,520 $ (3,960,480) $ (1,892,960) 126,337 (240,235) (113,898)Class R2 1,436,290 (2,404,640) (968,350) 87,509 (144,510) (57,001)Class R3 2,000,912 (1,606,381) 394,531 124,187 (99,458) 24,729Class R4 1,853,000 (2,958,446) (1,105,446) 115,652 (183,940) (68,288)Class R5 188,281 (2,175,338) (1,987,057) 11,742 (134,885) (123,143)Class R6 164,617 (328,309) (163,692) 10,403 (20,265) (9,862)Class R7 101,610 (210,933) (109,323) 6,493 (13,892) (7,399)Class R8 46,512 (74,720) (28,208) 2,930 (4,629) (1,699)Class LifeStyle 4,168,181 (5,280,607) (1,112,426) — — — $ 12,026,923 $ (18,999,854) $ (6,972,931) 485,253 (841,814) (356,561)
566
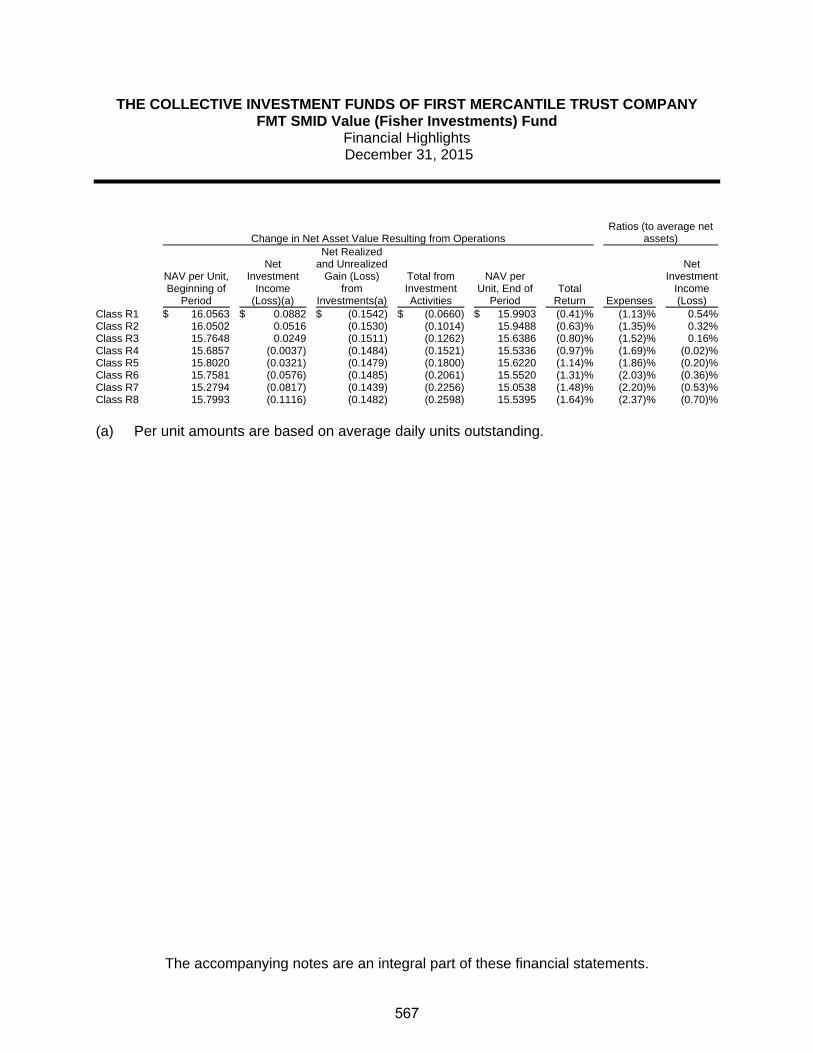
THE COLLECTIVE INVESTMENT FUNDS OF FIRST MERCANTILE TRUST COMPANY FMT SMID Value (Fisher Investments) Fund
Financial Highlights December 31, 2015
The accompanying notes are an integral part of these financial statements.
Change in Net Asset Value Resulting from Operations Ratios (to average net
assets)
NAV per Unit, Beginning of
Period
Net Investment
Income (Loss)(a)
Net Realized and Unrealized
Gain (Loss) from
Investments(a)
Total from Investment Activities
NAV per Unit, End of
Period Total
Return Expenses
Net Investment
Income (Loss)
Class R1 $ 16.0563 $ 0.0882 $ (0.1542) $ (0.0660) $ 15.9903 (0.41)% (1.13)% 0.54%Class R2 16.0502 0.0516 (0.1530) (0.1014) 15.9488 (0.63)% (1.35)% 0.32%Class R3 15.7648 0.0249 (0.1511) (0.1262) 15.6386 (0.80)% (1.52)% 0.16%Class R4 15.6857 (0.0037) (0.1484) (0.1521) 15.5336 (0.97)% (1.69)% (0.02)%Class R5 15.8020 (0.0321) (0.1479) (0.1800) 15.6220 (1.14)% (1.86)% (0.20)%Class R6 15.7581 (0.0576) (0.1485) (0.2061) 15.5520 (1.31)% (2.03)% (0.36)%Class R7 15.2794 (0.0817) (0.1439) (0.2256) 15.0538 (1.48)% (2.20)% (0.53)%Class R8 15.7993 (0.1116) (0.1482) (0.2598) 15.5395 (1.64)% (2.37)% (0.70)%
(a) Per unit amounts are based on average daily units outstanding.
567

FMT Special Opportunities (Sterling) Fund
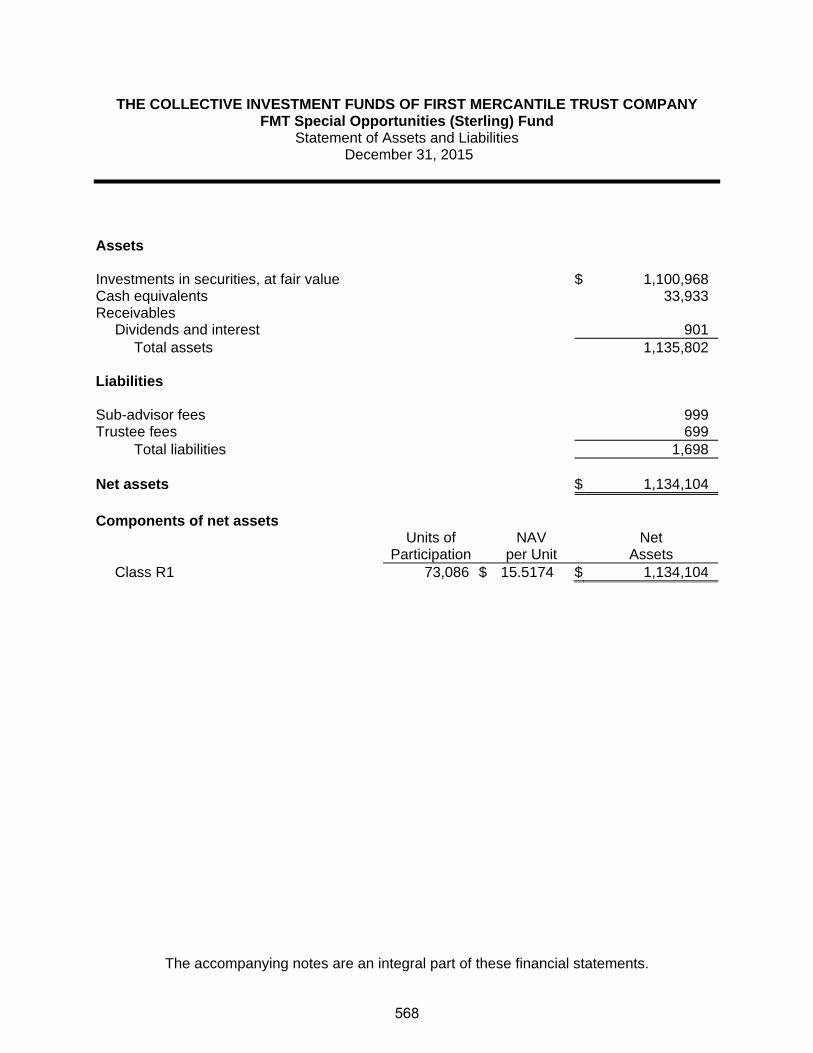
THE COLLECTIVE INVESTMENT FUNDS OF FIRST MERCANTILE TRUST COMPANY FMT Special Opportunities (Sterling) Fund
Statement of Assets and Liabilities December 31, 2015
The accompanying notes are an integral part of these financial statements.
Assets Investments in securities, at fair value $ 1,100,968 Cash equivalents 33,933Receivables
Dividends and interest 901Total assets 1,135,802
Liabilities Sub-advisor fees 999Trustee fees 699
Total liabilities 1,698 Net assets $ 1,134,104 Components of net assets
Units of
Participation NAV
per Unit Net
Assets Class R1 73,086 $ 15.5174 $ 1,134,104
568

THE COLLECTIVE INVESTMENT FUNDS OF FIRST MERCANTILE TRUST COMPANY FMT Special Opportunities (Sterling) Fund
Statement of Operations For the Year Ended December 31, 2015
The accompanying notes are an integral part of these financial statements.
Investment income
Dividends (net of foreign withholding taxes of $117) $ 31,241Interest 115
31,356 Expenses
Sub-advisor fees 15,333Trustee fees 10,733Custody fees 10,011Audit fees 5,400
41,477 Net investment loss (10,121) Net realized gain from investments sold
Proceeds from sales of investments 3,374,758Cost of investments sold 2,568,118
Net realized gain from investments sold 806,640 Change in net unrealized appreciation (depreciation) on investments (541,124) Net realized and unrealized gain on investments 265,516 Net increase in net assets resulting from operations $ 255,395
569

THE COLLECTIVE INVESTMENT FUNDS OF FIRST MERCANTILE TRUST COMPANY FMT Special Opportunities (Sterling) Fund
Statement of Changes in Net Assets For the Year Ended December 31, 2015
The accompanying notes are an integral part of these financial statements.
Operations
Net investment loss $ (10,121)
Net realized gain from investments sold 806,640
Change in net unrealized appreciation (depreciation) on investments (541,124)
Net increase in net assets resulting from operations 255,395 Participant transactions
Proceeds from units purchased 664,425Less payments for units redeemed 2,676,040
Decrease in net assets from participant transactions (2,011,615)
Total decrease in net assets (1,756,220) Net assets at beginning of year 2,890,324 Net assets at end of year $ 1,134,104
570

THE COLLECTIVE INVESTMENT FUNDS OF FIRST MERCANTILE TRUST COMPANY FMT Special Opportunities (Sterling) Fund
Schedule of Investments and Specific Fund Disclosures December 31, 2015
The accompanying notes are an integral part of these financial statements.
Investments
Principal Amount or
Shares Fair Value ____________ ____________
Common stocks (90.9%)
Communications (24.6%) Alphabet, Inc. Class C 58 $ 44,015 AT&T, Inc. 691 23,777 CBS Corp. Class B 902 42,511 Cisco Systems, Inc. 1,577 42,823 Comcast Corp. Class A 740 41,758 Discovery Communications, Inc. Class C 1,644 41,462 Nielsen Holdings PLC 906 42,220 __________ 278,566
Consumer, Cyclical (5.7%) Ford Motor Co. 2,960 41,706 Lennar Corp. Class A 462 22,597 __________ 64,303
Consumer, Non-cyclical (32.5%) HCA Holdings, Inc. 628 42,471 Jarden Corp. 498 28,446 Live Nation Entertainment, Inc. 904 22,211 MEDNAX, Inc. 548 39,270 Mondelez International, Inc. Class A 632 28,339 Myriad Genetics, Inc. 783 33,794 Perrigo Co. PLC 234 33,860 Tyson Foods, Inc. Class A 527 28,105 UnitedHealth Group, Inc. 356 41,880 Verisk Analytics, Inc. 548 42,130 Zimmer Biomet Holdings, Inc. 278 28,520 __________ 369,026
Financial (7.5%) Capital One Financial Corp. 580 41,865 CBRE Group, Inc. Class A 1,242 42,948 __________ 84,813
Industrial (2.5%) JB Hunt Transport Services, Inc. 394 28,904
Technology (18.1%) Activision Blizzard, Inc. 1,020 39,484 Akamai Technologies, Inc. 794 41,788
571

THE COLLECTIVE INVESTMENT FUNDS OF FIRST MERCANTILE TRUST COMPANY FMT Special Opportunities (Sterling) Fund
Schedule of Investments and Specific Fund Disclosures (continued) December 31, 2015
The accompanying notes are an integral part of these financial statements.
Investments
Principal Amount or
Shares Fair Value ____________ ____________
Common stocks (continued)
Technology (continued) Autodesk, Inc. 371 $ 22,605 Check Point Software Technologies Ltd. 512 41,667 IMS Health Holdings, Inc. 885 22,541 Intuit, Inc. 390 37,635 __________ 205,720 __________ Total Common stocks (Cost $794,102) 1,031,332
Real estate investment trusts (6.1%) American Campus Communities, Inc. 860 35,553 Ryman Hospitality Properties, Inc. 660 34,083 __________ Total Real estate investment trusts (Cost $56,860) 69,636 __________Total Investments (Cost $850,962) $ 1,100,968 ____________________
572

THE COLLECTIVE INVESTMENT FUNDS OF FIRST MERCANTILE TRUST COMPANY FMT Special Opportunities (Sterling) Fund
Schedule of Investments and Specific Fund Disclosures (continued) December 31, 2015
The accompanying notes are an integral part of these financial statements.
Specific Fund Disclosures Fair value The inputs or methodology used for valuing securities may not be indicative of the risks associated with investing in those securities. For more information on valuation inputs, and their aggregation into the levels used in the table below, please refer to note 4 to the financial statements. The following table sets forth by level, within the fair value hierarchy, the Fund's investments measured at fair value.
Total Level 1 Level 2 Level 3
Common stocks $ 1,031,332 $ 1,031,332 $ — $ —Real estate investment trusts 69,636 69,636 — —__________ __________ __________ _________
$ 1,100,968 $ 1,100,968 $ — $ —__________ __________ __________ ___________________ __________ __________ _________ Investment transactions The aggregate cost of purchases of investment securities and proceeds from sales of investment securities (other than temporary cash investments) totaled $1,353,537 and $3,374,758, respectively, for the year ended December 31, 2015. Class-specific expenses Class-specific trustee fees for the year ended December 31, 2015 were as follows: Class R1 $ 10,733
573

THE COLLECTIVE INVESTMENT FUNDS OF FIRST MERCANTILE TRUST COMPANY FMT Special Opportunities (Sterling) Fund
Schedule of Participant Transactions December 31, 2015
The accompanying notes are an integral part of these financial statements.
Participant transactions by class for the year ended December 31, 2015 were as follows: Dollars Units Purchases Redemptions Net change Purchases Redemptions Net change Class R1 $ 664,425 $ (2,676,040) $ (2,011,615) 44,171 (171,069) (126,898)
574
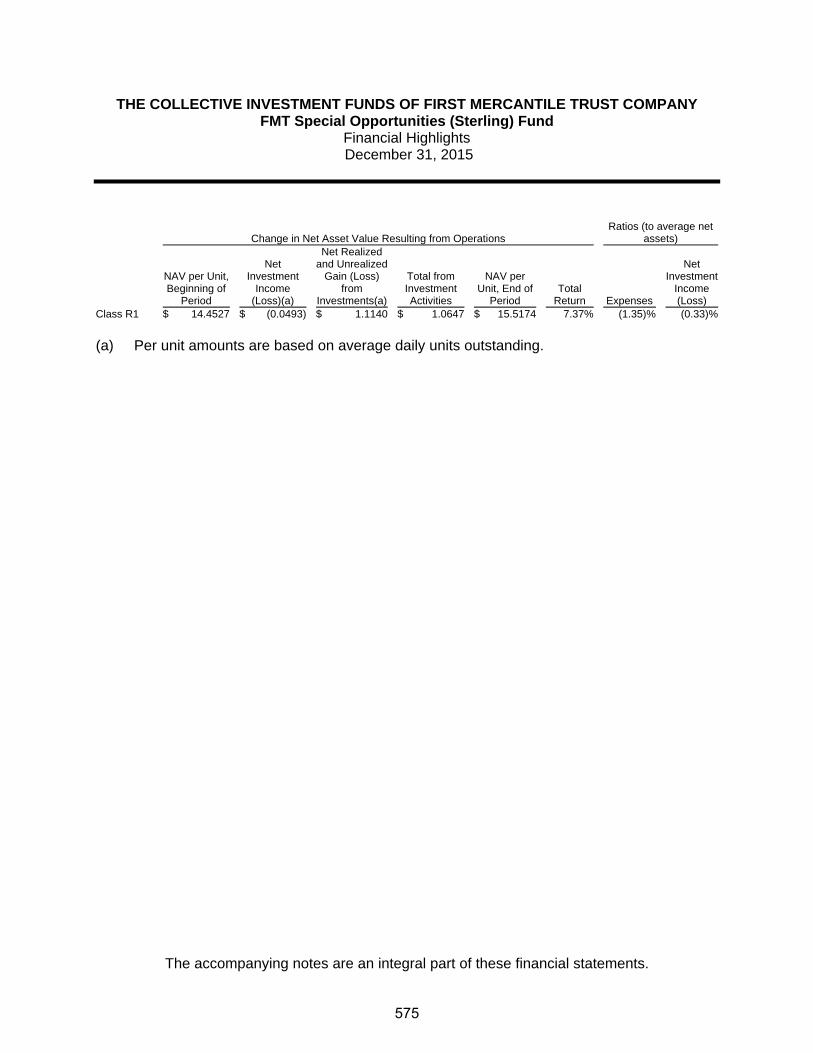
THE COLLECTIVE INVESTMENT FUNDS OF FIRST MERCANTILE TRUST COMPANY FMT Special Opportunities (Sterling) Fund
Financial Highlights December 31, 2015
The accompanying notes are an integral part of these financial statements.
Change in Net Asset Value Resulting from Operations Ratios (to average net
assets)
NAV per Unit, Beginning of
Period
Net Investment
Income (Loss)(a)
Net Realized and Unrealized
Gain (Loss) from
Investments(a)
Total from Investment Activities
NAV per Unit, End of
Period Total
Return Expenses
Net Investment
Income (Loss)
Class R1 $ 14.4527 $ (0.0493) $ 1.1140 $ 1.0647 $ 15.5174 7.37% (1.35)% (0.33)%
(a) Per unit amounts are based on average daily units outstanding.
575

FMT U.S. Growth Opportunities (Zevenbergen) Fund

THE COLLECTIVE INVESTMENT FUNDS OF FIRST MERCANTILE TRUST COMPANY FMT U.S. Growth Opportunities (Zevenbergen) Fund
Statement of Assets and Liabilities December 31, 2015
The accompanying notes are an integral part of these financial statements.
Assets Investments in securities, at fair value $ 50,690,451 Cash equivalents 107,604Receivables
Investments sold 25,954 Dividends and interest 1,184
Total assets 50,825,193 Liabilities Investments purchased 130,270Trustee fees 22,204Sub-advisor fees 21,720
Total liabilities 174,194 Net assets $ 50,650,999 Components of net assets
Units of
Participation NAV
per Unit Net
Assets Class R1 921,377 $ 22.9322 $ 21,129,175Class R2 414,180 $ 18.0082 7,458,628Class R3 253,287 $ 17.9854 4,555,476Class R4 306,678 $ 18.8715 5,787,471Class R5 90,913 $ 17.6043 1,600,463Class R6 45,919 $ 17.9835 825,782Class R7 38,252 $ 17.2550 660,047Class R8 56,075 $ 17.6956 992,279Class LifeStyle 7,641,678
$ 50,650,999
576

THE COLLECTIVE INVESTMENT FUNDS OF FIRST MERCANTILE TRUST COMPANY FMT U.S. Growth Opportunities (Zevenbergen) Fund
Statement of Operations For the Year Ended December 31, 2015
The accompanying notes are an integral part of these financial statements.
Investment income
Dividends $ 46,001 Expenses
Trustee fees 308,689Sub-advisor fees 252,656Custody fees 16,590Audit fees 5,557
583,492 Net investment loss (537,491) Net realized gain from investments sold
Proceeds from sales of investments 18,991,294Cost of investments sold 14,439,854
Net realized gain from investments sold 4,551,440 Change in net unrealized appreciation (depreciation) on investments (1,526,001) Net realized and unrealized gain on investments 3,025,439 Other operating credits (charges) 223 Net increase in net assets resulting from operations $ 2,488,171
577
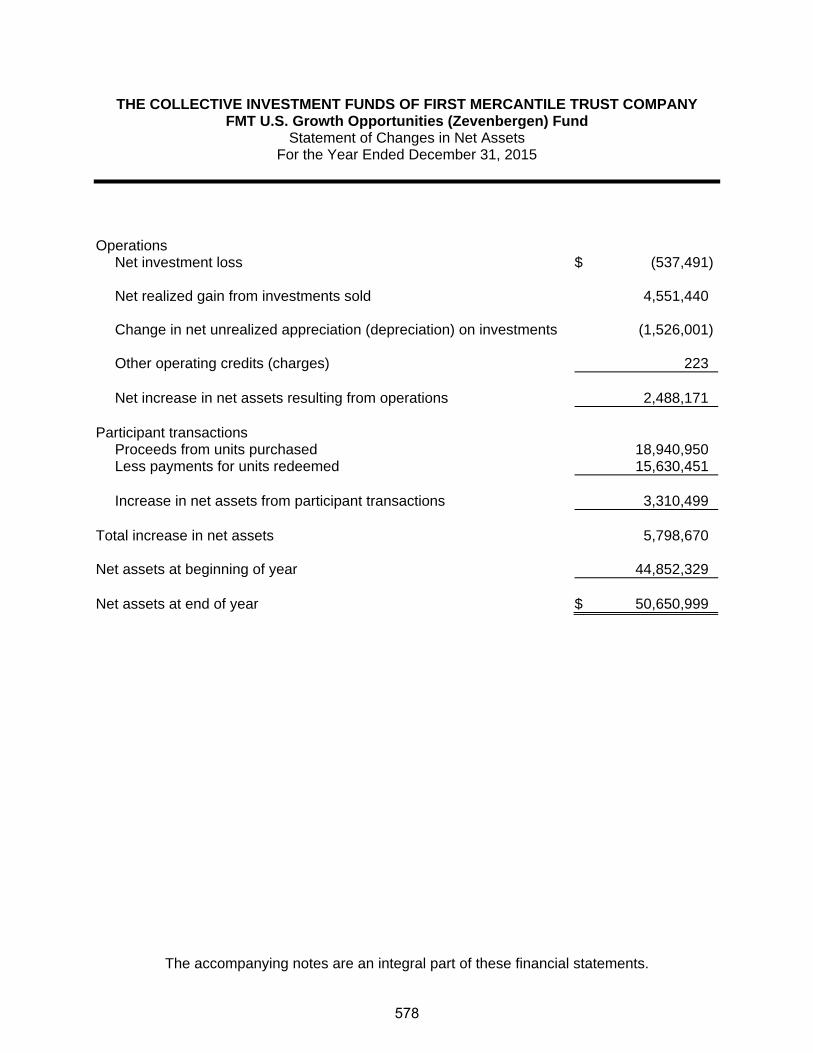
THE COLLECTIVE INVESTMENT FUNDS OF FIRST MERCANTILE TRUST COMPANY FMT U.S. Growth Opportunities (Zevenbergen) Fund
Statement of Changes in Net Assets For the Year Ended December 31, 2015
The accompanying notes are an integral part of these financial statements.
Operations
Net investment loss $ (537,491)
Net realized gain from investments sold 4,551,440
Change in net unrealized appreciation (depreciation) on investments (1,526,001)
Other operating credits (charges) 223
Net increase in net assets resulting from operations 2,488,171 Participant transactions
Proceeds from units purchased 18,940,950Less payments for units redeemed 15,630,451
Increase in net assets from participant transactions 3,310,499
Total increase in net assets 5,798,670 Net assets at beginning of year 44,852,329 Net assets at end of year $ 50,650,999
578

THE COLLECTIVE INVESTMENT FUNDS OF FIRST MERCANTILE TRUST COMPANY FMT U.S. Growth Opportunities (Zevenbergen) Fund Schedule of Investments and Specific Fund Disclosures
December 31, 2015
The accompanying notes are an integral part of these financial statements.
Investments
Principal Amount or
Shares Fair Value ____________ ____________
Common stocks (94.0%)
Communications (41.0%) Alphabet, Inc. Class A 2,470 $ 1,921,685 Amazon.com, Inc. 5,750 3,886,367 Expedia, Inc. 3,304 410,687 Facebook, Inc. Class A 25,375 2,655,748 LinkedIn Corp. Class A 6,300 1,418,004 MercadoLibre, Inc. 11,250 1,286,325 Netflix, Inc. 26,200 2,996,756 Palo Alto Networks, Inc. 7,400 1,303,436 Pandora Media, Inc. 69,600 933,336 Priceline Group, Inc./The 1,300 1,657,435 Splunk, Inc. 8,200 482,242 Zillow Group, Inc. Class A 23,500 611,940 Zillow Group, Inc. Class C 51,000 1,197,480 __________ 20,761,441
Consumer, Cyclical (11.0%) Chipotle Mexican Grill, Inc. 2,190 1,050,872 lululemon athletica, Inc. 22,100 1,159,587 Tesla Motors, Inc. 12,100 2,904,121 Under Armour, Inc. Class A 5,900 475,599 __________ 5,590,179
Consumer, Non-cyclical (18.7%) Alexion Pharmaceuticals, Inc. 7,650 1,459,238 BioMarin Pharmaceutical, Inc. 9,700 1,016,172 Celgene Corp. 19,600 2,347,296 Exact Sciences Corp. 47,800 441,194 Gilead Sciences, Inc. 12,100 1,224,399 Illumina, Inc. 5,050 969,322 PayPal Holdings, Inc. 13,600 492,320 Regeneron Pharmaceuticals, Inc. 2,800 1,520,036 __________ 9,469,977
Financial (12.7%) Alliance Data Systems Corp. 4,550 1,258,393 Charles Schwab Corp./The 57,850 1,905,000 First Republic Bank/CA 19,150 1,265,049 LendingClub Corp. 119,900 1,324,895 PRA Group, Inc. 4,000 138,760
579

THE COLLECTIVE INVESTMENT FUNDS OF FIRST MERCANTILE TRUST COMPANY FMT U.S. Growth Opportunities (Zevenbergen) Fund
Schedule of Investments and Specific Fund Disclosures (continued) December 31, 2015
The accompanying notes are an integral part of these financial statements.
Investments
Principal Amount or
Shares Fair Value
Common stocks (continued)
Financial (continued) Signature Bank 3,450 $ 529,127 __________
6,421,224
Industrial (4.0%) XPO Logistics, Inc. 75,200 2,049,200
Technology (6.6%) Medidata Solutions, Inc. 23,600 1,163,244 Monolithic Power Systems, Inc. 2,000 127,420 salesforce.com, Inc. 14,800 1,160,320 ServiceNow, Inc. 10,300 891,568 __________ 3,342,552 __________ Total Common stocks (Cost $32,446,431) 47,634,573
Depository receipts (6.0%)
Communications (6.0%) Alibaba Group Holding Ltd. ADR 13,000 1,056,510 Baidu, Inc. ADR 4,800 907,392 Criteo S.A. ADR 10,300 407,880 Vipshop Holdings Ltd. ADR 44,800 684,096 __________ Total Depository receipts (Cost $3,075,733) 3,055,878 __________Total Investments (Cost $35,522,164) $ 50,690,451 ____________________
580

THE COLLECTIVE INVESTMENT FUNDS OF FIRST MERCANTILE TRUST COMPANY FMT U.S. Growth Opportunities (Zevenbergen) Fund
Schedule of Investments and Specific Fund Disclosures (continued) December 31, 2015
The accompanying notes are an integral part of these financial statements.
Specific Fund Disclosures Fair value The inputs or methodology used for valuing securities may not be indicative of the risks associated with investing in those securities. For more information on valuation inputs, and their aggregation into the levels used in the table below, please refer to note 4 to the financial statements. The following table sets forth by level, within the fair value hierarchy, the Fund's investments measured at fair value.
Total Level 1 Level 2 Level 3
Common stocks $ 47,634,573 $ 47,634,573 $ — $ —Depository receipts 3,055,878 3,055,878 — —__________ __________ __________ _________
$ 50,690,451 $ 50,690,451 $ — $ —__________ __________ __________ ___________________ __________ __________ _________ Investment transactions The aggregate cost of purchases of investment securities and proceeds from sales of investment securities (other than temporary cash investments) totaled $22,843,599 and $18,991,294, respectively, for the year ended December 31, 2015. Class-specific expenses Class-specific trustee fees for the year ended December 31, 2015 were as follows: Class R1 $ 75,525 Class R2 39,346 Class R3 35,127 Class R4 51,759 Class R5 27,192 Class R6 12,258 Class R7 15,013 Class R8 16,667 Class LifeStyle 35,802 $ 308,689
581

THE COLLECTIVE INVESTMENT FUNDS OF FIRST MERCANTILE TRUST COMPANY FMT U.S. Growth Opportunities (Zevenbergen) Fund
Schedule of Participant Transactions December 31, 2015
The accompanying notes are an integral part of these financial statements.
Participant transactions by class for the year ended December 31, 2015 were as follows: Dollars Units Purchases Redemptions Net change Purchases Redemptions Net change Class R1 $ 3,017,418 $ (3,608,832) $ (591,414) 130,448 (158,735) (28,287)Class R2 1,927,399 (685,014) 1,242,385 105,817 (38,356) 67,461Class R3 905,836 (1,539,990) (634,154) 50,790 (86,020) (35,230)Class R4 2,685,211 (2,640,686) 44,525 142,106 (140,718) 1,388Class R5 199,344 (2,371,591) (2,172,247) 11,548 (134,980) (123,432)Class R6 165,515 (475,279) (309,764) 9,126 (25,964) (16,838)Class R7 63,513 (1,427,259) (1,363,746) 3,709 (83,087) (79,378)Class R8 132,735 (414,715) (281,980) 7,492 (23,476) (15,984)Class LifeStyle 9,843,979 (2,467,085) 7,376,894 — — — $ 18,940,950 $ (15,630,451) $ 3,310,499 461,036 (691,336) (230,300)
582

THE COLLECTIVE INVESTMENT FUNDS OF FIRST MERCANTILE TRUST COMPANY FMT U.S. Growth Opportunities (Zevenbergen) Fund
Financial Highlights December 31, 2015
The accompanying notes are an integral part of these financial statements.
Change in Net Asset Value Resulting from Operations Ratios (to average net
assets)
NAV per Unit, Beginning of
Period
Net Investment
Income (Loss)(a)
Net Realized and Unrealized
Gain (Loss) from
Investments(a)
Total from Investment Activities
NAV per Unit, End of
Period Total
Return Expenses
Net Investment
Income (Loss)
Class R1 $ 21.7357 $ (0.1832) $ 1.3797 $ 1.1965 $ 22.9322 5.50% (0.89)% (0.80)%Class R2 17.1063 (0.1837) 1.0856 0.9019 18.0082 5.27% (1.11)% (1.02)%Class R3 17.1139 (0.2142) 1.0857 0.8715 17.9854 5.09% (1.28)% (1.19)%Class R4 17.9877 (0.2573) 1.1411 0.8838 18.8715 4.91% (1.45)% (1.36)%Class R5 16.8084 (0.2694) 1.0653 0.7959 17.6043 4.74% (1.62)% (1.53)%Class R6 17.1998 (0.3067) 1.0904 0.7837 17.9835 4.56% (1.79)% (1.70)%Class R7 16.5317 (0.3222) 1.0455 0.7233 17.2550 4.38% (1.96)% (1.87)%Class R8 16.9824 (0.3624) 1.0756 0.7132 17.6956 4.20% (2.13)% (2.04)%
(a) Per unit amounts are based on average daily units outstanding.
583

FMT/Alger Spectra Fund
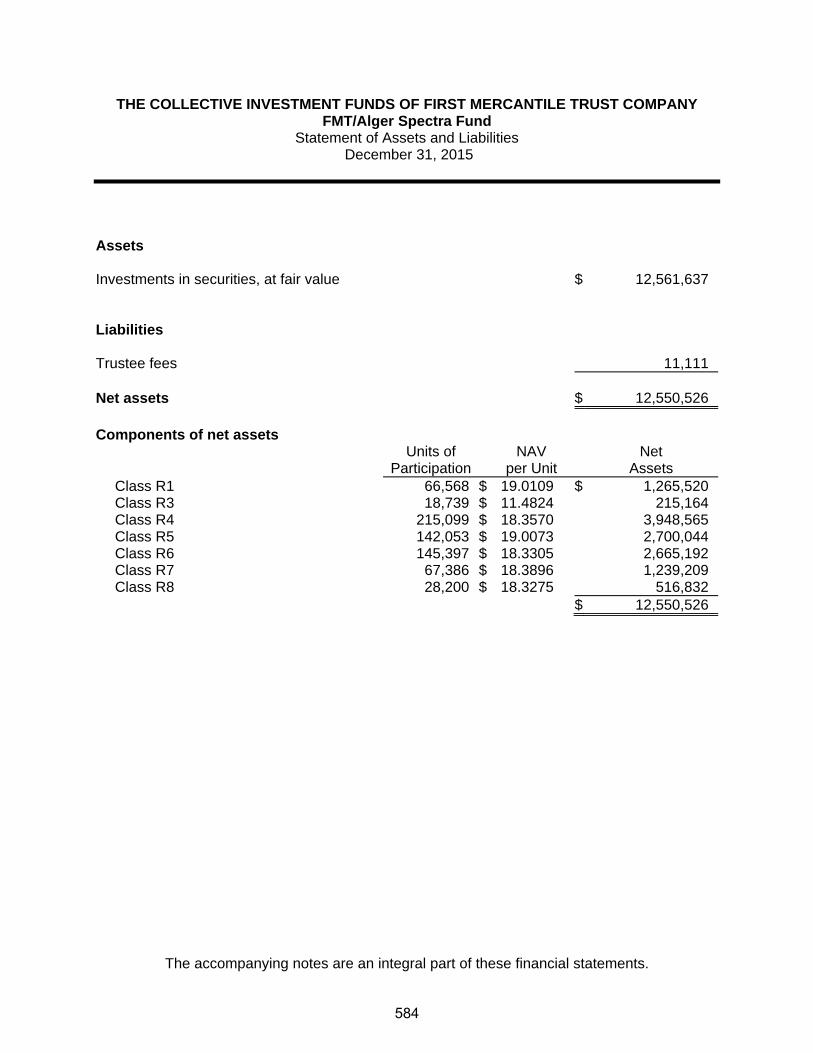
THE COLLECTIVE INVESTMENT FUNDS OF FIRST MERCANTILE TRUST COMPANY FMT/Alger Spectra Fund
Statement of Assets and Liabilities December 31, 2015
The accompanying notes are an integral part of these financial statements.
Assets Investments in securities, at fair value $ 12,561,637 Liabilities Trustee fees 11,111 Net assets $ 12,550,526 Components of net assets
Units of
Participation NAV
per Unit Net
Assets Class R1 66,568 $ 19.0109 $ 1,265,520Class R3 18,739 $ 11.4824 215,164Class R4 215,099 $ 18.3570 3,948,565Class R5 142,053 $ 19.0073 2,700,044Class R6 145,397 $ 18.3305 2,665,192Class R7 67,386 $ 18.3896 1,239,209Class R8 28,200 $ 18.3275 516,832
$ 12,550,526
584

THE COLLECTIVE INVESTMENT FUNDS OF FIRST MERCANTILE TRUST COMPANY FMT/Alger Spectra Fund Statement of Operations
For the Year Ended December 31, 2015
The accompanying notes are an integral part of these financial statements.
Investment income
Dividends $ 1,000,060 Expenses
Trustee fees 133,167Custody fees 4,657Audit fees 1,200
139,024 Net investment income 861,036 Net realized gain from investments sold
Proceeds from sales of investments 5,431,225Cost of investments sold 4,036,654
Net realized gain from investments sold 1,394,571 Change in net unrealized appreciation (depreciation) on investments (1,438,641) Net realized and unrealized loss on investments (44,070) Other operating credits (charges) 81,635 Net increase in net assets resulting from operations $ 898,601
585

THE COLLECTIVE INVESTMENT FUNDS OF FIRST MERCANTILE TRUST COMPANY FMT/Alger Spectra Fund
Statement of Changes in Net Assets For the Year Ended December 31, 2015
The accompanying notes are an integral part of these financial statements.
Operations
Net investment income $ 861,036
Net realized gain from investments sold 1,394,571
Change in net unrealized appreciation (depreciation) on investments (1,438,641)
Other operating credits (charges) 81,635
Net increase in net assets resulting from operations 898,601 Participant transactions
Proceeds from units purchased 5,784,087Less payments for units redeemed 6,978,884
Decrease in net assets from participant transactions (1,194,797)
Total decrease in net assets (296,196) Net assets at beginning of year 12,846,722 Net assets at end of year $ 12,550,526
586

THE COLLECTIVE INVESTMENT FUNDS OF FIRST MERCANTILE TRUST COMPANY FMT/Alger Spectra Fund
Schedule of Investments and Specific Fund Disclosures December 31, 2015
The accompanying notes are an integral part of these financial statements.
Investments Shares Fair Value ____________ ____________
Mutual fund (100.1%) Alger Spectra A Fund (Cost $10,589,741) 731,604 $ 12,561,637 ____________________ Specific Fund Disclosures Fair value The inputs or methodology used for valuing securities may not be indicative of the risks associated with investing in those securities. For more information on valuation inputs, and their aggregation into the levels used in the table below, please refer to note 4 to the financial statements. The following table sets forth by level, within the fair value hierarchy, the Fund's investments measured at fair value.
Total Level 1 Level 2 Level 3
Mutual fund - Large Cap Growth $ 12,561,637 $ 12,561,637 $ — $ —__________ __________ __________ ___________________ __________ __________ _________ Investment transactions The aggregate cost of purchases of investment securities and proceeds from sales of investment securities (other than temporary cash investments) totaled $5,179,119 and $5,431,225, respectively, for the year ended December 31, 2015. Class-specific expenses Class-specific trustee fees for the year ended December 31, 2015 were as follows: Class R1 $ 8,221 Class R2 269 Class R3 1,182 Class R4 32,696 Class R5 31,728 Class R6 33,868 Class R7 17,046 Class R8 8,157 $ 133,167
587

THE COLLECTIVE INVESTMENT FUNDS OF FIRST MERCANTILE TRUST COMPANY FMT/Alger Spectra Fund
Schedule of Participant Transactions December 31, 2015
The accompanying notes are an integral part of these financial statements.
Participant transactions by class for the year ended December 31, 2015 were as follows: Dollars Units Purchases Redemptions Net change Purchases Redemptions Net change Class R1 $ 3,288,279 $ (3,926,870) $ (638,591) 178,282 (205,354) (27,072)Class R2 — (528,165) (528,165) — (34,322) (34,322)Class R3 95,911 (87) 95,824 8,185 (8) 8,177Class R4 1,725,937 (631,385) 1,094,552 95,114 (34,685) 60,429Class R5 301,113 (1,287,099) (985,986) 16,036 (68,302) (52,266)Class R6 237,046 (497,044) (259,998) 13,144 (28,756) (15,612)Class R7 84,584 (46,459) 38,125 4,653 (2,591) 2,062Class R8 51,217 (61,775) (10,558) 2,862 (3,555) (693) $ 5,784,087 $ (6,978,884) $ (1,194,797) 318,276 (377,573) (59,297)
588

THE COLLECTIVE INVESTMENT FUNDS OF FIRST MERCANTILE TRUST COMPANY FMT/Alger Spectra Fund
Financial Highlights December 31, 2015
The accompanying notes are an integral part of these financial statements.
Change in Net Asset Value Resulting from Operations Ratios (to average net
assets)
NAV per Unit, Beginning of
Period
Net Investment
Income (Loss)(a)
Net Realized and Unrealized
Gain (Loss) from
Investments(a)
Total from Investment Activities
NAV per Unit, End of
Period Total
Return Expenses
Net Investment
Income (Loss)
Class R1 $ 17.7282 $ 0.8427 $ 0.4400 $ 1.2827 $ 19.0109 7.24% (0.39)% 4.50%Class R2(b) 15.4847 (0.0006) (0.0971) (0.0977) — (0.63)% (0.61)% (0.04)%Class R3 10.7496 1.2041 (0.4713) 0.7328 11.4824 6.82% (0.78)% 10.65%Class R4 17.2147 1.5122 (0.3699) 1.1423 18.3570 6.64% (0.95)% 8.34%Class R5 17.8550 1.2771 (0.1248) 1.1523 19.0073 6.45% (1.12)% 6.82%Class R6 17.2486 1.3007 (0.2188) 1.0819 18.3305 6.27% (1.29)% 7.18%Class R7 17.3338 1.3507 (0.2949) 1.0558 18.3896 6.09% (1.46)% 7.43%Class R8 17.3046 1.2795 (0.2566) 1.0229 18.3275 5.91% (1.63)% 7.06%
(a) Per unit amounts are based on average daily units outstanding.
(b) For the period from January 1, 2015 through February 2, 2015.
589
FMT/American Beacon Large Cap Value Institutional Fund

THE COLLECTIVE INVESTMENT FUNDS OF FIRST MERCANTILE TRUST COMPANY FMT/American Beacon Large Cap Value Institutional Fund
Statement of Assets and Liabilities December 31, 2015
The accompanying notes are an integral part of these financial statements.
Assets Investments in securities, at fair value $ 24,142,561 Liabilities Trustee fees 13,068 Net assets $ 24,129,493 Components of net assets
Units of
Participation NAV
per Unit Net
Assets Class R1 710,316 $ 16.0103 $ 11,372,386Class R2 84,148 $ 10.5664 889,133Class R3 393,988 $ 16.2153 6,388,643Class R4 115,626 $ 16.7413 1,935,733Class R5 136,315 $ 16.2034 2,208,772Class R6 47,125 $ 16.0917 758,313Class R7 8,610 $ 15.3778 132,409Class R8 28,253 $ 15.7189 444,104
$ 24,129,493
590

THE COLLECTIVE INVESTMENT FUNDS OF FIRST MERCANTILE TRUST COMPANY FMT/American Beacon Large Cap Value Institutional Fund
Statement of Operations For the Year Ended December 31, 2015
The accompanying notes are an integral part of these financial statements.
Investment income
Dividends $ 2,561,511 Expenses
Trustee fees 153,361Custody fees 8,481Audit fees 1,200
163,042 Net investment income 2,398,469 Net realized gain from investments sold
Proceeds from sales of investments 4,393,870Cost of investments sold 3,432,324
Net realized gain from investments sold 961,546 Change in net unrealized appreciation (depreciation) on investments (4,867,027) Net realized and unrealized loss on investments (3,905,481) Other operating credits (charges) 9,878 Net decrease in net assets resulting from operations $ (1,497,134)
591
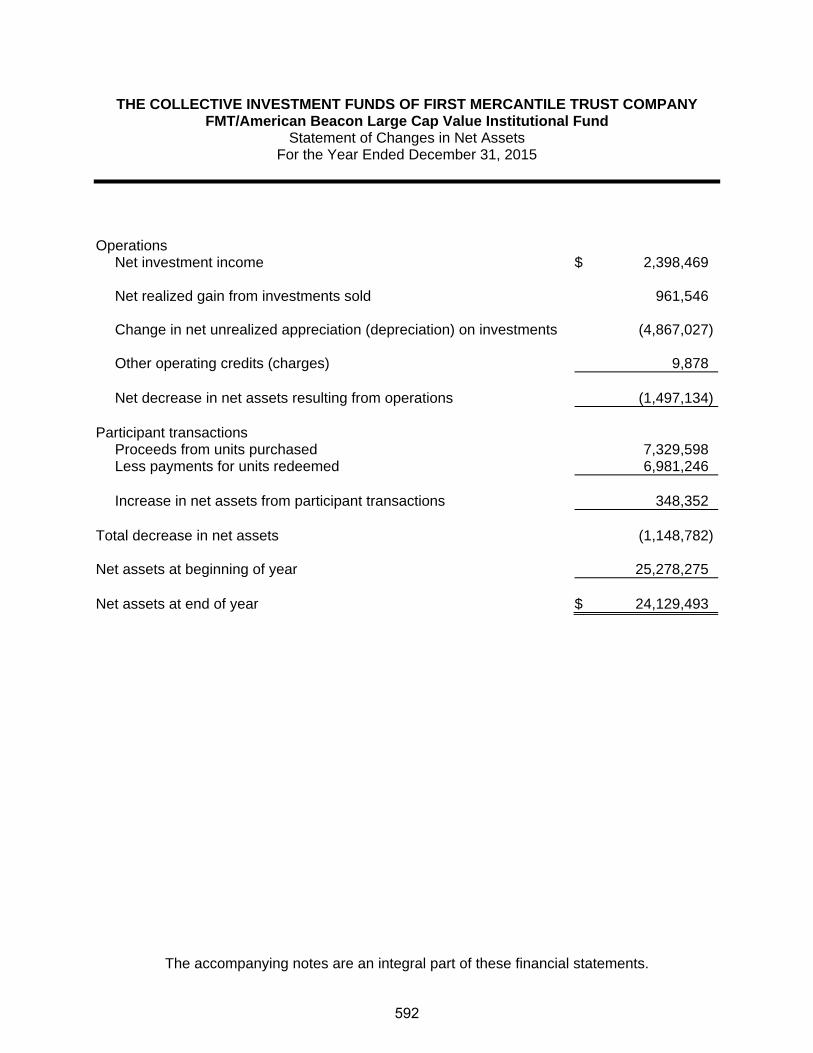
THE COLLECTIVE INVESTMENT FUNDS OF FIRST MERCANTILE TRUST COMPANY FMT/American Beacon Large Cap Value Institutional Fund
Statement of Changes in Net Assets For the Year Ended December 31, 2015
The accompanying notes are an integral part of these financial statements.
Operations
Net investment income $ 2,398,469
Net realized gain from investments sold 961,546
Change in net unrealized appreciation (depreciation) on investments (4,867,027)
Other operating credits (charges) 9,878
Net decrease in net assets resulting from operations (1,497,134) Participant transactions
Proceeds from units purchased 7,329,598Less payments for units redeemed 6,981,246
Increase in net assets from participant transactions 348,352
Total decrease in net assets (1,148,782) Net assets at beginning of year 25,278,275 Net assets at end of year $ 24,129,493
592
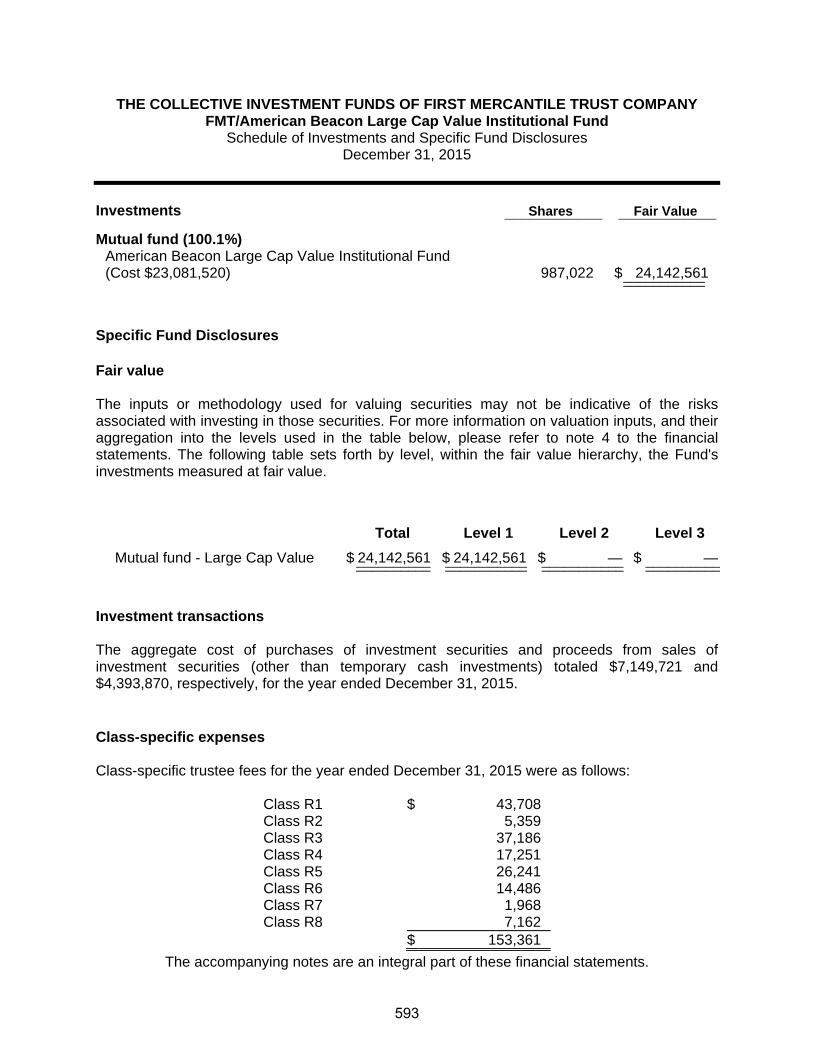
THE COLLECTIVE INVESTMENT FUNDS OF FIRST MERCANTILE TRUST COMPANY FMT/American Beacon Large Cap Value Institutional Fund
Schedule of Investments and Specific Fund Disclosures December 31, 2015
The accompanying notes are an integral part of these financial statements.
Investments Shares Fair Value ____________ ____________
Mutual fund (100.1%)
American Beacon Large Cap Value Institutional Fund (Cost $23,081,520) 987,022 $ 24,142,561 ______________________
Specific Fund Disclosures Fair value The inputs or methodology used for valuing securities may not be indicative of the risks associated with investing in those securities. For more information on valuation inputs, and their aggregation into the levels used in the table below, please refer to note 4 to the financial statements. The following table sets forth by level, within the fair value hierarchy, the Fund's investments measured at fair value.
Total Level 1 Level 2 Level 3
Mutual fund - Large Cap Value $ 24,142,561 $ 24,142,561 $ — $ —__________ ___________ ___________ ____________________ ___________ ___________ __________ Investment transactions The aggregate cost of purchases of investment securities and proceeds from sales of investment securities (other than temporary cash investments) totaled $7,149,721 and $4,393,870, respectively, for the year ended December 31, 2015. Class-specific expenses Class-specific trustee fees for the year ended December 31, 2015 were as follows: Class R1 $ 43,708 Class R2 5,359 Class R3 37,186 Class R4 17,251 Class R5 26,241 Class R6 14,486 Class R7 1,968 Class R8 7,162 $ 153,361
593

THE COLLECTIVE INVESTMENT FUNDS OF FIRST MERCANTILE TRUST COMPANY FMT/American Beacon Large Cap Value Institutional Fund
Schedule of Participant Transactions December 31, 2015
The accompanying notes are an integral part of these financial statements.
Participant transactions by class for the year ended December 31, 2015 were as follows: Dollars Units Purchases Redemptions Net change Purchases Redemptions Net change Class R1 $ 1,793,133 $ (2,830,139) $ (1,037,006) 107,738 (169,148) (61,410)Class R2 42,346 (44,468) (2,122) 3,740 (3,961) (221)Class R3 3,274,962 (436,990) 2,837,972 198,380 (25,429) 172,951Class R4 1,491,699 (1,484,284) 7,415 84,152 (82,245) 1,907Class R5 521,719 (1,002,425) (480,706) 31,371 (57,749) (26,378)Class R6 96,910 (1,004,775) (907,865) 5,785 (57,347) (51,562)Class R7 23,241 (32,716) (9,475) 1,453 (1,978) (525)Class R8 85,588 (145,449) (59,861) 5,099 (8,606) (3,507) $ 7,329,598 $ (6,981,246) $ 348,352 437,718 (406,463) 31,255
594

THE COLLECTIVE INVESTMENT FUNDS OF FIRST MERCANTILE TRUST COMPANY FMT/American Beacon Large Cap Value Institutional Fund
Financial Highlights December 31, 2015
The accompanying notes are an integral part of these financial statements.
Change in Net Asset Value Resulting from Operations Ratios (to average net
assets)
NAV per Unit, Beginning of
Period
Net Investment
Income (Loss)(a)
Net Realized and Unrealized
Gain (Loss) from
Investments(a)
Total from Investment Activities
NAV per Unit, End of
Period Total
Return Expenses
Net Investment
Income (Loss)
Class R1 $ 17.0999 $ 1.5882 $ (2.6778) $ (1.0896) $ 16.0103 (6.37)% (0.39)% 9.38%Class R2 11.3105 1.0559 (1.8000) (0.7441) 10.5664 (6.58)% (0.61)% 9.44%Class R3 17.3870 2.1755 (3.3472) (1.1717) 16.2153 (6.74)% (0.78)% 12.72%Class R4 17.9817 1.7542 (2.9946) (1.2404) 16.7413 (6.90)% (0.95)% 9.89%Class R5 17.4339 1.4428 (2.6733) (1.2305) 16.2034 (7.06)% (1.12)% 8.39%Class R6 17.3432 0.9839 (2.2354) (1.2515) 16.0917 (7.22)% (1.29)% 5.72%Class R7 16.6022 1.4180 (2.6424) (1.2244) 15.3778 (7.37)% (1.46)% 8.68%Class R8 16.9996 1.4767 (2.7574) (1.2807) 15.7189 (7.53)% (1.63)% 8.84%
(a) Per unit amounts are based on average daily units outstanding.
595

FMT/American Beacon Small Cap Value Institutional Fund

THE COLLECTIVE INVESTMENT FUNDS OF FIRST MERCANTILE TRUST COMPANY FMT/American Beacon Small Cap Value Institutional Fund
Statement of Assets and Liabilities December 31, 2015
The accompanying notes are an integral part of these financial statements.
Assets Investments in securities, at fair value $ 3,314,199 Liabilities Trustee fees 1,958 Net assets $ 3,312,241 Components of net assets
Units of
Participation NAV
per Unit Net
Assets Class R1 77,407 $ 18.3882 $ 1,423,383Class R2 9,030 $ 14.8371 133,985Class R3 24,557 $ 14.6759 360,392Class R4 54,126 $ 15.6912 849,308Class R5 12,211 $ 16.4808 201,245Class R6 20,440 $ 15.2354 311,414Class R7 1,574 $ 15.3849 24,221Class R8 541 $ 15.3347 8,293
$ 3,312,241
596

THE COLLECTIVE INVESTMENT FUNDS OF FIRST MERCANTILE TRUST COMPANY FMT/American Beacon Small Cap Value Institutional Fund
Statement of Operations For the Year Ended December 31, 2015
The accompanying notes are an integral part of these financial statements.
Investment income
Dividends $ 188,289 Expenses
Trustee fees 25,814Custody fees 1,371Audit fees 1,200
28,385 Net investment income 159,904 Net realized gain from investments sold
Proceeds from sales of investments 1,339,411Cost of investments sold 1,180,553
Net realized gain from investments sold 158,858 Change in net unrealized appreciation (depreciation) on investments (537,928) Net realized and unrealized loss on investments (379,070) Other operating credits (charges) 1,594 Net decrease in net assets resulting from operations $ (217,572)
597

THE COLLECTIVE INVESTMENT FUNDS OF FIRST MERCANTILE TRUST COMPANY FMT/American Beacon Small Cap Value Institutional Fund
Statement of Changes in Net Assets For the Year Ended December 31, 2015
The accompanying notes are an integral part of these financial statements.
Operations
Net investment income $ 159,904
Net realized gain from investments sold 158,858
Change in net unrealized appreciation (depreciation) on investments (537,928)
Other operating credits (charges) 1,594
Net decrease in net assets resulting from operations (217,572) Participant transactions
Proceeds from units purchased 989,497Less payments for units redeemed 1,427,362
Decrease in net assets from participant transactions (437,865)
Total decrease in net assets (655,437) Net assets at beginning of year 3,967,678 Net assets at end of year $ 3,312,241
598

THE COLLECTIVE INVESTMENT FUNDS OF FIRST MERCANTILE TRUST COMPANY FMT/American Beacon Small Cap Value Institutional Fund
Schedule of Investments and Specific Fund Disclosures December 31, 2015
The accompanying notes are an integral part of these financial statements.
Investments Shares Fair Value ____________ ____________
Mutual fund (100.1%)
American Beacon Small Cap Value Institutional Fund (Cost $3,271,034) 147,560 $ 3,314,199 ______________________
Specific Fund Disclosures Fair value The inputs or methodology used for valuing securities may not be indicative of the risks associated with investing in those securities. For more information on valuation inputs, and their aggregation into the levels used in the table below, please refer to note 4 to the financial statements. The following table sets forth by level, within the fair value hierarchy, the Fund's investments measured at fair value.
Total Level 1 Level 2 Level 3
Mutual fund - Small Cap Value $ 3,314,199 $ 3,314,199 $ — $ —__________ ___________ ___________ ____________________ ___________ ___________ __________
Investment transactions The aggregate cost of purchases of investment securities and proceeds from sales of investment securities (other than temporary cash investments) totaled $1,062,752 and $1,339,411, respectively, for the year ended December 31, 2015. Class-specific expenses Class-specific trustee fees for the year ended December 31, 2015 were as follows: Class R1 $ 6,334 Class R2 1,133 Class R3 2,794 Class R4 8,707 Class R5 2,313 Class R6 3,957 Class R7 361 Class R8 215 $ 25,814
599

THE COLLECTIVE INVESTMENT FUNDS OF FIRST MERCANTILE TRUST COMPANY FMT/American Beacon Small Cap Value Institutional Fund
Schedule of Participant Transactions December 31, 2015
The accompanying notes are an integral part of these financial statements.
Participant transactions by class for the year ended December 31, 2015 were as follows: Dollars Units Purchases Redemptions Net change Purchases Redemptions Net change Class R1 $ 624,935 $ (877,030) $ (252,095) 31,716 (45,183) (13,467)Class R2 7,743 (82,311) (74,568) 487 (5,180) (4,693)Class R3 110,678 (60,362) 50,316 7,076 (3,938) 3,138Class R4 142,155 (258,923) (116,768) 8,658 (15,870) (7,212)Class R5 14,237 (62,503) (48,266) 815 (3,678) (2,863)Class R6 81,947 (69,346) 12,601 5,113 (4,376) 737Class R7 1,079 (182) 897 65 (11) 54Class R8 6,723 (16,705) (9,982) 403 (1,041) (638) $ 989,497 $ (1,427,362) $ (437,865) 54,333 (79,277) (24,944)
600

THE COLLECTIVE INVESTMENT FUNDS OF FIRST MERCANTILE TRUST COMPANY FMT/American Beacon Small Cap Value Institutional Fund
Financial Highlights December 31, 2015
The accompanying notes are an integral part of these financial statements.
Change in Net Asset Value Resulting from Operations Ratios (to average net
assets)
NAV per Unit, Beginning of
Period
Net Investment
Income (Loss)(a)
Net Realized and Unrealized
Gain (Loss) from
Investments(a)
Total from Investment Activities
NAV per Unit, End of
Period Total
Return Expenses
Net Investment
Income (Loss)
Class R1 $ 19.4367 $ 0.7997 $ (1.8482) $ (1.0485) $ 18.3882 (5.39)% (0.42)% 4.12%Class R2 15.7178 0.5046 (1.3853) (0.8807) 14.8371 (5.60)% (0.64)% 3.22%Class R3 15.5737 0.7177 (1.6155) (0.8978) 14.6759 (5.76)% (0.81)% 4.63%Class R4 16.6796 0.6780 (1.6664) (0.9884) 15.6912 (5.93)% (0.98)% 4.09%Class R5 17.5489 0.7331 (1.8012) (1.0681) 16.4808 (6.09)% (1.15)% 4.21%Class R6 16.2505 0.6920 (1.7071) (1.0151) 15.2354 (6.25)% (1.32)% 4.30%Class R7 16.4381 0.6449 (1.6981) (1.0532) 15.3849 (6.41)% (1.49)% 3.96%Class R8 16.4124 0.3040 (1.3817) (1.0777) 15.3347 (6.57)% (1.65)% 1.87%
(a) Per unit amounts are based on average daily units outstanding.
601

FMT/American Century Mid Cap Value Fund

THE COLLECTIVE INVESTMENT FUNDS OF FIRST MERCANTILE TRUST COMPANY FMT/American Century Mid Cap Value Fund
Statement of Assets and Liabilities December 31, 2015
The accompanying notes are an integral part of these financial statements.
Assets Investments in securities, at fair value $ 3,586,334 Liabilities Trustee fees 60 Net assets $ 3,586,274 Components of net assets
Units of
Participation NAV
per Unit Net
Assets Class R4 90 $ 9.7817 $ 878Class R5 3,075 $ 15.5452 47,798Class R8 1,149 $ 9.7259 11,174Class LifeStyle 3,526,424
$ 3,586,274
602

THE COLLECTIVE INVESTMENT FUNDS OF FIRST MERCANTILE TRUST COMPANY FMT/American Century Mid Cap Value Fund
Statement of Operations For the Year Ended December 31, 2015
The accompanying notes are an integral part of these financial statements.
Investment income
Dividends $ 367,582 Expenses
Trustee fees 23,370Custody fees 1,390Audit fees 1,253
26,013 Net investment income 341,569 Net realized loss from investments sold
Proceeds from sales of investments 907,956Cost of investments sold 947,315
Net realized loss from investments sold (39,359) Change in net unrealized appreciation (depreciation) on investments (390,197) Net realized and unrealized loss on investments (429,556) Other operating credits (charges) 14,112 Net decrease in net assets resulting from operations $ (73,875)
603

THE COLLECTIVE INVESTMENT FUNDS OF FIRST MERCANTILE TRUST COMPANY FMT/American Century Mid Cap Value Fund
Statement of Changes in Net Assets For the Year Ended December 31, 2015
The accompanying notes are an integral part of these financial statements.
Operations
Net investment income $ 341,569
Net realized loss from investments sold (39,359)
Change in net unrealized appreciation (depreciation) on investments (390,197)
Other operating credits (charges) 14,112
Net decrease in net assets resulting from operations (73,875) Participant transactions
Proceeds from units purchased 1,071,270Less payments for units redeemed 1,488,130
Decrease in net assets from participant transactions (416,860)
Total decrease in net assets (490,735) Net assets at beginning of year 4,077,009 Net assets at end of year $ 3,586,274
604
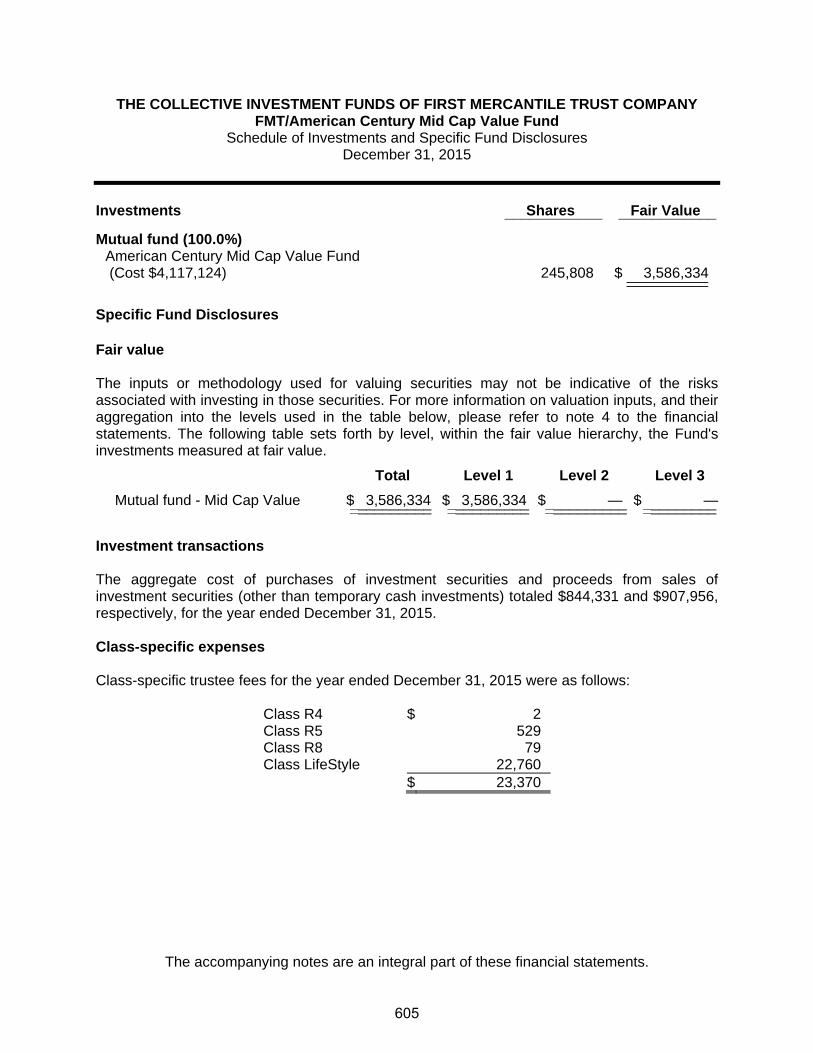
THE COLLECTIVE INVESTMENT FUNDS OF FIRST MERCANTILE TRUST COMPANY FMT/American Century Mid Cap Value Fund
Schedule of Investments and Specific Fund Disclosures December 31, 2015
The accompanying notes are an integral part of these financial statements.
Investments Shares Fair Value ____________ ____________
Mutual fund (100.0%)
American Century Mid Cap Value Fund (Cost $4,117,124) 245,808 $ 3,586,334 ____________________
Specific Fund Disclosures Fair value The inputs or methodology used for valuing securities may not be indicative of the risks associated with investing in those securities. For more information on valuation inputs, and their aggregation into the levels used in the table below, please refer to note 4 to the financial statements. The following table sets forth by level, within the fair value hierarchy, the Fund's investments measured at fair value.
Total Level 1 Level 2 Level 3
Mutual fund - Mid Cap Value $ 3,586,334 $ 3,586,334 $ — $ —__________ __________ __________ ___________________ __________ __________ _________ Investment transactions The aggregate cost of purchases of investment securities and proceeds from sales of investment securities (other than temporary cash investments) totaled $844,331 and $907,956, respectively, for the year ended December 31, 2015. Class-specific expenses Class-specific trustee fees for the year ended December 31, 2015 were as follows: Class R4 $ 2 Class R5 529 Class R8 79 Class LifeStyle 22,760 $ 23,370
605

THE COLLECTIVE INVESTMENT FUNDS OF FIRST MERCANTILE TRUST COMPANY FMT/American Century Mid Cap Value Fund
Schedule of Participant Transactions December 31, 2015
The accompanying notes are an integral part of these financial statements.
Participant transactions by class for the year ended December 31, 2015 were as follows: Dollars Units Purchases Redemptions Net change Purchases Redemptions Net change Class R1 $ — $ (513) $ (513) (46) (46)Class R4 879 — 879 90 — 90Class R5 3,886 (12,328) (8,442) 246 (772) (526)Class R8 11,458 — 11,458 1,149 — 1,149Class LifeStyle 1,055,047 (1,475,289) (420,242) — — — $ 1,071,270 $ (1,488,130) $ (416,860) 1,485 (818) 667
606
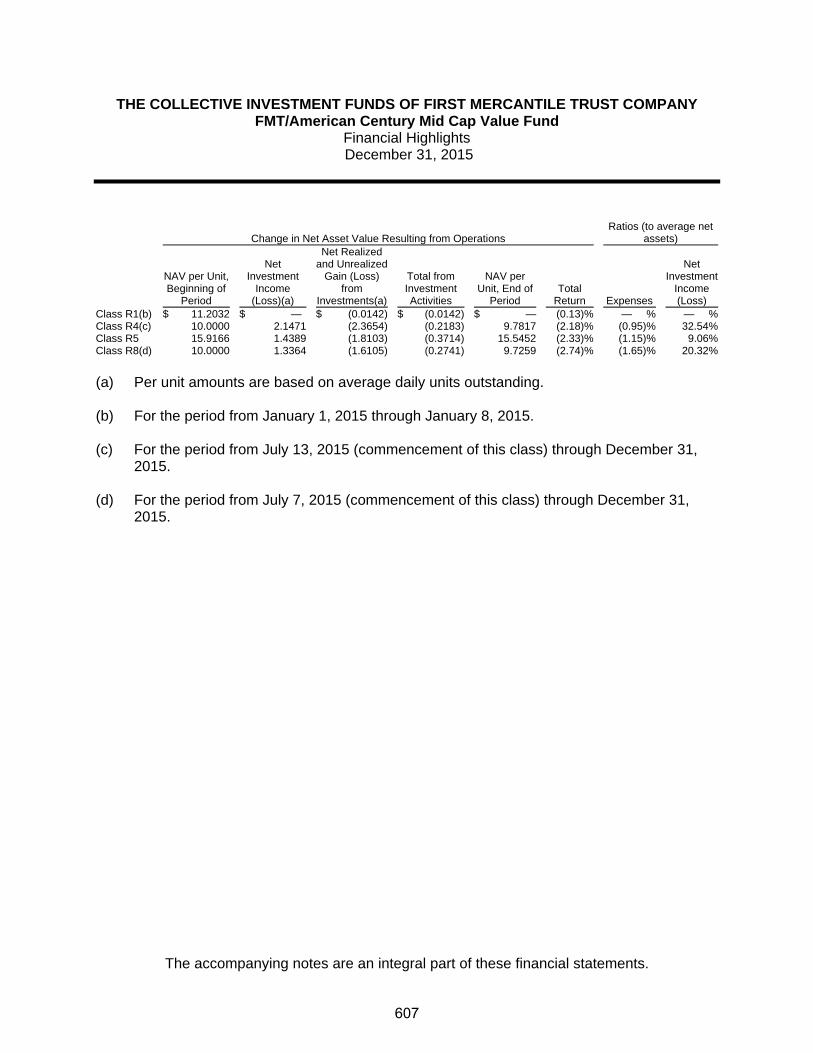
THE COLLECTIVE INVESTMENT FUNDS OF FIRST MERCANTILE TRUST COMPANY FMT/American Century Mid Cap Value Fund
Financial Highlights December 31, 2015
The accompanying notes are an integral part of these financial statements.
Change in Net Asset Value Resulting from Operations Ratios (to average net
assets)
NAV per Unit, Beginning of
Period
Net Investment
Income (Loss)(a)
Net Realized and Unrealized
Gain (Loss) from
Investments(a)
Total from Investment Activities
NAV per Unit, End of
Period Total
Return Expenses
Net Investment
Income (Loss)
Class R1(b) $ 11.2032 $ — $ (0.0142) $ (0.0142) $ — (0.13)% — % — %Class R4(c) 10.0000 2.1471 (2.3654) (0.2183) 9.7817 (2.18)% (0.95)% 32.54%Class R5 15.9166 1.4389 (1.8103) (0.3714) 15.5452 (2.33)% (1.15)% 9.06%Class R8(d) 10.0000 1.3364 (1.6105) (0.2741) 9.7259 (2.74)% (1.65)% 20.32%
(a) Per unit amounts are based on average daily units outstanding.
(b) For the period from January 1, 2015 through January 8, 2015.
(c) For the period from July 13, 2015 (commencement of this class) through December 31,
2015.
(d) For the period from July 7, 2015 (commencement of this class) through December 31, 2015.
607
FMT/American Funds Amcap Fund

THE COLLECTIVE INVESTMENT FUNDS OF FIRST MERCANTILE TRUST COMPANY FMT/American Funds Amcap Fund
Statement of Assets and Liabilities December 31, 2015
The accompanying notes are an integral part of these financial statements.
Assets Investments in securities, at fair value $ 13,842,118 Liabilities Trustee fees 5,566 Net assets $ 13,836,552 Components of net assets
Units of
Participation NAV
per Unit Net
Assets Class R1 612,154 $ 17.1873 $ 10,521,247Class R2 79,591 $ 17.5237 1,394,723Class R3 11,000 $ 17.2417 189,660Class R4 37,815 $ 17.5194 662,491Class R5 45,634 $ 17.4004 794,055Class R6 10,753 $ 16.2121 174,326Class R8 6,212 $ 16.1061 100,050
$ 13,836,552
608

THE COLLECTIVE INVESTMENT FUNDS OF FIRST MERCANTILE TRUST COMPANY FMT/American Funds Amcap Fund
Statement of Operations For the Year Ended December 31, 2015
The accompanying notes are an integral part of these financial statements.
Investment income
Dividends $ 1,148,709 Expenses
Trustee fees 66,787Custody fees 4,622Audit fees 1,200
72,609 Net investment income 1,076,100 Net realized gain from investments sold
Proceeds from sales of investments 2,254,329Cost of investments sold 1,878,345
Net realized gain from investments sold 375,984 Change in net unrealized appreciation (depreciation) on investments (1,411,400) Net realized and unrealized loss on investments (1,035,416) Net increase in net assets resulting from operations $ 40,684
609

THE COLLECTIVE INVESTMENT FUNDS OF FIRST MERCANTILE TRUST COMPANY FMT/American Funds Amcap Fund Statement of Changes in Net Assets
For the Year Ended December 31, 2015
The accompanying notes are an integral part of these financial statements.
Operations
Net investment income $ 1,076,100
Net realized gain from investments sold 375,984
Change in net unrealized appreciation (depreciation) on investments (1,411,400)
Net increase in net assets resulting from operations 40,684 Participant transactions
Proceeds from units purchased 5,874,138Less payments for units redeemed 4,761,051
Increase in net assets from participant transactions 1,113,087
Total increase in net assets 1,153,771 Net assets at beginning of year 12,682,781 Net assets at end of year $ 13,836,552
610
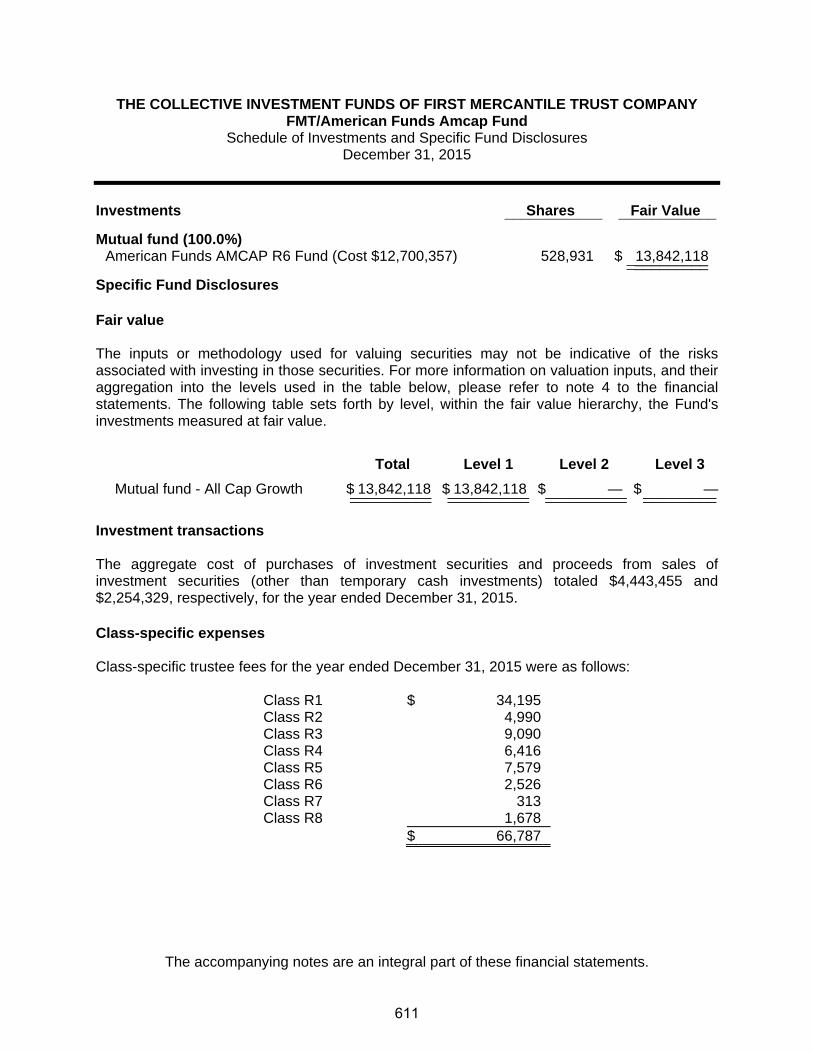
THE COLLECTIVE INVESTMENT FUNDS OF FIRST MERCANTILE TRUST COMPANY FMT/American Funds Amcap Fund
Schedule of Investments and Specific Fund Disclosures December 31, 2015
The accompanying notes are an integral part of these financial statements.
Investments Shares Fair Value ____________ ____________
Mutual fund (100.0%) American Funds AMCAP R6 Fund (Cost $12,700,357) 528,931 $ 13,842,118 ____________________ Specific Fund Disclosures Fair value The inputs or methodology used for valuing securities may not be indicative of the risks associated with investing in those securities. For more information on valuation inputs, and their aggregation into the levels used in the table below, please refer to note 4 to the financial statements. The following table sets forth by level, within the fair value hierarchy, the Fund's investments measured at fair value.
Total Level 1 Level 2 Level 3
Mutual fund - All Cap Growth $ 13,842,118 $ 13,842,118 $ — $ —__________ __________ __________ ___________________ __________ __________ _________ Investment transactions The aggregate cost of purchases of investment securities and proceeds from sales of investment securities (other than temporary cash investments) totaled $4,443,455 and $2,254,329, respectively, for the year ended December 31, 2015. Class-specific expenses Class-specific trustee fees for the year ended December 31, 2015 were as follows: Class R1 $ 34,195 Class R2 4,990 Class R3 9,090 Class R4 6,416 Class R5 7,579 Class R6 2,526 Class R7 313 Class R8 1,678 $ 66,787
611

THE COLLECTIVE INVESTMENT FUNDS OF FIRST MERCANTILE TRUST COMPANY FMT/American Funds Amcap Fund Schedule of Participant Transactions
December 31, 2015
The accompanying notes are an integral part of these financial statements.
Participant transactions by class for the year ended December 31, 2015 were as follows: Dollars Units Purchases Redemptions Net change Purchases Redemptions Net change Class R1 $ 3,844,330 $ (1,782,400) $ 2,061,930 219,071 (102,563) 116,508Class R2 1,324,530 (118,116) 1,206,414 72,443 (6,621) 65,822Class R3 277,586 (2,410,285) (2,132,699) 15,915 (134,875) (118,960)Class R4 154,405 (134,914) 19,491 8,842 (7,559) 1,283Class R5 240,349 (224,761) 15,588 13,949 (12,985) 964Class R6 19,822 (44,290) (24,468) 1,185 (2,713) (1,528)Class R7 3,857 (35,753) (31,896) 368 (3,492) (3,124)Class R8 9,259 (10,532) (1,273) 570 (662) (92) $ 5,874,138 $ (4,761,051) $ 1,113,087 332,343 (271,470) 60,873
612
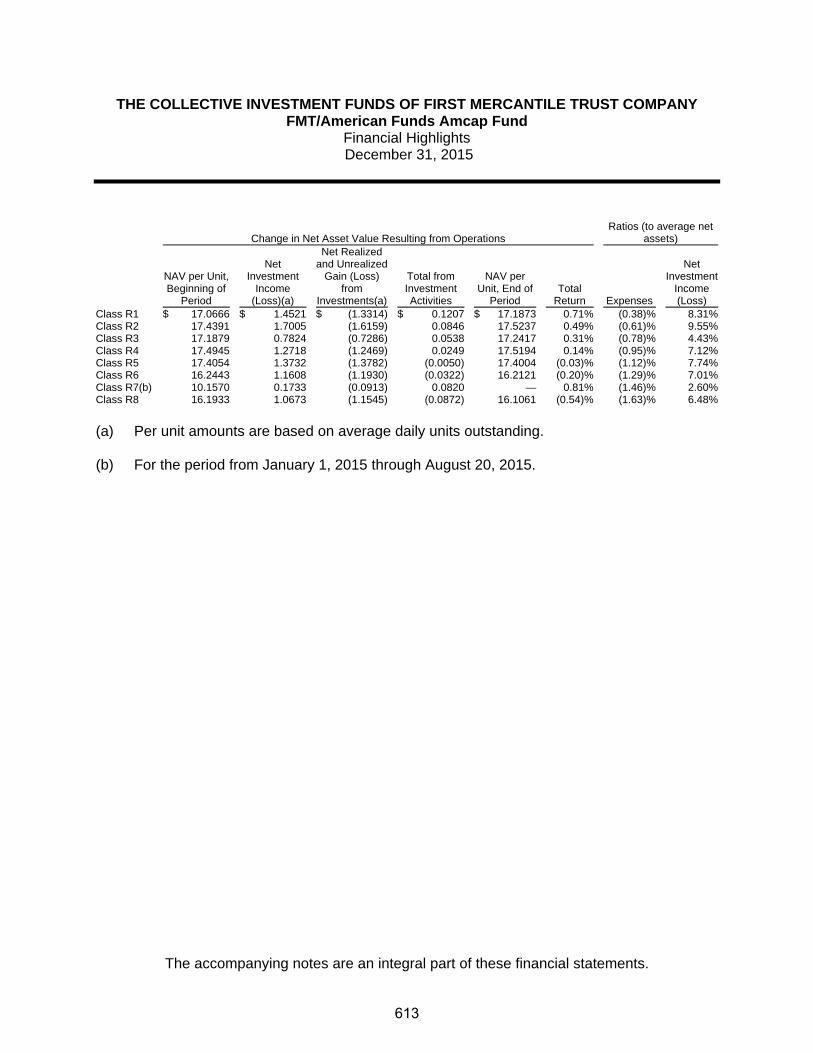
THE COLLECTIVE INVESTMENT FUNDS OF FIRST MERCANTILE TRUST COMPANY FMT/American Funds Amcap Fund
Financial Highlights December 31, 2015
The accompanying notes are an integral part of these financial statements.
Change in Net Asset Value Resulting from Operations Ratios (to average net
assets)
NAV per Unit, Beginning of
Period
Net Investment
Income (Loss)(a)
Net Realized and Unrealized
Gain (Loss) from
Investments(a)
Total from Investment Activities
NAV per Unit, End of
Period Total
Return Expenses
Net Investment
Income (Loss)
Class R1 $ 17.0666 $ 1.4521 $ (1.3314) $ 0.1207 $ 17.1873 0.71% (0.38)% 8.31%Class R2 17.4391 1.7005 (1.6159) 0.0846 17.5237 0.49% (0.61)% 9.55%Class R3 17.1879 0.7824 (0.7286) 0.0538 17.2417 0.31% (0.78)% 4.43%Class R4 17.4945 1.2718 (1.2469) 0.0249 17.5194 0.14% (0.95)% 7.12%Class R5 17.4054 1.3732 (1.3782) (0.0050) 17.4004 (0.03)% (1.12)% 7.74%Class R6 16.2443 1.1608 (1.1930) (0.0322) 16.2121 (0.20)% (1.29)% 7.01%Class R7(b) 10.1570 0.1733 (0.0913) 0.0820 — 0.81% (1.46)% 2.60%Class R8 16.1933 1.0673 (1.1545) (0.0872) 16.1061 (0.54)% (1.63)% 6.48%
(a) Per unit amounts are based on average daily units outstanding.
(b) For the period from January 1, 2015 through August 20, 2015.
613
FMT/American Funds Europacific Fund

THE COLLECTIVE INVESTMENT FUNDS OF FIRST MERCANTILE TRUST COMPANY FMT/American Funds Europacific Fund
Statement of Assets and Liabilities December 31, 2015
The accompanying notes are an integral part of these financial statements.
Assets Investments in securities, at fair value $ 51,470,716 Liabilities Trustee fees 26,562 Net assets $ 51,444,154 Components of net assets
Units of
Participation NAV
per Unit Net
Assets Class R1 1,112,814 $ 21.2591 $ 23,657,468Class R2 604,212 $ 14.0420 8,484,327Class R3 557,596 $ 13.4617 7,506,184Class R4 482,691 $ 13.1340 6,339,669Class R5 211,134 $ 13.7572 2,904,616Class R6 48,651 $ 13.4222 652,997Class R7 80,800 $ 13.4124 1,083,719Class R8 60,483 $ 13.4777 815,174
$ 51,444,154
614

THE COLLECTIVE INVESTMENT FUNDS OF FIRST MERCANTILE TRUST COMPANY FMT/American Funds Europacific Fund
Statement of Operations For the Year Ended December 31, 2015
The accompanying notes are an integral part of these financial statements.
Investment income
Dividends $ 1,700,813 Expenses
Trustee fees 324,040Custody fees 17,918Audit fees 1,200
343,158 Net investment income 1,357,655 Net realized gain from investments sold
Proceeds from sales of investments 7,926,744Cost of investments sold 6,676,049
Net realized gain from investments sold 1,250,695 Change in net unrealized appreciation (depreciation) on investments (3,350,079) Net realized and unrealized loss on investments (2,099,384) Net decrease in net assets resulting from operations $ (741,729)
615

THE COLLECTIVE INVESTMENT FUNDS OF FIRST MERCANTILE TRUST COMPANY FMT/American Funds Europacific Fund
Statement of Changes in Net Assets For the Year Ended December 31, 2015
The accompanying notes are an integral part of these financial statements.
Operations
Net investment income $ 1,357,655
Net realized gain from investments sold 1,250,695
Change in net unrealized appreciation (depreciation) on investments (3,350,079)
Net decrease in net assets resulting from operations (741,729) Participant transactions
Proceeds from units purchased 21,281,092Less payments for units redeemed 18,691,830
Increase in net assets from participant transactions 2,589,262
Total increase in net assets 1,847,533 Net assets at beginning of year 49,596,621 Net assets at end of year $ 51,444,154
616

THE COLLECTIVE INVESTMENT FUNDS OF FIRST MERCANTILE TRUST COMPANY FMT/American Funds Europacific Fund
Schedule of Investments and Specific Fund Disclosures December 31, 2015
The accompanying notes are an integral part of these financial statements.
Investments Shares Fair Value ____________ ____________
Mutual fund (100.1%)
American Funds EuroPacific Growth R6 Fund (Cost $47,423,823) 1,135,717 $ 51,470,716 ______________________
Specific Fund Disclosures Fair value The inputs or methodology used for valuing securities may not be indicative of the risks associated with investing in those securities. For more information on valuation inputs, and their aggregation into the levels used in the table below, please refer to note 4 to the financial statements. The following table sets forth by level, within the fair value hierarchy, the Fund's investments measured at fair value.
Total Level 1 Level 2 Level 3
Mutual fund - International Core Equity $ 51,470,716 $ 51,470,716 $ — $ —__________ ___________ ___________ ____________________ ___________ ___________ __________
Investment transactions The aggregate cost of purchases of investment securities and proceeds from sales of investment securities (other than temporary cash investments) totaled $11,873,918 and $7,926,744, respectively, for the year ended December 31, 2015. Class-specific expenses Class-specific trustee fees for the year ended December 31, 2015 were as follows: Class R1 $ 84,120 Class R2 44,197 Class R3 59,814 Class R4 54,739 Class R5 38,025 Class R6 7,972 Class R7 21,736 Class R8 13,437 $ 324,040
617
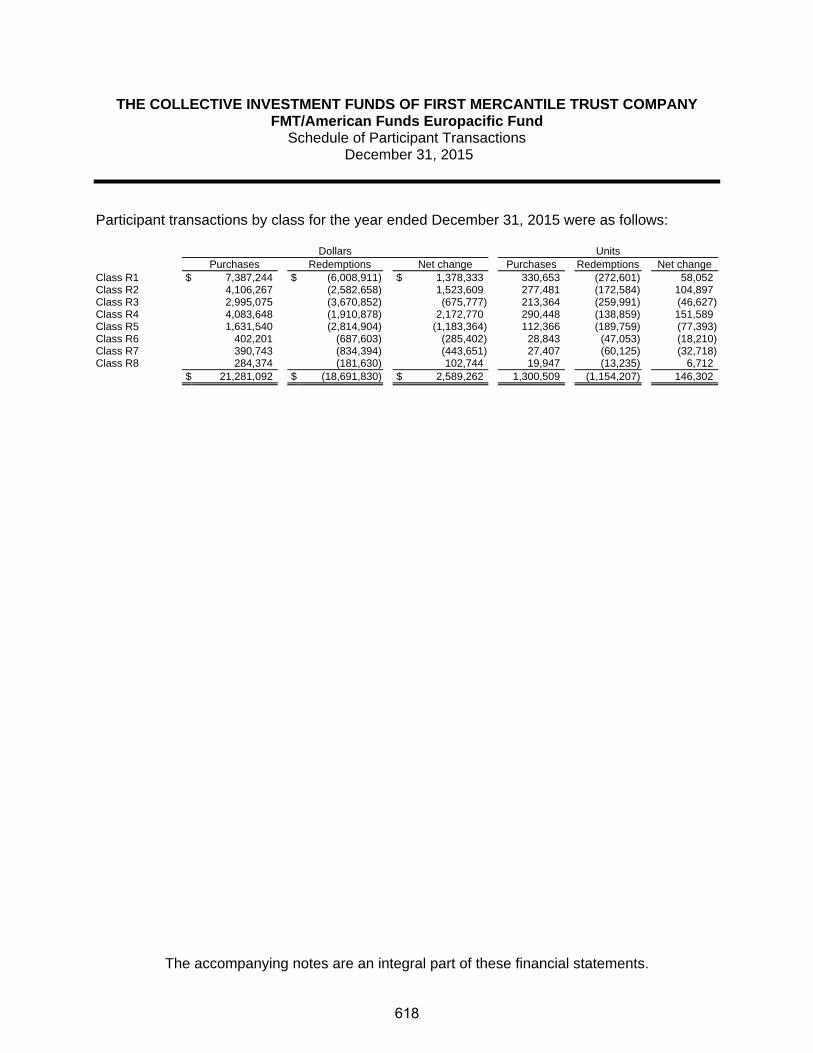
THE COLLECTIVE INVESTMENT FUNDS OF FIRST MERCANTILE TRUST COMPANY FMT/American Funds Europacific Fund
Schedule of Participant Transactions December 31, 2015
The accompanying notes are an integral part of these financial statements.
Participant transactions by class for the year ended December 31, 2015 were as follows: Dollars Units Purchases Redemptions Net change Purchases Redemptions Net change Class R1 $ 7,387,244 $ (6,008,911) $ 1,378,333 330,653 (272,601) 58,052Class R2 4,106,267 (2,582,658) 1,523,609 277,481 (172,584) 104,897Class R3 2,995,075 (3,670,852) (675,777) 213,364 (259,991) (46,627)Class R4 4,083,648 (1,910,878) 2,172,770 290,448 (138,859) 151,589Class R5 1,631,540 (2,814,904) (1,183,364) 112,366 (189,759) (77,393)Class R6 402,201 (687,603) (285,402) 28,843 (47,053) (18,210)Class R7 390,743 (834,394) (443,651) 27,407 (60,125) (32,718)Class R8 284,374 (181,630) 102,744 19,947 (13,235) 6,712 $ 21,281,092 $ (18,691,830) $ 2,589,262 1,300,509 (1,154,207) 146,302
618

THE COLLECTIVE INVESTMENT FUNDS OF FIRST MERCANTILE TRUST COMPANY FMT/American Funds Europacific Fund
Financial Highlights December 31, 2015
The accompanying notes are an integral part of these financial statements.
Change in Net Asset Value Resulting from Operations Ratios (to average net
assets)
NAV per Unit, Beginning of
Period
Net Investment
Income (Loss)(a)
Net Realized and Unrealized
Gain (Loss) from
Investments(a)
Total from Investment Activities
NAV per Unit, End of
Period Total
Return Expenses
Net Investment
Income (Loss)
Class R1 $ 21.4453 $ 0.6436 $ (0.8298) $ (0.1862) $ 21.2591 (0.87)% (0.39)% 2.89%Class R2 14.1963 0.4266 (0.5809) (0.1543) 14.0420 (1.09)% (0.61)% 2.89%Class R3 13.6328 0.3297 (0.5008) (0.1711) 13.4617 (1.26)% (0.78)% 2.33%Class R4 13.3237 0.3519 (0.5416) (0.1897) 13.1340 (1.42)% (0.95)% 2.55%Class R5 13.9798 0.2392 (0.4618) (0.2226) 13.7572 (1.59)% (1.12)% 1.65%Class R6 13.6627 0.3000 (0.5405) (0.2405) 13.4222 (1.76)% (1.29)% 2.12%Class R7 13.6759 0.1231 (0.3866) (0.2635) 13.4124 (1.93)% (1.46)% 0.87%Class R8 13.7660 0.2236 (0.5119) (0.2883) 13.4777 (2.09)% (1.63)% 1.57%
(a) Per unit amounts are based on average daily units outstanding.
619

FMT/American Funds Growth Fund of America Fund
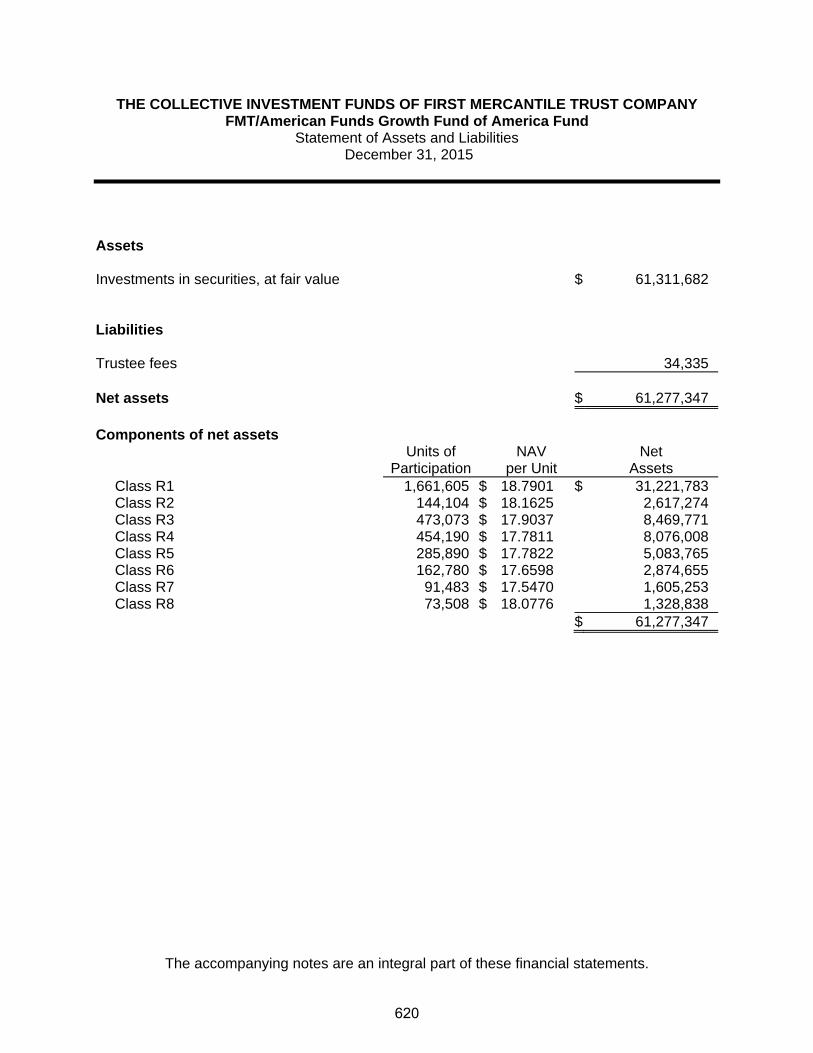
THE COLLECTIVE INVESTMENT FUNDS OF FIRST MERCANTILE TRUST COMPANY FMT/American Funds Growth Fund of America Fund
Statement of Assets and Liabilities December 31, 2015
The accompanying notes are an integral part of these financial statements.
Assets Investments in securities, at fair value $ 61,311,682 Liabilities Trustee fees 34,335 Net assets $ 61,277,347 Components of net assets
Units of
Participation NAV
per Unit Net
Assets Class R1 1,661,605 $ 18.7901 $ 31,221,783Class R2 144,104 $ 18.1625 2,617,274Class R3 473,073 $ 17.9037 8,469,771Class R4 454,190 $ 17.7811 8,076,008Class R5 285,890 $ 17.7822 5,083,765Class R6 162,780 $ 17.6598 2,874,655Class R7 91,483 $ 17.5470 1,605,253Class R8 73,508 $ 18.0776 1,328,838
$ 61,277,347
620

THE COLLECTIVE INVESTMENT FUNDS OF FIRST MERCANTILE TRUST COMPANY FMT/American Funds Growth Fund of America Fund
Statement of Operations For the Year Ended December 31, 2015
The accompanying notes are an integral part of these financial statements.
Investment income
Dividends $ 5,257,237 Expenses
Trustee fees 447,450Custody fees 24,508Audit fees 1,200
473,158 Net investment income 4,784,079 Net realized gain from investments sold
Proceeds from sales of investments 21,880,340Cost of investments sold 15,945,525
Net realized gain from investments sold 5,934,815 Change in net unrealized appreciation (depreciation) on investments (7,203,045) Net realized and unrealized loss on investments (1,268,230) Net increase in net assets resulting from operations $ 3,515,849
621

THE COLLECTIVE INVESTMENT FUNDS OF FIRST MERCANTILE TRUST COMPANY FMT/American Funds Growth Fund of America Fund
Statement of Changes in Net Assets For the Year Ended December 31, 2015
The accompanying notes are an integral part of these financial statements.
Operations
Net investment income $ 4,784,079
Net realized gain from investments sold 5,934,815
Change in net unrealized appreciation (depreciation) on investments (7,203,045)
Net increase in net assets resulting from operations 3,515,849 Participant transactions
Proceeds from units purchased 15,199,781Less payments for units redeemed 32,922,724
Decrease in net assets from participant transactions (17,722,943)
Total decrease in net assets (14,207,094) Net assets at beginning of year 75,484,441 Net assets at end of year $ 61,277,347
622
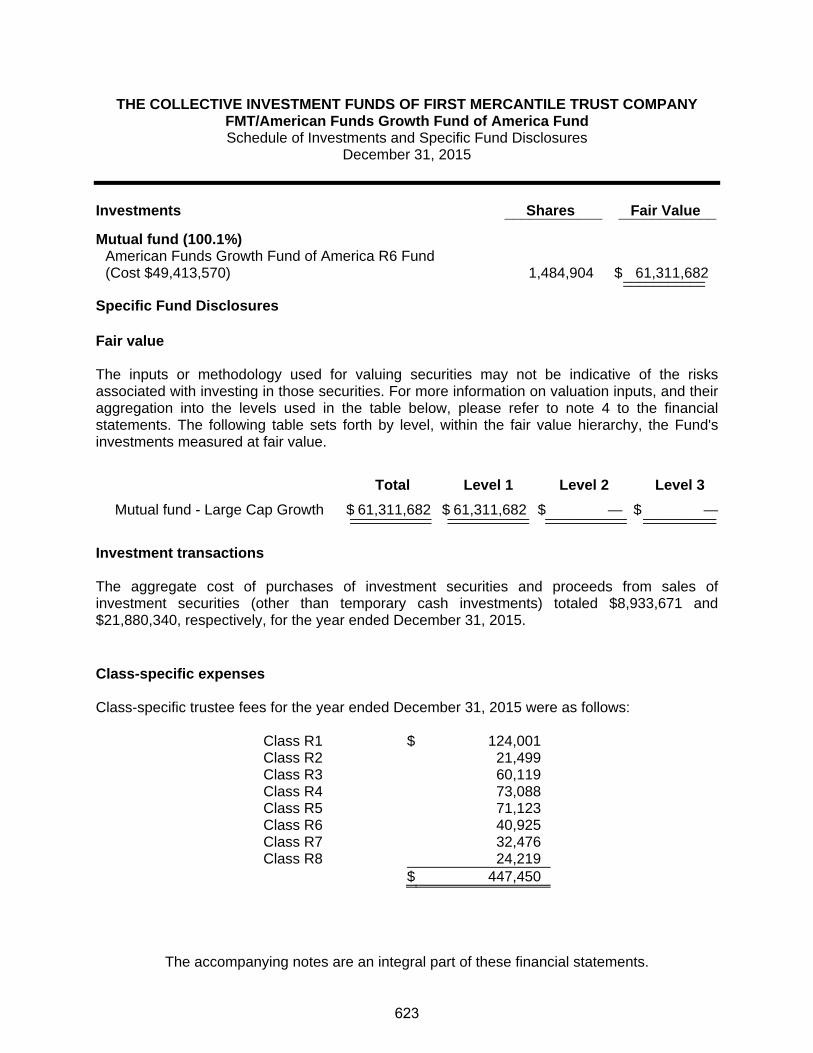
THE COLLECTIVE INVESTMENT FUNDS OF FIRST MERCANTILE TRUST COMPANY FMT/American Funds Growth Fund of America Fund Schedule of Investments and Specific Fund Disclosures
December 31, 2015
The accompanying notes are an integral part of these financial statements.
Investments Shares Fair Value ____________ ____________
Mutual fund (100.1%)
American Funds Growth Fund of America R6 Fund (Cost $49,413,570) 1,484,904 $ 61,311,682 ______________________
Specific Fund Disclosures Fair value The inputs or methodology used for valuing securities may not be indicative of the risks associated with investing in those securities. For more information on valuation inputs, and their aggregation into the levels used in the table below, please refer to note 4 to the financial statements. The following table sets forth by level, within the fair value hierarchy, the Fund's investments measured at fair value.
Total Level 1 Level 2 Level 3
Mutual fund - Large Cap Growth $ 61,311,682 $ 61,311,682 $ — $ —__________ __________ __________ ___________________ __________ __________ _________ Investment transactions The aggregate cost of purchases of investment securities and proceeds from sales of investment securities (other than temporary cash investments) totaled $8,933,671 and $21,880,340, respectively, for the year ended December 31, 2015. Class-specific expenses Class-specific trustee fees for the year ended December 31, 2015 were as follows: Class R1 $ 124,001 Class R2 21,499 Class R3 60,119 Class R4 73,088 Class R5 71,123 Class R6 40,925 Class R7 32,476 Class R8 24,219 $ 447,450
623

THE COLLECTIVE INVESTMENT FUNDS OF FIRST MERCANTILE TRUST COMPANY FMT/American Funds Growth Fund of America Fund
Schedule of Participant Transactions December 31, 2015
The accompanying notes are an integral part of these financial statements.
Participant transactions by class for the year ended December 31, 2015 were as follows: Dollars Units Purchases Redemptions Net change Purchases Redemptions Net change Class R1 $ 4,980,059 $ (15,148,476) $ (10,168,417) 267,880 (816,635) (548,755)Class R2 1,232,816 (2,532,808) (1,299,992) 68,992 (139,002) (70,010)Class R3 3,074,166 (4,254,758) (1,180,592) 171,034 (240,299) (69,265)Class R4 4,099,845 (2,975,254) 1,124,591 230,582 (167,749) 62,833Class R5 807,214 (5,113,212) (4,305,998) 45,804 (288,209) (242,405)Class R6 584,506 (1,078,545) (494,039) 33,727 (61,061) (27,334)Class R7 172,727 (1,340,901) (1,168,174) 9,821 (78,978) (69,157)Class R8 248,448 (478,770) (230,322) 13,864 (27,617) (13,753) $ 15,199,781 $ (32,922,724) $ (17,722,943) 841,704 (1,819,550) (977,846)
624

THE COLLECTIVE INVESTMENT FUNDS OF FIRST MERCANTILE TRUST COMPANY FMT/American Funds Growth Fund of America Fund
Financial Highlights December 31, 2015
The accompanying notes are an integral part of these financial statements.
Change in Net Asset Value Resulting from Operations Ratios (to average net
assets)
NAV per Unit, Beginning of
Period
Net Investment
Income (Loss)(a)
Net Realized and Unrealized
Gain (Loss) from
Investments(a)
Total from Investment Activities
NAV per Unit, End of
Period Total
Return Expenses
Net Investment
Income (Loss)
Class R1 $ 17.8470 $ 1.3133 $ (0.3702) $ 0.9431 $ 18.7901 5.28% (0.39)% 7.07%Class R2 17.2889 1.2307 (0.3571) 0.8736 18.1625 5.05% (0.61)% 6.84%Class R3 17.0717 1.4442 (0.6122) 0.8320 17.9037 4.87% (0.78)% 8.15%Class R4 16.9837 1.3262 (0.5288) 0.7974 17.7811 4.70% (0.95)% 7.51%Class R5 17.0137 0.9746 (0.2061) 0.7685 17.7822 4.52% (1.12)% 5.53%Class R6 16.9253 1.0854 (0.3509) 0.7345 17.6598 4.34% (1.29)% 6.19%Class R7 16.8459 0.7769 (0.0758) 0.7011 17.5470 4.16% (1.46)% 4.45%Class R8 17.3849 1.0175 (0.3248) 0.6927 18.0776 3.98% (1.63)% 5.65%
(a) Per unit amounts are based on average daily units outstanding.
625
FMT/American Funds New Perspective Fund
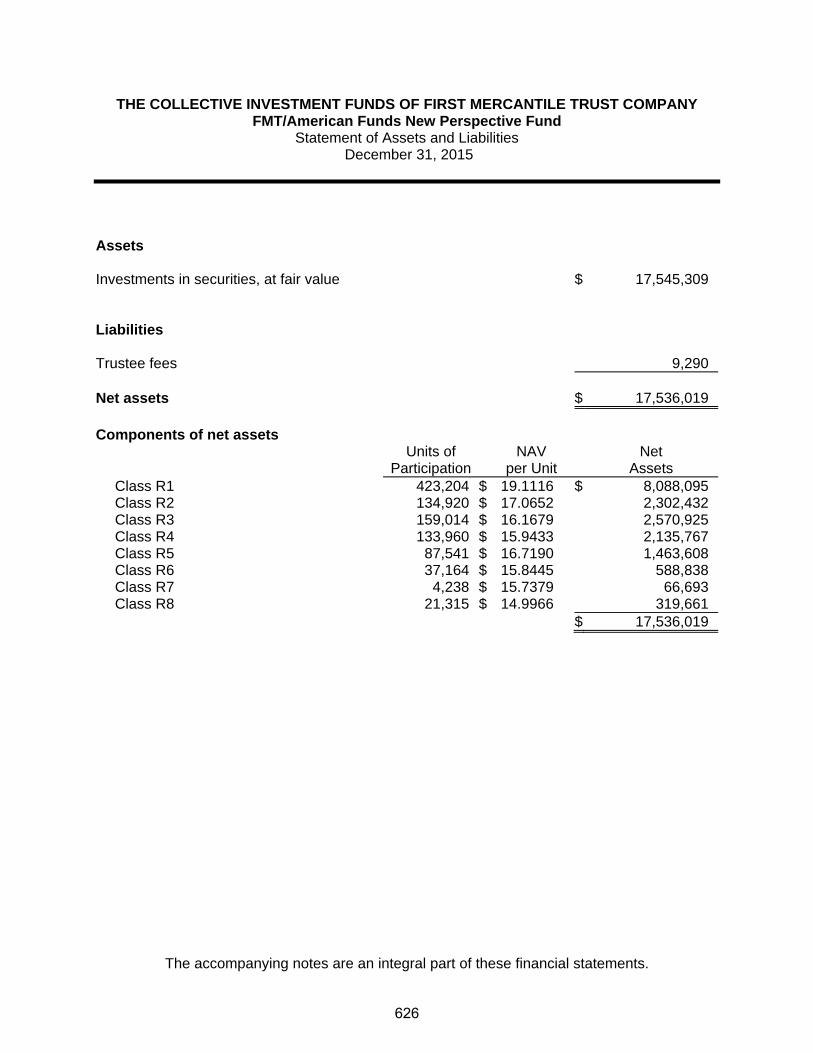
THE COLLECTIVE INVESTMENT FUNDS OF FIRST MERCANTILE TRUST COMPANY FMT/American Funds New Perspective Fund
Statement of Assets and Liabilities December 31, 2015
The accompanying notes are an integral part of these financial statements.
Assets Investments in securities, at fair value $ 17,545,309 Liabilities Trustee fees 9,290 Net assets $ 17,536,019 Components of net assets
Units of
Participation NAV
per Unit Net
Assets Class R1 423,204 $ 19.1116 $ 8,088,095Class R2 134,920 $ 17.0652 2,302,432Class R3 159,014 $ 16.1679 2,570,925Class R4 133,960 $ 15.9433 2,135,767Class R5 87,541 $ 16.7190 1,463,608Class R6 37,164 $ 15.8445 588,838Class R7 4,238 $ 15.7379 66,693Class R8 21,315 $ 14.9966 319,661
$ 17,536,019
626

THE COLLECTIVE INVESTMENT FUNDS OF FIRST MERCANTILE TRUST COMPANY FMT/American Funds New Perspective Fund
Statement of Operations For the Year Ended December 31, 2015
The accompanying notes are an integral part of these financial statements.
Investment income
Dividends $ 1,065,694 Expenses
Trustee fees 112,830Custody fees 6,507Audit fees 1,200
120,537 Net investment income 945,157 Net realized gain from investments sold
Proceeds from sales of investments 4,424,990Cost of investments sold 3,489,625
Net realized gain from investments sold 935,365 Change in net unrealized appreciation (depreciation) on investments (955,872) Net realized and unrealized loss on investments (20,507) Net increase in net assets resulting from operations $ 924,650
627

THE COLLECTIVE INVESTMENT FUNDS OF FIRST MERCANTILE TRUST COMPANY FMT/American Funds New Perspective Fund
Statement of Changes in Net Assets For the Year Ended December 31, 2015
The accompanying notes are an integral part of these financial statements.
Operations
Net investment income $ 945,157
Net realized gain from investments sold 935,365
Change in net unrealized appreciation (depreciation) on investments (955,872)
Net increase in net assets resulting from operations 924,650 Participant transactions
Proceeds from units purchased 5,713,251Less payments for units redeemed 7,839,014
Decrease in net assets from participant transactions (2,125,763)
Total decrease in net assets (1,201,113) Net assets at beginning of year 18,737,132 Net assets at end of year $ 17,536,019
628
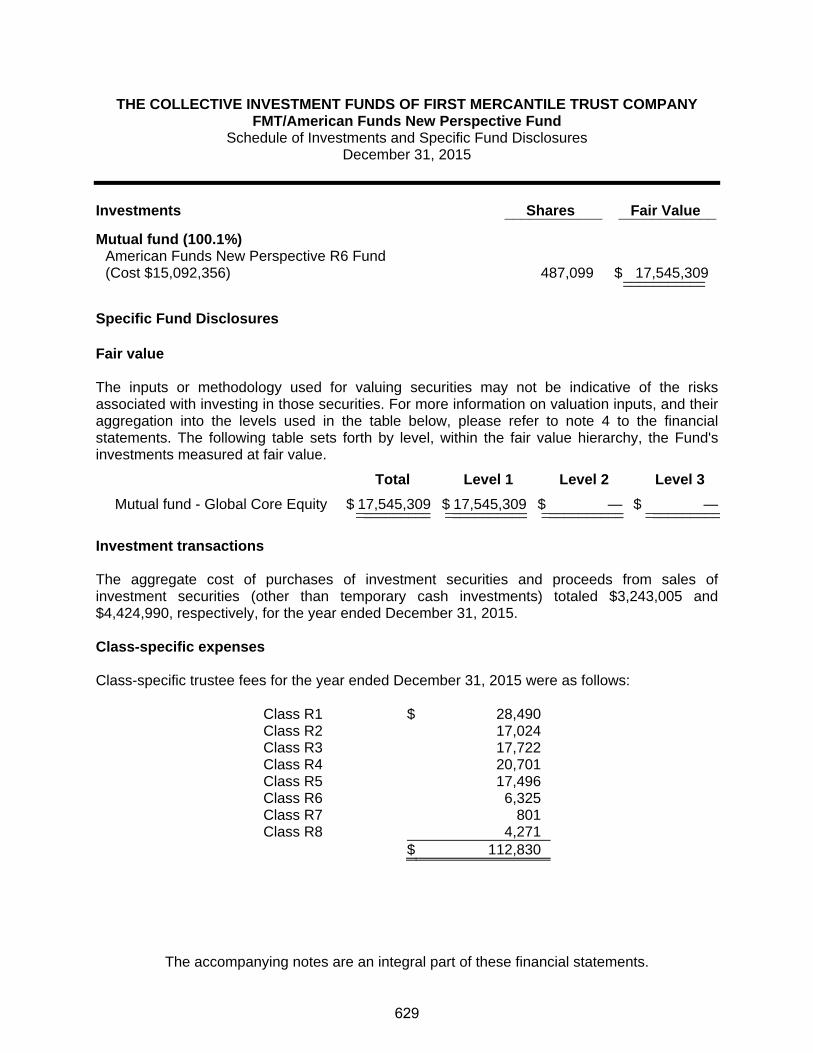
THE COLLECTIVE INVESTMENT FUNDS OF FIRST MERCANTILE TRUST COMPANY FMT/American Funds New Perspective Fund
Schedule of Investments and Specific Fund Disclosures December 31, 2015
The accompanying notes are an integral part of these financial statements.
Investments Shares Fair Value ____________ ____________
Mutual fund (100.1%)
American Funds New Perspective R6 Fund (Cost $15,092,356) 487,099 $ 17,545,309 ______________________
Specific Fund Disclosures Fair value The inputs or methodology used for valuing securities may not be indicative of the risks associated with investing in those securities. For more information on valuation inputs, and their aggregation into the levels used in the table below, please refer to note 4 to the financial statements. The following table sets forth by level, within the fair value hierarchy, the Fund's investments measured at fair value.
Total Level 1 Level 2 Level 3
Mutual fund - Global Core Equity $ 17,545,309 $ 17,545,309 $ — $ —__________ ___________ ___________ ____________________ ___________ ___________ __________ Investment transactions The aggregate cost of purchases of investment securities and proceeds from sales of investment securities (other than temporary cash investments) totaled $3,243,005 and $4,424,990, respectively, for the year ended December 31, 2015. Class-specific expenses Class-specific trustee fees for the year ended December 31, 2015 were as follows: Class R1 $ 28,490 Class R2 17,024 Class R3 17,722 Class R4 20,701 Class R5 17,496 Class R6 6,325 Class R7 801 Class R8 4,271 $ 112,830
629

THE COLLECTIVE INVESTMENT FUNDS OF FIRST MERCANTILE TRUST COMPANY FMT/American Funds New Perspective Fund
Schedule of Participant Transactions December 31, 2015
The accompanying notes are an integral part of these financial statements.
Participant transactions by class for the year ended December 31, 2015 were as follows: Dollars Units Purchases Redemptions Net change Purchases Redemptions Net change Class R1 $ 2,019,688 $ (2,630,794) $ (611,106) 105,837 (139,319) (33,482)Class R2 711,973 (1,939,104) (1,227,131) 41,864 (112,636) (70,772)Class R3 1,295,990 (859,731) 436,259 78,463 (53,181) 25,282Class R4 1,047,333 (1,442,466) (395,133) 66,072 (88,527) (22,455)Class R5 381,760 (932,610) (550,850) 22,917 (56,056) (33,139)Class R6 152,261 (26,718) 125,543 9,836 (1,702) 8,134Class R7 17,685 (951) 16,734 1,104 (59) 1,045Class R8 86,561 (6,640) 79,921 5,746 (439) 5,307 $ 5,713,251 $ (7,839,014) $ (2,125,763) 331,839 (451,919) (120,080)
630

THE COLLECTIVE INVESTMENT FUNDS OF FIRST MERCANTILE TRUST COMPANY FMT/American Funds New Perspective Fund
Financial Highlights December 31, 2015
The accompanying notes are an integral part of these financial statements.
Change in Net Asset Value Resulting from Operations Ratios (to average net
assets)
NAV per Unit, Beginning of
Period
Net Investment
Income (Loss)(a)
Net Realized and Unrealized
Gain (Loss) from
Investments(a)
Total from Investment Activities
NAV per Unit, End of
Period Total
Return Expenses
Net Investment
Income (Loss)
Class R1 $ 18.1638 $ 1.0729 $ (0.1251) $ 0.9478 $ 19.1116 5.22% (0.39)% 5.63%Class R2 16.2547 0.7022 0.1083 0.8105 17.0652 4.99% (0.61)% 4.12%Class R3 15.4263 0.9254 (0.1838) 0.7416 16.1679 4.81% (0.78)% 5.73%Class R4 15.2379 0.7555 (0.0501) 0.7054 15.9433 4.63% (0.95)% 4.74%Class R5 16.0065 0.7289 (0.0164) 0.7125 16.7190 4.45% (1.12)% 4.36%Class R6 15.1951 0.9215 (0.2721) 0.6494 15.8445 4.27% (1.29)% 5.81%Class R7 15.1185 0.8995 (0.2801) 0.6194 15.7379 4.10% (1.46)% 5.71%Class R8 14.4311 0.8416 (0.2761) 0.5655 14.9966 3.92% (1.63)% 5.60%
(a) Per unit amounts are based on average daily units outstanding.
631

FMT/American Funds Small Cap World Fund

THE COLLECTIVE INVESTMENT FUNDS OF FIRST MERCANTILE TRUST COMPANY FMT/American Funds Small Cap World Fund
Statement of Assets and Liabilities December 31, 2015
The accompanying notes are an integral part of these financial statements.
Assets Investments in securities, at fair value $ 4,845,614 Liabilities Trustee fees 2,469 Net assets $ 4,843,145 Components of net assets
Units of
Participation NAV
per Unit Net
Assets Class R1 234,294 $ 14.1257 $ 3,309,564Class R2 1,499 $ 15.9325 23,883Class R3 1,318 $ 16.0472 21,146Class R4 23,763 $ 16.1702 384,259Class R5 35,464 $ 15.1059 535,717Class R6 10,352 $ 15.6602 162,111Class R7 23,473 $ 15.4814 363,400Class R8 2,787 $ 15.4533 43,065
$ 4,843,145
632

THE COLLECTIVE INVESTMENT FUNDS OF FIRST MERCANTILE TRUST COMPANY FMT/American Funds Small Cap World Fund
Statement of Operations For the Year Ended December 31, 2015
The accompanying notes are an integral part of these financial statements.
Investment income
Dividends $ 291,700 Expenses
Trustee fees 34,269Custody fees 1,971Audit fees 1,200
37,440 Net investment income 254,260 Net realized gain from investments sold
Proceeds from sales of investments 1,719,985Cost of investments sold 1,386,633
Net realized gain from investments sold 333,352 Change in net unrealized appreciation (depreciation) on investments (420,434) Net realized and unrealized loss on investments (87,082) Net increase in net assets resulting from operations $ 167,178
633

THE COLLECTIVE INVESTMENT FUNDS OF FIRST MERCANTILE TRUST COMPANY FMT/American Funds Small Cap World Fund
Statement of Changes in Net Assets For the Year Ended December 31, 2015
The accompanying notes are an integral part of these financial statements.
Operations
Net investment income $ 254,260
Net realized gain from investments sold 333,352
Change in net unrealized appreciation (depreciation) on investments (420,434)
Net increase in net assets resulting from operations 167,178 Participant transactions
Proceeds from units purchased 1,058,576Less payments for units redeemed 2,008,024
Decrease in net assets from participant transactions (949,448)
Total decrease in net assets (782,270) Net assets at beginning of year 5,625,415 Net assets at end of year $ 4,843,145
634

THE COLLECTIVE INVESTMENT FUNDS OF FIRST MERCANTILE TRUST COMPANY FMT/American Funds Small Cap World Fund
Schedule of Participant Transactions December 31, 2015
The accompanying notes are an integral part of these financial statements.
Investments Shares Fair Value ____________ ____________
Mutual fund (100.1%)
American Funds Small Cap World R6 Fund (Cost $4,391,397) 109,803 $ 4,845,614 ______________________
Specific Fund Disclosures Fair value The inputs or methodology used for valuing securities may not be indicative of the risks associated with investing in those securities. For more information on valuation inputs, and their aggregation into the levels used in the table below, please refer to note 4 to the financial statements. The following table sets forth by level, within the fair value hierarchy, the Fund's investments measured at fair value.
Total Level 1 Level 2 Level 3
Mutual fund - Global Core Equity $ 4,845,614 $ 4,845,614 $ — $ —__________ ___________ ___________ ____________________ ___________ ___________ __________ Investment transactions The aggregate cost of purchases of investment securities and proceeds from sales of investmentsecurities (other than temporary cash investments) totaled $1,024,200 and $1,719,985,respectively, for the year ended December 31, 2015. Class-specific expenses Class-specific trustee fees for the year ended December 31, 2015 were as follows: Class R1 $ 12,443 Class R2 137 Class R3 177 Class R4 7,840 Class R5 5,731 Class R6 1,988 Class R7 5,282 Class R8 671 $ 34,269
635

THE COLLECTIVE INVESTMENT FUNDS OF FIRST MERCANTILE TRUST COMPANY FMT/American Funds Small Cap World Fund
Schedule of Participant Transactions December 31, 2015
The accompanying notes are an integral part of these financial statements.
Participant transactions by class for the year ended December 31, 2015 were as follows: Dollars Units Purchases Redemptions Net change Purchases Redemptions Net change Class R1 $ 669,125 $ (937,536) $ (268,411) 45,939 (63,981) (18,042)Class R2 1,871 — 1,871 115 — 115Class R3 748 (3,126) (2,378) 46 (195) (149)Class R4 150,208 (914,756) (764,548) 8,842 (54,388) (45,546)Class R5 135,360 (93,240) 42,120 8,467 (5,824) 2,643Class R6 47,589 (19,309) 28,280 3,032 (1,157) 1,875Class R7 34,036 (36,139) (2,103) 2,119 (2,272) (153)Class R8 19,639 (3,918) 15,721 1,240 (251) 989 $ 1,058,576 $ (2,008,024) $ (949,448) 69,800 (128,068) (58,268)
636

THE COLLECTIVE INVESTMENT FUNDS OF FIRST MERCANTILE TRUST COMPANY FMT/American Funds Small Cap World Fund
Financial Highlights December 31, 2015
The accompanying notes are an integral part of these financial statements.
Change in Net Asset Value Resulting from Operations Ratios (to average net
assets)
NAV per Unit, Beginning of
Period
Net Investment
Income (Loss)(a)
Net Realized and Unrealized
Gain (Loss) from
Investments(a)
Total from Investment Activities
NAV per Unit, End of
Period Total
Return Expenses
Net Investment
Income (Loss)
Class R1 $ 13.7754 $ 0.7573 $ (0.4070) $ 0.3503 $ 14.1257 2.54% (0.41)% 5.20%Class R2 15.5717 0.8848 (0.5240) 0.3608 15.9325 2.32% (0.63)% 5.38%Class R3 15.7107 0.7497 (0.4132) 0.3365 16.0472 2.14% (0.79)% 4.52%Class R4 15.8582 0.2882 0.0238 0.3120 16.1702 1.97% (0.97)% 1.72%Class R5 14.8396 0.7734 (0.5071) 0.2663 15.1059 1.79% (1.14)% 4.95%Class R6 15.4104 0.7777 (0.5279) 0.2498 15.6602 1.62% (1.31)% 4.80%Class R7 15.2605 0.7080 (0.4871) 0.2209 15.4814 1.45% (1.48)% 4.42%Class R8 15.2588 0.6898 (0.4953) 0.1945 15.4533 1.27% (1.65)% 4.30%
(a) Per unit amounts are based on average daily units outstanding.
637
FMT/American Funds Washington Mutual Fund

THE COLLECTIVE INVESTMENT FUNDS OF FIRST MERCANTILE TRUST COMPANY FMT/American Funds Washington Mutual Fund
Statement of Assets and Liabilities December 31, 2015
The accompanying notes are an integral part of these financial statements.
Assets Investments in securities, at fair value $ 4,881,207 Liabilities Trustee fees 4,024 Net assets $ 4,877,183 Components of net assets
Units of
Participation NAV
per Unit Net
Assets Class R1 204,147 $ 15.9368 $ 3,253,458Class R2 12,313 $ 16.0365 197,451Class R3 38,162 $ 15.9726 609,546Class R4 23,829 $ 15.8195 376,970Class R5 19,923 $ 15.7127 313,050Class R6 3,767 $ 16.2363 61,164Class R7 1,824 $ 15.2180 27,759Class R8 2,491 $ 15.1691 37,785
$ 4,877,183
638

THE COLLECTIVE INVESTMENT FUNDS OF FIRST MERCANTILE TRUST COMPANY FMT/American Funds Washington Mutual Fund
Statement of Operations For the Year Ended December 31, 2015
The accompanying notes are an integral part of these financial statements.
Investment income
Dividends $ 691,851 Expenses
Trustee fees 49,317Custody fees 3,861Audit fees 1,200
54,378 Net investment income 637,473 Net realized gain from investments sold
Proceeds from sales of investments 8,267,329Cost of investments sold 7,010,840
Net realized gain from investments sold 1,256,489 Change in net unrealized appreciation (depreciation) on investments (1,889,887) Net realized and unrealized loss on investments (633,398) Net increase in net assets resulting from operations $ 4,075
639

THE COLLECTIVE INVESTMENT FUNDS OF FIRST MERCANTILE TRUST COMPANY FMT/American Funds Washington Mutual Fund
Statement of Changes in Net Assets For the Year Ended December 31, 2015
The accompanying notes are an integral part of these financial statements.
Operations
Net investment income $ 637,473
Net realized gain from investments sold 1,256,489
Change in net unrealized appreciation (depreciation) on investments (1,889,887)
Net increase in net assets resulting from operations 4,075 Participant transactions
Proceeds from units purchased 2,718,286Less payments for units redeemed 9,378,108
Decrease in net assets from participant transactions (6,659,822)
Total decrease in net assets (6,655,747) Net assets at beginning of year 11,532,930 Net assets at end of year $ 4,877,183
640
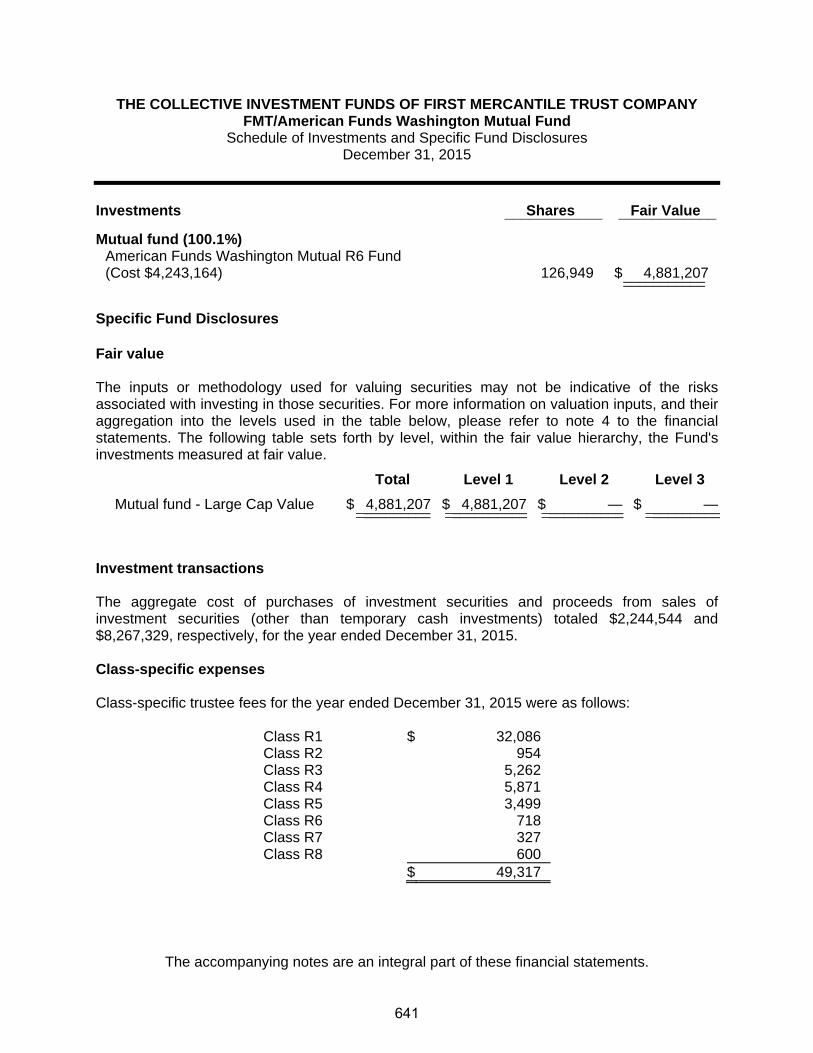
THE COLLECTIVE INVESTMENT FUNDS OF FIRST MERCANTILE TRUST COMPANY FMT/American Funds Washington Mutual Fund
Schedule of Investments and Specific Fund Disclosures December 31, 2015
The accompanying notes are an integral part of these financial statements.
Investments Shares Fair Value ____________ ____________
Mutual fund (100.1%)
American Funds Washington Mutual R6 Fund (Cost $4,243,164) 126,949 $ 4,881,207 ______________________
Specific Fund Disclosures Fair value The inputs or methodology used for valuing securities may not be indicative of the risks associated with investing in those securities. For more information on valuation inputs, and their aggregation into the levels used in the table below, please refer to note 4 to the financial statements. The following table sets forth by level, within the fair value hierarchy, the Fund's investments measured at fair value.
Total Level 1 Level 2 Level 3
Mutual fund - Large Cap Value $ 4,881,207 $ 4,881,207 $ — $ —__________ ___________ ___________ ____________________ ___________ ___________ __________
Investment transactions The aggregate cost of purchases of investment securities and proceeds from sales of investment securities (other than temporary cash investments) totaled $2,244,544 and $8,267,329, respectively, for the year ended December 31, 2015. Class-specific expenses Class-specific trustee fees for the year ended December 31, 2015 were as follows: Class R1 $ 32,086 Class R2 954 Class R3 5,262 Class R4 5,871 Class R5 3,499 Class R6 718 Class R7 327 Class R8 600 $ 49,317
641

THE COLLECTIVE INVESTMENT FUNDS OF FIRST MERCANTILE TRUST COMPANY FMT/American Funds Washington Mutual Fund
Schedule of Participant Transactions December 31, 2015
The accompanying notes are an integral part of these financial statements.
Participant transactions by class for the year ended December 31, 2015 were as follows: Dollars Units Purchases Redemptions Net change Purchases Redemptions Net change Class R1 $ 1,658,644 $ (7,811,579) $ (6,152,935) 103,947 (487,610) (383,663)Class R2 158,086 (1,324) 156,762 9,798 (85) 9,713Class R3 509,235 (570,587) (61,352) 31,455 (35,305) (3,850)Class R4 256,224 (718,756) (462,532) 16,164 (44,601) (28,437)Class R5 107,078 (274,982) (167,904) 6,850 (17,640) (10,790)Class R6 20,883 (512) 20,371 1,259 (32) 1,227Class R7 6,580 (45) 6,535 426 (3) 423Class R8 1,556 (323) 1,233 101 (21) 80 $ 2,718,286 $ (9,378,108) $ (6,659,822) 170,000 (585,297) (415,297)
642

THE COLLECTIVE INVESTMENT FUNDS OF FIRST MERCANTILE TRUST COMPANY FMT/American Funds Washington Mutual Fund
Financial Highlights December 31, 2015
The accompanying notes are an integral part of these financial statements.
Change in Net Asset Value Resulting from Operations Ratios (to average net
assets)
NAV per Unit, Beginning of
Period
Net Investment
Income (Loss)(a)
Net Realized and Unrealized
Gain (Loss) from
Investments(a)
Total from Investment Activities
NAV per Unit, End of
Period Total
Return Expenses
Net Investment
Income (Loss)
Class R1 $ 15.9809 $ 0.9394 $ (0.9835) $ (0.0441) $ 15.9368 (0.28)% (0.40)% 5.90%Class R2 16.1166 1.0208 (1.1009) (0.0801) 16.0365 (0.50)% (0.62)% 6.36%Class R3 16.0797 0.8719 (0.9790) (0.1071) 15.9726 (0.67)% (0.79)% 5.45%Class R4 15.9528 0.6313 (0.7646) (0.1333) 15.8195 (0.84)% (0.96)% 3.96%Class R5 15.8723 0.7782 (0.9378) (0.1596) 15.7127 (1.01)% (1.13)% 4.94%Class R6 16.4292 0.8495 (1.0424) (0.1929) 16.2363 (1.17)% (1.30)% 5.21%Class R7 15.4251 0.8646 (1.0717) (0.2071) 15.2180 (1.34)% (1.46)% 5.65%Class R8 15.4019 0.7020 (0.9348) (0.2328) 15.1691 (1.51)% (1.64)% 4.60%
(a) Per unit amounts are based on average daily units outstanding.
643

FMT/Artisan International Fund

THE COLLECTIVE INVESTMENT FUNDS OF FIRST MERCANTILE TRUST COMPANY FMT/Artisan International Fund Statement of Assets and Liabilities
December 31, 2015
The accompanying notes are an integral part of these financial statements.
Assets Investments in securities, at fair value $ 14,846,678 Liabilities Trustee fees 10,619 Net assets $ 14,836,059 Components of net assets
Units of
Participation NAV
per Unit Net
Assets Class R1 327,218 $ 14.4440 $ 4,726,340Class R2 28,099 $ 15.4097 432,992Class R3 88,979 $ 14.4138 1,282,524Class R4 222,039 $ 14.4076 3,199,048Class R5 71,290 $ 14.6249 1,042,616Class R6 166,414 $ 14.1316 2,351,701Class R7 82,842 $ 14.4056 1,193,384Class R8 45,068 $ 13.4787 607,454
$ 14,836,059
644
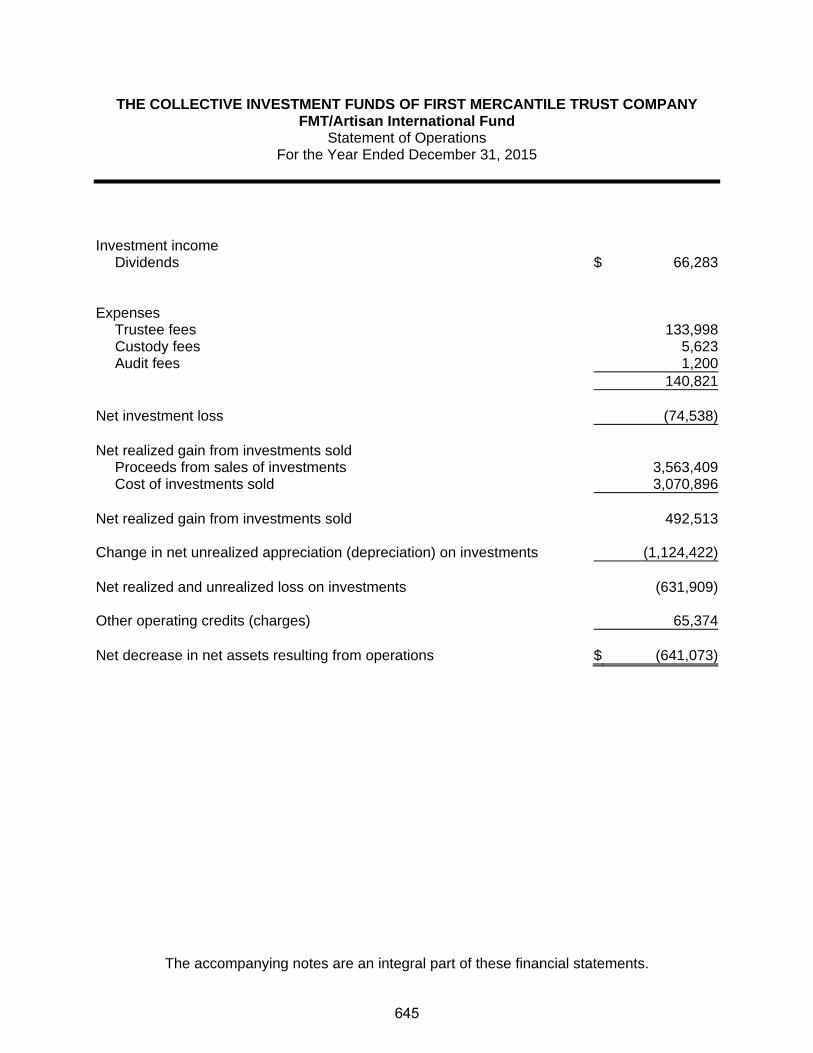
THE COLLECTIVE INVESTMENT FUNDS OF FIRST MERCANTILE TRUST COMPANY FMT/Artisan International Fund
Statement of Operations For the Year Ended December 31, 2015
The accompanying notes are an integral part of these financial statements.
Investment income
Dividends $ 66,283 Expenses
Trustee fees 133,998Custody fees 5,623Audit fees 1,200
140,821 Net investment loss (74,538) Net realized gain from investments sold
Proceeds from sales of investments 3,563,409Cost of investments sold 3,070,896
Net realized gain from investments sold 492,513 Change in net unrealized appreciation (depreciation) on investments (1,124,422) Net realized and unrealized loss on investments (631,909) Other operating credits (charges) 65,374 Net decrease in net assets resulting from operations $ (641,073)
645

THE COLLECTIVE INVESTMENT FUNDS OF FIRST MERCANTILE TRUST COMPANY FMT/Artisan International Fund
Statement of Changes in Net Assets For the Year Ended December 31, 2015
The accompanying notes are an integral part of these financial statements.
Operations
Net investment loss $ (74,538)
Net realized gain from investments sold 492,513
Change in net unrealized appreciation (depreciation) on investments (1,124,422)
Other operating credits (charges) 65,374
Net decrease in net assets resulting from operations (641,073) Participant transactions
Proceeds from units purchased 5,726,625Less payments for units redeemed 6,956,069
Decrease in net assets from participant transactions (1,229,444)
Total decrease in net assets (1,870,517) Net assets at beginning of year 16,706,576 Net assets at end of year $ 14,836,059
646

THE COLLECTIVE INVESTMENT FUNDS OF FIRST MERCANTILE TRUST COMPANY FMT/Artisan International Fund
Schedule of Investments and Specific Fund Disclosures December 31, 2015
The accompanying notes are an integral part of these financial statements.
Investments Shares Fair Value ____________ ____________
Mutual fund (100.1%) Artisan International Fund (Cost $13,587,745) 517,667 $ 14,846,678 ______________________ Specific Fund Disclosures Fair value The inputs or methodology used for valuing securities may not be indicative of the risks associated with investing in those securities. For more information on valuation inputs, and their aggregation into the levels used in the table below, please refer to note 4 to the financial statements. The following table sets forth by level, within the fair value hierarchy, the Fund's investments measured at fair value.
Total Level 1 Level 2 Level 3
Mutual fund - International Growth $ 14,846,678 $ 14,846,678 $ — $ —__________ ___________ ___________ ____________________ ___________ ___________ __________
Investment transactions The aggregate cost of purchases of investment securities and proceeds from sales of investment securities (other than temporary cash investments) totaled $2,323,024 and $3,563,409, respectively, for the year ended December 31, 2015. Class-specific expenses Class-specific trustee fees for the year ended December 31, 2015 were as follows: Class R1 $ 16,438 Class R2 6,684 Class R3 8,608 Class R4 31,459 Class R5 13,260 Class R6 28,920 Class R7 20,139 Class R8 8,490 $ 133,998
647
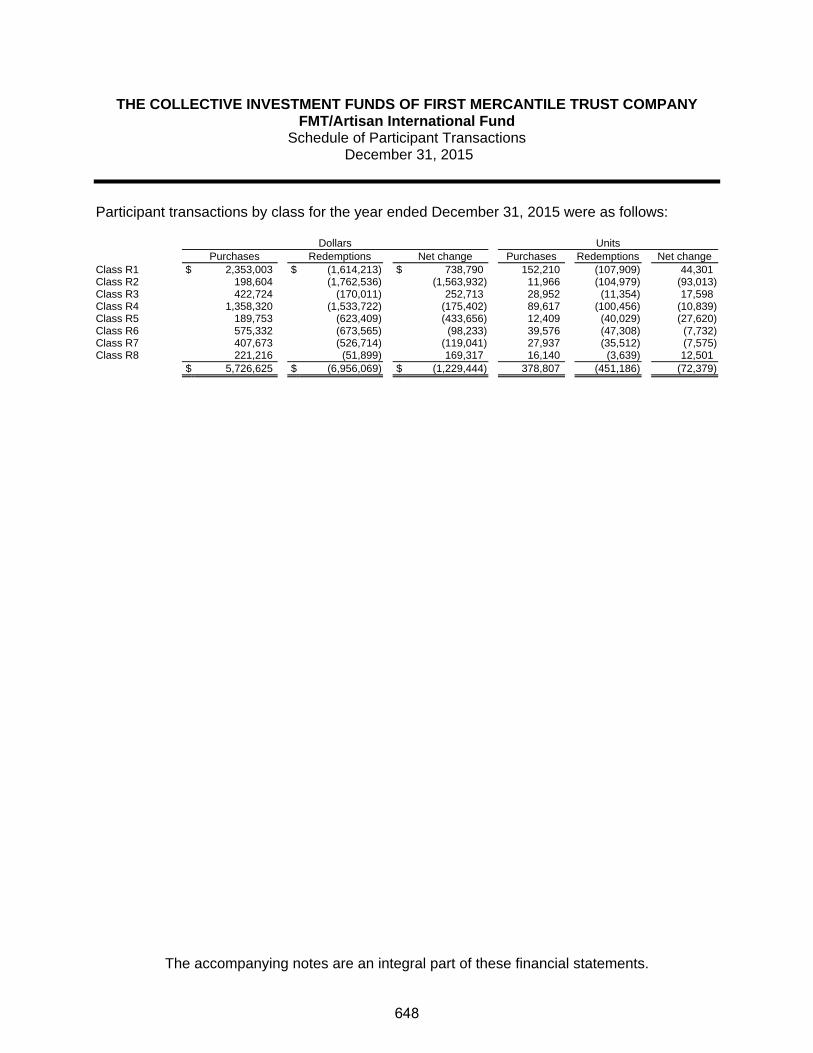
THE COLLECTIVE INVESTMENT FUNDS OF FIRST MERCANTILE TRUST COMPANY FMT/Artisan International Fund
Schedule of Participant Transactions December 31, 2015
The accompanying notes are an integral part of these financial statements.
Participant transactions by class for the year ended December 31, 2015 were as follows: Dollars Units Purchases Redemptions Net change Purchases Redemptions Net change Class R1 $ 2,353,003 $ (1,614,213) $ 738,790 152,210 (107,909) 44,301Class R2 198,604 (1,762,536) (1,563,932) 11,966 (104,979) (93,013)Class R3 422,724 (170,011) 252,713 28,952 (11,354) 17,598Class R4 1,358,320 (1,533,722) (175,402) 89,617 (100,456) (10,839)Class R5 189,753 (623,409) (433,656) 12,409 (40,029) (27,620)Class R6 575,332 (673,565) (98,233) 39,576 (47,308) (7,732)Class R7 407,673 (526,714) (119,041) 27,937 (35,512) (7,575)Class R8 221,216 (51,899) 169,317 16,140 (3,639) 12,501 $ 5,726,625 $ (6,956,069) $ (1,229,444) 378,807 (451,186) (72,379)
648

THE COLLECTIVE INVESTMENT FUNDS OF FIRST MERCANTILE TRUST COMPANY FMT/Artisan International Fund
Financial Highlights December 31, 2015
The accompanying notes are an integral part of these financial statements.
Change in Net Asset Value Resulting from Operations Ratios (to average net
assets)
NAV per Unit, Beginning of
Period
Net Investment
Income (Loss)(a)
Net Realized and Unrealized
Gain (Loss) from
Investments(a)
Total from Investment Activities
NAV per Unit, End of
Period Total
Return Expenses
Net Investment
Income (Loss)
Class R1 $ 15.0203 $ 0.0704 $ (0.6467) $ (0.5763) $ 14.4440 (3.84)% (0.39)% 0.47%Class R2 16.0604 (0.0077) (0.6430) (0.6507) 15.4097 (4.05)% (0.61)% (0.05)%Class R3 15.0478 0.0182 (0.6522) (0.6340) 14.4138 (4.21)% (0.78)% 0.12%Class R4 15.0670 (0.0212) (0.6382) (0.6594) 14.4076 (4.38)% (0.95)% (0.14)%Class R5 15.3205 (0.0481) (0.6475) (0.6956) 14.6249 (4.54)% (1.12)% (0.31)%Class R6 14.8290 (0.0645) (0.6329) (0.6974) 14.1316 (4.70)% (1.29)% (0.43)%Class R7 15.1424 (0.1005) (0.6363) (0.7368) 14.4056 (4.87)% (1.46)% (0.66)%Class R8 14.1923 (0.1018) (0.6118) (0.7136) 13.4787 (5.03)% (1.63)% (0.72)%
(a) Per unit amounts are based on average daily units outstanding.
649
FMT/Columbia Acorn Z Fund
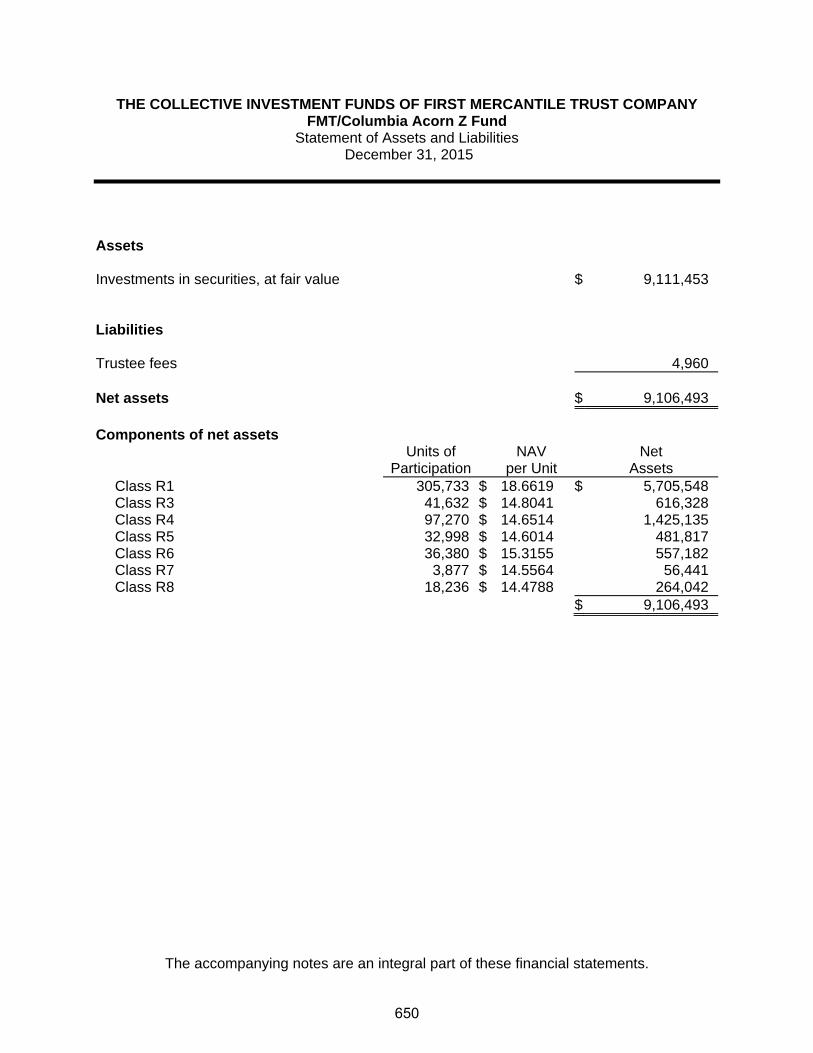
THE COLLECTIVE INVESTMENT FUNDS OF FIRST MERCANTILE TRUST COMPANY FMT/Columbia Acorn Z Fund
Statement of Assets and Liabilities December 31, 2015
The accompanying notes are an integral part of these financial statements.
Assets Investments in securities, at fair value $ 9,111,453 Liabilities Trustee fees 4,960 Net assets $ 9,106,493 Components of net assets
Units of
Participation NAV
per Unit Net
Assets Class R1 305,733 $ 18.6619 $ 5,705,548Class R3 41,632 $ 14.8041 616,328Class R4 97,270 $ 14.6514 1,425,135Class R5 32,998 $ 14.6014 481,817Class R6 36,380 $ 15.3155 557,182Class R7 3,877 $ 14.5564 56,441Class R8 18,236 $ 14.4788 264,042
$ 9,106,493
650

THE COLLECTIVE INVESTMENT FUNDS OF FIRST MERCANTILE TRUST COMPANY FMT/Columbia Acorn Z Fund
Statement of Operations For the Year Ended December 31, 2015
The accompanying notes are an integral part of these financial statements.
Investment income
Dividends $ 4,592,236 Expenses
Trustee fees 105,966Custody fees 6,454Audit fees 1,200
113,620 Net investment income 4,478,616 Net realized gain from investments sold
Proceeds from sales of investments 13,460,547Cost of investments sold 13,330,044
Net realized gain from investments sold 130,503 Change in net unrealized appreciation (depreciation) on investments (4,781,649) Net realized and unrealized loss on investments (4,651,146) Other operating credits (charges) 74,622 Net decrease in net assets resulting from operations $ (97,908)
651

THE COLLECTIVE INVESTMENT FUNDS OF FIRST MERCANTILE TRUST COMPANY FMT/Columbia Acorn Z Fund
Statement of Changes in Net Assets For the Year Ended December 31, 2015
The accompanying notes are an integral part of these financial statements.
Operations
Net investment income $ 4,478,616
Net realized gain from investments sold 130,503
Change in net unrealized appreciation (depreciation) on investments (4,781,649)
Other operating credits (charges) 74,622
Net decrease in net assets resulting from operations (97,908) Participant transactions
Proceeds from units purchased 4,829,348Less payments for units redeemed 16,792,452
Decrease in net assets from participant transactions (11,963,104)
Total decrease in net assets (12,061,012) Net assets at beginning of year 21,167,505 Net assets at end of year $ 9,106,493
652

THE COLLECTIVE INVESTMENT FUNDS OF FIRST MERCANTILE TRUST COMPANY FMT/Columbia Acorn Z Fund
Schedule of Investments and Specific Fund Disclosures December 31, 2015
The accompanying notes are an integral part of these financial statements.
Investments Shares Fair Value ____________ ____________
Mutual fund (100.1%) Columbia Acorn Z Fund (Cost $12,224,108) 471,120 $ 9,111,453 ______________________ Specific Fund Disclosures Fair value The inputs or methodology used for valuing securities may not be indicative of the risks associated with investing in those securities. For more information on valuation inputs, and their aggregation into the levels used in the table below, please refer to note 4 to the financial statements. The following table sets forth by level, within the fair value hierarchy, the Fund's investments measured at fair value.
Total Level 1 Level 2 Level 3
Mutual fund - Mid Cap Growth $ 9,111,453 $ 9,111,453 $ — $ —__________ ___________ ___________ ____________________ ___________ ___________ __________
Investment transactions The aggregate cost of purchases of investment securities and proceeds from sales of investment securities (other than temporary cash investments) totaled $6,044,000 and $13,460,547, respectively, for the year ended December 31, 2015. Class-specific expenses Class-specific trustee fees for the year ended December 31, 2015 were as follows: Class R1 $ 27,368 Class R2 8,148 Class R3 24,120 Class R4 18,428 Class R5 10,381 Class R6 9,842 Class R7 2,719 Class R8 4,960 $ 105,966
653

THE COLLECTIVE INVESTMENT FUNDS OF FIRST MERCANTILE TRUST COMPANY FMT/Columbia Acorn Z Fund
Schedule of Participant Transactions December 31, 2015
The accompanying notes are an integral part of these financial statements.
Participant transactions by class for the year ended December 31, 2015 were as follows: Dollars Units Purchases Redemptions Net change Purchases Redemptions Net change Class R1 $ 2,547,965 $ (5,524,688) $ (2,976,723) 130,413 (286,662) (156,249)Class R2 86,533 (2,812,676) (2,726,143) 5,275 (169,594) (164,319)Class R3 1,292,097 (5,033,200) (3,741,103) 83,553 (337,619) (254,066)Class R4 679,996 (1,381,768) (701,772) 44,532 (91,638) (47,106)Class R5 102,707 (1,223,025) (1,120,318) 6,766 (80,719) (73,953)Class R6 65,934 (508,392) (442,458) 4,115 (31,417) (27,302)Class R7 30,748 (239,132) (208,384) 2,035 (15,938) (13,903)Class R8 23,368 (69,571) (46,203) 1,549 (4,670) (3,121) $ 4,829,348 $ (16,792,452) $ (11,963,104) 278,238 (1,018,257) (740,019)
654
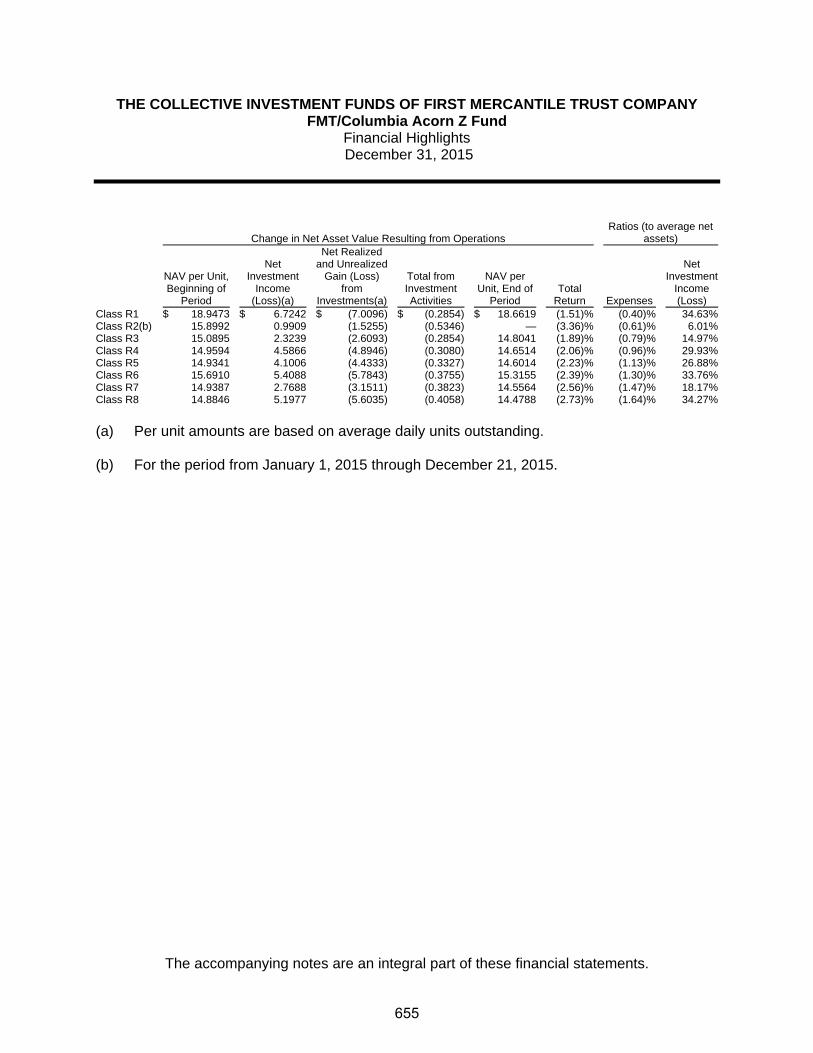
THE COLLECTIVE INVESTMENT FUNDS OF FIRST MERCANTILE TRUST COMPANY FMT/Columbia Acorn Z Fund
Financial Highlights December 31, 2015
The accompanying notes are an integral part of these financial statements.
Change in Net Asset Value Resulting from Operations Ratios (to average net
assets)
NAV per Unit, Beginning of
Period
Net Investment
Income (Loss)(a)
Net Realized and Unrealized
Gain (Loss) from
Investments(a)
Total from Investment Activities
NAV per Unit, End of
Period Total
Return Expenses
Net Investment
Income (Loss)
Class R1 $ 18.9473 $ 6.7242 $ (7.0096) $ (0.2854) $ 18.6619 (1.51)% (0.40)% 34.63%Class R2(b) 15.8992 0.9909 (1.5255) (0.5346) — (3.36)% (0.61)% 6.01%Class R3 15.0895 2.3239 (2.6093) (0.2854) 14.8041 (1.89)% (0.79)% 14.97%Class R4 14.9594 4.5866 (4.8946) (0.3080) 14.6514 (2.06)% (0.96)% 29.93%Class R5 14.9341 4.1006 (4.4333) (0.3327) 14.6014 (2.23)% (1.13)% 26.88%Class R6 15.6910 5.4088 (5.7843) (0.3755) 15.3155 (2.39)% (1.30)% 33.76%Class R7 14.9387 2.7688 (3.1511) (0.3823) 14.5564 (2.56)% (1.47)% 18.17%Class R8 14.8846 5.1977 (5.6035) (0.4058) 14.4788 (2.73)% (1.64)% 34.27%
(a) Per unit amounts are based on average daily units outstanding.
(b) For the period from January 1, 2015 through December 21, 2015.
655
FMT/DFA Emerging Markets Core Equity Fund

THE COLLECTIVE INVESTMENT FUNDS OF FIRST MERCANTILE TRUST COMPANY FMT/DFA Emerging Markets Core Equity Fund
Statement of Assets and Liabilities December 31, 2015
The accompanying notes are an integral part of these financial statements.
Assets Investments in securities, at fair value $ 11,155,200 Liabilities Trustee fees 6,316 Net assets $ 11,148,884 Components of net assets
Units of
Participation NAV
per Unit Net
Assets Class R1 492,324 $ 9.7506 $ 4,800,448Class R2 94,208 $ 9.2587 872,247Class R3 246,111 $ 9.1650 2,255,599Class R4 167,789 $ 9.1018 1,527,185Class R5 46,127 $ 9.8196 452,950Class R6 83,941 $ 8.6441 725,599Class R7 32,584 $ 9.3303 304,018Class R8 26,343 $ 8.0036 210,838
$ 11,148,884
656

THE COLLECTIVE INVESTMENT FUNDS OF FIRST MERCANTILE TRUST COMPANY FMT/DFA Emerging Markets Core Equity Fund
Statement of Operations For the Year Ended December 31, 2015
The accompanying notes are an integral part of these financial statements.
Investment income
Dividends $ 248,719 Expenses
Trustee fees 85,970Custody fees 4,617Audit fees 1,200
91,787 Net investment income 156,932 Net realized loss from investments sold
Proceeds from sales of investments 3,462,014Cost of investments sold 3,730,161
Net realized loss from investments sold (268,147) Change in net unrealized appreciation (depreciation) on investments (1,870,035) Net realized and unrealized loss on investments (2,138,182) Net decrease in net assets resulting from operations $ (1,981,250)
657

THE COLLECTIVE INVESTMENT FUNDS OF FIRST MERCANTILE TRUST COMPANY FMT/DFA Emerging Markets Core Equity Fund
Statement of Changes in Net Assets For the Year Ended December 31, 2015
The accompanying notes are an integral part of these financial statements.
Operations
Net investment income $ 156,932
Net realized loss from investments sold (268,147)
Change in net unrealized appreciation (depreciation) on investments (1,870,035)
Net decrease in net assets resulting from operations (1,981,250) Participant transactions
Proceeds from units purchased 4,903,992Less payments for units redeemed 5,752,086
Decrease in net assets from participant transactions (848,094)
Total decrease in net assets (2,829,344) Net assets at beginning of year 13,978,228 Net assets at end of year $ 11,148,884
658
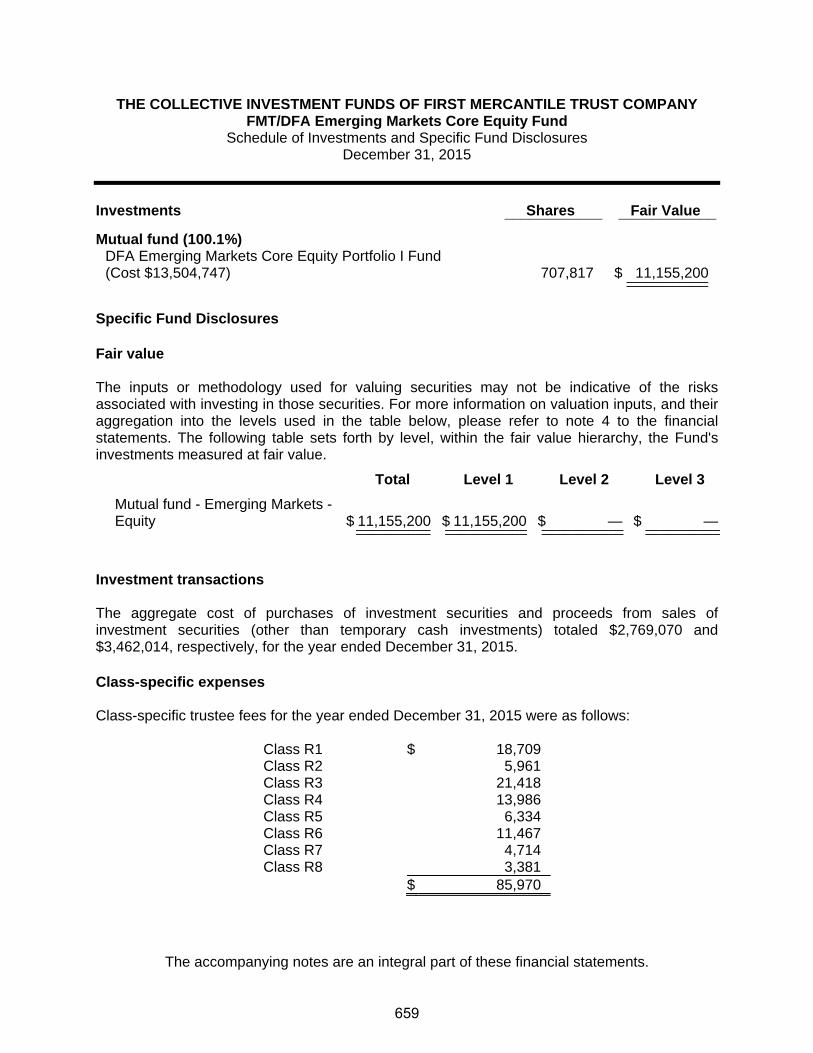
THE COLLECTIVE INVESTMENT FUNDS OF FIRST MERCANTILE TRUST COMPANY FMT/DFA Emerging Markets Core Equity Fund
Schedule of Investments and Specific Fund Disclosures December 31, 2015
The accompanying notes are an integral part of these financial statements.
Investments Shares Fair Value ____________ ____________
Mutual fund (100.1%)
DFA Emerging Markets Core Equity Portfolio I Fund (Cost $13,504,747) 707,817 $ 11,155,200 ____________________
Specific Fund Disclosures Fair value The inputs or methodology used for valuing securities may not be indicative of the risks associated with investing in those securities. For more information on valuation inputs, and their aggregation into the levels used in the table below, please refer to note 4 to the financial statements. The following table sets forth by level, within the fair value hierarchy, the Fund's investments measured at fair value.
Total Level 1 Level 2 Level 3
Mutual fund - Emerging Markets -Equity $ 11,155,200 $ 11,155,200 $ — $ —__________ ___________ ___________ ____________________ ___________ ___________ __________
Investment transactions The aggregate cost of purchases of investment securities and proceeds from sales of investment securities (other than temporary cash investments) totaled $2,769,070 and $3,462,014, respectively, for the year ended December 31, 2015. Class-specific expenses Class-specific trustee fees for the year ended December 31, 2015 were as follows: Class R1 $ 18,709 Class R2 5,961 Class R3 21,418 Class R4 13,986 Class R5 6,334 Class R6 11,467 Class R7 4,714 Class R8 3,381 $ 85,970
659

THE COLLECTIVE INVESTMENT FUNDS OF FIRST MERCANTILE TRUST COMPANY FMT/DFA Emerging Markets Core Equity Fund
Schedule of Participant Transactions December 31, 2015
The accompanying notes are an integral part of these financial statements.
Participant transactions by class for the year ended December 31, 2015 were as follows: Dollars Units Purchases Redemptions Net change Purchases Redemptions Net change Class R1 $ 2,111,820 $ (2,402,845) $ (291,025) 197,636 (222,739) (25,103)Class R2 415,636 (613,419) (197,783) 40,834 (58,483) (17,649)Class R3 983,750 (1,263,202) (279,452) 96,523 (123,354) (26,831)Class R4 659,638 (333,969) 325,669 64,505 (32,359) 32,146Class R5 169,870 (303,346) (133,476) 15,779 (27,129) (11,350)Class R6 388,104 (544,327) (156,223) 38,856 (51,113) (12,257)Class R7 116,573 (169,029) (52,456) 10,524 (14,818) (4,294)Class R8 58,601 (121,949) (63,348) 6,660 (12,671) (6,011) $ 4,903,992 $ (5,752,086) $ (848,094) 471,317 (542,666) (71,349)
660

THE COLLECTIVE INVESTMENT FUNDS OF FIRST MERCANTILE TRUST COMPANY FMT/DFA Emerging Markets Core Equity Fund
Financial Highlights December 31, 2015
The accompanying notes are an integral part of these financial statements.
Change in Net Asset Value Resulting from Operations Ratios (to average net
assets)
NAV per Unit, Beginning of
Period
Net Investment
Income (Loss)(a)
Net Realized and Unrealized
Gain (Loss) from
Investments(a)
Total from Investment Activities
NAV per Unit, End of
Period Total
Return Expenses
Net Investment
Income (Loss)
Class R1 $ 11.4980 $ 0.1734 $ (1.9208) $ (1.7474) $ 9.7506 (15.20)% (0.40)% 1.56%Class R2 10.9423 0.1383 (1.8219) (1.6836) 9.2587 (15.39)% (0.62)% 1.31%Class R3 10.8501 0.1152 (1.8003) (1.6851) 9.1650 (15.53)% (0.79)% 1.10%Class R4 10.7938 0.1079 (1.7999) (1.6920) 9.1018 (15.68)% (0.96)% 1.04%Class R5 11.6650 0.0844 (1.9298) (1.8454) 9.8196 (15.82)% (1.13)% 0.75%Class R6 10.2863 0.0619 (1.7041) (1.6422) 8.6441 (15.96)% (1.30)% 0.62%Class R7 11.1219 0.0504 (1.8420) (1.7916) 9.3303 (16.11)% (1.47)% 0.47%Class R8 9.5566 0.0311 (1.5841) (1.5530) 8.0036 (16.25)% (1.64)% 0.34%
(a) Per unit amounts are based on average daily units outstanding.
661

FMT/DFA Emerging Markets I Fund

THE COLLECTIVE INVESTMENT FUNDS OF FIRST MERCANTILE TRUST COMPANY FMT/DFA Emerging Markets I Fund
Statement of Assets and Liabilities December 31, 2015
The accompanying notes are an integral part of these financial statements.
Assets Investments in securities, at fair value $ 3,243,436 Liabilities Trustee fees 2,089 Net assets $ 3,241,347 Components of net assets
Units of
Participation NAV
per Unit Net
Assets Class R1 112,399 $ 9.3594 $ 1,051,988Class R2 18,035 $ 9.4689 170,772Class R3 90,027 $ 8.9237 803,375Class R4 38,169 $ 8.3020 316,881Class R5 30,960 $ 8.9671 277,624Class R6 31,389 $ 8.6682 272,083Class R7 35,897 $ 8.6249 309,609Class R8 4,452 $ 8.7629 39,015
$ 3,241,347
662

THE COLLECTIVE INVESTMENT FUNDS OF FIRST MERCANTILE TRUST COMPANY FMT/DFA Emerging Markets I Fund
Statement of Operations For the Year Ended December 31, 2015
The accompanying notes are an integral part of these financial statements.
Investment income
Dividends $ 65,973 Expenses
Trustee fees 27,429Custody fees 1,265Audit fees 1,200
29,894 Net investment income 36,079 Net realized loss from investments sold
Proceeds from sales of investments 594,078Cost of investments sold 648,061
Net realized loss from investments sold (53,983) Change in net unrealized appreciation (depreciation) on investments (612,403) Net realized and unrealized loss on investments (666,386) Net decrease in net assets resulting from operations $ (630,307)
663

THE COLLECTIVE INVESTMENT FUNDS OF FIRST MERCANTILE TRUST COMPANY FMT/DFA Emerging Markets I Fund Statement of Changes in Net Assets
For the Year Ended December 31, 2015
The accompanying notes are an integral part of these financial statements.
Operations
Net investment income $ 36,079
Net realized loss from investments sold (53,983)
Change in net unrealized appreciation (depreciation) on investments (612,403)
Net decrease in net assets resulting from operations (630,307) Participant transactions
Proceeds from units purchased 1,619,801Less payments for units redeemed 1,366,133
Increase in net assets from participant transactions 253,668
Total decrease in net assets (376,639) Net assets at beginning of year 3,617,986 Net assets at end of year $ 3,241,347
664

THE COLLECTIVE INVESTMENT FUNDS OF FIRST MERCANTILE TRUST COMPANY FMT/DFA Emerging Markets I Fund
Schedule of Investments and Specific Fund Disclosures December 31, 2015
The accompanying notes are an integral part of these financial statements.
Investments Shares Fair Value ____________ ____________
Mutual fund (100.1%)
DFA Emerging Markets Portfolio I Fund (Cost $4,010,006) 156,915 $ 3,243,436 ____________________
Specific Fund Disclosures Fair value The inputs or methodology used for valuing securities may not be indicative of the risks associated with investing in those securities. For more information on valuation inputs, and their aggregation into the levels used in the table below, please refer to note 4 to the financial statements. The following table sets forth by level, within the fair value hierarchy, the Fund's investments measured at fair value.
Total Level 1 Level 2 Level 3
Mutual fund – Emerging Markets $ 3,243,436 $ 3,243,436 $ — $ —__________ __________ __________ ___________________ __________ __________ _________
Investment transactions The aggregate cost of purchases of investment securities and proceeds from sales of investment securities (other than temporary cash investments) totaled $883,414 and $594,078, respectively, for the year ended December 31, 2015. Class-specific expenses Class-specific trustee fees for the year ended December 31, 2015 were as follows: Class R1 $ 4,240 Class R2 1,065 Class R3 6,826 Class R4 2,733 Class R5 3,478 Class R6 3,788 Class R7 3,702 Class R8 1,597 $ 27,429
665

THE COLLECTIVE INVESTMENT FUNDS OF FIRST MERCANTILE TRUST COMPANY FMT/DFA Emerging Markets I Fund Schedule of Participant Transactions
December 31, 2015
The accompanying notes are an integral part of these financial statements.
Participant transactions by class for the year ended December 31, 2015 were as follows: Dollars Units Purchases Redemptions Net change Purchases Redemptions Net change Class R1 $ 526,604 $ (403,215) $ 123,389 48,679 (38,889) 9,790Class R2 178,329 (157,916) 20,413 16,657 (14,378) 2,279Class R3 186,993 (122,322) 64,671 17,875 (12,329) 5,546Class R4 235,358 (155,515) 79,843 25,457 (16,326) 9,131Class R5 241,885 (264,884) (22,999) 22,676 (24,528) (1,852)Class R6 64,968 (32,947) 32,021 6,724 (3,462) 3,262Class R7 143,257 (25,752) 117,505 15,338 (2,590) 12,748Class R8 42,407 (203,582) (161,175) 4,098 (19,893) (15,795) $ 1,619,801 $ (1,366,133) $ 253,668 157,504 (132,395) 25,109
666

THE COLLECTIVE INVESTMENT FUNDS OF FIRST MERCANTILE TRUST COMPANY FMT/DFA Emerging Markets I Fund
Financial Highlights December 31, 2015
The accompanying notes are an integral part of these financial statements.
Change in Net Asset Value Resulting from Operations Ratios (to average net
assets)
NAV per Unit, Beginning of
Period
Net Investment
Income (Loss)(a)
Net Realized and Unrealized
Gain (Loss) from
Investments(a)
Total from Investment Activities
NAV per Unit, End of
Period Total
Return Expenses
Net Investment
Income (Loss)
Class R1 $ 11.1642 $ 0.1507 $ (1.9555) $ (1.8048) $ 9.3594 (16.17)% (0.42)% 1.41%Class R2 11.3199 0.1291 (1.9801) (1.8510) 9.4689 (16.35)% (0.64)% 1.19%Class R3 10.6865 0.1026 (1.8654) (1.7628) 8.9237 (16.50)% (0.81)% 1.00%Class R4 9.9591 0.0874 (1.7445) (1.6571) 8.3020 (16.64)% (0.98)% 0.92%Class R5 10.7751 0.0680 (1.8760) (1.8080) 8.9671 (16.78)% (1.15)% 0.66%Class R6 10.4340 0.0507 (1.8165) (1.7658) 8.6682 (16.92)% (1.32)% 0.51%Class R7 10.3995 0.0477 (1.8223) (1.7746) 8.6249 (17.06)% (1.49)% 0.49%Class R8 10.5849 (0.0083) (1.8137) (1.8220) 8.7629 (17.21)% (1.66)% (0.08)%
(a) Per unit amounts are based on average daily units outstanding.
667

FMT/DFA Emerging Markets Small Cap Fund
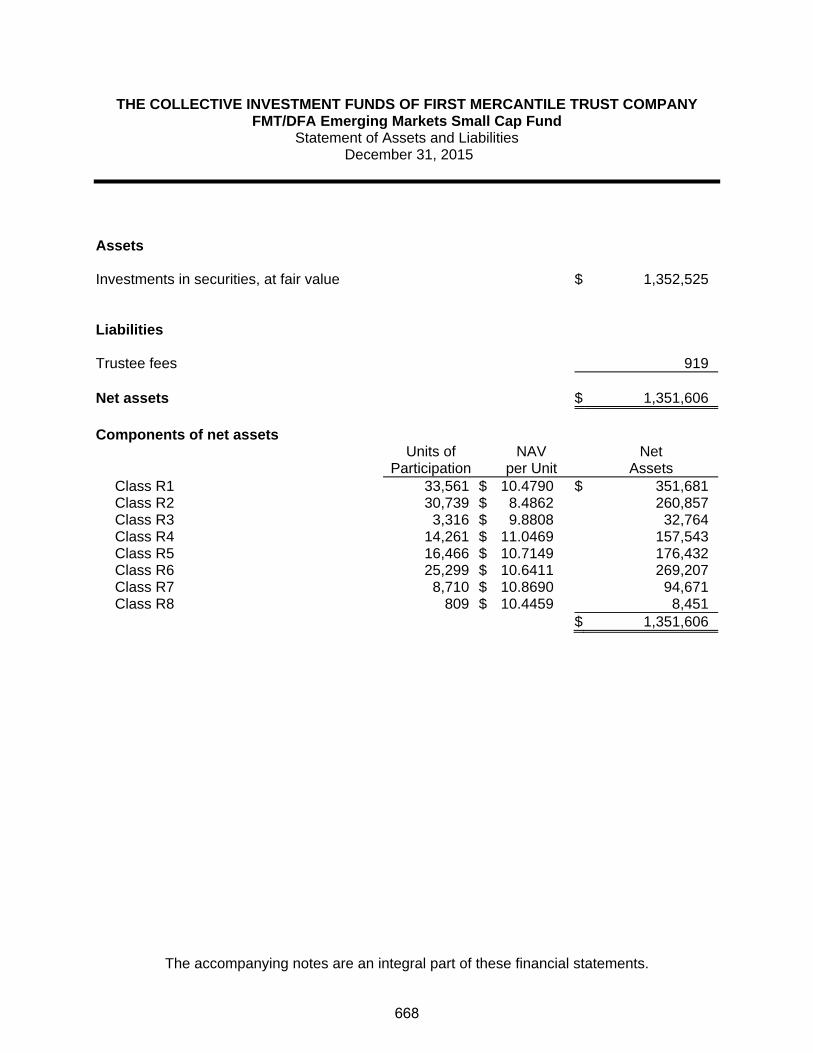
THE COLLECTIVE INVESTMENT FUNDS OF FIRST MERCANTILE TRUST COMPANY FMT/DFA Emerging Markets Small Cap Fund
Statement of Assets and Liabilities December 31, 2015
The accompanying notes are an integral part of these financial statements.
Assets Investments in securities, at fair value $ 1,352,525 Liabilities Trustee fees 919 Net assets $ 1,351,606 Components of net assets
Units of
Participation NAV
per Unit Net
Assets Class R1 33,561 $ 10.4790 $ 351,681Class R2 30,739 $ 8.4862 260,857Class R3 3,316 $ 9.8808 32,764Class R4 14,261 $ 11.0469 157,543Class R5 16,466 $ 10.7149 176,432Class R6 25,299 $ 10.6411 269,207Class R7 8,710 $ 10.8690 94,671Class R8 809 $ 10.4459 8,451
$ 1,351,606
668

THE COLLECTIVE INVESTMENT FUNDS OF FIRST MERCANTILE TRUST COMPANY FMT/DFA Emerging Markets Small Cap Fund
Statement of Operations For the Year Ended December 31, 2015
The accompanying notes are an integral part of these financial statements.
Investment income
Dividends $ 43,318 Expenses
Trustee fees 12,405Audit fees 1,200Custody fees 543
14,148 Net investment income 29,170 Net realized loss from investments sold
Proceeds from sales of investments 426,661Cost of investments sold 450,949
Net realized loss from investments sold (24,288) Change in net unrealized appreciation (depreciation) on investments (156,681) Net realized and unrealized loss on investments (180,969) Net decrease in net assets resulting from operations $ (151,799)
669

THE COLLECTIVE INVESTMENT FUNDS OF FIRST MERCANTILE TRUST COMPANY FMT/DFA Emerging Markets Small Cap Fund
Statement of Changes in Net Assets For the Year Ended December 31, 2015
The accompanying notes are an integral part of these financial statements.
Operations
Net investment income $ 29,170
Net realized loss from investments sold (24,288)
Change in net unrealized appreciation (depreciation) on investments (156,681)
Net decrease in net assets resulting from operations (151,799) Participant transactions
Proceeds from units purchased 463,788Less payments for units redeemed 467,651
Decrease in net assets from participant transactions (3,863)
Total decrease in net assets (155,662) Net assets at beginning of year 1,507,268 Net assets at end of year $ 1,351,606
670

THE COLLECTIVE INVESTMENT FUNDS OF FIRST MERCANTILE TRUST COMPANY FMT/DFA Emerging Markets Small Cap Fund
Schedule of Investments and Specific Fund Disclosures December 31, 2015
The accompanying notes are an integral part of these financial statements.
Investments Shares Fair Value ____________ ____________
Mutual fund (100.1%)
DFA Emerging Markets Small Cap Portfolio Fund (Cost $1,547,998) 76,935 $ 1,352,525 ____________________
Specific Fund Disclosures Fair value The inputs or methodology used for valuing securities may not be indicative of the risks associated with investing in those securities. For more information on valuation inputs, and their aggregation into the levels used in the table below, please refer to note 4 to the financial statements. The following table sets forth by level, within the fair value hierarchy, the Fund's investments measured at fair value.
Total Level 1 Level 2 Level 3
Mutual fund - Emerging Markets $ 1,352,525 $ 1,352,525 $ — $ —__________ ___________ ___________ ____________________ ___________ ___________ __________ Investment transactions The aggregate cost of purchases of investment securities and proceeds from sales of investment securities (other than temporary cash investments) totaled $451,856 and $426,661, respectively, for the year ended December 31, 2015. Class-specific expenses Class-specific trustee fees for the year ended December 31, 2015 were as follows: Class R1 $ 1,737 Class R2 1,470 Class R3 191 Class R4 1,496 Class R5 2,088 Class R6 3,882 Class R7 1,406 Class R8 135 $ 12,405
671

THE COLLECTIVE INVESTMENT FUNDS OF FIRST MERCANTILE TRUST COMPANY FMT/DFA Emerging Markets Small Cap Fund
Schedule of Participant Transactions December 31, 2015
The accompanying notes are an integral part of these financial statements.
Participant transactions by class for the year ended December 31, 2015 were as follows: Dollars Units Purchases Redemptions Net change Purchases Redemptions Net change Class R1 $ 83,078 $ (195,317) $ (112,239) 7,255 (17,693) (10,438)Class R2 53,026 (24,971) 28,055 5,997 (2,569) 3,428Class R3 45,171 (15,180) 29,991 3,959 (1,479) 2,480Class R4 85,384 (53,575) 31,809 6,914 (4,952) 1,962Class R5 133,502 (110,344) 23,158 11,313 (8,762) 2,551Class R6 36,597 (50,916) (14,319) 3,216 (4,579) (1,363)Class R7 25,003 (17,064) 7,939 2,140 (1,450) 690Class R8 2,027 (284) 1,743 174 (22) 152 $ 463,788 $ (467,651) $ (3,863) 40,968 (41,506) (538)
672

THE COLLECTIVE INVESTMENT FUNDS OF FIRST MERCANTILE TRUST COMPANY FMT/DFA Emerging Markets Small Cap Fund
Financial Highlights December 31, 2015
The accompanying notes are an integral part of these financial statements.
Change in Net Asset Value Resulting from Operations Ratios (to average net
assets)
NAV per Unit, Beginning of
Period
Net Investment
Income (Loss)(a)
Net Realized and Unrealized
Gain (Loss) from
Investments(a)
Total from Investment Activities
NAV per Unit, End of
Period Total
Return Expenses
Net Investment
Income (Loss)
Class R1 $ 11.5304 $ 0.2297 $ (1.2811) $ (1.0514) $ 10.4790 (9.12)% (0.46)% 2.00%Class R2 9.3584 0.2213 (1.0935) (0.8722) 8.4862 (9.32)% (0.68)% 2.38%Class R3 10.9150 0.2871 (1.3213) (1.0342) 9.8808 (9.48)% (0.85)% 2.72%Class R4 12.2240 0.2363 (1.4134) (1.1771) 11.0469 (9.63)% (1.02)% 1.95%Class R5 11.8769 0.1992 (1.3612) (1.1620) 10.7149 (9.78)% (1.19)% 1.69%Class R6 11.8153 0.1662 (1.3404) (1.1742) 10.6411 (9.94)% (1.36)% 1.42%Class R7 12.0890 0.1710 (1.3910) (1.2200) 10.8690 (10.09)% (1.53)% 1.43%Class R8 11.6383 0.1502 (1.3426) (1.1924) 10.4459 (10.25)% (1.70)% 1.31%
(a) Per unit amounts are based on average daily units outstanding.
673
FMT/DFA Emerging Markets Value Fund

THE COLLECTIVE INVESTMENT FUNDS OF FIRST MERCANTILE TRUST COMPANY FMT/DFA Emerging Markets Value Fund
Statement of Assets and Liabilities December 31, 2015
The accompanying notes are an integral part of these financial statements.
Assets Investments in securities, at fair value $ 11,053,742 Liabilities Trustee fees 1,515 Net assets $ 11,052,227 Components of net assets
Units of
Participation NAV
per Unit Net
Assets Class R1 107,622 $ 11.2008 $ 1,205,456Class R2 29,008 $ 8.2634 239,703Class R3 1,482 $ 7.2576 10,756Class R4 47,491 $ 8.5195 404,599Class R5 36,515 $ 8.2208 300,182Class R6 29,926 $ 8.1640 244,313Class R7 15,310 $ 7.9840 122,235Class R8 7,352 $ 7.9762 58,644Class LifeStyle 8,466,339
$ 11,052,227
674

THE COLLECTIVE INVESTMENT FUNDS OF FIRST MERCANTILE TRUST COMPANY FMT/DFA Emerging Markets Value Fund
Statement of Operations For the Year Ended December 31, 2015
The accompanying notes are an integral part of these financial statements.
Investment income
Dividends $ 281,440 Expenses
Trustee fees 94,379Custody fees 5,818Audit fees 1,426
101,623 Net investment income 179,817 Net realized loss from investments sold
Proceeds from sales of investments 7,336,681Cost of investments sold 8,163,250
Net realized loss from investments sold (826,569) Change in net unrealized appreciation (depreciation) on investments (2,141,232) Net realized and unrealized loss on investments (2,967,801) Other operating credits (charges) 80 Net decrease in net assets resulting from operations $ (2,787,904)
675

THE COLLECTIVE INVESTMENT FUNDS OF FIRST MERCANTILE TRUST COMPANY FMT/DFA Emerging Markets Value Fund
Statement of Changes in Net Assets For the Year Ended December 31, 2015
The accompanying notes are an integral part of these financial statements.
Operations
Net investment income $ 179,817
Net realized loss from investments sold (826,569)
Change in net unrealized appreciation (depreciation) on investments (2,141,232)
Other operating credits (charges) 80
Net decrease in net assets resulting from operations (2,787,904) Participant transactions
Proceeds from units purchased 3,342,999Less payments for units redeemed 9,567,179
Decrease in net assets from participant transactions (6,224,180)
Total decrease in net assets (9,012,084) Net assets at beginning of year 20,064,311 Net assets at end of year $ 11,052,227
676

THE COLLECTIVE INVESTMENT FUNDS OF FIRST MERCANTILE TRUST COMPANY FMT/DFA Emerging Markets Value Fund
Schedule of Investments and Specific Fund Disclosures December 31, 2015
The accompanying notes are an integral part of these financial statements.
Investments Shares Fair Value ____________ ____________
Mutual fund (100.0%)
DFA Emerging Markets Value Portfolio I Fund (Cost $14,790,569) 541,850 $ 11,053,742 _____________________
Specific Fund Disclosures Fair value The inputs or methodology used for valuing securities may not be indicative of the risks associated with investing in those securities. For more information on valuation inputs, and their aggregation into the levels used in the table below, please refer to note 4 to the financial statements. The following table sets forth by level, within the fair value hierarchy, the Fund's investments measured at fair value.
Total Level 1 Level 2 Level 3
Mutual fund - Diversified Emerging Markets $ 11,053,742 $ 11,053,742 $ — $ —__________ __________ __________ ___________________ ___________ ___________ __________
Investment transactions The aggregate cost of purchases of investment securities and proceeds from sales of investment securities (other than temporary cash investments) totaled $1,282,013 and $7,336,681, respectively, for the year ended December 31, 2015. Class-specific expenses Class-specific trustee fees for the year ended December 31, 2015 were as follows: Class R1 $ 5,639 Class R2 4,839 Class R3 558 Class R4 3,331 Class R5 3,992 Class R6 4,440 Class R7 1,749 Class R8 1,043 Class LifeStyle 68,788 $ 94,379
677

THE COLLECTIVE INVESTMENT FUNDS OF FIRST MERCANTILE TRUST COMPANY FMT/DFA Emerging Markets Value Fund
Schedule of Participant Transactions December 31, 2015
The accompanying notes are an integral part of these financial statements.
Participant transactions by class for the year ended December 31, 2015 were as follows: Dollars Units Purchases Redemptions Net change Purchases Redemptions Net change Class R1 $ 344,087 $ (992,818) $ (648,731) 27,432 (74,927) (47,495)Class R2 233,783 (1,225,780) (991,997) 23,988 (123,123) (99,135)Class R3 5,956 (297,654) (291,698) 664 (33,258) (32,594)Class R4 152,634 (66,845) 85,789 16,797 (6,594) 10,203Class R5 142,584 (386,893) (244,309) 15,064 (39,077) (24,013)Class R6 43,723 (121,870) (78,147) 4,897 (13,511) (8,614)Class R7 61,392 (18,994) 42,398 6,806 (2,064) 4,742Class R8 40,288 (75,114) (34,826) 4,413 (8,013) (3,600)Class LifeStyle 2,318,552 (6,381,211) (4,062,659) — — — $ 3,342,999 $ (9,567,179) $ (6,224,180) 100,061 (300,567) (200,506)
678

THE COLLECTIVE INVESTMENT FUNDS OF FIRST MERCANTILE TRUST COMPANY FMT/DFA Emerging Markets Value Fund
Financial Highlights December 31, 2015
The accompanying notes are an integral part of these financial statements.
Change in Net Asset Value Resulting from Operations Ratios (to average net
assets)
NAV per Unit, Beginning of
Period
Net Investment
Income (Loss)(a)
Net Realized and Unrealized
Gain (Loss) from
Investments(a)
Total from Investment Activities
NAV per Unit, End of
Period Total
Return Expenses
Net Investment
Income (Loss)
Class R1 $ 13.8450 $ 0.1959 $ (2.8401) $ (2.6442) $ 11.2008 (19.10)% (0.40)% 1.48%Class R2 10.2376 0.0645 (2.0387) (1.9742) 8.2634 (19.28)% (0.62)% 0.63%Class R3 9.0067 0.0239 (1.7730) (1.7491) 7.2576 (19.42)% (0.79)% 0.27%Class R4 10.5905 0.1407 (2.2117) (2.0710) 8.5195 (19.56)% (0.96)% 1.41%Class R5 10.2366 0.0812 (2.0970) (2.0158) 8.2208 (19.69)% (1.13)% 0.84%Class R6 10.1834 0.0479 (2.0673) (2.0194) 8.1640 (19.83)% (1.30)% 0.49%Class R7 9.9761 0.0708 (2.0629) (1.9921) 7.9840 (19.97)% (1.47)% 0.75%Class R8 9.9835 0.0390 (2.0463) (2.0073) 7.9762 (20.11)% (1.64)% 0.42%
(a) Per unit amounts are based on average daily units outstanding.
679

FMT/DFA Global Equity Fund

THE COLLECTIVE INVESTMENT FUNDS OF FIRST MERCANTILE TRUST COMPANY FMT/DFA Global Equity Fund
Statement of Assets and Liabilities December 31, 2015
The accompanying notes are an integral part of these financial statements.
Assets Investments in securities, at fair value $ 2,408,049 Liabilities Trustee fees 1,223 Net assets $ 2,406,826 Components of net assets
Units of
Participation NAV
per Unit Net
Assets Class R1 89,245 $ 13.5116 $ 1,205,849Class R2 56,200 $ 9.6777 543,885Class R3 806 $ 13.4891 10,874Class R4 7,802 $ 14.1997 110,787Class R5 35,840 $ 14.9114 534,431Class R6 105 $ 9.5234 1,000
$ 2,406,826
680

THE COLLECTIVE INVESTMENT FUNDS OF FIRST MERCANTILE TRUST COMPANY FMT/DFA Global Equity Fund
Statement of Operations For the Year Ended December 31, 2015
The accompanying notes are an integral part of these financial statements.
Investment income
Dividends $ 46,161 Expenses
Trustee fees 14,302Audit fees 1,200Custody fees 797
16,299 Net investment income 29,862 Net realized gain from investments sold
Proceeds from sales of investments 364,152Cost of investments sold 319,816
Net realized gain from investments sold 44,336 Change in net unrealized appreciation (depreciation) on investments (169,161) Net realized and unrealized loss on investments (124,825) Net decrease in net assets resulting from operations $ (94,963)
681

THE COLLECTIVE INVESTMENT FUNDS OF FIRST MERCANTILE TRUST COMPANY FMT/DFA Global Equity Fund
Statement of Changes in Net Assets For the Year Ended December 31, 2015
The accompanying notes are an integral part of these financial statements.
Operations
Net investment income $ 29,862
Net realized gain from investments sold 44,336
Change in net unrealized appreciation (depreciation) on investments (169,161)
Net decrease in net assets resulting from operations (94,963) Participant transactions
Proceeds from units purchased 1,192,474Less payments for units redeemed 485,344
Increase in net assets from participant transactions 707,130
Total increase in net assets 612,167 Net assets at beginning of year 1,794,659 Net assets at end of year $ 2,406,826
682

THE COLLECTIVE INVESTMENT FUNDS OF FIRST MERCANTILE TRUST COMPANY FMT/DFA Global Equity Fund
Schedule of Investments and Specific Fund Disclosures December 31, 2015
The accompanying notes are an integral part of these financial statements.
Investments Shares Fair Value ____________ ____________
Mutual fund (100.1%) DFA Global Equity Portfolio Fund (Cost $2,276,163) 136,899 $ 2,408,049 ____________________ Specific Fund Disclosures Fair value The inputs or methodology used for valuing securities may not be indicative of the risks associated with investing in those securities. For more information on valuation inputs, and their aggregation into the levels used in the table below, please refer to note 4 to the financial statements. The following table sets forth by level, within the fair value hierarchy, the Fund's investments measured at fair value.
Total Level 1 Level 2 Level 3
Mutual fund - Global Core Equity $ 2,408,049 $ 2,408,049 $ — $ —__________ ___________ ___________ ____________________ ___________ ___________ __________ Investment transactions The aggregate cost of purchases of investment securities and proceeds from sales of investment securities (other than temporary cash investments) totaled $1,101,437 and $364,152, respectively, for the year ended December 31, 2015. Class-specific expenses Class-specific trustee fees for the year ended December 31, 2015 were as follows: Class R1 $ 4,262 Class R2 3,123 Class R3 78 Class R4 309 Class R5 6,514 Class R6 16 $ 14,302
683

THE COLLECTIVE INVESTMENT FUNDS OF FIRST MERCANTILE TRUST COMPANY FMT/DFA Global Equity Fund
Schedule of Participant Transactions December 31, 2015
The accompanying notes are an integral part of these financial statements.
Participant transactions by class for the year ended December 31, 2015 were as follows: Dollars Units Purchases Redemptions Net change Purchases Redemptions Net change Class R1 $ 332,214 $ (116,499) $ 215,715 23,331 (8,398) 14,933Class R2 105,232 (75,065) 30,167 10,209 (7,309) 2,900Class R3 1,644 (13) 1,631 116 (1) 115Class R4 113,880 (28,866) 85,014 7,768 (1,865) 5,903Class R5 506,596 (133,618) 372,978 32,477 (8,675) 23,802Class R6 132,908 (131,283) 1,625 13,291 (13,186) 105 $ 1,192,474 $ (485,344) $ 707,130 87,192 (39,434) 47,758
684
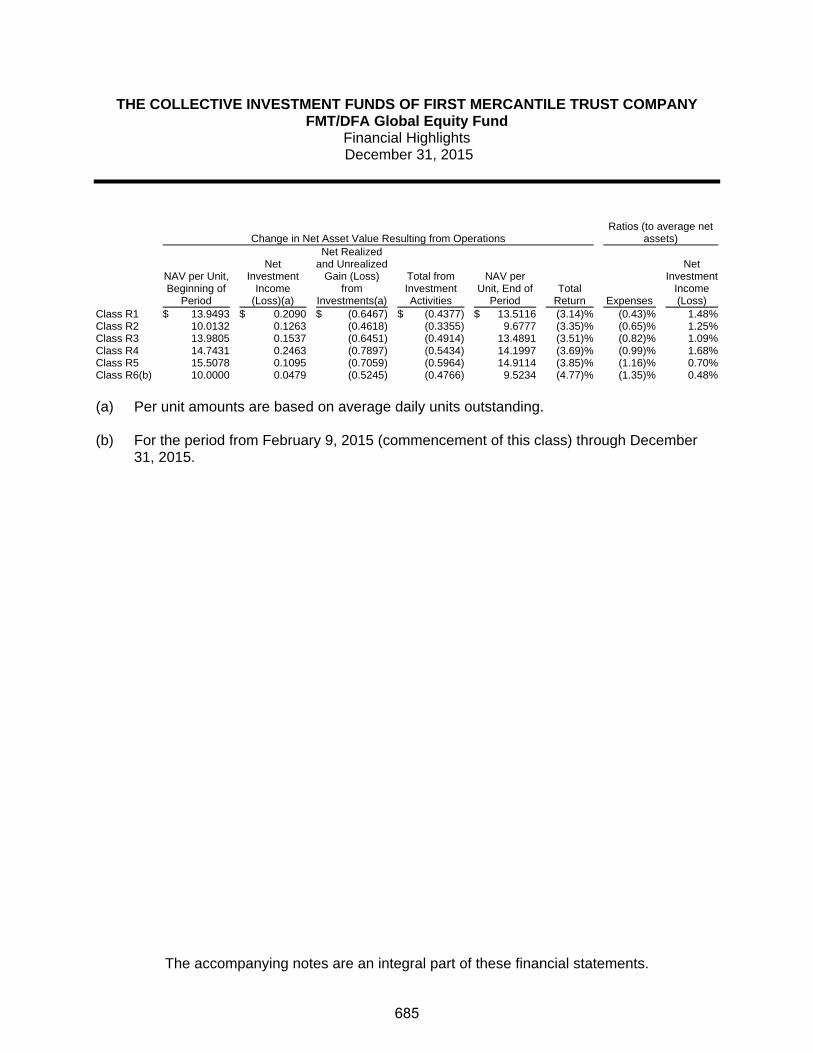
THE COLLECTIVE INVESTMENT FUNDS OF FIRST MERCANTILE TRUST COMPANY FMT/DFA Global Equity Fund
Financial Highlights December 31, 2015
The accompanying notes are an integral part of these financial statements.
Change in Net Asset Value Resulting from Operations Ratios (to average net
assets)
NAV per Unit, Beginning of
Period
Net Investment
Income (Loss)(a)
Net Realized and Unrealized
Gain (Loss) from
Investments(a)
Total from Investment Activities
NAV per Unit, End of
Period Total
Return Expenses
Net Investment
Income (Loss)
Class R1 $ 13.9493 $ 0.2090 $ (0.6467) $ (0.4377) $ 13.5116 (3.14)% (0.43)% 1.48%Class R2 10.0132 0.1263 (0.4618) (0.3355) 9.6777 (3.35)% (0.65)% 1.25%Class R3 13.9805 0.1537 (0.6451) (0.4914) 13.4891 (3.51)% (0.82)% 1.09%Class R4 14.7431 0.2463 (0.7897) (0.5434) 14.1997 (3.69)% (0.99)% 1.68%Class R5 15.5078 0.1095 (0.7059) (0.5964) 14.9114 (3.85)% (1.16)% 0.70%Class R6(b) 10.0000 0.0479 (0.5245) (0.4766) 9.5234 (4.77)% (1.35)% 0.48%
(a) Per unit amounts are based on average daily units outstanding.
(b) For the period from February 9, 2015 (commencement of this class) through December
31, 2015.
685
FMT/DFA International Core Equity Fund

THE COLLECTIVE INVESTMENT FUNDS OF FIRST MERCANTILE TRUST COMPANY FMT/DFA International Core Equity Fund
Statement of Assets and Liabilities December 31, 2015
The accompanying notes are an integral part of these financial statements.
Assets Investments in securities, at fair value $ 18,046,985 Liabilities Trustee fees 9,938 Net assets $ 18,037,047 Components of net assets
Units of
Participation NAV
per Unit Net
Assets Class R1 571,353 $ 13.5370 $ 7,734,439Class R2 113,529 $ 13.1671 1,494,849Class R3 311,237 $ 12.9277 4,023,582Class R4 192,635 $ 13.2382 2,550,137Class R5 28,801 $ 13.5833 391,209Class R6 109,172 $ 12.3729 1,350,770Class R7 18,818 $ 12.6281 237,642Class R8 21,164 $ 12.0216 254,419
$ 18,037,047
686

THE COLLECTIVE INVESTMENT FUNDS OF FIRST MERCANTILE TRUST COMPANY FMT/DFA International Core Equity Fund
Statement of Operations For the Year Ended December 31, 2015
The accompanying notes are an integral part of these financial statements.
Investment income
Dividends $ 491,596 Expenses
Trustee fees 132,111Custody fees 7,353Audit fees 1,200
140,664 Net investment income 350,932 Net realized gain from investments sold
Proceeds from sales of investments 7,498,075Cost of investments sold 6,789,348
Net realized gain from investments sold 708,727 Change in net unrealized appreciation (depreciation) on investments (960,154) Net realized and unrealized loss on investments (251,427) Net increase in net assets resulting from operations $ 99,505
687

THE COLLECTIVE INVESTMENT FUNDS OF FIRST MERCANTILE TRUST COMPANY FMT/DFA International Core Equity Fund
Statement of Changes in Net Assets For the Year Ended December 31, 2015
The accompanying notes are an integral part of these financial statements.
Operations
Net investment income $ 350,932
Net realized gain from investments sold 708,727
Change in net unrealized appreciation (depreciation) on investments (960,154)
Net increase in net assets resulting from operations 99,505 Participant transactions
Proceeds from units purchased 8,248,866Less payments for units redeemed 11,924,228
Decrease in net assets from participant transactions (3,675,362)
Total decrease in net assets (3,575,857) Net assets at beginning of year 21,612,904 Net assets at end of year $ 18,037,047
688

THE COLLECTIVE INVESTMENT FUNDS OF FIRST MERCANTILE TRUST COMPANY FMT/DFA International Core Equity Fund
Schedule of Investments and Specific Fund Disclosures December 31, 2015
The accompanying notes are an integral part of these financial statements.
Investments Shares Fair Value ____________ ____________
Mutual fund (100.1%)
DFA International Core Equity Portfolio Fund (Cost $17,631,425) 1,584,459 $ 18,046,985 ____________________
Specific Fund Disclosures Fair value The inputs or methodology used for valuing securities may not be indicative of the risks associated with investing in those securities. For more information on valuation inputs, and their aggregation into the levels used in the table below, please refer to note 4 to the financial statements. The following table sets forth by level, within the fair value hierarchy, the Fund's investments measured at fair value.
Total Level 1 Level 2 Level 3
Mutual fund - International Core Equity $ 18,046,985 $ 18,046,985 $ — $ —__________ ___________ ___________ ____________________ ___________ ___________ __________
Investment transactions The aggregate cost of purchases of investment securities and proceeds from sales of investment securities (other than temporary cash investments) totaled $4,172,002 and $7,498,075, respectively, for the year ended December 31, 2015. Class-specific expenses Class-specific trustee fees for the year ended December 31, 2015 were as follows: Class R1 $ 32,096 Class R2 9,336 Class R3 36,675 Class R4 19,973 Class R5 7,929 Class R6 19,028 Class R7 3,277 Class R8 3,797 $ 132,111
689

THE COLLECTIVE INVESTMENT FUNDS OF FIRST MERCANTILE TRUST COMPANY FMT/DFA International Core Equity Fund
Schedule of Participant Transactions December 31, 2015
The accompanying notes are an integral part of these financial statements.
Participant transactions by class for the year ended December 31, 2015 were as follows: Dollars Units Purchases Redemptions Net change Purchases Redemptions Net change Class R1 $ 3,585,227 $ (5,941,694) $ (2,356,467) 255,120 (418,421) (163,301)Class R2 622,787 (1,075,855) (453,068) 45,153 (75,842) (30,689)Class R3 1,410,015 (2,236,506) (826,491) 104,986 (165,569) (60,583)Class R4 1,441,172 (1,100,632) 340,540 105,069 (78,794) 26,275Class R5 116,248 (674,414) (558,166) 8,374 (47,780) (39,406)Class R6 828,049 (669,370) 158,679 65,121 (50,120) 15,001Class R7 187,754 (217,125) (29,371) 13,931 (16,724) (2,793)Class R8 57,614 (8,632) 48,982 4,628 (668) 3,960 $ 8,248,866 $ (11,924,228) $ (3,675,362) 602,382 (853,918) (251,536)
690

THE COLLECTIVE INVESTMENT FUNDS OF FIRST MERCANTILE TRUST COMPANY FMT/DFA International Core Equity Fund
Financial Highlights December 31, 2015
The accompanying notes are an integral part of these financial statements.
Change in Net Asset Value Resulting from Operations Ratios (to average net
assets)
NAV per Unit, Beginning of
Period
Net Investment
Income (Loss)(a)
Net Realized and Unrealized
Gain (Loss) from
Investments(a)
Total from Investment Activities
NAV per Unit, End of
Period Total
Return Expenses
Net Investment
Income (Loss)
Class R1 $ 13.6190 $ 0.2805 $ (0.3625) $ (0.0820) $ 13.5370 (0.60)% (0.39)% 1.99%Class R2 13.2761 0.2422 (0.3512) (0.1090) 13.1671 (0.82)% (0.61)% 1.76%Class R3 13.0570 0.2149 (0.3442) (0.1293) 12.9277 (0.99)% (0.78)% 1.59%Class R4 13.3934 0.2019 (0.3571) (0.1552) 13.2382 (1.16)% (0.95)% 1.46%Class R5 13.7661 0.1686 (0.3514) (0.1828) 13.5833 (1.33)% (1.12)% 1.19%Class R6 12.5608 0.1415 (0.3294) (0.1879) 12.3729 (1.50)% (1.29)% 1.09%Class R7 12.8417 0.1224 (0.3360) (0.2136) 12.6281 (1.66)% (1.46)% 0.93%Class R8 12.2459 0.0953 (0.3196) (0.2243) 12.0216 (1.83)% (1.63)% 0.76%
(a) Per unit amounts are based on average daily units outstanding.
691

FMT/DFA International Small Cap Value Fund
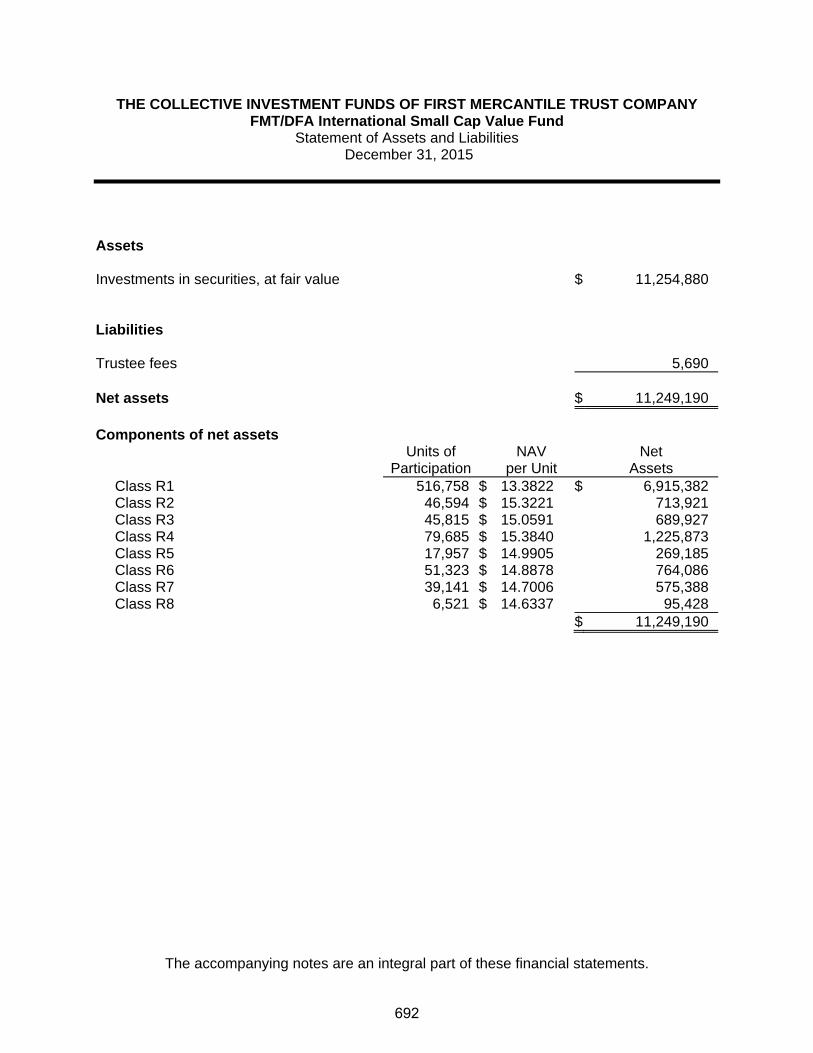
THE COLLECTIVE INVESTMENT FUNDS OF FIRST MERCANTILE TRUST COMPANY FMT/DFA International Small Cap Value Fund
Statement of Assets and Liabilities December 31, 2015
The accompanying notes are an integral part of these financial statements.
Assets Investments in securities, at fair value $ 11,254,880 Liabilities Trustee fees 5,690 Net assets $ 11,249,190 Components of net assets
Units of
Participation NAV
per Unit Net
Assets Class R1 516,758 $ 13.3822 $ 6,915,382Class R2 46,594 $ 15.3221 713,921Class R3 45,815 $ 15.0591 689,927Class R4 79,685 $ 15.3840 1,225,873Class R5 17,957 $ 14.9905 269,185Class R6 51,323 $ 14.8878 764,086Class R7 39,141 $ 14.7006 575,388Class R8 6,521 $ 14.6337 95,428
$ 11,249,190
692

THE COLLECTIVE INVESTMENT FUNDS OF FIRST MERCANTILE TRUST COMPANY FMT/DFA International Small Cap Value Fund
Statement of Operations For the Year Ended December 31, 2015
The accompanying notes are an integral part of these financial statements.
Investment income
Dividends $ 394,238 Expenses
Trustee fees 78,312Custody fees 4,554Audit fees 1,200
84,066 Net investment income 310,172 Net realized gain from investments sold
Proceeds from sales of investments 3,958,097Cost of investments sold 3,377,007
Net realized gain from investments sold 581,090 Change in net unrealized appreciation (depreciation) on investments (365,038) Net realized and unrealized gain on investments 216,052 Net increase in net assets resulting from operations $ 526,224
693

THE COLLECTIVE INVESTMENT FUNDS OF FIRST MERCANTILE TRUST COMPANY FMT/DFA International Small Cap Value Fund
Statement of Changes in Net Assets For the Year Ended December 31, 2015
The accompanying notes are an integral part of these financial statements.
Operations
Net investment income $ 310,172
Net realized gain from investments sold 581,090
Change in net unrealized appreciation (depreciation) on investments (365,038)
Net increase in net assets resulting from operations 526,224 Participant transactions
Proceeds from units purchased 4,089,643Less payments for units redeemed 7,128,354
Decrease in net assets from participant transactions (3,038,711)
Total decrease in net assets (2,512,487) Net assets at beginning of year 13,761,677 Net assets at end of year $ 11,249,190
694

THE COLLECTIVE INVESTMENT FUNDS OF FIRST MERCANTILE TRUST COMPANY FMT/DFA International Small Cap Value Fund
Schedule of Investments and Specific Fund Disclosures December 31, 2015
The accompanying notes are an integral part of these financial statements.
Investments Shares Fair Value ____________ ____________
Mutual fund (100.1%)
DFA International Small Cap Value Portfolio Fund (Cost $10,186,108) 602,510 $ 11,254,880 ______________________
Specific Fund Disclosures Fair value The inputs or methodology used for valuing securities may not be indicative of the risks associated with investing in those securities. For more information on valuation inputs, and their aggregation into the levels used in the table below, please refer to note 4 to the financial statements. The following table sets forth by level, within the fair value hierarchy, the Fund's investments measured at fair value.
Total Level 1 Level 2 Level 3
Mutual fund - International Small Cap $ 11,254,880 $ 11,254,880 $ — $ —__________ ___________ ___________ ____________________ ___________ ___________ __________
Investment transactions The aggregate cost of purchases of investment securities and proceeds from sales of investment securities (other than temporary cash investments) totaled $1,227,922 and $3,958,097, respectively, for the year ended December 31, 2015. Class-specific expenses Class-specific trustee fees for the year ended December 31, 2015 were as follows: Class R1 $ 25,163 Class R2 3,934 Class R3 13,229 Class R4 9,693 Class R5 5,215 Class R6 10,620 Class R7 6,622 Class R8 3,836 $ 78,312
695

THE COLLECTIVE INVESTMENT FUNDS OF FIRST MERCANTILE TRUST COMPANY FMT/DFA International Small Cap Value Fund
Schedule of Participant Transactions December 31, 2015
The accompanying notes are an integral part of these financial statements.
Participant transactions by class for the year ended December 31, 2015 were as follows: Dollars Units Purchases Redemptions Net change Purchases Redemptions Net change Class R1 $ 2,083,449 $ (3,023,591) $ (940,142) 151,966 (220,937) (68,971)Class R2 218,691 (241,507) (22,816) 13,925 (15,392) (1,467)Class R3 330,950 (1,998,521) (1,667,571) 21,406 (129,386) (107,980)Class R4 702,099 (397,952) 304,147 44,987 (25,265) 19,722Class R5 95,855 (724,317) (628,462) 6,320 (48,156) (41,836)Class R6 286,054 (332,242) (46,188) 19,313 (21,396) (2,083)Class R7 340,413 (143,676) 196,737 21,931 (9,823) 12,108Class R8 32,132 (266,548) (234,416) 2,144 (17,089) (14,945) $ 4,089,643 $ (7,128,354) $ (3,038,711) 281,992 (487,444) (205,452)
696

THE COLLECTIVE INVESTMENT FUNDS OF FIRST MERCANTILE TRUST COMPANY FMT/DFA International Small Cap Value Fund
Financial Highlights December 31, 2015
The accompanying notes are an integral part of these financial statements.
Change in Net Asset Value Resulting from Operations Ratios (to average net
assets)
NAV per Unit, Beginning of
Period
Net Investment
Income (Loss)(a)
Net Realized and Unrealized
Gain (Loss) from
Investments(a)
Total from Investment Activities
NAV per Unit, End of
Period Total
Return Expenses
Net Investment
Income (Loss)
Class R1 $ 12.9199 $ 0.4019 $ 0.0604 $ 0.4623 $ 13.3822 3.58% (0.40)% 2.94%Class R2 14.8254 0.4419 0.0548 0.4967 15.3221 3.35% (0.62)% 2.83%Class R3 14.5959 0.1445 0.3187 0.4632 15.0591 3.17% (0.79)% 0.94%Class R4 14.9361 0.4411 0.0068 0.4479 15.3840 3.00% (0.95)% 2.80%Class R5 14.5789 0.1630 0.2486 0.4116 14.9905 2.82% (1.13)% 1.07%Class R6 14.5037 0.2747 0.1094 0.3841 14.8878 2.65% (1.30)% 1.80%Class R7 14.3456 0.3768 (0.0218) 0.3550 14.7006 2.47% (1.46)% 2.51%Class R8 14.3059 0.0200 0.3078 0.3278 14.6337 2.29% (1.64)% 0.13%
(a) Per unit amounts are based on average daily units outstanding.
697

FMT/DFA International Small Company Fund

THE COLLECTIVE INVESTMENT FUNDS OF FIRST MERCANTILE TRUST COMPANY FMT/DFA International Small Company Fund
Statement of Assets and Liabilities December 31, 2015
The accompanying notes are an integral part of these financial statements.
Assets Investments in securities, at fair value $ 2,119,190 Liabilities Trustee fees 1,308 Net assets $ 2,117,882 Components of net assets
Units of
Participation NAV
per Unit Net
Assets Class R1 29,179 $ 26.6050 $ 776,315Class R2 23,139 $ 14.3873 332,914Class R3 14,698 $ 13.0563 191,902Class R4 18,625 $ 14.8675 276,905Class R5 20,341 $ 14.0639 286,079Class R6 10,039 $ 13.9675 140,218Class R7 7,284 $ 14.2113 103,516Class R8 727 $ 13.8049 10,033
$ 2,117,882
698
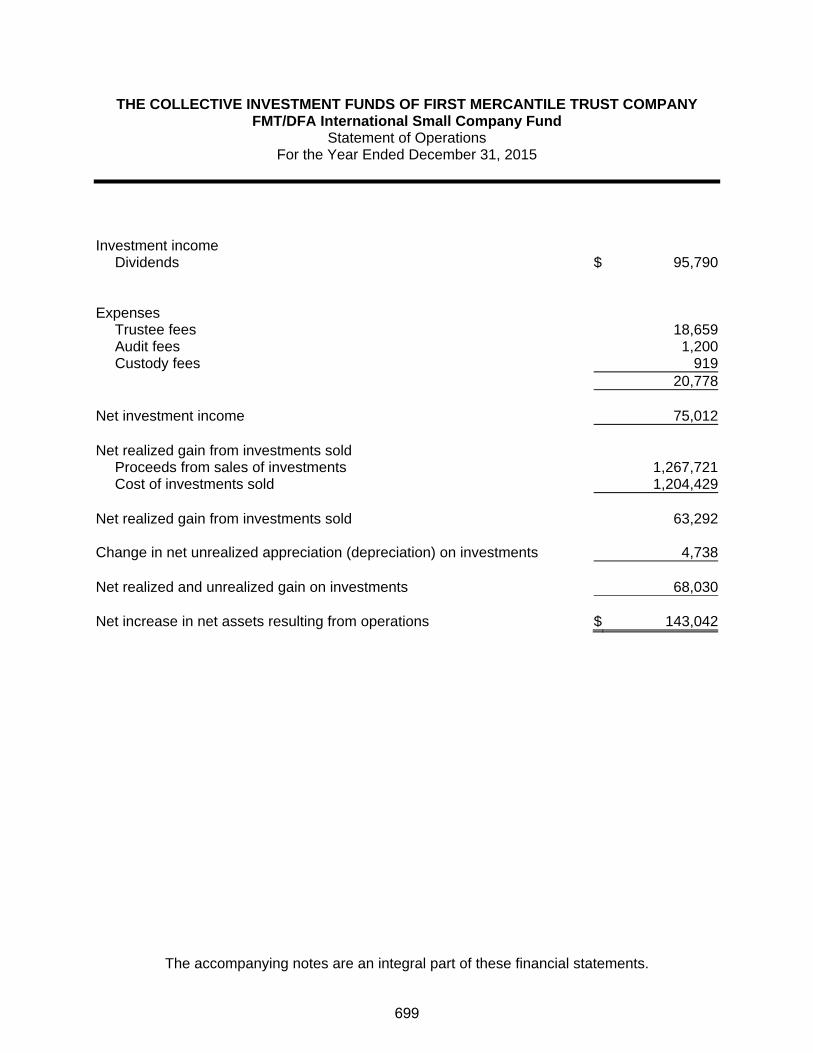
THE COLLECTIVE INVESTMENT FUNDS OF FIRST MERCANTILE TRUST COMPANY FMT/DFA International Small Company Fund
Statement of Operations For the Year Ended December 31, 2015
The accompanying notes are an integral part of these financial statements.
Investment income
Dividends $ 95,790 Expenses
Trustee fees 18,659Audit fees 1,200Custody fees 919
20,778 Net investment income 75,012 Net realized gain from investments sold
Proceeds from sales of investments 1,267,721Cost of investments sold 1,204,429
Net realized gain from investments sold 63,292 Change in net unrealized appreciation (depreciation) on investments 4,738 Net realized and unrealized gain on investments 68,030 Net increase in net assets resulting from operations $ 143,042
699

THE COLLECTIVE INVESTMENT FUNDS OF FIRST MERCANTILE TRUST COMPANY FMT/DFA International Small Company Fund
Statement of Changes in Net Assets For the Year Ended December 31, 2015
The accompanying notes are an integral part of these financial statements.
Operations
Net investment income $ 75,012
Net realized gain from investments sold 63,292
Change in net unrealized appreciation (depreciation) on investments 4,738
Net increase in net assets resulting from operations 143,042 Participant transactions
Proceeds from units purchased 554,802Less payments for units redeemed 1,513,668
Decrease in net assets from participant transactions (958,866)
Total decrease in net assets (815,824) Net assets at beginning of year 2,933,706 Net assets at end of year $ 2,117,882
700
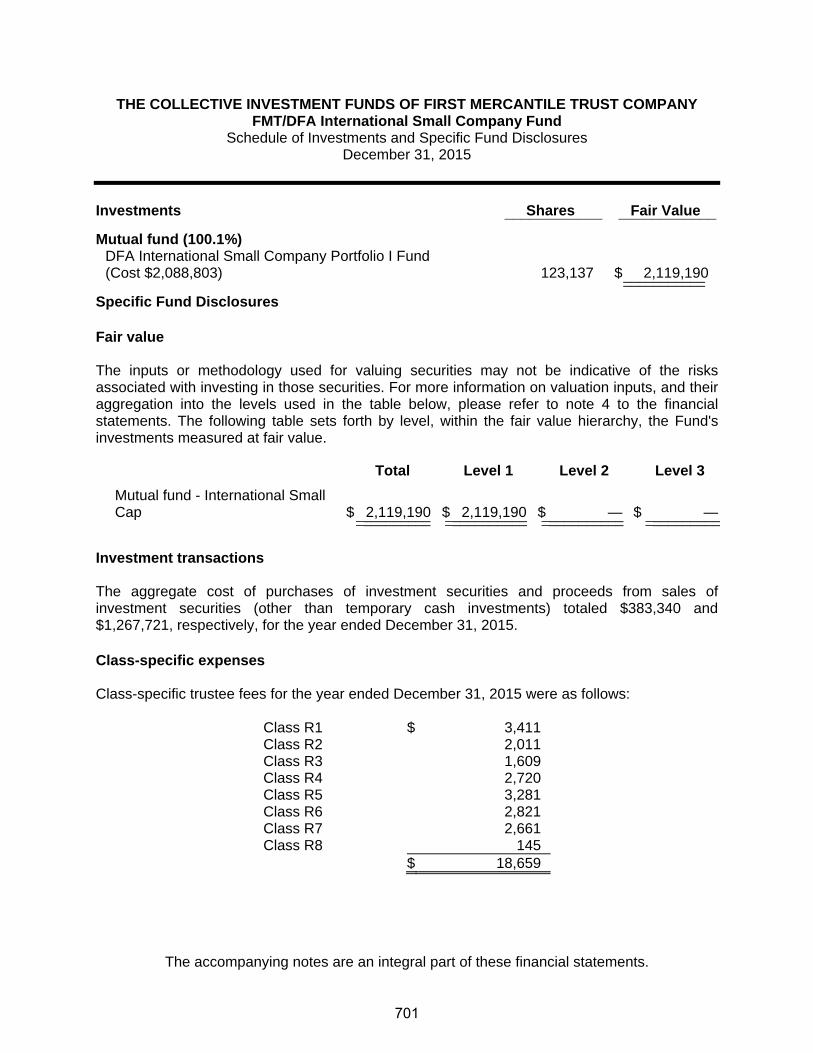
THE COLLECTIVE INVESTMENT FUNDS OF FIRST MERCANTILE TRUST COMPANY FMT/DFA International Small Company Fund
Schedule of Investments and Specific Fund Disclosures December 31, 2015
The accompanying notes are an integral part of these financial statements.
Investments Shares Fair Value ____________ ____________
Mutual fund (100.1%)
DFA International Small Company Portfolio I Fund (Cost $2,088,803) 123,137 $ 2,119,190 ______________________
Specific Fund Disclosures Fair value The inputs or methodology used for valuing securities may not be indicative of the risks associated with investing in those securities. For more information on valuation inputs, and their aggregation into the levels used in the table below, please refer to note 4 to the financial statements. The following table sets forth by level, within the fair value hierarchy, the Fund's investments measured at fair value.
Total Level 1 Level 2 Level 3
Mutual fund - International Small Cap $ 2,119,190 $ 2,119,190 $ — $ —__________ ___________ ___________ ____________________ ___________ ___________ __________
Investment transactions The aggregate cost of purchases of investment securities and proceeds from sales of investment securities (other than temporary cash investments) totaled $383,340 and $1,267,721, respectively, for the year ended December 31, 2015. Class-specific expenses Class-specific trustee fees for the year ended December 31, 2015 were as follows: Class R1 $ 3,411 Class R2 2,011 Class R3 1,609 Class R4 2,720 Class R5 3,281 Class R6 2,821 Class R7 2,661 Class R8 145 $ 18,659
701

THE COLLECTIVE INVESTMENT FUNDS OF FIRST MERCANTILE TRUST COMPANY FMT/DFA International Small Company Fund
Schedule of Participant Transactions December 31, 2015
The accompanying notes are an integral part of these financial statements.
Participant transactions by class for the year ended December 31, 2015 were as follows: Dollars Units Purchases Redemptions Net change Purchases Redemptions Net change Class R1 $ 252,992 $ (637,441) $ (384,449) 9,355 (24,239) (14,884)Class R2 81,778 (126,009) (44,231) 5,630 (8,492) (2,862)Class R3 59,272 (145,675) (86,403) 4,578 (10,922) (6,344)Class R4 89,193 (224,981) (135,788) 6,048 (15,240) (9,192)Class R5 32,950 (43,196) (10,246) 2,348 (3,085) (737)Class R6 25,281 (139,707) (114,426) 1,807 (9,980) (8,173)Class R7 11,341 (141,360) (130,019) 792 (9,736) (8,944)Class R8 1,995 (55,299) (53,304) 143 (4,172) (4,029) $ 554,802 $ (1,513,668) $ (958,866) 30,701 (85,866) (55,165)
702

THE COLLECTIVE INVESTMENT FUNDS OF FIRST MERCANTILE TRUST COMPANY FMT/DFA International Small Company Fund
Financial Highlights December 31, 2015
The accompanying notes are an integral part of these financial statements.
Change in Net Asset Value Resulting from Operations Ratios (to average net
assets)
NAV per Unit, Beginning of
Period
Net Investment
Income (Loss)(a)
Net Realized and Unrealized
Gain (Loss) from
Investments(a)
Total from Investment Activities
NAV per Unit, End of
Period Total
Return Expenses
Net Investment
Income (Loss)
Class R1 $ 25.2283 $ 0.8455 $ 0.5312 $ 1.3767 $ 26.6050 5.46% (0.43)% 3.18%Class R2 13.6729 0.4921 0.2223 0.7144 14.3873 5.22% (0.65)% 3.41%Class R3 12.4292 0.3976 0.2295 0.6271 13.0563 5.05% (0.82)% 3.04%Class R4 14.1775 0.4521 0.2379 0.6900 14.8675 4.87% (0.99)% 3.04%Class R5 13.4341 0.4110 0.2188 0.6298 14.0639 4.69% (1.16)% 2.91%Class R6 13.3647 0.2976 0.3052 0.6028 13.9675 4.51% (1.33)% 2.12%Class R7 13.6214 0.1859 0.4040 0.5899 14.2113 4.33% (1.50)% 1.29%Class R8 13.2541 0.4024 0.1484 0.5508 13.8049 4.16% (1.67)% 2.90%
(a) Per unit amounts are based on average daily units outstanding.
703
FMT/DFA International Value Fund

THE COLLECTIVE INVESTMENT FUNDS OF FIRST MERCANTILE TRUST COMPANY FMT/DFA International Value Fund Statement of Assets and Liabilities
December 31, 2015
The accompanying notes are an integral part of these financial statements.
Assets Investments in securities, at fair value $ 17,828,240 Liabilities Trustee fees 9,019 Net assets $ 17,819,221 Components of net assets
Units of
Participation NAV
per Unit Net
Assets Class R1 1,148,212 $ 9.2306 $ 10,598,742Class R2 85,114 $ 11.9155 1,014,175Class R3 133,817 $ 11.6959 1,565,108Class R4 152,818 $ 11.6073 1,773,797Class R5 78,546 $ 11.5355 906,061Class R6 90,416 $ 11.5505 1,044,351Class R7 71,643 $ 11.3988 816,645Class R8 8,636 $ 11.6196 100,342
$ 17,819,221
704

THE COLLECTIVE INVESTMENT FUNDS OF FIRST MERCANTILE TRUST COMPANY FMT/DFA International Value Fund
Statement of Operations For the Year Ended December 31, 2015
The accompanying notes are an integral part of these financial statements.
Investment income
Dividends $ 612,925 Expenses
Trustee fees 122,886Custody fees 7,178Audit fees 1,200
131,264 Net investment income 481,661 Net realized gain from investments sold
Proceeds from sales of investments 5,220,592Cost of investments sold 5,123,571
Net realized gain from investments sold 97,021 Change in net unrealized appreciation (depreciation) on investments (1,744,281) Net realized and unrealized loss on investments (1,647,260) Net decrease in net assets resulting from operations $ (1,165,599)
705

THE COLLECTIVE INVESTMENT FUNDS OF FIRST MERCANTILE TRUST COMPANY FMT/DFA International Value Fund Statement of Changes in Net Assets
For the Year Ended December 31, 2015
The accompanying notes are an integral part of these financial statements.
Operations
Net investment income $ 481,661
Net realized gain from investments sold 97,021
Change in net unrealized appreciation (depreciation) on investments (1,744,281)
Net decrease in net assets resulting from operations (1,165,599) Participant transactions
Proceeds from units purchased 5,366,863Less payments for units redeemed 8,078,273
Decrease in net assets from participant transactions (2,711,410)
Total decrease in net assets (3,877,009) Net assets at beginning of year 21,696,230 Net assets at end of year $ 17,819,221
706

THE COLLECTIVE INVESTMENT FUNDS OF FIRST MERCANTILE TRUST COMPANY FMT/DFA International Value Fund
Schedule of Investments and Specific Fund Disclosures December 31, 2015
The accompanying notes are an integral part of these financial statements.
Investments Shares Fair Value ____________ ____________
Mutual fund (100.1%)
DFA International Value Portfolio Fund (Cost $19,530,378) 1,112,180 $ 17,828,240 ______________________
Specific Fund Disclosures Fair value The inputs or methodology used for valuing securities may not be indicative of the risks associated with investing in those securities. For more information on valuation inputs, and their aggregation into the levels used in the table below, please refer to note 4 to the financial statements. The following table sets forth by level, within the fair value hierarchy, the Fund's investments measured at fair value.
Total Level 1 Level 2 Level 3
Mutual fund - International Value $ 17,828,240 $ 17,828,240 $ — $ —__________ ___________ ___________ ____________________ ___________ ___________ __________ Investment transactions The aggregate cost of purchases of investment securities and proceeds from sales of investment securities (other than temporary cash investments) totaled $2,988,358 and $5,220,592, respectively, for the year ended December 31, 2015. Class-specific expenses Class-specific trustee fees for the year ended December 31, 2015 were as follows: Class R1 $ 39,931 Class R2 5,621 Class R3 20,106 Class R4 16,414 Class R5 11,599 Class R6 15,436 Class R7 10,360 Class R8 3,419 $ 122,886
707

THE COLLECTIVE INVESTMENT FUNDS OF FIRST MERCANTILE TRUST COMPANY FMT/DFA International Value Fund Schedule of Participant Transactions
December 31, 2015
The accompanying notes are an integral part of these financial statements.
Participant transactions by class for the year ended December 31, 2015 were as follows: Dollars Units Purchases Redemptions Net change Purchases Redemptions Net change Class R1 $ 2,910,792 $ (3,570,140) $ (659,348) 297,028 (357,237) (60,209)Class R2 348,052 (303,880) 44,172 27,352 (22,687) 4,665Class R3 499,528 (2,046,531) (1,547,003) 39,535 (161,088) (121,553)Class R4 511,105 (846,215) (335,110) 41,233 (64,915) (23,682)Class R5 347,762 (485,900) (138,138) 27,355 (38,418) (11,063)Class R6 342,205 (481,171) (138,966) 27,436 (36,969) (9,533)Class R7 368,890 (138,575) 230,315 29,091 (11,152) 17,939Class R8 38,529 (205,861) (167,332) 3,052 (15,424) (12,372) $ 5,366,863 $ (8,078,273) $ (2,711,410) 492,082 (707,890) (215,808)
708

THE COLLECTIVE INVESTMENT FUNDS OF FIRST MERCANTILE TRUST COMPANY FMT/DFA International Value Fund
Financial Highlights December 31, 2015
The accompanying notes are an integral part of these financial statements.
Change in Net Asset Value Resulting from Operations Ratios (to average net
assets)
NAV per Unit, Beginning of
Period
Net Investment
Income (Loss)(a)
Net Realized and Unrealized
Gain (Loss) from
Investments(a)
Total from Investment Activities
NAV per Unit, End of
Period Total
Return Expenses
Net Investment
Income (Loss)
Class R1 $ 9.8917 $ 0.2703 $ (0.9314) $ (0.6611) $ 9.2306 (6.68)% (0.39)% 2.67%Class R2 12.7971 0.3250 (1.2066) (0.8816) 11.9155 (6.89)% (0.61)% 2.50%Class R3 12.5829 0.2710 (1.1580) (0.8870) 11.6959 (7.05)% (0.78)% 2.10%Class R4 12.5089 0.2705 (1.1721) (0.9016) 11.6073 (7.21)% (0.95)% 2.13%Class R5 12.4528 0.2383 (1.1556) (0.9173) 11.5355 (7.37)% (1.12)% 1.88%Class R6 12.4904 0.2200 (1.1599) (0.9399) 11.5505 (7.53)% (1.29)% 1.73%Class R7 12.3473 0.2103 (1.1588) (0.9485) 11.3988 (7.68)% (1.46)% 1.69%Class R8 12.6092 0.1570 (1.1466) (0.9896) 11.6196 (7.85)% (1.63)% 1.20%
(a) Per unit amounts are based on average daily units outstanding.
709

FMT/DFA U.S. Core Equity I Fund

THE COLLECTIVE INVESTMENT FUNDS OF FIRST MERCANTILE TRUST COMPANY FMT/DFA U.S. Core Equity I Fund Statement of Assets and Liabilities
December 31, 2015
The accompanying notes are an integral part of these financial statements.
Assets Investments in securities, at fair value $ 3,972,493 Liabilities Trustee fees 2,806 Net assets $ 3,969,687 Components of net assets
Units of
Participation NAV
per Unit Net
Assets Class R1 91,168 $ 15.1186 $ 1,378,327Class R2 23,998 $ 17.1231 410,922Class R3 200 $ 10.0173 2,003Class R4 81,501 $ 15.9924 1,303,405Class R5 4,775 $ 16.8625 80,525Class R6 29,810 $ 16.1942 482,756Class R7 18,697 $ 16.3456 305,609Class R8 377 $ 16.2896 6,140
$ 3,969,687
710

THE COLLECTIVE INVESTMENT FUNDS OF FIRST MERCANTILE TRUST COMPANY FMT/DFA U.S. Core Equity I Fund
Statement of Operations For the Year Ended December 31, 2015
The accompanying notes are an integral part of these financial statements.
Investment income
Dividends $ 164,801 Expenses
Trustee fees 47,949Custody fees 3,225Audit fees 1,200
52,374 Net investment income 112,427 Net realized gain from investments sold
Proceeds from sales of investments 8,983,046Cost of investments sold 6,077,835
Net realized gain from investments sold 2,905,211 Change in net unrealized appreciation (depreciation) on investments (3,117,300) Net realized and unrealized loss on investments (212,089) Net decrease in net assets resulting from operations $ (99,662)
711

THE COLLECTIVE INVESTMENT FUNDS OF FIRST MERCANTILE TRUST COMPANY FMT/DFA U.S. Core Equity I Fund Statement of Changes in Net Assets
For the Year Ended December 31, 2015
The accompanying notes are an integral part of these financial statements.
Operations
Net investment income $ 112,427
Net realized gain from investments sold 2,905,211
Change in net unrealized appreciation (depreciation) on investments (3,117,300)
Net decrease in net assets resulting from operations (99,662) Participant transactions
Proceeds from units purchased 1,661,667Less payments for units redeemed 9,887,241
Decrease in net assets from participant transactions (8,225,574)
Total decrease in net assets (8,325,236) Net assets at beginning of year 12,294,923 Net assets at end of year $ 3,969,687
712

THE COLLECTIVE INVESTMENT FUNDS OF FIRST MERCANTILE TRUST COMPANY FMT/DFA U.S. Core Equity I Fund
Schedule of Investments and Specific Fund Disclosures December 31, 2015
The accompanying notes are an integral part of these financial statements.
Investments Shares Fair Value ____________ ____________
Mutual fund (100.1%) DFA U.S. Core Equity I Portfolio Fund (Cost $2,908,801) 231,362 $ 3,972,493 ______________________ Specific Fund Disclosures Fair value The inputs or methodology used for valuing securities may not be indicative of the risks associated with investing in those securities. For more information on valuation inputs, and their aggregation into the levels used in the table below, please refer to note 4 to the financial statements. The following table sets forth by level, within the fair value hierarchy, the Fund's investments measured at fair value.
Total Level 1 Level 2 Level 3
Mutual fund - All Cap Value $ 3,972,493 $ 3,972,493 $ — $ —__________ ___________ ___________ ____________________ ___________ ___________ __________ Investment transactions The aggregate cost of purchases of investment securities and proceeds from sales of investment securities (other than temporary cash investments) totaled $864,809 and $8,983,046, respectively, for the year ended December 31, 2015. Class-specific expenses Class-specific trustee fees for the year ended December 31, 2015 were as follows: Class R1 $ 13,882 Class R2 4,415 Class R3 — Class R4 11,334 Class R5 1,555 Class R6 12,245 Class R7 4,420 Class R8 98 $ 47,949
713

THE COLLECTIVE INVESTMENT FUNDS OF FIRST MERCANTILE TRUST COMPANY FMT/DFA U.S. Core Equity I Fund Schedule of Participant Transactions
December 31, 2015
The accompanying notes are an integral part of these financial statements.
Participant transactions by class for the year ended December 31, 2015 were as follows: Dollars Units Purchases Redemptions Net change Purchases Redemptions Net change Class R1 $ 860,713 $ (5,989,415) $ (5,128,702) 55,869 (394,906) (339,037)Class R2 101,600 (1,600,880) (1,499,280) 5,788 (89,782) (83,994)Class R3 2,000 — 2,000 200 — 200Class R4 535,332 (200,405) 334,927 32,376 (12,365) 20,011Class R5 34,264 (321,974) (287,710) 1,958 (18,211) (16,253)Class R6 90,679 (1,734,211) (1,643,532) 5,335 (101,394) (96,059)Class R7 36,199 (39,539) (3,340) 2,149 (2,370) (221)Class R8 880 (817) 63 52 (47) 5 $ 1,661,667 $ (9,887,241) $ (8,225,574) 103,727 (619,075) (515,348)
714

THE COLLECTIVE INVESTMENT FUNDS OF FIRST MERCANTILE TRUST COMPANY FMT/DFA U.S. Core Equity I Fund
Financial Highlights December 31, 2015
The accompanying notes are an integral part of these financial statements.
Change in Net Asset Value Resulting from Operations Ratios (to average net
assets)
NAV per Unit, Beginning of
Period
Net Investment
Income (Loss)(a)
Net Realized and Unrealized
Gain (Loss) from
Investments(a)
Total from Investment Activities
NAV per Unit, End of
Period Total
Return Expenses
Net Investment
Income (Loss)
Class R1 $ 15.3888 $ 0.2560 $ (0.5262) $ (0.2702) $ 15.1186 (1.76)% (0.41)% 1.64%Class R2 17.4678 0.2529 (0.5976) (0.3447) 17.1231 (1.97)% (0.63)% 1.44%Class R3(b) 10.0000 — 0.0173 0.0173 10.0173 0.17% (0.86)% (0.86)%Class R4 16.3701 0.3141 (0.6918) (0.3777) 15.9924 (2.31)% (0.97)% 1.91%Class R5 17.2901 0.1691 (0.5967) (0.4276) 16.8625 (2.47)% (1.14)% 0.97%Class R6 16.6338 0.1170 (0.5566) (0.4396) 16.1942 (2.64)% (1.31)% 0.70%Class R7 16.8176 0.2196 (0.6916) (0.4720) 16.3456 (2.81)% (1.48)% 1.30%Class R8 16.7888 0.1940 (0.6932) (0.4992) 16.2896 (2.97)% (1.65)% 1.15%
(a) Per unit amounts are based on average daily units outstanding.
(b) For the period from December 23, 2015 (commencement of this class) through December
31, 2015.
715

FMT/DFA U.S. Core Equity II Fund

THE COLLECTIVE INVESTMENT FUNDS OF FIRST MERCANTILE TRUST COMPANY FMT/DFA U.S. Core Equity II Fund Statement of Assets and Liabilities
December 31, 2015
The accompanying notes are an integral part of these financial statements.
Assets Investments in securities, at fair value $ 34,933,184 Liabilities Trustee fees 19,707 Net assets $ 34,913,477 Components of net assets
Units of
Participation NAV
per Unit Net
Assets Class R1 859,873 $ 16.9708 $ 14,592,709Class R2 173,089 $ 15.9760 2,765,272Class R3 522,300 $ 16.6177 8,679,435Class R4 262,407 $ 16.5964 4,354,994Class R5 53,079 $ 15.8327 840,377Class R6 174,857 $ 15.8106 2,764,587Class R7 21,836 $ 15.6139 340,950Class R8 38,564 $ 14.9141 575,153
$ 34,913,477
716
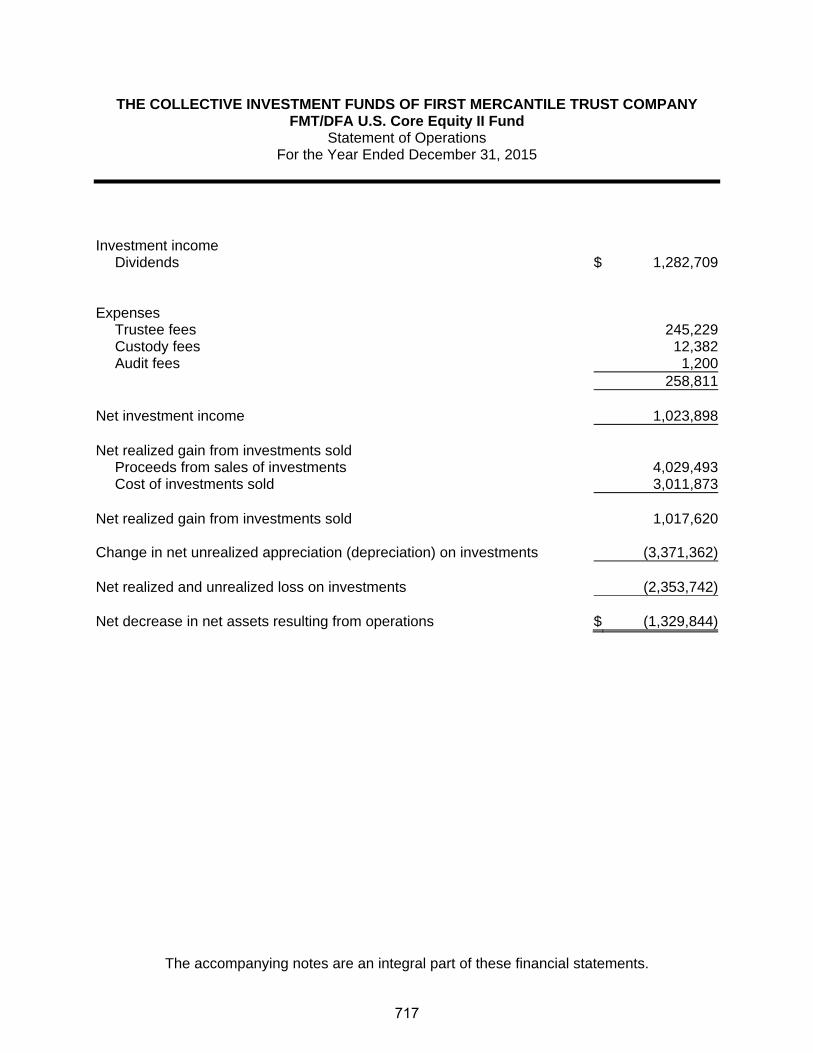
THE COLLECTIVE INVESTMENT FUNDS OF FIRST MERCANTILE TRUST COMPANY FMT/DFA U.S. Core Equity II Fund
Statement of Operations For the Year Ended December 31, 2015
The accompanying notes are an integral part of these financial statements.
Investment income
Dividends $ 1,282,709 Expenses
Trustee fees 245,229Custody fees 12,382Audit fees 1,200
258,811 Net investment income 1,023,898 Net realized gain from investments sold
Proceeds from sales of investments 4,029,493Cost of investments sold 3,011,873
Net realized gain from investments sold 1,017,620 Change in net unrealized appreciation (depreciation) on investments (3,371,362) Net realized and unrealized loss on investments (2,353,742) Net decrease in net assets resulting from operations $ (1,329,844)
717

THE COLLECTIVE INVESTMENT FUNDS OF FIRST MERCANTILE TRUST COMPANY FMT/DFA U.S. Core Equity II Fund Statement of Changes in Net Assets
For the Year Ended December 31, 2015
The accompanying notes are an integral part of these financial statements.
Operations
Net investment income $ 1,023,898
Net realized gain from investments sold 1,017,620
Change in net unrealized appreciation (depreciation) on investments (3,371,362)
Net decrease in net assets resulting from operations (1,329,844) Participant transactions
Proceeds from units purchased 14,006,553Less payments for units redeemed 12,342,946
Increase in net assets from participant transactions 1,663,607
Total increase in net assets 333,763 Net assets at beginning of year 34,579,714 Net assets at end of year $ 34,913,477
718
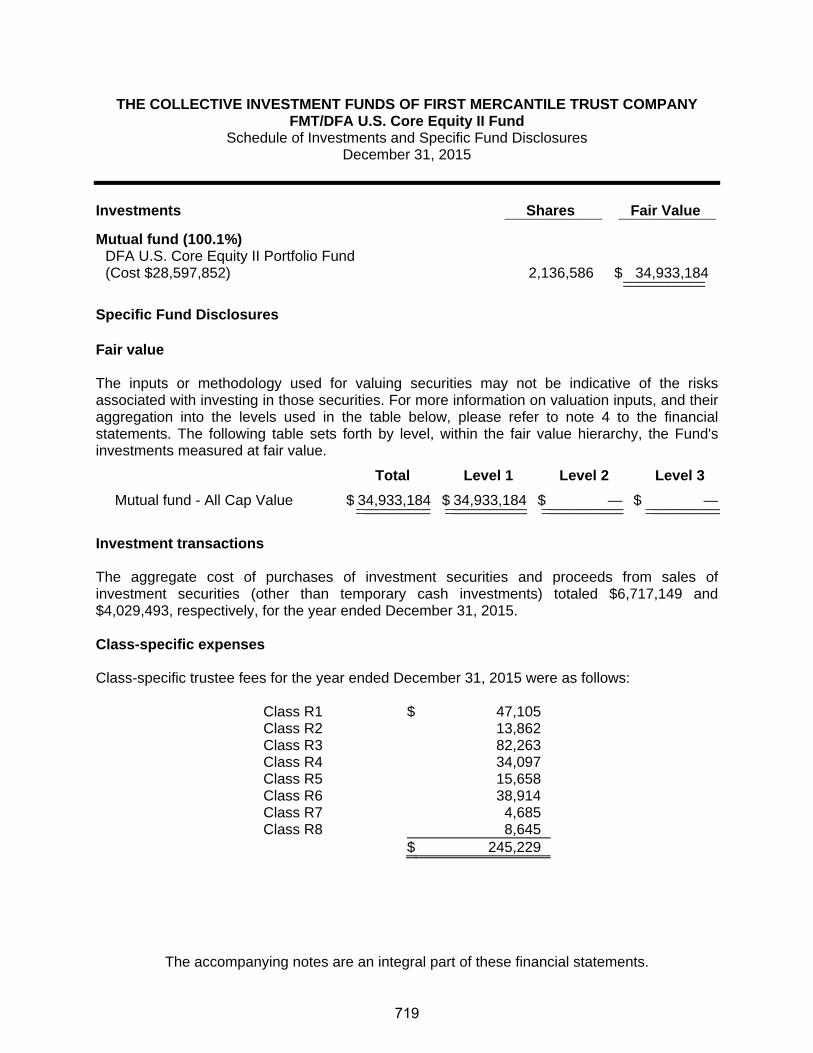
THE COLLECTIVE INVESTMENT FUNDS OF FIRST MERCANTILE TRUST COMPANY FMT/DFA U.S. Core Equity II Fund
Schedule of Investments and Specific Fund Disclosures December 31, 2015
The accompanying notes are an integral part of these financial statements.
Investments Shares Fair Value ____________ ____________
Mutual fund (100.1%)
DFA U.S. Core Equity II Portfolio Fund (Cost $28,597,852) 2,136,586 $ 34,933,184 ______________________
Specific Fund Disclosures Fair value The inputs or methodology used for valuing securities may not be indicative of the risks associated with investing in those securities. For more information on valuation inputs, and their aggregation into the levels used in the table below, please refer to note 4 to the financial statements. The following table sets forth by level, within the fair value hierarchy, the Fund's investments measured at fair value.
Total Level 1 Level 2 Level 3
Mutual fund - All Cap Value $ 34,933,184 $ 34,933,184 $ — $ —__________ ___________ ___________ ____________________ ___________ ___________ __________
Investment transactions The aggregate cost of purchases of investment securities and proceeds from sales of investment securities (other than temporary cash investments) totaled $6,717,149 and $4,029,493, respectively, for the year ended December 31, 2015. Class-specific expenses Class-specific trustee fees for the year ended December 31, 2015 were as follows: Class R1 $ 47,105 Class R2 13,862 Class R3 82,263 Class R4 34,097 Class R5 15,658 Class R6 38,914 Class R7 4,685 Class R8 8,645 $ 245,229
719

THE COLLECTIVE INVESTMENT FUNDS OF FIRST MERCANTILE TRUST COMPANY FMT/DFA U.S. Core Equity II Fund Schedule of Participant Transactions
December 31, 2015
The accompanying notes are an integral part of these financial statements.
Participant transactions by class for the year ended December 31, 2015 were as follows: Dollars Units Purchases Redemptions Net change Purchases Redemptions Net change Class R1 $ 5,862,351 $ (3,972,225) $ 1,890,126 337,620 (224,741) 112,879Class R2 992,200 (116,984) 875,216 59,370 (7,011) 52,359Class R3 2,981,223 (5,032,643) (2,051,420) 172,863 (295,101) (122,238)Class R4 1,784,948 (1,137,888) 647,060 103,069 (65,056) 38,013Class R5 183,221 (834,192) (650,971) 11,327 (50,782) (39,455)Class R6 1,710,648 (774,717) 935,931 104,888 (47,528) 57,360Class R7 374,061 (460,341) (86,280) 22,322 (28,837) (6,515)Class R8 117,901 (13,956) 103,945 7,606 (892) 6,714 $ 14,006,553 $ (12,342,946) $ 1,663,607 819,065 (719,948) 99,117
720

THE COLLECTIVE INVESTMENT FUNDS OF FIRST MERCANTILE TRUST COMPANY FMT/DFA U.S. Core Equity II Fund
Financial Highlights December 31, 2015
The accompanying notes are an integral part of these financial statements.
Change in Net Asset Value Resulting from Operations Ratios (to average net
assets)
NAV per Unit, Beginning of
Period
Net Investment
Income (Loss)(a)
Net Realized and Unrealized
Gain (Loss) from
Investments(a)
Total from Investment Activities
NAV per Unit, End of
Period Total
Return Expenses
Net Investment
Income (Loss)
Class R1 $ 17.5771 $ 0.5988 $ (1.2051) $ (0.6063) $ 16.9708 (3.45)% (0.39)% 3.40%Class R2 16.5834 0.5509 (1.1583) (0.6074) 15.9760 (3.66)% (0.61)% 3.33%Class R3 17.2790 0.3979 (1.0592) (0.6613) 16.6177 (3.83)% (0.78)% 2.30%Class R4 17.2863 0.5287 (1.2186) (0.6899) 16.5964 (3.99)% (0.95)% 3.07%Class R5 16.5191 0.2486 (0.9350) (0.6864) 15.8327 (4.16)% (1.12)% 1.51%Class R6 16.5243 0.3908 (1.1045) (0.7137) 15.8106 (4.32)% (1.29)% 2.37%Class R7 16.3452 0.3682 (1.0995) (0.7313) 15.6139 (4.47)% (1.46)% 2.27%Class R8 15.6407 0.3266 (1.0532) (0.7266) 14.9141 (4.65)% (1.63)% 2.10%
(a) Per unit amounts are based on average daily units outstanding.
721

FMT/DFA U.S. Large Cap Value Fund

THE COLLECTIVE INVESTMENT FUNDS OF FIRST MERCANTILE TRUST COMPANY FMT/DFA U.S. Large Cap Value Fund
Statement of Assets and Liabilities December 31, 2015
The accompanying notes are an integral part of these financial statements.
Assets Investments in securities, at fair value $ 25,552,703 Liabilities Trustee fees 14,861 Net assets $ 25,537,842 Components of net assets
Units of
Participation NAV
per Unit Net
Assets Class R1 697,788 $ 16.5469 $ 11,546,250Class R2 150,083 $ 17.8683 2,681,717Class R3 143,038 $ 17.5268 2,506,995Class R4 220,144 $ 17.4234 3,835,658Class R5 77,815 $ 17.4695 1,359,392Class R6 125,500 $ 17.3498 2,177,404Class R7 65,703 $ 17.0588 1,120,815Class R8 19,016 $ 16.2818 309,611
$ 25,537,842
722

THE COLLECTIVE INVESTMENT FUNDS OF FIRST MERCANTILE TRUST COMPANY FMT/DFA U.S. Large Cap Value Fund
Statement of Operations For the Year Ended December 31, 2015
The accompanying notes are an integral part of these financial statements.
Investment income
Dividends $ 1,656,369 Expenses
Trustee fees 210,625Custody fees 10,916Audit fees 1,200
222,741 Net investment income 1,433,628 Net realized gain from investments sold
Proceeds from sales of investments 12,260,727Cost of investments sold 8,370,188
Net realized gain from investments sold 3,890,539 Change in net unrealized appreciation (depreciation) on investments (6,399,037) Net realized and unrealized loss on investments (2,508,498) Net decrease in net assets resulting from operations $ (1,074,870)
723

THE COLLECTIVE INVESTMENT FUNDS OF FIRST MERCANTILE TRUST COMPANY FMT/DFA U.S. Large Cap Value Fund
Statement of Changes in Net Assets For the Year Ended December 31, 2015
The accompanying notes are an integral part of these financial statements.
Operations
Net investment income $ 1,433,628
Net realized gain from investments sold 3,890,539
Change in net unrealized appreciation (depreciation) on investments (6,399,037)
Net decrease in net assets resulting from operations (1,074,870) Participant transactions
Proceeds from units purchased 9,563,109Less payments for units redeemed 18,674,670
Decrease in net assets from participant transactions (9,111,561)
Total decrease in net assets (10,186,431) Net assets at beginning of year 35,724,273 Net assets at end of year $ 25,537,842
724

THE COLLECTIVE INVESTMENT FUNDS OF FIRST MERCANTILE TRUST COMPANY FMT/DFA U.S. Large Cap Value Fund
Schedule of Investments and Specific Fund Disclosures December 31, 2015
The accompanying notes are an integral part of these financial statements.
Investments Shares Fair Value ____________ ____________
Mutual fund (100.1%)
DFA U.S. Large Cap Value Portfolio Fund (Cost $19,897,216) 829,095 $ 25,552,703 ______________________
Specific Fund Disclosures Fair value The inputs or methodology used for valuing securities may not be indicative of the risks associated with investing in those securities. For more information on valuation inputs, and their aggregation into the levels used in the table below, please refer to note 4 to the financial statements. The following table sets forth by level, within the fair value hierarchy, the Fund's investments measured at fair value.
Total Level 1 Level 2 Level 3
Mutual fund - Large Cap Value $ 25,552,703 $ 25,552,703 $ — $ —__________ ___________ ___________ ____________________ ___________ ___________ __________ Investment transactions The aggregate cost of purchases of investment securities and proceeds from sales of investment securities (other than temporary cash investments) totaled $4,575,594 and $12,260,727, respectively, for the year ended December 31, 2015. Class-specific expenses Class-specific trustee fees for the year ended December 31, 2015 were as follows: Class R1 $ 42,423 Class R2 15,582 Class R3 32,885 Class R4 40,821 Class R5 23,485 Class R6 32,927 Class R7 15,781 Class R8 6,721 $ 210,625
725

THE COLLECTIVE INVESTMENT FUNDS OF FIRST MERCANTILE TRUST COMPANY FMT/DFA U.S. Large Cap Value Fund
Schedule of Participant Transactions December 31, 2015
The accompanying notes are an integral part of these financial statements.
Participant transactions by class for the year ended December 31, 2015 were as follows: Dollars Units Purchases Redemptions Net change Purchases Redemptions Net change Class R1 $ 3,692,865 $ (5,246,098) $ (1,553,233) 217,391 (307,674) (90,283)Class R2 932,240 (925,040) 7,200 50,142 (49,444) 698Class R3 1,343,054 (4,663,317) (3,320,263) 74,510 (257,006) (182,496)Class R4 1,859,260 (3,058,717) (1,199,457) 103,102 (165,448) (62,346)Class R5 414,236 (2,785,508) (2,371,272) 22,697 (153,152) (130,455)Class R6 840,491 (1,053,153) (212,662) 47,334 (57,973) (10,639)Class R7 415,457 (507,101) (91,644) 23,126 (28,790) (5,664)Class R8 65,506 (435,736) (370,230) 3,875 (25,393) (21,518) $ 9,563,109 $ (18,674,670) $ (9,111,561) 542,177 (1,044,880) (502,703)
726

THE COLLECTIVE INVESTMENT FUNDS OF FIRST MERCANTILE TRUST COMPANY FMT/DFA U.S. Large Cap Value Fund
Financial Highlights December 31, 2015
The accompanying notes are an integral part of these financial statements.
Change in Net Asset Value Resulting from Operations Ratios (to average net
assets)
NAV per Unit, Beginning of
Period
Net Investment
Income (Loss)(a)
Net Realized and Unrealized
Gain (Loss) from
Investments(a)
Total from Investment Activities
NAV per Unit, End of
Period Total
Return Expenses
Net Investment
Income (Loss)
Class R1 $ 17.2137 $ 0.9696 $ (1.6364) $ (0.6668) $ 16.5469 (3.87)% (0.39)% 5.68%Class R2 18.6294 1.0016 (1.7627) (0.7611) 17.8683 (4.09)% (0.61)% 5.43%Class R3 18.3047 0.6012 (1.3791) (0.7779) 17.5268 (4.25)% (0.78)% 3.31%Class R4 18.2279 0.8056 (1.6101) (0.8045) 17.4234 (4.41)% (0.95)% 4.45%Class R5 18.3073 0.5987 (1.4365) (0.8378) 17.4695 (4.58)% (1.12)% 3.31%Class R6 18.2131 0.7655 (1.6288) (0.8633) 17.3498 (4.74)% (1.29)% 4.25%Class R7 17.9381 0.8318 (1.7111) (0.8793) 17.0588 (4.90)% (1.46)% 4.71%Class R8 17.1508 0.5536 (1.4226) (0.8690) 16.2818 (5.07)% (1.63)% 3.26%
(a) Per unit amounts are based on average daily units outstanding.
727

FMT/DFA U.S. Large Cap Value III Fund

THE COLLECTIVE INVESTMENT FUNDS OF FIRST MERCANTILE TRUST COMPANY FMT/DFA U.S. Large Cap Value III Fund
Statement of Assets and Liabilities December 31, 2015
The accompanying notes are an integral part of these financial statements.
Assets Investments in securities, at fair value $ 216,894 Liabilities Trustee fees 146 Net assets $ 216,748 Components of net assets
Units of
Participation NAV
per Unit Net
Assets Class R1 3,104 $ 14.9365 $ 46,356Class R4 10,379 $ 16.4171 170,392
$ 216,748
728

THE COLLECTIVE INVESTMENT FUNDS OF FIRST MERCANTILE TRUST COMPANY FMT/DFA U.S. Large Cap Value III Fund
Statement of Operations For the Year Ended December 31, 2015
The accompanying notes are an integral part of these financial statements.
Investment income
Dividends $ 26,535 Expenses
Trustee fees 4,335Audit fees 1,200Custody fees 468
6,003 Net investment income 20,532 Net realized gain from investments sold
Proceeds from sales of investments 1,213,787Cost of investments sold 963,462
Net realized gain from investments sold 250,325 Change in net unrealized appreciation (depreciation) on investments (336,458) Net realized and unrealized loss on investments (86,133) Net decrease in net assets resulting from operations $ (65,601)
729

THE COLLECTIVE INVESTMENT FUNDS OF FIRST MERCANTILE TRUST COMPANY FMT/DFA U.S. Large Cap Value III Fund
Statement of Changes in Net Assets For the Year Ended December 31, 2015
The accompanying notes are an integral part of these financial statements.
Operations
Net investment income $ 20,532
Net realized gain from investments sold 250,325
Change in net unrealized appreciation (depreciation) on investments (336,458)
Net decrease in net assets resulting from operations (65,601) Participant transactions
Proceeds from units purchased 42,464Less payments for units redeemed 1,209,838
Decrease in net assets from participant transactions (1,167,374)
Total decrease in net assets (1,232,975) Net assets at beginning of year 1,449,723 Net assets at end of year $ 216,748
730

THE COLLECTIVE INVESTMENT FUNDS OF FIRST MERCANTILE TRUST COMPANY FMT/DFA U.S. Large Cap Value III Fund
Schedule of Investments and Specific Fund Disclosures December 31, 2015
The accompanying notes are an integral part of these financial statements.
Investments Shares Fair Value ____________ ____________
Mutual fund (100.1%)
DFA U.S. Large Cap Value Portfolio III Fund (Cost $186,321) 9,917 $ 216,894 ____________________
Specific Fund Disclosures Fair value The inputs or methodology used for valuing securities may not be indicative of the risks associated with investing in those securities. For more information on valuation inputs, and their aggregation into the levels used in the table below, please refer to note 4 to the financial statements. The following table sets forth by level, within the fair value hierarchy, the Fund's investments measured at fair value.
Total Level 1 Level 2 Level 3
Mutual fund - Large Cap Value $ 216,894 $ 216,894 $ — $ —__________ __________ __________ ___________________ __________ __________ _________ Investment transactions The aggregate cost of purchases of investment securities and proceeds from sales of investment securities (other than temporary cash investments) totaled $66,237 and $1,213,787, respectively, for the year ended December 31, 2015. Class-specific expenses Class-specific trustee fees for the year ended December 31, 2015 were as follows: Class R1 $ 2,688 Class R4 1,647 $ 4,335
731

THE COLLECTIVE INVESTMENT FUNDS OF FIRST MERCANTILE TRUST COMPANY FMT/DFA U.S. Large Cap Value III Fund
Schedule of Participant Transactions December 31, 2015
The accompanying notes are an integral part of these financial statements.
Participant transactions by class for the year ended December 31, 2015 were as follows: Dollars Units Purchases Redemptions Net change Purchases Redemptions Net change Class R1 $ 22,732 $ (1,150,502) $ (1,127,770) 1,457 (77,504) (76,047)Class R4 19,732 (59,336) (39,604) 1,157 (3,473) (2,316) $ 42,464 $ (1,209,838) $ (1,167,374) 2,614 (80,977) (78,363)
732
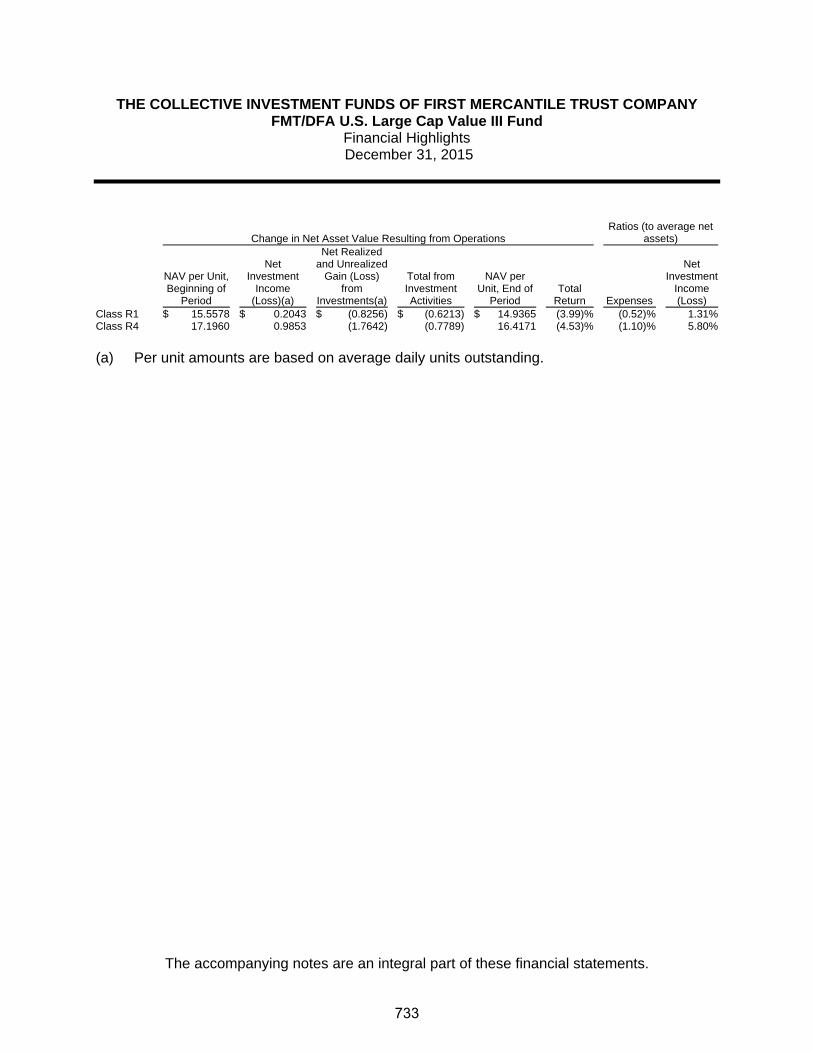
THE COLLECTIVE INVESTMENT FUNDS OF FIRST MERCANTILE TRUST COMPANY FMT/DFA U.S. Large Cap Value III Fund
Financial Highlights December 31, 2015
The accompanying notes are an integral part of these financial statements.
Change in Net Asset Value Resulting from Operations Ratios (to average net
assets)
NAV per Unit, Beginning of
Period
Net Investment
Income (Loss)(a)
Net Realized and Unrealized
Gain (Loss) from
Investments(a)
Total from Investment Activities
NAV per Unit, End of
Period Total
Return Expenses
Net Investment
Income (Loss)
Class R1 $ 15.5578 $ 0.2043 $ (0.8256) $ (0.6213) $ 14.9365 (3.99)% (0.52)% 1.31%Class R4 17.1960 0.9853 (1.7642) (0.7789) 16.4171 (4.53)% (1.10)% 5.80%
(a) Per unit amounts are based on average daily units outstanding.
733

FMT/DFA U.S. Large Company Fund

THE COLLECTIVE INVESTMENT FUNDS OF FIRST MERCANTILE TRUST COMPANY FMT/DFA U.S. Large Company Fund
Statement of Assets and Liabilities December 31, 2015
The accompanying notes are an integral part of these financial statements.
Assets Investments in securities, at fair value $ 10,878,521 Liabilities Trustee fees 5,959 Net assets $ 10,872,562 Components of net assets
Units of
Participation NAV
per Unit Net
Assets Class R1 186,090 $ 33.1442 $ 6,167,799Class R2 68,165 $ 17.4715 1,190,941Class R3 188 $ 17.1147 3,216Class R4 51,219 $ 17.3141 886,807Class R5 75,651 $ 16.5714 1,253,645Class R6 37,230 $ 17.0450 634,592Class R7 41,992 $ 16.6361 698,589Class R8 2,299 $ 16.0796 36,973
$ 10,872,562
734

THE COLLECTIVE INVESTMENT FUNDS OF FIRST MERCANTILE TRUST COMPANY FMT/DFA U.S. Large Company Fund
Statement of Operations For the Year Ended December 31, 2015
The accompanying notes are an integral part of these financial statements.
Investment income
Dividends $ 338,193 Expenses
Trustee fees 85,371Custody fees 4,670Audit fees 1,200
91,241 Net investment income 246,952 Net realized gain from investments sold
Proceeds from sales of investments 4,541,570Cost of investments sold 2,998,025
Net realized gain from investments sold 1,543,545 Change in net unrealized appreciation (depreciation) on investments (1,683,672) Net realized and unrealized loss on investments (140,127) Net increase in net assets resulting from operations $ 106,825
735

THE COLLECTIVE INVESTMENT FUNDS OF FIRST MERCANTILE TRUST COMPANY FMT/DFA U.S. Large Company Fund Statement of Changes in Net Assets
For the Year Ended December 31, 2015
The accompanying notes are an integral part of these financial statements.
Operations
Net investment income $ 246,952
Net realized gain from investments sold 1,543,545
Change in net unrealized appreciation (depreciation) on investments (1,683,672)
Net increase in net assets resulting from operations 106,825 Participant transactions
Proceeds from units purchased 3,698,677Less payments for units redeemed 7,036,560
Decrease in net assets from participant transactions (3,337,883)
Total decrease in net assets (3,231,058) Net assets at beginning of year 14,103,620 Net assets at end of year $ 10,872,562
736

THE COLLECTIVE INVESTMENT FUNDS OF FIRST MERCANTILE TRUST COMPANY FMT/DFA U.S. Large Company Fund
Schedule of Investments and Specific Fund Disclosures December 31, 2015
The accompanying notes are an integral part of these financial statements.
Investments Shares Fair Value ____________ ____________
Mutual fund (100.1%)
DFA U.S. Large Company Portfolio Fund (Cost $7,495,040) 680,758 $ 10,878,521 ____________________
Specific Fund Disclosures Fair value The inputs or methodology used for valuing securities may not be indicative of the risks associated with investing in those securities. For more information on valuation inputs, and their aggregation into the levels used in the table below, please refer to note 4 to the financial statements. The following table sets forth by level, within the fair value hierarchy, the Fund's investments measured at fair value.
Total Level 1 Level 2 Level 3
Mutual fund - Large Cap Core $ 10,878,521 $ 10,878,521 $ — $ —__________ __________ __________ ___________________ __________ __________ _________ Investment transactions The aggregate cost of purchases of investment securities and proceeds from sales of investment securities (other than temporary cash investments) totaled $1,448,436 and $4,541,570, respectively, for the year ended December 31, 2015. Class-specific expenses Class-specific trustee fees for the year ended December 31, 2015 were as follows: Class R1 $ 23,638 Class R2 6,561 Class R3 9,930 Class R4 8,538 Class R5 14,487 Class R6 10,164 Class R7 9,576 Class R8 2,477 $ 85,371
737

THE COLLECTIVE INVESTMENT FUNDS OF FIRST MERCANTILE TRUST COMPANY FMT/DFA U.S. Large Company Fund Schedule of Participant Transactions
December 31, 2015
The accompanying notes are an integral part of these financial statements.
Participant transactions by class for the year ended December 31, 2015 were as follows: Dollars Units Purchases Redemptions Net change Purchases Redemptions Net change Class R1 $ 2,306,912 $ (3,255,928) $ (949,016) 70,222 (98,572) (28,350)Class R2 210,012 (97,997) 112,015 11,994 (5,598) 6,396Class R3 143,293 (1,858,847) (1,715,554) 8,390 (109,876) (101,486)Class R4 232,144 (624,684) (392,540) 13,312 (35,549) (22,237)Class R5 287,428 (346,544) (59,116) 17,692 (20,810) (3,118)Class R6 260,240 (434,528) (174,288) 15,160 (25,248) (10,088)Class R7 244,727 (211,554) 33,173 14,395 (12,575) 1,820Class R8 13,921 (206,478) (192,557) 853 (12,504) (11,651) $ 3,698,677 $ (7,036,560) $ (3,337,883) 152,018 (320,732) (168,714)
738

THE COLLECTIVE INVESTMENT FUNDS OF FIRST MERCANTILE TRUST COMPANY FMT/DFA U.S. Large Company Fund
Financial Highlights December 31, 2015
The accompanying notes are an integral part of these financial statements.
Change in Net Asset Value Resulting from Operations Ratios (to average net
assets)
NAV per Unit, Beginning of
Period
Net Investment
Income (Loss)(a)
Net Realized and Unrealized
Gain (Loss) from
Investments(a)
Total from Investment Activities
NAV per Unit, End of
Period Total
Return Expenses
Net Investment
Income (Loss)
Class R1 $ 32.8232 $ 0.7531 $ (0.4321) $ 0.3210 $ 33.1442 0.98% (0.39)% 2.27%Class R2 17.3406 0.3871 (0.2562) 0.1309 17.4715 0.75% (0.61)% 2.21%Class R3 16.9680 0.1336 0.0131 0.1467 17.1147 0.86% (0.78)% 0.78%Class R4 17.2431 0.3132 (0.2422) 0.0710 17.3141 0.41% (0.95)% 1.81%Class R5 16.5317 0.2627 (0.2230) 0.0397 16.5714 0.24% (1.12)% 1.58%Class R6 17.0332 0.2077 (0.1959) 0.0118 17.0450 0.07% (1.30)% 1.21%Class R7 16.6529 0.2283 (0.2451) (0.0168) 16.6361 (0.10)% (1.46)% 1.37%Class R8 16.1259 0.0360 (0.0823) (0.0463) 16.0796 (0.29)% (1.63)% 0.22%
(a) Per unit amounts are based on average daily units outstanding.
739

FMT/DFA U.S. Micro Cap Fund

THE COLLECTIVE INVESTMENT FUNDS OF FIRST MERCANTILE TRUST COMPANY FMT/DFA U.S. Micro Cap Fund
Statement of Assets and Liabilities December 31, 2015
The accompanying notes are an integral part of these financial statements.
Assets Investments in securities, at fair value $ 5,848,546 Liabilities Trustee fees 3,437 Net assets $ 5,845,109 Components of net assets
Units of
Participation NAV
per Unit Net
Assets Class R1 192,021 $ 16.4051 $ 3,150,113Class R2 2,248 $ 16.7849 37,725Class R3 755 $ 12.0261 9,079Class R4 95,756 $ 16.8583 1,614,291Class R5 23,315 $ 16.0093 373,265Class R6 25,401 $ 15.3255 389,288Class R7 14,716 $ 15.1930 223,575Class R8 4,898 $ 9.7533 47,773
$ 5,845,109
740

THE COLLECTIVE INVESTMENT FUNDS OF FIRST MERCANTILE TRUST COMPANY FMT/DFA U.S. Micro Cap Fund
Statement of Operations For the Year Ended December 31, 2015
The accompanying notes are an integral part of these financial statements.
Investment income
Dividends $ 386,576 Expenses
Trustee fees 49,824Custody fees 2,694Audit fees 1,200
53,718 Net investment income 332,858 Net realized gain from investments sold
Proceeds from sales of investments 3,736,231Cost of investments sold 3,442,900
Net realized gain from investments sold 293,331 Change in net unrealized appreciation (depreciation) on investments (920,301) Net realized and unrealized loss on investments (626,970) Net decrease in net assets resulting from operations $ (294,112)
741

THE COLLECTIVE INVESTMENT FUNDS OF FIRST MERCANTILE TRUST COMPANY FMT/DFA U.S. Micro Cap Fund
Statement of Changes in Net Assets For the Year Ended December 31, 2015
The accompanying notes are an integral part of these financial statements.
Operations
Net investment income $ 332,858
Net realized gain from investments sold 293,331
Change in net unrealized appreciation (depreciation) on investments (920,301)
Net decrease in net assets resulting from operations (294,112) Participant transactions
Proceeds from units purchased 2,288,664Less payments for units redeemed 5,030,092
Decrease in net assets from participant transactions (2,741,428)
Total decrease in net assets (3,035,540) Net assets at beginning of year 8,880,649 Net assets at end of year $ 5,845,109
742

THE COLLECTIVE INVESTMENT FUNDS OF FIRST MERCANTILE TRUST COMPANY FMT/DFA U.S. Micro Cap Fund
Schedule of Investments and Specific Fund Disclosures December 31, 2015
The accompanying notes are an integral part of these financial statements.
Investments Shares Fair Value ____________ ____________
Mutual fund (100.1%) DFA U.S. Micro Cap Portfolio Fund (Cost $5,960,745) 334,012 $ 5,848,546 ______________________ Specific Fund Disclosures Fair value The inputs or methodology used for valuing securities may not be indicative of the risks associated with investing in those securities. For more information on valuation inputs, and their aggregation into the levels used in the table below, please refer to note 4 to the financial statements. The following table sets forth by level, within the fair value hierarchy, the Fund's investments measured at fair value.
Total Level 1 Level 2 Level 3
Mutual fund - Small Cap Core $ 5,848,546 $ 5,848,546 $ — $ —__________ ___________ ___________ ____________________ ___________ ___________ __________ Investment transactions The aggregate cost of purchases of investment securities and proceeds from sales of investment securities (other than temporary cash investments) totaled $1,325,912 and $3,736,231, respectively, for the year ended December 31, 2015. Class-specific expenses Class-specific trustee fees for the year ended December 31, 2015 were as follows: Class R1 $ 13,428 Class R2 594 Class R3 1,130 Class R4 13,765 Class R5 8,698 Class R6 7,306 Class R7 3,965 Class R8 938 $ 49,824
743

THE COLLECTIVE INVESTMENT FUNDS OF FIRST MERCANTILE TRUST COMPANY FMT/DFA U.S. Micro Cap Fund
Schedule of Participant Transactions December 31, 2015
The accompanying notes are an integral part of these financial statements.
Participant transactions by class for the year ended December 31, 2015 were as follows: Dollars Units Purchases Redemptions Net change Purchases Redemptions Net change Class R1 $ 940,960 $ (2,251,720) $ (1,310,760) 54,177 (132,979) (78,802)Class R2 1,211 (68,424) (67,213) 69 (4,067) (3,998)Class R3 28,338 (478,637) (450,299) 2,243 (37,184) (34,941)Class R4 1,064,684 (773,270) 291,414 59,824 (43,563) 16,261Class R5 151,867 (1,066,149) (914,282) 9,172 (63,234) (54,062)Class R6 55,452 (274,461) (219,009) 3,463 (17,261) (13,798)Class R7 22,678 (92,906) (70,228) 1,434 (5,800) (4,366)Class R8 23,474 (24,525) (1,051) 2,287 (2,493) (206) $ 2,288,664 $ (5,030,092) $ (2,741,428) 132,669 (306,581) (173,912)
744
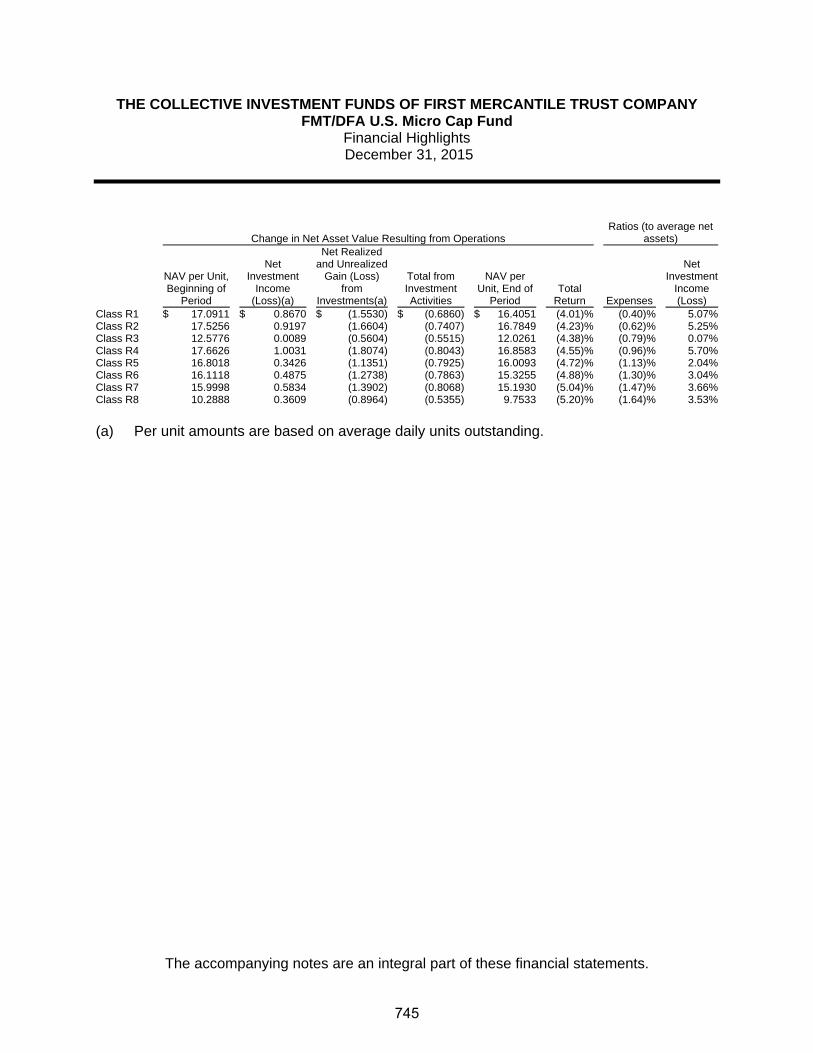
THE COLLECTIVE INVESTMENT FUNDS OF FIRST MERCANTILE TRUST COMPANY FMT/DFA U.S. Micro Cap Fund
Financial Highlights December 31, 2015
The accompanying notes are an integral part of these financial statements.
Change in Net Asset Value Resulting from Operations Ratios (to average net
assets)
NAV per Unit, Beginning of
Period
Net Investment
Income (Loss)(a)
Net Realized and Unrealized
Gain (Loss) from
Investments(a)
Total from Investment Activities
NAV per Unit, End of
Period Total
Return Expenses
Net Investment
Income (Loss)
Class R1 $ 17.0911 $ 0.8670 $ (1.5530) $ (0.6860) $ 16.4051 (4.01)% (0.40)% 5.07%Class R2 17.5256 0.9197 (1.6604) (0.7407) 16.7849 (4.23)% (0.62)% 5.25%Class R3 12.5776 0.0089 (0.5604) (0.5515) 12.0261 (4.38)% (0.79)% 0.07%Class R4 17.6626 1.0031 (1.8074) (0.8043) 16.8583 (4.55)% (0.96)% 5.70%Class R5 16.8018 0.3426 (1.1351) (0.7925) 16.0093 (4.72)% (1.13)% 2.04%Class R6 16.1118 0.4875 (1.2738) (0.7863) 15.3255 (4.88)% (1.30)% 3.04%Class R7 15.9998 0.5834 (1.3902) (0.8068) 15.1930 (5.04)% (1.47)% 3.66%Class R8 10.2888 0.3609 (0.8964) (0.5355) 9.7533 (5.20)% (1.64)% 3.53%
(a) Per unit amounts are based on average daily units outstanding.
745

FMT/DFA U.S. Small Cap Portfolio Fund

THE COLLECTIVE INVESTMENT FUNDS OF FIRST MERCANTILE TRUST COMPANY FMT/DFA U.S. Small Cap Portfolio Fund
Statement of Assets and Liabilities December 31, 2015
The accompanying notes are an integral part of these financial statements.
Assets Investments in securities, at fair value $ 15,848,902 Liabilities Trustee fees 7,639 Net assets $ 15,841,263 Components of net assets
Units of
Participation NAV
per Unit Net
Assets Class R1 583,157 $ 17.6444 $ 10,289,453Class R2 66,502 $ 15.9112 1,058,132Class R3 63,768 $ 16.3749 1,044,199Class R4 85,190 $ 15.4485 1,316,052Class R5 38,292 $ 15.9942 612,444Class R6 51,382 $ 16.3107 838,075Class R7 34,338 $ 15.9219 546,720Class R8 8,842 $ 15.4020 136,188
$ 15,841,263
746

THE COLLECTIVE INVESTMENT FUNDS OF FIRST MERCANTILE TRUST COMPANY FMT/DFA U.S. Small Cap Portfolio Fund
Statement of Operations For the Year Ended December 31, 2015
The accompanying notes are an integral part of these financial statements.
Investment income
Dividends $ 957,779 Expenses
Trustee fees 101,249Custody fees 5,952Audit fees 1,200
108,401 Net investment income 849,378 Net realized gain from investments sold
Proceeds from sales of investments 3,847,804Cost of investments sold 2,637,401
Net realized gain from investments sold 1,210,403 Change in net unrealized appreciation (depreciation) on investments (2,634,808) Net realized and unrealized loss on investments (1,424,405) Net decrease in net assets resulting from operations $ (575,027)
747

THE COLLECTIVE INVESTMENT FUNDS OF FIRST MERCANTILE TRUST COMPANY FMT/DFA U.S. Small Cap Portfolio Fund
Statement of Changes in Net Assets For the Year Ended December 31, 2015
The accompanying notes are an integral part of these financial statements.
Operations
Net investment income $ 849,378
Net realized gain from investments sold 1,210,403
Change in net unrealized appreciation (depreciation) on investments (2,634,808)
Net decrease in net assets resulting from operations (575,027) Participant transactions
Proceeds from units purchased 6,393,775Less payments for units redeemed 7,700,892
Decrease in net assets from participant transactions (1,307,117)
Total decrease in net assets (1,882,144) Net assets at beginning of year 17,723,407 Net assets at end of year $ 15,841,263
748

THE COLLECTIVE INVESTMENT FUNDS OF FIRST MERCANTILE TRUST COMPANY FMT/DFA U.S. Small Cap Portfolio Fund
Schedule of Investments and Specific Fund Disclosures December 31, 2015
The accompanying notes are an integral part of these financial statements.
Investments Shares Fair Value ____________ ____________
Mutual fund (100.0%) DFA U.S. Small Cap Portfolio Fund (Cost $12,836,461) 558,847 $ 15,848,902 ______________________ Specific Fund Disclosures Fair value The inputs or methodology used for valuing securities may not be indicative of the risks associated with investing in those securities. For more information on valuation inputs, and their aggregation into the levels used in the table below, please refer to note 4 to the financial statements. The following table sets forth by level, within the fair value hierarchy, the Fund's investments measured at fair value.
Total Level 1 Level 2 Level 3
Mutual fund - Small Cap Core $ 15,848,902 $ 15,848,902 $ — $ —__________ ___________ ___________ ____________________ ___________ ___________ __________ Investment transactions The aggregate cost of purchases of investment securities and proceeds from sales of investment securities (other than temporary cash investments) totaled $3,388,143 and $3,847,804, respectively, for the year ended December 31, 2015. Class-specific expenses Class-specific trustee fees for the year ended December 31, 2015 were as follows: Class R1 $ 32,382 Class R2 5,600 Class R3 22,263 Class R4 10,629 Class R5 9,484 Class R6 10,498 Class R7 6,419 Class R8 3,974 $ 101,249
749

THE COLLECTIVE INVESTMENT FUNDS OF FIRST MERCANTILE TRUST COMPANY FMT/DFA U.S. Small Cap Portfolio Fund
Schedule of Participant Transactions December 31, 2015
The accompanying notes are an integral part of these financial statements.
Participant transactions by class for the year ended December 31, 2015 were as follows: Dollars Units Purchases Redemptions Net change Purchases Redemptions Net change Class R1 $ 3,588,075 $ (2,240,637) $ 1,347,438 196,828 (119,682) 77,146Class R2 300,270 (77,423) 222,847 17,880 (4,550) 13,330Class R3 855,848 (3,599,196) (2,743,348) 49,288 (210,896) (161,608)Class R4 508,209 (742,631) (234,422) 31,642 (45,089) (13,447)Class R5 392,904 (534,150) (141,246) 23,199 (31,907) (8,708)Class R6 416,262 (186,110) 230,152 24,797 (11,015) 13,782Class R7 292,494 (116,790) 175,704 17,221 (7,157) 10,064Class R8 39,713 (203,955) (164,242) 2,441 (12,380) (9,939) $ 6,393,775 $ (7,700,892) $ (1,307,117) 363,296 (442,676) (79,380)
750

THE COLLECTIVE INVESTMENT FUNDS OF FIRST MERCANTILE TRUST COMPANY FMT/DFA U.S. Small Cap Portfolio Fund
Financial Highlights December 31, 2015
The accompanying notes are an integral part of these financial statements.
Change in Net Asset Value Resulting from Operations Ratios (to average net
assets)
NAV per Unit, Beginning of
Period
Net Investment
Income (Loss)(a)
Net Realized and Unrealized
Gain (Loss) from
Investments(a)
Total from Investment Activities
NAV per Unit, End of
Period Total
Return Expenses
Net Investment
Income (Loss)
Class R1 $ 18.3162 $ 1.1474 $ (1.8192) $ (0.6718) $ 17.6444 (3.67)% (0.39)% 6.22%Class R2 16.5537 0.9511 (1.5936) (0.6425) 15.9112 (3.88)% (0.61)% 5.71%Class R3 17.0653 0.2996 (0.9900) (0.6904) 16.3749 (4.05)% (0.78)% 1.74%Class R4 16.1273 0.8983 (1.5771) (0.6788) 15.4485 (4.21)% (0.95)% 5.56%Class R5 16.7255 0.5486 (1.2799) (0.7313) 15.9942 (4.37)% (1.12)% 3.26%Class R6 17.0857 0.8592 (1.6342) (0.7750) 16.3107 (4.54)% (1.29)% 5.01%Class R7 16.7068 0.9280 (1.7129) (0.7849) 15.9219 (4.70)% (1.46)% 5.57%Class R8 16.1897 0.3168 (1.1045) (0.7877) 15.4020 (4.87)% (1.63)% 1.94%
(a) Per unit amounts are based on average daily units outstanding.
751
FMT/DFA U.S. Small Cap Value Fund

THE COLLECTIVE INVESTMENT FUNDS OF FIRST MERCANTILE TRUST COMPANY FMT/DFA U.S. Small Cap Value Fund
Statement of Assets and Liabilities December 31, 2015
The accompanying notes are an integral part of these financial statements.
Assets Investments in securities, at fair value $ 4,945,292 Liabilities Trustee fees 3,263 Net assets $ 4,942,029 Components of net assets
Units of
Participation NAV
per Unit Net
Assets Class R1 152,849 $ 14.6365 $ 2,237,182Class R2 1,383 $ 16.3656 22,637Class R4 62,314 $ 16.3925 1,021,482Class R5 44,557 $ 15.5069 690,944Class R6 29,618 $ 15.6473 463,446Class R7 31,892 $ 14.6715 467,898Class R8 2,623 $ 14.6554 38,440
$ 4,942,029
752
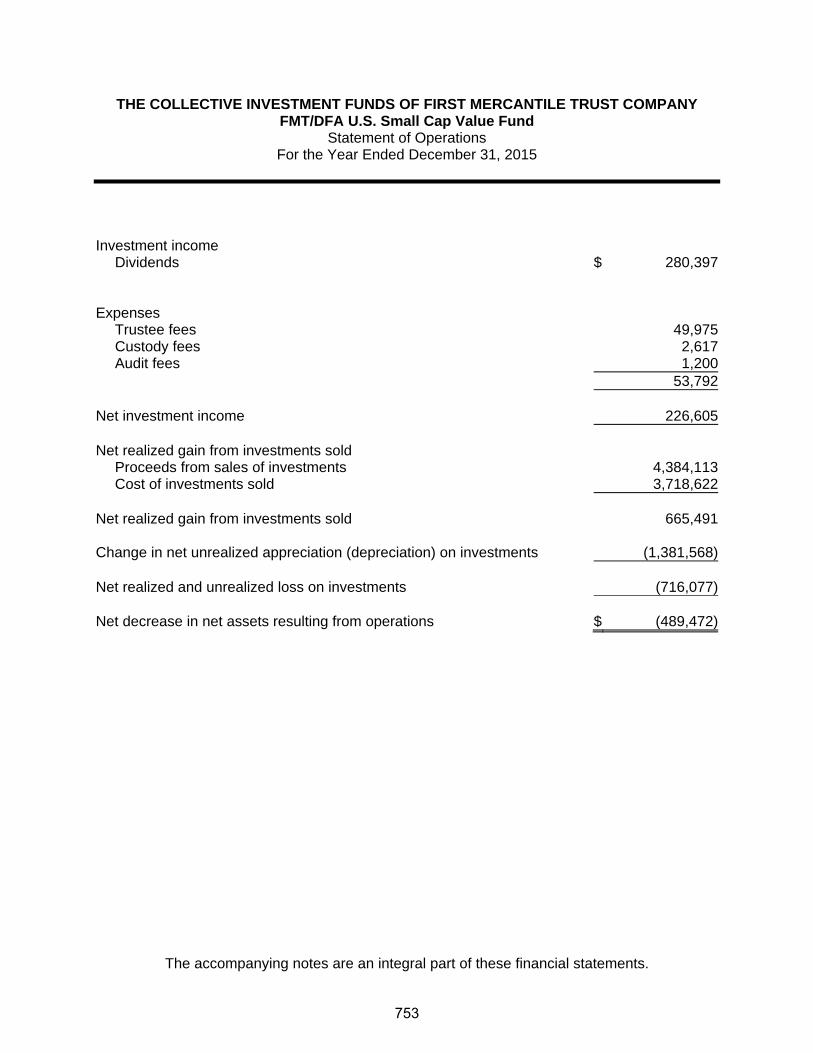
THE COLLECTIVE INVESTMENT FUNDS OF FIRST MERCANTILE TRUST COMPANY FMT/DFA U.S. Small Cap Value Fund
Statement of Operations For the Year Ended December 31, 2015
The accompanying notes are an integral part of these financial statements.
Investment income
Dividends $ 280,397 Expenses
Trustee fees 49,975Custody fees 2,617Audit fees 1,200
53,792 Net investment income 226,605 Net realized gain from investments sold
Proceeds from sales of investments 4,384,113Cost of investments sold 3,718,622
Net realized gain from investments sold 665,491 Change in net unrealized appreciation (depreciation) on investments (1,381,568) Net realized and unrealized loss on investments (716,077) Net decrease in net assets resulting from operations $ (489,472)
753

THE COLLECTIVE INVESTMENT FUNDS OF FIRST MERCANTILE TRUST COMPANY FMT/DFA U.S. Small Cap Value Fund
Statement of Changes in Net Assets For the Year Ended December 31, 2015
The accompanying notes are an integral part of these financial statements.
Operations
Net investment income $ 226,605
Net realized gain from investments sold 665,491
Change in net unrealized appreciation (depreciation) on investments (1,381,568)
Net decrease in net assets resulting from operations (489,472) Participant transactions
Proceeds from units purchased 1,212,612Less payments for units redeemed 4,563,968
Decrease in net assets from participant transactions (3,351,356)
Total decrease in net assets (3,840,828) Net assets at beginning of year 8,782,857 Net assets at end of year $ 4,942,029
754

THE COLLECTIVE INVESTMENT FUNDS OF FIRST MERCANTILE TRUST COMPANY FMT/DFA U.S. Small Cap Value Fund
Schedule of Investments and Specific Fund Disclosures December 31, 2015
The accompanying notes are an integral part of these financial statements.
Investments Shares Fair Value ____________ ____________
Mutual fund (100.1%)
DFA U.S. Small Cap Value Portfolio I Fund (Cost $4,831,917) 162,194 $ 4,945,292 ______________________
Specific Fund Disclosures Fair value The inputs or methodology used for valuing securities may not be indicative of the risks associated with investing in those securities. For more information on valuation inputs, and their aggregation into the levels used in the table below, please refer to note 4 to the financial statements. The following table sets forth by level, within the fair value hierarchy, the Fund's investments measured at fair value.
Total Level 1 Level 2 Level 3
Mutual fund - Small Cap Value $ 4,945,292 $ 4,945,292 $ — $ —__________ ___________ ___________ ____________________ ___________ ___________ __________
Investment transactions The aggregate cost of purchases of investment securities and proceeds from sales of investment securities (other than temporary cash investments) totaled $1,256,429 and $4,384,113, respectively, for the year ended December 31, 2015. Class-specific expenses Class-specific trustee fees for the year ended December 31, 2015 were as follows: Class R1 $ 10,654 Class R2 127 Class R4 13,904 Class R5 10,072 Class R6 7,251 Class R7 7,332 Class R8 635 $ 49,975
755

THE COLLECTIVE INVESTMENT FUNDS OF FIRST MERCANTILE TRUST COMPANY FMT/DFA U.S. Small Cap Value Fund
Schedule of Participant Transactions December 31, 2015
The accompanying notes are an integral part of these financial statements.
Participant transactions by class for the year ended December 31, 2015 were as follows: Dollars Units Purchases Redemptions Net change Purchases Redemptions Net change Class R1 $ 529,550 $ (1,883,834) $ (1,354,284) 34,264 (123,022) (88,758)Class R2 3,022 (1,493) 1,529 179 (81) 98Class R4 448,595 (1,599,819) (1,151,224) 25,472 (86,894) (61,422)Class R5 83,136 (719,482) (636,346) 5,023 (43,030) (38,007)Class R6 88,660 (165,504) (76,844) 5,265 (9,947) (4,682)Class R7 56,728 (107,946) (51,218) 3,577 (6,733) (3,156)Class R8 2,921 (85,890) (82,969) 185 (5,314) (5,129) $ 1,212,612 $ (4,563,968) $ (3,351,356) 73,965 (275,021) (201,056)
756

THE COLLECTIVE INVESTMENT FUNDS OF FIRST MERCANTILE TRUST COMPANY FMT/DFA U.S. Small Cap Value Fund
Financial Highlights December 31, 2015
The accompanying notes are an integral part of these financial statements.
Change in Net Asset Value Resulting from Operations Ratios (to average net
assets)
NAV per Unit, Beginning of
Period
Net Investment
Income (Loss)(a)
Net Realized and Unrealized
Gain (Loss) from
Investments(a)
Total from Investment Activities
NAV per Unit, End of
Period Total
Return Expenses
Net Investment
Income (Loss)
Class R1 $ 15.9425 $ 0.5965 $ (1.9025) $ (1.3060) $ 14.6365 (8.19)% (0.41)% 3.79%Class R2 17.8653 0.8509 (2.3506) (1.4997) 16.3656 (8.39)% (0.63)% 4.85%Class R4 17.9564 0.5128 (2.0767) (1.5639) 16.3925 (8.71)% (0.97)% 2.89%Class R5 17.0153 0.5079 (2.0163) (1.5084) 15.5069 (8.87)% (1.14)% 3.05%Class R6 17.1988 0.5305 (2.0820) (1.5515) 15.6473 (9.02)% (1.31)% 3.15%Class R7 16.1539 0.5524 (2.0348) (1.4824) 14.6715 (9.18)% (1.48)% 3.49%Class R8 16.1639 0.5665 (2.0750) (1.5085) 14.6554 (9.33)% (1.65)% 3.59%
(a) Per unit amounts are based on average daily units outstanding.
757

FMT/DFA U.S. Targeted Value Fund

THE COLLECTIVE INVESTMENT FUNDS OF FIRST MERCANTILE TRUST COMPANY FMT/DFA U.S. Targeted Value Fund
Statement of Assets and Liabilities December 31, 2015
The accompanying notes are an integral part of these financial statements.
Assets Investments in securities, at fair value $ 17,773,049 Liabilities Trustee fees 9,527 Net assets $ 17,763,522 Components of net assets
Units of
Participation NAV
per Unit Net
Assets Class R1 486,006 $ 19.0532 $ 9,259,943Class R2 98,206 $ 16.3130 1,602,027Class R3 154,321 $ 15.9832 2,466,546Class R4 117,396 $ 15.8624 1,862,190Class R5 43,004 $ 15.9664 686,620Class R6 73,743 $ 16.7602 1,235,954Class R7 31,229 $ 15.5486 485,574Class R8 10,621 $ 15.5044 164,668
$ 17,763,522
758
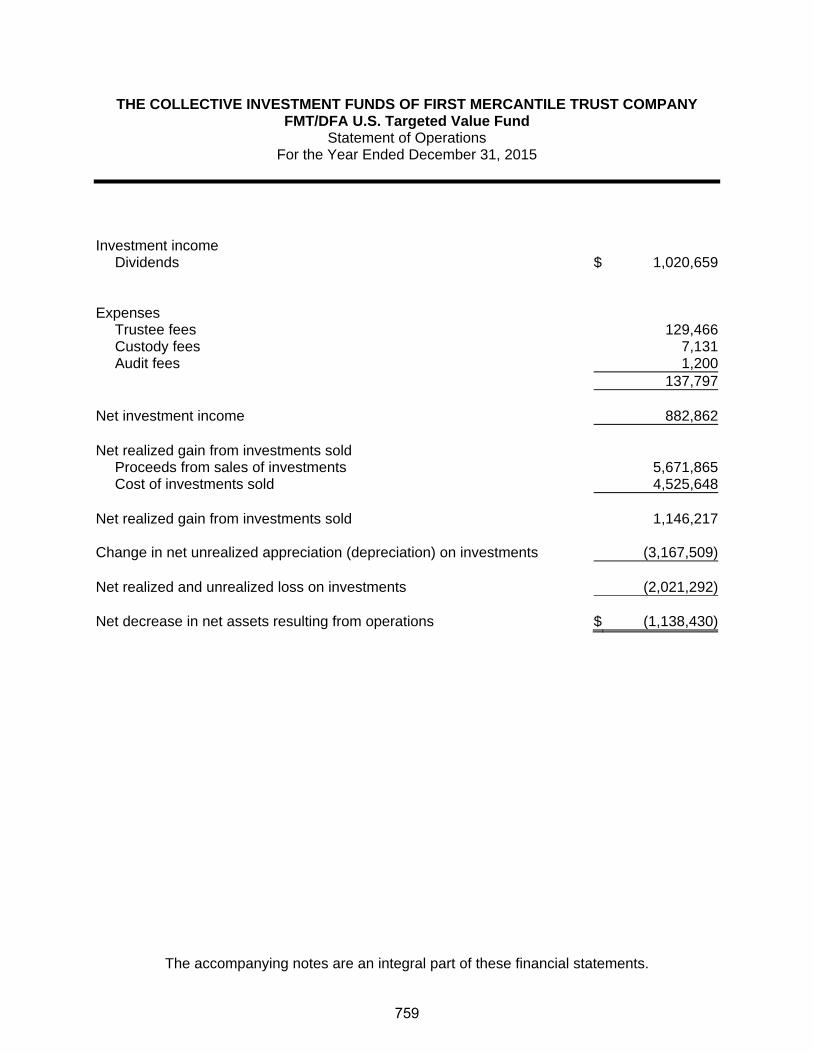
THE COLLECTIVE INVESTMENT FUNDS OF FIRST MERCANTILE TRUST COMPANY FMT/DFA U.S. Targeted Value Fund
Statement of Operations For the Year Ended December 31, 2015
The accompanying notes are an integral part of these financial statements.
Investment income
Dividends $ 1,020,659 Expenses
Trustee fees 129,466Custody fees 7,131Audit fees 1,200
137,797 Net investment income 882,862 Net realized gain from investments sold
Proceeds from sales of investments 5,671,865Cost of investments sold 4,525,648
Net realized gain from investments sold 1,146,217 Change in net unrealized appreciation (depreciation) on investments (3,167,509) Net realized and unrealized loss on investments (2,021,292) Net decrease in net assets resulting from operations $ (1,138,430)
759

THE COLLECTIVE INVESTMENT FUNDS OF FIRST MERCANTILE TRUST COMPANY FMT/DFA U.S. Targeted Value Fund Statement of Changes in Net Assets
For the Year Ended December 31, 2015
The accompanying notes are an integral part of these financial statements.
Operations
Net investment income $ 882,862
Net realized gain from investments sold 1,146,217
Change in net unrealized appreciation (depreciation) on investments (3,167,509)
Net decrease in net assets resulting from operations (1,138,430) Participant transactions
Proceeds from units purchased 6,795,371Less payments for units redeemed 10,184,102
Decrease in net assets from participant transactions (3,388,731)
Total decrease in net assets (4,527,161) Net assets at beginning of year 22,290,683 Net assets at end of year $ 17,763,522
760

THE COLLECTIVE INVESTMENT FUNDS OF FIRST MERCANTILE TRUST COMPANY FMT/DFA U.S. Targeted Value Fund
Schedule of Investments and Specific Fund Disclosures December 31, 2015
The accompanying notes are an integral part of these financial statements.
Investments Shares Fair Value ____________ ____________
Mutual fund (100.1%)
DFA U.S. Targeted Value Portfolio Fund (Cost $16,268,721) 899,901 $ 17,773,049 ______________________
Specific Fund Disclosures Fair value The inputs or methodology used for valuing securities may not be indicative of the risks associated with investing in those securities. For more information on valuation inputs, and their aggregation into the levels used in the table below, please refer to note 4 to the financial statements. The following table sets forth by level, within the fair value hierarchy, the Fund's investments measured at fair value.
Total Level 1 Level 2 Level 3
Mutual fund - Small Mid Cap Value $ 17,773,049 $ 17,773,049 $ — $ —__________ ___________ ___________ ____________________ ___________ ___________ __________
Investment transactions The aggregate cost of purchases of investment securities and proceeds from sales of investment securities (other than temporary cash investments) totaled $3,163,597 and $5,671,865, respectively, for the year ended December 31, 2015. Class-specific expenses Class-specific trustee fees for the year ended December 31, 2015 were as follows: Class R1 $ 32,310 Class R2 9,190 Class R3 33,379 Class R4 14,970 Class R5 11,667 Class R6 17,835 Class R7 6,205 Class R8 3,910 $ 129,466
761

THE COLLECTIVE INVESTMENT FUNDS OF FIRST MERCANTILE TRUST COMPANY FMT/DFA U.S. Targeted Value Fund Schedule of Participant Transactions
December 31, 2015
The accompanying notes are an integral part of these financial statements.
Participant transactions by class for the year ended December 31, 2015 were as follows: Dollars Units Purchases Redemptions Net change Purchases Redemptions Net change Class R1 $ 3,358,496 $ (3,709,364) $ (350,868) 168,025 (182,977) (14,952)Class R2 532,244 (676,322) (144,078) 30,457 (37,529) (7,072)Class R3 911,680 (3,378,913) (2,467,233) 53,612 (199,488) (145,876)Class R4 848,100 (574,329) 273,771 50,145 (33,742) 16,403Class R5 137,430 (538,164) (400,734) 8,051 (31,774) (23,723)Class R6 640,151 (792,648) (152,497) 35,940 (42,848) (6,908)Class R7 312,224 (349,982) (37,758) 18,425 (21,179) (2,754)Class R8 55,046 (164,380) (109,334) 3,342 (9,725) (6,383) $ 6,795,371 $ (10,184,102) $ (3,388,731) 367,997 (559,262) (191,265)
762

THE COLLECTIVE INVESTMENT FUNDS OF FIRST MERCANTILE TRUST COMPANY FMT/DFA U.S. Targeted Value Fund
Financial Highlights December 31, 2015
The accompanying notes are an integral part of these financial statements.
Change in Net Asset Value Resulting from Operations Ratios (to average net
assets)
NAV per Unit, Beginning of
Period
Net Investment
Income (Loss)(a)
Net Realized and Unrealized
Gain (Loss) from
Investments(a)
Total from Investment Activities
NAV per Unit, End of
Period Total
Return Expenses
Net Investment
Income (Loss)
Class R1 $ 20.2895 $ 1.0927 $ (2.3290) $ (1.2363) $ 19.0532 (6.09)% (0.39)% 5.37%Class R2 17.4100 0.8409 (1.9379) (1.0970) 16.3130 (6.30)% (0.61)% 4.84%Class R3 17.0873 0.4403 (1.5444) (1.1041) 15.9832 (6.46)% (0.78)% 2.57%Class R4 16.9871 0.8885 (2.0132) (1.1247) 15.8624 (6.62)% (0.95)% 5.25%Class R5 17.1278 0.4605 (1.6219) (1.1614) 15.9664 (6.78)% (1.12)% 2.69%Class R6 18.0102 0.6588 (1.9088) (1.2500) 16.7602 (6.94)% (1.29)% 3.66%Class R7 16.7366 0.7526 (1.9406) (1.1880) 15.5486 (7.10)% (1.46)% 4.54%Class R8 16.7182 0.3825 (1.5963) (1.2138) 15.5044 (7.26)% (1.63)% 2.28%
(a) Per unit amounts are based on average daily units outstanding.
763

FMT/DFA U.S. Vector Equity Fund
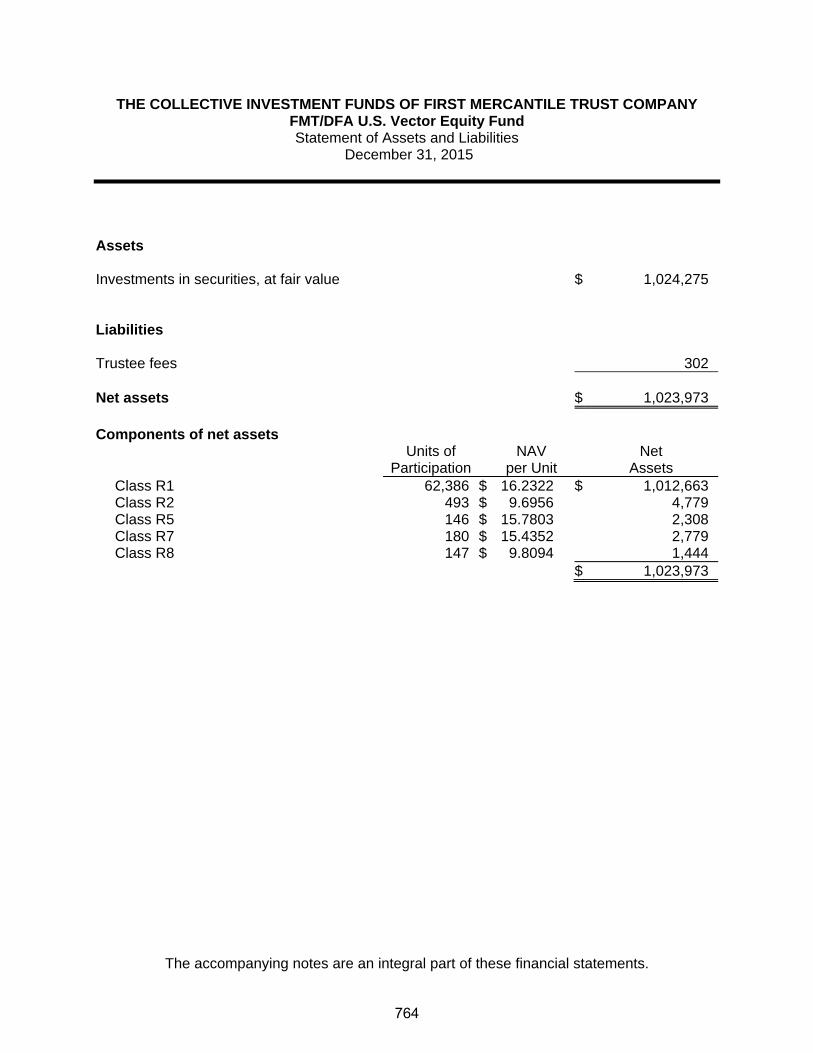
THE COLLECTIVE INVESTMENT FUNDS OF FIRST MERCANTILE TRUST COMPANY FMT/DFA U.S. Vector Equity Fund Statement of Assets and Liabilities
December 31, 2015
The accompanying notes are an integral part of these financial statements.
Assets Investments in securities, at fair value $ 1,024,275 Liabilities Trustee fees 302 Net assets $ 1,023,973 Components of net assets
Units of
Participation NAV
per Unit Net
Assets Class R1 62,386 $ 16.2322 $ 1,012,663Class R2 493 $ 9.6956 4,779Class R5 146 $ 15.7803 2,308Class R7 180 $ 15.4352 2,779Class R8 147 $ 9.8094 1,444
$ 1,023,973
764
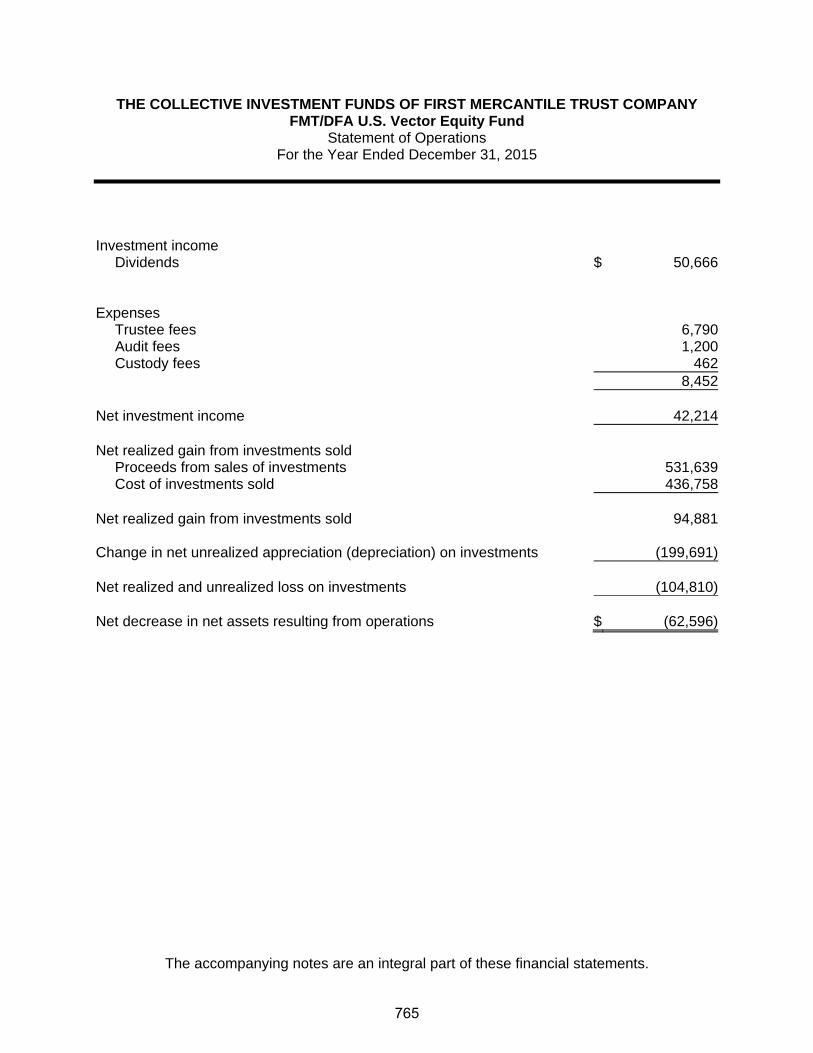
THE COLLECTIVE INVESTMENT FUNDS OF FIRST MERCANTILE TRUST COMPANY FMT/DFA U.S. Vector Equity Fund
Statement of Operations For the Year Ended December 31, 2015
The accompanying notes are an integral part of these financial statements.
Investment income
Dividends $ 50,666 Expenses
Trustee fees 6,790Audit fees 1,200Custody fees 462
8,452 Net investment income 42,214 Net realized gain from investments sold
Proceeds from sales of investments 531,639Cost of investments sold 436,758
Net realized gain from investments sold 94,881 Change in net unrealized appreciation (depreciation) on investments (199,691) Net realized and unrealized loss on investments (104,810) Net decrease in net assets resulting from operations $ (62,596)
765

THE COLLECTIVE INVESTMENT FUNDS OF FIRST MERCANTILE TRUST COMPANY FMT/DFA U.S. Vector Equity Fund Statement of Changes in Net Assets
For the Year Ended December 31, 2015
The accompanying notes are an integral part of these financial statements.
Operations
Net investment income $ 42,214
Net realized gain from investments sold 94,881
Change in net unrealized appreciation (depreciation) on investments (199,691)
Net decrease in net assets resulting from operations (62,596) Participant transactions
Proceeds from units purchased 1,062,682Less payments for units redeemed 1,291,427
Decrease in net assets from participant transactions (228,745)
Total decrease in net assets (291,341) Net assets at beginning of year 1,315,314 Net assets at end of year $ 1,023,973
766
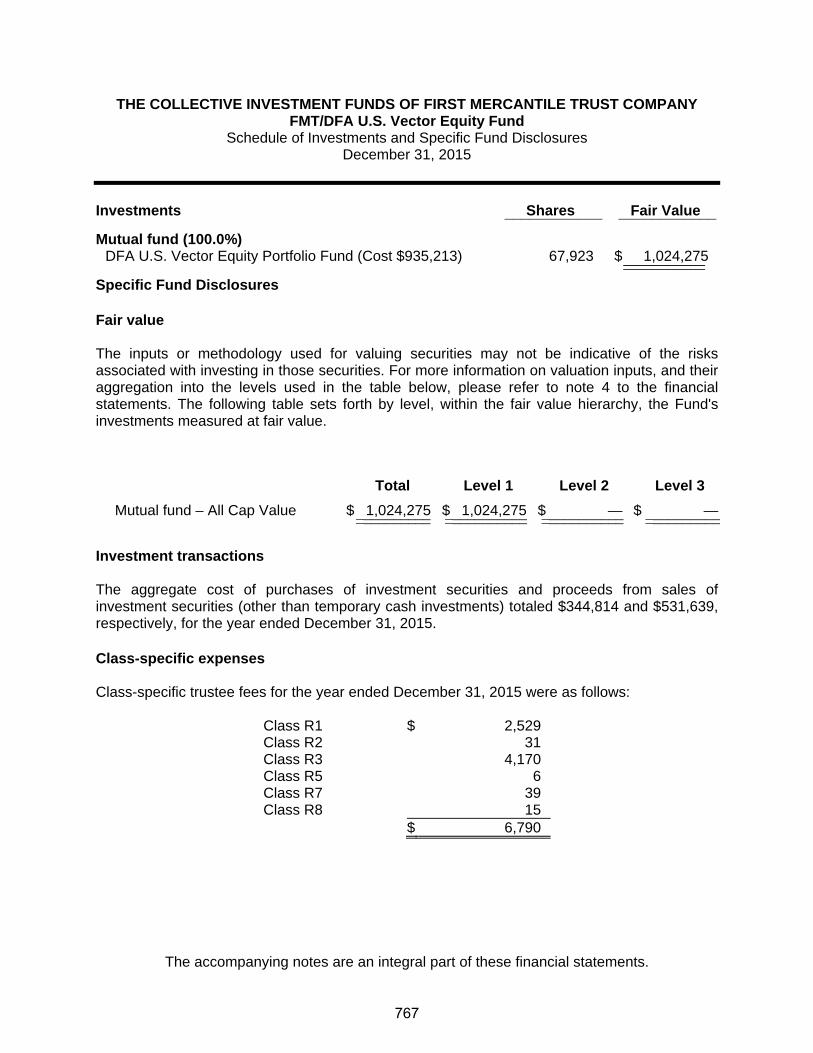
THE COLLECTIVE INVESTMENT FUNDS OF FIRST MERCANTILE TRUST COMPANY FMT/DFA U.S. Vector Equity Fund
Schedule of Investments and Specific Fund Disclosures December 31, 2015
The accompanying notes are an integral part of these financial statements.
Investments Shares Fair Value ____________ ____________
Mutual fund (100.0%) DFA U.S. Vector Equity Portfolio Fund (Cost $935,213) 67,923 $ 1,024,275 ______________________ Specific Fund Disclosures Fair value The inputs or methodology used for valuing securities may not be indicative of the risks associated with investing in those securities. For more information on valuation inputs, and their aggregation into the levels used in the table below, please refer to note 4 to the financial statements. The following table sets forth by level, within the fair value hierarchy, the Fund's investments measured at fair value.
Total Level 1 Level 2 Level 3
Mutual fund – All Cap Value $ 1,024,275 $ 1,024,275 $ — $ —__________ ___________ ___________ ____________________ ___________ ___________ __________ Investment transactions The aggregate cost of purchases of investment securities and proceeds from sales of investment securities (other than temporary cash investments) totaled $344,814 and $531,639, respectively, for the year ended December 31, 2015. Class-specific expenses Class-specific trustee fees for the year ended December 31, 2015 were as follows: Class R1 $ 2,529 Class R2 31 Class R3 4,170 Class R5 6 Class R7 39 Class R8 15 $ 6,790
767

THE COLLECTIVE INVESTMENT FUNDS OF FIRST MERCANTILE TRUST COMPANY FMT/DFA U.S. Vector Equity Fund Schedule of Participant Transactions
December 31, 2015
The accompanying notes are an integral part of these financial statements.
Participant transactions by class for the year ended December 31, 2015 were as follows: Dollars Units Purchases Redemptions Net change Purchases Redemptions Net change Class R1 $ 898,463 $ (516,584) $ 381,879 53,667 (30,353) 23,314Class R2 1,932 (6,005) (4,073) 188 (566) (378)Class R3 158,143 (768,683) (610,540) 9,267 (46,084) (36,817)Class R5 2,200 — 2,200 135 — 135Class R7 556 (47) 509 34 (3) 31Class R8 1,388 (108) 1,280 132 (10) 122 $ 1,062,682 $ (1,291,427) $ (228,745) 63,423 (77,016) (13,593)
768

THE COLLECTIVE INVESTMENT FUNDS OF FIRST MERCANTILE TRUST COMPANY FMT/DFA U.S. Vector Equity Fund
Financial Highlights December 31, 2015
The accompanying notes are an integral part of these financial statements.
Change in Net Asset Value Resulting from Operations Ratios (to average net
assets)
NAV per Unit, Beginning of
Period
Net Investment
Income (Loss)(a)
Net Realized and Unrealized
Gain (Loss) from
Investments(a)
Total from Investment Activities
NAV per Unit, End of
Period Total
Return Expenses
Net Investment
Income (Loss)
Class R1 $ 17.1762 $ 0.9492 $ (1.8932) $ (0.9440) $ 16.2322 (5.50)% (0.48)% 5.57%Class R2 10.2824 0.3713 (0.9581) (0.5868) 9.6956 (5.71)% (0.70)% 3.63%Class R3(b) 17.1748 0.0381 (0.5557) (0.5176) — (3.01)% (0.87)% 0.28%Class R5 16.7400 2.3243 (3.2840) (0.9597) 15.7803 (5.73)% (1.04)% 14.26%Class R7 16.5115 0.5488 (1.6251) (1.0763) 15.4352 (6.52)% (1.56)% 3.35%Class R8 10.5093 0.4947 (1.1946) (0.6999) 9.8094 (6.66)% (1.71)% 4.79%
(a) Per unit amounts are based on average daily units outstanding.
(b) For the period from January 1, 2015 through October 15, 2015.
769

FMT/Dodge & Cox International Fund

THE COLLECTIVE INVESTMENT FUNDS OF FIRST MERCANTILE TRUST COMPANY FMT/Dodge & Cox International Fund
Statement of Assets and Liabilities December 31, 2015
The accompanying notes are an integral part of these financial statements.
Assets Investments in securities, at fair value $ 55,130,320 Liabilities Trustee fees 20,731 Net assets $ 55,109,589 Components of net assets
Units of
Participation NAV
per Unit Net
Assets Class R1 2,447,061 $ 11.9503 $ 29,243,072Class R2 182,181 $ 13.0257 2,373,032Class R3 373,281 $ 13.0312 4,864,295Class R4 190,130 $ 13.5324 2,572,907Class R5 149,145 $ 13.6046 2,029,046Class R6 115,209 $ 13.2973 1,531,974Class R7 72,025 $ 12.5828 906,267Class R8 53,276 $ 13.1670 701,480Class LifeStyle 10,887,516
$ 55,109,589
770

THE COLLECTIVE INVESTMENT FUNDS OF FIRST MERCANTILE TRUST COMPANY FMT/Dodge & Cox International Fund
Statement of Operations For the Year Ended December 31, 2015
The accompanying notes are an integral part of these financial statements.
Investment income
Dividends $ 1,242,935 Expenses
Trustee fees 341,603Custody fees 20,485Audit fees 1,465
363,553 Net investment income 879,382 Net realized gain from investments sold
Proceeds from sales of investments 14,030,599Cost of investments sold 12,657,143
Net realized gain from investments sold 1,373,456 Change in net unrealized appreciation (depreciation) on investments (8,810,080) Net realized and unrealized loss on investments (7,436,624) Other operating credits (charges) 45,439 Net decrease in net assets resulting from operations $ (6,511,803)
771
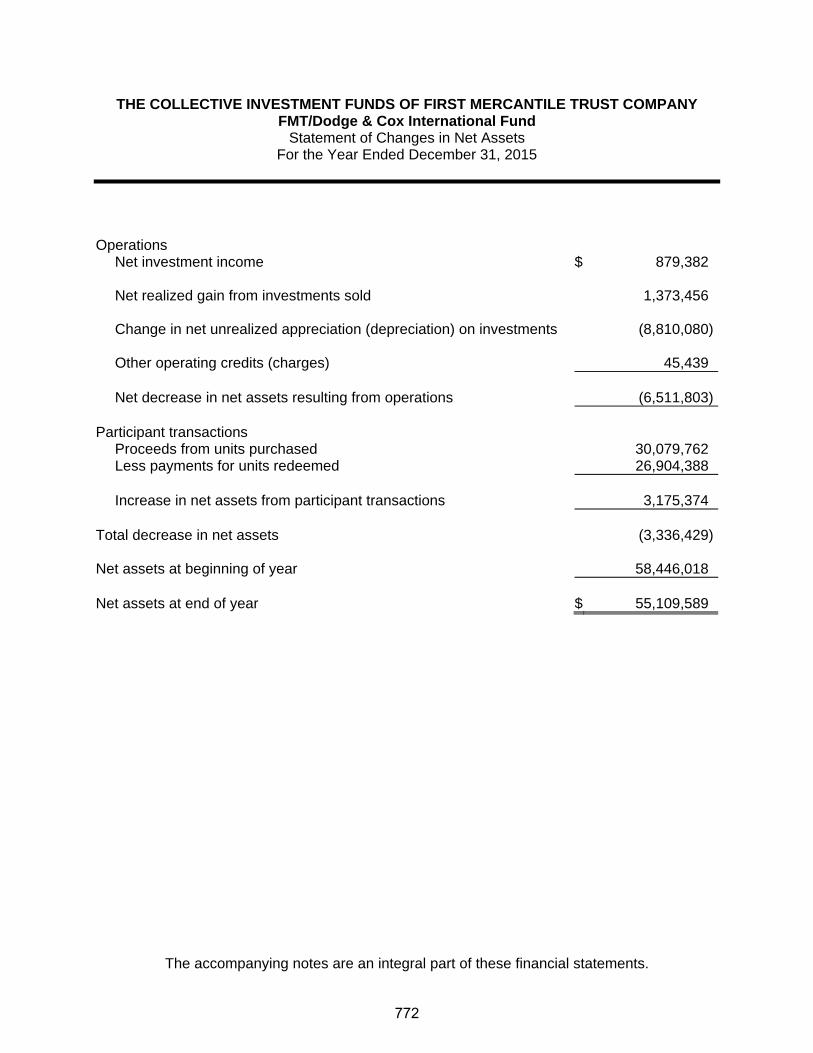
THE COLLECTIVE INVESTMENT FUNDS OF FIRST MERCANTILE TRUST COMPANY FMT/Dodge & Cox International Fund
Statement of Changes in Net Assets For the Year Ended December 31, 2015
The accompanying notes are an integral part of these financial statements.
Operations
Net investment income $ 879,382
Net realized gain from investments sold 1,373,456
Change in net unrealized appreciation (depreciation) on investments (8,810,080)
Other operating credits (charges) 45,439
Net decrease in net assets resulting from operations (6,511,803) Participant transactions
Proceeds from units purchased 30,079,762Less payments for units redeemed 26,904,388
Increase in net assets from participant transactions 3,175,374
Total decrease in net assets (3,336,429) Net assets at beginning of year 58,446,018 Net assets at end of year $ 55,109,589
772

THE COLLECTIVE INVESTMENT FUNDS OF FIRST MERCANTILE TRUST COMPANY FMT/Dodge & Cox International Fund
Schedule of Investments and Specific Fund Disclosures December 31, 2015
The accompanying notes are an integral part of these financial statements.
Investments Shares Fair Value ____________ ____________
Mutual fund (100.0%)
Dodge and Cox International Stock Fund (Cost $57,812,367) 1,511,248 $ 55,130,320 ____________________
Specific Fund Disclosures Fair value The inputs or methodology used for valuing securities may not be indicative of the risks associated with investing in those securities. For more information on valuation inputs, and their aggregation into the levels used in the table below, please refer to note 4 to the financial statements. The following table sets forth by level, within the fair value hierarchy, the Fund's investments measured at fair value.
Total Level 1 Level 2 Level 3
Mutual fund - International Value $ 55,130,320 $ 55,130,320 $ — $ —__________ __________ __________ ___________________ __________ __________ _________ Investment transactions The aggregate cost of purchases of investment securities and proceeds from sales of investment securities (other than temporary cash investments) totaled $18,117,483 and $14,030,599, respectively, for the year ended December 31, 2015. Class-specific expenses Class-specific trustee fees for the year ended December 31, 2015 were as follows: Class R1 $ 91,151 Class R2 16,688 Class R3 38,681 Class R4 33,371 Class R5 34,039 Class R6 20,939 Class R7 15,011 Class R8 10,933 Class LifeStyle 80,790 $ 341,603
773
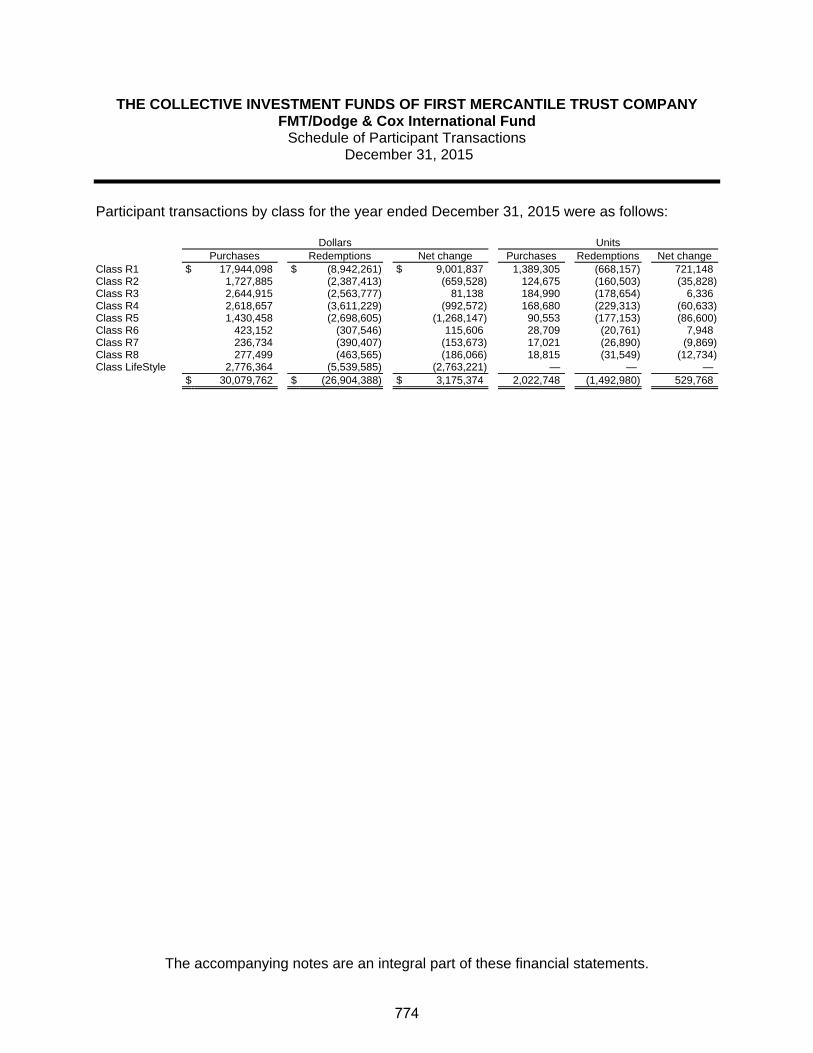
THE COLLECTIVE INVESTMENT FUNDS OF FIRST MERCANTILE TRUST COMPANY FMT/Dodge & Cox International Fund
Schedule of Participant Transactions December 31, 2015
The accompanying notes are an integral part of these financial statements.
Participant transactions by class for the year ended December 31, 2015 were as follows: Dollars Units Purchases Redemptions Net change Purchases Redemptions Net change Class R1 $ 17,944,098 $ (8,942,261) $ 9,001,837 1,389,305 (668,157) 721,148Class R2 1,727,885 (2,387,413) (659,528) 124,675 (160,503) (35,828)Class R3 2,644,915 (2,563,777) 81,138 184,990 (178,654) 6,336Class R4 2,618,657 (3,611,229) (992,572) 168,680 (229,313) (60,633)Class R5 1,430,458 (2,698,605) (1,268,147) 90,553 (177,153) (86,600)Class R6 423,152 (307,546) 115,606 28,709 (20,761) 7,948Class R7 236,734 (390,407) (153,673) 17,021 (26,890) (9,869)Class R8 277,499 (463,565) (186,066) 18,815 (31,549) (12,734)Class LifeStyle 2,776,364 (5,539,585) (2,763,221) — — — $ 30,079,762 $ (26,904,388) $ 3,175,374 2,022,748 (1,492,980) 529,768
774

THE COLLECTIVE INVESTMENT FUNDS OF FIRST MERCANTILE TRUST COMPANY FMT/Dodge & Cox International Fund
Financial Highlights December 31, 2015
The accompanying notes are an integral part of these financial statements.
Change in Net Asset Value Resulting from Operations Ratios (to average net
assets)
NAV per Unit, Beginning of
Period
Net Investment
Income (Loss)(a)
Net Realized and Unrealized
Gain (Loss) from
Investments(a)
Total from Investment Activities
NAV per Unit, End of
Period Total
Return Expenses
Net Investment
Income (Loss)
Class R1 $ 13.5232 $ 0.2959 $ (1.8688) $ (1.5729) $ 11.9503 (11.63)% (0.39)% 2.22%Class R2 14.7729 0.1786 (1.9258) (1.7472) 13.0257 (11.83)% (0.61)% 1.21%Class R3 14.8044 0.2157 (1.9889) (1.7732) 13.0312 (11.98)% (0.78)% 1.46%Class R4 15.4004 0.1097 (1.9777) (1.8680) 13.5324 (12.13)% (0.95)% 0.71%Class R5 15.5088 0.0665 (1.9707) (1.9042) 13.6046 (12.28)% (1.12)% 0.43%Class R6 15.1847 0.1263 (2.0137) (1.8874) 13.2973 (12.43)% (1.29)% 0.84%Class R7 14.3934 0.0778 (1.8884) (1.8106) 12.5828 (12.58)% (1.46)% 0.54%Class R8 15.0874 0.1045 (2.0249) (1.9204) 13.1670 (12.73)% (1.63)% 0.70%
(a) Per unit amounts are based on average daily units outstanding.
775
FMT/Dodge & Cox Stock Fund

THE COLLECTIVE INVESTMENT FUNDS OF FIRST MERCANTILE TRUST COMPANY FMT/Dodge & Cox Stock Fund
Statement of Assets and Liabilities December 31, 2015
The accompanying notes are an integral part of these financial statements.
Assets Investments in securities, at fair value $ 68,364,799 Liabilities Trustee fees 38,952 Net assets $ 68,325,847 Components of net assets
Units of
Participation NAV
per Unit Net
Assets Class R1 1,911,973 $ 15.6997 $ 30,017,306Class R2 443,455 $ 17.3455 7,691,971Class R3 506,264 $ 17.1825 8,698,895Class R4 517,855 $ 17.9975 9,320,101Class R5 302,985 $ 17.7384 5,374,486Class R6 267,068 $ 18.3304 4,895,478Class R7 72,727 $ 17.1224 1,245,268Class R8 67,166 $ 16.1143 1,082,342
$ 68,325,847
776

THE COLLECTIVE INVESTMENT FUNDS OF FIRST MERCANTILE TRUST COMPANY FMT/Dodge & Cox Stock Fund
Statement of Operations For the Year Ended December 31, 2015
The accompanying notes are an integral part of these financial statements.
Investment income
Dividends $ 4,190,266 Expenses
Trustee fees 520,189Custody fees 27,054Audit fees 1,200
548,443 Net investment income 3,641,823 Net realized gain from investments sold
Proceeds from sales of investments 17,620,057Cost of investments sold 14,595,661
Net realized gain from investments sold 3,024,396 Change in net unrealized appreciation (depreciation) on investments (10,506,814) Net realized and unrealized loss on investments (7,482,418) Other operating credits (charges) 55,020 Net decrease in net assets resulting from operations $ (3,785,575)
777

THE COLLECTIVE INVESTMENT FUNDS OF FIRST MERCANTILE TRUST COMPANY FMT/Dodge & Cox Stock Fund
Statement of Changes in Net Assets For the Year Ended December 31, 2015
The accompanying notes are an integral part of these financial statements.
Operations
Net investment income $ 3,641,823
Net realized gain from investments sold 3,024,396
Change in net unrealized appreciation (depreciation) on investments (10,506,814)
Other operating credits (charges) 55,020
Net decrease in net assets resulting from operations (3,785,575) Participant transactions
Proceeds from units purchased 18,194,005Less payments for units redeemed 30,813,597
Decrease in net assets from participant transactions (12,619,592)
Total decrease in net assets (16,405,167) Net assets at beginning of year 84,731,014 Net assets at end of year $ 68,325,847
778
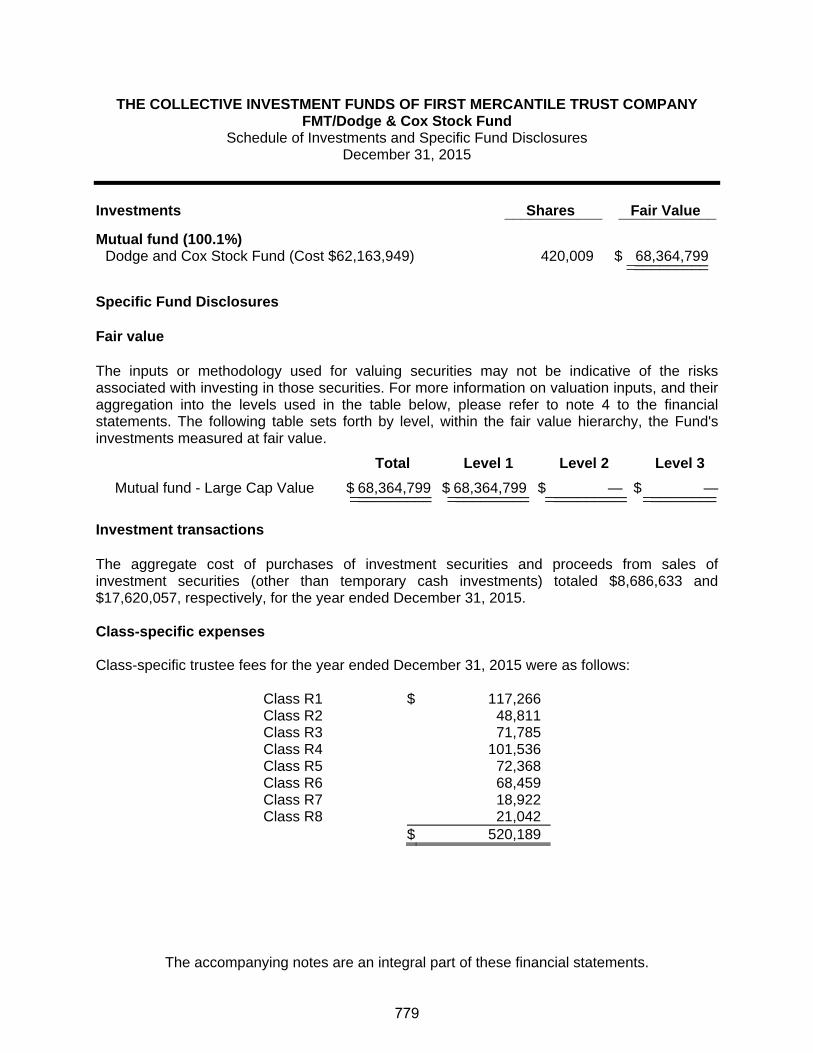
THE COLLECTIVE INVESTMENT FUNDS OF FIRST MERCANTILE TRUST COMPANY FMT/Dodge & Cox Stock Fund
Schedule of Investments and Specific Fund Disclosures December 31, 2015
The accompanying notes are an integral part of these financial statements.
Investments Shares Fair Value ____________ ____________
Mutual fund (100.1%) Dodge and Cox Stock Fund (Cost $62,163,949) 420,009 $ 68,364,799 ____________________ Specific Fund Disclosures Fair value The inputs or methodology used for valuing securities may not be indicative of the risks associated with investing in those securities. For more information on valuation inputs, and their aggregation into the levels used in the table below, please refer to note 4 to the financial statements. The following table sets forth by level, within the fair value hierarchy, the Fund's investments measured at fair value.
Total Level 1 Level 2 Level 3
Mutual fund - Large Cap Value $ 68,364,799 $ 68,364,799 $ — $ —__________ __________ __________ ___________________ __________ __________ _________ Investment transactions The aggregate cost of purchases of investment securities and proceeds from sales of investment securities (other than temporary cash investments) totaled $8,686,633 and $17,620,057, respectively, for the year ended December 31, 2015. Class-specific expenses Class-specific trustee fees for the year ended December 31, 2015 were as follows: Class R1 $ 117,266 Class R2 48,811 Class R3 71,785 Class R4 101,536 Class R5 72,368 Class R6 68,459 Class R7 18,922 Class R8 21,042 $ 520,189
779

THE COLLECTIVE INVESTMENT FUNDS OF FIRST MERCANTILE TRUST COMPANY FMT/Dodge & Cox Stock Fund
Schedule of Participant Transactions December 31, 2015
The accompanying notes are an integral part of these financial statements.
Participant transactions by class for the year ended December 31, 2015 were as follows: Dollars Units Purchases Redemptions Net change Purchases Redemptions Net change Class R1 $ 6,680,647 $ (11,128,145) $ (4,447,498) 408,234 (683,299) (275,065)Class R2 2,988,281 (3,435,965) (447,684) 166,823 (187,651) (20,828)Class R3 3,294,982 (4,544,335) (1,249,353) 181,363 (254,347) (72,984)Class R4 3,258,217 (5,318,191) (2,059,974) 172,329 (279,470) (107,141)Class R5 908,182 (3,697,197) (2,789,015) 49,757 (199,828) (150,071)Class R6 534,364 (1,390,169) (855,805) 27,813 (72,570) (44,757)Class R7 306,988 (599,061) (292,073) 17,298 (33,752) (16,454)Class R8 222,344 (700,534) (478,190) 13,489 (41,495) (28,006) $ 18,194,005 $ (30,813,597) $ (12,619,592) 1,037,106 (1,752,412) (715,306)
780

THE COLLECTIVE INVESTMENT FUNDS OF FIRST MERCANTILE TRUST COMPANY FMT/Dodge & Cox Stock Fund
Financial Highlights December 31, 2015
The accompanying notes are an integral part of these financial statements.
Change in Net Asset Value Resulting from Operations Ratios (to average net
assets)
NAV per Unit, Beginning of
Period
Net Investment
Income (Loss)(a)
Net Realized and Unrealized
Gain (Loss) from
Investments(a)
Total from Investment Activities
NAV per Unit, End of
Period Total
Return Expenses
Net Investment
Income (Loss)
Class R1 $ 16.4898 $ 0.8407 $ (1.6308) $ (0.7901) $ 15.6997 (4.79)% (0.39)% 5.15%Class R2 18.2589 0.8344 (1.7478) (0.9134) 17.3455 (5.00)% (0.61)% 4.61%Class R3 18.1183 0.8690 (1.8048) (0.9358) 17.1825 (5.16)% (0.78)% 4.86%Class R4 19.0101 0.8205 (1.8331) (1.0126) 17.9975 (5.33)% (0.95)% 4.37%Class R5 18.7686 0.7855 (1.8157) (1.0302) 17.7384 (5.49)% (1.12)% 4.24%Class R6 19.4282 0.8110 (1.9088) (1.0978) 18.3304 (5.65)% (1.29)% 4.23%Class R7 18.1790 0.7533 (1.8099) (1.0566) 17.1224 (5.81)% (1.46)% 4.21%Class R8 17.1380 0.5934 (1.6171) (1.0237) 16.1143 (5.97)% (1.63)% 3.52%
(a) Per unit amounts are based on average daily units outstanding.
781

FMT/Domini Social Equity Fund

THE COLLECTIVE INVESTMENT FUNDS OF FIRST MERCANTILE TRUST COMPANY FMT/Domini Social Equity Fund Statement of Assets and Liabilities
December 31, 2015
The accompanying notes are an integral part of these financial statements.
Assets Investments in securities, at fair value $ 1,632,518 Liabilities Trustee fees 964 Net assets $ 1,631,554 Components of net assets
Units of
Participation NAV
per Unit Net
Assets Class R1 21,099 $ 14.7748 $ 311,727Class R2 58,616 $ 13.9666 818,660Class R3 1,487 $ 13.7344 20,423Class R4 9,626 $ 14.5053 139,633Class R5 10,815 $ 14.1255 152,765Class R6 12,680 $ 14.2502 180,696Class R7 353 $ 14.9196 5,273Class R8 179 $ 13.3063 2,377
$ 1,631,554
782782

THE COLLECTIVE INVESTMENT FUNDS OF FIRST MERCANTILE TRUST COMPANY FMT/Domini Social Equity Fund
Statement of Operations For the Year Ended December 31, 2015
The accompanying notes are an integral part of these financial statements.
Investment income
Dividends $ 182,260 Expenses
Trustee fees 12,124Audit fees 1,200Custody fees 635
13,959 Net investment income 168,301 Net realized gain from investments sold
Proceeds from sales of investments 683,144Cost of investments sold 532,896
Net realized gain from investments sold 150,248 Change in net unrealized appreciation (depreciation) on investments (459,585) Net realized and unrealized loss on investments (309,337) Other operating credits (charges) 6,774 Net decrease in net assets resulting from operations $ (134,262)
783783

THE COLLECTIVE INVESTMENT FUNDS OF FIRST MERCANTILE TRUST COMPANY FMT/Domini Social Equity Fund
Statement of Changes in Net Assets For the Year Ended December 31, 2015
The accompanying notes are an integral part of these financial statements.
Operations
Net investment income $ 168,301
Net realized gain from investments sold 150,248
Change in net unrealized appreciation (depreciation) on investments (459,585)
Other operating credits (charges) 6,774
Net decrease in net assets resulting from operations (134,262) Participant transactions
Proceeds from units purchased 599,520Less payments for units redeemed 783,403
Decrease in net assets from participant transactions (183,883)
Total decrease in net assets (318,145) Net assets at beginning of year 1,949,699 Net assets at end of year $ 1,631,554
784784

THE COLLECTIVE INVESTMENT FUNDS OF FIRST MERCANTILE TRUST COMPANY FMT/Domini Social Equity Fund
Schedule of Investments and Specific Fund Disclosures December 31, 2015
The accompanying notes are an integral part of these financial statements.
Investments Shares Fair Value ____________ ____________
Mutual fund (100.1%) Domini Social Equity Investment Fund (Cost $1,577,158) 75,966 $ 1,632,518 ______________________ Specific Fund Disclosures Fair value The inputs or methodology used for valuing securities may not be indicative of the risks associated with investing in those securities. For more information on valuation inputs, and their aggregation into the levels used in the table below, please refer to note 4 to the financial statements. The following table sets forth by level, within the fair value hierarchy, the Fund's investments measured at fair value.
Total Level 1 Level 2 Level 3
Mutual fund - Large Cap Core $ 1,632,518 $ 1,632,518 $ — $ —__________ __________ __________ ___________________ ___________ ___________ __________ Investment transactions The aggregate cost of purchases of investment securities and proceeds from sales of investment securities (other than temporary cash investments) totaled $674,088 and $683,144, respectively, for the year ended December 31, 2015. Class-specific expenses Class-specific trustee fees for the year ended December 31, 2015 were as follows: Class R1 $ 1,363 Class R2 4,790 Class R3 325 Class R4 1,689 Class R5 1,480 Class R6 2,377 Class R7 54 Class R8 46 $ 12,124
785785
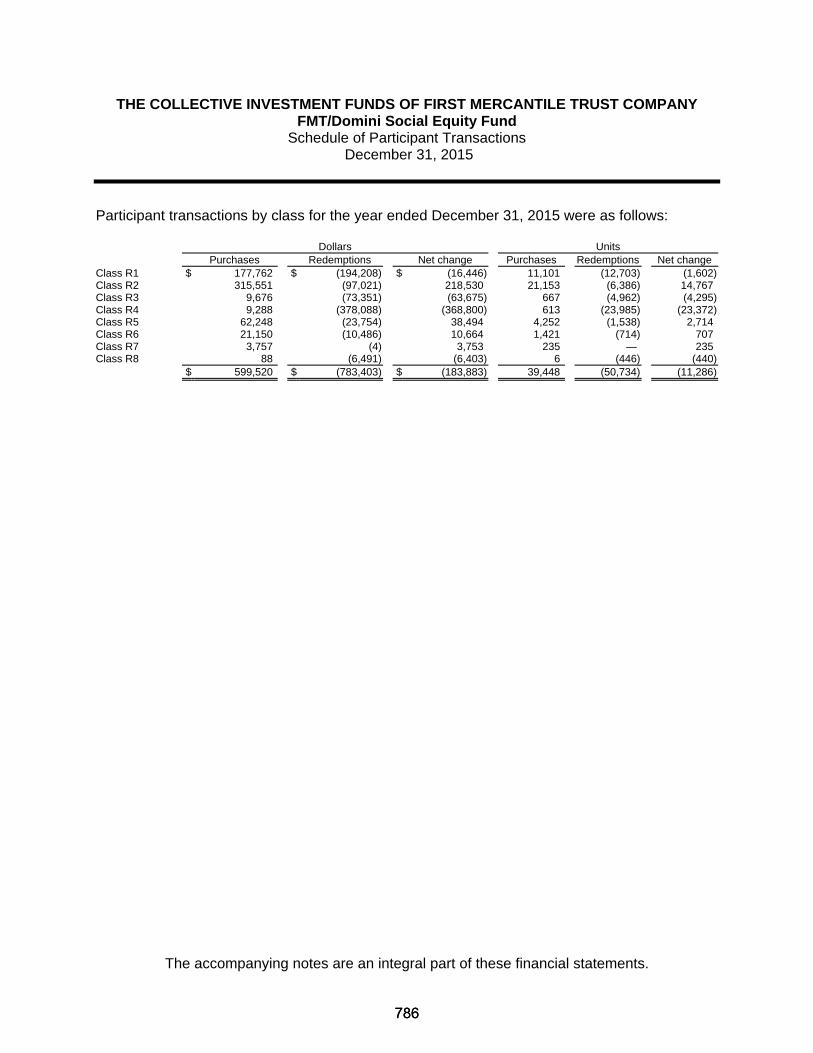
THE COLLECTIVE INVESTMENT FUNDS OF FIRST MERCANTILE TRUST COMPANY FMT/Domini Social Equity Fund
Schedule of Participant Transactions December 31, 2015
The accompanying notes are an integral part of these financial statements.
Participant transactions by class for the year ended December 31, 2015 were as follows: Dollars Units Purchases Redemptions Net change Purchases Redemptions Net change Class R1 $ 177,762 $ (194,208) $ (16,446) 11,101 (12,703) (1,602)Class R2 315,551 (97,021) 218,530 21,153 (6,386) 14,767Class R3 9,676 (73,351) (63,675) 667 (4,962) (4,295)Class R4 9,288 (378,088) (368,800) 613 (23,985) (23,372)Class R5 62,248 (23,754) 38,494 4,252 (1,538) 2,714Class R6 21,150 (10,486) 10,664 1,421 (714) 707Class R7 3,757 (4) 3,753 235 — 235Class R8 88 (6,491) (6,403) 6 (446) (440) $ 599,520 $ (783,403) $ (183,883) 39,448 (50,734) (11,286)
786786

THE COLLECTIVE INVESTMENT FUNDS OF FIRST MERCANTILE TRUST COMPANY FMT/Domini Social Equity Fund
Financial Highlights December 31, 2015
The accompanying notes are an integral part of these financial statements.
Change in Net Asset Value Resulting from Operations Ratios (to average net
assets)
NAV per Unit, Beginning of
Period
Net Investment
Income (Loss)(a)
Net Realized and Unrealized
Gain (Loss) from
Investments(a)
Total from Investment Activities
NAV per Unit, End of
Period Total
Return Expenses
Net Investment
Income (Loss)
Class R1 $ 15.9342 $ 1.4204 $ (2.5798) $ (1.1594) $ 14.7748 (7.28)% (0.45)% 9.07%Class R2 15.0960 1.5582 (2.6876) (1.1294) 13.9666 (7.48)% (0.67)% 10.50%Class R3 14.8710 0.7041 (1.8407) (1.1366) 13.7344 (7.64)% (0.84)% 4.75%Class R4 15.7321 1.2076 (2.4344) (1.2268) 14.5053 (7.80)% (1.01)% 7.79%Class R5 15.3464 1.7583 (2.9792) (1.2209) 14.1255 (7.96)% (1.18)% 11.72%Class R6 15.5084 1.4529 (2.7111) (1.2582) 14.2502 (8.11)% (1.35)% 9.56%Class R7 16.2655 2.1925 (3.5384) (1.3459) 14.9196 (8.27)% (1.52)% 13.86%Class R8 14.5279 1.1014 (2.3230) (1.2216) 13.3063 (8.41)% (1.67)% 7.71%
(a) Per unit amounts are based on average daily units outstanding.
787787

FMT/Fifth Third Equity Index Fund

THE COLLECTIVE INVESTMENT FUNDS OF FIRST MERCANTILE TRUST COMPANY FMT/Fifth Third Equity Index Fund Statement of Assets and Liabilities
December 31, 2015
The accompanying notes are an integral part of these financial statements.
Assets Investments in securities, at fair value $ 2,490,389 Liabilities Trustee fees 852 Net assets $ 2,489,537 Components of net assets
Units of
Participation NAV
per Unit Net
Assets Class R1 165,529 $ 15.0399 $ 2,489,537
788
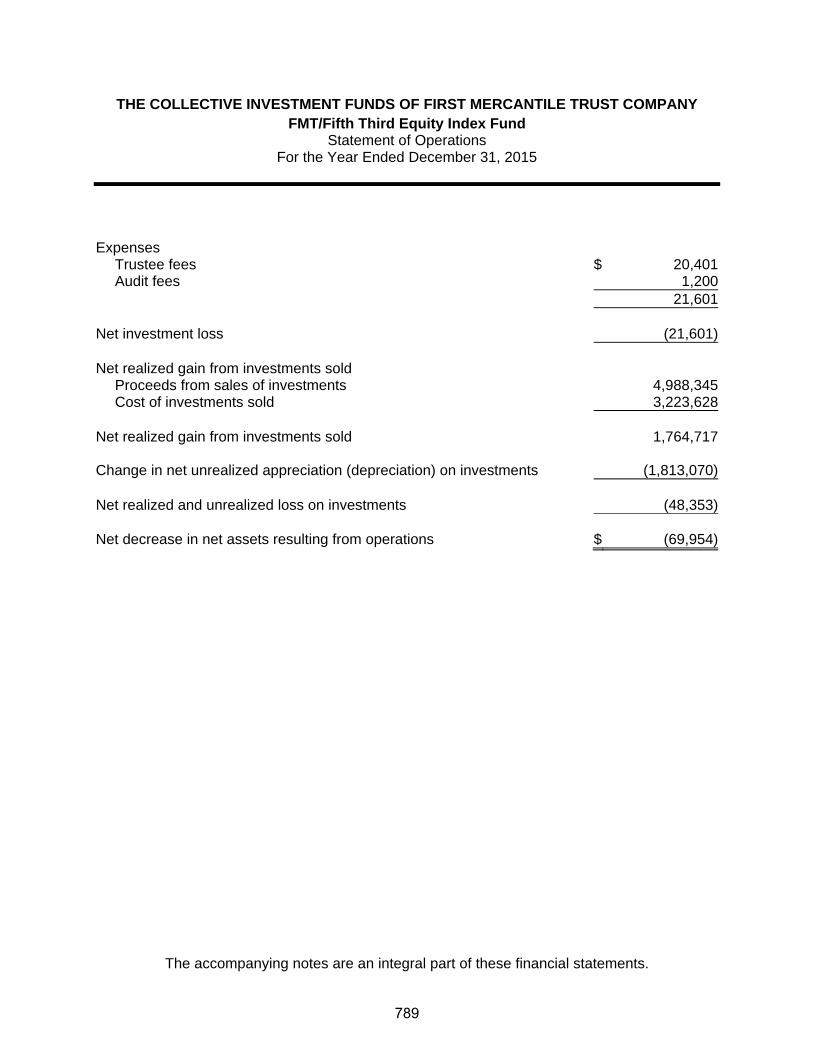
THE COLLECTIVE INVESTMENT FUNDS OF FIRST MERCANTILE TRUST COMPANY FMT/Fifth Third Equity Index Fund
Statement of Operations For the Year Ended December 31, 2015
The accompanying notes are an integral part of these financial statements.
Expenses
Trustee fees $ 20,401Audit fees 1,200
21,601 Net investment loss (21,601) Net realized gain from investments sold
Proceeds from sales of investments 4,988,345Cost of investments sold 3,223,628
Net realized gain from investments sold 1,764,717 Change in net unrealized appreciation (depreciation) on investments (1,813,070) Net realized and unrealized loss on investments (48,353) Net decrease in net assets resulting from operations $ (69,954)
789

THE COLLECTIVE INVESTMENT FUNDS OF FIRST MERCANTILE TRUST COMPANY FMT/Fifth Third Equity Index Fund Statement of Changes in Net Assets
For the Year Ended December 31, 2015
The accompanying notes are an integral part of these financial statements.
Operations
Net investment loss $ (21,601)
Net realized gain from investments sold 1,764,717
Change in net unrealized appreciation (depreciation) on investments (1,813,070)
Net decrease in net assets resulting from operations (69,954) Participant transactions
Proceeds from units purchased 562,479Less payments for units redeemed 5,071,706
Decrease in net assets from participant transactions (4,509,227)
Total decrease in net assets (4,579,181) Net assets at beginning of year 7,068,718 Net assets at end of year $ 2,489,537
790
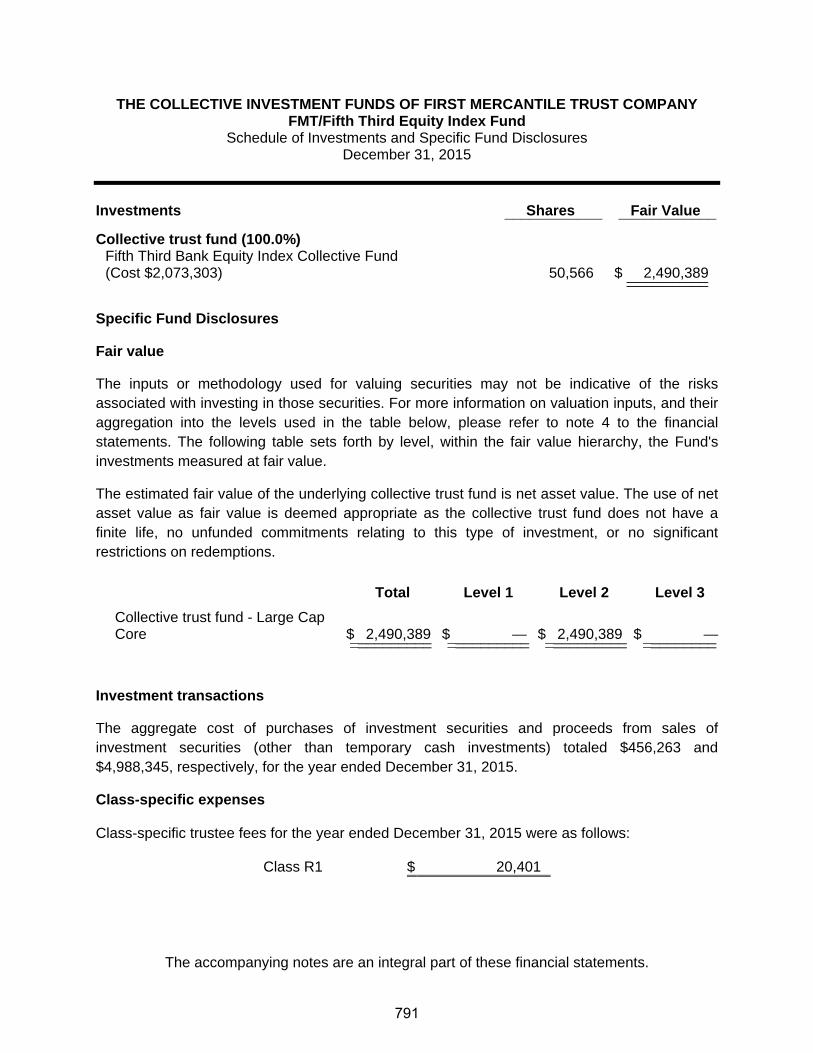
THE COLLECTIVE INVESTMENT FUNDS OF FIRST MERCANTILE TRUST COMPANY FMT/Fifth Third Equity Index Fund
Schedule of Investments and Specific Fund Disclosures December 31, 2015
The accompanying notes are an integral part of these financial statements.
Investments Shares Fair Value ____________ ____________
Collective trust fund (100.0%)
Fifth Third Bank Equity Index Collective Fund (Cost $2,073,303) 50,566 $ 2,490,389 ____________________
Specific Fund Disclosures
Fair value
The inputs or methodology used for valuing securities may not be indicative of the risks associated with investing in those securities. For more information on valuation inputs, and their aggregation into the levels used in the table below, please refer to note 4 to the financial statements. The following table sets forth by level, within the fair value hierarchy, the Fund's investments measured at fair value.
The estimated fair value of the underlying collective trust fund is net asset value. The use of net asset value as fair value is deemed appropriate as the collective trust fund does not have a finite life, no unfunded commitments relating to this type of investment, or no significant restrictions on redemptions.
Total Level 1 Level 2 Level 3
Collective trust fund - Large Cap Core $ 2,490,389 $ — $ 2,490,389 $ —__________ __________ __________ ___________________ __________ __________ _________
Investment transactions
The aggregate cost of purchases of investment securities and proceeds from sales of investment securities (other than temporary cash investments) totaled $456,263 and $4,988,345, respectively, for the year ended December 31, 2015.
Class-specific expenses Class-specific trustee fees for the year ended December 31, 2015 were as follows: Class R1 $ 20,401
791

THE COLLECTIVE INVESTMENT FUNDS OF FIRST MERCANTILE TRUST COMPANY FMT/Fifth Third Equity Index Fund Schedule of Participant Transactions
December 31, 2015
The accompanying notes are an integral part of these financial statements.
Participant transactions by class for the year ended December 31, 2015 were as follows: Dollars Units Purchases Redemptions Net change Purchases Redemptions Net change Class R1 $ 562,479 $ (5,071,706) $ (4,509,227) 37,177 (345,573) (308,396)
792

THE COLLECTIVE INVESTMENT FUNDS OF FIRST MERCANTILE TRUST COMPANY FMT/Fifth Third Equity Index Fund
Financial Highlights December 31, 2015
The accompanying notes are an integral part of these financial statements.
Change in Net Asset Value Resulting from Operations Ratios (to average net
assets)
NAV per Unit, Beginning of
Period
Net Investment
Income (Loss)(a)
Net Realized and Unrealized
Gain (Loss) from
Investments(a)
Total from Investment Activities
NAV per Unit, End of
Period Total
Return Expenses
Net Investment
Income (Loss)
Class R1 $ 14.9153 $ — $ 0.1246 $ 0.1246 $ 15.0399 0.84% (0.37)% (0.37)%
(a) Per unit amounts are based on average daily units outstanding.
793

FMT/Franklin Mutual Global Discovery Fund

THE COLLECTIVE INVESTMENT FUNDS OF FIRST MERCANTILE TRUST COMPANY FMT/Franklin Mutual Global Discovery Fund
Statement of Assets and Liabilities December 31, 2015
The accompanying notes are an integral part of these financial statements.
Assets Investments in securities, at fair value $ 2,363,625 Liabilities Trustee fees 1,546 Net assets $ 2,362,079 Components of net assets
Units of
Participation NAV
per Unit Net
Assets Class R1 14,300 $ 13.2683 $ 189,743Class R3 126,245 $ 14.0811 1,777,659Class R4 797 $ 14.0920 11,226Class R5 28,557 $ 13.2918 379,577Class R8 328 $ 11.8198 3,874
$ 2,362,079
794
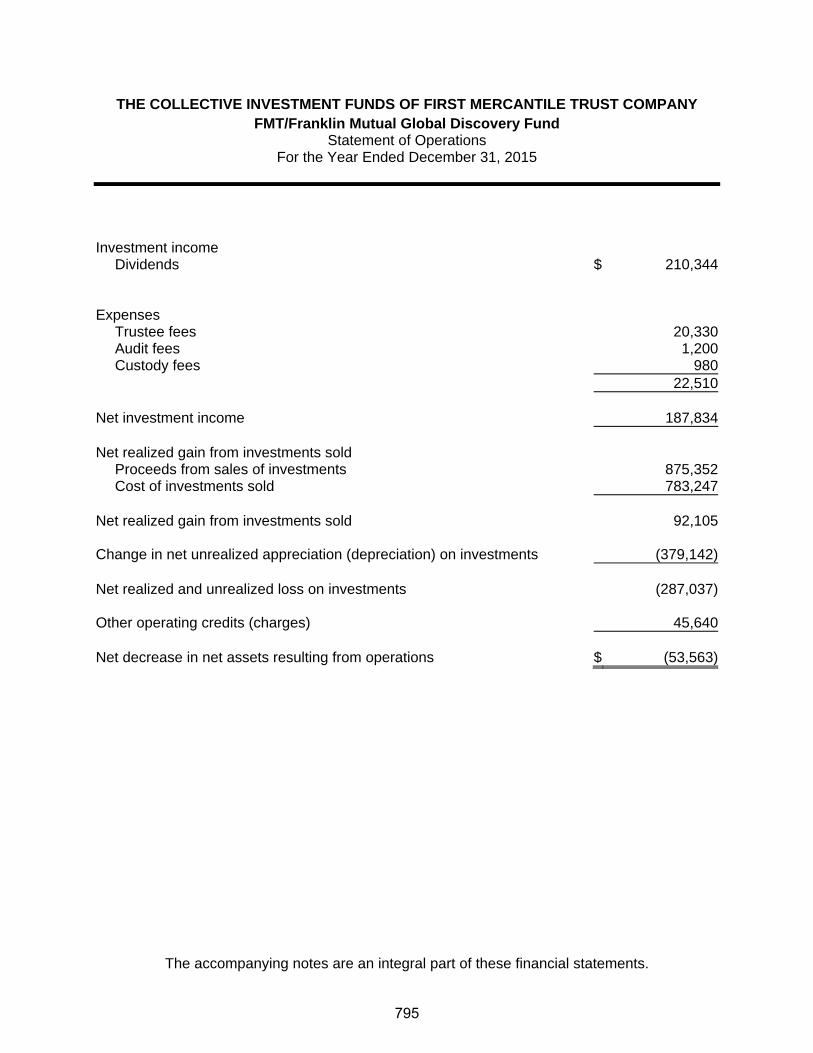
THE COLLECTIVE INVESTMENT FUNDS OF FIRST MERCANTILE TRUST COMPANY FMT/Franklin Mutual Global Discovery Fund
Statement of Operations For the Year Ended December 31, 2015
The accompanying notes are an integral part of these financial statements.
Investment income
Dividends $ 210,344 Expenses
Trustee fees 20,330Audit fees 1,200Custody fees 980
22,510 Net investment income 187,834 Net realized gain from investments sold
Proceeds from sales of investments 875,352Cost of investments sold 783,247
Net realized gain from investments sold 92,105 Change in net unrealized appreciation (depreciation) on investments (379,142) Net realized and unrealized loss on investments (287,037) Other operating credits (charges) 45,640 Net decrease in net assets resulting from operations $ (53,563)
795

THE COLLECTIVE INVESTMENT FUNDS OF FIRST MERCANTILE TRUST COMPANY FMT/Franklin Mutual Global Discovery Fund
Statement of Changes in Net Assets For the Year Ended December 31, 2015
The accompanying notes are an integral part of these financial statements.
Operations
Net investment income $ 187,834
Net realized gain from investments sold 92,105
Change in net unrealized appreciation (depreciation) on investments (379,142)
Other operating credits (charges) 45,640
Net decrease in net assets resulting from operations (53,563) Participant transactions
Proceeds from units purchased 566,130Less payments for units redeemed 1,096,014
Decrease in net assets from participant transactions (529,884)
Total decrease in net assets (583,447) Net assets at beginning of year 2,945,526 Net assets at end of year $ 2,362,079
796

THE COLLECTIVE INVESTMENT FUNDS OF FIRST MERCANTILE TRUST COMPANY FMT/Franklin Mutual Global Discovery Fund
Schedule of Investments and Specific Fund Disclosures December 31, 2015
The accompanying notes are an integral part of these financial statements.
Investments Shares Fair Value ____________ ____________
Mutual fund (100.1%)
Franklin Mutual Global Discovery A Fund (Cost $2,452,468) 80,532 $ 2,363,625 ____________________
Specific Fund Disclosures
Fair value
The inputs or methodology used for valuing securities may not be indicative of the risks associated with investing in those securities. For more information on valuation inputs, and their aggregation into the levels used in the table below, please refer to note 4 to the financial statements. The following table sets forth by level, within the fair value hierarchy, the Fund's investments measured at fair value.
Total Level 1 Level 2 Level 3
Mutual fund - Global Value $ 2,363,625 $ 2,363,625 $ — $ —__________ __________ __________ ___________________ __________ __________ _________
Investment transactions
The aggregate cost of purchases of investment securities and proceeds from sales of investment securities (other than temporary cash investments) totaled $578,692 and $875,352, respectively, for the year ended December 31, 2015.
Class-specific expenses Class-specific trustee fees for the year ended December 31, 2015 were as follows: Class R1 $ 1,160 Class R2 1,259 Class R3 12,616 Class R4 821 Class R5 4,418 Class R8 56 $ 20,330
797

THE COLLECTIVE INVESTMENT FUNDS OF FIRST MERCANTILE TRUST COMPANY FMT/Franklin Mutual Global Discovery Fund
Schedule of Participant Transactions December 31, 2015
The accompanying notes are an integral part of these financial statements.
Participant transactions by class for the year ended December 31, 2015 were as follows: Dollars Units Purchases Redemptions Net change Purchases Redemptions Net change Class R1 $ 25,353 $ (232,593) $ (207,240) 1,816 (16,738) (14,922)Class R2 11,856 (412,940) (401,084) 1,146 (39,509) (38,363)Class R3 321,268 (197,715) 123,553 21,793 (13,602) 8,191Class R4 146,920 (138,421) 8,499 9,714 (9,605) 109Class R5 58,163 (98,528) (40,365) 4,168 (6,867) (2,699)Class R8 2,570 (15,817) (13,247) 201 (1,291) (1,090) $ 566,130 $ (1,096,014) $ (529,884) 38,838 (87,612) (48,774)
798

THE COLLECTIVE INVESTMENT FUNDS OF FIRST MERCANTILE TRUST COMPANY FMT/Franklin Mutual Global Discovery Fund
Financial Highlights December 31, 2015
The accompanying notes are an integral part of these financial statements.
Change in Net Asset Value Resulting from Operations Ratios (to average net
assets)
NAV per Unit, Beginning of
Period
Net Investment
Income (Loss)(a)
Net Realized and Unrealized
Gain (Loss) from
Investments(a)
Total from Investment Activities
NAV per Unit, End of
Period Total
Return Expenses
Net Investment
Income (Loss)
Class R1 $ 13.6063 $ 0.9440 $ (1.2820) $ (0.3380) $ 13.2683 (2.48)% (0.43)% 6.76%Class R2(b) 9.9046 0.1495 0.3482 0.4977 — 5.02% (0.65)% 2.46%Class R3 14.4965 1.4501 (1.8655) (0.4154) 14.0811 (2.87)% (0.82)% 9.83%Class R4 14.5325 0.4391 (0.8796) (0.4405) 14.0920 (3.03)% (0.99)% 2.95%Class R5 13.7308 1.1992 (1.6382) (0.4390) 13.2918 (3.20)% (1.16)% 8.58%Class R8 12.2734 1.1503 (1.6039) (0.4536) 11.8198 (3.70)% (1.67)% 9.28%
(a) Per unit amounts are based on average daily units outstanding.
(b) For the period from January 1, 2015 through August 3, 2015.
799

FMT/Harbor Capital Appreciation Fund

THE COLLECTIVE INVESTMENT FUNDS OF FIRST MERCANTILE TRUST COMPANY FMT/Harbor Capital Appreciation Fund
Statement of Assets and Liabilities December 31, 2015
The accompanying notes are an integral part of these financial statements.
Assets Investments in securities, at fair value $ 28,755,273 Liabilities Trustee fees 17,460 Net assets $ 28,737,813 Components of net assets
Units of
Participation NAV
per Unit Net
Assets Class R1 529,831 $ 19.3013 $ 10,226,453Class R2 170,014 $ 19.5837 3,329,504Class R3 302,834 $ 18.7938 5,691,393Class R4 204,187 $ 18.4997 3,777,395Class R5 91,241 $ 19.0683 1,739,811Class R6 133,565 $ 18.2518 2,437,798Class R7 60,238 $ 18.0691 1,088,439Class R8 23,993 $ 18.6313 447,020
$ 28,737,813
800

THE COLLECTIVE INVESTMENT FUNDS OF FIRST MERCANTILE TRUST COMPANY FMT/Harbor Capital Appreciation Fund
Statement of Operations For the Year Ended December 31, 2015
The accompanying notes are an integral part of these financial statements.
Investment income
Dividends $ 1,837,228 Expenses
Trustee fees 202,228Custody fees 10,244Audit fees 1,200
213,672 Net investment income 1,623,556 Net realized gain from investments sold
Proceeds from sales of investments 4,939,073Cost of investments sold 3,408,143
Net realized gain from investments sold 1,530,930 Change in net unrealized appreciation (depreciation) on investments (454,223) Net realized and unrealized gain on investments 1,076,707 Other operating credits (charges) 29,801 Net increase in net assets resulting from operations $ 2,730,064
801

THE COLLECTIVE INVESTMENT FUNDS OF FIRST MERCANTILE TRUST COMPANY FMT/Harbor Capital Appreciation Fund
Statement of Changes in Net Assets For the Year Ended December 31, 2015
The accompanying notes are an integral part of these financial statements.
Operations
Net investment income $ 1,623,556
Net realized gain from investments sold 1,530,930
Change in net unrealized appreciation (depreciation) on investments (454,223)
Other operating credits (charges) 29,801
Net increase in net assets resulting from operations 2,730,064 Participant transactions
Proceeds from units purchased 9,548,743Less payments for units redeemed 10,459,091
Decrease in net assets from participant transactions (910,348)
Total increase in net assets 1,819,716 Net assets at beginning of year 26,918,097 Net assets at end of year $ 28,737,813
802

THE COLLECTIVE INVESTMENT FUNDS OF FIRST MERCANTILE TRUST COMPANY FMT/Harbor Capital Appreciation Fund
Schedule of Investments and Specific Fund Disclosures December 31, 2015
The accompanying notes are an integral part of these financial statements.
Investments Shares Fair Value ____________ ____________
Mutual fund (100.1%)
Harbor Capital Appreciation Institutional Fund (Cost $21,661,706) 472,871 $ 28,755,273 _____________________
Specific Fund Disclosures Fair value The inputs or methodology used for valuing securities may not be indicative of the risks associated with investing in those securities. For more information on valuation inputs, and their aggregation into the levels used in the table below, please refer to note 4 to the financial statements. The following table sets forth by level, within the fair value hierarchy, the Fund's investments measured at fair value.
Total Level 1 Level 2 Level 3
Mutual fund - Large Cap Growth $ 28,755,273 $ 28,755,273 $ — $ —__________ ___________ ___________ ____________________ ___________ ___________ __________ Investment transactions The aggregate cost of purchases of investment securities and proceeds from sales of investment securities (other than temporary cash investments) totaled $5,680,239 and $4,939,073, respectively, for the year ended December 31, 2015. Class-specific expenses Class-specific trustee fees for the year ended December 31, 2015 were as follows: Class R1 $ 32,417 Class R2 27,351 Class R3 37,098 Class R4 31,899 Class R5 24,825 Class R6 29,802 Class R7 11,639 Class R8 7,197 $ 202,228
803

THE COLLECTIVE INVESTMENT FUNDS OF FIRST MERCANTILE TRUST COMPANY FMT/Harbor Capital Appreciation Fund
Schedule of Participant Transactions December 31, 2015
The accompanying notes are an integral part of these financial statements.
Participant transactions by class for the year ended December 31, 2015 were as follows: Dollars Units Purchases Redemptions Net change Purchases Redemptions Net change Class R1 $ 4,835,784 $ (2,972,657) $ 1,863,127 249,487 (157,748) 91,739Class R2 605,228 (3,585,596) (2,980,368) 31,794 (181,145) (149,351)Class R3 1,715,086 (798,074) 917,012 95,572 (43,332) 52,240Class R4 1,122,902 (1,074,940) 47,962 61,576 (59,716) 1,860Class R5 319,328 (1,231,152) (911,824) 17,105 (65,451) (48,346)Class R6 390,710 (625,200) (234,490) 21,840 (36,296) (14,456)Class R7 408,770 (15,344) 393,426 22,565 (865) 21,700Class R8 150,935 (156,128) (5,193) 8,132 (8,713) (581) $ 9,548,743 $ (10,459,091) $ (910,348) 508,071 (553,266) (45,195)
804
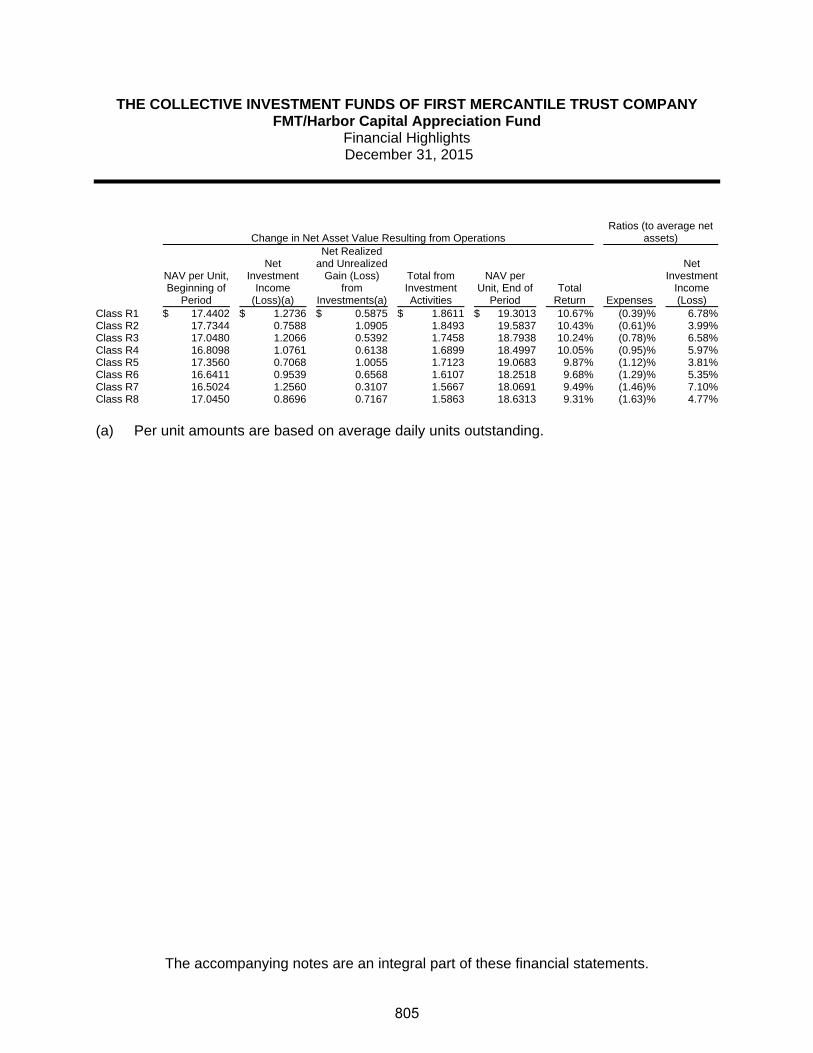
THE COLLECTIVE INVESTMENT FUNDS OF FIRST MERCANTILE TRUST COMPANY FMT/Harbor Capital Appreciation Fund
Financial Highlights December 31, 2015
The accompanying notes are an integral part of these financial statements.
Change in Net Asset Value Resulting from Operations Ratios (to average net
assets)
NAV per Unit, Beginning of
Period
Net Investment
Income (Loss)(a)
Net Realized and Unrealized
Gain (Loss) from
Investments(a)
Total from Investment Activities
NAV per Unit, End of
Period Total
Return Expenses
Net Investment
Income (Loss)
Class R1 $ 17.4402 $ 1.2736 $ 0.5875 $ 1.8611 $ 19.3013 10.67% (0.39)% 6.78%Class R2 17.7344 0.7588 1.0905 1.8493 19.5837 10.43% (0.61)% 3.99%Class R3 17.0480 1.2066 0.5392 1.7458 18.7938 10.24% (0.78)% 6.58%Class R4 16.8098 1.0761 0.6138 1.6899 18.4997 10.05% (0.95)% 5.97%Class R5 17.3560 0.7068 1.0055 1.7123 19.0683 9.87% (1.12)% 3.81%Class R6 16.6411 0.9539 0.6568 1.6107 18.2518 9.68% (1.29)% 5.35%Class R7 16.5024 1.2560 0.3107 1.5667 18.0691 9.49% (1.46)% 7.10%Class R8 17.0450 0.8696 0.7167 1.5863 18.6313 9.31% (1.63)% 4.77%
(a) Per unit amounts are based on average daily units outstanding.
805

FMT/International Equity Index Fund

THE COLLECTIVE INVESTMENT FUNDS OF FIRST MERCANTILE TRUST COMPANY FMT/International Equity Index Fund
Statement of Assets and Liabilities December 31, 2015
The accompanying notes are an integral part of these financial statements.
Assets Investments in securities, at fair value $ 23,596,847 Liabilities Trustee fees 1,070 Net assets $ 23,595,777 Components of net assets
Units of
Participation NAV
per Unit Net
Assets Class R1 382,700 $ 9.3377 $ 3,573,524Class R2 13,349 $ 9.8333 131,263Class R3 105 $ 10.2073 1,074Class R4 5,427 $ 9.8029 53,186Class LifeStyle 19,836,730
$ 23,595,777
806
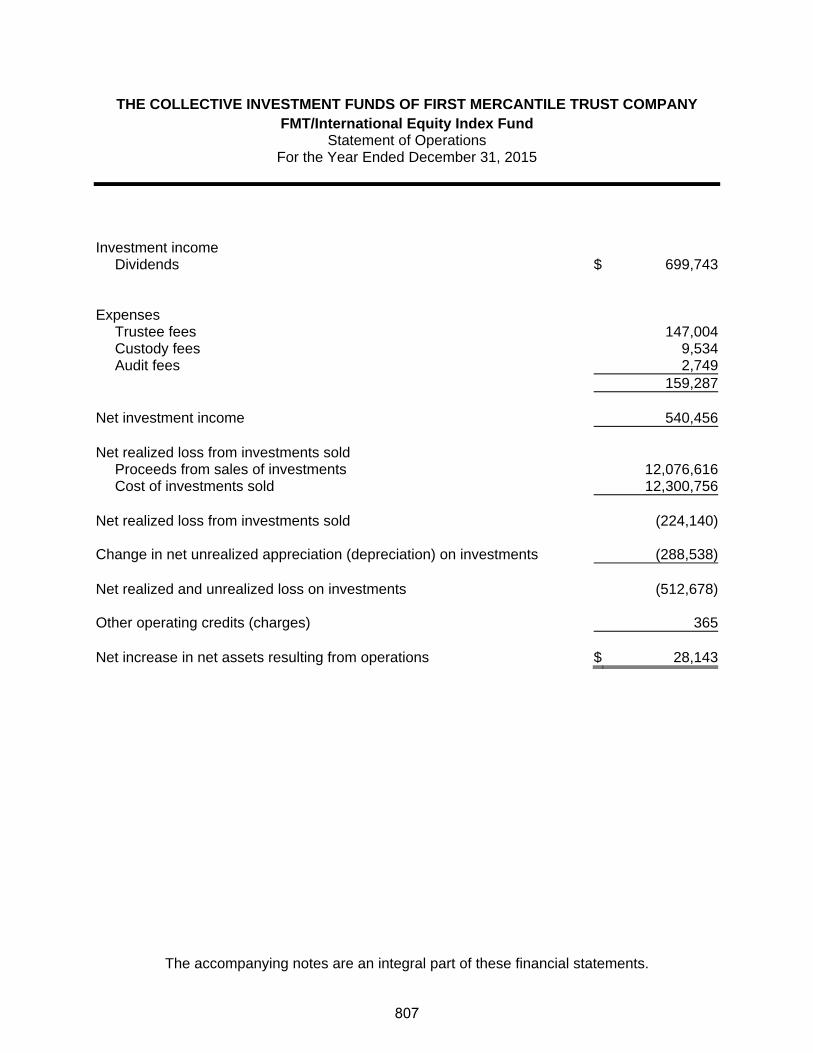
THE COLLECTIVE INVESTMENT FUNDS OF FIRST MERCANTILE TRUST COMPANY FMT/International Equity Index Fund
Statement of Operations For the Year Ended December 31, 2015
The accompanying notes are an integral part of these financial statements.
Investment income
Dividends $ 699,743 Expenses
Trustee fees 147,004Custody fees 9,534Audit fees 2,749
159,287 Net investment income 540,456 Net realized loss from investments sold
Proceeds from sales of investments 12,076,616Cost of investments sold 12,300,756
Net realized loss from investments sold (224,140) Change in net unrealized appreciation (depreciation) on investments (288,538) Net realized and unrealized loss on investments (512,678) Other operating credits (charges) 365 Net increase in net assets resulting from operations $ 28,143
807

THE COLLECTIVE INVESTMENT FUNDS OF FIRST MERCANTILE TRUST COMPANY FMT/International Equity Index Fund
Statement of Changes in Net Assets For the Year Ended December 31, 2015
The accompanying notes are an integral part of these financial statements.
Operations
Net investment income $ 540,456
Net realized loss from investments sold (224,140)
Change in net unrealized appreciation (depreciation) on investments (288,538)
Other operating credits (charges) 365
Net increase in net assets resulting from operations 28,143 Participant transactions
Proceeds from units purchased 9,423,787Less payments for units redeemed 16,070,679
Decrease in net assets from participant transactions (6,646,892)
Total decrease in net assets (6,618,749) Net assets at beginning of year 30,214,526 Net assets at end of year $ 23,595,777
808

THE COLLECTIVE INVESTMENT FUNDS OF FIRST MERCANTILE TRUST COMPANY FMT/International Equity Index Fund
Schedule of Investments and Specific Fund Disclosures December 31, 2015
The accompanying notes are an integral part of these financial statements.
Investments Shares Fair Value ____________ ____________
Mutual fund (100.0%)
Vanguard Developed Markets Index Fund Admiral Shares (Cost $25,535,980) 1,996,349 $ 23,596,847 ____________________
Specific Fund Disclosures
Fair value
The inputs or methodology used for valuing securities may not be indicative of the risks associated with investing in those securities. For more information on valuation inputs, and their aggregation into the levels used in the table below, please refer to note 4 to the financial statements. The following table sets forth by level, within the fair value hierarchy, the Fund's investments measured at fair value.
Total Level 1 Level 2 Level 3
Mutual fund - International Core Index $ 23,596,847 $ 23,596,847 $ — $ —__________ __________ __________ ___________________ __________ __________ _________
Investment transactions
The aggregate cost of purchases of investment securities and proceeds from sales of investment securities (other than temporary cash investments) totaled $5,953,826 and $12,076,616, respectively, for the year ended December 31, 2015.
Class-specific expenses Class-specific trustee fees for the year ended December 31, 2015 were as follows: Class R1 $ 5,281 Class R2 4 Class R3 1 Class R4 13 Class LifeStyle 141,705 $ 147,004
809
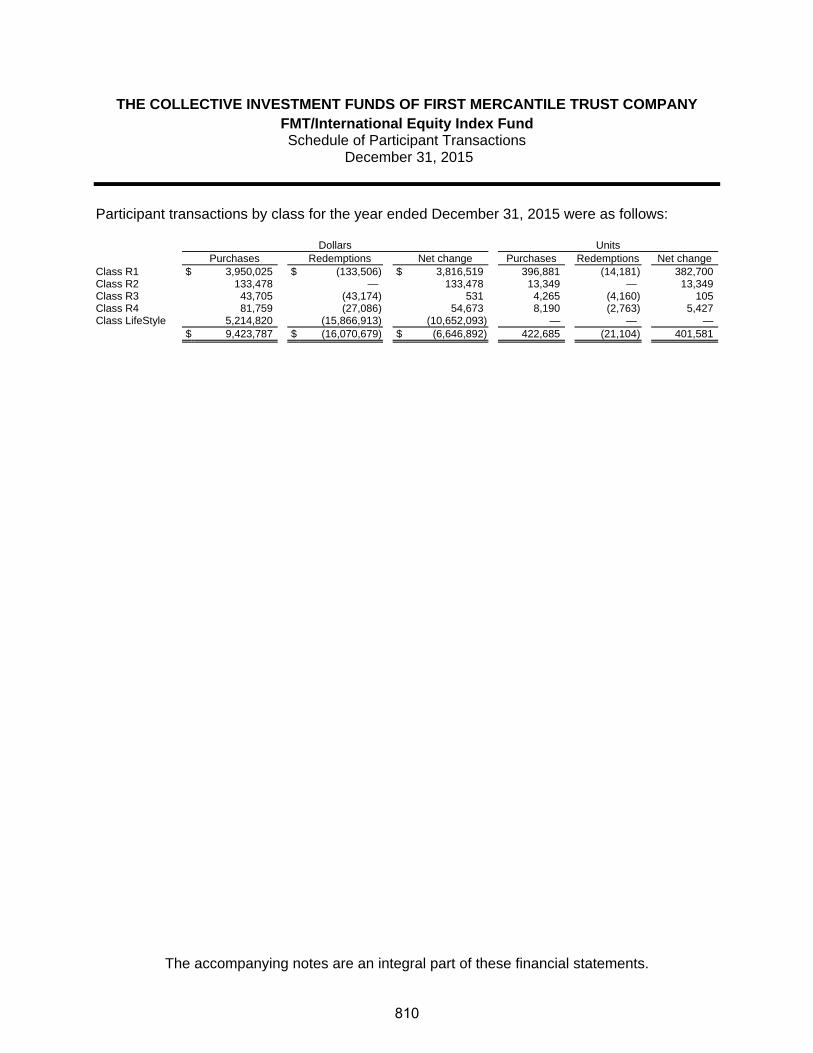
THE COLLECTIVE INVESTMENT FUNDS OF FIRST MERCANTILE TRUST COMPANY FMT/International Equity Index Fund Schedule of Participant Transactions
December 31, 2015
The accompanying notes are an integral part of these financial statements.
Participant transactions by class for the year ended December 31, 2015 were as follows: Dollars Units Purchases Redemptions Net change Purchases Redemptions Net change Class R1 $ 3,950,025 $ (133,506) $ 3,816,519 396,881 (14,181) 382,700Class R2 133,478 — 133,478 13,349 — 13,349Class R3 43,705 (43,174) 531 4,265 (4,160) 105Class R4 81,759 (27,086) 54,673 8,190 (2,763) 5,427Class LifeStyle 5,214,820 (15,866,913) (10,652,093) — — — $ 9,423,787 $ (16,070,679) $ (6,646,892) 422,685 (21,104) 401,581
810

THE COLLECTIVE INVESTMENT FUNDS OF FIRST MERCANTILE TRUST COMPANY FMT/International Equity Index Fund
Financial Highlights December 31, 2015
The accompanying notes are an integral part of these financial statements.
Change in Net Asset Value Resulting from Operations Ratios (to average net
assets)
NAV per Unit, Beginning of
Period
Net Investment
Income (Loss)(a)
Net Realized and Unrealized
Gain (Loss) from
Investments(a)
Total from Investment Activities
NAV per Unit, End of
Period Total
Return Expenses
Net Investment
Income (Loss)
Class R1(b) $ 10.0000 $ 0.1076 $ (0.7699) $ (0.6623) $ 9.3377 (6.62)% (0.40)% 2.62%Class R2(c) 10.0000 (0.0005) (0.1662) (0.1667) 9.8333 (1.67)% (0.57)% (0.55)%Class R3(d) 10.0000 0.0077 0.1996 0.2073 10.2073 2.07% (0.75)% 1.31%Class R4(e) 10.0000 0.0239 (0.2210) (0.1971) 9.8029 (1.97)% (1.01)% 3.16%
(a) Per unit amounts are based on average daily units outstanding.
(b) For the period from July 27, 2015 through December 31, 2015.
(c) For the period from December 30, 2015 through December 31, 2015.
(d) For the period from December 14, 2015 through December 31, 2015.
(e) For the period from December 4, 2015 through December 31, 2015.
811
FMT/iShares MSCI EAFE Index ETF
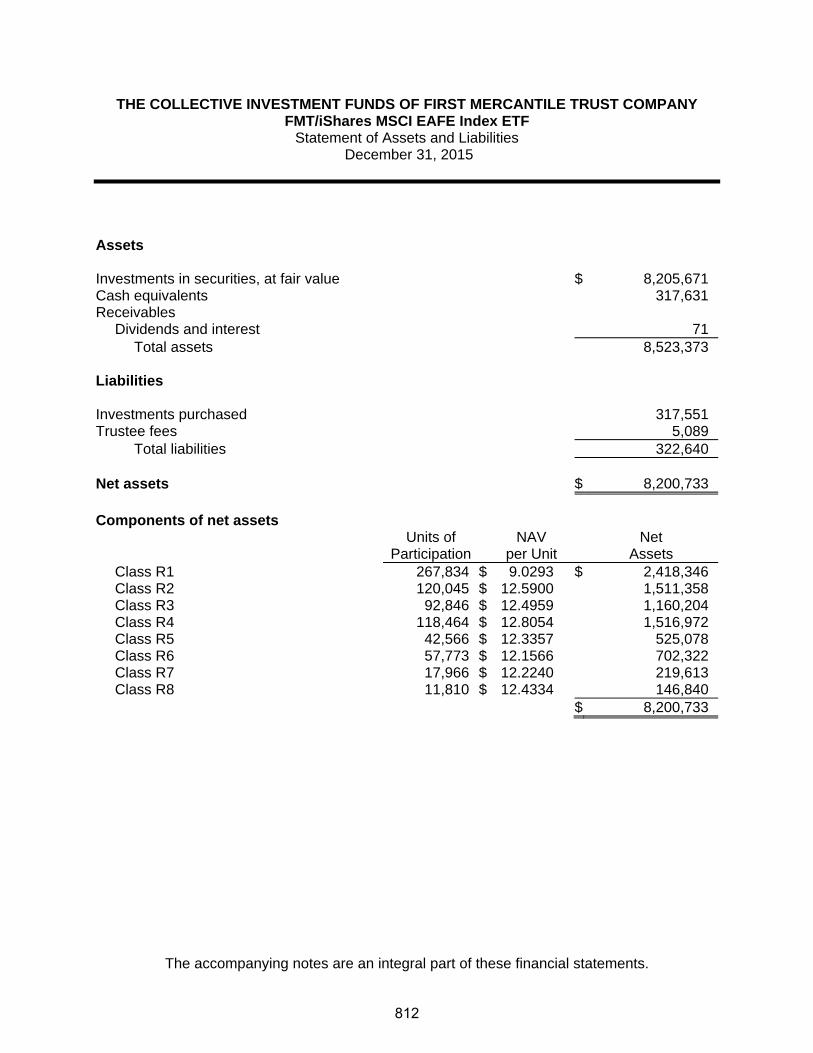
THE COLLECTIVE INVESTMENT FUNDS OF FIRST MERCANTILE TRUST COMPANY FMT/iShares MSCI EAFE Index ETF
Statement of Assets and Liabilities December 31, 2015
The accompanying notes are an integral part of these financial statements.
Assets Investments in securities, at fair value $ 8,205,671 Cash equivalents 317,631Receivables
Dividends and interest 71Total assets 8,523,373
Liabilities Investments purchased 317,551Trustee fees 5,089
Total liabilities 322,640 Net assets $ 8,200,733 Components of net assets
Units of
Participation NAV
per Unit Net
Assets Class R1 267,834 $ 9.0293 $ 2,418,346Class R2 120,045 $ 12.5900 1,511,358Class R3 92,846 $ 12.4959 1,160,204Class R4 118,464 $ 12.8054 1,516,972Class R5 42,566 $ 12.3357 525,078Class R6 57,773 $ 12.1566 702,322Class R7 17,966 $ 12.2240 219,613Class R8 11,810 $ 12.4334 146,840
$ 8,200,733
812

THE COLLECTIVE INVESTMENT FUNDS OF FIRST MERCANTILE TRUST COMPANY FMT/iShares MSCI EAFE Index ETF
Statement of Operations For the Year Ended December 31, 2015
The accompanying notes are an integral part of these financial statements.
Investment income
Dividends $ 271,890Interest 149
272,039 Expenses
Trustee fees 68,789Custody fees 5,559Audit fees 1,200
75,548 Net investment income 196,491 Net realized gain from investments sold
Proceeds from sales of investments 4,827,524Cost of investments sold 4,418,627
Net realized gain from investments sold 408,897 Change in net unrealized appreciation (depreciation) on investments (547,883) Net realized and unrealized loss on investments (138,986) Net increase in net assets resulting from operations $ 57,505
813

THE COLLECTIVE INVESTMENT FUNDS OF FIRST MERCANTILE TRUST COMPANY FMT/iShares MSCI EAFE Index ETF Statement of Changes in Net Assets
For the Year Ended December 31, 2015
The accompanying notes are an integral part of these financial statements.
Operations
Net investment income $ 196,491
Net realized gain from investments sold 408,897
Change in net unrealized appreciation (depreciation) on investments (547,883)
Net increase in net assets resulting from operations 57,505 Participant transactions
Proceeds from units purchased 3,741,175Less payments for units redeemed 7,334,709
Decrease in net assets from participant transactions (3,593,534)
Total decrease in net assets (3,536,029) Net assets at beginning of year 11,736,762 Net assets at end of year $ 8,200,733
814
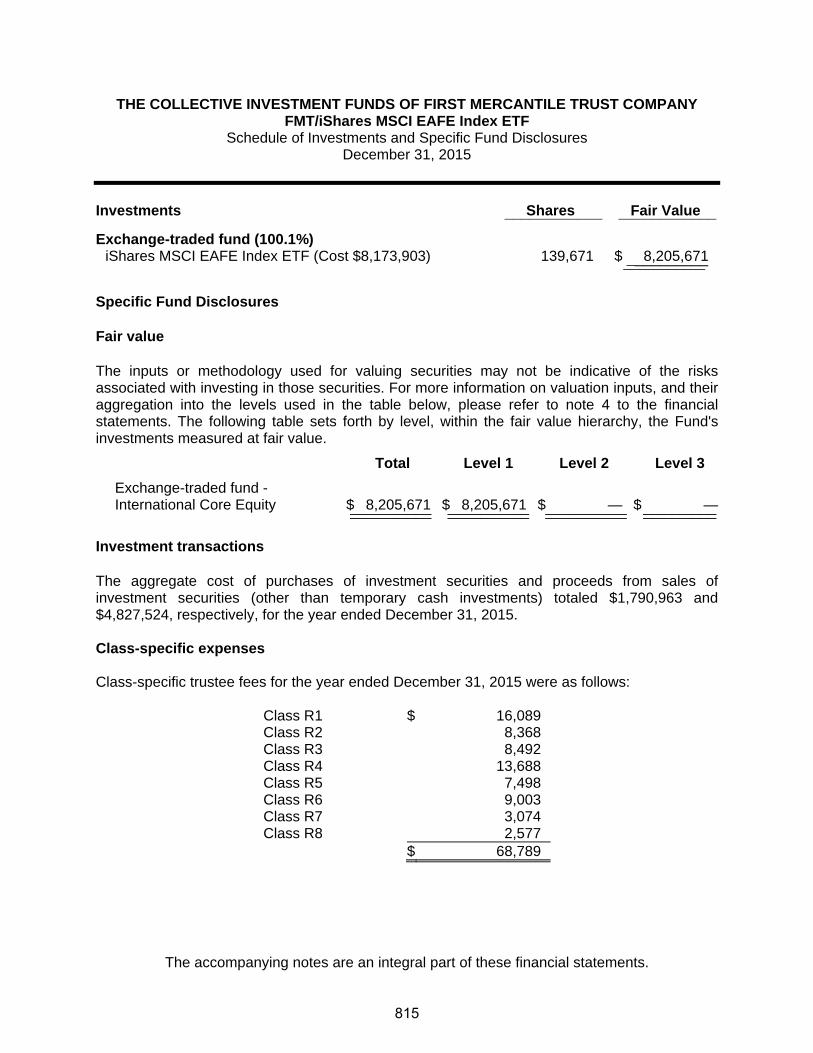
THE COLLECTIVE INVESTMENT FUNDS OF FIRST MERCANTILE TRUST COMPANY FMT/iShares MSCI EAFE Index ETF
Schedule of Investments and Specific Fund Disclosures December 31, 2015
The accompanying notes are an integral part of these financial statements.
Investments Shares Fair Value ____________ ____________
Exchange-traded fund (100.1%) iShares MSCI EAFE Index ETF (Cost $8,173,903) 139,671 $ 8,205,671 _____________________ Specific Fund Disclosures Fair value The inputs or methodology used for valuing securities may not be indicative of the risks associated with investing in those securities. For more information on valuation inputs, and their aggregation into the levels used in the table below, please refer to note 4 to the financial statements. The following table sets forth by level, within the fair value hierarchy, the Fund's investments measured at fair value.
Total Level 1 Level 2 Level 3
Exchange-traded fund - International Core Equity $ 8,205,671 $ 8,205,671 $ — $ —__________ __________ __________ ___________________ __________ __________ _________
Investment transactions The aggregate cost of purchases of investment securities and proceeds from sales of investment securities (other than temporary cash investments) totaled $1,790,963 and $4,827,524, respectively, for the year ended December 31, 2015. Class-specific expenses Class-specific trustee fees for the year ended December 31, 2015 were as follows: Class R1 $ 16,089 Class R2 8,368 Class R3 8,492 Class R4 13,688 Class R5 7,498 Class R6 9,003 Class R7 3,074 Class R8 2,577 $ 68,789
815

THE COLLECTIVE INVESTMENT FUNDS OF FIRST MERCANTILE TRUST COMPANY FMT/iShares MSCI EAFE Index ETF Schedule of Participant Transactions
December 31, 2015
The accompanying notes are an integral part of these financial statements.
Participant transactions by class for the year ended December 31, 2015 were as follows: Dollars Units Purchases Redemptions Net change Purchases Redemptions Net change Class R1 $ 1,030,808 $ (4,833,533) $ (3,802,725) 107,095 (495,925) (388,830)Class R2 476,594 (200,673) 275,921 35,402 (14,835) 20,567Class R3 778,763 (609,914) 168,849 58,067 (45,281) 12,786Class R4 531,419 (690,783) (159,364) 39,854 (49,932) (10,078)Class R5 369,166 (560,885) (191,719) 27,405 (43,548) (16,143)Class R6 358,516 (225,688) 132,828 27,957 (16,923) 11,034Class R7 152,323 (159,000) (6,677) 11,503 (12,343) (840)Class R8 43,586 (54,233) (10,647) 3,323 (3,943) (620) $ 3,741,175 $ (7,334,709) $ (3,593,534) 310,606 (682,730) (372,124)
816

THE COLLECTIVE INVESTMENT FUNDS OF FIRST MERCANTILE TRUST COMPANY FMT/iShares MSCI EAFE Index ETF
Financial Highlights December 31, 2015
The accompanying notes are an integral part of these financial statements.
Change in Net Asset Value Resulting from Operations Ratios (to average net
assets)
NAV per Unit, Beginning of
Period
Net Investment
Income (Loss)(a)
Net Realized and Unrealized
Gain (Loss) from
Investments(a)
Total from Investment Activities
NAV per Unit, End of
Period Total
Return Expenses
Net Investment
Income (Loss)
Class R1 $ 9.1865 $ 0.1959 $ (0.3531) $ (0.1572) $ 9.0293 (1.71)% (0.42)% 2.03%Class R2 12.8377 0.2782 (0.5259) (0.2477) 12.5900 (1.93)% (0.63)% 2.09%Class R3 12.7636 0.2535 (0.5212) (0.2677) 12.4959 (2.10)% (0.80)% 1.92%Class R4 13.1020 0.2375 (0.5341) (0.2966) 12.8054 (2.26)% (0.97)% 1.75%Class R5 12.6431 0.1849 (0.4923) (0.3074) 12.3357 (2.43)% (1.14)% 1.41%Class R6 12.4808 0.1771 (0.5013) (0.3242) 12.1566 (2.60)% (1.31)% 1.37%Class R7 12.5714 0.1573 (0.5047) (0.3474) 12.2240 (2.76)% (1.48)% 1.22%Class R8 12.8088 0.1314 (0.5068) (0.3754) 12.4334 (2.93)% (1.65)% 0.99%
(a) Per unit amounts are based on average daily units outstanding.
817
FMT/iShares Russell 2000 Growth Index ETF
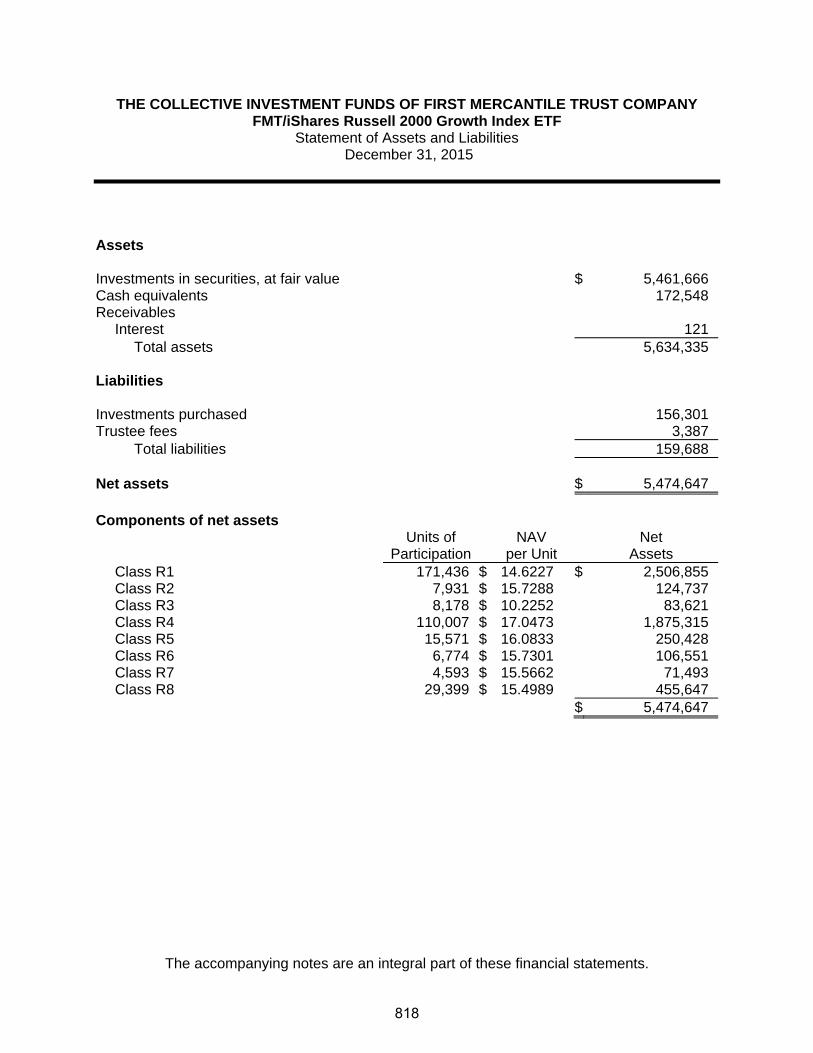
THE COLLECTIVE INVESTMENT FUNDS OF FIRST MERCANTILE TRUST COMPANY FMT/iShares Russell 2000 Growth Index ETF
Statement of Assets and Liabilities December 31, 2015
The accompanying notes are an integral part of these financial statements.
Assets Investments in securities, at fair value $ 5,461,666 Cash equivalents 172,548Receivables
Interest 121Total assets 5,634,335
Liabilities Investments purchased 156,301Trustee fees 3,387
Total liabilities 159,688 Net assets $ 5,474,647 Components of net assets
Units of
Participation NAV
per Unit Net
Assets Class R1 171,436 $ 14.6227 $ 2,506,855Class R2 7,931 $ 15.7288 124,737Class R3 8,178 $ 10.2252 83,621Class R4 110,007 $ 17.0473 1,875,315Class R5 15,571 $ 16.0833 250,428Class R6 6,774 $ 15.7301 106,551Class R7 4,593 $ 15.5662 71,493Class R8 29,399 $ 15.4989 455,647
$ 5,474,647
818

THE COLLECTIVE INVESTMENT FUNDS OF FIRST MERCANTILE TRUST COMPANY FMT/iShares Russell 2000 Growth Index ETF
Statement of Operations For the Year Ended December 31, 2015
The accompanying notes are an integral part of these financial statements.
Investment income
Dividends $ 39,756Interest 197
39,953 Expenses
Trustee fees 33,332Custody fees 5,742Audit fees 1,200
40,274 Net investment loss (321) Net realized gain from investments sold
Proceeds from sales of investments 2,961,815Cost of investments sold 2,143,531
Net realized gain from investments sold 818,284 Change in net unrealized appreciation (depreciation) on investments (795,447) Net realized and unrealized gain on investments 22,837 Net increase in net assets resulting from operations $ 22,516
819
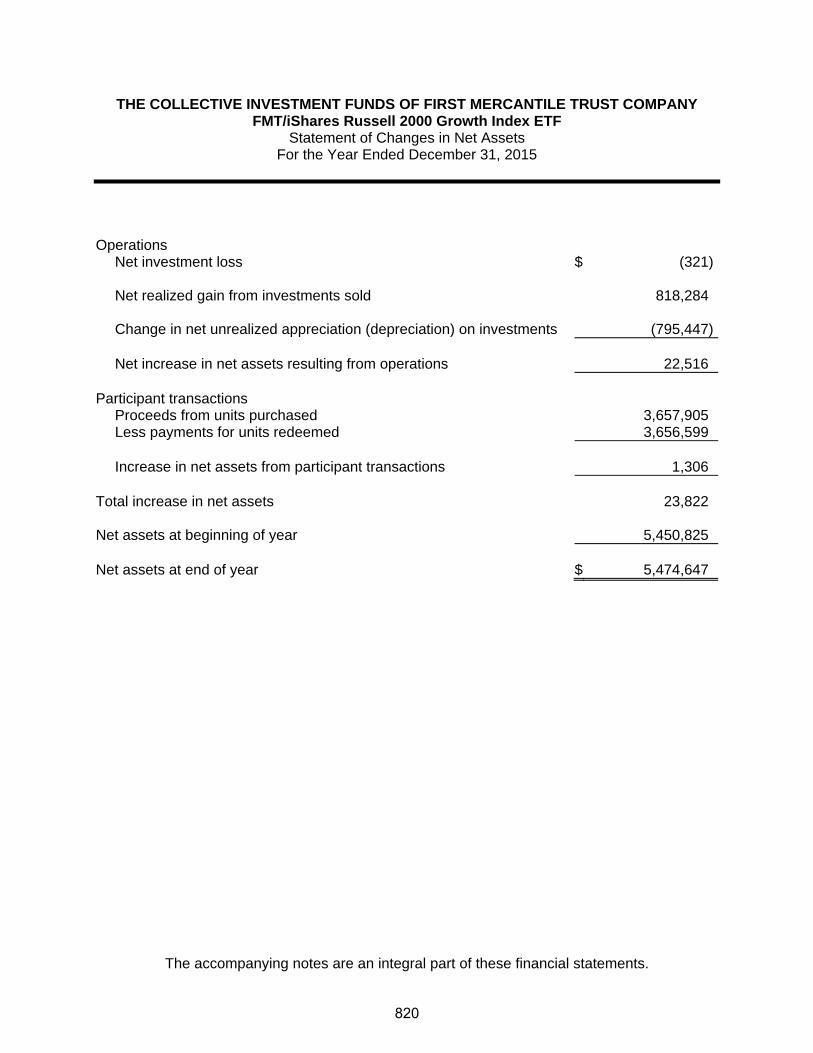
THE COLLECTIVE INVESTMENT FUNDS OF FIRST MERCANTILE TRUST COMPANY FMT/iShares Russell 2000 Growth Index ETF
Statement of Changes in Net Assets For the Year Ended December 31, 2015
The accompanying notes are an integral part of these financial statements.
Operations
Net investment loss $ (321)
Net realized gain from investments sold 818,284
Change in net unrealized appreciation (depreciation) on investments (795,447)
Net increase in net assets resulting from operations 22,516 Participant transactions
Proceeds from units purchased 3,657,905Less payments for units redeemed 3,656,599
Increase in net assets from participant transactions 1,306
Total increase in net assets 23,822 Net assets at beginning of year 5,450,825 Net assets at end of year $ 5,474,647
820

THE COLLECTIVE INVESTMENT FUNDS OF FIRST MERCANTILE TRUST COMPANY FMT/iShares Russell 2000 Growth Index ETF
Schedule of Investments and Specific Fund Disclosures December 31, 2015
The accompanying notes are an integral part of these financial statements.
Investments Shares Fair Value ____________ ____________
Exchange-traded fund (99.8%)
iShares Russell 2000 Growth Index ETF (Cost $4,922,966) 39,177 $ 5,461,666 ______________________
Specific Fund Disclosures Fair value The inputs or methodology used for valuing securities may not be indicative of the risks associated with investing in those securities. For more information on valuation inputs, and their aggregation into the levels used in the table below, please refer to note 4 to the financial statements. The following table sets forth by level, within the fair value hierarchy, the Fund's investments measured at fair value.
Total Level 1 Level 2 Level 3
Exchange-traded fund - Small Cap Growth $ 5,461,666 $ 5,461,666 $ — $ —__________ __________ __________ ___________________ __________ __________ _________
Investment transactions The aggregate cost of purchases of investment securities and proceeds from sales of investment securities (other than temporary cash investments) totaled $3,095,423 and $2,961,815, respectively, for the year ended December 31, 2015. Class-specific expenses Class-specific trustee fees for the year ended December 31, 2015 were as follows: Class R1 $ 10,107 Class R2 672 Class R3 255 Class R4 10,977 Class R5 2,900 Class R6 1,803 Class R7 1,150 Class R8 5,468 $ 33,332
821

THE COLLECTIVE INVESTMENT FUNDS OF FIRST MERCANTILE TRUST COMPANY FMT/iShares Russell 2000 Growth Index ETF
Schedule of Participant Transactions December 31, 2015
The accompanying notes are an integral part of these financial statements.
Participant transactions by class for the year ended December 31, 2015 were as follows: Dollars Units Purchases Redemptions Net change Purchases Redemptions Net change Class R1 $ 1,878,352 $ (2,870,162) $ (991,810) 121,625 (180,290) (58,665)Class R2 163,860 (111,225) 52,635 9,452 (6,405) 3,047Class R3 84,710 (47,045) 37,665 8,360 (2,914) 5,446Class R4 1,151,314 (308,420) 842,894 66,418 (17,478) 48,940Class R5 198,845 (160,692) 38,153 11,431 (9,397) 2,034Class R6 16,485 (125,278) (108,793) 1,005 (7,548) (6,543)Class R7 12,933 (32,541) (19,608) 787 (2,008) (1,221)Class R8 151,406 (1,236) 150,170 9,447 (76) 9,371 $ 3,657,905 $ (3,656,599) $ 1,306 228,525 (226,116) 2,409
822
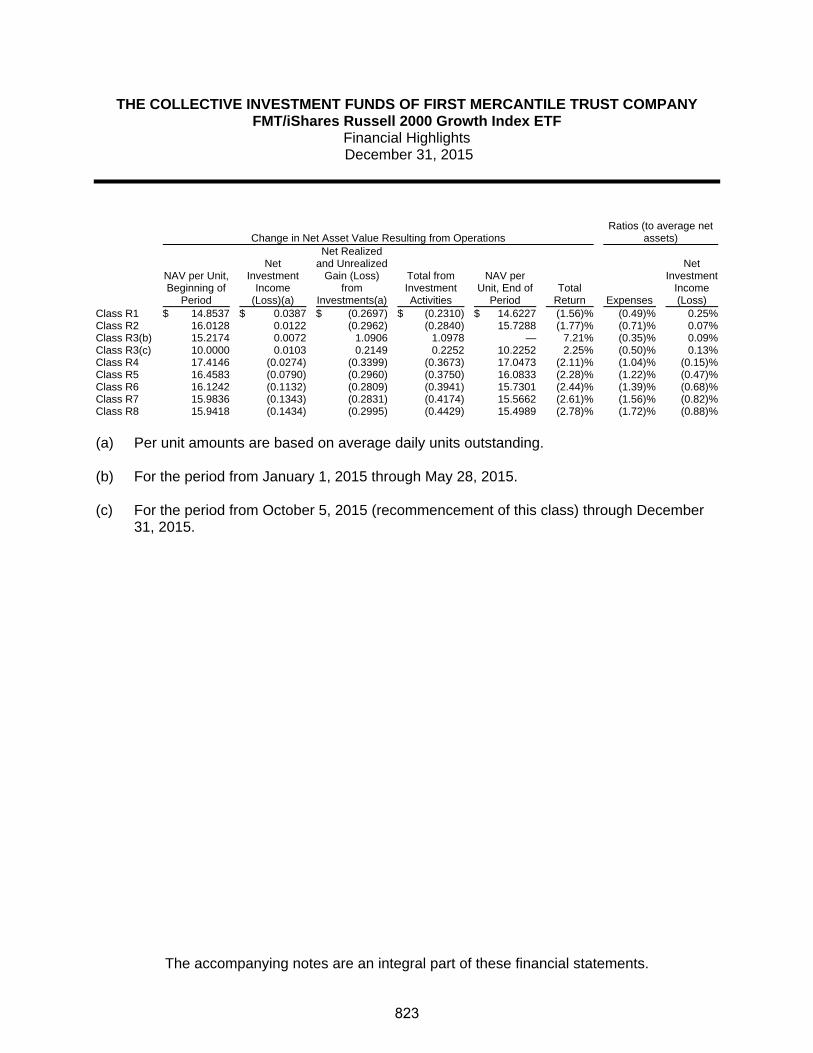
THE COLLECTIVE INVESTMENT FUNDS OF FIRST MERCANTILE TRUST COMPANY FMT/iShares Russell 2000 Growth Index ETF
Financial Highlights December 31, 2015
The accompanying notes are an integral part of these financial statements.
Change in Net Asset Value Resulting from Operations Ratios (to average net
assets)
NAV per Unit, Beginning of
Period
Net Investment
Income (Loss)(a)
Net Realized and Unrealized
Gain (Loss) from
Investments(a)
Total from Investment Activities
NAV per Unit, End of
Period Total
Return Expenses
Net Investment
Income (Loss)
Class R1 $ 14.8537 $ 0.0387 $ (0.2697) $ (0.2310) $ 14.6227 (1.56)% (0.49)% 0.25%Class R2 16.0128 0.0122 (0.2962) (0.2840) 15.7288 (1.77)% (0.71)% 0.07%Class R3(b) 15.2174 0.0072 1.0906 1.0978 — 7.21% (0.35)% 0.09%Class R3(c) 10.0000 0.0103 0.2149 0.2252 10.2252 2.25% (0.50)% 0.13%Class R4 17.4146 (0.0274) (0.3399) (0.3673) 17.0473 (2.11)% (1.04)% (0.15)%Class R5 16.4583 (0.0790) (0.2960) (0.3750) 16.0833 (2.28)% (1.22)% (0.47)%Class R6 16.1242 (0.1132) (0.2809) (0.3941) 15.7301 (2.44)% (1.39)% (0.68)%Class R7 15.9836 (0.1343) (0.2831) (0.4174) 15.5662 (2.61)% (1.56)% (0.82)%Class R8 15.9418 (0.1434) (0.2995) (0.4429) 15.4989 (2.78)% (1.72)% (0.88)%
(a) Per unit amounts are based on average daily units outstanding.
(b) For the period from January 1, 2015 through May 28, 2015.
(c) For the period from October 5, 2015 (recommencement of this class) through December
31, 2015.
823

FMT/iShares Russell 2000 Index ETF

THE COLLECTIVE INVESTMENT FUNDS OF FIRST MERCANTILE TRUST COMPANY FMT/iShares Russell 2000 Index ETF
Statement of Assets and Liabilities December 31, 2015
The accompanying notes are an integral part of these financial statements.
Assets Investments in securities, at fair value $ 4,113,591 Cash equivalents 32,832Receivables
Dividends and interest 962Total assets 4,147,385
Liabilities Investments purchased 13,863Trustee fees 2,953
Total liabilities 16,816 Net assets $ 4,130,569 Components of net assets
Units of
Participation NAV
per Unit Net
Assets Class R1 90,405 $ 15.3055 $ 1,383,683Class R2 160 $ 15.2875 2,445Class R3 47,941 $ 14.3234 686,677Class R4 32,170 $ 16.1387 519,179Class R5 65,312 $ 15.7478 1,028,519Class R6 23,932 $ 14.8721 355,917Class R7 9,267 $ 15.0232 139,215Class R8 1,006 $ 14.8507 14,934
$ 4,130,569
824

THE COLLECTIVE INVESTMENT FUNDS OF FIRST MERCANTILE TRUST COMPANY FMT/iShares Russell 2000 Index ETF
Statement of Operations For the Year Ended December 31, 2015
The accompanying notes are an integral part of these financial statements.
Investment income
Dividends $ 91,351Interest 7
91,358 Expenses
Trustee fees 41,535Custody fees 5,445Audit fees 1,200
48,180 Net investment income 43,178 Net realized gain from investments sold
Proceeds from sales of investments 4,516,613Cost of investments sold 3,590,546
Net realized gain from investments sold 926,067 Change in net unrealized appreciation (depreciation) on investments (1,162,254) Net realized and unrealized loss on investments (236,187) Net decrease in net assets resulting from operations $ (193,009)
825

THE COLLECTIVE INVESTMENT FUNDS OF FIRST MERCANTILE TRUST COMPANY FMT/iShares Russell 2000 Index ETF
Statement of Changes in Net Assets For the Year Ended December 31, 2015
The accompanying notes are an integral part of these financial statements.
Operations
Net investment income $ 43,178
Net realized gain from investments sold 926,067
Change in net unrealized appreciation (depreciation) on investments (1,162,254)
Net decrease in net assets resulting from operations (193,009) Participant transactions
Proceeds from units purchased 1,533,892Less payments for units redeemed 5,218,044
Decrease in net assets from participant transactions (3,684,152)
Total decrease in net assets (3,877,161) Net assets at beginning of year 8,007,730 Net assets at end of year $ 4,130,569
826

THE COLLECTIVE INVESTMENT FUNDS OF FIRST MERCANTILE TRUST COMPANY FMT/iShares Russell 2000 Index ETF
Schedule of Investments and Specific Fund Disclosures December 31, 2015
The accompanying notes are an integral part of these financial statements.
Investments Shares Fair Value ____________ ____________
Exchange-traded fund (99.6%) iShares Russell 2000 Index ETF (Cost $3,576,100) 36,562 $ 4,113,591 ______________________ Specific Fund Disclosures Fair value The inputs or methodology used for valuing securities may not be indicative of the risks associated with investing in those securities. For more information on valuation inputs, and their aggregation into the levels used in the table below, please refer to note 4 to the financial statements. The following table sets forth by level, within the fair value hierarchy, the Fund's investments measured at fair value.
Total Level 1 Level 2 Level 3
Exchange-traded fund - Small Cap Core $ 4,113,591 $ 4,113,591 $ — $ —__________ ___________ ___________ ____________________ ___________ ___________ __________
Investment transactions The aggregate cost of purchases of investment securities and proceeds from sales of investment securities (other than temporary cash investments) totaled $1,114,049 and $4,516,613, respectively, for the year ended December 31, 2015. Class-specific expenses Class-specific trustee fees for the year ended December 31, 2015 were as follows: Class R1 $ 12,378 Class R2 2,757 Class R3 5,309 Class R4 5,381 Class R5 8,582 Class R6 4,652 Class R7 2,173 Class R8 303 $ 41,535
827

THE COLLECTIVE INVESTMENT FUNDS OF FIRST MERCANTILE TRUST COMPANY FMT/iShares Russell 2000 Index ETF Schedule of Participant Transactions
December 31, 2015
The accompanying notes are an integral part of these financial statements.
Participant transactions by class for the year ended December 31, 2015 were as follows: Dollars Units Purchases Redemptions Net change Purchases Redemptions Net change Class R1 $ 687,695 $ (4,010,307) $ (3,322,612) 41,952 (244,000) (202,048)Class R2 33,714 (503,731) (470,017) 2,147 (32,340) (30,193)Class R3 204,349 (168,127) 36,222 13,314 (11,161) 2,153Class R4 157,558 (359,047) (201,489) 9,384 (20,358) (10,974)Class R5 417,091 (112,814) 304,277 25,786 (6,913) 18,873Class R6 23,537 (16,940) 6,597 1,509 (1,083) 426Class R7 4,633 (12,255) (7,622) 292 (759) (467)Class R8 5,315 (34,823) (29,508) 339 (2,215) (1,876) $ 1,533,892 $ (5,218,044) $ (3,684,152) 94,723 (318,829) (224,106)
828

THE COLLECTIVE INVESTMENT FUNDS OF FIRST MERCANTILE TRUST COMPANY FMT/iShares Russell 2000 Index ETF
Financial Highlights December 31, 2015
The accompanying notes are an integral part of these financial statements.
Change in Net Asset Value Resulting from Operations Ratios (to average net
assets)
NAV per Unit, Beginning of
Period
Net Investment
Income (Loss)(a)
Net Realized and Unrealized
Gain (Loss) from
Investments(a)
Total from Investment Activities
NAV per Unit, End of
Period Total
Return Expenses
Net Investment
Income (Loss)
Class R1 $ 16.1681 $ 0.1368 $ (0.9994) $ (0.8626) $ 15.3055 (5.34)% (0.45)% 0.84%Class R2 16.1855 0.1254 (1.0234) (0.8980) 15.2875 (5.55)% (0.67)% 0.77%Class R3 15.1902 0.0925 (0.9593) (0.8668) 14.3234 (5.71)% (0.83)% 0.61%Class R4 17.1449 0.0685 (1.0747) (1.0062) 16.1387 (5.87)% (1.01)% 0.40%Class R5 16.7582 0.0637 (1.0741) (1.0104) 15.7478 (6.03)% (1.17)% 0.38%Class R6 15.8535 0.0132 (0.9946) (0.9814) 14.8721 (6.19)% (1.35)% 0.08%Class R7 16.0421 (0.0155) (1.0034) (1.0189) 15.0232 (6.35)% (1.52)% (0.10)%Class R8 15.8851 (0.0514) (0.9830) (1.0344) 14.8507 (6.51)% (1.68)% (0.33)%
(a) Per unit amounts are based on average daily units outstanding.
829

FMT/iShares Russell 2000 Value Index ETF

THE COLLECTIVE INVESTMENT FUNDS OF FIRST MERCANTILE TRUST COMPANY FMT/iShares Russell 2000 Value Index ETF
Statement of Assets and Liabilities December 31, 2015
The accompanying notes are an integral part of these financial statements.
Assets Investments in securities, at fair value $ 1,475,012 Cash equivalents 58,101Receivables
Interest 9Total assets 1,533,122
Liabilities Investments purchased 47,771Trustee fees 848
Total liabilities 48,619 Net assets $ 1,484,503 Components of net assets
Units of
Participation NAV
per Unit Net
Assets Class R1 63,466 $ 12.2076 $ 774,764Class R2 13,459 $ 9.1434 123,066Class R3 2,494 $ 13.4545 33,554Class R4 17,483 $ 13.4167 234,564Class R5 9,372 $ 13.9903 131,118Class R6 5,750 $ 13.6654 78,573Class R8 8,623 $ 12.6246 108,864
$ 1,484,503
830

THE COLLECTIVE INVESTMENT FUNDS OF FIRST MERCANTILE TRUST COMPANY FMT/iShares Russell 2000 Value Index ETF
Statement of Operations For the Year Ended December 31, 2015
The accompanying notes are an integral part of these financial statements.
Investment income
Dividends $ 32,360Interest 29
32,389 Expenses
Trustee fees 11,454Custody fees 5,265Audit fees 1,200
17,919 Net investment income 14,470 Net realized gain from investments sold
Proceeds from sales of investments 920,976Cost of investments sold 676,450
Net realized gain from investments sold 244,526 Change in net unrealized appreciation (depreciation) on investments (385,087) Net realized and unrealized loss on investments (140,561) Net decrease in net assets resulting from operations $ (126,091)
831
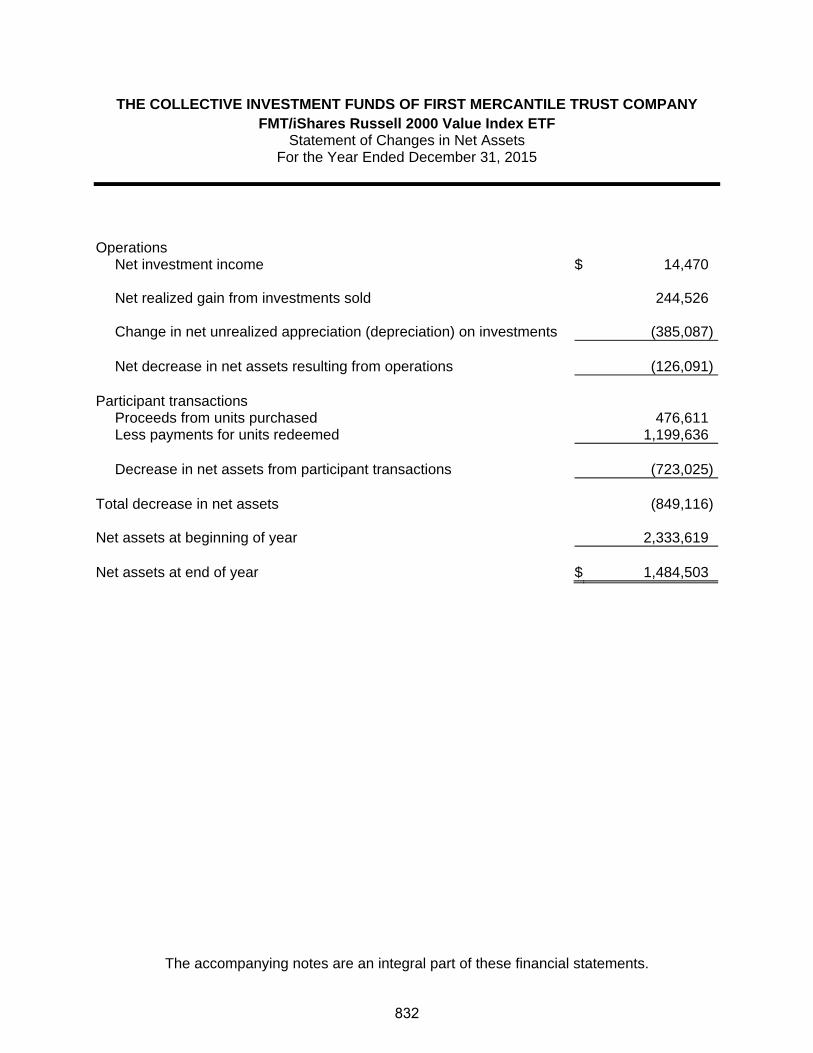
THE COLLECTIVE INVESTMENT FUNDS OF FIRST MERCANTILE TRUST COMPANY FMT/iShares Russell 2000 Value Index ETF
Statement of Changes in Net Assets For the Year Ended December 31, 2015
The accompanying notes are an integral part of these financial statements.
Operations
Net investment income $ 14,470
Net realized gain from investments sold 244,526
Change in net unrealized appreciation (depreciation) on investments (385,087)
Net decrease in net assets resulting from operations (126,091) Participant transactions
Proceeds from units purchased 476,611Less payments for units redeemed 1,199,636
Decrease in net assets from participant transactions (723,025)
Total decrease in net assets (849,116) Net assets at beginning of year 2,333,619 Net assets at end of year $ 1,484,503
832
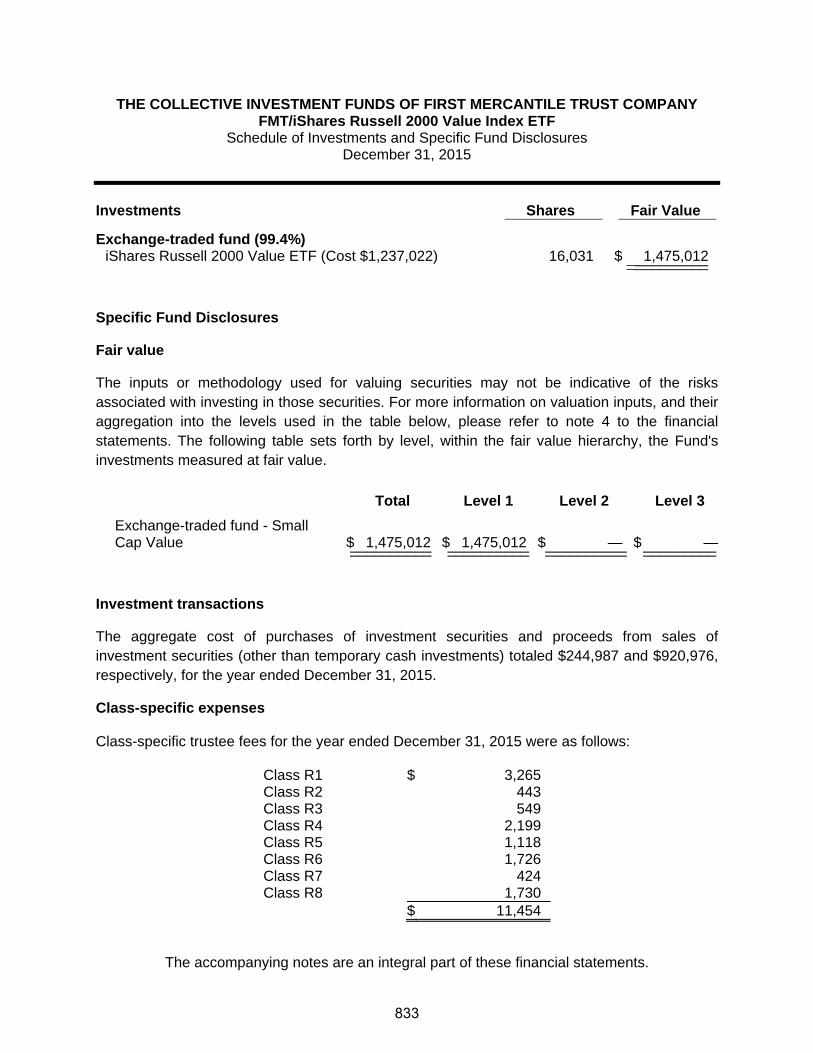
THE COLLECTIVE INVESTMENT FUNDS OF FIRST MERCANTILE TRUST COMPANY FMT/iShares Russell 2000 Value Index ETF
Schedule of Investments and Specific Fund Disclosures December 31, 2015
The accompanying notes are an integral part of these financial statements.
Investments Shares Fair Value ____________ ____________
Exchange-traded fund (99.4%) iShares Russell 2000 Value ETF (Cost $1,237,022) 16,031 $ 1,475,012 ____________________
Specific Fund Disclosures
Fair value
The inputs or methodology used for valuing securities may not be indicative of the risks associated with investing in those securities. For more information on valuation inputs, and their aggregation into the levels used in the table below, please refer to note 4 to the financial statements. The following table sets forth by level, within the fair value hierarchy, the Fund's investments measured at fair value.
Total Level 1 Level 2 Level 3
Exchange-traded fund - Small Cap Value $ 1,475,012 $ 1,475,012 $ — $ —__________ __________ __________ ___________________ __________ __________ _________
Investment transactions
The aggregate cost of purchases of investment securities and proceeds from sales of investment securities (other than temporary cash investments) totaled $244,987 and $920,976, respectively, for the year ended December 31, 2015.
Class-specific expenses Class-specific trustee fees for the year ended December 31, 2015 were as follows: Class R1 $ 3,265 Class R2 443 Class R3 549 Class R4 2,199 Class R5 1,118 Class R6 1,726 Class R7 424 Class R8 1,730 $ 11,454
833
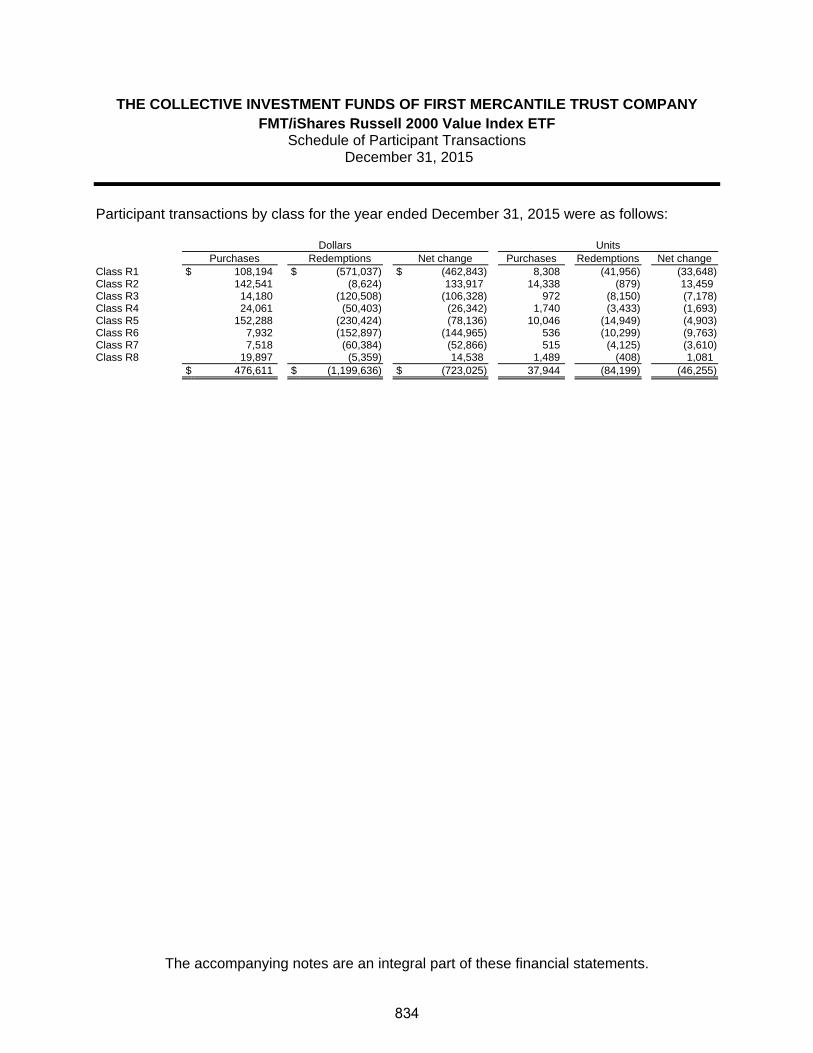
THE COLLECTIVE INVESTMENT FUNDS OF FIRST MERCANTILE TRUST COMPANY FMT/iShares Russell 2000 Value Index ETF
Schedule of Participant Transactions December 31, 2015
The accompanying notes are an integral part of these financial statements.
Participant transactions by class for the year ended December 31, 2015 were as follows: Dollars Units Purchases Redemptions Net change Purchases Redemptions Net change Class R1 $ 108,194 $ (571,037) $ (462,843) 8,308 (41,956) (33,648)Class R2 142,541 (8,624) 133,917 14,338 (879) 13,459Class R3 14,180 (120,508) (106,328) 972 (8,150) (7,178)Class R4 24,061 (50,403) (26,342) 1,740 (3,433) (1,693)Class R5 152,288 (230,424) (78,136) 10,046 (14,949) (4,903)Class R6 7,932 (152,897) (144,965) 536 (10,299) (9,763)Class R7 7,518 (60,384) (52,866) 515 (4,125) (3,610)Class R8 19,897 (5,359) 14,538 1,489 (408) 1,081 $ 476,611 $ (1,199,636) $ (723,025) 37,944 (84,199) (46,255)
834

THE COLLECTIVE INVESTMENT FUNDS OF FIRST MERCANTILE TRUST COMPANY FMT/iShares Russell 2000 Value Index ETF
Financial Highlights December 31, 2015
The accompanying notes are an integral part of these financial statements.
Change in Net Asset Value Resulting from Operations Ratios (to average net
assets)
NAV per Unit, Beginning of
Period
Net Investment
Income (Loss)(a)
Net Realized and Unrealized
Gain (Loss) from
Investments(a)
Total from Investment Activities
NAV per Unit, End of
Period Total
Return Expenses
Net Investment
Income (Loss)
Class R1 $ 13.3350 $ 0.1493 $ (1.2767) $ (1.1274) $ 12.2076 (8.45)% (0.73)% 1.15%Class R2(b) 10.0000 0.1100 (0.9666) (0.8566) 9.1434 (8.57)% (0.91)% 1.33%Class R3 14.7551 0.0816 (1.3822) (1.3006) 13.4545 (8.81)% (1.14)% 0.56%Class R4 14.7388 0.0948 (1.4169) (1.3221) 13.4167 (8.97)% (1.28)% 0.66%Class R5 15.3957 0.0951 (1.5005) (1.4054) 13.9903 (9.13)% (1.44)% 0.64%Class R6 15.0636 0.0165 (1.4147) (1.3982) 13.6654 (9.28)% (1.65)% 0.11%Class R7(c) 15.0915 (0.0572) (0.8440) (0.9012) — (5.97)% (1.83)% (0.39)%Class R8 13.9640 (0.0004) (1.3390) (1.3394) 12.6246 (9.59)% (1.96)% — %
(a) Per unit amounts are based on average daily units outstanding.
(b) For the period from February 20, 2015 (commencement of this class) through December
31, 2015.
(c) For the period from January 1, 2015 through November 20, 2015.
835
FMT/iShares Russell 3000 Index ETF

THE COLLECTIVE INVESTMENT FUNDS OF FIRST MERCANTILE TRUST COMPANY FMT/iShares Russell 3000 Index ETF
Statement of Assets and Liabilities December 31, 2015
The accompanying notes are an integral part of these financial statements.
Assets Investments in securities, at fair value $ 2,697,591 Cash equivalents 114,675Receivables
Dividends and interest 3,201Total assets 2,815,467
Liabilities Investments purchased 98,139Trustee fees 1,444
Total liabilities 99,583 Net assets $ 2,715,884 Components of net assets
Units of
Participation NAV
per Unit Net
Assets Class R1 126,726 $ 15.0979 $ 1,913,291Class R2 8,282 $ 16.6815 138,162Class R3 2,831 $ 16.1543 45,734Class R4 8,141 $ 16.6854 135,835Class R5 11,938 $ 16.1720 193,055Class R6 5,995 $ 16.4955 98,896Class R7 992 $ 16.7161 16,585Class R8 11,681 $ 14.9233 174,326
$ 2,715,884
836

THE COLLECTIVE INVESTMENT FUNDS OF FIRST MERCANTILE TRUST COMPANY FMT/iShares Russell 3000 Index ETF
Statement of Operations For the Year Ended December 31, 2015
The accompanying notes are an integral part of these financial statements.
Investment income
Dividends $ 59,538Interest 47
59,585 Expenses
Trustee fees 16,863Custody fees 5,034Audit fees 1,200
23,097 Net investment income 36,488 Net realized gain from investments sold
Proceeds from sales of investments 1,022,237Cost of investments sold 764,105
Net realized gain from investments sold 258,132 Change in net unrealized appreciation (depreciation) on investments (298,233) Net realized and unrealized loss on investments (40,101) Net decrease in net assets resulting from operations $ (3,613)
837

THE COLLECTIVE INVESTMENT FUNDS OF FIRST MERCANTILE TRUST COMPANY FMT/iShares Russell 3000 Index ETF
Statement of Changes in Net Assets For the Year Ended December 31, 2015
The accompanying notes are an integral part of these financial statements.
Operations
Net investment income $ 36,488
Net realized gain from investments sold 258,132
Change in net unrealized appreciation (depreciation) on investments (298,233)
Net decrease in net assets resulting from operations (3,613) Participant transactions
Proceeds from units purchased 912,010Less payments for units redeemed 1,135,570
Decrease in net assets from participant transactions (223,560)
Total decrease in net assets (227,173) Net assets at beginning of year 2,943,057 Net assets at end of year $ 2,715,884
838

THE COLLECTIVE INVESTMENT FUNDS OF FIRST MERCANTILE TRUST COMPANY FMT/iShares Russell 3000 Index ETF
Schedule of Investments and Specific Fund Disclosures December 31, 2015
The accompanying notes are an integral part of these financial statements.
Investments Shares Fair Value ____________ ____________
Exchange-traded fund (99.3%) iShares Russell 3000 Index ETF (Cost $2,107,324) 22,422 $ 2,697,591 _____________________ Specific Fund Disclosures Fair value The inputs or methodology used for valuing securities may not be indicative of the risks associated with investing in those securities. For more information on valuation inputs, and their aggregation into the levels used in the table below, please refer to note 4 to the financial statements. The following table sets forth by level, within the fair value hierarchy, the Fund's investments measured at fair value.
Total Level 1 Level 2 Level 3
Exchange-traded fund - All Cap Core $ 2,697,591 $ 2,697,591 $ — $ —__________ __________ __________ ___________________ __________ __________ _________
Investment transactions The aggregate cost of purchases of investment securities and proceeds from sales of investment securities (other than temporary cash investments) totaled $918,276 and $1,022,237, respectively, for the year ended December 31, 2015. Class-specific expenses Class-specific trustee fees for the year ended December 31, 2015 were as follows: Class R1 $ 7,888 Class R2 765 Class R3 262 Class R4 1,882 Class R5 1,494 Class R6 1,222 Class R7 553 Class R8 2,797 $ 16,863
839

THE COLLECTIVE INVESTMENT FUNDS OF FIRST MERCANTILE TRUST COMPANY FMT/iShares Russell 3000 Index ETF Schedule of Participant Transactions
December 31, 2015
The accompanying notes are an integral part of these financial statements.
Participant transactions by class for the year ended December 31, 2015 were as follows: Dollars Units Purchases Redemptions Net change Purchases Redemptions Net change Class R1 $ 682,726 $ (955,456) $ (272,730) 45,476 (62,141) (16,665)Class R2 16,081 (1,589) 14,492 943 (97) 846Class R3 18,931 (6,110) 12,821 1,143 (383) 760Class R4 40,559 (129,036) (88,477) 2,379 (7,839) (5,460)Class R5 136,765 (5,283) 131,482 8,208 (322) 7,886Class R6 7,418 (4,162) 3,256 440 (243) 197Class R7 4,100 (24,927) (20,827) 240 (1,507) (1,267)Class R8 5,430 (9,007) (3,577) 358 (591) (233) $ 912,010 $ (1,135,570) $ (223,560) 59,187 (73,123) (13,936)
840

THE COLLECTIVE INVESTMENT FUNDS OF FIRST MERCANTILE TRUST COMPANY FMT/iShares Russell 3000 Index ETF
Financial Highlights December 31, 2015
The accompanying notes are an integral part of these financial statements.
Change in Net Asset Value Resulting from Operations Ratios (to average net
assets)
NAV per Unit, Beginning of
Period
Net Investment
Income (Loss)(a)
Net Realized and Unrealized
Gain (Loss) from
Investments(a)
Total from Investment Activities
NAV per Unit, End of
Period Total
Return Expenses
Net Investment
Income (Loss)
Class R1 $ 15.1560 $ 0.1521 $ (0.2102) $ (0.0581) $ 15.0979 (0.38)% (0.48)% 1.00%Class R2 16.7827 0.2041 (0.3053) (0.1012) 16.6815 (0.60)% (0.78)% 1.21%Class R3 16.2801 0.2475 (0.3733) (0.1258) 16.1543 (0.77)% (1.01)% 1.51%Class R4 16.8442 0.2438 (0.4026) (0.1588) 16.6854 (0.94)% (1.26)% 1.43%Class R5 16.3538 0.2959 (0.4777) (0.1818) 16.1720 (1.11)% (1.45)% 1.81%Class R6 16.7094 0.3161 (0.5300) (0.2139) 16.4955 (1.28)% (1.71)% 1.88%Class R7 16.9619 0.3017 (0.5475) (0.2458) 16.7161 (1.45)% (0.78)% 0.71%Class R8 15.1686 0.3382 (0.5835) (0.2453) 14.9233 (1.62)% (2.17)% 2.22%
(a) Per unit amounts are based on average daily units outstanding.
841

FMT/iShares Russell Mid-Cap Growth Index ETF

THE COLLECTIVE INVESTMENT FUNDS OF FIRST MERCANTILE TRUST COMPANY FMT/iShares Russell Mid-Cap Growth Index ETF
Statement of Assets and Liabilities December 31, 2015
The accompanying notes are an integral part of these financial statements.
Assets Investments in securities, at fair value $ 7,010,597 Cash equivalents 304,254Receivables
Interest 109Total assets 7,314,960
Liabilities Investments purchased 282,767Trustee fees 4,033
Total liabilities 286,800 Net assets $ 7,028,160 Components of net assets
Units of
Participation NAV
per Unit Net
Assets Class R1 79,097 $ 34.0678 $ 2,694,662Class R2 170 $ 9.4912 1,611Class R3 151,896 $ 16.0035 2,430,868Class R4 72,257 $ 16.2779 1,176,196Class R5 14,404 $ 15.6958 226,080Class R6 13,756 $ 14.6244 201,179Class R7 2,800 $ 15.5790 43,620Class R8 16,942 $ 14.9888 253,944
$ 7,028,160
842
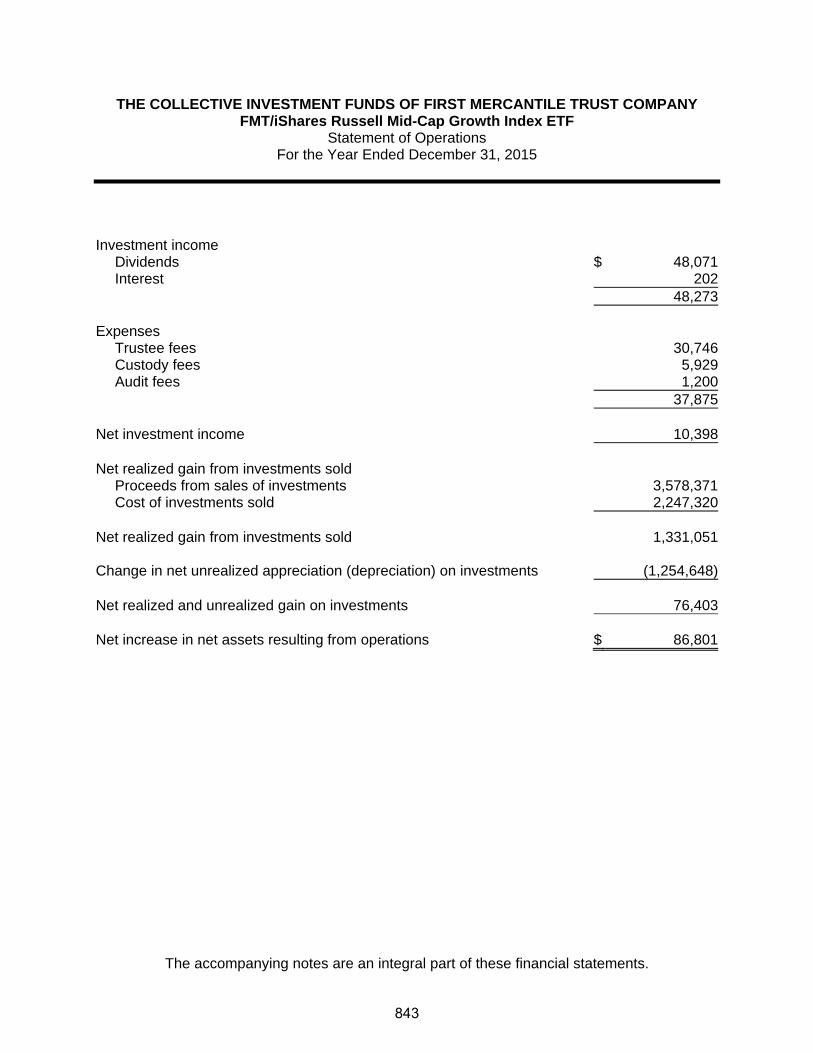
THE COLLECTIVE INVESTMENT FUNDS OF FIRST MERCANTILE TRUST COMPANY FMT/iShares Russell Mid-Cap Growth Index ETF
Statement of Operations For the Year Ended December 31, 2015
The accompanying notes are an integral part of these financial statements.
Investment income
Dividends $ 48,071Interest 202
48,273 Expenses
Trustee fees 30,746Custody fees 5,929Audit fees 1,200
37,875 Net investment income 10,398 Net realized gain from investments sold
Proceeds from sales of investments 3,578,371Cost of investments sold 2,247,320
Net realized gain from investments sold 1,331,051 Change in net unrealized appreciation (depreciation) on investments (1,254,648) Net realized and unrealized gain on investments 76,403 Net increase in net assets resulting from operations $ 86,801
843

THE COLLECTIVE INVESTMENT FUNDS OF FIRST MERCANTILE TRUST COMPANY FMT/iShares Russell Mid-Cap Growth Index ETF
Statement of Changes in Net Assets For the Year Ended December 31, 2015
The accompanying notes are an integral part of these financial statements.
Operations
Net investment income $ 10,398
Net realized gain from investments sold 1,331,051
Change in net unrealized appreciation (depreciation) on investments (1,254,648)
Net increase in net assets resulting from operations 86,801 Participant transactions
Proceeds from units purchased 4,938,493Less payments for units redeemed 4,144,169
Increase in net assets from participant transactions 794,324
Total increase in net assets 881,125 Net assets at beginning of year 6,147,035 Net assets at end of year $ 7,028,160
844

THE COLLECTIVE INVESTMENT FUNDS OF FIRST MERCANTILE TRUST COMPANY FMT/iShares Russell Mid-Cap Growth Index ETF
Schedule of Investments and Specific Fund Disclosures December 31, 2015
The accompanying notes are an integral part of these financial statements.
Investments Shares Fair Value ____________ ____________
Exchange-traded fund (99.8%)
iShares Russell Mid-Cap Growth Index ETF (Cost $5,961,581) 76,227 $ 7,010,597 ____________________
Specific Fund Disclosures Fair value The inputs or methodology used for valuing securities may not be indicative of the risks associated with investing in those securities. For more information on valuation inputs, and their aggregation into the levels used in the table below, please refer to note 4 to the financial statements. The following table sets forth by level, within the fair value hierarchy, the Fund's investments measured at fair value.
Total Level 1 Level 2 Level 3
Exchange-traded fund - Mid Cap Growth $ 7,010,597 $ 7,010,597 $ — $ —__________ __________ __________ ___________________ __________ __________ _________
Investment transactions The aggregate cost of purchases of investment securities and proceeds from sales of investment securities (other than temporary cash investments) totaled $4,576,704 and $3,578,371, respectively, for the year ended December 31, 2015. Class-specific expenses Class-specific trustee fees for the year ended December 31, 2015 were as follows: Class R1 $ 13,265 Class R2 34 Class R3 7,252 Class R4 3,387 Class R5 1,369 Class R6 1,298 Class R7 552 Class R8 3,589 $ 30,746
845

THE COLLECTIVE INVESTMENT FUNDS OF FIRST MERCANTILE TRUST COMPANY FMT/iShares Russell Mid-Cap Growth Index ETF
Schedule of Participant Transactions December 31, 2015
The accompanying notes are an integral part of these financial statements.
Participant transactions by class for the year ended December 31, 2015 were as follows: Dollars Units Purchases Redemptions Net change Purchases Redemptions Net change Class R1 $ 1,018,430 $ (3,432,950) $ (2,414,520) 29,026 (96,413) (67,387)Class R2 1,700 (57,802) (56,102) 172 (3,693) (3,521)Class R3 2,113,220 (162,963) 1,950,257 133,735 (9,827) 123,908Class R4 1,398,123 (332,335) 1,065,788 85,660 (20,459) 65,201Class R5 121,344 (52,734) 68,610 7,789 (3,329) 4,460Class R6 169,457 (25,120) 144,337 11,448 (1,715) 9,733Class R7 51,660 (66,149) (14,489) 3,265 (4,103) (838)Class R8 64,559 (14,116) 50,443 4,239 (886) 3,353 $ 4,938,493 $ (4,144,169) $ 794,324 275,334 (140,425) 134,909
846

THE COLLECTIVE INVESTMENT FUNDS OF FIRST MERCANTILE TRUST COMPANY FMT/iShares Russell Mid-Cap Growth Index ETF
Financial Highlights December 31, 2015
The accompanying notes are an integral part of these financial statements.
Change in Net Asset Value Resulting from Operations Ratios (to average net
assets)
NAV per Unit, Beginning of
Period
Net Investment
Income (Loss)(a)
Net Realized and Unrealized
Gain (Loss) from
Investments(a)
Total from Investment Activities
NAV per Unit, End of
Period Total
Return Expenses
Net Investment
Income (Loss)
Class R1 $ 34.3674 $ 0.0889 $ (0.3885) $ (0.2996) $ 34.0678 (0.87)% (0.49)% 0.25%Class R2(b) 15.7822 (0.0015) (0.1276) (0.1291) — (0.82)% (0.10)% (0.01)%Class R2(c) 10.0000 (0.0098) (0.4990) (0.5088) 9.4912 (5.09)% (0.63)% (0.09)%Class R3 16.2077 0.0470 (0.2512) (0.2042) 16.0035 (1.26)% (0.84)% 0.29%Class R4 16.5138 0.0448 (0.2807) (0.2359) 16.2779 (1.43)% (0.99)% 0.27%Class R5 15.9505 (0.0295) (0.2252) (0.2547) 15.6958 (1.60)% (1.21)% (0.18)%Class R6 14.8870 (0.0518) (0.2108) (0.2626) 14.6244 (1.76)% (1.36)% (0.34)%Class R7 15.8860 (0.1395) (0.1675) (0.3070) 15.5790 (1.93)% (1.55)% (0.86)%Class R8 15.3103 (0.1384) (0.1831) (0.3215) 14.9888 (2.10)% (1.72)% (0.89)%
(a) Per unit amounts are based on average daily units outstanding.
(b) For the period from January 1, 2015 through February 2, 2015.
(c) For the period from May 1, 2015 (recommencement of this class) through December 31,
2015.
847
FMT/iShares Russell Mid-Cap Value Index ETF

THE COLLECTIVE INVESTMENT FUNDS OF FIRST MERCANTILE TRUST COMPANY FMT/iShares Russell Mid-Cap Value Index ETF
Statement of Assets and Liabilities December 31, 2015
The accompanying notes are an integral part of these financial statements.
Assets Investments in securities, at fair value $ 8,147,234 Cash equivalents 323,656Receivables
Dividends and interest 474Total assets 8,471,364
Liabilities Investments purchased 266,189Trustee fees 4,038
Total liabilities 270,227 Net assets $ 8,201,137 Components of net assets
Units of
Participation NAV
per Unit Net
Assets Class R1 367,749 $ 14.6542 $ 5,389,077Class R2 3,413 $ 16.5232 56,397Class R3 55,591 $ 15.4975 861,523Class R4 58,330 $ 16.3329 952,703Class R5 12,949 $ 15.4762 200,394Class R6 37,766 $ 15.8694 599,332Class R7 397 $ 15.5180 6,160Class R8 8,470 $ 16.0039 135,551
$ 8,201,137
848

THE COLLECTIVE INVESTMENT FUNDS OF FIRST MERCANTILE TRUST COMPANY FMT/iShares Russell Mid-Cap Value Index ETF
Statement of Operations For the Year Ended December 31, 2015
The accompanying notes are an integral part of these financial statements.
Investment income
Dividends $ 190,799Interest 582
191,381 Expenses
Trustee fees 59,167Custody fees 5,529Audit fees 1,200
65,896 Net investment income 125,485 Net realized gain from investments sold
Proceeds from sales of investments 3,352,596Cost of investments sold 2,326,417
Net realized gain from investments sold 1,026,179 Change in net unrealized appreciation (depreciation) on investments (1,728,672) Net realized and unrealized loss on investments (702,493) Net decrease in net assets resulting from operations $ (577,008)
849

THE COLLECTIVE INVESTMENT FUNDS OF FIRST MERCANTILE TRUST COMPANY FMT/iShares Russell Mid-Cap Value Index ETF
Statement of Changes in Net Assets For the Year Ended December 31, 2015
The accompanying notes are an integral part of these financial statements.
Operations
Net investment income $ 125,485
Net realized gain from investments sold 1,026,179
Change in net unrealized appreciation (depreciation) on investments (1,728,672)
Net decrease in net assets resulting from operations (577,008) Participant transactions
Proceeds from units purchased 2,245,607Less payments for units redeemed 4,660,116
Decrease in net assets from participant transactions (2,414,509)
Total decrease in net assets (2,991,517) Net assets at beginning of year 11,192,654 Net assets at end of year $ 8,201,137
850
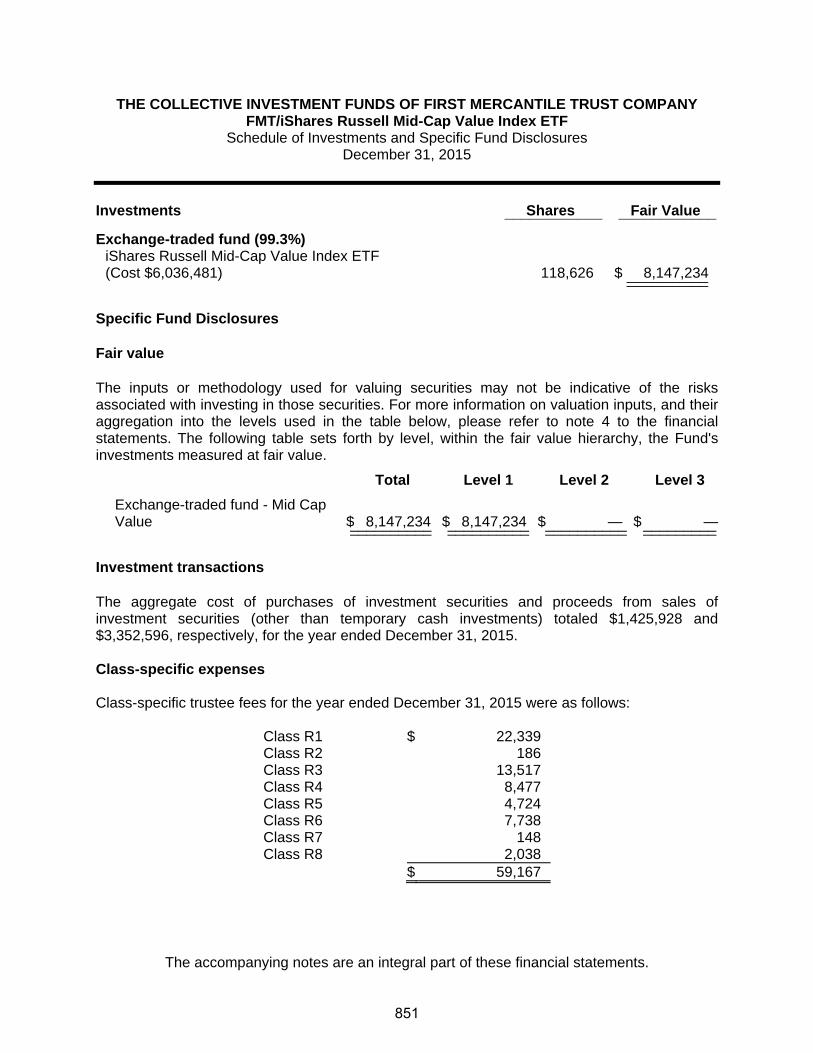
THE COLLECTIVE INVESTMENT FUNDS OF FIRST MERCANTILE TRUST COMPANY FMT/iShares Russell Mid-Cap Value Index ETF
Schedule of Investments and Specific Fund Disclosures December 31, 2015
The accompanying notes are an integral part of these financial statements.
Investments Shares Fair Value ____________ ____________
Exchange-traded fund (99.3%)
iShares Russell Mid-Cap Value Index ETF (Cost $6,036,481) 118,626 $ 8,147,234 ____________________
Specific Fund Disclosures Fair value The inputs or methodology used for valuing securities may not be indicative of the risks associated with investing in those securities. For more information on valuation inputs, and their aggregation into the levels used in the table below, please refer to note 4 to the financial statements. The following table sets forth by level, within the fair value hierarchy, the Fund's investments measured at fair value.
Total Level 1 Level 2 Level 3
Exchange-traded fund - Mid Cap Value $ 8,147,234 $ 8,147,234 $ — $ —__________ __________ __________ ___________________ __________ __________ _________
Investment transactions The aggregate cost of purchases of investment securities and proceeds from sales of investment securities (other than temporary cash investments) totaled $1,425,928 and $3,352,596, respectively, for the year ended December 31, 2015. Class-specific expenses Class-specific trustee fees for the year ended December 31, 2015 were as follows: Class R1 $ 22,339 Class R2 186 Class R3 13,517 Class R4 8,477 Class R5 4,724 Class R6 7,738 Class R7 148 Class R8 2,038 $ 59,167
851

THE COLLECTIVE INVESTMENT FUNDS OF FIRST MERCANTILE TRUST COMPANY FMT/iShares Russell Mid-Cap Value Index ETF
Schedule of Participant Transactions December 31, 2015
The accompanying notes are an integral part of these financial statements.
Participant transactions by class for the year ended December 31, 2015 were as follows: Dollars Units Purchases Redemptions Net change Purchases Redemptions Net change Class R1 $ 897,616 $ (2,345,206) $ (1,447,590) 58,221 (152,170) (93,949)Class R2 60,966 (494) 60,472 3,417 (28) 3,389Class R3 594,466 (1,636,331) (1,041,865) 36,297 (106,268) (69,971)Class R4 464,040 (223,859) 240,181 27,262 (13,819) 13,443Class R5 39,931 (286,047) (246,116) 2,489 (18,058) (15,569)Class R6 122,282 (127,289) (5,007) 7,223 (7,451) (228)Class R7 2,672 (6,627) (3,955) 163 (410) (247)Class R8 63,634 (34,263) 29,371 3,734 (1,969) 1,765 $ 2,245,607 $ (4,660,116) $ (2,414,509) 138,806 (300,173) (161,367)
852

THE COLLECTIVE INVESTMENT FUNDS OF FIRST MERCANTILE TRUST COMPANY FMT/iShares Russell Mid-Cap Value Index ETF
Financial Highlights December 31, 2015
The accompanying notes are an integral part of these financial statements.
Change in Net Asset Value Resulting from Operations Ratios (to average net
assets)
NAV per Unit, Beginning of
Period
Net Investment
Income (Loss)(a)
Net Realized and Unrealized
Gain (Loss) from
Investments(a)
Total from Investment Activities
NAV per Unit, End of
Period Total
Return Expenses
Net Investment
Income (Loss)
Class R1 $ 15.4316 $ 0.2245 $ (1.0019) $ (0.7774) $ 14.6542 (5.04)% (0.41)% 1.46%Class R2 17.4386 0.2861 (1.2015) (0.9154) 16.5232 (5.25)% (0.63)% 1.68%Class R3 16.3837 0.1436 (1.0298) (0.8862) 15.4975 (5.41)% (0.81)% 0.88%Class R4 17.2965 0.1671 (1.1307) (0.9636) 16.3329 (5.57)% (0.97)% 0.98%Class R5 16.4172 0.0813 (1.0223) (0.9410) 15.4762 (5.73)% (1.15)% 0.50%Class R6 16.8631 0.1040 (1.0977) (0.9937) 15.8694 (5.89)% (1.31)% 0.62%Class R7 16.5178 0.0392 (1.0390) (0.9998) 15.5180 (6.05)% (1.48)% 0.24%Class R8 17.0642 0.0547 (1.1150) (1.0603) 16.0039 (6.21)% (1.65)% 0.33%
(a) Per unit amounts are based on average daily units outstanding.
853
FMT/Longleaf Partners Fund

THE COLLECTIVE INVESTMENT FUNDS OF FIRST MERCANTILE TRUST COMPANY FMT/Longleaf Partners Fund
Statement of Assets and Liabilities December 31, 2015
The accompanying notes are an integral part of these financial statements.
Assets Investments in securities, at fair value $ 2,540,285 Liabilities Trustee fees 1,752 Net assets $ 2,538,533 Components of net assets
Units of
Participation NAV
per Unit Net
Assets Class R1 78,565 $ 11.8597 $ 931,761Class R2 23,102 $ 12.7043 293,495Class R3 6,000 $ 12.0745 72,452Class R4 24,244 $ 12.3536 299,508Class R5 14,798 $ 12.0479 178,278Class R6 44,370 $ 12.2497 543,512Class R7 16,226 $ 12.2602 198,937Class R8 1,624 $ 12.6804 20,590
$ 2,538,533
854

THE COLLECTIVE INVESTMENT FUNDS OF FIRST MERCANTILE TRUST COMPANY FMT/Longleaf Partners Fund
Statement of Operations For the Year Ended December 31, 2015
The accompanying notes are an integral part of these financial statements.
Investment income
Dividends $ 447,572 Expenses
Trustee fees 32,400Custody fees 1,774Audit fees 1,200
35,374 Net investment income 412,198 Net realized loss from investments sold
Proceeds from sales of investments 3,473,329Cost of investments sold 3,567,157
Net realized loss from investments sold (93,828) Change in net unrealized appreciation (depreciation) on investments (1,203,767) Net realized and unrealized loss on investments (1,297,595) Net decrease in net assets resulting from operations $ (885,397)
855

THE COLLECTIVE INVESTMENT FUNDS OF FIRST MERCANTILE TRUST COMPANY FMT/Longleaf Partners Fund
Statement of Changes in Net Assets For the Year Ended December 31, 2015
The accompanying notes are an integral part of these financial statements.
Operations
Net investment income $ 412,198
Net realized loss from investments sold (93,828)
Change in net unrealized appreciation (depreciation) on investments (1,203,767)
Net decrease in net assets resulting from operations (885,397) Participant transactions
Proceeds from units purchased 650,498Less payments for units redeemed 3,619,848
Decrease in net assets from participant transactions (2,969,350)
Total decrease in net assets (3,854,747) Net assets at beginning of year 6,393,280 Net assets at end of year $ 2,538,533
856

THE COLLECTIVE INVESTMENT FUNDS OF FIRST MERCANTILE TRUST COMPANY FMT/Longleaf Partners Fund
Schedule of Investments and Specific Fund Disclosures December 31, 2015
The accompanying notes are an integral part of these financial statements.
Investments Shares Fair Value ____________ ____________
Mutual fund (100.1%) Longleaf Partners Fund (Cost $3,305,434) 118,428 $ 2,540,285 ____________________ Specific Fund Disclosures Fair value The inputs or methodology used for valuing securities may not be indicative of the risks associated with investing in those securities. For more information on valuation inputs, and their aggregation into the levels used in the table below, please refer to note 4 to the financial statements. The following table sets forth by level, within the fair value hierarchy, the Fund's investments measured at fair value.
Total Level 1 Level 2 Level 3
Mutual fund - All Cap Value $ 2,540,285 $ 2,540,285 $ — $ —__________ __________ __________ ___________________ __________ __________ _________ Investment transactions The aggregate cost of purchases of investment securities and proceeds from sales of investment securities (other than temporary cash investments) totaled $914,105 and $3,473,329, respectively, for the year ended December 31, 2015. Class-specific expenses Class-specific trustee fees for the year ended December 31, 2015 were as follows: Class R1 $ 6,685 Class R2 3,317 Class R3 1,613 Class R4 4,295 Class R5 4,126 Class R6 8,069 Class R7 3,379 Class R8 916 $ 32,400
857

THE COLLECTIVE INVESTMENT FUNDS OF FIRST MERCANTILE TRUST COMPANY FMT/Longleaf Partners Fund
Schedule of Participant Transactions December 31, 2015
The accompanying notes are an integral part of these financial statements.
Participant transactions by class for the year ended December 31, 2015 were as follows: Dollars Units Purchases Redemptions Net change Purchases Redemptions Net change Class R1 $ 174,623 $ (1,380,957) $ (1,206,334) 13,185 (107,139) (93,954)Class R2 76,549 (741,792) (665,243) 5,335 (49,715) (44,380)Class R3 60,173 (449,874) (389,701) 4,667 (31,298) (26,631)Class R4 240,258 (558,989) (318,731) 16,257 (38,165) (21,908)Class R5 26,363 (282,809) (256,446) 1,995 (20,721) (18,726)Class R6 56,809 (124,312) (67,503) 4,022 (8,656) (4,634)Class R7 9,150 (42,793) (33,643) 630 (2,951) (2,321)Class R8 6,573 (38,322) (31,749) 457 (2,908) (2,451) $ 650,498 $ (3,619,848) $ (2,969,350) 46,548 (261,553) (215,005)
858

THE COLLECTIVE INVESTMENT FUNDS OF FIRST MERCANTILE TRUST COMPANY FMT/Longleaf Partners Fund
Financial Highlights December 31, 2015
The accompanying notes are an integral part of these financial statements.
Change in Net Asset Value Resulting from Operations Ratios (to average net
assets)
NAV per Unit, Beginning of
Period
Net Investment
Income (Loss)(a)
Net Realized and Unrealized
Gain (Loss) from
Investments(a)
Total from Investment Activities
NAV per Unit, End of
Period Total
Return Expenses
Net Investment
Income (Loss)
Class R1 $ 14.6684 $ 1.2025 $ (4.0112) $ (2.8087) $ 11.8597 (19.15)% (0.42)% 8.74%Class R2 15.7482 1.0573 (4.1012) (3.0439) 12.7043 (19.33)% (0.64)% 7.03%Class R3 14.9934 0.4060 (3.3249) (2.9189) 12.0745 (19.47)% (0.81)% 2.79%Class R4 15.3663 1.3718 (4.3845) (3.0127) 12.3536 (19.61)% (0.98)% 9.58%Class R5 15.0120 1.4328 (4.3969) (2.9641) 12.0479 (19.74)% (1.15)% 10.15%Class R6 15.2897 1.7083 (4.7483) (3.0400) 12.2497 (19.88)% (1.32)% 12.10%Class R7 15.3293 1.7453 (4.8144) (3.0691) 12.2602 (20.02)% (1.49)% 12.35%Class R8 15.8819 1.7291 (4.9306) (3.2015) 12.6804 (20.16)% (1.66)% 11.76%
(a) Per unit amounts are based on average daily units outstanding.
859

FMT/Longleaf Small Cap Fund

THE COLLECTIVE INVESTMENT FUNDS OF FIRST MERCANTILE TRUST COMPANY FMT/Longleaf Small Cap Fund
Statement of Assets and Liabilities December 31, 2015
The accompanying notes are an integral part of these financial statements.
Assets Investments in securities, at fair value $ 700,811 Liabilities Trustee fees 597 Net assets $ 700,214 Components of net assets
Units of
Participation NAV
per Unit Net
Assets Class R1 10,661 $ 13.6996 $ 146,050Class R2 1,292 $ 8.6361 11,160Class R4 17,920 $ 11.4241 204,723Class R5 8,729 $ 11.6811 101,964Class R6 6,955 $ 15.2311 105,935Class R7 130 $ 12.2724 1,593Class R8 13,570 $ 9.4906 128,789
$ 700,214
860

THE COLLECTIVE INVESTMENT FUNDS OF FIRST MERCANTILE TRUST COMPANY FMT/Longleaf Small Cap Fund
Statement of Operations For the Year Ended December 31, 2015
The accompanying notes are an integral part of these financial statements.
Investment income
Dividends $ 39,418 Expenses
Trustee fees 8,063Audit fees 1,200Custody fees 279
9,542 Net investment income 29,876 Net realized gain from investments sold
Proceeds from sales of investments 290,128Cost of investments sold 275,930
Net realized gain from investments sold 14,198 Change in net unrealized appreciation (depreciation) on investments (83,081) Net realized and unrealized loss on investments (68,883) Net decrease in net assets resulting from operations $ (39,007)
861

THE COLLECTIVE INVESTMENT FUNDS OF FIRST MERCANTILE TRUST COMPANY FMT/Longleaf Small Cap Fund
Statement of Changes in Net Assets For the Year Ended December 31, 2015
The accompanying notes are an integral part of these financial statements.
Operations
Net investment income $ 29,876
Net realized gain from investments sold 14,198
Change in net unrealized appreciation (depreciation) on investments (83,081)
Net decrease in net assets resulting from operations (39,007) Participant transactions
Proceeds from units purchased 508,189Less payments for units redeemed 502,095
Increase in net assets from participant transactions 6,094
Total decrease in net assets (32,913) Net assets at beginning of year 733,127 Net assets at end of year $ 700,214
862

THE COLLECTIVE INVESTMENT FUNDS OF FIRST MERCANTILE TRUST COMPANY FMT/Longleaf Small Cap Fund
Schedule of Investments and Specific Fund Disclosures December 31, 2015
The accompanying notes are an integral part of these financial statements.
Investments Shares Fair Value ____________ ____________
Mutual fund (100.1%) Longleaf Partners Small Cap Fund (Cost $779,279) 25,975 $ 700,811 ____________________ Specific Fund Disclosures Fair value The inputs or methodology used for valuing securities may not be indicative of the risks associated with investing in those securities. For more information on valuation inputs, and their aggregation into the levels used in the table below, please refer to note 4 to the financial statements. The following table sets forth by level, within the fair value hierarchy, the Fund's investments measured at fair value.
Total Level 1 Level 2 Level 3
Mutual fund - Small Cap Value $ 700,811 $ 700,811 $ — $ —__________ __________ __________ ___________________ __________ __________ _________ Investment transactions The aggregate cost of purchases of investment securities and proceeds from sales of investment securities (other than temporary cash investments) totaled $326,125 and $290,128, respectively, for the year ended December 31, 2015. Class-specific expenses Class-specific trustee fees for the year ended December 31, 2015 were as follows: Class R1 $ 586 Class R2 29 Class R3 13 Class R4 1,518 Class R5 2,387 Class R6 1,396 Class R7 24 Class R8 2,110 $ 8,063
863

THE COLLECTIVE INVESTMENT FUNDS OF FIRST MERCANTILE TRUST COMPANY FMT/Longleaf Small Cap Fund
Schedule of Participant Transactions December 31, 2015
The accompanying notes are an integral part of these financial statements.
Participant transactions by class for the year ended December 31, 2015 were as follows: Dollars Units Purchases Redemptions Net change Purchases Redemptions Net change Class R1 $ 80,472 $ (111,588) $ (31,116) 5,344 (7,238) (1,894)Class R2 12,271 (6) 12,265 1,293 (1) 1,292Class R3 4,336 (6,634) (2,298) 408 (602) (194)Class R4 224,521 (29,688) 194,833 17,013 (2,520) 14,493Class R5 33,790 (342,635) (308,845) 2,700 (25,247) (22,547)Class R6 5,823 (727) 5,096 349 (43) 306Class R7 — (1) (1) — — —Class R8 146,976 (10,816) 136,160 14,661 (1,091) 13,570 $ 508,189 $ (502,095) $ 6,094 41,768 (36,742) 5,026
864

THE COLLECTIVE INVESTMENT FUNDS OF FIRST MERCANTILE TRUST COMPANY FMT/Longleaf Small Cap Fund
Financial Highlights December 31, 2015
The accompanying notes are an integral part of these financial statements.
Change in Net Asset Value Resulting from Operations Ratios (to average net
assets)
NAV per Unit, Beginning of
Period
Net Investment
Income (Loss)(a)
Net Realized and Unrealized
Gain (Loss) from
Investments(a)
Total from Investment Activities
NAV per Unit, End of
Period Total
Return Expenses
Net Investment
Income (Loss)
Class R1 $ 14.6608 $ 0.6092 $ (1.5704) $ (0.9612) $ 13.6996 (6.56)% (0.52)% 4.14%Class R2(b) 10.0000 0.4749 (1.8388) (1.3639) 8.6361 (13.64)% (0.75)% 10.18%Class R3(c) 10.2188 (0.0395) 0.8453 0.8058 — 7.89% (0.94)% (0.94)%Class R4 12.2947 0.7581 (1.6287) (0.8706) 11.4241 (7.08)% (1.09)% 6.24%Class R5 12.5930 0.1656 (1.0775) (0.9119) 11.6811 (7.24)% (1.27)% 1.29%Class R6 16.4479 0.6328 (1.8496) (1.2168) 15.2311 (7.40)% (1.43)% 3.86%Class R7 13.2759 0.4692 (1.4727) (1.0035) 12.2724 (7.56)% (1.61)% 3.55%Class R8(d) 10.0000 0.3513 (0.8607) (0.5094) 9.4906 (5.09)% (1.77)% 3.62%
(a) Per unit amounts are based on average daily units outstanding.
(b) For the period from May 29, 2015 (commencement of this class) through December 31,
2015.
(c) For the period from January 1, 2015 through May 28, 2015.
(d) For the period from January 21, 2015 (commencement of this class) through December 31, 2015.
865

FMT/Meridian Growth Fund

THE COLLECTIVE INVESTMENT FUNDS OF FIRST MERCANTILE TRUST COMPANY FMT/Meridian Growth Fund
Statement of Assets and Liabilities December 31, 2015
The accompanying notes are an integral part of these financial statements.
Assets Investments in securities, at fair value $ 11,363,451 Liabilities Trustee fees 6,300 Net assets $ 11,357,151 Components of net assets
Units of
Participation NAV
per Unit Net
Assets Class R1 244,875 $ 20.1141 $ 4,925,437Class R2 91,907 $ 14.8953 1,368,982Class R3 122,773 $ 14.3244 1,758,651Class R4 112,114 $ 14.1343 1,584,652Class R5 79,293 $ 14.1679 1,123,408Class R6 31,848 $ 14.1978 452,168Class R7 5,309 $ 14.1756 75,262Class R8 4,798 $ 14.2962 68,591
$ 11,357,151
866

THE COLLECTIVE INVESTMENT FUNDS OF FIRST MERCANTILE TRUST COMPANY FMT/Meridian Growth Fund
Statement of Operations For the Year Ended December 31, 2015
The accompanying notes are an integral part of these financial statements.
Investment income
Dividends $ 1,238,218 Expenses
Trustee fees 91,055Custody fees 5,088Audit fees 1,200
97,343 Net investment income 1,140,875 Net realized loss from investments sold
Proceeds from sales of investments 5,477,647Cost of investments sold 5,740,281
Net realized loss from investments sold (262,634) Change in net unrealized appreciation (depreciation) on investments (1,653,123) Net realized and unrealized loss on investments (1,915,757) Net decrease in net assets resulting from operations $ (774,882)
867
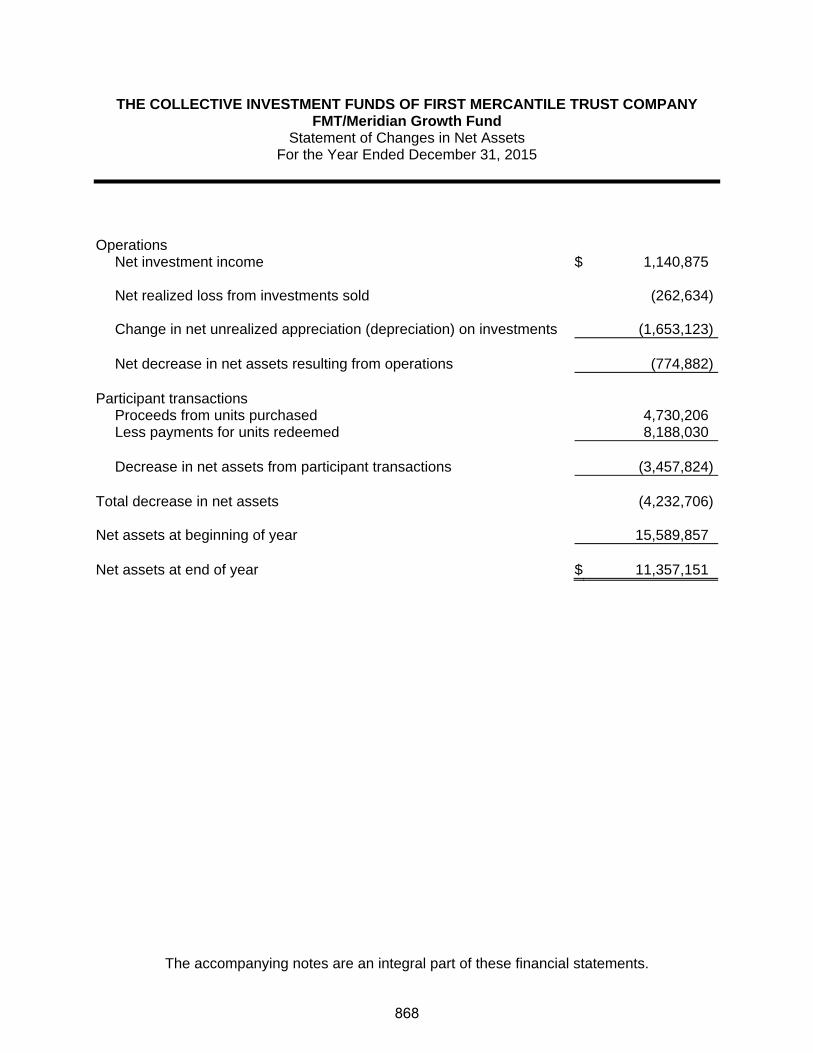
THE COLLECTIVE INVESTMENT FUNDS OF FIRST MERCANTILE TRUST COMPANY FMT/Meridian Growth Fund
Statement of Changes in Net Assets For the Year Ended December 31, 2015
The accompanying notes are an integral part of these financial statements.
Operations
Net investment income $ 1,140,875
Net realized loss from investments sold (262,634)
Change in net unrealized appreciation (depreciation) on investments (1,653,123)
Net decrease in net assets resulting from operations (774,882) Participant transactions
Proceeds from units purchased 4,730,206Less payments for units redeemed 8,188,030
Decrease in net assets from participant transactions (3,457,824)
Total decrease in net assets (4,232,706) Net assets at beginning of year 15,589,857 Net assets at end of year $ 11,357,151
868
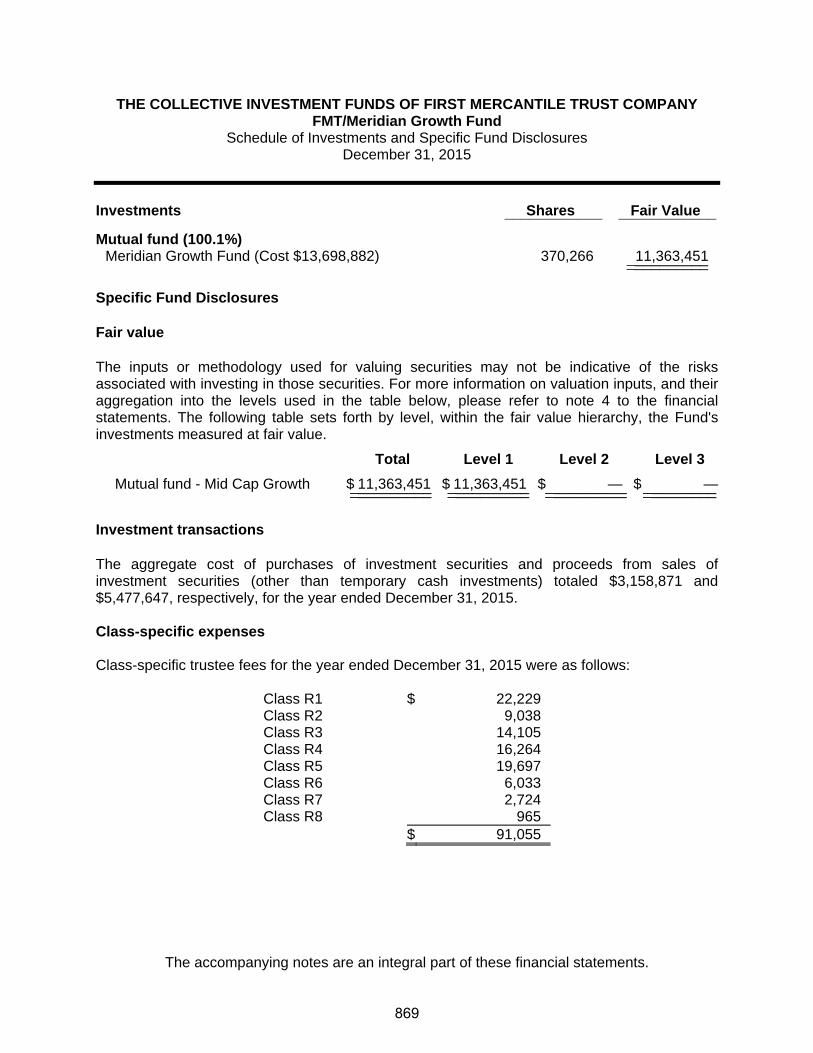
THE COLLECTIVE INVESTMENT FUNDS OF FIRST MERCANTILE TRUST COMPANY FMT/Meridian Growth Fund
Schedule of Investments and Specific Fund Disclosures December 31, 2015
The accompanying notes are an integral part of these financial statements.
Investments Shares Fair Value ____________ ____________
Mutual fund (100.1%) Meridian Growth Fund (Cost $13,698,882) 370,266 11,363,451 ____________________ Specific Fund Disclosures Fair value The inputs or methodology used for valuing securities may not be indicative of the risks associated with investing in those securities. For more information on valuation inputs, and their aggregation into the levels used in the table below, please refer to note 4 to the financial statements. The following table sets forth by level, within the fair value hierarchy, the Fund's investments measured at fair value.
Total Level 1 Level 2 Level 3
Mutual fund - Mid Cap Growth $ 11,363,451 $ 11,363,451 $ — $ —__________ __________ __________ ___________________ __________ __________ _________ Investment transactions The aggregate cost of purchases of investment securities and proceeds from sales of investment securities (other than temporary cash investments) totaled $3,158,871 and $5,477,647, respectively, for the year ended December 31, 2015. Class-specific expenses Class-specific trustee fees for the year ended December 31, 2015 were as follows: Class R1 $ 22,229 Class R2 9,038 Class R3 14,105 Class R4 16,264 Class R5 19,697 Class R6 6,033 Class R7 2,724 Class R8 965 $ 91,055
869

THE COLLECTIVE INVESTMENT FUNDS OF FIRST MERCANTILE TRUST COMPANY FMT/Meridian Growth Fund
Schedule of Participant Transactions December 31, 2015
The accompanying notes are an integral part of these financial statements.
Participant transactions by class for the year ended December 31, 2015 were as follows: Dollars Units Purchases Redemptions Net change Purchases Redemptions Net change Class R1 $ 1,026,142 $ (3,476,799) $ (2,450,657) 48,881 (163,487) (114,606)Class R2 143,361 (318,051) (174,690) 9,047 (20,742) (11,695)Class R3 895,136 (967,300) (72,164) 58,347 (65,011) (6,664)Class R4 1,844,468 (1,214,632) 629,836 120,255 (80,849) 39,406Class R5 741,904 (1,967,853) (1,225,949) 49,184 (129,138) (79,954)Class R6 43,305 (55,969) (12,664) 2,892 (3,754) (862)Class R7 13,207 (186,397) (173,190) 881 (12,279) (11,398)Class R8 22,683 (1,029) 21,654 1,507 (71) 1,436 $ 4,730,206 $ (8,188,030) $ (3,457,824) 290,994 (475,331) (184,337)
870

THE COLLECTIVE INVESTMENT FUNDS OF FIRST MERCANTILE TRUST COMPANY FMT/Meridian Growth Fund
Financial Highlights December 31, 2015
The accompanying notes are an integral part of these financial statements.
Change in Net Asset Value Resulting from Operations Ratios (to average net
assets)
NAV per Unit, Beginning of
Period
Net Investment
Income (Loss)(a)
Net Realized and Unrealized
Gain (Loss) from
Investments(a)
Total from Investment Activities
NAV per Unit, End of
Period Total
Return Expenses
Net Investment
Income (Loss)
Class R1 $ 21.3293 $ 1.7177 $ (2.9329) $ (1.2152) $ 20.1141 (5.70)% (0.39)% 8.09%Class R2 15.8301 1.3732 (2.3080) (0.9348) 14.8953 (5.91)% (0.61)% 8.74%Class R3 15.2495 1.3923 (2.3174) (0.9251) 14.3244 (6.07)% (0.78)% 9.19%Class R4 15.0729 1.2919 (2.2305) (0.9386) 14.1343 (6.23)% (0.95)% 8.65%Class R5 15.1346 0.8611 (1.8278) (0.9667) 14.1679 (6.39)% (1.12)% 5.73%Class R6 15.1926 1.3257 (2.3205) (0.9948) 14.1978 (6.55)% (1.29)% 8.83%Class R7 15.1958 0.4229 (1.4431) (1.0202) 14.1756 (6.71)% (1.46)% 2.78%Class R8 15.3503 1.5597 (2.6138) (1.0541) 14.2962 (6.87)% (1.63)% 10.31%
(a) Per unit amounts are based on average daily units outstanding.
871

FMT/Morgan Stanley Institutional Small Cap Growth Fund

THE COLLECTIVE INVESTMENT FUNDS OF FIRST MERCANTILE TRUST COMPANY FMT/Morgan Stanley Institutional Small Cap Growth Fund
Statement of Assets and Liabilities December 31, 2015
The accompanying notes are an integral part of these financial statements.
Assets Investments in securities, at fair value $ 2,097,628 Liabilities Trustee fees 919 Net assets $ 2,096,709 Components of net assets
Units of
Participation NAV
per Unit Net
Assets Class R1 60,598 $ 13.6583 $ 827,670Class R2 77,891 $ 14.4483 1,125,386Class R4 9,927 $ 9.8450 97,731Class R5 1,977 $ 14.4185 28,500Class R6 1,202 $ 14.4979 17,422
$ 2,096,709
872

THE COLLECTIVE INVESTMENT FUNDS OF FIRST MERCANTILE TRUST COMPANY FMT/Morgan Stanley Institutional Small Cap Growth Fund
Statement of Operations For the Year Ended December 31, 2015
The accompanying notes are an integral part of these financial statements.
Investment income
Dividends $ 167,425 Expenses
Trustee fees 13,022Audit fees 1,200Custody fees 936
15,158 Net investment income 152,267 Net realized gain from investments sold
Proceeds from sales of investments 966,471Cost of investments sold 930,416
Net realized gain from investments sold 36,055 Change in net unrealized appreciation (depreciation) on investments (429,925) Net realized and unrealized loss on investments (393,870) Other operating credits (charges) 4,075 Net decrease in net assets resulting from operations $ (237,528)
873

THE COLLECTIVE INVESTMENT FUNDS OF FIRST MERCANTILE TRUST COMPANY FMT/Morgan Stanley Institutional Small Cap Growth Fund
Statement of Changes in Net Assets For the Year Ended December 31, 2015
The accompanying notes are an integral part of these financial statements.
Operations
Net investment income $ 152,267
Net realized gain from investments sold 36,055
Change in net unrealized appreciation (depreciation) on investments (429,925)
Other operating credits (charges) 4,075
Net decrease in net assets resulting from operations (237,528) Participant transactions
Proceeds from units purchased 577,490Less payments for units redeemed 1,181,824
Decrease in net assets from participant transactions (604,334)
Total decrease in net assets (841,862) Net assets at beginning of year 2,938,571 Net assets at end of year $ 2,096,709
874

THE COLLECTIVE INVESTMENT FUNDS OF FIRST MERCANTILE TRUST COMPANY FMT/Morgan Stanley Institutional Small Cap Growth Fund
Schedule of Investments and Specific Fund Disclosures December 31, 2015
The accompanying notes are an integral part of these financial statements.
Investments Shares Fair Value ____________ ____________
Mutual fund (100.0%)
Morgan Stanley Institutional Small Company Growth I Fund (Cost $2,381,629) 152,555 $ 2,097,628 ____________________
Specific Fund Disclosures Fair value The inputs or methodology used for valuing securities may not be indicative of the risks associated with investing in those securities. For more information on valuation inputs, and their aggregation into the levels used in the table below, please refer to note 4 to the financial statements. The following table sets forth by level, within the fair value hierarchy, the Fund's investments measured at fair value.
Total Level 1 Level 2 Level 3
Mutual fund - Small Cap Growth $ 2,097,628 $ 2,097,628 $ — $ —__________ __________ __________ ___________________ __________ __________ _________ Investment transactions The aggregate cost of purchases of investment securities and proceeds from sales of investment securities (other than temporary cash investments) totaled $518,194 and $966,471, respectively, for the year ended December 31, 2015. Class-specific expenses Class-specific trustee fees for the year ended December 31, 2015 were as follows: Class R1 $ 4,096 Class R2 6,982 Class R3 196 Class R4 1,163 Class R5 331 Class R6 236 Class R8 18 $ 13,022
875

THE COLLECTIVE INVESTMENT FUNDS OF FIRST MERCANTILE TRUST COMPANY FMT/Morgan Stanley Institutional Small Cap Growth Fund
Schedule of Participant Transactions December 31, 2015
The accompanying notes are an integral part of these financial statements.
Participant transactions by class for the year ended December 31, 2015 were as follows: Dollars Units Purchases Redemptions Net change Purchases Redemptions Net change Class R1 $ 208,086 $ (713,818) $ (505,732) 13,916 (47,451) (33,535)Class R2 222,997 (267,544) (44,547) 13,955 (16,430) (2,475)Class R3 2,497 (76,722) (74,225) 236 (7,026) (6,790)Class R4 137,595 (83,232) 54,363 11,795 (7,821) 3,974Class R5 5,003 (3,029) 1,974 314 (191) 123Class R6 987 — 987 61 — 61Class R8 325 (37,479) (37,154) 23 (2,534) (2,511) $ 577,490 $ (1,181,824) $ (604,334) 40,300 (81,453) (41,153)
876

THE COLLECTIVE INVESTMENT FUNDS OF FIRST MERCANTILE TRUST COMPANY FMT/Morgan Stanley Institutional Small Cap Growth Fund
Financial Highlights December 31, 2015
The accompanying notes are an integral part of these financial statements.
Change in Net Asset Value Resulting from Operations Ratios (to average net
assets)
NAV per Unit, Beginning of
Period
Net Investment
Income (Loss)(a)
Net Realized and Unrealized
Gain (Loss) from
Investments(a)
Total from Investment Activities
NAV per Unit, End of
Period Total
Return Expenses
Net Investment
Income (Loss)
Class R1 $ 15.1483 $ 0.8201 $ (2.3101) $ (1.4900) $ 13.6583 (9.84)% (0.41)% 5.38%Class R2 16.0601 1.0978 (2.7096) (1.6118) 14.4483 (10.04)% (0.65)% 6.83%Class R3(b) 10.4428 (0.0235) 0.5113 0.4878 — 4.67% (0.82)% (0.52)%Class R4 10.9809 0.5829 (1.7188) (1.1359) 9.8450 (10.34)% (0.99)% 5.28%Class R5 16.1098 1.0331 (2.7244) (1.6913) 14.4185 (10.50)% (1.16)% 6.43%Class R6 16.2261 0.9974 (2.7256) (1.7282) 14.4979 (10.65)% (1.33)% 6.17%Class R8(c) 14.8455 (0.0289) 0.3178 0.2889 — 1.95% (1.67)% (1.33)%
(a) Per unit amounts are based on average daily units outstanding.
(b) For the period from January 1, 2015 through June 1, 2015.
(c) For the period from January 1, 2015 through February 23, 2015.
877
FMT/Neuberger Berman Genesis Trust Fund

THE COLLECTIVE INVESTMENT FUNDS OF FIRST MERCANTILE TRUST COMPANY FMT/Neuberger Berman Genesis Trust Fund
Statement of Assets and Liabilities December 31, 2015
The accompanying notes are an integral part of these financial statements.
Assets Investments in securities, at fair value $ 11,983,583 Liabilities Trustee fees 7,777 Net assets $ 11,975,806 Components of net assets
Units of
Participation NAV
per Unit Net
Assets Class R1 203,200 $ 21.6499 $ 4,399,257Class R2 104,073 $ 14.8900 1,549,643Class R3 37,358 $ 14.6576 547,572Class R4 83,796 $ 14.4162 1,208,019Class R5 146,326 $ 14.3184 2,095,149Class R6 122,419 $ 14.3175 1,752,723Class R7 28,243 $ 14.3045 404,004Class R8 1,434 $ 13.5557 19,439
$ 11,975,806
878

THE COLLECTIVE INVESTMENT FUNDS OF FIRST MERCANTILE TRUST COMPANY FMT/Neuberger Berman Genesis Trust Fund
Statement of Operations For the Year Ended December 31, 2015
The accompanying notes are an integral part of these financial statements.
Investment income
Dividends $ 1,218,642 Expenses
Trustee fees 101,926Custody fees 4,726Audit fees 1,200
107,852 Net investment income 1,110,790 Net realized gain from investments sold
Proceeds from sales of investments 3,551,143Cost of investments sold 2,815,153
Net realized gain from investments sold 735,990 Change in net unrealized appreciation (depreciation) on investments (1,861,946) Net realized and unrealized loss on investments (1,125,956) Other operating credits (charges) 51,856 Net increase in net assets resulting from operations $ 36,690
879

THE COLLECTIVE INVESTMENT FUNDS OF FIRST MERCANTILE TRUST COMPANY FMT/Neuberger Berman Genesis Trust Fund
Statement of Changes in Net Assets For the Year Ended December 31, 2015
The accompanying notes are an integral part of these financial statements.
Operations
Net investment income $ 1,110,790
Net realized gain from investments sold 735,990
Change in net unrealized appreciation (depreciation) on investments (1,861,946)
Other operating credits (charges) 51,856
Net increase in net assets resulting from operations 36,690 Participant transactions
Proceeds from units purchased 3,347,293Less payments for units redeemed 6,106,183
Decrease in net assets from participant transactions (2,758,890)
Total decrease in net assets (2,722,200) Net assets at beginning of year 14,698,006 Net assets at end of year $ 11,975,806
880

THE COLLECTIVE INVESTMENT FUNDS OF FIRST MERCANTILE TRUST COMPANY FMT/Neuberger Berman Genesis Trust Fund
Schedule of Investments and Specific Fund Disclosures December 31, 2015
The accompanying notes are an integral part of these financial statements.
Investments Shares Fair Value ____________ ____________
Mutual fund (100.1%)
Neuberger Berman Genesis Trust Fund (Cost $10,980,552) 234,696 $ 11,983,583 ____________________
Specific Fund Disclosures Fair value The inputs or methodology used for valuing securities may not be indicative of the risks associated with investing in those securities. For more information on valuation inputs, and their aggregation into the levels used in the table below, please refer to note 4 to the financial statements. The following table sets forth by level, within the fair value hierarchy, the Fund's investments measured at fair value.
Total Level 1 Level 2 Level 3
Mutual fund - Small Cap Core $ 11,983,583 $ 11,983,583 $ — $ —__________ __________ __________ ___________________ __________ __________ _________ Investment transactions The aggregate cost of purchases of investment securities and proceeds from sales of investment securities (other than temporary cash investments) totaled $1,953,085 and $3,551,143, respectively, for the year ended December 31, 2015. Class-specific expenses Class-specific trustee fees for the year ended December 31, 2015 were as follows: Class R1 $ 16,282 Class R2 8,119 Class R3 9,528 Class R4 10,463 Class R5 25,768 Class R6 23,526 Class R7 7,130 Class R8 1,110 $ 101,926
881
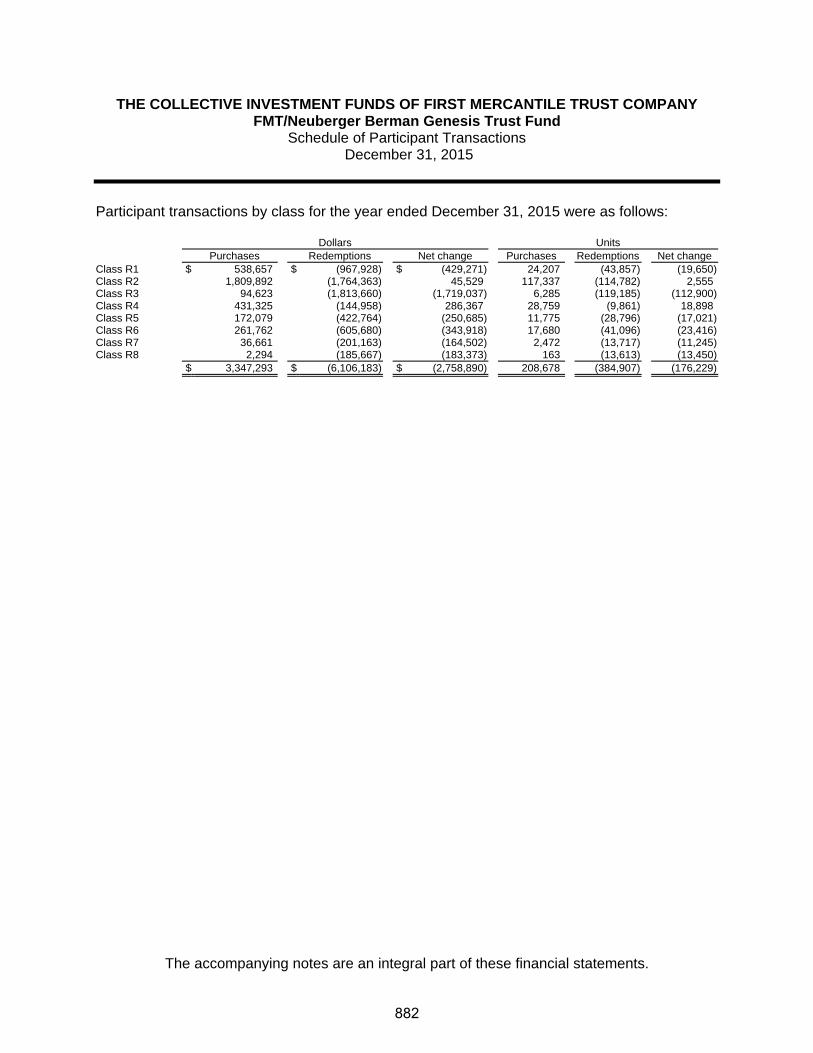
THE COLLECTIVE INVESTMENT FUNDS OF FIRST MERCANTILE TRUST COMPANY FMT/Neuberger Berman Genesis Trust Fund
Schedule of Participant Transactions December 31, 2015
The accompanying notes are an integral part of these financial statements.
Participant transactions by class for the year ended December 31, 2015 were as follows: Dollars Units Purchases Redemptions Net change Purchases Redemptions Net change Class R1 $ 538,657 $ (967,928) $ (429,271) 24,207 (43,857) (19,650)Class R2 1,809,892 (1,764,363) 45,529 117,337 (114,782) 2,555Class R3 94,623 (1,813,660) (1,719,037) 6,285 (119,185) (112,900)Class R4 431,325 (144,958) 286,367 28,759 (9,861) 18,898Class R5 172,079 (422,764) (250,685) 11,775 (28,796) (17,021)Class R6 261,762 (605,680) (343,918) 17,680 (41,096) (23,416)Class R7 36,661 (201,163) (164,502) 2,472 (13,717) (11,245)Class R8 2,294 (185,667) (183,373) 163 (13,613) (13,450) $ 3,347,293 $ (6,106,183) $ (2,758,890) 208,678 (384,907) (176,229)
882

THE COLLECTIVE INVESTMENT FUNDS OF FIRST MERCANTILE TRUST COMPANY FMT/Neuberger Berman Genesis Trust Fund
Financial Highlights December 31, 2015
The accompanying notes are an integral part of these financial statements.
Change in Net Asset Value Resulting from Operations Ratios (to average net
assets)
NAV per Unit, Beginning of
Period
Net Investment
Income (Loss)(a)
Net Realized and Unrealized
Gain (Loss) from
Investments(a)
Total from Investment Activities
NAV per Unit, End of
Period Total
Return Expenses
Net Investment
Income (Loss)
Class R1 $ 21.6031 $ 2.1355 $ (2.0887) $ 0.0468 $ 21.6499 0.22% (0.39)% 9.64%Class R2 14.8912 1.6433 (1.6445) (0.0012) 14.8900 (0.01)% (0.61)% 10.80%Class R3 14.6833 0.5887 (0.6144) (0.0257) 14.6576 (0.18)% (0.78)% 3.92%Class R4 14.4661 1.4833 (1.5332) (0.0499) 14.4162 (0.34)% (0.95)% 10.02%Class R5 14.3925 1.1985 (1.2726) (0.0741) 14.3184 (0.51)% (1.12)% 8.15%Class R6 14.4162 1.2566 (1.3553) (0.0987) 14.3175 (0.68)% (1.29)% 8.55%Class R7 14.4277 1.1114 (1.2346) (0.1232) 14.3045 (0.85)% (1.46)% 7.56%Class R8 13.6958 0.2220 (0.3621) (0.1401) 13.5557 (1.02)% (1.63)% 1.59%
(a) Per unit amounts are based on average daily units outstanding.
883

FMT/SPDR S & P 500 Index ETF
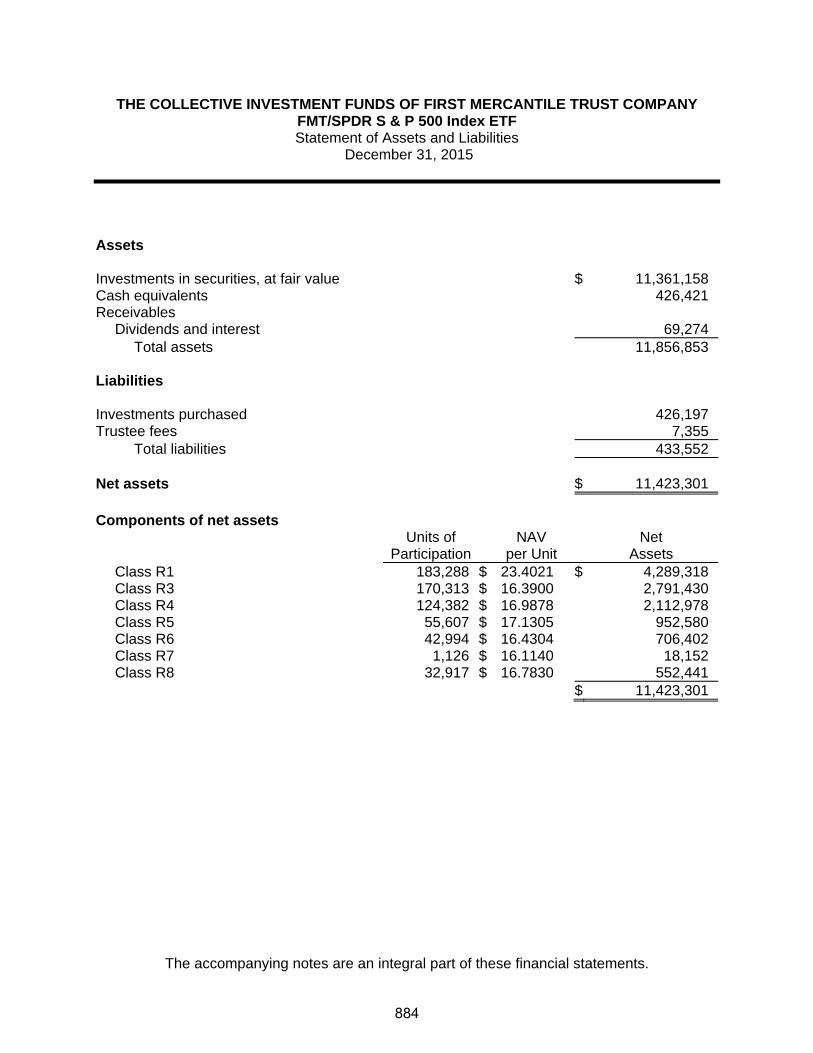
THE COLLECTIVE INVESTMENT FUNDS OF FIRST MERCANTILE TRUST COMPANY FMT/SPDR S & P 500 Index ETF Statement of Assets and Liabilities
December 31, 2015
The accompanying notes are an integral part of these financial statements.
Assets Investments in securities, at fair value $ 11,361,158 Cash equivalents 426,421Receivables
Dividends and interest 69,274Total assets 11,856,853
Liabilities Investments purchased 426,197Trustee fees 7,355
Total liabilities 433,552 Net assets $ 11,423,301 Components of net assets
Units of
Participation NAV
per Unit Net
Assets Class R1 183,288 $ 23.4021 $ 4,289,318Class R3 170,313 $ 16.3900 2,791,430Class R4 124,382 $ 16.9878 2,112,978Class R5 55,607 $ 17.1305 952,580Class R6 42,994 $ 16.4304 706,402Class R7 1,126 $ 16.1140 18,152Class R8 32,917 $ 16.7830 552,441
$ 11,423,301
884

THE COLLECTIVE INVESTMENT FUNDS OF FIRST MERCANTILE TRUST COMPANY FMT/SPDR S & P 500 Index ETF
Statement of Operations For the Year Ended December 31, 2015
The accompanying notes are an integral part of these financial statements.
Investment income
Dividends $ 265,232Interest 260
265,492 Expenses
Trustee fees 96,566Custody fees 4,960Audit fees 1,200
102,726 Net investment income 162,766 Net realized gain from investments sold
Proceeds from sales of investments 5,644,374Cost of investments sold 3,851,191
Net realized gain from investments sold 1,793,183 Change in net unrealized appreciation (depreciation) on investments (1,771,321) Net realized and unrealized gain on investments 21,862 Net increase in net assets resulting from operations $ 184,628
885

THE COLLECTIVE INVESTMENT FUNDS OF FIRST MERCANTILE TRUST COMPANY FMT/SPDR S & P 500 Index ETF
Statement of Changes in Net Assets For the Year Ended December 31, 2015
The accompanying notes are an integral part of these financial statements.
Operations
Net investment income $ 162,766
Net realized gain from investments sold 1,793,183
Change in net unrealized appreciation (depreciation) on investments (1,771,321)
Net increase in net assets resulting from operations 184,628 Participant transactions
Proceeds from units purchased 4,087,177Less payments for units redeemed 7,965,635
Decrease in net assets from participant transactions (3,878,458)
Total decrease in net assets (3,693,830) Net assets at beginning of year 15,117,131 Net assets at end of year $ 11,423,301
886

THE COLLECTIVE INVESTMENT FUNDS OF FIRST MERCANTILE TRUST COMPANY FMT/SPDR S & P 500 Index ETF
Schedule of Investments and Specific Fund Disclosures December 31, 2015
The accompanying notes are an integral part of these financial statements.
Investments Shares Fair Value ____________ ____________
Exchange-traded fund (99.5%) SPDR S&P 500 ETF (Cost $8,256,673) 55,722 $ 11,361,158 ____________________ Specific Fund Disclosures Fair value The inputs or methodology used for valuing securities may not be indicative of the risks associated with investing in those securities. For more information on valuation inputs, and their aggregation into the levels used in the table below, please refer to note 4 to the financial statements. The following table sets forth by level, within the fair value hierarchy, the Fund's investments measured at fair value.
Total Level 1 Level 2 Level 3
Exchange-traded fund - Large Cap Core $ 11,361,158 $ 11,361,158 $ — $ —__________ __________ __________ ___________________ __________ __________ _________
Investment transactions The aggregate cost of purchases of investment securities and proceeds from sales of investment securities (other than temporary cash investments) totaled $2,290,008 and $5,644,374, respectively, for the year ended December 31, 2015. Class-specific expenses Class-specific trustee fees for the year ended December 31, 2015 were as follows: Class R1 $ 20,136 Class R2 2,121 Class R3 20,727 Class R4 23,047 Class R5 9,030 Class R6 9,841 Class R7 3,079 Class R8 8,585 $ 96,566
887

THE COLLECTIVE INVESTMENT FUNDS OF FIRST MERCANTILE TRUST COMPANY FMT/SPDR S & P 500 Index ETF
Schedule of Participant Transactions December 31, 2015
The accompanying notes are an integral part of these financial statements.
Participant transactions by class for the year ended December 31, 2015 were as follows: Dollars Units Purchases Redemptions Net change Purchases Redemptions Net change Class R1 $ 1,700,125 $ (3,302,659) $ (1,602,534) 73,021 (139,210) (66,189)Class R2 29,171 (912,172) (883,001) 1,715 (52,785) (51,070)Class R3 660,085 (633,260) 26,825 40,146 (38,026) 2,120Class R4 360,182 (1,308,774) (948,592) 21,440 (76,423) (54,983)Class R5 743,390 (473,474) 269,916 43,176 (27,728) 15,448Class R6 388,448 (827,356) (438,908) 24,217 (49,414) (25,197)Class R7 41,993 (421,293) (379,300) 2,599 (25,683) (23,084)Class R8 163,783 (86,647) 77,136 9,894 (5,100) 4,794 $ 4,087,177 $ (7,965,635) $ (3,878,458) 216,208 (414,369) (198,161)
888

THE COLLECTIVE INVESTMENT FUNDS OF FIRST MERCANTILE TRUST COMPANY FMT/SPDR S & P 500 Index ETF
Financial Highlights December 31, 2015
The accompanying notes are an integral part of these financial statements.
Change in Net Asset Value Resulting from Operations Ratios (to average net
assets)
NAV per Unit, Beginning of
Period
Net Investment
Income (Loss)(a)
Net Realized and Unrealized
Gain (Loss) from
Investments(a)
Total from Investment Activities
NAV per Unit, End of
Period Total
Return Expenses
Net Investment
Income (Loss)
Class R1 $ 23.2283 $ 0.3578 $ (0.1840) $ 0.1738 $ 23.4021 0.75% (0.39)% 1.53%Class R2(b) 16.8010 0.1013 0.3376 0.4389 — 2.61% (0.37)% 0.59%Class R3 16.3321 0.1931 (0.1352) 0.0579 16.3900 0.35% (0.78)% 1.17%Class R4 16.9567 0.1626 (0.1315) 0.0311 16.9878 0.18% (0.95)% 0.95%Class R5 17.1284 0.1472 (0.1451) 0.0021 17.1305 0.01% (1.12)% 0.86%Class R6 16.4565 0.1046 (0.1307) (0.0261) 16.4304 (0.16)% (1.29)% 0.63%Class R7 16.1669 0.0224 (0.0753) (0.0529) 16.1140 (0.33)% (1.47)% 0.14%Class R8 16.8672 0.0559 (0.1401) (0.0842) 16.7830 (0.50)% (1.63)% 0.33%
(a) Per unit amounts are based on average daily units outstanding.
(b) For the period from January 1, 2015 through August 3, 2015.
889

FMT/T. Rowe Price Midcap Growth Fund

THE COLLECTIVE INVESTMENT FUNDS OF FIRST MERCANTILE TRUST COMPANY FMT/T. Rowe Price Midcap Growth Fund
Statement of Assets and Liabilities December 31, 2015
The accompanying notes are an integral part of these financial statements.
Assets Investments in securities, at fair value $ 6,772,690 Receivables
Investments sold 50,490Total assets 6,823,180
Liabilities Trustee fees 3,215 Net assets $ 6,819,965 Components of net assets
Units of
Participation NAV
per Unit Net
Assets Class R1 263,243 $ 17.7667 $ 4,676,974Class R2 31,286 $ 11.8281 370,047Class R3 13,435 $ 17.6768 237,487Class R4 46,016 $ 18.0496 830,563Class R5 15,824 $ 18.2172 288,261Class R6 7,748 $ 17.6318 136,617Class R7 2,420 $ 17.6048 42,602Class R8 13,496 $ 17.5910 237,414
$ 6,819,965
890
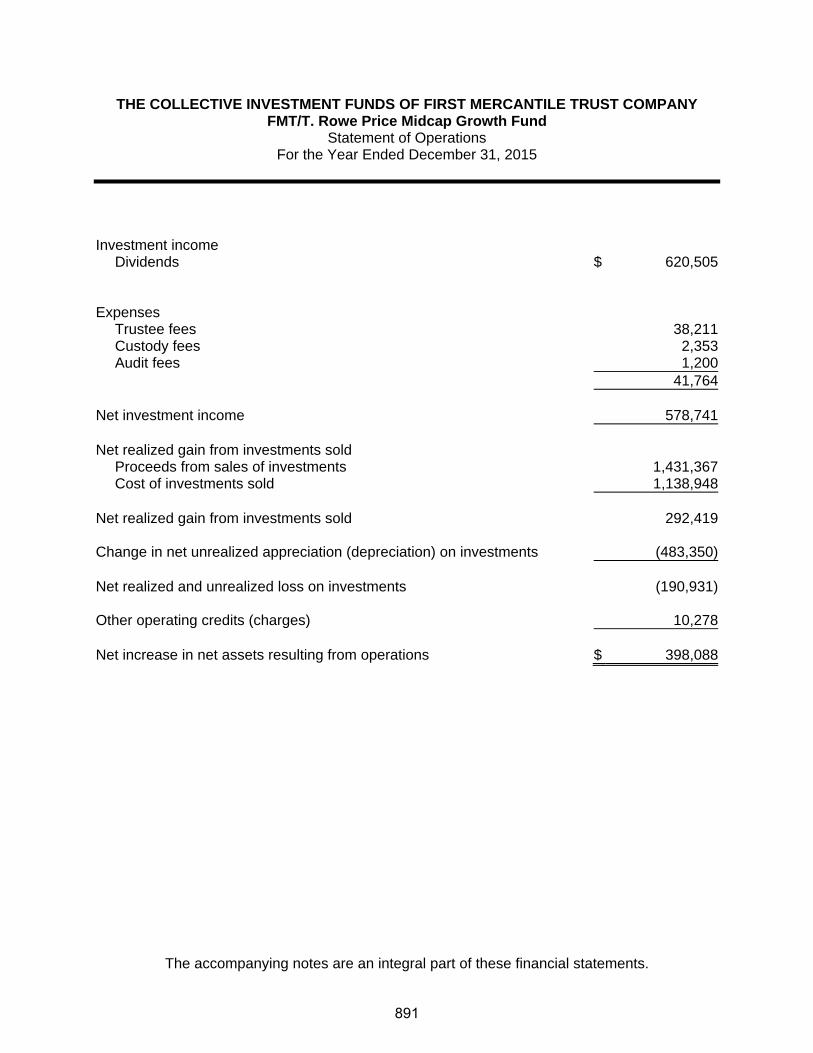
THE COLLECTIVE INVESTMENT FUNDS OF FIRST MERCANTILE TRUST COMPANY FMT/T. Rowe Price Midcap Growth Fund
Statement of Operations For the Year Ended December 31, 2015
The accompanying notes are an integral part of these financial statements.
Investment income
Dividends $ 620,505 Expenses
Trustee fees 38,211Custody fees 2,353Audit fees 1,200
41,764 Net investment income 578,741 Net realized gain from investments sold
Proceeds from sales of investments 1,431,367Cost of investments sold 1,138,948
Net realized gain from investments sold 292,419 Change in net unrealized appreciation (depreciation) on investments (483,350) Net realized and unrealized loss on investments (190,931) Other operating credits (charges) 10,278 Net increase in net assets resulting from operations $ 398,088
891

THE COLLECTIVE INVESTMENT FUNDS OF FIRST MERCANTILE TRUST COMPANY FMT/T. Rowe Price Midcap Growth Fund
Statement of Changes in Net Assets For the Year Ended December 31, 2015
The accompanying notes are an integral part of these financial statements.
Operations
Net investment income $ 578,741
Net realized gain from investments sold 292,419
Change in net unrealized appreciation (depreciation) on investments (483,350)
Other operating credits (charges) 10,278
Net increase in net assets resulting from operations 398,088 Participant transactions
Proceeds from units purchased 2,290,724Less payments for units redeemed 2,362,866
Decrease in net assets from participant transactions (72,142)
Total increase in net assets 325,946 Net assets at beginning of year 6,494,019 Net assets at end of year $ 6,819,965
892

THE COLLECTIVE INVESTMENT FUNDS OF FIRST MERCANTILE TRUST COMPANY FMT/T. Rowe Price Midcap Growth Fund
Schedule of Investments and Specific Fund Disclosures December 31, 2015
The accompanying notes are an integral part of these financial statements.
Investments Shares Fair Value ____________ ____________
Mutual fund (99.3%) T. Rowe Price Mid-Cap Growth Fund (Cost $5,871,642) 93,372 $ 6,772,690 ____________________ Specific Fund Disclosures Fair value The inputs or methodology used for valuing securities may not be indicative of the risks associated with investing in those securities. For more information on valuation inputs, and their aggregation into the levels used in the table below, please refer to note 4 to the financial statements. The following table sets forth by level, within the fair value hierarchy, the Fund's investments measured at fair value.
Total Level 1 Level 2 Level 3
Mutual fund - Mid Cap Growth $ 6,772,690 $ 6,772,690 $ — $ —__________ __________ __________ ___________________ __________ __________ _________ Investment transactions The aggregate cost of purchases of investment securities and proceeds from sales of investment securities (other than temporary cash investments) totaled $1,897,796 and $1,431,367, respectively, for the year ended December 31, 2015. Class-specific expenses Class-specific trustee fees for the year ended December 31, 2015 were as follows: Class R1 $ 16,663 Class R2 1,355 Class R3 2,429 Class R4 8,210 Class R5 3,076 Class R6 1,700 Class R7 791 Class R8 3,987 $ 38,211
893

THE COLLECTIVE INVESTMENT FUNDS OF FIRST MERCANTILE TRUST COMPANY FMT/T. Rowe Price Midcap Growth Fund
Schedule of Participant Transactions December 31, 2015
The accompanying notes are an integral part of these financial statements.
Participant transactions by class for the year ended December 31, 2015 were as follows: Dollars Units Purchases Redemptions Net change Purchases Redemptions Net change Class R1 $ 1,171,650 $ (1,155,567) $ 16,083 66,029 (64,894) 1,135Class R2 380,275 (35,502) 344,773 32,807 (3,028) 29,779Class R3 337,876 (415,126) (77,250) 19,527 (23,901) (4,374)Class R4 311,236 (310,363) 873 17,998 (17,106) 892Class R5 34,094 (294,072) (259,978) 1,860 (17,119) (15,259)Class R6 17,691 (21,776) (4,085) 997 (1,280) (283)Class R7 5,179 (35,545) (30,366) 296 (1,965) (1,669)Class R8 32,723 (94,915) (62,192) 1,862 (5,593) (3,731) $ 2,290,724 $ (2,362,866) $ (72,142) 141,376 (134,886) 6,490
894

THE COLLECTIVE INVESTMENT FUNDS OF FIRST MERCANTILE TRUST COMPANY FMT/T. Rowe Price Midcap Growth Fund
Financial Highlights December 31, 2015
The accompanying notes are an integral part of these financial statements.
Change in Net Asset Value Resulting from Operations Ratios (to average net
assets)
NAV per Unit, Beginning of
Period
Net Investment
Income (Loss)(a)
Net Realized and Unrealized
Gain (Loss) from
Investments(a)
Total from Investment Activities
NAV per Unit, End of
Period Total
Return Expenses
Net Investment
Income (Loss)
Class R1 $ 16.7149 $ 1.5615 $ (0.5097) $ 1.0518 $ 17.7667 6.29% (0.40)% 8.82%Class R2 11.1524 1.1004 (0.4247) 0.6757 11.8281 6.06% (0.62)% 9.26%Class R3 16.6954 1.5998 (0.6184) 0.9814 17.6768 5.88% (0.79)% 9.07%Class R4 17.0766 1.2581 (0.2851) 0.9730 18.0496 5.70% (0.96)% 7.09%Class R5 17.2647 1.4132 (0.4607) 0.9525 18.2172 5.52% (1.13)% 7.76%Class R6 16.7383 1.3935 (0.5000) 0.8935 17.6318 5.34% (1.30)% 7.89%Class R7 16.7412 1.0101 (0.1465) 0.8636 17.6048 5.16% (1.47)% 5.74%Class R8 16.7566 1.2335 (0.3991) 0.8344 17.5910 4.98% (1.64)% 7.00%
(a) Per unit amounts are based on average daily units outstanding.
895

FMT/T. Rowe Price Value Fund

THE COLLECTIVE INVESTMENT FUNDS OF FIRST MERCANTILE TRUST COMPANY FMT/T. Rowe Price Value Fund
Statement of Assets and Liabilities December 31, 2015
The accompanying notes are an integral part of these financial statements.
Assets Investments in securities, at fair value $ 12,552,604 Liabilities Trustee fees 5,827 Net assets $ 12,546,777 Components of net assets
Units of
Participation NAV
per Unit Net
Assets Class R1 404,023 $ 20.0083 $ 8,083,798Class R2 11,632 $ 18.1434 211,053Class R3 95,318 $ 17.1327 1,633,060Class R4 81,711 $ 18.2484 1,491,094Class R5 28,892 $ 17.9986 520,009Class R6 27,859 $ 16.9293 471,635Class R7 155 $ 15.6234 2,423Class R8 8,569 $ 15.6025 133,705
$ 12,546,777
896

THE COLLECTIVE INVESTMENT FUNDS OF FIRST MERCANTILE TRUST COMPANY FMT/T. Rowe Price Value Fund
Statement of Operations For the Year Ended December 31, 2015
The accompanying notes are an integral part of these financial statements.
Investment income
Dividends $ 1,003,383 Expenses
Trustee fees 68,876Custody fees 4,419Audit fees 1,200
74,495 Net investment income 928,888 Net realized gain from investments sold
Proceeds from sales of investments 2,562,750Cost of investments sold 2,265,054
Net realized gain from investments sold 297,696 Change in net unrealized appreciation (depreciation) on investments (1,493,211) Net realized and unrealized loss on investments (1,195,515) Other operating credits (charges) 19,296 Net decrease in net assets resulting from operations $ (247,331)
897

THE COLLECTIVE INVESTMENT FUNDS OF FIRST MERCANTILE TRUST COMPANY FMT/T. Rowe Price Value Fund
Statement of Changes in Net Assets For the Year Ended December 31, 2015
The accompanying notes are an integral part of these financial statements.
Operations
Net investment income $ 928,888
Net realized gain from investments sold 297,696
Change in net unrealized appreciation (depreciation) on investments (1,493,211)
Other operating credits (charges) 19,296
Net decrease in net assets resulting from operations (247,331) Participant transactions
Proceeds from units purchased 4,907,384Less payments for units redeemed 4,710,221
Increase in net assets from participant transactions 197,163
Total decrease in net assets (50,168) Net assets at beginning of year 12,596,945 Net assets at end of year $ 12,546,777
898

THE COLLECTIVE INVESTMENT FUNDS OF FIRST MERCANTILE TRUST COMPANY FMT/T. Rowe Price Value Fund
Schedule of Investments and Specific Fund Disclosures December 31, 2015
The accompanying notes are an integral part of these financial statements.
Investments Shares Fair Value ____________ ____________
Mutual fund (100.0%) T. Rowe Price Value Fund (Cost $12,358,032) 401,683 $ 12,552,604 ____________________ Specific Fund Disclosures Fair value The inputs or methodology used for valuing securities may not be indicative of the risks associated with investing in those securities. For more information on valuation inputs, and their aggregation into the levels used in the table below, please refer to note 4 to the financial statements. The following table sets forth by level, within the fair value hierarchy, the Fund's investments measured at fair value.
Total Level 1 Level 2 Level 3
Mutual fund – Large Cap Value $ 12,552,604 $ 12,552,604 $ — $ — __________ __________ __________ ___________________ __________ __________ _________ Investment transactions The aggregate cost of purchases of investment securities and proceeds from sales of investment securities (other than temporary cash investments) totaled $3,708,307 and $2,562,750, respectively, for the year ended December 31, 2015. Class-specific expenses Class-specific trustee fees for the year ended December 31, 2015 were as follows: Class R1 $ 30,381 Class R2 966 Class R3 8,560 Class R4 17,909 Class R5 6,861 Class R6 2,242 Class R7 6 Class R8 1,951 $ 68,876
899

THE COLLECTIVE INVESTMENT FUNDS OF FIRST MERCANTILE TRUST COMPANY FMT/T. Rowe Price Value Fund
Schedule of Participant Transactions December 31, 2015
The accompanying notes are an integral part of these financial statements.
Participant transactions by class for the year ended December 31, 2015 were as follows: Dollars Units Purchases Redemptions Net change Purchases Redemptions Net change Class R1 $ 2,062,119 $ (2,235,329) $ (173,210) 100,388 (109,539) (9,151)Class R2 59,014 (11,107) 47,907 3,316 (610) 2,706Class R3 1,003,404 (660,382) 343,022 58,162 (37,363) 20,799Class R4 1,149,680 (1,161,840) (12,160) 61,494 (62,806) (1,312)Class R5 94,011 (602,597) (508,586) 5,176 (32,386) (27,210)Class R6 433,469 (26) 433,443 26,622 (2) 26,620Class R7 2,318 (37) 2,281 146 (2) 144Class R8 103,369 (38,903) 64,466 6,356 (2,421) 3,935 $ 4,907,384 $ (4,710,221) $ 197,163 261,660 (245,129) 16,531
900

THE COLLECTIVE INVESTMENT FUNDS OF FIRST MERCANTILE TRUST COMPANY FMT/T. Rowe Price Value Fund
Financial Highlights December 31, 2015
The accompanying notes are an integral part of these financial statements.
Change in Net Asset Value Resulting from Operations Ratios (to average net
assets)
NAV per Unit, Beginning of
Period
Net Investment
Income (Loss)(a)
Net Realized and Unrealized
Gain (Loss) from
Investments(a)
Total from Investment Activities
NAV per Unit, End of
Period Total
Return Expenses
Net Investment
Income (Loss)
Class R1 $ 20.4145 $ 1.4738 $ (1.8800) $ (0.4062) $ 20.0083 (1.99)% (0.39)% 7.25%Class R2 18.5528 1.7705 (2.1799) (0.4094) 18.1434 (2.21)% (0.61)% 9.61%Class R3 17.5493 1.7163 (2.1329) (0.4166) 17.1327 (2.37)% (0.78)% 9.83%Class R4 18.7241 0.9902 (1.4659) (0.4757) 18.2484 (2.54)% (0.95)% 5.33%Class R5 18.4994 1.1239 (1.6247) (0.5008) 17.9986 (2.71)% (1.12)% 6.12%Class R6 17.4301 3.3856 (3.8864) (0.5008) 16.9293 (2.87)% (1.29)% 20.03%Class R7 16.1129 6.3333 (6.8228) (0.4895) 15.6234 (3.04)% (1.45)% 39.40%Class R8 16.1191 1.1563 (1.6729) (0.5166) 15.6025 (3.20)% (1.63)% 7.26%
(a) Per unit amounts are based on average daily units outstanding.
901
FMT/Third Avenue Value Fund

THE COLLECTIVE INVESTMENT FUNDS OF FIRST MERCANTILE TRUST COMPANY FMT/Third Avenue Value Fund
Statement of Assets and Liabilities December 31, 2015
The accompanying notes are an integral part of these financial statements.
Assets Investments in securities, at fair value $ 1,627,412 Liabilities Trustee fees 792 Net assets $ 1,626,620 Components of net assets
Units of
Participation NAV
per Unit Net
Assets Class R1 91,300 $ 12.8895 $ 1,176,801Class R3 16,117 $ 9.4950 153,031Class R4 11,091 $ 14.6765 162,773Class R5 6 $ 13.8027 86Class R6 786 $ 13.7211 10,782Class R7 6,463 $ 13.7119 88,626Class R8 2,550 $ 13.5376 34,521
$ 1,626,620
902

THE COLLECTIVE INVESTMENT FUNDS OF FIRST MERCANTILE TRUST COMPANY FMT/Third Avenue Value Fund
Statement of Operations For the Year Ended December 31, 2015
The accompanying notes are an integral part of these financial statements.
Investment income
Dividends $ 137,962 Expenses
Trustee fees 10,762Audit fees 1,200Custody fees 696
12,658 Net investment income 125,304 Net realized gain from investments sold
Proceeds from sales of investments 875,368Cost of investments sold 829,714
Net realized gain from investments sold 45,654 Change in net unrealized appreciation (depreciation) on investments (344,093) Net realized and unrealized loss on investments (298,439) Other operating credits (charges) 7,082 Net decrease in net assets resulting from operations $ (166,053)
903

THE COLLECTIVE INVESTMENT FUNDS OF FIRST MERCANTILE TRUST COMPANY FMT/Third Avenue Value Fund
Statement of Changes in Net Assets For the Year Ended December 31, 2015
The accompanying notes are an integral part of these financial statements.
Operations
Net investment income $ 125,304
Net realized gain from investments sold 45,654
Change in net unrealized appreciation (depreciation) on investments (344,093)
Other operating credits (charges) 7,082
Net decrease in net assets resulting from operations (166,053) Participant transactions
Proceeds from units purchased 830,972Less payments for units redeemed 1,354,568
Decrease in net assets from participant transactions (523,596)
Total decrease in net assets (689,649) Net assets at beginning of year 2,316,269 Net assets at end of year $ 1,626,620
904
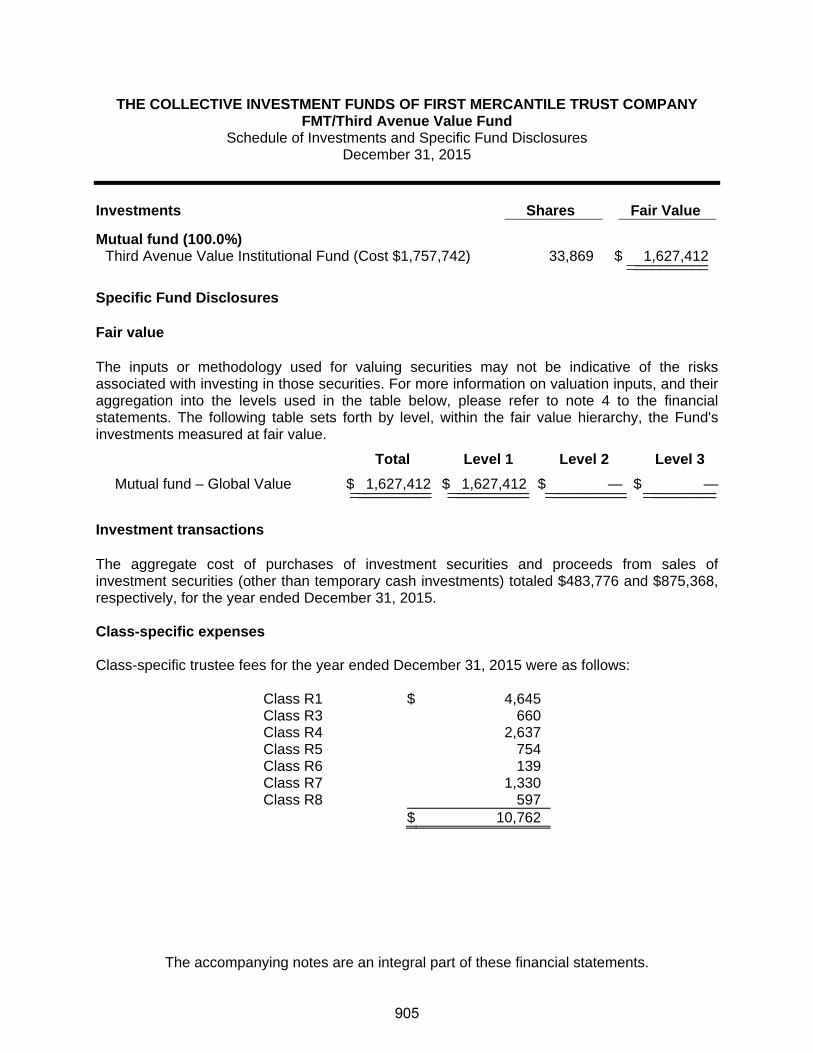
THE COLLECTIVE INVESTMENT FUNDS OF FIRST MERCANTILE TRUST COMPANY FMT/Third Avenue Value Fund
Schedule of Investments and Specific Fund Disclosures December 31, 2015
The accompanying notes are an integral part of these financial statements.
Investments Shares Fair Value ____________ ____________
Mutual fund (100.0%) Third Avenue Value Institutional Fund (Cost $1,757,742) 33,869 $ 1,627,412 ____________________ Specific Fund Disclosures Fair value The inputs or methodology used for valuing securities may not be indicative of the risks associated with investing in those securities. For more information on valuation inputs, and their aggregation into the levels used in the table below, please refer to note 4 to the financial statements. The following table sets forth by level, within the fair value hierarchy, the Fund's investments measured at fair value.
Total Level 1 Level 2 Level 3
Mutual fund – Global Value $ 1,627,412 $ 1,627,412 $ — $ —__________ __________ __________ ___________________ __________ __________ _________ Investment transactions The aggregate cost of purchases of investment securities and proceeds from sales of investment securities (other than temporary cash investments) totaled $483,776 and $875,368, respectively, for the year ended December 31, 2015. Class-specific expenses Class-specific trustee fees for the year ended December 31, 2015 were as follows: Class R1 $ 4,645 Class R3 660 Class R4 2,637 Class R5 754 Class R6 139 Class R7 1,330 Class R8 597 $ 10,762
905

THE COLLECTIVE INVESTMENT FUNDS OF FIRST MERCANTILE TRUST COMPANY FMT/Third Avenue Value Fund
Schedule of Participant Transactions December 31, 2015
The accompanying notes are an integral part of these financial statements.
Participant transactions by class for the year ended December 31, 2015 were as follows: Dollars Units Purchases Redemptions Net change Purchases Redemptions Net change Class R1 $ 96,099 $ (369,143) $ (273,044) 7,075 (26,464) (19,389)Class R3 494,676 (320,084) 174,592 49,421 (33,304) 16,117Class R4 220,217 (206,476) 13,741 13,724 (13,346) 378Class R5 7,793 (448,013) (440,220) 515 (29,446) (28,931)Class R6 1,150 (192) 958 77 (12) 65Class R7 3,864 — 3,864 261 — 261Class R8 7,173 (10,660) (3,487) 496 (713) (217) $ 830,972 $ (1,354,568) $ (523,596) 71,569 (103,285) (31,716)
906

THE COLLECTIVE INVESTMENT FUNDS OF FIRST MERCANTILE TRUST COMPANY FMT/Third Avenue Value Fund
Financial Highlights December 31, 2015
The accompanying notes are an integral part of these financial statements.
Change in Net Asset Value Resulting from Operations Ratios (to average net
assets)
NAV per Unit, Beginning of
Period
Net Investment
Income (Loss)(a)
Net Realized and Unrealized
Gain (Loss) from
Investments(a)
Total from Investment Activities
NAV per Unit, End of
Period Total
Return Expenses
Net Investment
Income (Loss)
Class R1 $ 14.0782 $ 0.9268 $ (2.1155) $ (1.1887) $ 12.8895 (8.44)% (0.45)% 6.71%Class R3(b) 10.0000 0.9283 (1.0278) (0.0995) — (1.00)% (0.53)% 17.72%Class R3(c) 10.0000 0.5015 (0.5565) (0.0550) 9.9450 (5.05)% (0.29)% 9.57%Class R4 16.1205 0.5783 (2.0223) (1.4440) 14.6765 (8.96)% (1.01)% 3.66%Class R5 15.1729 (0.1222) (1.2480) (1.3702) 13.8027 (9.03)% (1.18)% (0.81)%Class R6 15.1228 0.9747 (2.3764) (1.4017) 13.7211 (9.27)% (1.35)% 6.61%Class R7 15.1384 0.9188 (2.3453) (1.4265) 13.7119 (9.42)% (1.52)% 6.22%Class R8 14.9716 0.8916 (2.3256) (1.4340) 13.5376 (9.58)% (1.69)% 6.11%
(a) Per unit amounts are based on average daily units outstanding.
(b) For the period from February 25, 2015 (commencement of this class) through July 13,
2015.
(c) For the period from November 11, 2015 (recommencement of this class) through December 31, 2015.
907
FMT/Thornburg International Equity Fund

THE COLLECTIVE INVESTMENT FUNDS OF FIRST MERCANTILE TRUST COMPANY FMT/Thornburg International Equity Fund
Statement of Assets and Liabilities December 31, 2015
The accompanying notes are an integral part of these financial statements.
Assets Investments in securities, at fair value $ 16,188,867 Liabilities Trustee fees 9,434 Net assets $ 16,179,433 Components of net assets
Units of
Participation NAV
per Unit Net
Assets Class R1 641,578 $ 11.2755 $ 7,234,085Class R2 11,327 $ 12.5202 141,812Class R3 234,322 $ 12.4866 2,925,874Class R4 217,112 $ 12.7317 2,764,212Class R5 153,044 $ 12.3053 1,883,254Class R6 43,887 $ 12.3147 540,457Class R7 10,761 $ 12.0125 129,264Class R8 46,578 $ 12.0330 560,475
$ 16,179,433
908

THE COLLECTIVE INVESTMENT FUNDS OF FIRST MERCANTILE TRUST COMPANY FMT/Thornburg International Equity Fund
Statement of Operations For the Year Ended December 31, 2015
The accompanying notes are an integral part of these financial statements.
Expenses
Trustee fees $ 119,542Custody fees 6,066Audit fees 1,200
126,808 Net investment loss (126,808) Net realized gain from investments sold
Proceeds from sales of investments 4,043,509Cost of investments sold 3,400,256
Net realized gain from investments sold 643,253 Change in net unrealized appreciation (depreciation) on investments (585,871) Net realized and unrealized gain on investments 57,382 Net decrease in net assets resulting from operations $ (69,426)
909

THE COLLECTIVE INVESTMENT FUNDS OF FIRST MERCANTILE TRUST COMPANY FMT/Thornburg International Equity Fund
Statement of Changes in Net Assets For the Year Ended December 31, 2015
The accompanying notes are an integral part of these financial statements.
Operations
Net investment loss $ (126,808)
Net realized gain from investments sold 643,253
Change in net unrealized appreciation (depreciation) on investments (585,871)
Net decrease in net assets resulting from operations (69,426) Participant transactions
Proceeds from units purchased 3,794,618Less payments for units redeemed 5,562,081
Decrease in net assets from participant transactions (1,767,463)
Total decrease in net assets (1,836,889) Net assets at beginning of year 18,016,322 Net assets at end of year $ 16,179,433
910

THE COLLECTIVE INVESTMENT FUNDS OF FIRST MERCANTILE TRUST COMPANY FMT/Thornburg International Equity Fund
Schedule of Investments and Specific Fund Disclosures December 31, 2015
The accompanying notes are an integral part of these financial statements.
Investments Shares Fair Value ____________ ____________
Collective trust fund (100.1%) Thornburg International Equity Fund (Cost $14,380,494) 1,318,312 $ 16,188,867 ____________________ Specific Fund Disclosures Fair value The inputs or methodology used for valuing securities may not be indicative of the risks associated with investing in those securities. For more information on valuation inputs, and their aggregation into the levels used in the table below, please refer to note 4 to the financial statements. The following table sets forth by level, within the fair value hierarchy, the Fund's investments measured at fair value. The estimated fair value of the underlying collective trust fund is net asset value. The use of net asset value as fair value is deemed appropriate as the collective trust fund does not have a finite life, no unfunded commitments relating to this type of investment, or no significant restrictions on redemptions.
Total Level 1 Level 2 Level 3
Collective trust fund – International Core - Equity $ 16,188,867 $ — $ 16,188,867 $ —__________ __________ __________ ___________________ __________ __________ _________
Investment transactions The aggregate cost of purchases of investment securities and proceeds from sales of investment securities (other than temporary cash investments) totaled $2,147,992 and $4,043,509, respectively, for the year ended December 31, 2015. Class-specific trustee fees for the year ended December 31, 2015 were as follows: Class R1 $ 25,974 Class R2 797 Class R3 25,866 Class R4 28,500 Class R5 19,679 Class R6 6,127 Class R7 3,303 Class R8 9,296 $ 119,542
911

THE COLLECTIVE INVESTMENT FUNDS OF FIRST MERCANTILE TRUST COMPANY FMT/Thornburg International Equity Fund
Schedule of Participant Transactions December 31, 2015
The accompanying notes are an integral part of these financial statements.
Participant transactions by class for the year ended December 31, 2015 were as follows: Dollars Units Purchases Redemptions Net change Purchases Redemptions Net change Class R1 $ 1,601,157 $ (2,305,064) $ (703,907) 135,276 (195,943) (60,667)Class R2 347,148 (257,868) 89,280 27,214 (20,427) 6,787Class R3 620,701 (1,367,601) (746,900) 46,987 (102,386) (55,399)Class R4 366,165 (730,230) (364,065) 27,223 (55,827) (28,604)Class R5 511,101 (327,183) 183,918 39,869 (24,577) 15,292Class R6 154,116 (102,771) 51,345 12,434 (8,027) 4,407Class R7 39,638 (127,231) (87,593) 3,109 (10,395) (7,286)Class R8 154,592 (344,133) (189,541) 12,120 (27,997) (15,877) $ 3,794,618 $ (5,562,081) $ (1,767,463) 304,232 (445,579) (141,347)
912

THE COLLECTIVE INVESTMENT FUNDS OF FIRST MERCANTILE TRUST COMPANY FMT/Thornburg International Equity Fund
Financial Highlights December 31, 2015
The accompanying notes are an integral part of these financial statements.
Change in Net Asset Value Resulting from Operations Ratios (to average net
assets)
NAV per Unit, Beginning of
Period
Net Investment
Income (Loss)(a)
Net Realized and Unrealized
Gain (Loss) from
Investments(a)
Total from Investment Activities
NAV per Unit, End of
Period Total
Return Expenses
Net Investment
Income (Loss)
Class R1 $ 11.3291 $ (0.0463) $ (0.0073) $ (0.0536) $ 11.2755 (0.47)% (0.39)% (0.39)%Class R2 12.6074 (0.0792) (0.0080) (0.0872) 12.5202 (0.69)% (0.61)% (0.61)%Class R3 12.5951 (0.1028) (0.0057) (0.1085) 12.4866 (0.86)% (0.78)% (0.78)%Class R4 12.8643 (0.1276) (0.0050) (0.1326) 12.7317 (1.03)% (0.95)% (0.95)%Class R5 12.4546 (0.1452) (0.0041) (0.1493) 12.3053 (1.20)% (1.12)% (1.12)%Class R6 12.4854 (0.1671) (0.0036) (0.1707) 12.3147 (1.37)% (1.29)% (1.29)%Class R7 12.1998 (0.1855) (0.0018) (0.1873) 12.0125 (1.54)% (1.46)% (1.46)%Class R8 12.2414 (0.2068) (0.0016) (0.2084) 12.0330 (1.70)% (1.63)% (1.63)%
(a) Per unit amounts are based on average daily units outstanding.
913

FMT/Vanguard 500 Index Fund

THE COLLECTIVE INVESTMENT FUNDS OF FIRST MERCANTILE TRUST COMPANY FMT/Vanguard 500 Index Fund
Statement of Assets and Liabilities December 31, 2015
The accompanying notes are an integral part of these financial statements.
Assets Investments in securities, at fair value $ 124,032,489 Liabilities Trustee fees 63,404 Net assets $ 123,969,085 Components of net assets
Units of
Participation NAV
per Unit Net
Assets Class R1 2,599,540 $ 19.6617 $ 51,111,412Class R2 960,331 $ 17.8030 17,096,822Class R3 937,383 $ 17.1455 16,071,899Class R4 670,385 $ 17.0468 11,427,894Class R5 499,223 $ 17.8520 8,912,130Class R6 431,732 $ 17.7289 7,654,112Class R7 121,396 $ 17.2582 2,095,083Class R8 100,817 $ 16.3125 1,644,577Class LifeStyle 7,955,156
$ 123,969,085
914

THE COLLECTIVE INVESTMENT FUNDS OF FIRST MERCANTILE TRUST COMPANY FMT/Vanguard 500 Index Fund
Statement of Operations For the Year Ended December 31, 2015
The accompanying notes are an integral part of these financial statements.
Investment income
Dividends $ 2,667,567 Expenses
Trustee fees 818,340Custody fees 45,589Audit fees 2,807
866,736 Net investment income 1,800,831 Net realized gain from investments sold
Proceeds from sales of investments 28,442,352Cost of investments sold 20,775,527
Net realized gain from investments sold 7,666,825 Change in net unrealized appreciation (depreciation) on investments (8,519,993) Net realized and unrealized loss on investments (853,168) Other operating credits (charges) 318 Net increase in net assets resulting from operations $ 947,981
915

THE COLLECTIVE INVESTMENT FUNDS OF FIRST MERCANTILE TRUST COMPANY FMT/Vanguard 500 Index Fund
Statement of Changes in Net Assets For the Year Ended December 31, 2015
The accompanying notes are an integral part of these financial statements.
Operations
Net investment income $ 1,800,831
Net realized gain from investments sold 7,666,825
Change in net unrealized appreciation (depreciation) on investments (8,519,993)
Other operating credits (charges) 318
Net increase in net assets resulting from operations 947,981 Participant transactions
Proceeds from units purchased 44,908,279Less payments for units redeemed 57,069,450
Decrease in net assets from participant transactions (12,161,171)
Total decrease in net assets (11,213,190) Net assets at beginning of year 135,182,275 Net assets at end of year $ 123,969,085
916

THE COLLECTIVE INVESTMENT FUNDS OF FIRST MERCANTILE TRUST COMPANY FMT/Vanguard 500 Index Fund
Schedule of Investments and Specific Fund Disclosures December 31, 2015
The accompanying notes are an integral part of these financial statements.
Investments Shares Fair Value ____________ ____________
Mutual fund (100.1%)
Vanguard 500 Index Fund Admiral Shares (Cost $93,901,524) 658,067 $ 124,032,489 ____________________
Specific Fund Disclosures Fair value The inputs or methodology used for valuing securities may not be indicative of the risks associated with investing in those securities. For more information on valuation inputs, and their aggregation into the levels used in the table below, please refer to note 4 to the financial statements. The following table sets forth by level, within the fair value hierarchy, the Fund's investments measured at fair value.
Total Level 1 Level 2 Level 3
Mutual fund – Large Cap Core $124,032,489 $124,032,489 $ — $ — __________ __________ __________ ___________________ __________ __________ _________ Investment transactions The aggregate cost of purchases of investment securities and proceeds from sales of investment securities (other than temporary cash investments) totaled $18,069,503 and $28,442,352, respectively, for the year ended December 31, 2015. Class-specific expenses Class-specific trustee fees for the year ended December 31, 2015 were as follows: Class R1 $ 184,956 Class R2 98,648 Class R3 119,006 Class R4 111,681 Class R5 100,003 Class R6 94,821 Class R7 35,542 Class R8 24,774 Class LifeStyle 48,909 $ 818,340
917

THE COLLECTIVE INVESTMENT FUNDS OF FIRST MERCANTILE TRUST COMPANY FMT/Vanguard 500 Index Fund
Schedule of Participant Transactions December 31, 2015
The accompanying notes are an integral part of these financial statements.
Participant transactions by class for the year ended December 31, 2015 were as follows: Dollars Units Purchases Redemptions Net change Purchases Redemptions Net change Class R1 $ 16,295,545 $ (22,505,831) $ (6,210,286) 828,583 (1,145,617) (317,034)Class R2 6,928,796 (6,427,081) 501,715 390,836 (360,139) 30,697Class R3 7,568,262 (9,169,399) (1,601,137) 440,096 (529,450) (89,354)Class R4 6,447,423 (5,608,633) 838,790 378,209 (325,465) 52,744Class R5 2,598,450 (4,404,632) (1,806,182) 145,463 (246,054) (100,591)Class R6 1,390,843 (1,408,181) (17,338) 78,929 (79,882) (953)Class R7 577,594 (1,064,056) (486,462) 33,237 (62,452) (29,215)Class R8 700,628 (1,613,383) (912,755) 43,009 (97,829) (54,820)Class LifeStyle 2,400,738 (4,868,254) (2,467,516) — — — $ 44,908,279 $ (57,069,450) $ (12,161,171) 2,338,362 (2,846,888) (508,526)
918

THE COLLECTIVE INVESTMENT FUNDS OF FIRST MERCANTILE TRUST COMPANY FMT/Vanguard 500 Index Fund
Financial Highlights December 31, 2015
The accompanying notes are an integral part of these financial statements.
Change in Net Asset Value Resulting from Operations Ratios (to average net
assets)
NAV per Unit, Beginning of
Period
Net Investment
Income (Loss)(a)
Net Realized and Unrealized
Gain (Loss) from
Investments(a)
Total from Investment Activities
NAV per Unit, End of
Period Total
Return Expenses
Net Investment
Income (Loss)
Class R1 $ 19.4733 $ 0.3309 $ (0.1425) $ 0.1884 $ 19.6617 0.97% (0.39)% 1.68%Class R2 17.6714 0.2601 (0.1285) 0.1316 17.8030 0.74% (0.61)% 1.46%Class R3 17.0478 0.2237 (0.1260) 0.0977 17.1455 0.57% (0.78)% 1.30%Class R4 16.9786 0.1908 (0.1226) 0.0682 17.0468 0.40% (0.95)% 1.12%Class R5 17.8110 0.1704 (0.1294) 0.0410 17.8520 0.23% (1.12)% 0.95%Class R6 17.7184 0.1426 (0.1321) 0.0105 17.7289 0.06% (1.29)% 0.80%Class R7 17.2774 0.0988 (0.1180) (0.0192) 17.2582 (0.11)% (1.46)% 0.57%Class R8 16.3586 0.0761 (0.1222) (0.0461) 16.3125 (0.28)% (1.63)% 0.46%
(a) Per unit amounts are based on average daily units outstanding.
919

FMT/Vanguard Emerging Markets ETF

THE COLLECTIVE INVESTMENT FUNDS OF FIRST MERCANTILE TRUST COMPANY FMT/Vanguard Emerging Markets ETF
Statement of Assets and Liabilities December 31, 2015
The accompanying notes are an integral part of these financial statements.
Assets Investments in securities, at fair value $ 11,137,297 Cash equivalents 395,275Receivables
Interest 50Total assets 11,532,622
Liabilities Investments purchased 342,799Trustee fees 4,526
Total liabilities 347,325 Net assets $ 11,185,297 Components of net assets
Units of
Participation NAV
per Unit Net
Assets Class R1 660,007 $ 10.7269 $ 7,079,856Class R2 63,087 $ 9.2790 585,381Class R3 75,756 $ 9.0178 683,155Class R4 111,066 $ 9.3747 1,041,211Class R5 60,711 $ 9.3623 568,392Class R6 20,732 $ 8.3784 173,700Class R7 13,393 $ 9.0582 121,315Class R8 7,504 $ 8.9966 67,507Class LifeStyle 864,780
$ 11,185,297
920

THE COLLECTIVE INVESTMENT FUNDS OF FIRST MERCANTILE TRUST COMPANY FMT/Vanguard Emerging Markets ETF
Statement of Operations For the Year Ended December 31, 2015
The accompanying notes are an integral part of these financial statements.
Investment income
Dividends $ 320,329Interest 191
320,520 Expenses
Trustee fees 63,714Custody fees 4,705Audit fees 1,429
69,848 Net investment income 250,672 Net realized loss from investments sold
Proceeds from sales of investments 1,658,703Cost of investments sold 1,659,368
Net realized loss from investments sold (665) Change in net unrealized appreciation (depreciation) on investments (2,232,504) Net realized and unrealized loss on investments (2,233,169) Other operating credits (charges) 57 Net decrease in net assets resulting from operations $ (1,982,440)
921

THE COLLECTIVE INVESTMENT FUNDS OF FIRST MERCANTILE TRUST COMPANY FMT/Vanguard Emerging Markets ETF
Statement of Changes in Net Assets For the Year Ended December 31, 2015
The accompanying notes are an integral part of these financial statements.
Operations
Net investment income $ 250,672
Net realized loss from investments sold (665)
Change in net unrealized appreciation (depreciation) on investments (2,232,504)
Other operating credits (charges) 57
Net decrease in net assets resulting from operations (1,982,440) Participant transactions
Proceeds from units purchased 6,518,496Less payments for units redeemed 5,519,107
Increase in net assets from participant transactions 999,389
Total decrease in net assets (983,051) Net assets at beginning of year 12,168,348 Net assets at end of year $ 11,185,297
922
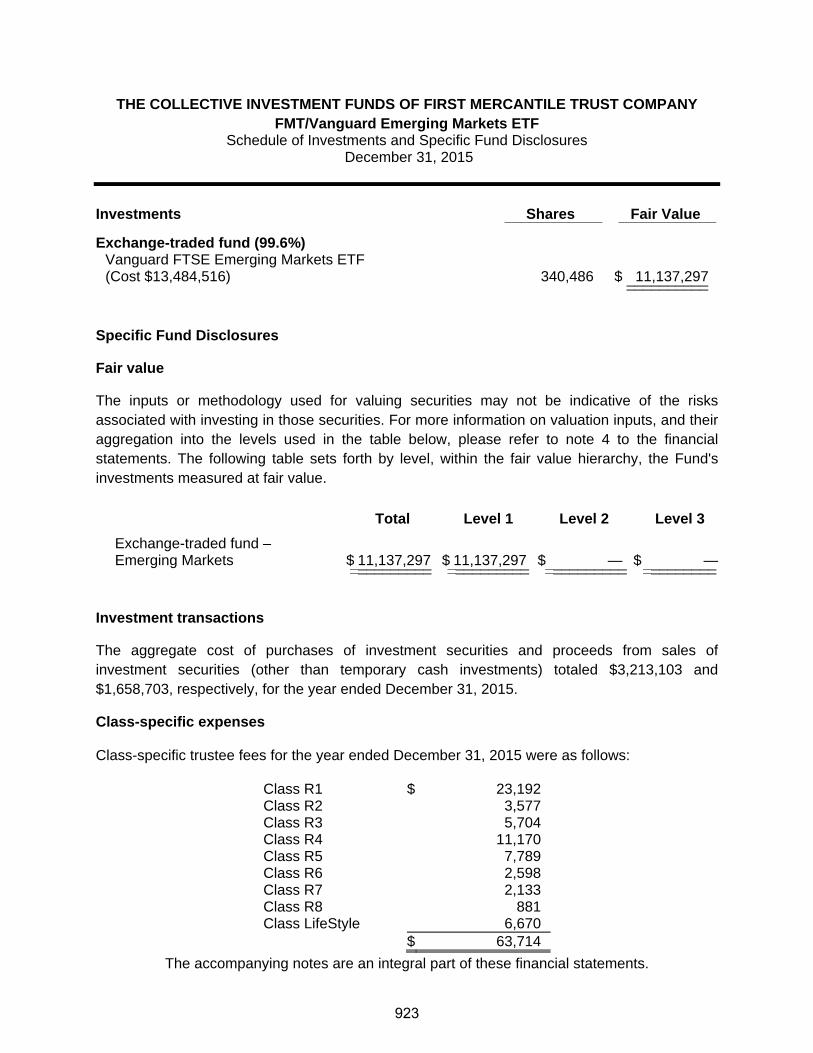
THE COLLECTIVE INVESTMENT FUNDS OF FIRST MERCANTILE TRUST COMPANY FMT/Vanguard Emerging Markets ETF
Schedule of Investments and Specific Fund Disclosures December 31, 2015
The accompanying notes are an integral part of these financial statements.
Investments Shares Fair Value ____________ ____________
Exchange-traded fund (99.6%)
Vanguard FTSE Emerging Markets ETF (Cost $13,484,516) 340,486 $ 11,137,297 ____________________
Specific Fund Disclosures
Fair value
The inputs or methodology used for valuing securities may not be indicative of the risks associated with investing in those securities. For more information on valuation inputs, and their aggregation into the levels used in the table below, please refer to note 4 to the financial statements. The following table sets forth by level, within the fair value hierarchy, the Fund's investments measured at fair value.
Total Level 1 Level 2 Level 3
Exchange-traded fund – Emerging Markets $ 11,137,297 $ 11,137,297 $ — $ —__________ __________ __________ ___________________ __________ __________ _________
Investment transactions
The aggregate cost of purchases of investment securities and proceeds from sales of investment securities (other than temporary cash investments) totaled $3,213,103 and $1,658,703, respectively, for the year ended December 31, 2015.
Class-specific expenses Class-specific trustee fees for the year ended December 31, 2015 were as follows: Class R1 $ 23,192 Class R2 3,577 Class R3 5,704 Class R4 11,170 Class R5 7,789 Class R6 2,598 Class R7 2,133 Class R8 881 Class LifeStyle 6,670 $ 63,714
923

THE COLLECTIVE INVESTMENT FUNDS OF FIRST MERCANTILE TRUST COMPANY FMT/Vanguard Emerging Markets ETF
Schedule of Participant Transactions December 31, 2015
The accompanying notes are an integral part of these financial statements.
Participant transactions by class for the year ended December 31, 2015 were as follows: Dollars Units Purchases Redemptions Net change Purchases Redemptions Net change Class R1 $ 3,495,085 $ (1,811,090) $ 1,683,995 288,616 (141,526) 147,090Class R2 1,368,792 (1,229,023) 139,769 125,282 (112,803) 12,479Class R3 432,280 (560,280) (128,000) 41,732 (52,412) (10,680)Class R4 509,165 (469,624) 39,541 44,566 (42,264) 2,302Class R5 253,707 (280,122) (26,415) 22,578 (26,702) (4,124)Class R6 51,928 (125,268) (73,340) 5,569 (11,954) (6,385)Class R7 25,520 (29,389) (3,869) 2,431 (2,939) (508)Class R8 44,316 (14,017) 30,299 4,242 (1,300) 2,942Class LifeStyle 337,703 (1,000,294) (662,591) — — — $ 6,518,496 $ (5,519,107) $ 999,389 535,016 (391,900) 143,116
924
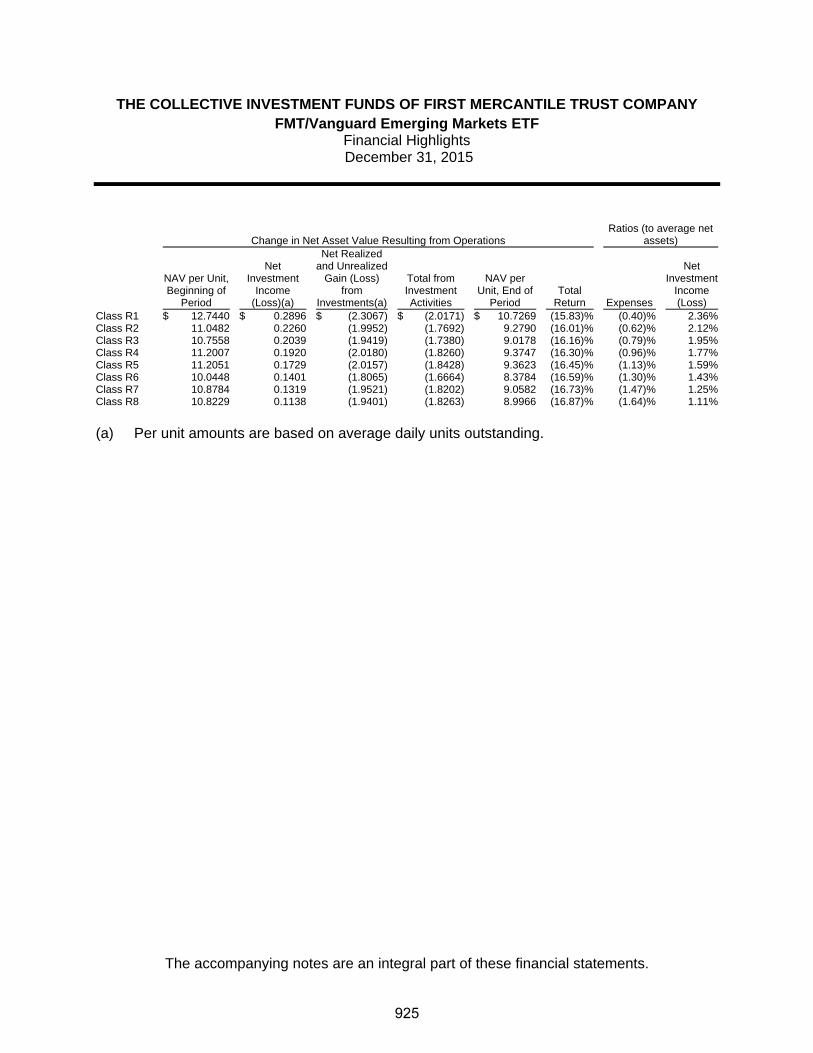
THE COLLECTIVE INVESTMENT FUNDS OF FIRST MERCANTILE TRUST COMPANY FMT/Vanguard Emerging Markets ETF
Financial Highlights December 31, 2015
The accompanying notes are an integral part of these financial statements.
Change in Net Asset Value Resulting from Operations Ratios (to average net
assets)
NAV per Unit, Beginning of
Period
Net Investment
Income (Loss)(a)
Net Realized and Unrealized
Gain (Loss) from
Investments(a)
Total from Investment Activities
NAV per Unit, End of
Period Total
Return Expenses
Net Investment
Income (Loss)
Class R1 $ 12.7440 $ 0.2896 $ (2.3067) $ (2.0171) $ 10.7269 (15.83)% (0.40)% 2.36%Class R2 11.0482 0.2260 (1.9952) (1.7692) 9.2790 (16.01)% (0.62)% 2.12%Class R3 10.7558 0.2039 (1.9419) (1.7380) 9.0178 (16.16)% (0.79)% 1.95%Class R4 11.2007 0.1920 (2.0180) (1.8260) 9.3747 (16.30)% (0.96)% 1.77%Class R5 11.2051 0.1729 (2.0157) (1.8428) 9.3623 (16.45)% (1.13)% 1.59%Class R6 10.0448 0.1401 (1.8065) (1.6664) 8.3784 (16.59)% (1.30)% 1.43%Class R7 10.8784 0.1319 (1.9521) (1.8202) 9.0582 (16.73)% (1.47)% 1.25%Class R8 10.8229 0.1138 (1.9401) (1.8263) 8.9966 (16.87)% (1.64)% 1.11%
(a) Per unit amounts are based on average daily units outstanding.
925

FMT/Vanguard Growth Index Fund
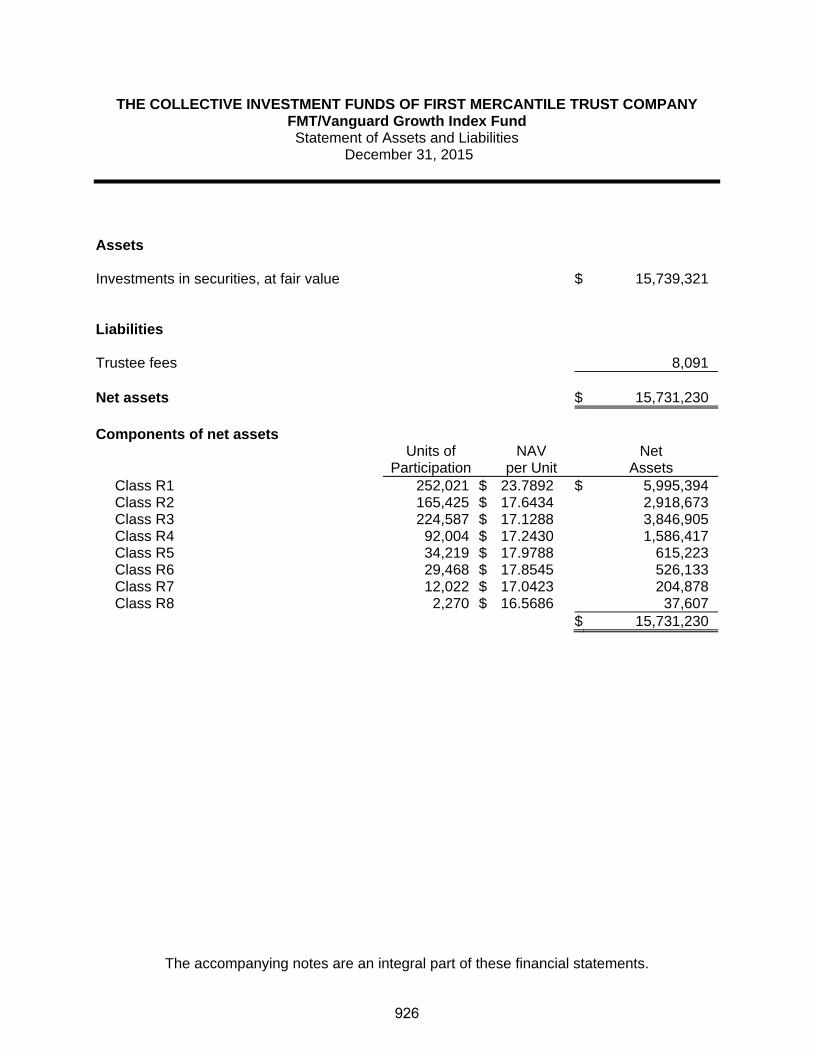
THE COLLECTIVE INVESTMENT FUNDS OF FIRST MERCANTILE TRUST COMPANY FMT/Vanguard Growth Index Fund Statement of Assets and Liabilities
December 31, 2015
The accompanying notes are an integral part of these financial statements.
Assets Investments in securities, at fair value $ 15,739,321 Liabilities Trustee fees 8,091 Net assets $ 15,731,230 Components of net assets
Units of
Participation NAV
per Unit Net
Assets Class R1 252,021 $ 23.7892 $ 5,995,394Class R2 165,425 $ 17.6434 2,918,673Class R3 224,587 $ 17.1288 3,846,905Class R4 92,004 $ 17.2430 1,586,417Class R5 34,219 $ 17.9788 615,223Class R6 29,468 $ 17.8545 526,133Class R7 12,022 $ 17.0423 204,878Class R8 2,270 $ 16.5686 37,607
$ 15,731,230
926

THE COLLECTIVE INVESTMENT FUNDS OF FIRST MERCANTILE TRUST COMPANY FMT/Vanguard Growth Index Fund
Statement of Operations For the Year Ended December 31, 2015
The accompanying notes are an integral part of these financial statements.
Investment income
Dividends $ 211,217 Expenses
Trustee fees 99,612Custody fees 5,888Audit fees 1,200
106,700 Net investment income 104,517 Net realized gain from investments sold
Proceeds from sales of investments 6,289,386Cost of investments sold 4,391,191
Net realized gain from investments sold 1,898,195 Change in net unrealized appreciation (depreciation) on investments (1,529,144) Net realized and unrealized gain on investments 369,051 Net increase in net assets resulting from operations $ 473,568
927

THE COLLECTIVE INVESTMENT FUNDS OF FIRST MERCANTILE TRUST COMPANY FMT/Vanguard Growth Index Fund Statement of Changes in Net Assets
For the Year Ended December 31, 2015
The accompanying notes are an integral part of these financial statements.
Operations
Net investment income $ 104,517
Net realized gain from investments sold 1,898,195
Change in net unrealized appreciation (depreciation) on investments (1,529,144)
Net increase in net assets resulting from operations 473,568 Participant transactions
Proceeds from units purchased 6,259,444Less payments for units redeemed 8,754,820
Decrease in net assets from participant transactions (2,495,376)
Total decrease in net assets (2,021,808) Net assets at beginning of year 17,753,038 Net assets at end of year $ 15,731,230
928

THE COLLECTIVE INVESTMENT FUNDS OF FIRST MERCANTILE TRUST COMPANY FMT/Vanguard Growth Index Fund
Schedule of Investments and Specific Fund Disclosures December 31, 2015
The accompanying notes are an integral part of these financial statements.
Investments Shares Fair Value ____________ ____________
Mutual fund (100.1%)
Vanguard Growth Index Fund Admiral Shares (Cost $11,732,885) 287,371 $ 15,739,321 ____________________
Specific Fund Disclosures Fair value The inputs or methodology used for valuing securities may not be indicative of the risks associated with investing in those securities. For more information on valuation inputs, and their aggregation into the levels used in the table below, please refer to note 4 to the financial statements. The following table sets forth by level, within the fair value hierarchy, the Fund's investments measured at fair value.
Total Level 1 Level 2 Level 3
Mutual fund – Large Cap Growth $ 15,739,321 $ 15,739,321 $ — $ —__________ __________ __________ ___________________ __________ __________ _________ Investment transactions The aggregate cost of purchases of investment securities and proceeds from sales of investment securities (other than temporary cash investments) totaled $3,897,353 and $6,289,386, respectively, for the year ended December 31, 2015. Class-specific expenses Class-specific trustee fees for the year ended December 31, 2015 were as follows: Class R1 $ 25,346 Class R2 13,316 Class R3 27,846 Class R4 14,332 Class R5 8,146 Class R6 7,811 Class R7 1,476 Class R8 1,339 $ 99,612
929

THE COLLECTIVE INVESTMENT FUNDS OF FIRST MERCANTILE TRUST COMPANY FMT/Vanguard Growth Index Fund Schedule of Participant Transactions
December 31, 2015
The accompanying notes are an integral part of these financial statements.
Participant transactions by class for the year ended December 31, 2015 were as follows: Dollars Units Purchases Redemptions Net change Purchases Redemptions Net change Class R1 $ 1,455,754 $ (4,412,502) $ (2,956,748) 61,228 (186,306) (125,078)Class R2 1,296,599 (416,482) 880,117 72,951 (23,303) 49,648Class R3 1,756,345 (1,636,843) 119,502 101,763 (94,041) 7,722Class R4 1,063,215 (1,303,764) (240,549) 61,448 (75,258) (13,810)Class R5 300,368 (442,764) (142,396) 16,523 (24,210) (7,687)Class R6 168,738 (346,259) (177,521) 9,465 (19,440) (9,975)Class R7 124,868 (5,325) 119,543 7,174 (313) 6,861Class R8 93,557 (190,881) (97,324) 5,840 (11,273) (5,433) $ 6,259,444 $ (8,754,820) $ (2,495,376) 336,392 (434,144) (97,752)
930

THE COLLECTIVE INVESTMENT FUNDS OF FIRST MERCANTILE TRUST COMPANY FMT/Vanguard Growth Index Fund
Financial Highlights December 31, 2015
The accompanying notes are an integral part of these financial statements.
Change in Net Asset Value Resulting from Operations Ratios (to average net
assets)
NAV per Unit, Beginning of
Period
Net Investment
Income (Loss)(a)
Net Realized and Unrealized
Gain (Loss) from
Investments(a)
Total from Investment Activities
NAV per Unit, End of
Period Total
Return Expenses
Net Investment
Income (Loss)
Class R1 $ 23.1163 $ 0.2070 $ 0.4659 $ 0.6729 $ 23.7892 2.91% (0.39)% 0.87%Class R2 17.1822 0.1220 0.3392 0.4612 17.6434 2.68% (0.61)% 0.69%Class R3 16.7095 0.0896 0.3297 0.4193 17.1288 2.51% (0.78)% 0.52%Class R4 16.8496 0.0600 0.3334 0.3934 17.2430 2.33% (0.95)% 0.35%Class R5 17.5986 0.0244 0.3558 0.3802 17.9788 2.16% (1.12)% 0.13%Class R6 17.5069 (0.0050) 0.3526 0.3476 17.8545 1.99% (1.29)% (0.03)%Class R7 16.7389 0.0170 0.2864 0.3034 17.0423 1.81% (1.46)% 0.10%Class R8 16.3017 (0.0826) 0.3495 0.2669 16.5686 1.64% (1.63)% (0.50)%
(a) Per unit amounts are based on average daily units outstanding.
931

FMT/Vanguard Mid Cap Index Fund

THE COLLECTIVE INVESTMENT FUNDS OF FIRST MERCANTILE TRUST COMPANY FMT/Vanguard Mid Cap Index Fund
Statement of Assets and Liabilities December 31, 2015
The accompanying notes are an integral part of these financial statements.
Assets Investments in securities, at fair value $ 25,713,914 Receivables
Investments sold 27,730Total assets 25,741,644
Liabilities Trustee fees 13,670 Net assets $ 25,727,974 Components of net assets
Units of
Participation NAV
per Unit Net
Assets Class R1 544,552 $ 18.1823 $ 9,901,191Class R2 207,947 $ 17.0155 3,538,330Class R3 291,332 $ 16.8628 4,912,669Class R4 123,155 $ 17.6309 2,171,340Class R5 127,764 $ 17.5756 2,245,525Class R6 75,816 $ 16.5530 1,254,986Class R7 26,048 $ 16.4047 427,308Class R8 21,335 $ 16.4157 350,236Class LifeStyle 926,389
$ 25,727,974
932
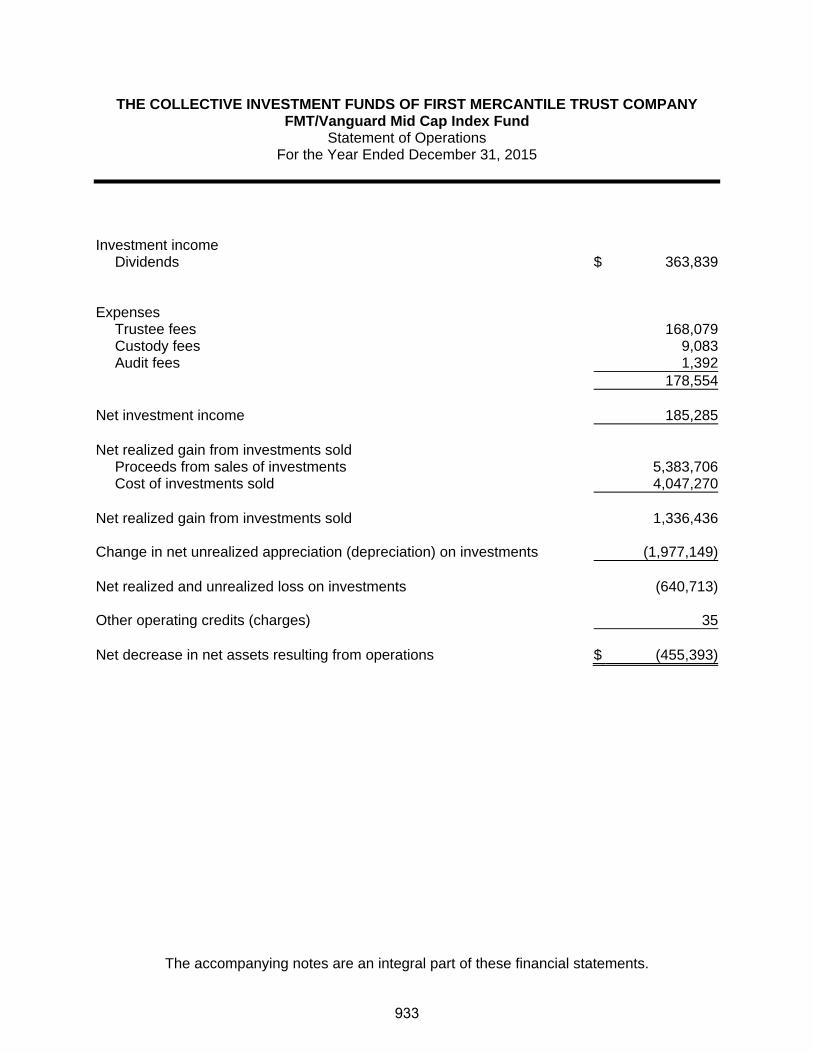
THE COLLECTIVE INVESTMENT FUNDS OF FIRST MERCANTILE TRUST COMPANY FMT/Vanguard Mid Cap Index Fund
Statement of Operations For the Year Ended December 31, 2015
The accompanying notes are an integral part of these financial statements.
Investment income
Dividends $ 363,839 Expenses
Trustee fees 168,079Custody fees 9,083Audit fees 1,392
178,554 Net investment income 185,285 Net realized gain from investments sold
Proceeds from sales of investments 5,383,706Cost of investments sold 4,047,270
Net realized gain from investments sold 1,336,436 Change in net unrealized appreciation (depreciation) on investments (1,977,149) Net realized and unrealized loss on investments (640,713) Other operating credits (charges) 35 Net decrease in net assets resulting from operations $ (455,393)
933
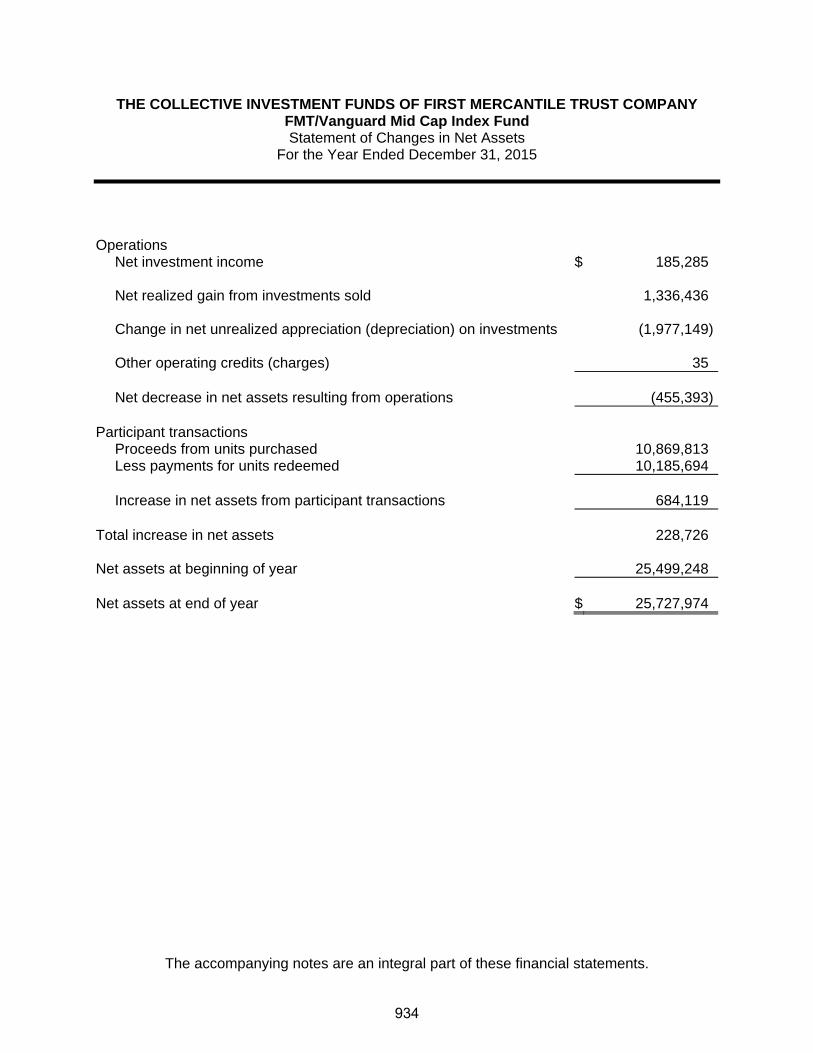
THE COLLECTIVE INVESTMENT FUNDS OF FIRST MERCANTILE TRUST COMPANY FMT/Vanguard Mid Cap Index Fund Statement of Changes in Net Assets
For the Year Ended December 31, 2015
The accompanying notes are an integral part of these financial statements.
Operations
Net investment income $ 185,285
Net realized gain from investments sold 1,336,436
Change in net unrealized appreciation (depreciation) on investments (1,977,149)
Other operating credits (charges) 35
Net decrease in net assets resulting from operations (455,393) Participant transactions
Proceeds from units purchased 10,869,813Less payments for units redeemed 10,185,694
Increase in net assets from participant transactions 684,119
Total increase in net assets 228,726 Net assets at beginning of year 25,499,248 Net assets at end of year $ 25,727,974
934

THE COLLECTIVE INVESTMENT FUNDS OF FIRST MERCANTILE TRUST COMPANY FMT/Vanguard Mid Cap Index Fund
Schedule of Investments and Specific Fund Disclosures December 31, 2015
The accompanying notes are an integral part of these financial statements.
Investments Shares Fair Value ____________ ____________
Mutual fund (99.9%)
Vanguard Mid-Cap Index Fund Admiral Shares (Cost $20,868,668) 172,902 $ 25,713,914 ____________________
Specific Fund Disclosures Fair value The inputs or methodology used for valuing securities may not be indicative of the risks associated with investing in those securities. For more information on valuation inputs, and their aggregation into the levels used in the table below, please refer to note 4 to the financial statements. The following table sets forth by level, within the fair value hierarchy, the Fund's investments measured at fair value.
Total Level 1 Level 2 Level 3
Mutual fund – Mid Cap Core $ 25,713,914 $ 25,713,914 $ — $ —__________ __________ __________ ___________________ __________ __________ _________ Investment transactions The aggregate cost of purchases of investment securities and proceeds from sales of investment securities (other than temporary cash investments) totaled $6,224,629 and $5,383,706, respectively, for the year ended December 31, 2015. Class-specific expenses Class-specific trustee fees for the year ended December 31, 2015 were as follows: Class R1 $ 37,101 Class R2 20,408 Class R3 31,589 Class R4 21,329 Class R5 22,309 Class R6 17,804 Class R7 4,944 Class R8 6,796 Class LifeStyle 5,799 $ 168,079
935

THE COLLECTIVE INVESTMENT FUNDS OF FIRST MERCANTILE TRUST COMPANY FMT/Vanguard Mid Cap Index Fund Schedule of Participant Transactions
December 31, 2015
The accompanying notes are an integral part of these financial statements.
Participant transactions by class for the year ended December 31, 2015 were as follows: Dollars Units Purchases Redemptions Net change Purchases Redemptions Net change Class R1 $ 3,763,656 $ (3,827,911) $ (64,255) 199,182 (203,799) (4,617)Class R2 1,060,848 (1,095,700) (34,852) 60,304 (61,479) (1,175)Class R3 2,418,001 (1,257,335) 1,160,666 143,694 (71,629) 72,065Class R4 1,165,020 (1,562,310) (397,290) 64,650 (85,546) (20,896)Class R5 974,275 (537,722) 436,553 53,617 (29,625) 23,992Class R6 371,158 (518,393) (147,235) 21,389 (30,896) (9,507)Class R7 472,694 (343,455) 129,239 28,202 (20,185) 8,017Class R8 288,289 (480,314) (192,025) 17,362 (28,231) (10,869)Class LifeStyle 355,872 (562,554) (206,682) — — — $ 10,869,813 $ (10,185,694) $ 684,119 588,400 (531,390) 57,010
936

THE COLLECTIVE INVESTMENT FUNDS OF FIRST MERCANTILE TRUST COMPANY FMT/Vanguard Mid Cap Index Fund
Financial Highlights December 31, 2015
The accompanying notes are an integral part of these financial statements.
Change in Net Asset Value Resulting from Operations Ratios (to average net
assets)
NAV per Unit, Beginning of
Period
Net Investment
Income (Loss)(a)
Net Realized and Unrealized
Gain (Loss) from
Investments(a)
Total from Investment Activities
NAV per Unit, End of
Period Total
Return Expenses
Net Investment
Income (Loss)
Class R1 $ 18.5021 $ 0.1857 $ (0.5055) $ (0.3198) $ 18.1823 (1.73)% (0.39)% 0.99%Class R2 17.3531 0.1321 (0.4697) (0.3376) 17.0155 (1.95)% (0.61)% 0.75%Class R3 17.2267 0.1177 (0.4816) (0.3639) 16.8628 (2.11)% (0.78)% 0.67%Class R4 18.0423 0.0800 (0.4914) (0.4114) 17.6309 (2.28)% (0.95)% 0.44%Class R5 18.0164 0.0566 (0.4974) (0.4408) 17.5756 (2.45)% (1.12)% 0.31%Class R6 16.9972 0.0107 (0.4549) (0.4442) 16.5530 (2.61)% (1.29)% 0.06%Class R7 16.8737 0.0052 (0.4742) (0.4690) 16.4047 (2.78)% (1.46)% 0.03%Class R8 16.9141 (0.0533) (0.4451) (0.4984) 16.4157 (2.95)% (1.63)% (0.31)%
(a) Per unit amounts are based on average daily units outstanding.
937

FMT/Vanguard Selected Value Fund

THE COLLECTIVE INVESTMENT FUNDS OF FIRST MERCANTILE TRUST COMPANY FMT/Vanguard Selected Value Fund
Statement of Assets and Liabilities December 31, 2015
The accompanying notes are an integral part of these financial statements.
Assets Investments in securities, at fair value $ 19,366,635 Liabilities Trustee fees 9,317 Net assets $ 19,357,318 Components of net assets
Units of
Participation NAV
per Unit Net
Assets Class R1 712,582 $ 15.8960 $ 11,327,231Class R2 113,363 $ 16.8449 1,909,593Class R3 165,272 $ 15.6099 2,579,870Class R4 126,800 $ 16.7335 2,121,810Class R5 60,937 $ 16.2820 992,181Class R6 5,869 $ 15.2221 89,337Class R7 8,366 $ 15.8891 132,928Class R8 13,535 $ 15.0990 204,368
$ 19,357,318
938

THE COLLECTIVE INVESTMENT FUNDS OF FIRST MERCANTILE TRUST COMPANY FMT/Vanguard Selected Value Fund
Statement of Operations For the Year Ended December 31, 2015
The accompanying notes are an integral part of these financial statements.
Investment income
Dividends $ 1,067,126 Expenses
Trustee fees 128,939Custody fees 7,997Audit fees 1,200
138,136 Net investment income 928,990 Net realized gain from investments sold
Proceeds from sales of investments 6,021,161Cost of investments sold 4,691,010
Net realized gain from investments sold 1,330,151 Change in net unrealized appreciation (depreciation) on investments (3,128,706) Net realized and unrealized loss on investments (1,798,555) Net decrease in net assets resulting from operations $ (869,565)
939

THE COLLECTIVE INVESTMENT FUNDS OF FIRST MERCANTILE TRUST COMPANY FMT/Vanguard Selected Value Fund Statement of Changes in Net Assets
For the Year Ended December 31, 2015
The accompanying notes are an integral part of these financial statements.
Operations
Net investment income $ 928,990
Net realized gain from investments sold 1,330,151
Change in net unrealized appreciation (depreciation) on investments (3,128,706)
Net decrease in net assets resulting from operations (869,565) Participant transactions
Proceeds from units purchased 6,604,628Less payments for units redeemed 10,914,034
Decrease in net assets from participant transactions (4,309,406)
Total decrease in net assets (5,178,971) Net assets at beginning of year 24,536,289 Net assets at end of year $ 19,357,318
940

THE COLLECTIVE INVESTMENT FUNDS OF FIRST MERCANTILE TRUST COMPANY FMT/Vanguard Selected Value Fund
Schedule of Investments and Specific Fund Disclosures December 31, 2015
The accompanying notes are an integral part of these financial statements.
Investments Shares Fair Value ____________ ____________
Mutual fund (100.0%)
Vanguard Selected Value Investment Fund (Cost $16,837,855) 749,193 $ 19,366,635 ____________________
Specific Fund Disclosures Fair value The inputs or methodology used for valuing securities may not be indicative of the risks associated with investing in those securities. For more information on valuation inputs, and their aggregation into the levels used in the table below, please refer to note 4 to the financial statements. The following table sets forth by level, within the fair value hierarchy, the Fund's investments measured at fair value.
Total Level 1 Level 2 Level 3
Mutual fund – Mid Cap Value $ 19,366,635 $ 19,366,635 $ — $ —__________ __________ __________ ___________________ __________ __________ _________ Investment transactions The aggregate cost of purchases of investment securities and proceeds from sales of investment securities (other than temporary cash investments) totaled $2,637,167 and $6,021,161, respectively, for the year ended December 31, 2015. Class-specific expenses Class-specific trustee fees for the year ended December 31, 2015 were as follows: Class R1 $ 40,423 Class R2 20,097 Class R3 19,931 Class R4 24,566 Class R5 16,487 Class R6 2,141 Class R7 1,938 Class R8 3,356 $ 128,939
941

THE COLLECTIVE INVESTMENT FUNDS OF FIRST MERCANTILE TRUST COMPANY FMT/Vanguard Selected Value Fund Schedule of Participant Transactions
December 31, 2015
The accompanying notes are an integral part of these financial statements.
Participant transactions by class for the year ended December 31, 2015 were as follows: Dollars Units Purchases Redemptions Net change Purchases Redemptions Net change Class R1 $ 3,611,788 $ (2,968,214) $ 643,574 217,596 (180,158) 37,438Class R2 745,956 (2,832,192) (2,086,236) 42,425 (160,649) (118,224)Class R3 904,372 (1,146,168) (241,796) 55,393 (69,406) (14,013)Class R4 1,034,624 (1,661,455) (626,831) 59,350 (92,581) (33,231)Class R5 167,519 (1,910,761) (1,743,242) 9,823 (112,765) (102,942)Class R6 7,668 (131,702) (124,034) 488 (8,313) (7,825)Class R7 60,268 (78,448) (18,180) 3,598 (4,633) (1,035)Class R8 72,433 (185,094) (112,661) 4,555 (11,743) (7,188) $ 6,604,628 $ (10,914,034) $ (4,309,406) 393,228 (640,248) (247,020)
942

THE COLLECTIVE INVESTMENT FUNDS OF FIRST MERCANTILE TRUST COMPANY FMT/Vanguard Selected Value Fund
Financial Highlights December 31, 2015
The accompanying notes are an integral part of these financial statements.
Change in Net Asset Value Resulting from Operations Ratios (to average net
assets)
NAV per Unit, Beginning of
Period
Net Investment
Income (Loss)(a)
Net Realized and Unrealized
Gain (Loss) from
Investments(a)
Total from Investment Activities
NAV per Unit, End of
Period Total
Return Expenses
Net Investment
Income (Loss)
Class R1 $ 16.5895 $ 0.8119 $ (1.5054) $ (0.6935) $ 15.8960 (4.18)% (0.39)% 4.90%Class R2 17.6188 0.4986 (1.2725) (0.7739) 16.8449 (4.39)% (0.61)% 2.81%Class R3 16.3549 0.7430 (1.4880) (0.7450) 15.6099 (4.56)% (0.78)% 4.55%Class R4 17.5622 0.5718 (1.4005) (0.8287) 16.7335 (4.72)% (0.95)% 3.25%Class R5 17.1176 0.4280 (1.2636) (0.8356) 16.2820 (4.88)% (1.12)% 2.51%Class R6 16.0307 0.2393 (1.0479) (0.8086) 15.2221 (5.04)% (1.29)% 1.50%Class R7 16.7618 0.6296 (1.5023) (0.8727) 15.8891 (5.21)% (1.46)% 3.77%Class R8 15.9555 0.5657 (1.4222) (0.8565) 15.0990 (5.37)% (1.63)% 3.57%
(a) Per unit amounts are based on average daily units outstanding.
943
FMT/Vanguard Small Cap Stock Index Fund

THE COLLECTIVE INVESTMENT FUNDS OF FIRST MERCANTILE TRUST COMPANY FMT/Vanguard Small Cap Stock Index Fund
Statement of Assets and Liabilities December 31, 2015
The accompanying notes are an integral part of these financial statements.
Assets Investments in securities, at fair value $ 31,814,208 Liabilities Trustee fees 14,851 Net assets $ 31,799,357 Components of net assets
Units of
Participation NAV
per Unit Net
Assets Class R1 406,949 $ 34.7917 $ 14,158,437Class R2 197,817 $ 17.2583 3,413,977Class R3 415,503 $ 15.8004 6,565,090Class R4 171,505 $ 16.0057 2,745,058Class R5 133,925 $ 16.1594 2,164,143Class R6 25,381 $ 15.7463 399,655Class R7 15,376 $ 15.6839 241,163Class R8 13,194 $ 16.2626 214,566Class LifeStyle 1,897,268
$ 31,799,357
944

THE COLLECTIVE INVESTMENT FUNDS OF FIRST MERCANTILE TRUST COMPANY FMT/Vanguard Small Cap Stock Index Fund
Statement of Operations For the Year Ended December 31, 2015
The accompanying notes are an integral part of these financial statements.
Investment income
Dividends $ 449,910 Expenses
Trustee fees 183,799Custody fees 10,174Audit fees 1,603
195,576 Net investment income 254,334 Net realized gain from investments sold
Proceeds from sales of investments 5,604,408Cost of investments sold 4,496,961
Net realized gain from investments sold 1,107,447 Change in net unrealized appreciation (depreciation) on investments (2,731,280) Net realized and unrealized loss on investments (1,623,833) Other operating credits (charges) 76 Net decrease in net assets resulting from operations $ (1,369,423)
945

THE COLLECTIVE INVESTMENT FUNDS OF FIRST MERCANTILE TRUST COMPANY FMT/Vanguard Small Cap Stock Index Fund
Statement of Changes in Net Assets For the Year Ended December 31, 2015
The accompanying notes are an integral part of these financial statements.
Operations
Net investment income $ 254,334
Net realized gain from investments sold 1,107,447
Change in net unrealized appreciation (depreciation) on investments (2,731,280)
Other operating credits (charges) 76
Net decrease in net assets resulting from operations (1,369,423) Participant transactions
Proceeds from units purchased 19,116,579Less payments for units redeemed 14,155,078
Increase in net assets from participant transactions 4,961,501
Total increase in net assets 3,592,078 Net assets at beginning of year 28,207,279 Net assets at end of year $ 31,799,357
946

THE COLLECTIVE INVESTMENT FUNDS OF FIRST MERCANTILE TRUST COMPANY FMT/Vanguard Small Cap Stock Index Fund
Schedule of Investments and Specific Fund Disclosures December 31, 2015
The accompanying notes are an integral part of these financial statements.
Investments Shares Fair Value ____________ ____________
Mutual fund (100.0%)
Vanguard Small Cap Index Fund Admiral Shares (Cost $28,283,302) 599,702 $ 31,814,208 ____________________
Specific Fund Disclosures Fair value The inputs or methodology used for valuing securities may not be indicative of the risks associated with investing in those securities. For more information on valuation inputs, and their aggregation into the levels used in the table below, please refer to note 4 to the financial statements. The following table sets forth by level, within the fair value hierarchy, the Fund's investments measured at fair value.
Total Level 1 Level 2 Level 3
Mutual fund – Small Cap Core $ 31,814,208 $ 31,814,208 $ — $ —__________ __________ __________ ___________________ __________ __________ _________ Investment transactions The aggregate cost of purchases of investment securities and proceeds from sales of investment securities (other than temporary cash investments) totaled $10,820,036 and $5,604,408, respectively, for the year ended December 31, 2015. Class-specific expenses Class-specific trustee fees for the year ended December 31, 2015 were as follows: Class R1 $ 43,127 Class R2 24,598 Class R3 33,026 Class R4 31,593 Class R5 22,996 Class R6 7,804 Class R7 3,848 Class R8 4,609 Class LifeStyle 12,198 $ 183,799
947

THE COLLECTIVE INVESTMENT FUNDS OF FIRST MERCANTILE TRUST COMPANY FMT/Vanguard Small Cap Stock Index Fund
Schedule of Participant Transactions December 31, 2015
The accompanying notes are an integral part of these financial statements.
Participant transactions by class for the year ended December 31, 2015 were as follows: Dollars Units Purchases Redemptions Net change Purchases Redemptions Net change Class R1 $ 8,510,484 $ (3,447,741) $ 5,062,743 230,433 (95,543) 134,890Class R2 1,210,088 (3,022,043) (1,811,955) 67,611 (163,677) (96,066)Class R3 4,479,274 (1,423,796) 3,055,478 278,640 (84,280) 194,360Class R4 2,336,299 (2,291,967) 44,332 137,058 (136,281) 777Class R5 1,410,159 (1,714,664) (304,505) 83,298 (98,290) (14,992)Class R6 109,773 (577,993) (468,220) 6,516 (35,454) (28,938)Class R7 215,231 (220,603) (5,372) 13,172 (13,636) (464)Class R8 175,131 (287,143) (112,012) 10,594 (16,551) (5,957)Class LifeStyle 670,140 (1,169,128) (498,988) — — — $ 19,116,579 $ (14,155,078) $ 4,961,501 827,322 (643,712) 183,610
948
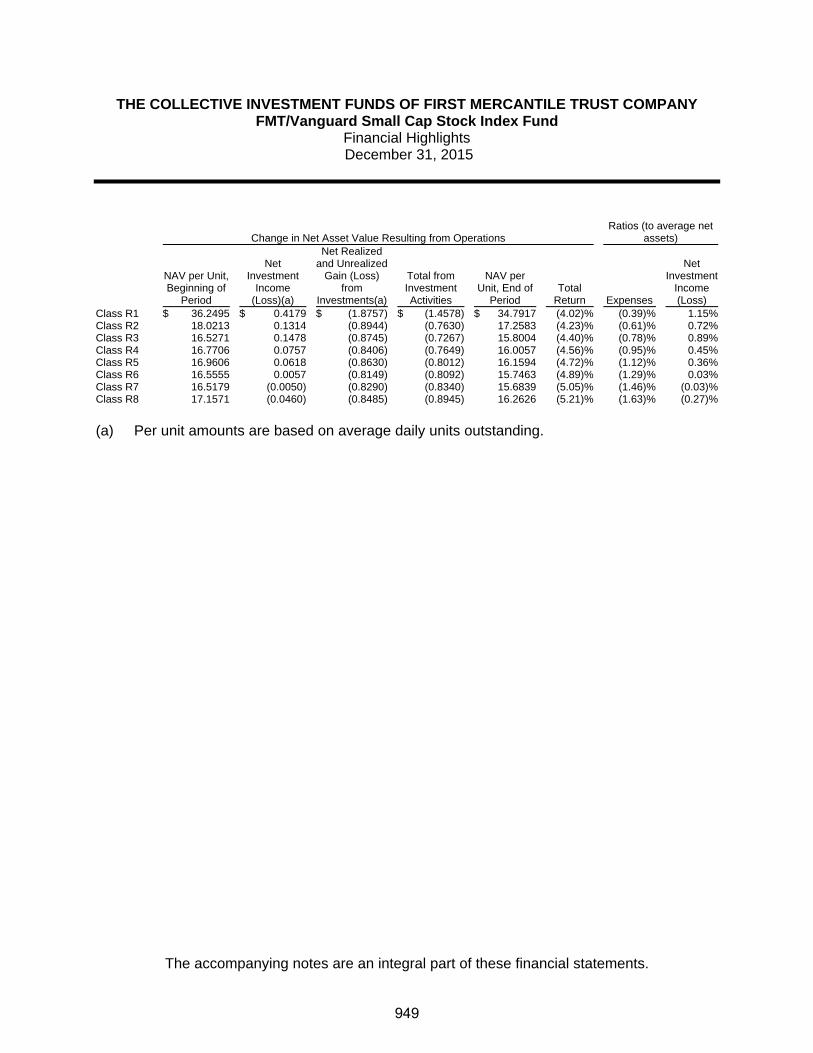
THE COLLECTIVE INVESTMENT FUNDS OF FIRST MERCANTILE TRUST COMPANY FMT/Vanguard Small Cap Stock Index Fund
Financial Highlights December 31, 2015
The accompanying notes are an integral part of these financial statements.
Change in Net Asset Value Resulting from Operations Ratios (to average net
assets)
NAV per Unit, Beginning of
Period
Net Investment
Income (Loss)(a)
Net Realized and Unrealized
Gain (Loss) from
Investments(a)
Total from Investment Activities
NAV per Unit, End of
Period Total
Return Expenses
Net Investment
Income (Loss)
Class R1 $ 36.2495 $ 0.4179 $ (1.8757) $ (1.4578) $ 34.7917 (4.02)% (0.39)% 1.15%Class R2 18.0213 0.1314 (0.8944) (0.7630) 17.2583 (4.23)% (0.61)% 0.72%Class R3 16.5271 0.1478 (0.8745) (0.7267) 15.8004 (4.40)% (0.78)% 0.89%Class R4 16.7706 0.0757 (0.8406) (0.7649) 16.0057 (4.56)% (0.95)% 0.45%Class R5 16.9606 0.0618 (0.8630) (0.8012) 16.1594 (4.72)% (1.12)% 0.36%Class R6 16.5555 0.0057 (0.8149) (0.8092) 15.7463 (4.89)% (1.29)% 0.03%Class R7 16.5179 (0.0050) (0.8290) (0.8340) 15.6839 (5.05)% (1.46)% (0.03)%Class R8 17.1571 (0.0460) (0.8485) (0.8945) 16.2626 (5.21)% (1.63)% (0.27)%
(a) Per unit amounts are based on average daily units outstanding.
949

FMT/Vanguard Value Index Fund
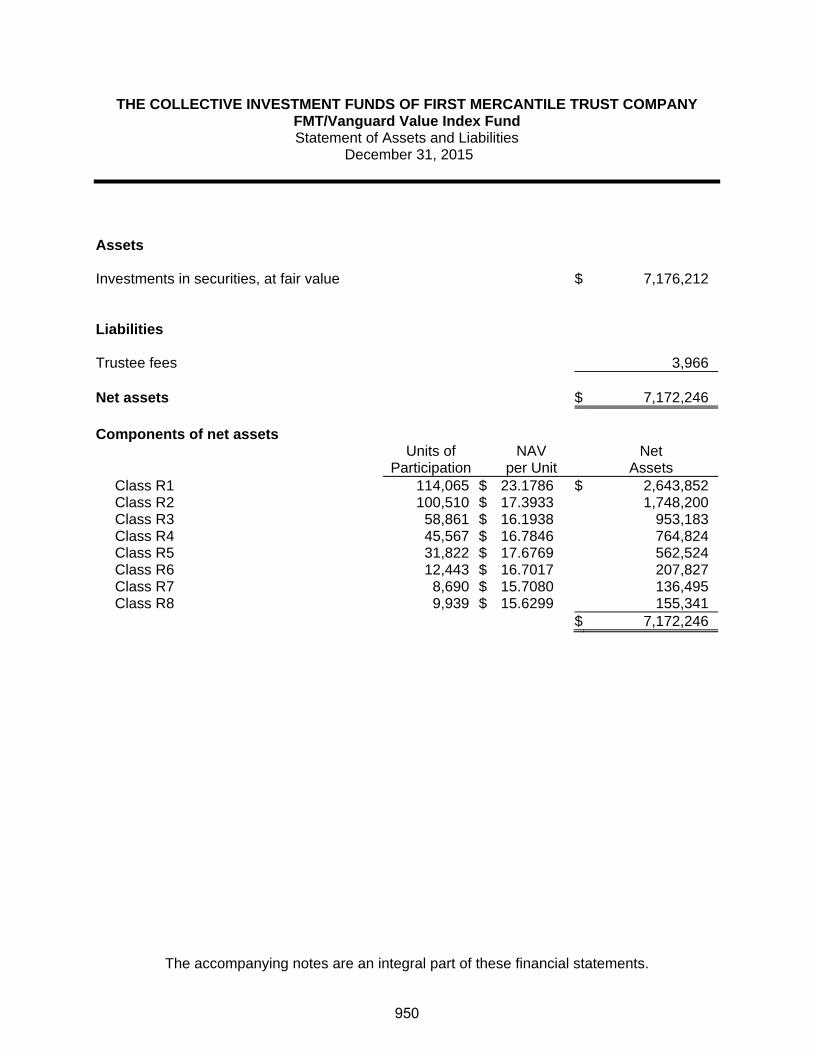
THE COLLECTIVE INVESTMENT FUNDS OF FIRST MERCANTILE TRUST COMPANY FMT/Vanguard Value Index Fund Statement of Assets and Liabilities
December 31, 2015
The accompanying notes are an integral part of these financial statements.
Assets Investments in securities, at fair value $ 7,176,212 Liabilities Trustee fees 3,966 Net assets $ 7,172,246 Components of net assets
Units of
Participation NAV
per Unit Net
Assets Class R1 114,065 $ 23.1786 $ 2,643,852Class R2 100,510 $ 17.3933 1,748,200Class R3 58,861 $ 16.1938 953,183Class R4 45,567 $ 16.7846 764,824Class R5 31,822 $ 17.6769 562,524Class R6 12,443 $ 16.7017 207,827Class R7 8,690 $ 15.7080 136,495Class R8 9,939 $ 15.6299 155,341
$ 7,172,246
950

THE COLLECTIVE INVESTMENT FUNDS OF FIRST MERCANTILE TRUST COMPANY FMT/Vanguard Value Index Fund
Statement of Operations For the Year Ended December 31, 2015
The accompanying notes are an integral part of these financial statements.
Investment income
Dividends $ 200,961 Expenses
Trustee fees 52,131Custody fees 2,872Audit fees 1,200
56,203 Net investment income 144,758 Net realized gain from investments sold
Proceeds from sales of investments 3,769,745Cost of investments sold 3,015,313
Net realized gain from investments sold 754,432 Change in net unrealized appreciation (depreciation) on investments (991,032) Net realized and unrealized loss on investments (236,600) Net decrease in net assets resulting from operations $ (91,842)
951

THE COLLECTIVE INVESTMENT FUNDS OF FIRST MERCANTILE TRUST COMPANY FMT/Vanguard Value Index Fund
Statement of Changes in Net Assets For the Year Ended December 31, 2015
The accompanying notes are an integral part of these financial statements.
Operations
Net investment income $ 144,758
Net realized gain from investments sold 754,432
Change in net unrealized appreciation (depreciation) on investments (991,032)
Net decrease in net assets resulting from operations (91,842) Participant transactions
Proceeds from units purchased 3,383,313Less payments for units redeemed 5,032,901
Decrease in net assets from participant transactions (1,649,588)
Total decrease in net assets (1,741,430) Net assets at beginning of year 8,913,676 Net assets at end of year $ 7,172,246
952
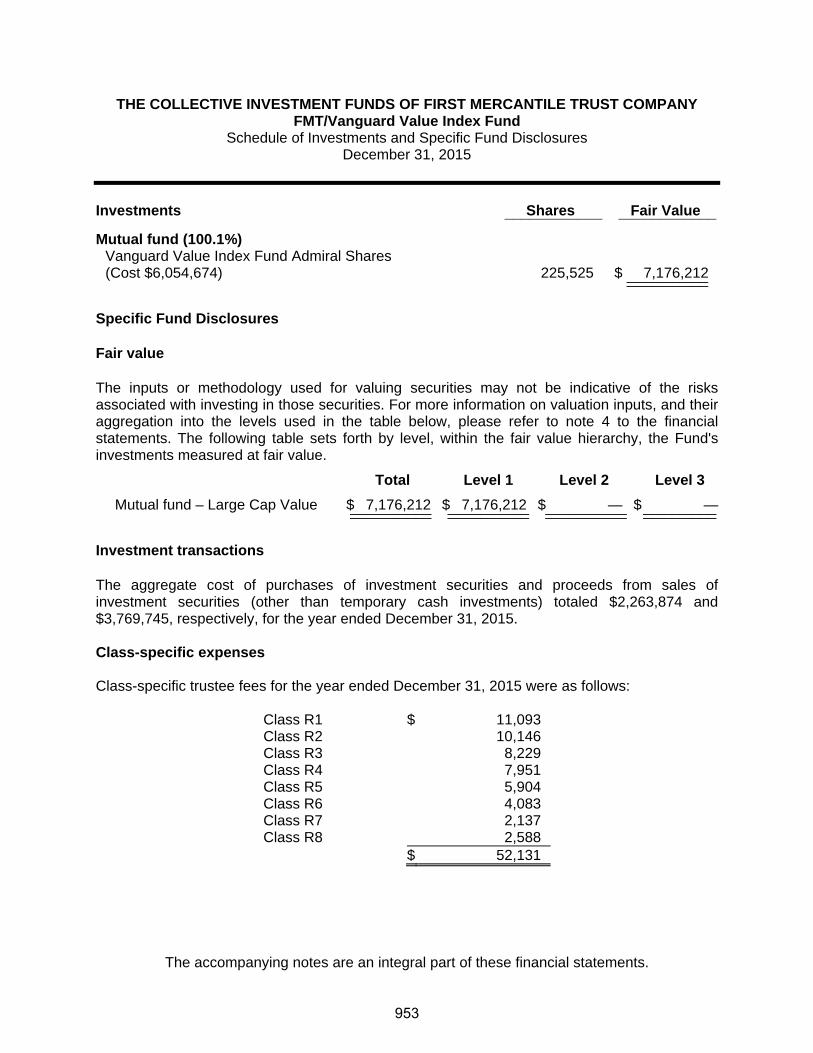
THE COLLECTIVE INVESTMENT FUNDS OF FIRST MERCANTILE TRUST COMPANY FMT/Vanguard Value Index Fund
Schedule of Investments and Specific Fund Disclosures December 31, 2015
The accompanying notes are an integral part of these financial statements.
Investments Shares Fair Value ____________ ____________
Mutual fund (100.1%)
Vanguard Value Index Fund Admiral Shares (Cost $6,054,674) 225,525 $ 7,176,212 ____________________
Specific Fund Disclosures Fair value The inputs or methodology used for valuing securities may not be indicative of the risks associated with investing in those securities. For more information on valuation inputs, and their aggregation into the levels used in the table below, please refer to note 4 to the financial statements. The following table sets forth by level, within the fair value hierarchy, the Fund's investments measured at fair value.
Total Level 1 Level 2 Level 3
Mutual fund – Large Cap Value $ 7,176,212 $ 7,176,212 $ — $ —__________ __________ __________ ___________________ __________ __________ _________ Investment transactions The aggregate cost of purchases of investment securities and proceeds from sales of investment securities (other than temporary cash investments) totaled $2,263,874 and $3,769,745, respectively, for the year ended December 31, 2015. Class-specific expenses Class-specific trustee fees for the year ended December 31, 2015 were as follows: Class R1 $ 11,093 Class R2 10,146 Class R3 8,229 Class R4 7,951 Class R5 5,904 Class R6 4,083 Class R7 2,137 Class R8 2,588 $ 52,131
953

THE COLLECTIVE INVESTMENT FUNDS OF FIRST MERCANTILE TRUST COMPANY FMT/Vanguard Value Index Fund
Schedule of Participant Transactions December 31, 2015
The accompanying notes are an integral part of these financial statements.
Participant transactions by class for the year ended December 31, 2015 were as follows: Dollars Units Purchases Redemptions Net change Purchases Redemptions Net change Class R1 $ 1,258,249 $ (1,652,259) $ (394,010) 53,861 (70,045) (16,184)Class R2 657,922 (711,182) (53,260) 38,096 (40,623) (2,527)Class R3 734,999 (1,210,681) (475,682) 45,481 (74,247) (28,766)Class R4 225,824 (836,288) (610,464) 13,356 (48,784) (35,428)Class R5 231,205 (153,249) 77,956 12,845 (8,577) 4,268Class R6 184,721 (350,878) (166,157) 10,765 (20,899) (10,134)Class R7 40,083 (50,216) (10,133) 2,543 (3,142) (599)Class R8 50,310 (68,148) (17,838) 3,173 (4,359) (1,186) $ 3,383,313 $ (5,032,901) $ (1,649,588) 180,120 (270,676) (90,556)
954

THE COLLECTIVE INVESTMENT FUNDS OF FIRST MERCANTILE TRUST COMPANY FMT/Vanguard Value Index Fund
Financial Highlights December 31, 2015
The accompanying notes are an integral part of these financial statements.
Change in Net Asset Value Resulting from Operations Ratios (to average net
assets)
NAV per Unit, Beginning of
Period
Net Investment
Income (Loss)(a)
Net Realized and Unrealized
Gain (Loss) from
Investments(a)
Total from Investment Activities
NAV per Unit, End of
Period Total
Return Expenses
Net Investment
Income (Loss)
Class R1 $ 23.4739 $ 0.4766 $ (0.7719) $ (0.2953) $ 23.1786 (1.26)% (0.40)% 2.05%Class R2 17.6539 0.3293 (0.5899) (0.2606) 17.3933 (1.48)% (0.62)% 1.88%Class R3 16.4646 0.2750 (0.5458) (0.2708) 16.1938 (1.64)% (0.79)% 1.69%Class R4 17.0944 0.2603 (0.5701) (0.3098) 16.7846 (1.81)% (0.96)% 1.54%Class R5 18.0341 0.2510 (0.6082) (0.3572) 17.6769 (1.98)% (1.13)% 1.41%Class R6 17.0682 0.1849 (0.5514) (0.3665) 16.7017 (2.15)% (1.30)% 1.09%Class R7 16.0802 0.1590 (0.5312) (0.3722) 15.7080 (2.31)% (1.47)% 1.00%Class R8 16.0276 0.1390 (0.5367) (0.3977) 15.6299 (2.48)% (1.64)% 0.88%
(a) Per unit amounts are based on average daily units outstanding.
955

FMT/Vanguard Windsor II Fund

THE COLLECTIVE INVESTMENT FUNDS OF FIRST MERCANTILE TRUST COMPANY FMT/Vanguard Windsor II Fund Statement of Assets and Liabilities
December 31, 2015
The accompanying notes are an integral part of these financial statements.
Assets Investments in securities, at fair value $ 8,936,927 Liabilities Trustee fees 4,571 Net assets $ 8,932,356 Components of net assets
Units of
Participation NAV
per Unit Net
Assets Class R1 221,797 $ 17.1992 $ 3,814,728Class R2 174,777 $ 16.7846 2,933,568Class R3 61,834 $ 15.4194 953,437Class R4 30,673 $ 16.4498 504,567Class R5 41,096 $ 16.3364 671,363Class R7 4,160 $ 10.5969 44,085Class R8 700 $ 15.1620 10,608
$ 8,932,356
956

THE COLLECTIVE INVESTMENT FUNDS OF FIRST MERCANTILE TRUST COMPANY FMT/Vanguard Windsor II Fund
Statement of Operations For the Year Ended December 31, 2015
The accompanying notes are an integral part of these financial statements.
Investment income
Dividends $ 748,158 Expenses
Trustee fees 65,985Custody fees 4,161Audit fees 1,200
71,346 Net investment income 676,812 Net realized gain from investments sold
Proceeds from sales of investments 4,663,622Cost of investments sold 4,007,219
Net realized gain from investments sold 656,403 Change in net unrealized appreciation (depreciation) on investments (1,733,734) Net realized and unrealized loss on investments (1,077,331) Net decrease in net assets resulting from operations $ (400,519)
957

THE COLLECTIVE INVESTMENT FUNDS OF FIRST MERCANTILE TRUST COMPANY FMT/Vanguard Windsor II Fund
Statement of Changes in Net Assets For the Year Ended December 31, 2015
The accompanying notes are an integral part of these financial statements.
Operations
Net investment income $ 676,812
Net realized gain from investments sold 656,403
Change in net unrealized appreciation (depreciation) on investments (1,733,734)
Net decrease in net assets resulting from operations (400,519) Participant transactions
Proceeds from units purchased 2,071,527Less payments for units redeemed 5,709,306
Decrease in net assets from participant transactions (3,637,779)
Total decrease in net assets (4,038,298) Net assets at beginning of year 12,970,654 Net assets at end of year $ 8,932,356
958

THE COLLECTIVE INVESTMENT FUNDS OF FIRST MERCANTILE TRUST COMPANY FMT/Vanguard Windsor II Fund
Schedule of Investments and Specific Fund Disclosures December 31, 2015
The accompanying notes are an integral part of these financial statements.
Investments Shares Fair Value ____________ ____________
Mutual fund (100.1%)
Vanguard Windsor II Fund Admiral Shares (Cost $8,410,855) 150,352 $ 8,936,927 ____________________
Specific Fund Disclosures Fair value The inputs or methodology used for valuing securities may not be indicative of the risks associated with investing in those securities. For more information on valuation inputs, and their aggregation into the levels used in the table below, please refer to note 4 to the financial statements. The following table sets forth by level, within the fair value hierarchy, the Fund's investments measured at fair value.
Total Level 1 Level 2 Level 3
Mutual fund – Large Cap Value $ 8,936,927 $ 8,936,927 $ — $ —__________ __________ __________ ___________________ __________ __________ _________ Investment transactions The aggregate cost of purchases of investment securities and proceeds from sales of investment securities (other than temporary cash investments) totaled $1,700,813 and $4,663,622, respectively, for the year ended December 31, 2015. Class-specific expenses Class-specific trustee fees for the year ended December 31, 2015 were as follows: Class R1 $ 16,283 Class R2 21,196 Class R3 11,739 Class R4 5,345 Class R5 7,780 Class R6 3,401 Class R7 66 Class R8 175 $ 65,985
959

THE COLLECTIVE INVESTMENT FUNDS OF FIRST MERCANTILE TRUST COMPANY FMT/Vanguard Windsor II Fund
Schedule of Participant Transactions December 31, 2015
The accompanying notes are an integral part of these financial statements.
Participant transactions by class for the year ended December 31, 2015 were as follows: Dollars Units Purchases Redemptions Net change Purchases Redemptions Net change Class R1 $ 572,583 $ (2,017,507) $ (1,444,924) 32,223 (113,723) (81,500)Class R2 683,055 (1,064,683) (381,628) 39,480 (62,494) (23,014)Class R3 606,677 (1,652,119) (1,045,442) 37,418 (103,074) (65,656)Class R4 74,218 (304,002) (229,784) 4,402 (17,330) (12,928)Class R5 67,105 (281,955) (214,850) 3,979 (16,712) (12,733)Class R6 22,561 (389,040) (366,479) 1,524 (25,980) (24,456)Class R7 45,328 — 45,328 4,160 — 4,160 $ 2,071,527 $ (5,709,306) $ (3,637,779) 123,186 (339,313) (216,127)
960
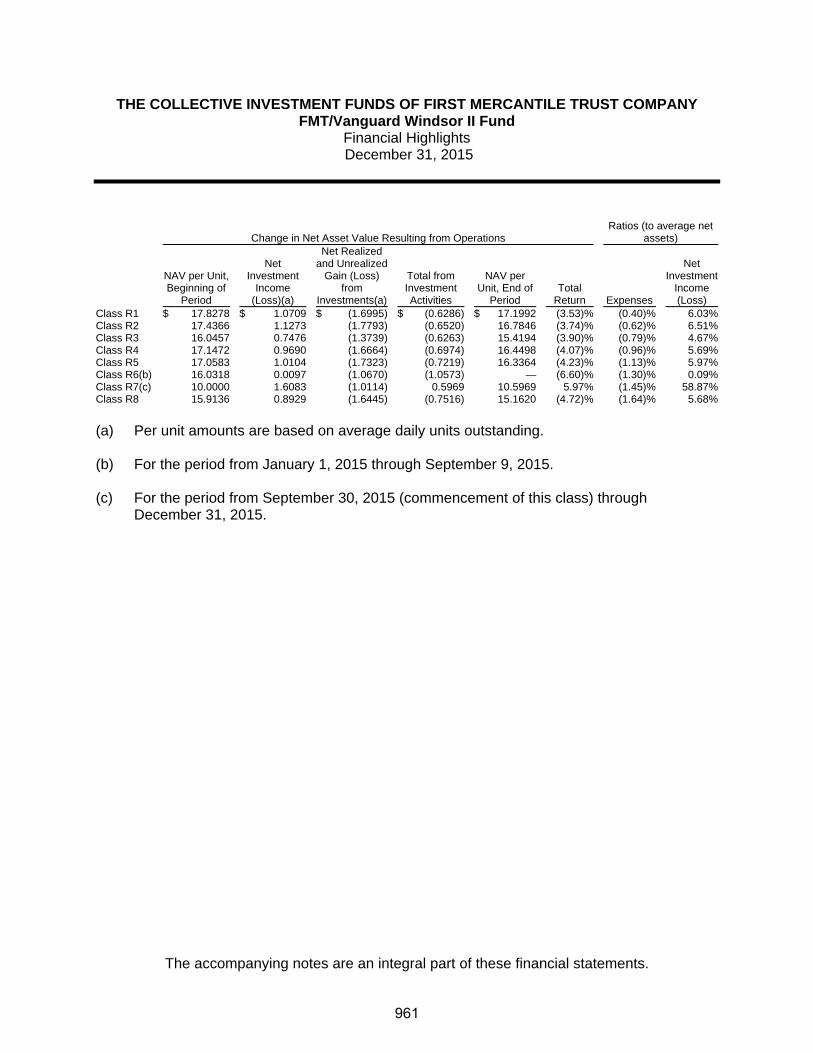
THE COLLECTIVE INVESTMENT FUNDS OF FIRST MERCANTILE TRUST COMPANY FMT/Vanguard Windsor II Fund
Financial Highlights December 31, 2015
The accompanying notes are an integral part of these financial statements.
Change in Net Asset Value Resulting from Operations Ratios (to average net
assets)
NAV per Unit, Beginning of
Period
Net Investment
Income (Loss)(a)
Net Realized and Unrealized
Gain (Loss) from
Investments(a)
Total from Investment Activities
NAV per Unit, End of
Period Total
Return Expenses
Net Investment
Income (Loss)
Class R1 $ 17.8278 $ 1.0709 $ (1.6995) $ (0.6286) $ 17.1992 (3.53)% (0.40)% 6.03%Class R2 17.4366 1.1273 (1.7793) (0.6520) 16.7846 (3.74)% (0.62)% 6.51%Class R3 16.0457 0.7476 (1.3739) (0.6263) 15.4194 (3.90)% (0.79)% 4.67%Class R4 17.1472 0.9690 (1.6664) (0.6974) 16.4498 (4.07)% (0.96)% 5.69%Class R5 17.0583 1.0104 (1.7323) (0.7219) 16.3364 (4.23)% (1.13)% 5.97%Class R6(b) 16.0318 0.0097 (1.0670) (1.0573) — (6.60)% (1.30)% 0.09%Class R7(c) 10.0000 1.6083 (1.0114) 0.5969 10.5969 5.97% (1.45)% 58.87%Class R8 15.9136 0.8929 (1.6445) (0.7516) 15.1620 (4.72)% (1.64)% 5.68%
(a) Per unit amounts are based on average daily units outstanding.
(b) For the period from January 1, 2015 through September 9, 2015.
(c) For the period from September 30, 2015 (commencement of this class) through
December 31, 2015.
961

FMT/Virtus Emerging Markets Opportunity Fund
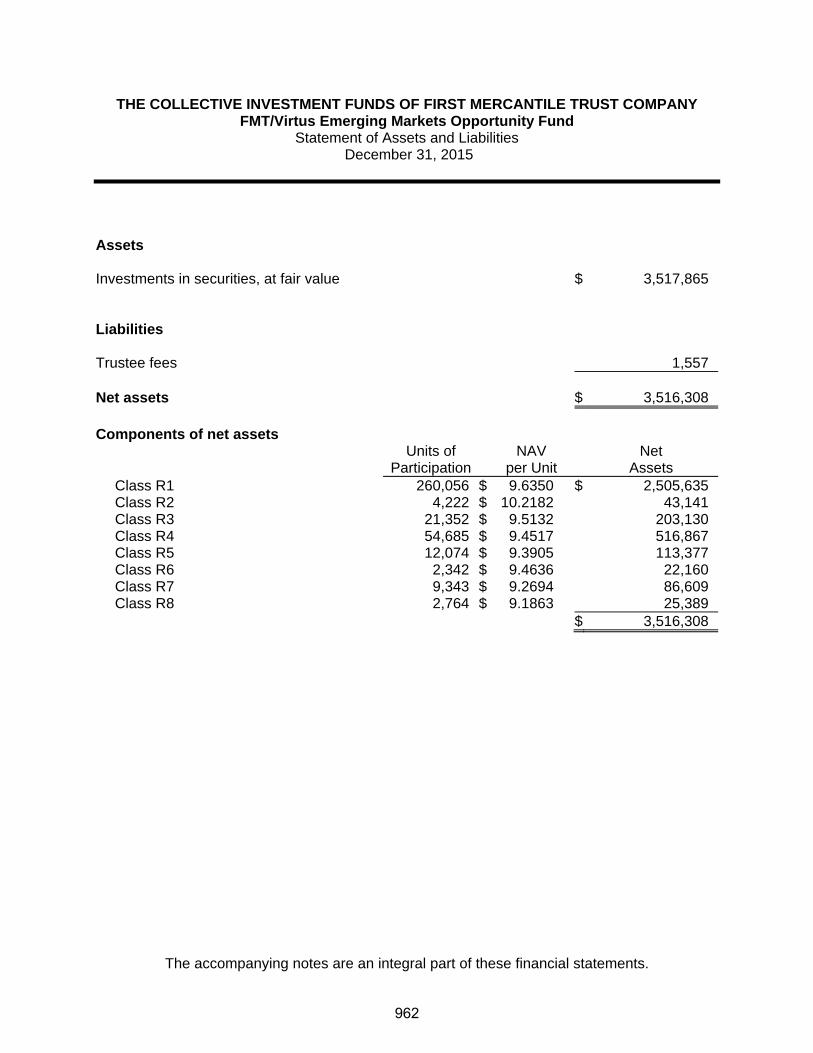
THE COLLECTIVE INVESTMENT FUNDS OF FIRST MERCANTILE TRUST COMPANY FMT/Virtus Emerging Markets Opportunity Fund
Statement of Assets and Liabilities December 31, 2015
The accompanying notes are an integral part of these financial statements.
Assets Investments in securities, at fair value $ 3,517,865 Liabilities Trustee fees 1,557 Net assets $ 3,516,308 Components of net assets
Units of
Participation NAV
per Unit Net
Assets Class R1 260,056 $ 9.6350 $ 2,505,635Class R2 4,222 $ 10.2182 43,141Class R3 21,352 $ 9.5132 203,130Class R4 54,685 $ 9.4517 516,867Class R5 12,074 $ 9.3905 113,377Class R6 2,342 $ 9.4636 22,160Class R7 9,343 $ 9.2694 86,609Class R8 2,764 $ 9.1863 25,389
$ 3,516,308
962

THE COLLECTIVE INVESTMENT FUNDS OF FIRST MERCANTILE TRUST COMPANY FMT/Virtus Emerging Markets Opportunity Fund
Statement of Operations For the Year Ended December 31, 2015
The accompanying notes are an integral part of these financial statements.
Investment income
Dividends $ 32,600 Expenses
Trustee fees 23,124Custody fees 1,619Audit fees 1,200
25,943 Net investment income 6,657 Net realized loss from investments sold
Proceeds from sales of investments 2,666,066Cost of investments sold 2,680,086
Net realized loss from investments sold (14,020) Change in net unrealized appreciation (depreciation) on investments (341,519) Net realized and unrealized loss on investments (355,539) Other operating credits (charges) 23,926 Net decrease in net assets resulting from operations $ (324,956)
963

THE COLLECTIVE INVESTMENT FUNDS OF FIRST MERCANTILE TRUST COMPANY FMT/Virtus Emerging Markets Opportunity Fund
Statement of Changes in Net Assets For the Year Ended December 31, 2015
The accompanying notes are an integral part of these financial statements.
Operations
Net investment income $ 6,657
Net realized loss from investments sold (14,020)
Change in net unrealized appreciation (depreciation) on investments (341,519)
Other operating credits (charges) 23,926
Net decrease in net assets resulting from operations (324,956) Participant transactions
Proceeds from units purchased 1,727,387Less payments for units redeemed 3,440,675
Decrease in net assets from participant transactions (1,713,288)
Total decrease in net assets (2,038,244) Net assets at beginning of year 5,554,552 Net assets at end of year $ 3,516,308
964

THE COLLECTIVE INVESTMENT FUNDS OF FIRST MERCANTILE TRUST COMPANY FMT/Virtus Emerging Markets Opportunity Fund
Schedule of Investments and Specific Fund Disclosures December 31, 2015
The accompanying notes are an integral part of these financial statements.
Investments Shares Fair Value ____________ ____________
Mutual fund (100.0%)
Virtus Emerging Markets Opportunity Fund (Cost $3,926,334) 392,619 $ 3,517,865 ____________________
Specific Fund Disclosures Fair value The inputs or methodology used for valuing securities may not be indicative of the risks associated with investing in those securities. For more information on valuation inputs, and their aggregation into the levels used in the table below, please refer to note 4 to the financial statements. The following table sets forth by level, within the fair value hierarchy, the Fund's investments measured at fair value.
Total Level 1 Level 2 Level 3
Mutual fund – Emerging Markets $ 3,517,865 $ 3,517,865 $ — $ —__________ __________ __________ ___________________ __________ __________ _________ Investment transactions The aggregate cost of purchases of investment securities and proceeds from sales of investment securities (other than temporary cash investments) totaled $982,311 and $2,666,066, respectively, for the year ended December 31, 2015. Class-specific expenses Class-specific trustee fees for the year ended December 31, 2015 were as follows: Class R1 $ 10,411 Class R2 67 Class R3 2,148 Class R4 5,558 Class R5 2,549 Class R6 212 Class R7 1,961 Class R8 218 $ 23,124
965
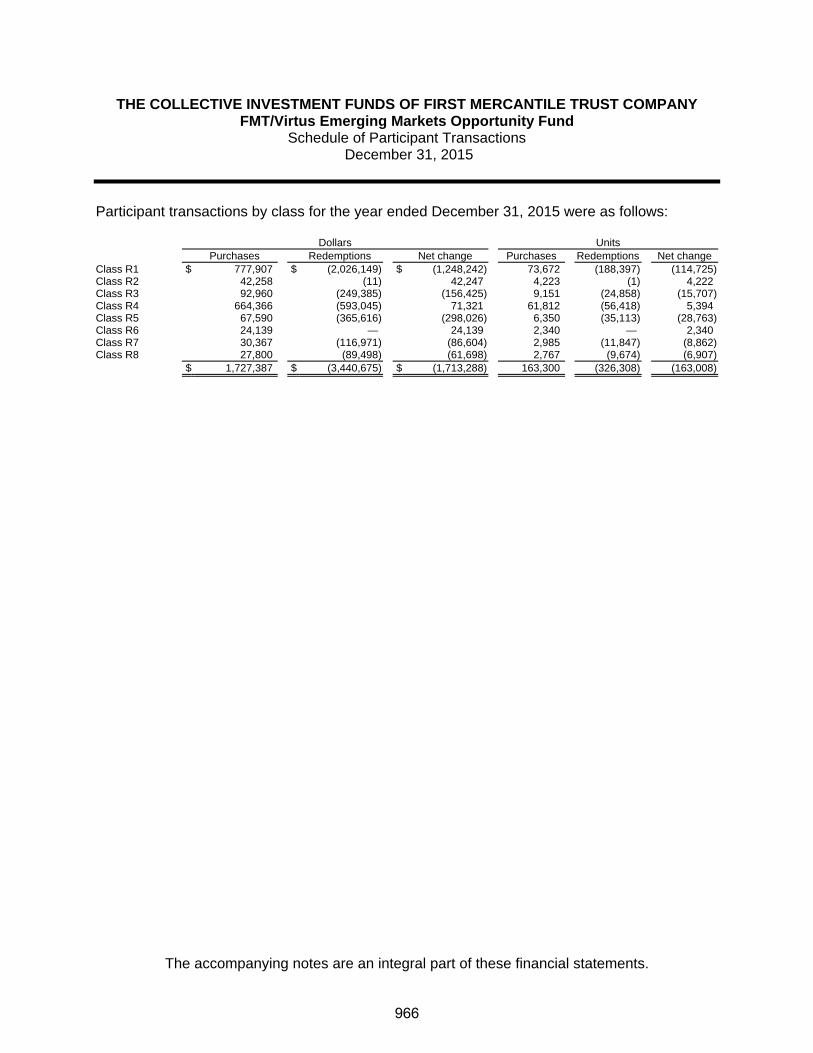
THE COLLECTIVE INVESTMENT FUNDS OF FIRST MERCANTILE TRUST COMPANY FMT/Virtus Emerging Markets Opportunity Fund
Schedule of Participant Transactions December 31, 2015
The accompanying notes are an integral part of these financial statements.
Participant transactions by class for the year ended December 31, 2015 were as follows: Dollars Units Purchases Redemptions Net change Purchases Redemptions Net change Class R1 $ 777,907 $ (2,026,149) $ (1,248,242) 73,672 (188,397) (114,725)Class R2 42,258 (11) 42,247 4,223 (1) 4,222Class R3 92,960 (249,385) (156,425) 9,151 (24,858) (15,707)Class R4 664,366 (593,045) 71,321 61,812 (56,418) 5,394Class R5 67,590 (365,616) (298,026) 6,350 (35,113) (28,763)Class R6 24,139 — 24,139 2,340 — 2,340Class R7 30,367 (116,971) (86,604) 2,985 (11,847) (8,862)Class R8 27,800 (89,498) (61,698) 2,767 (9,674) (6,907) $ 1,727,387 $ (3,440,675) $ (1,713,288) 163,300 (326,308) (163,008)
966

THE COLLECTIVE INVESTMENT FUNDS OF FIRST MERCANTILE TRUST COMPANY FMT/Virtus Emerging Markets Opportunity Fund
Financial Highlights December 31, 2015
The accompanying notes are an integral part of these financial statements.
Change in Net Asset Value Resulting from Operations Ratios (to average net
assets)
NAV per Unit, Beginning of
Period
Net Investment
Income (Loss)(a)
Net Realized and Unrealized
Gain (Loss) from
Investments(a)
Total from Investment Activities
NAV per Unit, End of
Period Total
Return Expenses
Net Investment
Income (Loss)
Class R1 $ 10.5511 $ 0.0962 $ (1.0123) $ (0.9161) $ 9.6350 (8.68)% (0.42)% 0.92%Class R2(b) 10.0000 0.0959 0.1223 0.2182 10.2182 2.18% (0.63)% 3.36%Class R3 10.4586 0.0411 (0.9865) (0.9454) 9.5132 (9.04)% (0.81)% 0.40%Class R4 10.4088 0.0376 (0.9947) (0.9571) 9.4517 (9.20)% (0.98)% 0.37%Class R5 10.3591 (0.0148) (0.9538) (0.9686) 9.3905 (9.35)% (1.15)% (0.14)%Class R6 10.4401 0.0464 (1.0229) (0.9765) 9.4636 (9.35)% (1.31)% 0.46%Class R7 10.2606 (0.0353) (0.9559) (0.9912) 9.2694 (9.66)% (1.49)% (0.35)%Class R8(c) 9.2759 0.0071 (0.0318) (0.0247) — (0.26)% (0.35)% 0.13%Class R8(d) 10.0000 0.0264 (0.8401) (0.8137) 9.1863 (8.14)% (1.30)% 0.48%
(a) Per unit amounts are based on average daily units outstanding.
(b) For the period from September 23, 2015 (commencement of this class) through
December 31, 2015.
(c) For the period from January 1, 2015 through January 12, 2015.
(d) For the period from June 16, 2015 (recommencement of this class) through December 31, 2015.
967

FMT/Equity Income Index Fund

THE COLLECTIVE INVESTMENT FUNDS OF FIRST MERCANTILE TRUST COMPANY FMT/Equity Income Index Fund Statement of Assets and Liabilities
December 31, 2015
The accompanying notes are an integral part of these financial statements.
Assets Investments in securities, at fair value $ 6,214,040 Liabilities Trustee fees 68 Net assets $ 6,213,972 Components of net assets
Units of
Participation NAV
per Unit Net
Assets Class R1 609,437 $ 9.8967 $ 6,031,444Class R2 10,346 $ 9.8965 102,393Class R4 8,098 $ 9.8963 80,135
$ 6,213,972
968

THE COLLECTIVE INVESTMENT FUNDS OF FIRST MERCANTILE TRUST COMPANY FMT/Equity Income Index Fund
Statement of Operations For the Year Ended December 31, 2015
The accompanying notes are an integral part of these financial statements.
Expenses
Trustee fees $ 68 Net investment loss (68) Change in net unrealized appreciation (depreciation) on investments (64,773) Net decrease in net assets resulting from operations $ (64,841)
969

THE COLLECTIVE INVESTMENT FUNDS OF FIRST MERCANTILE TRUST COMPANY FMT/Equity Income Index Fund
Statement of Changes in Net Assets For the Year Ended December 31, 2015
The accompanying notes are an integral part of these financial statements.
Operations
Net investment loss $ (68)
Change in net unrealized appreciation (depreciation) on investments (64,773)
Net decrease in net assets resulting from operations (64,841) Participant transactions
Proceeds from units purchased 6,381,930Less payments for units redeemed 103,117
Increase in net assets from participant transactions 6,278,813
Total increase in net assets 6,213,972 Net assets at beginning of year — Net assets at end of year $ 6,213,972
970
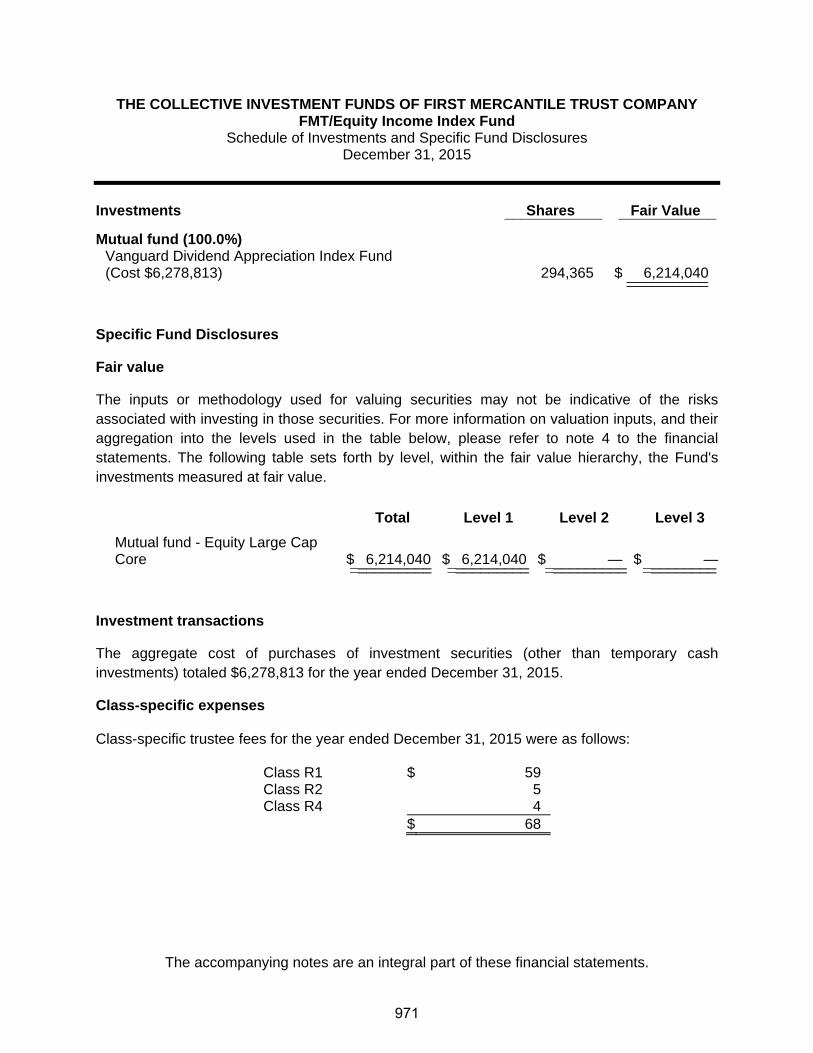
THE COLLECTIVE INVESTMENT FUNDS OF FIRST MERCANTILE TRUST COMPANY FMT/Equity Income Index Fund
Schedule of Investments and Specific Fund Disclosures December 31, 2015
The accompanying notes are an integral part of these financial statements.
Investments Shares Fair Value ____________ ____________
Mutual fund (100.0%)
Vanguard Dividend Appreciation Index Fund (Cost $6,278,813) 294,365 $ 6,214,040 ____________________
Specific Fund Disclosures
Fair value
The inputs or methodology used for valuing securities may not be indicative of the risks associated with investing in those securities. For more information on valuation inputs, and their aggregation into the levels used in the table below, please refer to note 4 to the financial statements. The following table sets forth by level, within the fair value hierarchy, the Fund's investments measured at fair value.
Total Level 1 Level 2 Level 3
Mutual fund - Equity Large Cap Core $ 6,214,040 $ 6,214,040 $ — $ —__________ __________ __________ ___________________ __________ __________ _________
Investment transactions
The aggregate cost of purchases of investment securities (other than temporary cash investments) totaled $6,278,813 for the year ended December 31, 2015.
Class-specific expenses Class-specific trustee fees for the year ended December 31, 2015 were as follows: Class R1 $ 59 Class R2 5 Class R4 4 $ 68
971
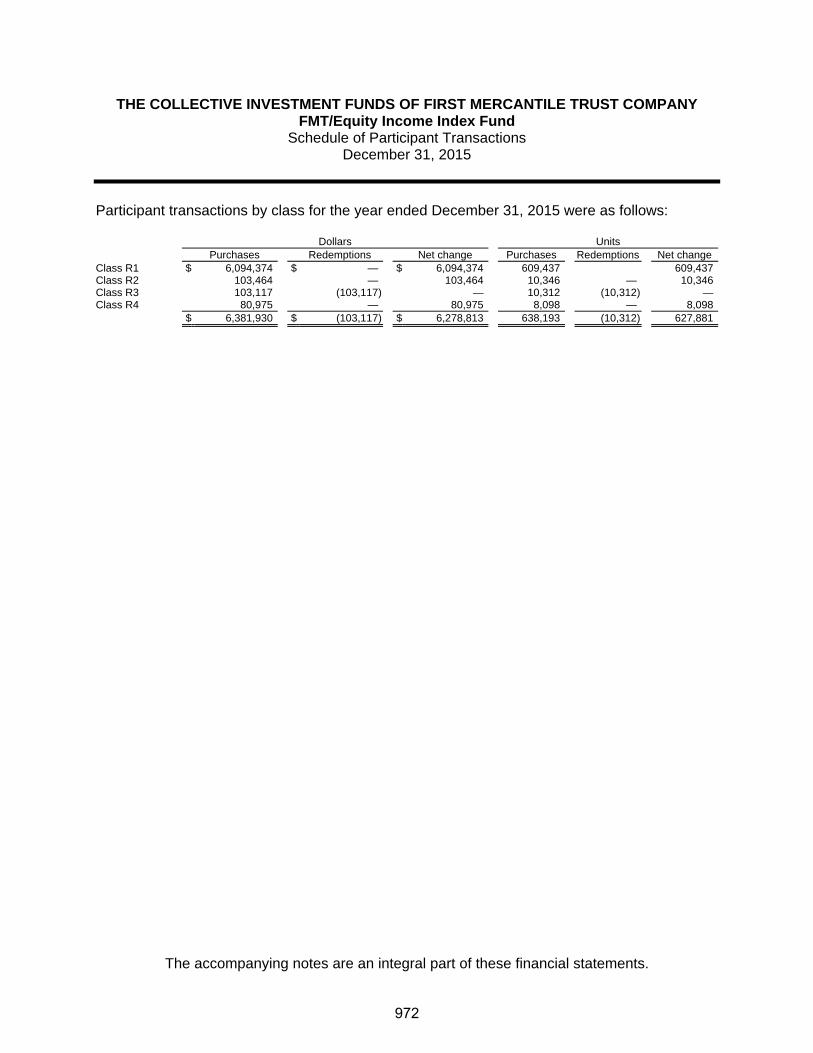
THE COLLECTIVE INVESTMENT FUNDS OF FIRST MERCANTILE TRUST COMPANY FMT/Equity Income Index Fund
Schedule of Participant Transactions December 31, 2015
The accompanying notes are an integral part of these financial statements.
Participant transactions by class for the year ended December 31, 2015 were as follows: Dollars Units Purchases Redemptions Net change Purchases Redemptions Net change Class R1 $ 6,094,374 $ — $ 6,094,374 609,437 609,437Class R2 103,464 — 103,464 10,346 — 10,346Class R3 103,117 (103,117) — 10,312 (10,312) —Class R4 80,975 — 80,975 8,098 — 8,098 $ 6,381,930 $ (103,117) $ 6,278,813 638,193 (10,312) 627,881
972
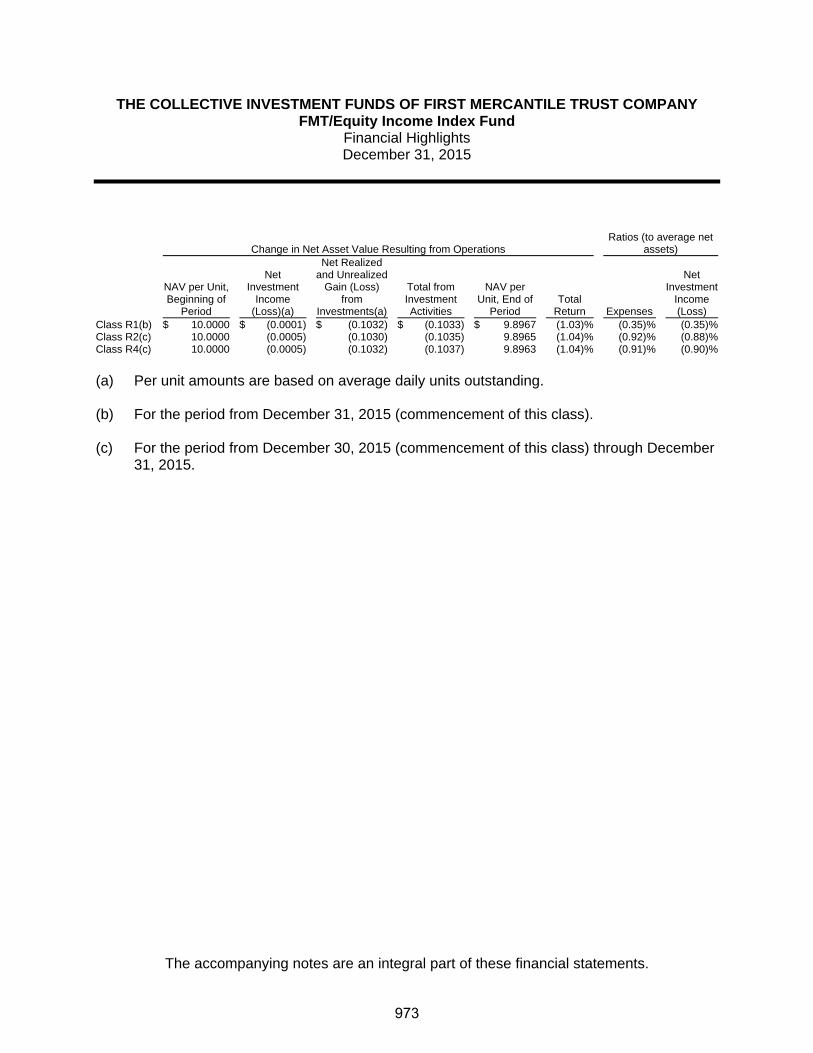
THE COLLECTIVE INVESTMENT FUNDS OF FIRST MERCANTILE TRUST COMPANY FMT/Equity Income Index Fund
Financial Highlights December 31, 2015
The accompanying notes are an integral part of these financial statements.
Change in Net Asset Value Resulting from Operations Ratios (to average net
assets)
NAV per Unit, Beginning of
Period
Net Investment
Income (Loss)(a)
Net Realized and Unrealized
Gain (Loss) from
Investments(a)
Total from Investment Activities
NAV per Unit, End of
Period Total
Return Expenses
Net Investment
Income (Loss)
Class R1(b) $ 10.0000 $ (0.0001) $ (0.1032) $ (0.1033) $ 9.8967 (1.03)% (0.35)% (0.35)%Class R2(c) 10.0000 (0.0005) (0.1030) (0.1035) 9.8965 (1.04)% (0.92)% (0.88)%Class R4(c) 10.0000 (0.0005) (0.1032) (0.1037) 9.8963 (1.04)% (0.91)% (0.90)%
(a) Per unit amounts are based on average daily units outstanding.
(b) For the period from December 31, 2015 (commencement of this class).
(c) For the period from December 30, 2015 (commencement of this class) through December
31, 2015.
973
FMT/Wells Fargo Advantage Discovery Fund
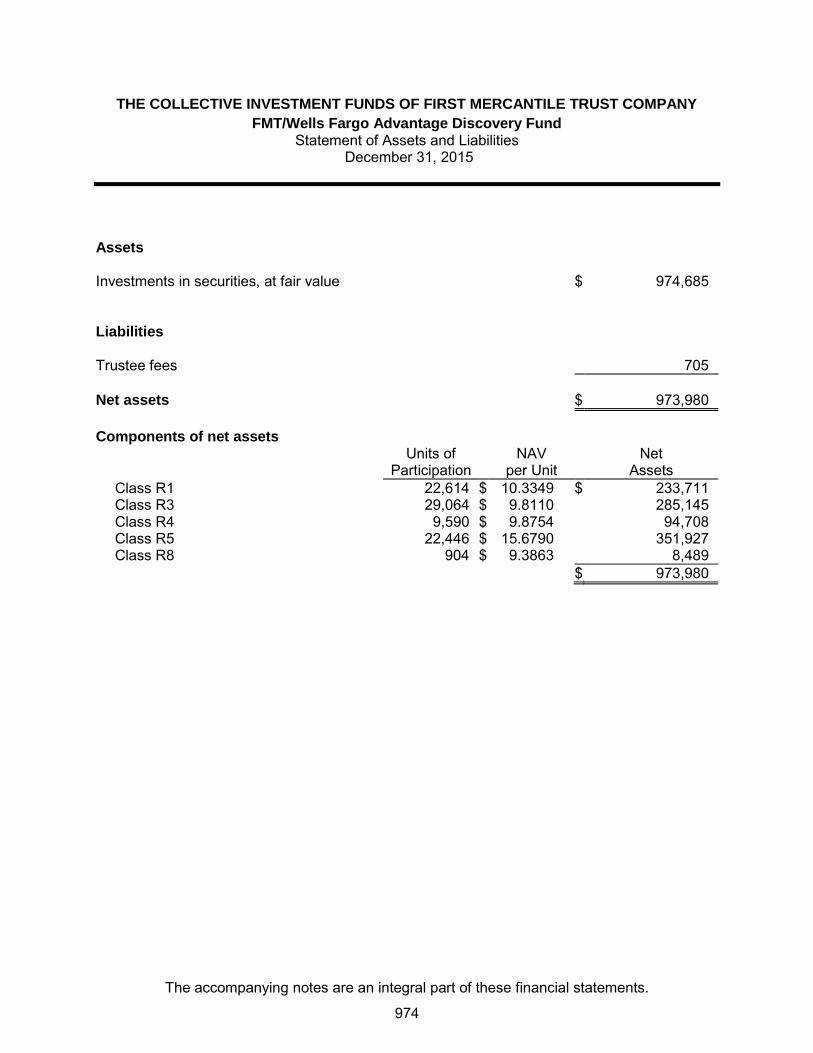
THE COLLECTIVE INVESTMENT FUNDS OF FIRST MERCANTILE TRUST COMPANY
FMT/Wells Fargo Advantage Discovery Fund Statement of Assets and Liabilities
December 31, 2015
The accompanying notes are an integral part of these financial statements.
Assets Investments in securities, at fair value $ 974,685 Liabilities Trustee fees 705
Net assets $ 973,980
Components of net assets
Units of
Participation NAV
per Unit Net
Assets Class R1 22,614 $ 10.3349 $ 233,711
Class R3 29,064 $ 9.8110 285,145
Class R4 9,590 $ 9.8754 94,708
Class R5 22,446 $ 15.6790 351,927
Class R8 904 $ 9.3863 8,489
$ 973,980
974

THE COLLECTIVE INVESTMENT FUNDS OF FIRST MERCANTILE TRUST COMPANY
FMT/Wells Fargo Advantage Discovery Fund Statement of Operations
For the Year Ended December 31, 2015
The accompanying notes are an integral part of these financial statements.
Investment income
Dividends $ 78,004
Expenses
Trustee fees 10,515
Audit fees 1,200
Custody fees 462
12,177
Net investment income 65,827
Net realized gain from investments sold
Proceeds from sales of investments 613,993
Cost of investments sold 612,044
Net realized gain from investments sold 1,949
Change in net unrealized appreciation (depreciation) on investments (98,119)
Net realized and unrealized loss on investments (96,170)
Other operating credits (charges) 4,489
Net decrease in net assets resulting from operations $ (25,854)
975
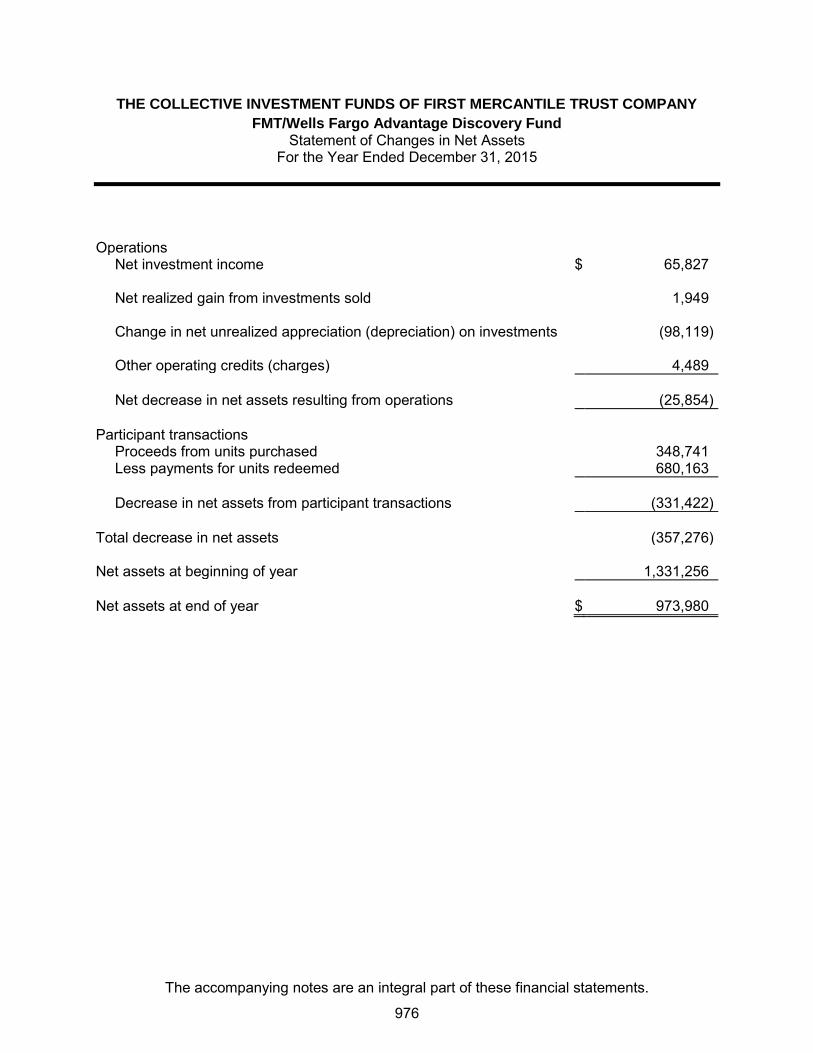
THE COLLECTIVE INVESTMENT FUNDS OF FIRST MERCANTILE TRUST COMPANY
FMT/Wells Fargo Advantage Discovery Fund Statement of Changes in Net Assets
For the Year Ended December 31, 2015
The accompanying notes are an integral part of these financial statements.
Operations
Net investment income $ 65,827
Net realized gain from investments sold 1,949
Change in net unrealized appreciation (depreciation) on investments (98,119)
Other operating credits (charges) 4,489
Net decrease in net assets resulting from operations (25,854)
Participant transactions
Proceeds from units purchased 348,741
Less payments for units redeemed 680,163
Decrease in net assets from participant transactions (331,422)
Total decrease in net assets (357,276)
Net assets at beginning of year 1,331,256
Net assets at end of year $ 973,980
976

THE COLLECTIVE INVESTMENT FUNDS OF FIRST MERCANTILE TRUST COMPANY FMT/Wells Fargo Advantage Discovery Fund
Schedule of Investments and Specific Fund Disclosures December 31, 2015
The accompanying notes are an integral part of these financial statements.
Investments Shares Fair Value ____________ ____________
Mutual fund (100.1%)
Wells Fargo Advantage Discovery Fund (Cost $1,077,213) 32,544 $ 974,685 __________ __________
Specific Fund Disclosures
Fair value
The inputs or methodology used for valuing securities may not be indicative of the risks associated with investing in those securities. For more information on valuation inputs, and their aggregation into the levels used in the table below, please refer to note 4 to the financial statements. The following table sets forth by level, within the fair value hierarchy, the Fund's investments measured at fair value.
Total Level 1 Level 2 Level 3
Mutual fund - Mid Cap Growth $ 974,685 $ 974,685 $ — $ — __________ __________ __________ _________ __________ __________ __________ _________
Investment transactions
The aggregate cost of purchases of investment securities and proceeds from sales of investment securities (other than temporary cash investments) totaled $352,647 and $613,993, respectively, for the year ended December 31, 2015.
Class-specific expenses Class-specific trustee fees for the year ended December 31, 2015 were as follows: Class R1 $ 1,044 Class R3 2,167 Class R4 2,667 Class R5 4,581 Class R8 56 $ 10,515
977

THE COLLECTIVE INVESTMENT FUNDS OF FIRST MERCANTILE TRUST COMPANY
FMT/Wells Fargo Advantage Discovery Fund Schedule of Participant Transactions
December 31, 2015
The accompanying notes are an integral part of these financial statements.
Participant transactions by class for the year ended December 31, 2015 were as follows: Dollars Units Purchases Redemptions Net change Purchases Redemptions Net change Class R1 $ 66,229 $ (130,168) $ (63,939) 6,178 (12,179) (6,001) Class R3 135,844 (101,013) 34,831 12,726 (9,452) 3,274 Class R4 96,280 (293,706) (197,426) 9,479 (29,447) (19,968) Class R5 41,441 (75,465) (34,024) 2,456 (4,696) (2,240) Class R8 8,947 (79,811) (70,864) 905 (7,939) (7,034) $ 348,741 $ (680,163) $ (331,422) 31,744 (63,713) (31,969)
978

THE COLLECTIVE INVESTMENT FUNDS OF FIRST MERCANTILE TRUST COMPANY
FMT/Wells Fargo Advantage Discovery Fund Financial Highlights December 31, 2015
The accompanying notes are an integral part of these financial statements.
Change in Net Asset Value Resulting from Operations Ratios (to average net
assets)
NAV per Unit, Beginning of
Period
Net Investment
Income (Loss)(a)
Net Realized and Unrealized
Gain (Loss) from
Investments(a)
Total from Investment Activities
NAV per Unit, End of
Period Total
Return Expenses
Net Investment
Income (Loss)
Class R1 $ 10.4858 $ 0.6960 $ (0.8469) $ (0.1509) $ 10.3349 (1.44) % (0.48) % 6.35 % Class R3 9.9935 0.7509 (0.9334) (0.1825) 9.8110 (1.83) % (0.87) % 7.21 % Class R4 10.0761 0.0407 (0.2414) (0.2007) 9.8754 (1.99) % (1.04) % 0.39 % Class R5 16.0252 1.1215 (1.4677) (0.3462) 15.6790 (2.16) % (1.21) % 6.72 % Class R8(b) 10.0830 0.1385 (0.1685) (0.0300) — (0.30) % (0.43) % 4.43 % Class R8(c) 10.0000 0.4183 (1.0320) (0.6137) 9.3863 (6.14) % (1.28) % 13.38 % (a) Per unit amounts are based on average daily units outstanding.
(b) For the period from January 1, 2015 through January 2, 2015.
(c) For the period from September 9, 2015 (recommencement of this class) through
December 31, 2015.
979

FMT Global Infrastructure (Miller/Howard) Fund

THE COLLECTIVE INVESTMENT FUNDS OF FIRST MERCANTILE TRUST COMPANY FMT Global Infrastructure (Miller/Howard) Fund
Statement of Assets and Liabilities December 31, 2015
The accompanying notes are an integral part of these financial statements.
Assets Investments in securities, at fair value $ 50,634,353 Cash equivalents 1,196,534Receivables
Dividends and interest 148,282Dividend tax reclaim 8,966
Total assets 51,988,135 Liabilities Trustee fees 21,252Sub-advisor fees 19,499
Total liabilities 40,751 Net assets $ 51,947,384 Components of net assets
Units of
Participation NAV
per Unit Net
Assets Class R1 1,136,899 $ 16.1782 $ 18,392,984Class R2 400,389 $ 12.4108 4,969,158Class R3 185,389 $ 12.1135 2,245,704Class R4 496,796 $ 12.6030 6,261,101Class R5 243,266 $ 12.1158 2,947,366Class R6 133,372 $ 12.2756 1,637,212Class R7 120,343 $ 11.9100 1,433,278Class R8 74,417 $ 12.1681 905,513Class LifeStyle 13,155,068
$ 51,947,384
980

THE COLLECTIVE INVESTMENT FUNDS OF FIRST MERCANTILE TRUST COMPANY FMT Global Infrastructure (Miller/Howard) Fund
Statement of Operations For the Year Ended December 31, 2015
The accompanying notes are an integral part of these financial statements.
Investment income
Dividends (net of foreign withholding taxes of $8,372) $ 1,988,969Interest 720
1,989,689 Expenses
Trustee fees 393,954Sub-advisor fees 262,738Custody fees 15,469Audit fees 5,813
677,974 Net investment income 1,311,715 Net realized gain from investments sold
Proceeds from sales of investments 22,161,097Cost of investments sold 19,836,412
Net realized gain from investments sold 2,324,685 Change in net unrealized appreciation (depreciation) on investments (12,651,335) Net realized and unrealized loss on investments (10,326,650) Other operating credits (charges) 133 Net decrease in net assets resulting from operations $ (9,014,802)
981
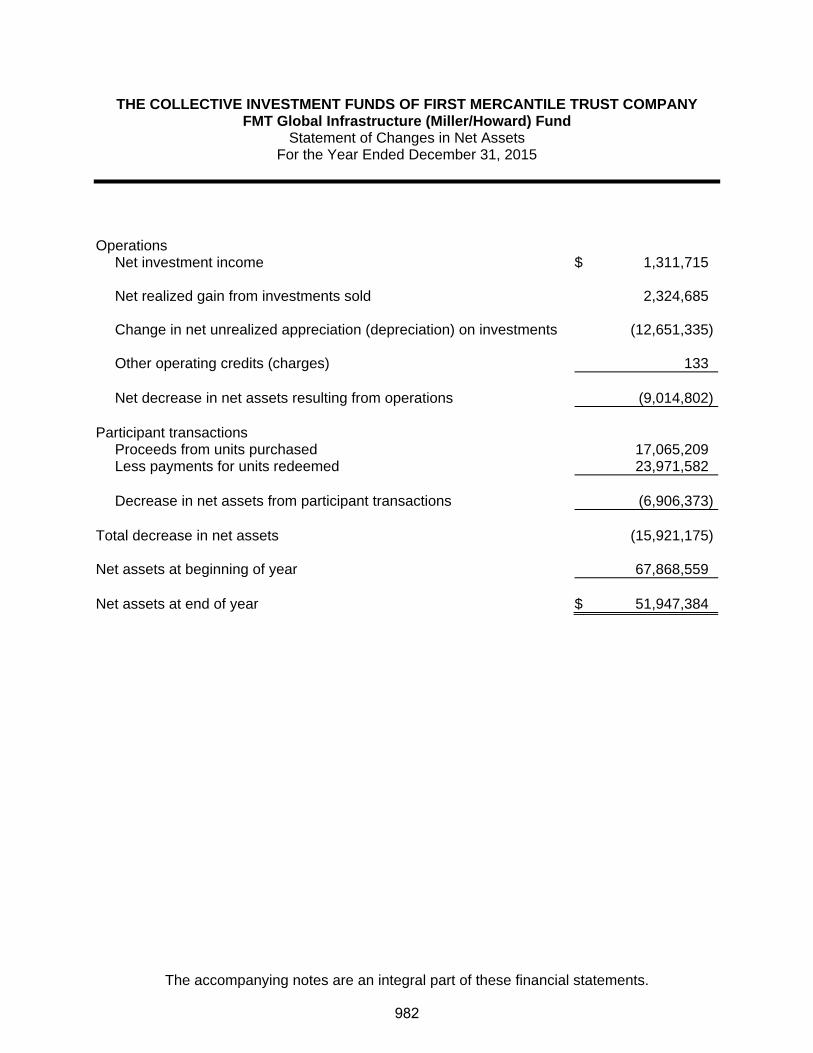
THE COLLECTIVE INVESTMENT FUNDS OF FIRST MERCANTILE TRUST COMPANY FMT Global Infrastructure (Miller/Howard) Fund
Statement of Changes in Net Assets For the Year Ended December 31, 2015
The accompanying notes are an integral part of these financial statements.
Operations
Net investment income $ 1,311,715
Net realized gain from investments sold 2,324,685
Change in net unrealized appreciation (depreciation) on investments (12,651,335)
Other operating credits (charges) 133
Net decrease in net assets resulting from operations (9,014,802) Participant transactions
Proceeds from units purchased 17,065,209Less payments for units redeemed 23,971,582
Decrease in net assets from participant transactions (6,906,373)
Total decrease in net assets (15,921,175) Net assets at beginning of year 67,868,559 Net assets at end of year $ 51,947,384
982
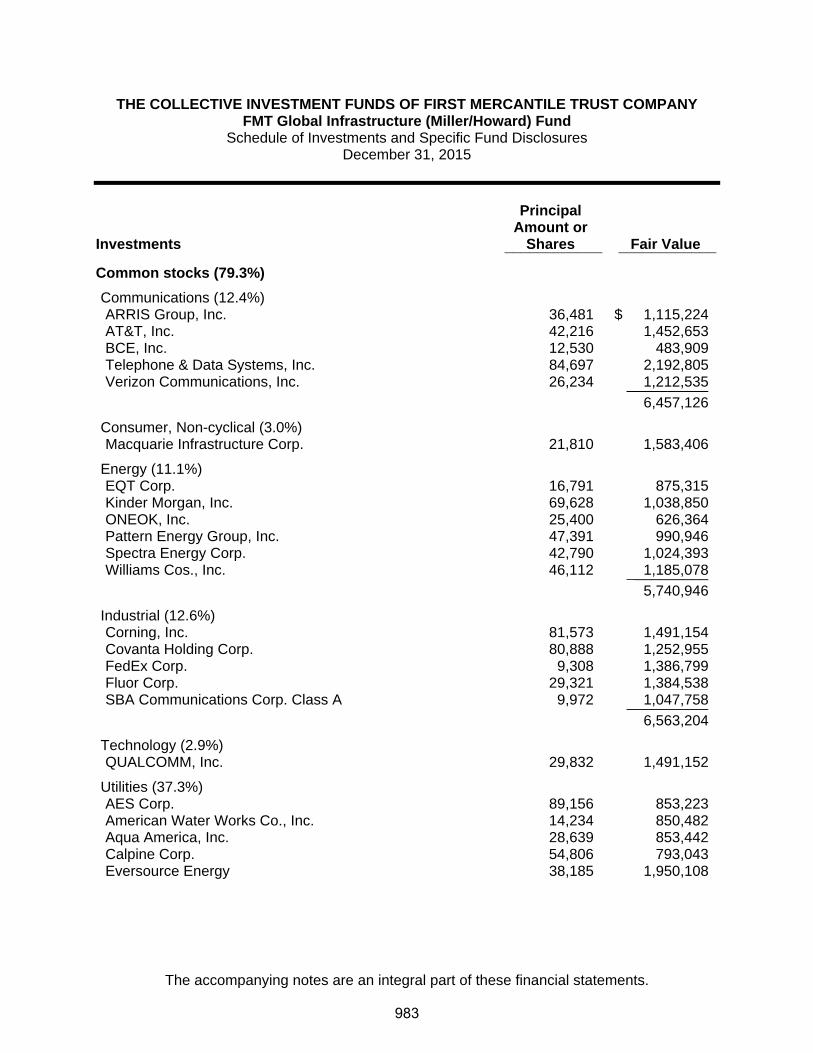
THE COLLECTIVE INVESTMENT FUNDS OF FIRST MERCANTILE TRUST COMPANY FMT Global Infrastructure (Miller/Howard) Fund
Schedule of Investments and Specific Fund Disclosures December 31, 2015
The accompanying notes are an integral part of these financial statements.
Investments
Principal Amount or
Shares Fair Value ____________ ____________
Common stocks (79.3%)
Communications (12.4%) ARRIS Group, Inc. 36,481 $ 1,115,224 AT&T, Inc. 42,216 1,452,653 BCE, Inc. 12,530 483,909 Telephone & Data Systems, Inc. 84,697 2,192,805 Verizon Communications, Inc. 26,234 1,212,535 __________ 6,457,126
Consumer, Non-cyclical (3.0%) Macquarie Infrastructure Corp. 21,810 1,583,406
Energy (11.1%) EQT Corp. 16,791 875,315 Kinder Morgan, Inc. 69,628 1,038,850 ONEOK, Inc. 25,400 626,364 Pattern Energy Group, Inc. 47,391 990,946 Spectra Energy Corp. 42,790 1,024,393 Williams Cos., Inc. 46,112 1,185,078 __________ 5,740,946
Industrial (12.6%) Corning, Inc. 81,573 1,491,154 Covanta Holding Corp. 80,888 1,252,955 FedEx Corp. 9,308 1,386,799 Fluor Corp. 29,321 1,384,538 SBA Communications Corp. Class A 9,972 1,047,758 __________ 6,563,204
Technology (2.9%) QUALCOMM, Inc. 29,832 1,491,152
Utilities (37.3%) AES Corp. 89,156 853,223 American Water Works Co., Inc. 14,234 850,482 Aqua America, Inc. 28,639 853,442 Calpine Corp. 54,806 793,043 Eversource Energy 38,185 1,950,108
983

THE COLLECTIVE INVESTMENT FUNDS OF FIRST MERCANTILE TRUST COMPANY FMT Global Infrastructure (Miller/Howard) Fund
Schedule of Investments and Specific Fund Disclosures (continued) December 31, 2015
The accompanying notes are an integral part of these financial statements.
Investments
Principal Amount or
Shares Fair Value ____________ ____________
Common stocks (continued)
Utilities (continued) ITC Holdings Corp. 64,077 $ 2,515,022 MDU Resources Group, Inc. 126,137 2,310,830 National Fuel Gas Co. 25,656 1,096,794 NiSource, Inc. 29,917 583,681 OGE Energy Corp. 64,810 1,703,855 Ormat Technologies, Inc. 16,536 603,068 Questar Corp. 83,275 1,622,197 Sempra Energy 17,047 1,602,588 UGI Corp. 60,261 2,034,411 __________ 19,372,744 __________ Total Common stocks (Cost $43,598,220) 41,208,578
Depository receipts (9.3%)
Communications (3.0%) Telefonaktiebolaget LM Ericsson ADR 106,449 1,022,975 Vodafone Group PLC ADR 16,621 536,193 __________ 1,559,168
Utilities (6.3%) National Grid PLC ADR 16,791 1,167,646 Veolia Environnement S.A. ADR 88,644 2,091,112 __________ 3,258,758 __________ Total Depository receipts (Cost $4,930,215) 4,817,926
Limited partnership (5.0%) Enterprise Products Partners L.P. 76,547 1,958,072 NextEra Energy Partners L.P. 21,223 633,507 Total Depository receipts (Cost $2,004,309) 2,591,579
Real estate investment trust (3.9%) American Tower Corp. (Cost $1,462,321) 20,797 2,016,270 __________Total Investments (Cost $51,995,065) $ 50,634,353 ____________________
984

THE COLLECTIVE INVESTMENT FUNDS OF FIRST MERCANTILE TRUST COMPANY FMT Global Infrastructure (Miller/Howard) Fund
Schedule of Investments and Specific Fund Disclosures (continued) December 31, 2015
The accompanying notes are an integral part of these financial statements.
Specific Fund Disclosures Fair value The inputs or methodology used for valuing securities may not be indicative of the risks associated with investing in those securities. For more information on valuation inputs, and their aggregation into the levels used in the table below, please refer to note 4 to the financial statements. The following table sets forth by level, within the fair value hierarchy, the Fund's investments measured at fair value.
Total Level 1 Level 2 Level 3
Common stocks $ 41,208,578 $ 41,208,578 $ — $ —Depository receipts 4,817,926 4,817,926 — —Limited partnership 2,591,579 2,591,579 — —Real estate investment trust 2,016,270 2,016,270 — —__________ __________ __________ _________
$ 50,634,353 $ 50,634,353 $ — $ —__________ __________ __________ ___________________ __________ __________ _________ Investment transactions The aggregate cost of purchases of investment securities and proceeds from sales of investment securities (other than temporary cash investments) totaled $15,839,921 and $22,161,097, respectively, for the year ended December 31, 2015. Class-specific expenses Class-specific trustee fees for the year ended December 31, 2015 were as follows: Class R1 $ 72,087 Class R2 28,986 Class R3 20,108 Class R4 67,763 Class R5 45,435 Class R6 23,290 Class R7 23,798 Class R8 15,656 Class LifeStyle 96,831 $ 393,954
985

THE COLLECTIVE INVESTMENT FUNDS OF FIRST MERCANTILE TRUST COMPANY FMT Global Infrastructure (Miller/Howard) Fund
Schedule of Participant Transactions December 31, 2015
The accompanying notes are an integral part of these financial statements.
Participant transactions by class for the year ended December 31, 2015 were as follows: Dollars Units Purchases Redemptions Net change Purchases Redemptions Net change Class R1 $ 4,620,247 $ (4,944,452) $ (324,205) 260,192 (279,186) (18,994)Class R2 1,549,125 (1,230,676) 318,449 117,323 (87,908) 29,415Class R3 2,630,194 (2,658,578) (28,384) 189,026 (196,632) (7,606)Class R4 2,692,306 (3,398,535) (706,229) 190,305 (239,497) (49,192)Class R5 593,170 (2,732,553) (2,139,383) 44,942 (199,906) (154,964)Class R6 254,702 (521,485) (266,783) 19,589 (37,429) (17,840)Class R7 250,057 (651,790) (401,733) 19,265 (48,347) (29,082)Class R8 145,210 (151,284) (6,074) 10,727 (11,115) (388)Class LifeStyle 4,330,198 (7,682,229) (3,352,031) — — — $ 17,065,209 $ (23,971,582) $ (6,906,373) 851,369 (1,100,020) (248,651)
986

THE COLLECTIVE INVESTMENT FUNDS OF FIRST MERCANTILE TRUST COMPANY FMT Global Infrastructure (Miller/Howard) Fund
Financial Highlights December 31, 2015
The accompanying notes are an integral part of these financial statements.
Change in Net Asset Value Resulting from Operations Ratios (to average net
assets)
NAV per Unit, Beginning of
Period
Net Investment
Income (Loss)(a)
Net Realized and Unrealized
Gain (Loss) from
Investments(a)
Total from Investment Activities
NAV per Unit, End of
Period Total
Return Expenses
Net Investment
Income (Loss)
Class R1 $ 18.8360 $ 0.4396 $ (3.0974) $ (2.6578) $ 16.1782 (14.11)% (0.82)% 2.45%Class R2 14.4817 0.3081 (2.3790) (2.0709) 12.4108 (14.30)% (1.04)% 2.24%Class R3 14.1589 0.2773 (2.3227) (2.0454) 12.1135 (14.45)% (1.21)% 2.05%Class R4 14.7563 0.2647 (2.4180) (2.1533) 12.6030 (14.59)% (1.38)% 1.89%Class R5 14.2102 0.2315 (2.3259) (2.0944) 12.1158 (14.74)% (1.55)% 1.71%Class R6 14.4222 0.2122 (2.3588) (2.1466) 12.2756 (14.88)% (1.72)% 1.55%Class R7 14.0166 0.1837 (2.2903) (2.1066) 11.9100 (15.03)% (1.89)% 1.38%Class R8 14.3450 0.1653 (2.3422) (2.1769) 12.1681 (15.18)% (2.06)% 1.22%
(a) Per unit amounts are based on average daily units outstanding.
987

FMT/BlackRock Global Allocation Fund

THE COLLECTIVE INVESTMENT FUNDS OF FIRST MERCANTILE TRUST COMPANY
FMT/BlackRock Global Allocation Fund Statement of Assets and Liabilities
December 31, 2015
The accompanying notes are an integral part of these financial statements.
Assets Investments in securities, at fair value $ 19,190,036 Liabilities Trustee fees 10,187
Net assets $ 19,179,849
Components of net assets
Units of
Participation NAV
per Unit Net
Assets Class R1 506,634 $ 13.9334 $ 7,059,154
Class R2 315,843 $ 12.7176 4,016,753
Class R3 316,050 $ 12.3694 3,909,347
Class R4 231,364 $ 12.6307 2,922,293
Class R5 40,395 $ 11.9301 481,912
Class R6 54,236 $ 12.1064 656,605
Class R7 1,433 $ 9.8108 14,060
Class R8 10,492 $ 11.4111 119,725
$ 19,179,849
988

THE COLLECTIVE INVESTMENT FUNDS OF FIRST MERCANTILE TRUST COMPANY
FMT/BlackRock Global Allocation Fund Statement of Operations
For the Year Ended December 31, 2015
The accompanying notes are an integral part of these financial statements.
Investment income
Dividends $ 1,708,810
Expenses
Trustee fees 127,830
Custody fees 7,223
Audit fees 1,200
136,253
Net investment income 1,572,557
Net realized gain from investments sold
Proceeds from sales of investments 5,575,552
Cost of investments sold 5,446,498
Net realized gain from investments sold 129,054
Change in net unrealized appreciation (depreciation) on investments (2,013,676)
Net realized and unrealized loss on investments (1,884,622)
Other operating credits (charges) 104,806
Net decrease in net assets resulting from operations $ (207,259)
989

THE COLLECTIVE INVESTMENT FUNDS OF FIRST MERCANTILE TRUST COMPANY
FMT/BlackRock Global Allocation Fund Statement of Changes in Net Assets
For the Year Ended December 31, 2015
The accompanying notes are an integral part of these financial statements.
Operations
Net investment income $ 1,572,557
Net realized gain from investments sold 129,054
Change in net unrealized appreciation (depreciation) on investments (2,013,676)
Other operating credits (charges) 104,806
Net decrease in net assets resulting from operations (207,259)
Participant transactions
Proceeds from units purchased 4,631,003
Less payments for units redeemed 7,362,610
Decrease in net assets from participant transactions (2,731,607)
Total decrease in net assets (2,938,866)
Net assets at beginning of year 22,118,715
Net assets at end of year $ 19,179,849
990
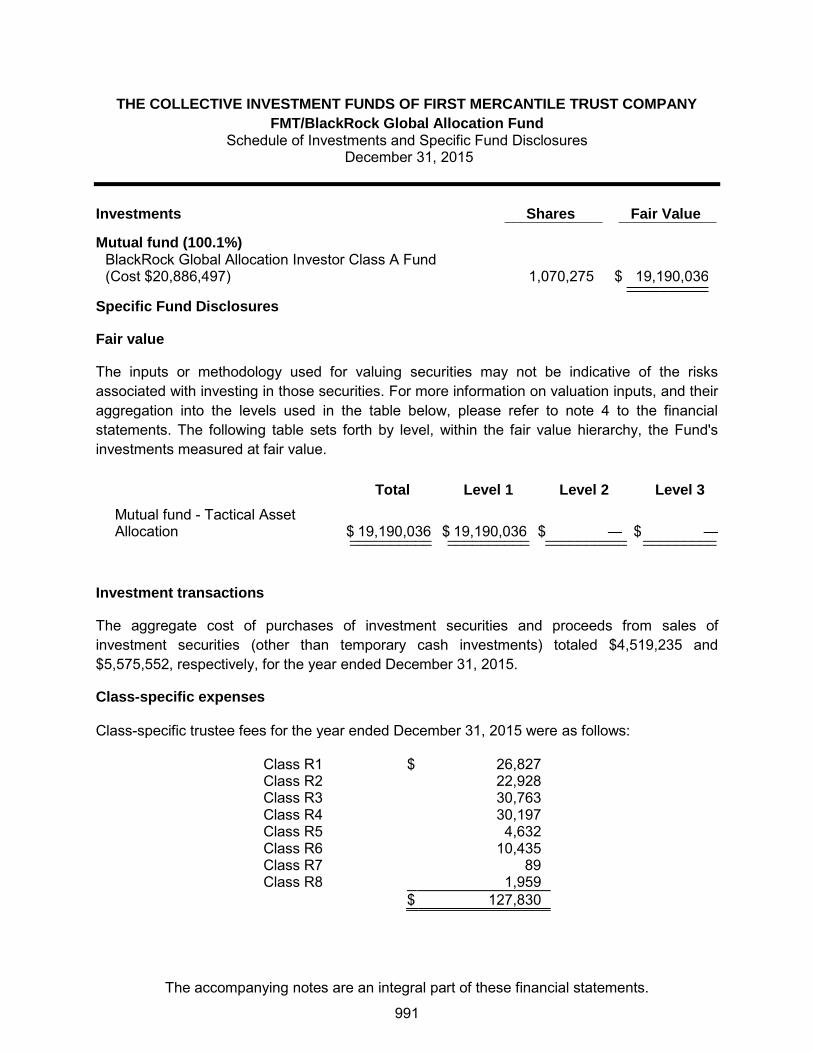
THE COLLECTIVE INVESTMENT FUNDS OF FIRST MERCANTILE TRUST COMPANY
FMT/BlackRock Global Allocation Fund Schedule of Investments and Specific Fund Disclosures
December 31, 2015
The accompanying notes are an integral part of these financial statements.
Investments Shares Fair Value ____________ ____________
Mutual fund (100.1%)
BlackRock Global Allocation Investor Class A Fund (Cost $20,886,497) 1,070,275 $ 19,190,036 __________ __________
Specific Fund Disclosures
Fair value
The inputs or methodology used for valuing securities may not be indicative of the risks associated with investing in those securities. For more information on valuation inputs, and their aggregation into the levels used in the table below, please refer to note 4 to the financial statements. The following table sets forth by level, within the fair value hierarchy, the Fund's investments measured at fair value.
Total Level 1 Level 2 Level 3
Mutual fund - Tactical Asset Allocation $ 19,190,036 $ 19,190,036 $ — $ — __________ __________ __________ _________ __________ __________ __________ _________
Investment transactions
The aggregate cost of purchases of investment securities and proceeds from sales of investment securities (other than temporary cash investments) totaled $4,519,235 and $5,575,552, respectively, for the year ended December 31, 2015.
Class-specific expenses Class-specific trustee fees for the year ended December 31, 2015 were as follows: Class R1 $ 26,827 Class R2 22,928 Class R3 30,763 Class R4 30,197 Class R5 4,632 Class R6 10,435 Class R7 89 Class R8 1,959 $ 127,830
991
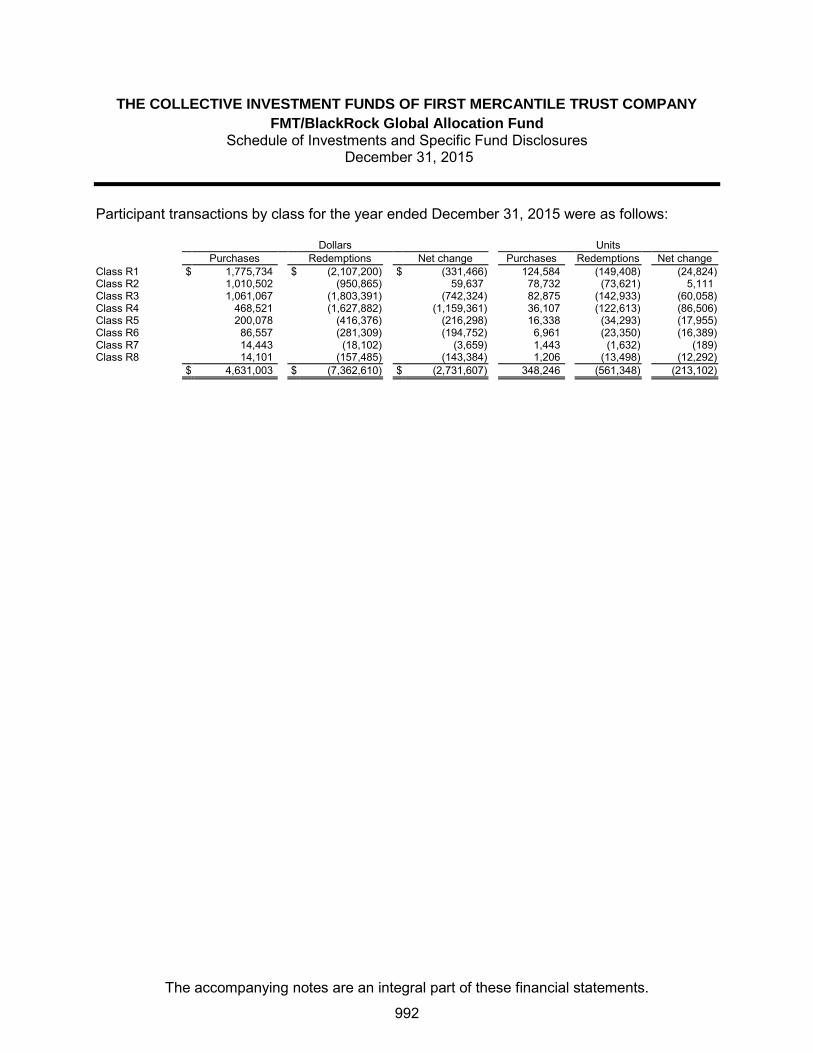
THE COLLECTIVE INVESTMENT FUNDS OF FIRST MERCANTILE TRUST COMPANY
FMT/BlackRock Global Allocation Fund Schedule of Investments and Specific Fund Disclosures
December 31, 2015
The accompanying notes are an integral part of these financial statements.
Participant transactions by class for the year ended December 31, 2015 were as follows: Dollars Units Purchases Redemptions Net change Purchases Redemptions Net change Class R1 $ 1,775,734 $ (2,107,200) $ (331,466) 124,584 (149,408) (24,824) Class R2 1,010,502 (950,865) 59,637 78,732 (73,621) 5,111 Class R3 1,061,067 (1,803,391) (742,324) 82,875 (142,933) (60,058) Class R4 468,521 (1,627,882) (1,159,361) 36,107 (122,613) (86,506) Class R5 200,078 (416,376) (216,298) 16,338 (34,293) (17,955) Class R6 86,557 (281,309) (194,752) 6,961 (23,350) (16,389) Class R7 14,443 (18,102) (3,659) 1,443 (1,632) (189) Class R8 14,101 (157,485) (143,384) 1,206 (13,498) (12,292) $ 4,631,003 $ (7,362,610) $ (2,731,607) 348,246 (561,348) (213,102)
992

THE COLLECTIVE INVESTMENT FUNDS OF FIRST MERCANTILE TRUST COMPANY
FMT/BlackRock Global Allocation Fund Financial Highlights December 31, 2015
The accompanying notes are an integral part of these financial statements.
Change in Net Asset Value Resulting from Operations Ratios (to average net
assets)
NAV per Unit, Beginning of
Period
Net Investment
Income (Loss)(a)
Net Realized and Unrealized
Gain (Loss) from
Investments(a)
Total from Investment Activities
NAV per Unit, End of
Period Total
Return Expenses
Net Investment
Income (Loss)
Class R1 $ 14.0608 $ 0.2621 $ (0.3895) $ (0.1274) $ 13.9334 (0.91) % (0.39) % 8.36 % Class R2 12.8621 0.2792 (0.4237) (0.1445) 12.7176 (1.12) % (0.61) % 8.72 % Class R3 12.5313 0.2528 (0.4147) (0.1619) 12.3694 (1.29) % (0.78) % 8.13 % Class R4 12.8179 0.2509 (0.4381) (0.1872) 12.6307 (1.46) % (0.95) % 7.40 % Class R5 12.1275 0.3220 (0.5194) (0.1974) 11.9301 (1.63) % (1.12) % 9.28 % Class R6 12.3278 0.1817 (0.4031) (0.2214) 12.1064 (1.80) % (1.29) % 6.25 % Class R7(b) 11.0055 0.1542 (0.0703) 0.0839 — 0.76 % (0.28) % 3.55 % Class R7(c) 10.0000 0.6386 (0.8278) (0.1892) 9.8108 (1.89) % (1.18) % 14.69 % Class R8 11.6594 0.2480 (0.4963) (0.2483) 11.4111 (2.13) % (1.63) % 7.50 % (a) Per unit amounts are based on average daily units outstanding.
(b) For the period from January 1, 2015 through January 25, 2015.
(c) For the period from August 21, 2015 (recommencement of this class) through December
31, 2015.
993

FMT/DFA Commodity Strategy Portfolio Fund

THE COLLECTIVE INVESTMENT FUNDS OF FIRST MERCANTILE TRUST COMPANY FMT/DFA Commodity Strategy Portfolio Fund
Statement of Assets and Liabilities December 31, 2015
The accompanying notes are an integral part of these financial statements.
Assets Investments in securities, at fair value $ 16,378,280 Liabilities Trustee fees 261 Net assets $ 16,378,019 Components of net assets
Units of
Participation NAV
per Unit Net
Assets Class R1 57,121 $ 5.6952 $ 325,313Class R2 8,472 $ 5.6266 47,670Class R3 7,521 $ 5.5527 41,763Class R5 3,734 $ 5.6316 21,030Class R6 5,153 $ 5.5915 28,816Class R7 3,281 $ 5.5970 18,365Class R8 1,485 $ 5.2952 7,866Class LifeStyle 15,887,196
$ 16,378,019
994

THE COLLECTIVE INVESTMENT FUNDS OF FIRST MERCANTILE TRUST COMPANY FMT/DFA Commodity Strategy Portfolio Fund
Statement of Operations For the Year Ended December 31, 2015
The accompanying notes are an integral part of these financial statements.
Investment income
Dividends $ 25,126 Expenses
Trustee fees 132,141Custody fees 8,451Audit fees 1,805
142,397 Net investment loss (117,271) Net realized loss from investments sold
Proceeds from sales of investments 6,481,123Cost of investments sold 9,214,786
Net realized loss from investments sold (2,733,663) Change in net unrealized appreciation (depreciation) on investments (2,951,018) Net realized and unrealized loss on investments (5,684,681) Other operating credits (charges) 198 Net decrease in net assets resulting from operations $ (5,801,754)
995

THE COLLECTIVE INVESTMENT FUNDS OF FIRST MERCANTILE TRUST COMPANY FMT/DFA Commodity Strategy Portfolio Fund
Statement of Changes in Net Assets For the Year Ended December 31, 2015
The accompanying notes are an integral part of these financial statements.
Operations
Net investment loss $ (117,271)
Net realized loss from investments sold (2,733,663)
Change in net unrealized appreciation (depreciation) on investments (2,951,018)
Other operating credits (charges) 198
Net decrease in net assets resulting from operations (5,801,754) Participant transactions
Proceeds from units purchased 6,604,891Less payments for units redeemed 10,521,944
Decrease in net assets from participant transactions (3,917,053)
Total decrease in net assets (9,718,807) Net assets at beginning of year 26,096,826 Net assets at end of year $ 16,378,019
996

THE COLLECTIVE INVESTMENT FUNDS OF FIRST MERCANTILE TRUST COMPANY FMT/DFA Commodity Strategy Portfolio Fund
Schedule of Investments and Specific Fund Disclosures December 31, 2015
The accompanying notes are an integral part of these financial statements.
Investments Shares Fair Value ____________ ____________
Mutual fund (100.0%)
DFA Commodity Strategy Portfolio Fund (Cost $27,447,061) 3,072,848 $ 16,378,280 ____________________
Specific Fund Disclosures Fair value The inputs or methodology used for valuing securities may not be indicative of the risks associated with investing in those securities. For more information on valuation inputs, and their aggregation into the levels used in the table below, please refer to note 4 to the financial statements. The following table sets forth by level, within the fair value hierarchy, the Fund's investments measured at fair value.
Total Level 1 Level 2 Level 3
Mutual fund - Sector Specific - Derivatives and Fixed Income $ 16,378,280 $ 16,378,280 $ — $ —__________ __________ __________ ___________________ __________ __________ _________
Investment transactions The aggregate cost of purchases of investment securities and proceeds from sales of investment securities (other than temporary cash investments) totaled $2,430,699 and $6,481,123, respectively, for the year ended December 31, 2015. Class-specific expenses Class-specific trustee fees for the year ended December 31, 2015 were as follows: Class R1 $ 2,503 Class R2 752 Class R3 352 Class R4 212 Class R5 301 Class R6 1,039 Class R7 280 Class R8 121 Class LifeStyle 126,581 $ 132,141
997

THE COLLECTIVE INVESTMENT FUNDS OF FIRST MERCANTILE TRUST COMPANY FMT/DFA Commodity Strategy Portfolio Fund
Schedule of Participant Transactions December 31, 2015
The accompanying notes are an integral part of these financial statements.
Participant transactions by class for the year ended December 31, 2015 were as follows: Dollars Units Purchases Redemptions Net change Purchases Redemptions Net change Class R1 $ 344,184 $ (630,364) $ (286,180) 51,131 (101,294) (50,163)Class R2 259,020 (461,753) (202,733) 35,822 (65,311) (29,489)Class R3 17,667 (20,146) (2,479) 2,912 (3,159) (247)Class R4 8,546 (44,690) (36,144) 1,042 (5,637) (4,595)Class R5 4,038 (13,266) (9,228) 578 (1,828) (1,250)Class R6 16,221 (198,513) (182,292) 2,474 (27,051) (24,577)Class R7 3,949 (3) 3,946 602 — 602Class R8 2,857 (328) 2,529 467 (48) 419Class LifeStyle 5,948,409 (9,152,881) (3,204,472) — — — $ 6,604,891 $ (10,521,944) $ (3,917,053) 95,028 (204,328) (109,300)
998
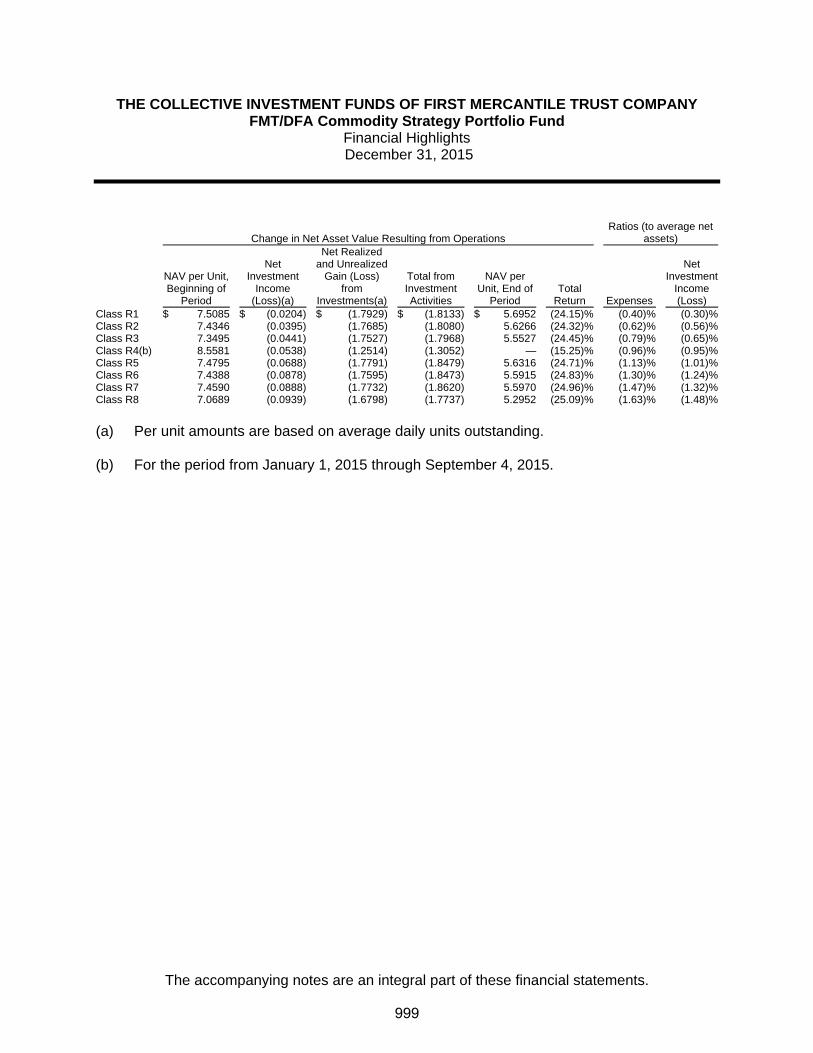
THE COLLECTIVE INVESTMENT FUNDS OF FIRST MERCANTILE TRUST COMPANY FMT/DFA Commodity Strategy Portfolio Fund
Financial Highlights December 31, 2015
The accompanying notes are an integral part of these financial statements.
Change in Net Asset Value Resulting from Operations Ratios (to average net
assets)
NAV per Unit, Beginning of
Period
Net Investment
Income (Loss)(a)
Net Realized and Unrealized
Gain (Loss) from
Investments(a)
Total from Investment Activities
NAV per Unit, End of
Period Total
Return Expenses
Net Investment
Income (Loss)
Class R1 $ 7.5085 $ (0.0204) $ (1.7929) $ (1.8133) $ 5.6952 (24.15)% (0.40)% (0.30)%Class R2 7.4346 (0.0395) (1.7685) (1.8080) 5.6266 (24.32)% (0.62)% (0.56)%Class R3 7.3495 (0.0441) (1.7527) (1.7968) 5.5527 (24.45)% (0.79)% (0.65)%Class R4(b) 8.5581 (0.0538) (1.2514) (1.3052) — (15.25)% (0.96)% (0.95)%Class R5 7.4795 (0.0688) (1.7791) (1.8479) 5.6316 (24.71)% (1.13)% (1.01)%Class R6 7.4388 (0.0878) (1.7595) (1.8473) 5.5915 (24.83)% (1.30)% (1.24)%Class R7 7.4590 (0.0888) (1.7732) (1.8620) 5.5970 (24.96)% (1.47)% (1.32)%Class R8 7.0689 (0.0939) (1.6798) (1.7737) 5.2952 (25.09)% (1.63)% (1.48)%
(a) Per unit amounts are based on average daily units outstanding.
(b) For the period from January 1, 2015 through September 4, 2015.
999

FMT/DFA International Real Estate Securities Fund
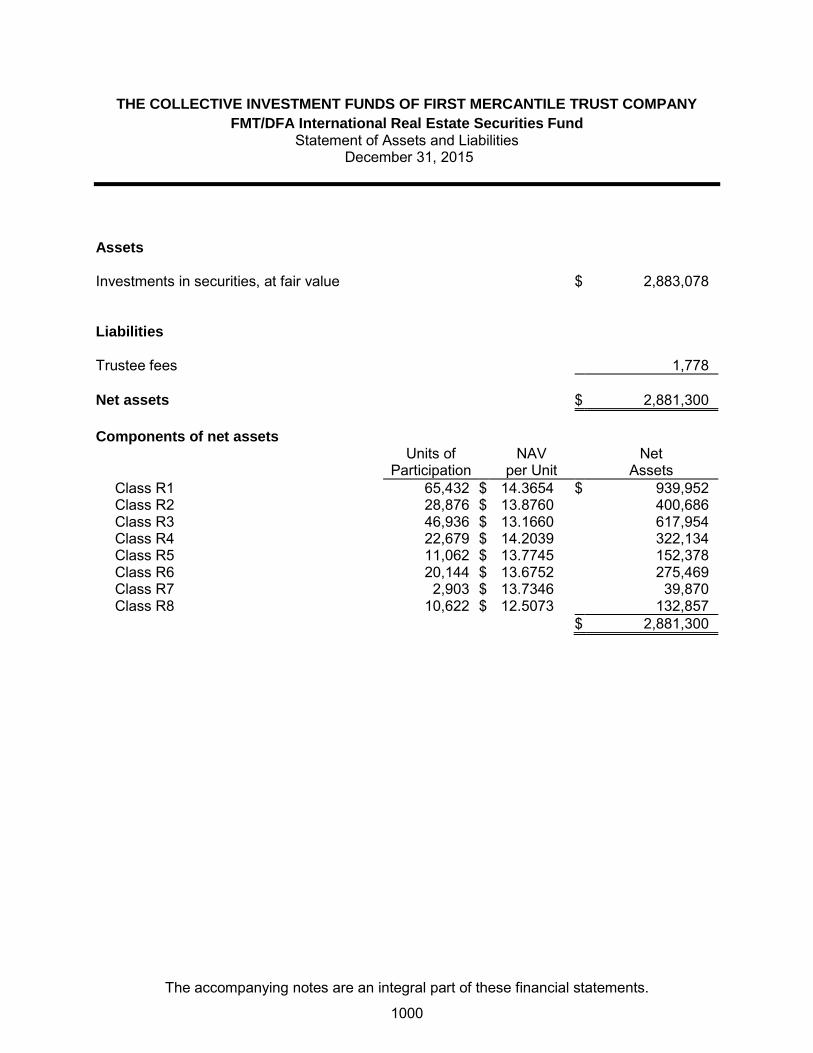
THE COLLECTIVE INVESTMENT FUNDS OF FIRST MERCANTILE TRUST COMPANY
FMT/DFA International Real Estate Securities Fund Statement of Assets and Liabilities
December 31, 2015
The accompanying notes are an integral part of these financial statements.
Assets Investments in securities, at fair value $ 2,883,078 Liabilities Trustee fees 1,778
Net assets $ 2,881,300
Components of net assets
Units of
Participation NAV
per Unit Net
Assets Class R1 65,432 $ 14.3654 $ 939,952
Class R2 28,876 $ 13.8760 400,686
Class R3 46,936 $ 13.1660 617,954
Class R4 22,679 $ 14.2039 322,134
Class R5 11,062 $ 13.7745 152,378
Class R6 20,144 $ 13.6752 275,469
Class R7 2,903 $ 13.7346 39,870
Class R8 10,622 $ 12.5073 132,857
$ 2,881,300
1000

THE COLLECTIVE INVESTMENT FUNDS OF FIRST MERCANTILE TRUST COMPANY
FMT/DFA International Real Estate Securities Fund Statement of Operations
For the Year Ended December 31, 2015
The accompanying notes are an integral part of these financial statements.
Investment income
Dividends $ 51,257
Expenses
Trustee fees 22,359
Audit fees 1,200
Custody fees 1,118
24,677
Net investment income 26,580
Net realized gain from investments sold
Proceeds from sales of investments 792,586
Cost of investments sold 769,330
Net realized gain from investments sold 23,256
Change in net unrealized appreciation (depreciation) on investments (191,782)
Net realized and unrealized loss on investments (168,526)
Net decrease in net assets resulting from operations $ (141,946)
1001

THE COLLECTIVE INVESTMENT FUNDS OF FIRST MERCANTILE TRUST COMPANY
FMT/DFA International Real Estate Securities Fund Statement of Changes in Net Assets
For the Year Ended December 31, 2015
The accompanying notes are an integral part of these financial statements.
Operations
Net investment income $ 26,580
Net realized gain from investments sold 23,256
Change in net unrealized appreciation (depreciation) on investments (191,782)
Net decrease in net assets resulting from operations (141,946)
Participant transactions
Proceeds from units purchased 1,090,316
Less payments for units redeemed 1,284,770
Decrease in net assets from participant transactions (194,454)
Total decrease in net assets (336,400)
Net assets at beginning of year 3,217,700
Net assets at end of year $ 2,881,300
1002

THE COLLECTIVE INVESTMENT FUNDS OF FIRST MERCANTILE TRUST COMPANY
FMT/DFA International Real Estate Securities Fund Schedule of Investments and Specific Fund Disclosures
December 31, 2015
The accompanying notes are an integral part of these financial statements.
Investments Shares Fair Value ____________ ____________
Mutual fund (100.1%)
DFA International Real Estate Securities Portfolio Fund (Cost $2,951,211) 581,266 $ 2,883,078 __________ __________
Specific Fund Disclosures
Fair value
The inputs or methodology used for valuing securities may not be indicative of the risks associated with investing in those securities. For more information on valuation inputs, and their aggregation into the levels used in the table below, please refer to note 4 to the financial statements. The following table sets forth by level, within the fair value hierarchy, the Fund's investments measured at fair value.
Total Level 1 Level 2 Level 3
Mutual fund - Sector Specific - Real Estate $ 2,883,078 $ 2,883,078 $ — $ — __________ __________ __________ _________ __________ __________ __________ _________
Investment transactions
The aggregate cost of purchases of investment securities and proceeds from sales of investment securities (other than temporary cash investments) totaled $652,259 and $792,586, respectively, for the year ended December 31, 2015.
Class-specific expenses Class-specific trustee fees for the year ended December 31, 2015 were as follows: Class R1 $ 4,100 Class R2 2,191 Class R3 4,643 Class R4 2,571 Class R5 2,572 Class R6 3,718 Class R7 535 Class R8 2,029 $ 22,359
1003

THE COLLECTIVE INVESTMENT FUNDS OF FIRST MERCANTILE TRUST COMPANY
FMT/DFA International Real Estate Securities Fund Schedule of Participant Transactions
December 31, 2015
The accompanying notes are an integral part of these financial statements.
Participant transactions by class for the year ended December 31, 2015 were as follows: Dollars Units Purchases Redemptions Net change Purchases Redemptions Net change Class R1 $ 257,806 $ (574,619) $ (316,813) 17,115 (39,058) (21,943) Class R2 133,485 (95,033) 38,452 9,292 (6,434) 2,858 Class R3 179,312 (123,769) 55,543 12,928 (9,128) 3,800 Class R4 135,645 (148,263) (12,618) 9,204 (9,660) (456) Class R5 40,504 (120,840) (80,336) 2,769 (8,468) (5,699) Class R6 206,759 (167,466) 39,293 14,078 (11,287) 2,791 Class R7 45,195 (51,235) (6,040) 2,976 (3,372) (396) Class R8 91,610 (3,545) 88,065 6,734 (264) 6,470 $ 1,090,316 $ (1,284,770) $ (194,454) 75,096 (87,671) (12,575)
1004

THE COLLECTIVE INVESTMENT FUNDS OF FIRST MERCANTILE TRUST COMPANY
FMT/DFA International Real Estate Securities Fund Financial Highlights December 31, 2015
The accompanying notes are an integral part of these financial statements.
Change in Net Asset Value Resulting from Operations Ratios (to average net
assets)
NAV per Unit, Beginning of
Period
Net Investment
Income (Loss)(a)
Net Realized and Unrealized
Gain (Loss) from
Investments(a)
Total from Investment Activities
NAV per Unit, End of
Period Total
Return Expenses
Net Investment
Income (Loss)
Class R1 $ 14.9687 $ 0.1629 $ (0.7662) $ (0.6033) $ 14.3654 (4.03) % (0.42) % 1.08 % Class R2 14.4907 0.1712 (0.7859) (0.6147) 13.8760 (4.24) % (0.64) % 1.18 % Class R3 13.7727 0.1181 (0.7248) (0.6067) 13.1660 (4.41) % (0.81) % 0.85 % Class R4 14.8838 0.1512 (0.8311) (0.6799) 14.2039 (4.57) % (0.98) % 1.01 % Class R5 14.4585 (0.0044) (0.6796) (0.6840) 13.7745 (4.73) % (1.15) % (0.03) % Class R6 14.3788 0.0431 (0.7467) (0.7036) 13.6752 (4.89) % (1.32) % 0.30 % Class R7 14.4636 0.0515 (0.7805) (0.7290) 13.7346 (5.04) % (1.49) % 0.36 % Class R8 13.1956 0.0200 (0.7083) (0.6883) 12.5073 (5.22) % (1.66) % 0.15 % (a) Per unit amounts are based on average daily units outstanding.
1005

FMT/DFA Real Estate Securities Fund

THE COLLECTIVE INVESTMENT FUNDS OF FIRST MERCANTILE TRUST COMPANY FMT/DFA Real Estate Securities Fund
Statement of Assets and Liabilities December 31, 2015
The accompanying notes are an integral part of these financial statements.
Assets Investments in securities, at fair value $ 15,216,576 Liabilities Trustee fees 8,298
Net assets $ 15,208,278
Components of net assets
Units of
Participation NAV
per Unit Net
Assets Class R1 412,432 $ 15.8729 $ 6,546,481
Class R2 92,539 $ 16.6051 1,536,616
Class R3 101,466 $ 16.1995 1,643,702
Class R4 94,818 $ 16.4828 1,562,861
Class R5 68,895 $ 16.0295 1,104,347
Class R6 90,701 $ 15.8671 1,439,167
Class R7 29,113 $ 15.0754 438,895
Class R8 14,769 $ 14.9380 220,625
Class LifeStyle 715,584
$ 15,208,278
1006

THE COLLECTIVE INVESTMENT FUNDS OF FIRST MERCANTILE TRUST COMPANY
FMT/DFA Real Estate Securities Fund Statement of Operations
For the Year Ended December 31, 2015
The accompanying notes are an integral part of these financial statements.
Investment income
Dividends $ 463,312
Expenses
Trustee fees 109,831
Custody fees 5,862
Audit fees 1,364
117,057
Net investment income 346,255
Net realized gain from investments sold
Proceeds from sales of investments 5,529,005
Cost of investments sold 4,282,844
Net realized gain from investments sold 1,246,161
Change in net unrealized appreciation (depreciation) on investments (1,182,726)
Net realized and unrealized gain on investments 63,435
Other operating credits (charges) 40
Net increase in net assets resulting from operations $ 409,730
1007

THE COLLECTIVE INVESTMENT FUNDS OF FIRST MERCANTILE TRUST COMPANY
FMT/DFA Real Estate Securities Fund Statement of Changes in Net Assets
For the Year Ended December 31, 2015
The accompanying notes are an integral part of these financial statements.
Operations
Net investment income $ 346,255
Net realized gain from investments sold 1,246,161
Change in net unrealized appreciation (depreciation) on investments (1,182,726)
Other operating credits (charges) 40
Net increase in net assets resulting from operations 409,730
Participant transactions
Proceeds from units purchased 6,210,385
Less payments for units redeemed 9,365,734
Decrease in net assets from participant transactions (3,155,349)
Total decrease in net assets (2,745,619)
Net assets at beginning of year 17,953,897
Net assets at end of year $ 15,208,278
1008
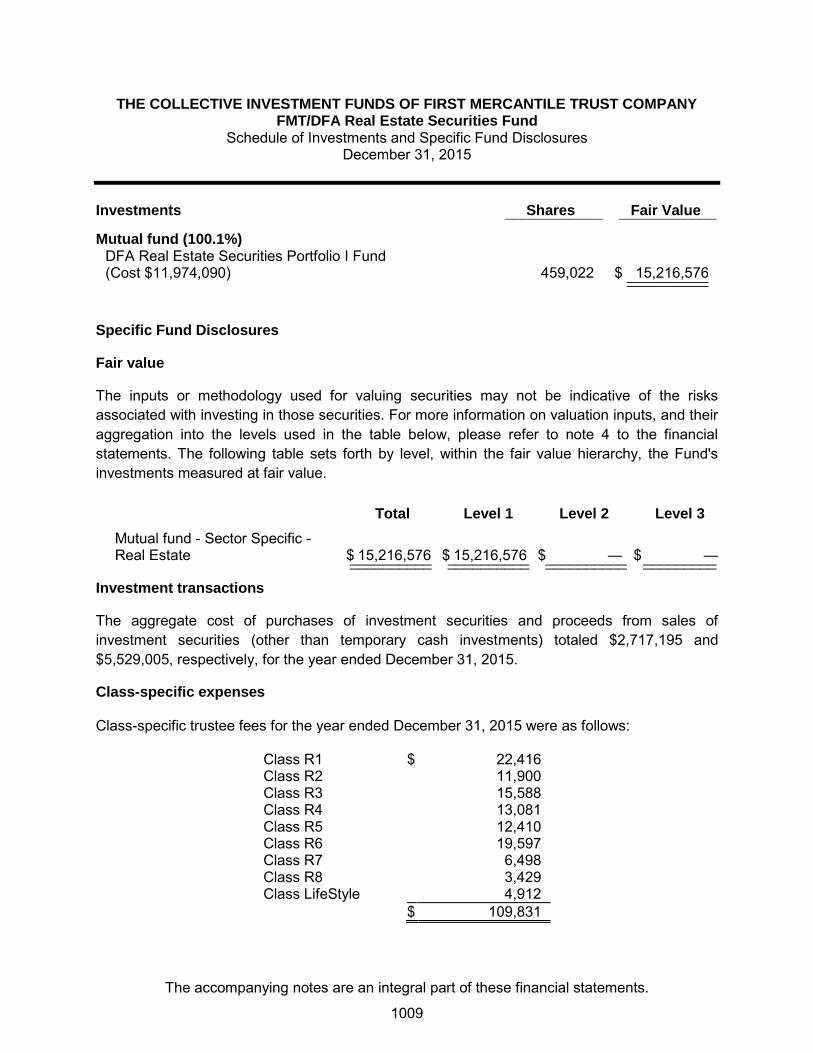
THE COLLECTIVE INVESTMENT FUNDS OF FIRST MERCANTILE TRUST COMPANY FMT/DFA Real Estate Securities Fund
Schedule of Investments and Specific Fund Disclosures December 31, 2015
The accompanying notes are an integral part of these financial statements.
Investments Shares Fair Value ____________ ____________
Mutual fund (100.1%)
DFA Real Estate Securities Portfolio I Fund (Cost $11,974,090) 459,022 $ 15,216,576 __________ __________
Specific Fund Disclosures
Fair value
The inputs or methodology used for valuing securities may not be indicative of the risks associated with investing in those securities. For more information on valuation inputs, and their aggregation into the levels used in the table below, please refer to note 4 to the financial statements. The following table sets forth by level, within the fair value hierarchy, the Fund's investments measured at fair value.
Total Level 1 Level 2 Level 3
Mutual fund - Sector Specific - Real Estate $ 15,216,576 $ 15,216,576 $ — $ — __________ __________ __________ _________ __________ __________ __________ _________
Investment transactions
The aggregate cost of purchases of investment securities and proceeds from sales of investment securities (other than temporary cash investments) totaled $2,717,195 and $5,529,005, respectively, for the year ended December 31, 2015.
Class-specific expenses Class-specific trustee fees for the year ended December 31, 2015 were as follows: Class R1 $ 22,416 Class R2 11,900 Class R3 15,588 Class R4 13,081 Class R5 12,410 Class R6 19,597 Class R7 6,498 Class R8 3,429 Class LifeStyle 4,912 $ 109,831
1009

THE COLLECTIVE INVESTMENT FUNDS OF FIRST MERCANTILE TRUST COMPANY
FMT/DFA Real Estate Securities Fund Schedule of Participant Transactions
December 31, 2015
The accompanying notes are an integral part of these financial statements.
Participant transactions by class for the year ended December 31, 2015 were as follows: Dollars Units Purchases Redemptions Net change Purchases Redemptions Net change Class R1 $ 2,651,448 $ (2,863,875) $ (212,427) 172,057 (186,033) (13,976) Class R2 719,504 (1,633,217) (913,713) 45,130 (101,986) (56,856) Class R3 594,488 (1,365,211) (770,723) 37,569 (86,085) (48,516) Class R4 670,385 (820,647) (150,262) 41,565 (49,632) (8,067) Class R5 449,405 (714,667) (265,262) 28,965 (44,466) (15,501) Class R6 628,913 (593,247) 35,666 39,260 (38,286) 974 Class R7 196,254 (222,827) (26,573) 12,914 (14,669) (1,755) Class R8 67,137 (175,867) (108,730) 4,584 (11,896) (7,312) Class LifeStyle 232,851 (976,176) (743,325) — — — $ 6,210,385 $ (9,365,734) $ (3,155,349) 382,044 (533,053) (151,009)
1010

THE COLLECTIVE INVESTMENT FUNDS OF FIRST MERCANTILE TRUST COMPANY
FMT/DFA Real Estate Securities Fund Financial Highlights December 31, 2015
The accompanying notes are an integral part of these financial statements.
Change in Net Asset Value Resulting from Operations Ratios (to average net
assets)
NAV per Unit, Beginning of
Period
Net Investment
Income (Loss)(a)
Net Realized and Unrealized
Gain (Loss) from
Investments(a)
Total from Investment Activities
NAV per Unit, End of
Period Total
Return Expenses
Net Investment
Income (Loss)
Class R1 $ 15.4358 $ 0.3874 $ 0.0497 $ 0.4371 $ 15.8729 2.83 % (0.39) % 2.50 % Class R2 16.1837 0.3408 0.0806 0.4214 16.6051 2.60 % (0.61) % 2.09 % Class R3 15.8155 0.3073 0.0767 0.3840 16.1995 2.43 % (0.78) % 1.94 % Class R4 16.1196 0.3195 0.0437 0.3632 16.4828 2.25 % (0.95) % 1.98 % Class R5 15.7032 0.2689 0.0574 0.3263 16.0295 2.08 % (1.12) % 1.71 % Class R6 15.5708 0.2367 0.0596 0.2963 15.8671 1.90 % (1.29) % 1.52 % Class R7 14.8192 0.2037 0.0525 0.2562 15.0754 1.73 % (1.46) % 1.38 % Class R8 14.7092 0.1797 0.0491 0.2288 14.9380 1.56 % (1.63) % 1.23 % (a) Per unit amounts are based on average daily units outstanding.
1011
FMT/First Eagle Gold Fund
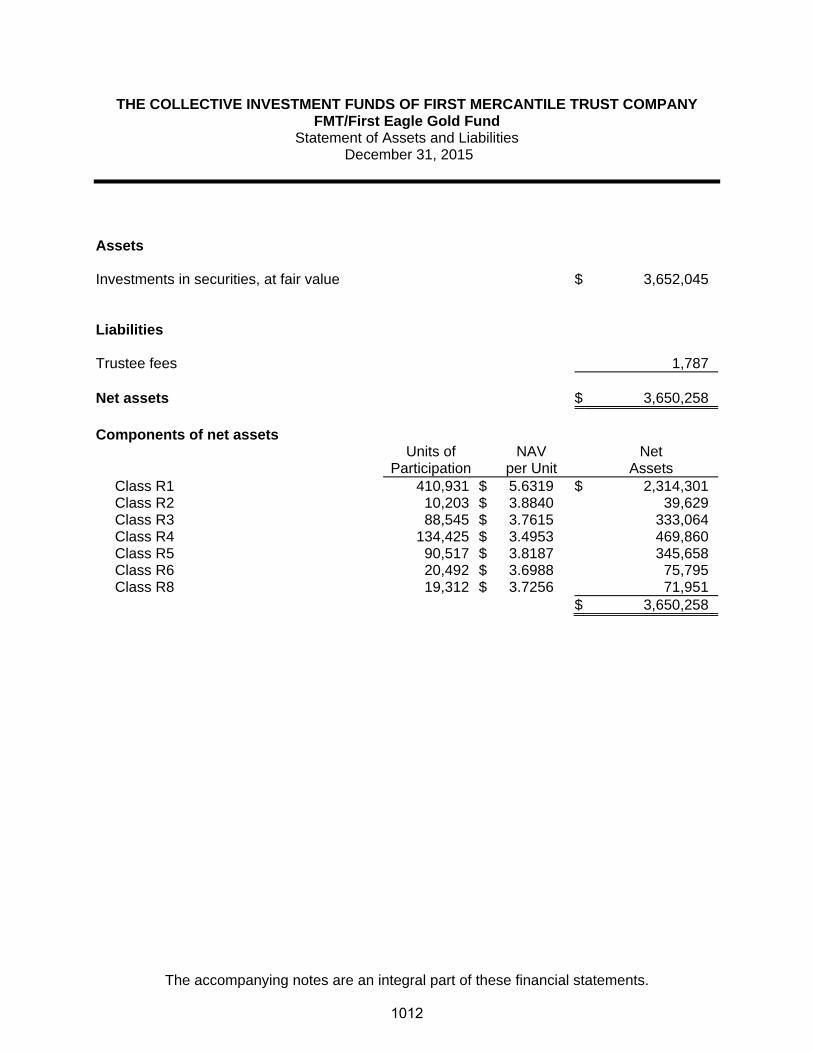
THE COLLECTIVE INVESTMENT FUNDS OF FIRST MERCANTILE TRUST COMPANY FMT/First Eagle Gold Fund
Statement of Assets and Liabilities December 31, 2015
The accompanying notes are an integral part of these financial statements.
Assets Investments in securities, at fair value $ 3,652,045 Liabilities Trustee fees 1,787 Net assets $ 3,650,258 Components of net assets
Units of
Participation NAV
per Unit Net
Assets Class R1 410,931 $ 5.6319 $ 2,314,301Class R2 10,203 $ 3.8840 39,629Class R3 88,545 $ 3.7615 333,064Class R4 134,425 $ 3.4953 469,860Class R5 90,517 $ 3.8187 345,658Class R6 20,492 $ 3.6988 75,795Class R8 19,312 $ 3.7256 71,951
$ 3,650,258
1012

THE COLLECTIVE INVESTMENT FUNDS OF FIRST MERCANTILE TRUST COMPANY FMT/First Eagle Gold Fund
Statement of Operations For the Year Ended December 31, 2015
The accompanying notes are an integral part of these financial statements.
Expenses
Trustee fees $ 28,248Custody fees 1,717Audit fees 1,200
31,165 Net investment loss (31,165) Net realized loss from investments sold
Proceeds from sales of investments 1,874,443Cost of investments sold 3,203,843
Net realized loss from investments sold (1,329,400) Change in net unrealized appreciation (depreciation) on investments 409,353 Net realized and unrealized loss on investments (920,047) Other operating credits (charges) 19,758 Net decrease in net assets resulting from operations $ (931,454)
1013

THE COLLECTIVE INVESTMENT FUNDS OF FIRST MERCANTILE TRUST COMPANY FMT/First Eagle Gold Fund
Statement of Changes in Net Assets For the Year Ended December 31, 2015
The accompanying notes are an integral part of these financial statements.
Operations
Net investment loss $ (31,165)
Net realized loss from investments sold (1,329,400)
Change in net unrealized appreciation (depreciation) on investments 409,353
Other operating credits (charges) 19,758
Net decrease in net assets resulting from operations (931,454) Participant transactions
Proceeds from units purchased 1,809,919Less payments for units redeemed 2,613,310
Decrease in net assets from participant transactions (803,391)
Total decrease in net assets (1,734,845) Net assets at beginning of year 5,385,103 Net assets at end of year $ 3,650,258
1014
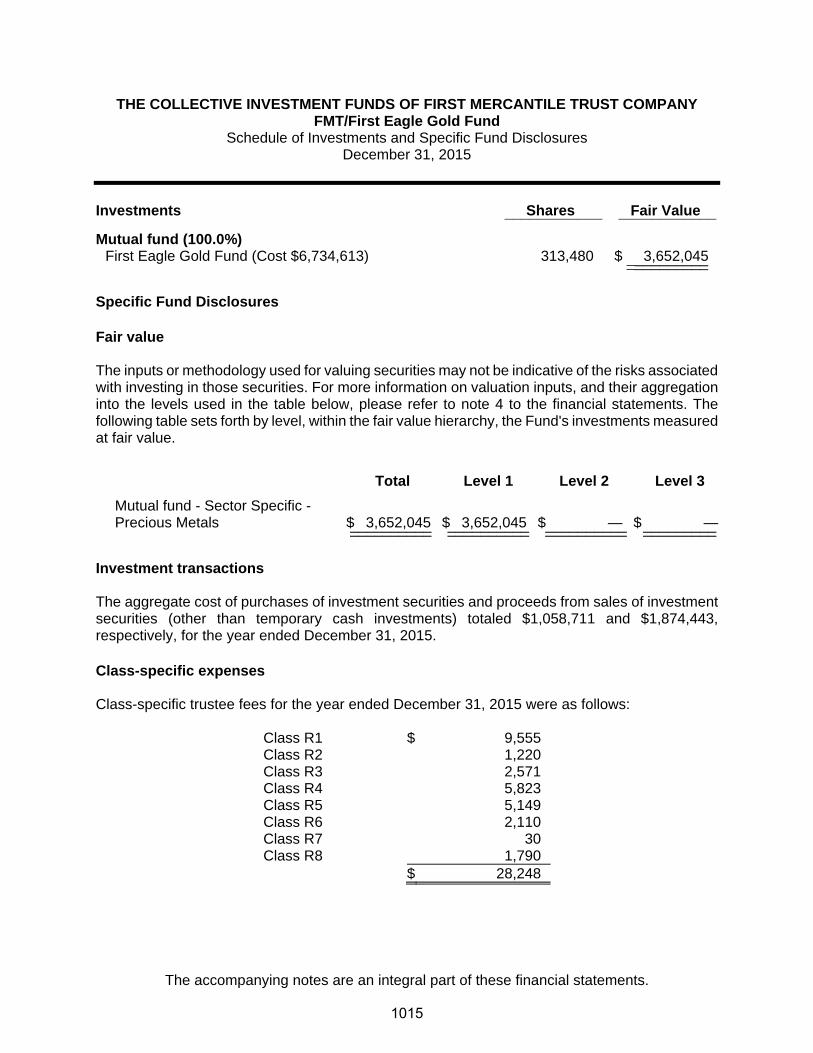
THE COLLECTIVE INVESTMENT FUNDS OF FIRST MERCANTILE TRUST COMPANY FMT/First Eagle Gold Fund
Schedule of Investments and Specific Fund Disclosures December 31, 2015
The accompanying notes are an integral part of these financial statements.
Investments Shares Fair Value ____________ ____________
Mutual fund (100.0%) First Eagle Gold Fund (Cost $6,734,613) 313,480 $ 3,652,045 ____________________ Specific Fund Disclosures Fair value The inputs or methodology used for valuing securities may not be indicative of the risks associated with investing in those securities. For more information on valuation inputs, and their aggregation into the levels used in the table below, please refer to note 4 to the financial statements. The following table sets forth by level, within the fair value hierarchy, the Fund's investments measured at fair value.
Total Level 1 Level 2 Level 3
Mutual fund - Sector Specific - Precious Metals $ 3,652,045 $ 3,652,045 $ — $ —__________ __________ __________ ___________________ __________ __________ _________
Investment transactions The aggregate cost of purchases of investment securities and proceeds from sales of investment securities (other than temporary cash investments) totaled $1,058,711 and $1,874,443, respectively, for the year ended December 31, 2015. Class-specific expenses Class-specific trustee fees for the year ended December 31, 2015 were as follows: Class R1 $ 9,555 Class R2 1,220 Class R3 2,571 Class R4 5,823 Class R5 5,149 Class R6 2,110 Class R7 30 Class R8 1,790 $ 28,248
1015

THE COLLECTIVE INVESTMENT FUNDS OF FIRST MERCANTILE TRUST COMPANY FMT/First Eagle Gold Fund
Schedule of Participant Transactions December 31, 2015
The accompanying notes are an integral part of these financial statements.
Participant transactions by class for the year ended December 31, 2015 were as follows: Dollars Units Purchases Redemptions Net change Purchases Redemptions Net change Class R1 $ 910,464 $ (1,105,784) $ (195,320) 140,821 (165,569) (24,748)Class R2 49,217 (267,398) (218,181) 10,088 (64,804) (54,716)Class R3 254,300 (282,877) (28,577) 58,745 (59,065) (320)Class R4 354,203 (450,951) (96,748) 88,199 (114,242) (26,043)Class R5 132,460 (287,711) (155,251) 29,790 (66,026) (36,236)Class R6 62,557 (143,808) (81,251) 15,985 (36,853) (20,868)Class R7 24 (2,461) (2,437) 6 (607) (601)Class R8 46,694 (72,320) (25,626) 10,986 (17,847) (6,861) $ 1,809,919 $ (2,613,310) $ (803,391) 354,620 (525,013) (170,393)
1016
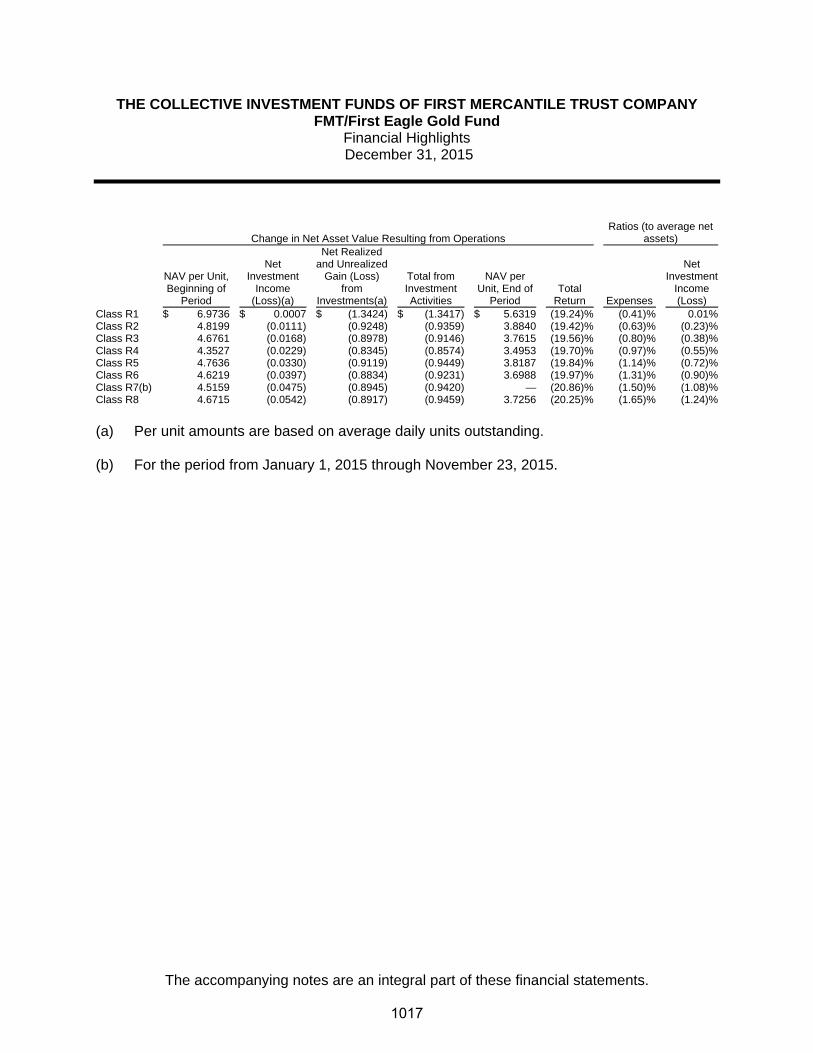
THE COLLECTIVE INVESTMENT FUNDS OF FIRST MERCANTILE TRUST COMPANY FMT/First Eagle Gold Fund
Financial Highlights December 31, 2015
The accompanying notes are an integral part of these financial statements.
Change in Net Asset Value Resulting from Operations Ratios (to average net
assets)
NAV per Unit, Beginning of
Period
Net Investment
Income (Loss)(a)
Net Realized and Unrealized
Gain (Loss) from
Investments(a)
Total from Investment Activities
NAV per Unit, End of
Period Total
Return Expenses
Net Investment
Income (Loss)
Class R1 $ 6.9736 $ 0.0007 $ (1.3424) $ (1.3417) $ 5.6319 (19.24)% (0.41)% 0.01%Class R2 4.8199 (0.0111) (0.9248) (0.9359) 3.8840 (19.42)% (0.63)% (0.23)%Class R3 4.6761 (0.0168) (0.8978) (0.9146) 3.7615 (19.56)% (0.80)% (0.38)%Class R4 4.3527 (0.0229) (0.8345) (0.8574) 3.4953 (19.70)% (0.97)% (0.55)%Class R5 4.7636 (0.0330) (0.9119) (0.9449) 3.8187 (19.84)% (1.14)% (0.72)%Class R6 4.6219 (0.0397) (0.8834) (0.9231) 3.6988 (19.97)% (1.31)% (0.90)%Class R7(b) 4.5159 (0.0475) (0.8945) (0.9420) — (20.86)% (1.50)% (1.08)%Class R8 4.6715 (0.0542) (0.8917) (0.9459) 3.7256 (20.25)% (1.65)% (1.24)%
(a) Per unit amounts are based on average daily units outstanding.
(b) For the period from January 1, 2015 through November 23, 2015.
1017

FMT/Gateway Fund

THE COLLECTIVE INVESTMENT FUNDS OF FIRST MERCANTILE TRUST COMPANY
FMT/Gateway Fund Statement of Assets and Liabilities
December 31, 2015
The accompanying notes are an integral part of these financial statements.
Assets Investments in securities, at fair value $ 1,741,998 Liabilities Trustee fees 898
Net assets $ 1,741,100
Components of net assets
Units of
Participation NAV
per Unit Net
Assets Class R1 74,045 $ 11.6578 $ 863,198
Class R2 4,142 $ 10.2071 42,282
Class R3 29,136 $ 11.5523 336,583
Class R4 39,506 $ 11.9498 472,085
Class R5 1,297 $ 11.5783 15,017
Class R6 135 $ 11.2950 1,523
Class R7 73 $ 11.0908 812
Class R8 859 $ 11.1744 9,600
$ 1,741,100
1018
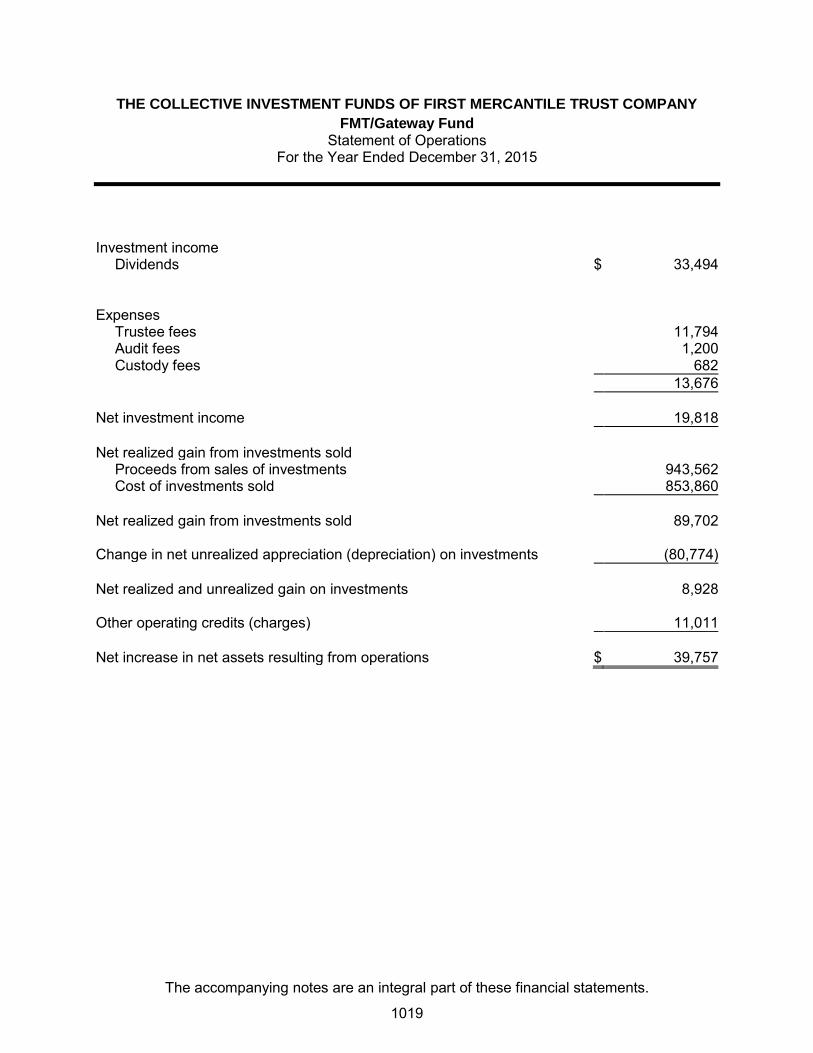
THE COLLECTIVE INVESTMENT FUNDS OF FIRST MERCANTILE TRUST COMPANY
FMT/Gateway Fund Statement of Operations
For the Year Ended December 31, 2015
The accompanying notes are an integral part of these financial statements.
Investment income
Dividends $ 33,494
Expenses
Trustee fees 11,794
Audit fees 1,200
Custody fees 682
13,676
Net investment income 19,818
Net realized gain from investments sold
Proceeds from sales of investments 943,562
Cost of investments sold 853,860
Net realized gain from investments sold 89,702
Change in net unrealized appreciation (depreciation) on investments (80,774)
Net realized and unrealized gain on investments 8,928
Other operating credits (charges) 11,011
Net increase in net assets resulting from operations $ 39,757
1019

THE COLLECTIVE INVESTMENT FUNDS OF FIRST MERCANTILE TRUST COMPANY
FMT/Gateway Fund Statement of Changes in Net Assets
For the Year Ended December 31, 2015
The accompanying notes are an integral part of these financial statements.
Operations
Net investment income $ 19,818
Net realized gain from investments sold 89,702
Change in net unrealized appreciation (depreciation) on investments (80,774)
Other operating credits (charges) 11,011
Net increase in net assets resulting from operations 39,757
Participant transactions
Proceeds from units purchased 544,980
Less payments for units redeemed 1,213,420
Decrease in net assets from participant transactions (668,440)
Total decrease in net assets (628,683)
Net assets at beginning of year 2,369,783
Net assets at end of year $ 1,741,100
1020
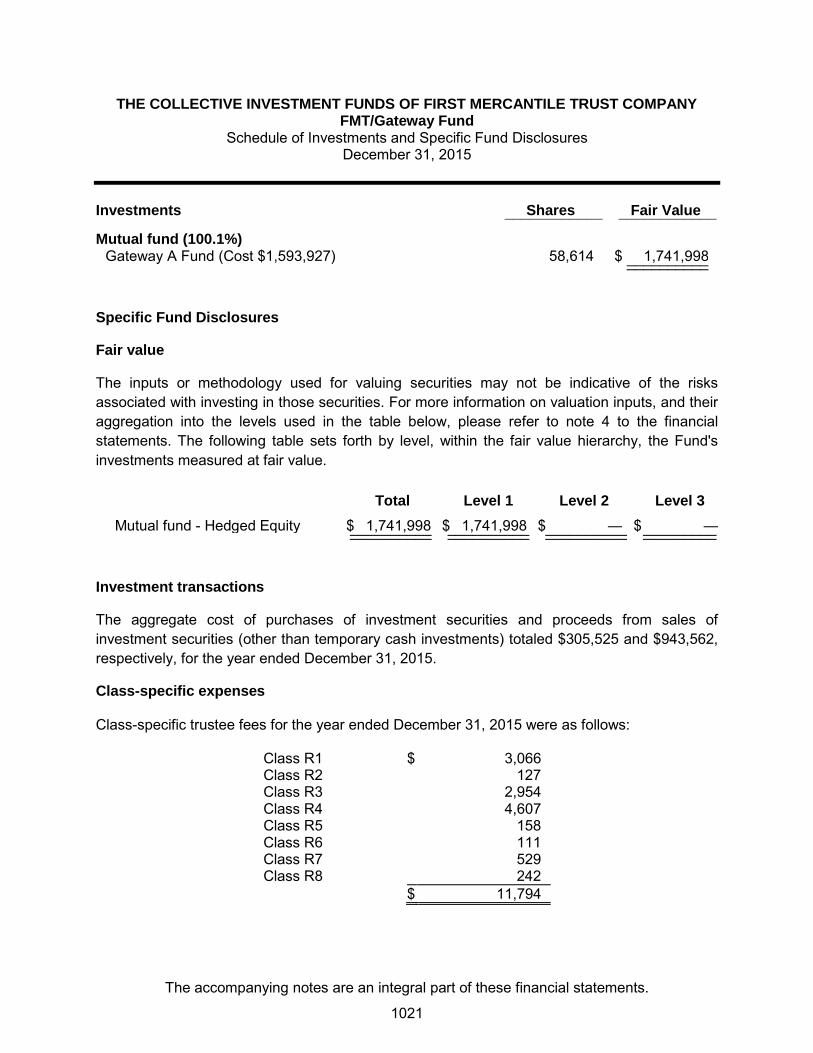
THE COLLECTIVE INVESTMENT FUNDS OF FIRST MERCANTILE TRUST COMPANY FMT/Gateway Fund
Schedule of Investments and Specific Fund Disclosures December 31, 2015
The accompanying notes are an integral part of these financial statements.
Investments Shares Fair Value ____________ ____________
Mutual fund (100.1%) Gateway A Fund (Cost $1,593,927) 58,614 $ 1,741,998 __________ __________
Specific Fund Disclosures
Fair value
The inputs or methodology used for valuing securities may not be indicative of the risks associated with investing in those securities. For more information on valuation inputs, and their aggregation into the levels used in the table below, please refer to note 4 to the financial statements. The following table sets forth by level, within the fair value hierarchy, the Fund's investments measured at fair value.
Total Level 1 Level 2 Level 3
Mutual fund - Hedged Equity $ 1,741,998 $ 1,741,998 $ — $ — __________ __________ __________ _________ __________ __________ __________ _________
Investment transactions
The aggregate cost of purchases of investment securities and proceeds from sales of investment securities (other than temporary cash investments) totaled $305,525 and $943,562, respectively, for the year ended December 31, 2015.
Class-specific expenses Class-specific trustee fees for the year ended December 31, 2015 were as follows: Class R1 $ 3,066 Class R2 127 Class R3 2,954 Class R4 4,607 Class R5 158 Class R6 111 Class R7 529 Class R8 242 $ 11,794
1021

THE COLLECTIVE INVESTMENT FUNDS OF FIRST MERCANTILE TRUST COMPANY
FMT/Gateway Fund Schedule of Participant Transactions
December 31, 2015
The accompanying notes are an integral part of these financial statements.
Participant transactions by class for the year ended December 31, 2015 were as follows: Dollars Units Purchases Redemptions Net change Purchases Redemptions Net change Class R1 $ 218,374 $ (521,675) $ (303,301) 18,815 (45,572) (26,757) Class R2 93,515 (52,499) 41,016 9,354 (5,212) 4,142 Class R3 57,937 (238,820) (180,883) 5,050 (20,948) (15,898) Class R4 106,267 (160,907) (54,640) 8,933 (13,351) (4,418) Class R5 11,755 (5,896) 5,859 1,017 (512) 505 Class R6 51,567 (57,823) (6,256) 4,496 (5,194) (698) Class R7 4,648 (59,477) (54,829) 419 (5,370) (4,951) Class R8 917 (116,323) (115,406) 82 (10,573) (10,491) $ 544,980 $ (1,213,420) $ (668,440) 48,166 (106,732) (58,566)
1022

THE COLLECTIVE INVESTMENT FUNDS OF FIRST MERCANTILE TRUST COMPANY
FMT/Gateway Fund Financial Highlights December 31, 2015
The accompanying notes are an integral part of these financial statements.
Change in Net Asset Value Resulting from Operations Ratios (to average net
assets)
NAV per Unit, Beginning of
Period
Net Investment
Income (Loss)(a)
Net Realized and Unrealized
Gain (Loss) from
Investments(a)
Total from Investment Activities
NAV per Unit, End of
Period Total
Return Expenses
Net Investment
Income (Loss)
Class R1 $ 11.3747 $ 0.2221 $ 0.0610 $ 0.2831 $ 11.6578 2.49 % (0.45) % 1.92 % Class R2(b) 10.0000 0.0355 0.1716 0.2071 10.2071 2.07 % (0.65) % 1.28 % Class R3 11.3159 0.1765 0.0599 0.2364 11.5523 2.09 % (0.84) % 1.54 % Class R4 11.7252 0.1622 0.0624 0.2246 11.9498 1.92 % (1.01) % 1.36 % Class R5 11.3801 0.1378 0.0604 0.1982 11.5783 1.74 % (1.18) % 1.19 % Class R6 11.1209 0.1159 0.0582 0.1741 11.2950 1.57 % (1.35) % 1.04 % Class R7 10.9471 0.0955 0.0482 0.1437 11.0908 1.31 % (1.52) % 0.86 % Class R8 11.0396 0.0709 0.0639 0.1348 11.1744 1.22 % (1.69) % 0.64 % (a) Per unit amounts are based on average daily units outstanding.
(b) For the period from September 23, 2015 (commencement of this class) through
December 31, 2015.
1023
FMT/Ivy Global Natural Resources Fund

THE COLLECTIVE INVESTMENT FUNDS OF FIRST MERCANTILE TRUST COMPANY
FMT/Ivy Global Natural Resources Fund Statement of Assets and Liabilities
December 31, 2015
The accompanying notes are an integral part of these financial statements.
Assets Investments in securities, at fair value $ 5,603,594 Liabilities Trustee fees 4,268
Net assets $ 5,599,326
Components of net assets
Units of
Participation NAV
per Unit Net
Assets Class R1 389,902 $ 5.4710 $ 2,133,152
Class R2 7,508 $ 7.7885 58,472
Class R3 91,460 $ 6.8907 630,224
Class R4 48,821 $ 7.6341 372,706
Class R5 77,837 $ 7.5210 585,414
Class R6 73,250 $ 6.8414 501,133
Class R7 101,251 $ 6.6263 670,921
Class R8 89,028 $ 7.2708 647,304
$ 5,599,326
1024

THE COLLECTIVE INVESTMENT FUNDS OF FIRST MERCANTILE TRUST COMPANY
FMT/Ivy Global Natural Resources Fund Statement of Operations
For the Year Ended December 31, 2015
The accompanying notes are an integral part of these financial statements.
Expenses
Trustee fees 49,054
Custody fees 2,371
Audit fees 1,200
52,625
Net investment loss (52,625)
Net realized loss from investments sold
Proceeds from sales of investments 2,731,831
Cost of investments sold 3,409,512
Net realized loss from investments sold (677,681)
Change in net unrealized appreciation (depreciation) on investments (823,693)
Net realized and unrealized loss on investments (1,501,374)
Other operating credits (charges) 31,778
Net decrease in net assets resulting from operations $ (1,522,221)
1025
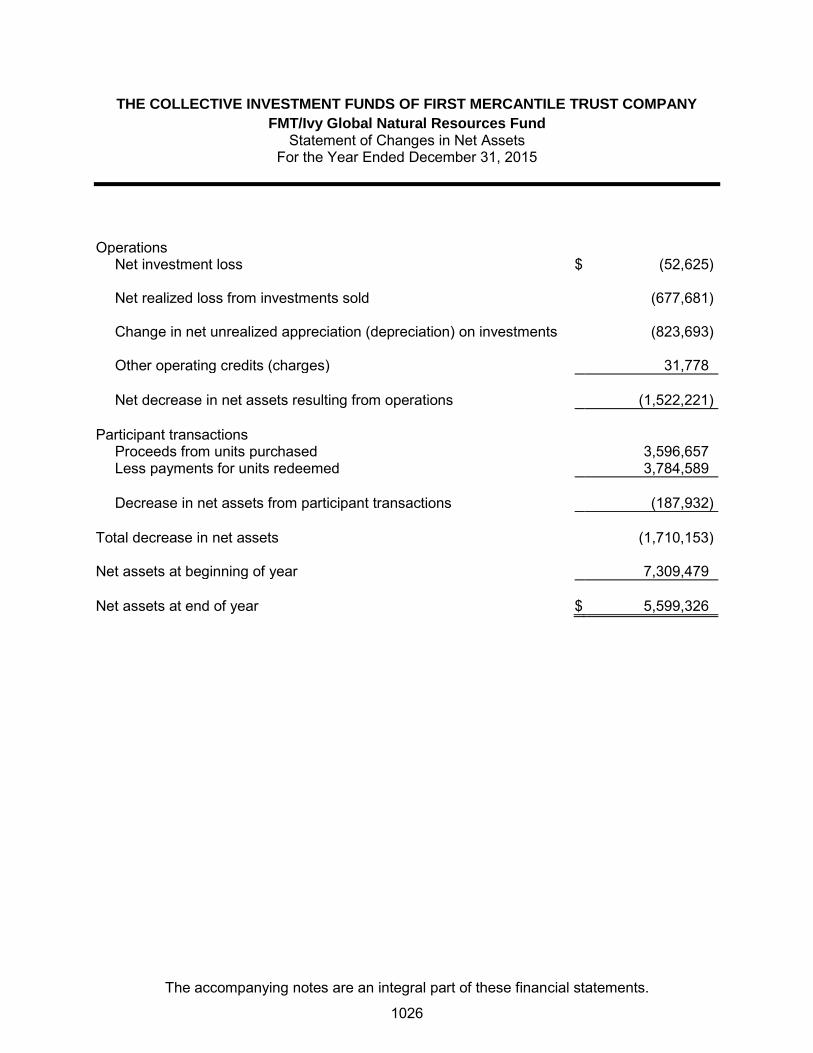
THE COLLECTIVE INVESTMENT FUNDS OF FIRST MERCANTILE TRUST COMPANY
FMT/Ivy Global Natural Resources Fund Statement of Changes in Net Assets
For the Year Ended December 31, 2015
The accompanying notes are an integral part of these financial statements.
Operations
Net investment loss $ (52,625)
Net realized loss from investments sold (677,681)
Change in net unrealized appreciation (depreciation) on investments (823,693)
Other operating credits (charges) 31,778
Net decrease in net assets resulting from operations (1,522,221)
Participant transactions
Proceeds from units purchased 3,596,657
Less payments for units redeemed 3,784,589
Decrease in net assets from participant transactions (187,932)
Total decrease in net assets (1,710,153)
Net assets at beginning of year 7,309,479
Net assets at end of year $ 5,599,326
1026
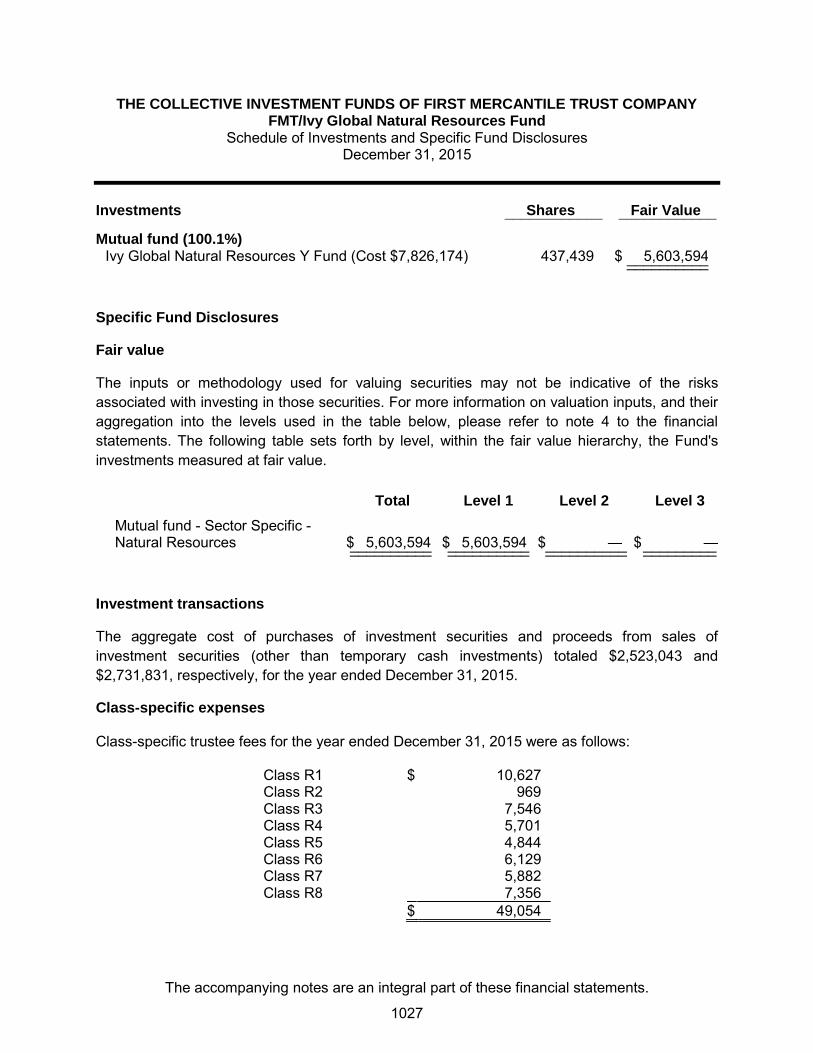
THE COLLECTIVE INVESTMENT FUNDS OF FIRST MERCANTILE TRUST COMPANY FMT/Ivy Global Natural Resources Fund
Schedule of Investments and Specific Fund Disclosures December 31, 2015
The accompanying notes are an integral part of these financial statements.
Investments Shares Fair Value ____________ ____________
Mutual fund (100.1%) Ivy Global Natural Resources Y Fund (Cost $7,826,174) 437,439 $ 5,603,594 __________ __________
Specific Fund Disclosures
Fair value
The inputs or methodology used for valuing securities may not be indicative of the risks associated with investing in those securities. For more information on valuation inputs, and their aggregation into the levels used in the table below, please refer to note 4 to the financial statements. The following table sets forth by level, within the fair value hierarchy, the Fund's investments measured at fair value.
Total Level 1 Level 2 Level 3
Mutual fund - Sector Specific - Natural Resources $ 5,603,594 $ 5,603,594 $ — $ — __________ __________ __________ _________ __________ __________ __________ _________
Investment transactions
The aggregate cost of purchases of investment securities and proceeds from sales of investment securities (other than temporary cash investments) totaled $2,523,043 and $2,731,831, respectively, for the year ended December 31, 2015.
Class-specific expenses Class-specific trustee fees for the year ended December 31, 2015 were as follows: Class R1 $ 10,627 Class R2 969 Class R3 7,546 Class R4 5,701 Class R5 4,844 Class R6 6,129 Class R7 5,882 Class R8 7,356 $ 49,054
1027
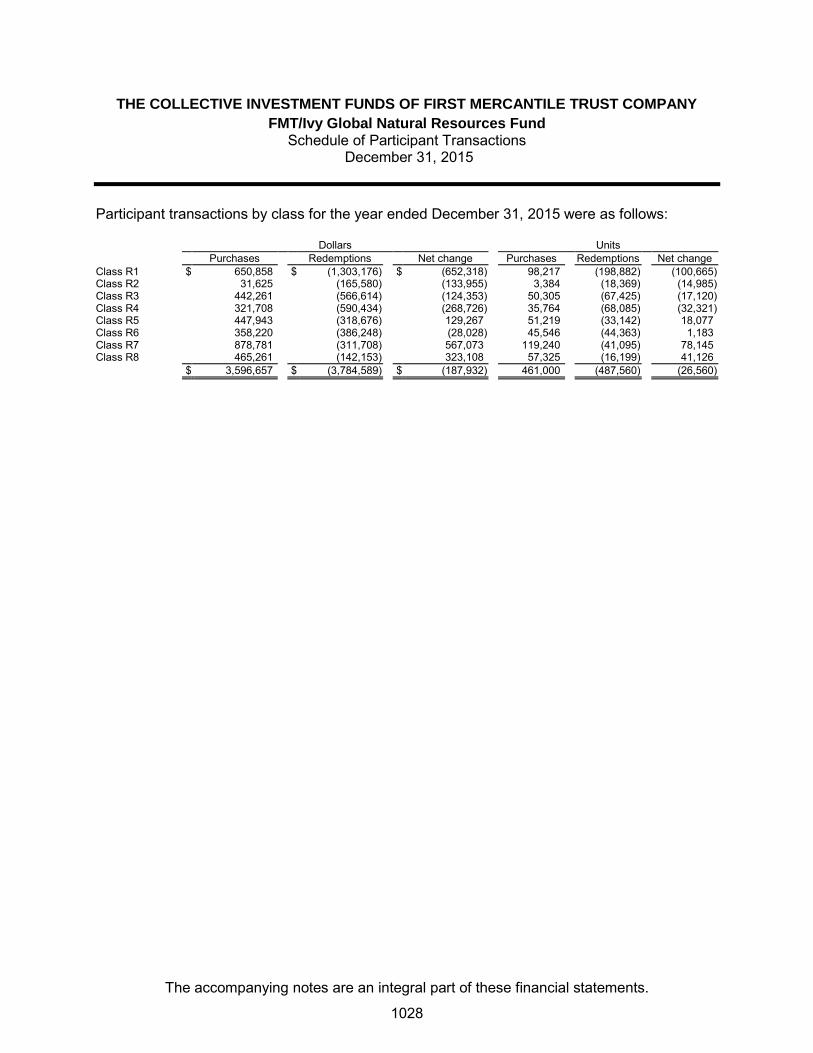
THE COLLECTIVE INVESTMENT FUNDS OF FIRST MERCANTILE TRUST COMPANY
FMT/Ivy Global Natural Resources Fund Schedule of Participant Transactions
December 31, 2015
The accompanying notes are an integral part of these financial statements.
Participant transactions by class for the year ended December 31, 2015 were as follows: Dollars Units Purchases Redemptions Net change Purchases Redemptions Net change Class R1 $ 650,858 $ (1,303,176) $ (652,318) 98,217 (198,882) (100,665) Class R2 31,625 (165,580) (133,955) 3,384 (18,369) (14,985) Class R3 442,261 (566,614) (124,353) 50,305 (67,425) (17,120) Class R4 321,708 (590,434) (268,726) 35,764 (68,085) (32,321) Class R5 447,943 (318,676) 129,267 51,219 (33,142) 18,077 Class R6 358,220 (386,248) (28,028) 45,546 (44,363) 1,183 Class R7 878,781 (311,708) 567,073 119,240 (41,095) 78,145 Class R8 465,261 (142,153) 323,108 57,325 (16,199) 41,126 $ 3,596,657 $ (3,784,589) $ (187,932) 461,000 (487,560) (26,560)
1028

THE COLLECTIVE INVESTMENT FUNDS OF FIRST MERCANTILE TRUST COMPANY
FMT/Ivy Global Natural Resources Fund Financial Highlights December 31, 2015
The accompanying notes are an integral part of these financial statements.
Change in Net Asset Value Resulting from Operations Ratios (to average net
assets)
NAV per Unit, Beginning of
Period
Net Investment
Income (Loss)(a)
Net Realized and Unrealized
Gain (Loss) from
Investments(a)
Total from Investment Activities
NAV per Unit, End of
Period Total
Return Expenses
Net Investment
Income (Loss)
Class R1 $ 7.0266 $ 0.0053 $ (1.5609) $ (1.5556) $ 5.4710 (22.14) % (0.40) % 0.08 % Class R2 10.0252 (0.0132) (2.2235) (2.2367) 7.7885 (22.31) % (0.62) % (0.14) % Class R3 8.8847 (0.0264) (1.9676) (1.9940) 6.8907 (22.44) % (0.79) % (0.31) % Class R4 9.8601 (0.0454) (2.1806) (2.2260) 7.6341 (22.58) % (0.96) % (0.48) % Class R5 9.7308 (0.0620) (2.1478) (2.2098) 7.5210 (22.71) % (1.13) % (0.67) % Class R6 8.8667 (0.0703) (1.9550) (2.0253) 6.8414 (22.84) % (1.30) % (0.83) % Class R7 8.6025 (0.0788) (1.8974) (1.9762) 6.6263 (22.97) % (1.47) % (1.02) % Class R8 9.4553 (0.1029) (2.0816) (2.1845) 7.2708 (23.10) % (1.64) % (1.18) % (a) Per unit amounts are based on average daily units outstanding.
1029
FMT/Neuberger Berman REIT Fund
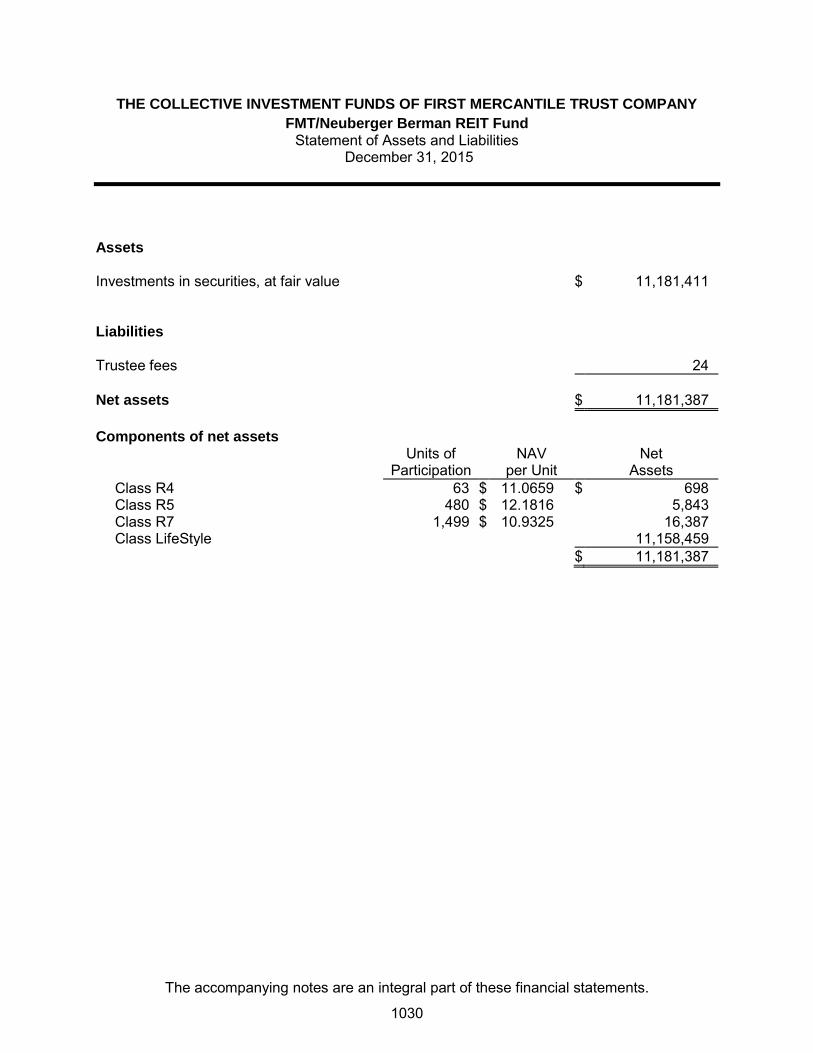
THE COLLECTIVE INVESTMENT FUNDS OF FIRST MERCANTILE TRUST COMPANY
FMT/Neuberger Berman REIT Fund Statement of Assets and Liabilities
December 31, 2015
The accompanying notes are an integral part of these financial statements.
Assets Investments in securities, at fair value $ 11,181,411 Liabilities Trustee fees 24
Net assets $ 11,181,387
Components of net assets
Units of
Participation NAV
per Unit Net
Assets Class R4 63 $ 11.0659 $ 698
Class R5 480 $ 12.1816 5,843
Class R7 1,499 $ 10.9325 16,387
Class LifeStyle 11,158,459
$ 11,181,387
1030

THE COLLECTIVE INVESTMENT FUNDS OF FIRST MERCANTILE TRUST COMPANY
FMT/Neuberger Berman REIT Fund Statement of Operations
For the Year Ended December 31, 2015
The accompanying notes are an integral part of these financial statements.
Investment income
Dividends $ 1,016,240
Expenses
Trustee fees 80,972
Custody fees 5,214
Audit fees 1,370
87,556
Net investment income 928,684
Net realized gain from investments sold
Proceeds from sales of investments 9,471,049
Cost of investments sold 8,577,838
Net realized gain from investments sold 893,211
Change in net unrealized appreciation (depreciation) on investments (1,365,446)
Net realized and unrealized loss on investments (472,235)
Other operating credits (charges) 56,907
Net increase in net assets resulting from operations $ 513,356
1031
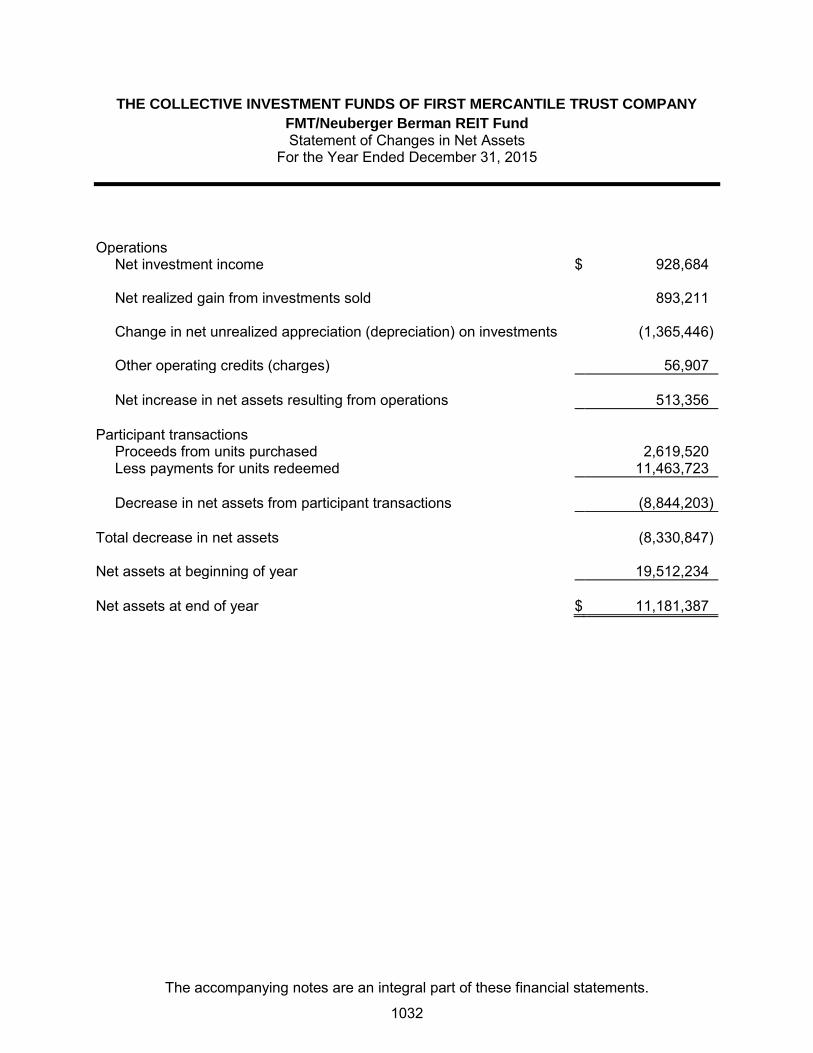
THE COLLECTIVE INVESTMENT FUNDS OF FIRST MERCANTILE TRUST COMPANY
FMT/Neuberger Berman REIT Fund Statement of Changes in Net Assets
For the Year Ended December 31, 2015
The accompanying notes are an integral part of these financial statements.
Operations
Net investment income $ 928,684
Net realized gain from investments sold 893,211
Change in net unrealized appreciation (depreciation) on investments (1,365,446)
Other operating credits (charges) 56,907
Net increase in net assets resulting from operations 513,356
Participant transactions
Proceeds from units purchased 2,619,520
Less payments for units redeemed 11,463,723
Decrease in net assets from participant transactions (8,844,203)
Total decrease in net assets (8,330,847)
Net assets at beginning of year 19,512,234
Net assets at end of year $ 11,181,387
1032
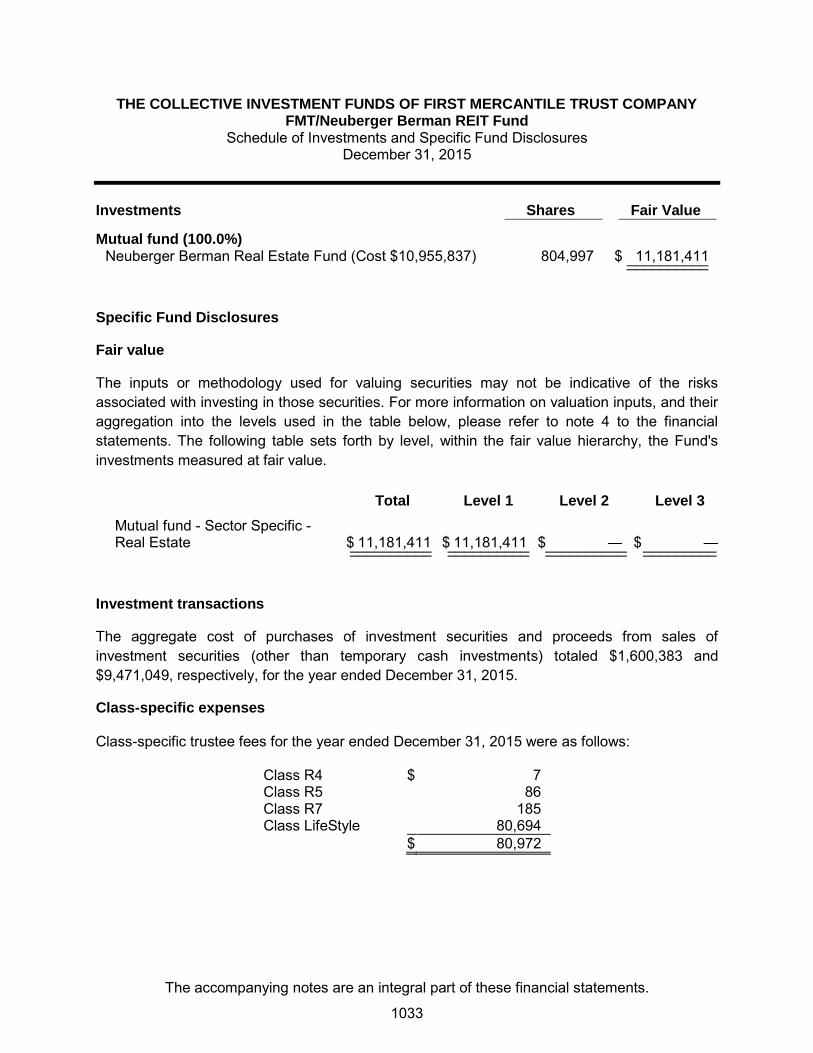
THE COLLECTIVE INVESTMENT FUNDS OF FIRST MERCANTILE TRUST COMPANY FMT/Neuberger Berman REIT Fund
Schedule of Investments and Specific Fund Disclosures December 31, 2015
The accompanying notes are an integral part of these financial statements.
Investments Shares Fair Value ____________ ____________
Mutual fund (100.0%) Neuberger Berman Real Estate Fund (Cost $10,955,837) 804,997 $ 11,181,411 __________ __________
Specific Fund Disclosures
Fair value
The inputs or methodology used for valuing securities may not be indicative of the risks associated with investing in those securities. For more information on valuation inputs, and their aggregation into the levels used in the table below, please refer to note 4 to the financial statements. The following table sets forth by level, within the fair value hierarchy, the Fund's investments measured at fair value.
Total Level 1 Level 2 Level 3
Mutual fund - Sector Specific - Real Estate $ 11,181,411 $ 11,181,411 $ — $ — __________ __________ __________ _________ __________ __________ __________ _________
Investment transactions
The aggregate cost of purchases of investment securities and proceeds from sales of investment securities (other than temporary cash investments) totaled $1,600,383 and $9,471,049, respectively, for the year ended December 31, 2015.
Class-specific expenses Class-specific trustee fees for the year ended December 31, 2015 were as follows: Class R4 $ 7 Class R5 86 Class R7 185 Class LifeStyle 80,694 $ 80,972
1033
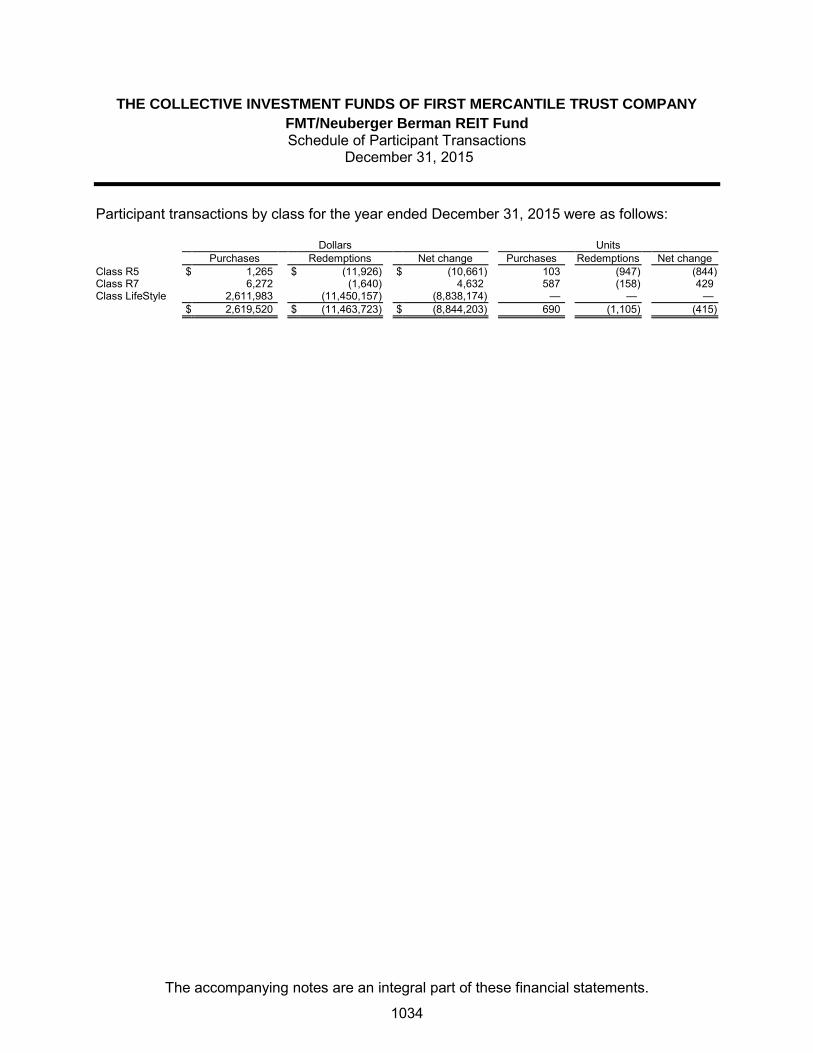
THE COLLECTIVE INVESTMENT FUNDS OF FIRST MERCANTILE TRUST COMPANY
FMT/Neuberger Berman REIT Fund Schedule of Participant Transactions
December 31, 2015
The accompanying notes are an integral part of these financial statements.
Participant transactions by class for the year ended December 31, 2015 were as follows: Dollars Units Purchases Redemptions Net change Purchases Redemptions Net change Class R5 $ 1,265 $ (11,926) $ (10,661) 103 (947) (844) Class R7 6,272 (1,640) 4,632 587 (158) 429 Class LifeStyle 2,611,983 (11,450,157) (8,838,174) — — — $ 2,619,520 $ (11,463,723) $ (8,844,203) 690 (1,105) (415)
1034

THE COLLECTIVE INVESTMENT FUNDS OF FIRST MERCANTILE TRUST COMPANY
FMT/Neuberger Berman REIT Fund Financial Highlights December 31, 2015
The accompanying notes are an integral part of these financial statements.
Change in Net Asset Value Resulting from Operations Ratios (to average net
assets)
NAV per Unit, Beginning of
Period
Net Investment
Income (Loss)(a)
Net Realized and Unrealized
Gain (Loss) from
Investments(a)
Total from Investment Activities
NAV per Unit, End of
Period Total
Return Expenses
Net Investment
Income (Loss)
Class R4 $ 10.7989 $ 0.8889 $ (0.6219) $ 0.2670 $ 11.0659 2.47 % (1.06) % 8.25 % Class R5 11.8954 0.7361 (0.4499) 0.2862 12.1816 2.41 % (1.13) % 6.13 % Class R7 10.7125 0.8710 (0.6510) 0.2200 10.9325 2.05 % (1.47) % 8.18 % (a) Per unit amounts are based on average daily units outstanding.
1035

FMT/Nuveen Real Estate Securities Fund

THE COLLECTIVE INVESTMENT FUNDS OF FIRST MERCANTILE TRUST COMPANY FMT/Nuveen Real Estate Securities Fund
Statement of Assets and Liabilities December 31, 2015
The accompanying notes are an integral part of these financial statements.
Assets Investments in securities, at fair value $ 29,553,983 Receivables
Dividends 240,046Total assets 29,794,029
Liabilities Trustee fees 16,643 Net assets $ 29,777,386 Components of net assets
Units of
Participation NAV
per Unit Net
Assets Class R1 675,608 $ 20.5583 $ 13,889,375Class R2 140,314 $ 16.6547 2,336,882Class R3 303,651 $ 15.9181 4,833,553Class R4 158,741 $ 16.4051 2,604,160Class R5 156,834 $ 16.4808 2,584,752Class R6 102,470 $ 15.5981 1,598,336Class R7 57,256 $ 16.3613 936,778Class R8 62,158 $ 15.9842 993,550
$ 29,777,386
1036

THE COLLECTIVE INVESTMENT FUNDS OF FIRST MERCANTILE TRUST COMPANY FMT/Nuveen Real Estate Securities Fund
Statement of Operations For the Year Ended December 31, 2015
The accompanying notes are an integral part of these financial statements.
Investment income
Dividends $ 2,425,567 Expenses
Trustee fees 210,674Custody fees 11,436Audit fees 1,200
223,310 Net investment income 2,202,257 Net realized gain from investments sold
Proceeds from sales of investments 9,388,977Cost of investments sold 9,005,931
Net realized gain from investments sold 383,046 Change in net unrealized appreciation (depreciation) on investments (1,957,647) Net realized and unrealized loss on investments (1,574,601) Other operating credits (charges) 83,094 Net increase in net assets resulting from operations $ 710,750
1037

THE COLLECTIVE INVESTMENT FUNDS OF FIRST MERCANTILE TRUST COMPANY FMT/Nuveen Real Estate Securities Fund
Statement of Changes in Net Assets For the Year Ended December 31, 2015
The accompanying notes are an integral part of these financial statements.
Operations
Net investment income $ 2,202,257
Net realized gain from investments sold 383,046
Change in net unrealized appreciation (depreciation) on investments (1,957,647)
Other operating credits (charges) 83,094
Net increase in net assets resulting from operations 710,750 Participant transactions
Proceeds from units purchased 9,634,366Less payments for units redeemed 14,974,145
Decrease in net assets from participant transactions (5,339,779)
Total decrease in net assets (4,629,029) Net assets at beginning of year 34,406,415 Net assets at end of year $ 29,777,386
1038

THE COLLECTIVE INVESTMENT FUNDS OF FIRST MERCANTILE TRUST COMPANY FMT/Nuveen Real Estate Securities Fund
Schedule of Investments and Specific Fund Disclosures December 31, 2015
The accompanying notes are an integral part of these financial statements.
Investments Shares Fair Value ____________ ____________
Mutual fund (99.2%) Nuveen Real Estate Securities Fund (Cost $29,220,339) 1,286,634 $ 29,553,983 ____________________ Specific Fund Disclosures Fair value The inputs or methodology used for valuing securities may not be indicative of the risks associated with investing in those securities. For more information on valuation inputs, and their aggregation into the levels used in the table below, please refer to note 4 to the financial statements. The following table sets forth by level, within the fair value hierarchy, the Fund's investments measured at fair value.
Total Level 1 Level 2 Level 3
Mutual fund - Sector Specific - Real Estate $ 29,553,983 $ 29,553,983 $ — $ —__________ __________ __________ ___________________ __________ __________ _________
Investment transactions The aggregate cost of purchases of investment securities and proceeds from sales of investment securities (other than temporary cash investments) totaled $6,092,443 and $9,388,977, respectively, for the year ended December 31, 2015. Class-specific expenses Class-specific trustee fees for the year ended December 31, 2015 were as follows: Class R1 $ 55,176 Class R2 16,681 Class R3 33,869 Class R4 23,479 Class R5 32,102 Class R6 19,566 Class R7 15,831 Class R8 13,970 $ 210,674
1039

THE COLLECTIVE INVESTMENT FUNDS OF FIRST MERCANTILE TRUST COMPANY FMT/Nuveen Real Estate Securities Fund
Schedule of Participant Transactions December 31, 2015
The accompanying notes are an integral part of these financial statements.
Participant transactions by class for the year ended December 31, 2015 were as follows: Dollars Units Purchases Redemptions Net change Purchases Redemptions Net change Class R1 $ 2,257,976 $ (6,168,906) $ (3,910,930) 112,631 (311,589) (198,958)Class R2 762,177 (1,897,937) (1,135,760) 46,980 (117,112) (70,132)Class R3 1,836,225 (1,456,586) 379,639 118,790 (95,810) 22,980Class R4 1,772,101 (1,457,639) 314,462 109,686 (91,338) 18,348Class R5 852,163 (2,170,504) (1,318,341) 52,693 (135,102) (82,409)Class R6 516,984 (835,015) (318,031) 34,153 (54,993) (20,840)Class R7 1,049,033 (843,911) 205,122 62,840 (52,554) 10,286Class R8 587,707 (143,647) 444,060 36,309 (9,380) 26,929 $ 9,634,366 $ (14,974,145) $ (5,339,779) 574,082 (867,878) (293,796)
1040

THE COLLECTIVE INVESTMENT FUNDS OF FIRST MERCANTILE TRUST COMPANY FMT/Nuveen Real Estate Securities Fund
Financial Highlights December 31, 2015
The accompanying notes are an integral part of these financial statements.
Change in Net Asset Value Resulting from Operations Ratios (to average net
assets)
NAV per Unit, Beginning of
Period
Net Investment
Income (Loss)(a)
Net Realized and Unrealized
Gain (Loss) from
Investments(a)
Total from Investment Activities
NAV per Unit, End of
Period Total
Return Expenses
Net Investment
Income (Loss)
Class R1 $ 19.8949 $ 1.4344 $ (0.7710) $ 0.6634 $ 20.5583 3.33% (0.39)% 7.19%Class R2 16.1530 1.0719 (0.5702) 0.5017 16.6547 3.11% (0.61)% 6.61%Class R3 15.4651 1.1732 (0.7202) 0.4530 15.9181 2.93% (0.78)% 7.58%Class R4 15.9655 1.1514 (0.7118) 0.4396 16.4051 2.75% (0.95)% 7.23%Class R5 16.0667 1.0310 (0.6169) 0.4141 16.4808 2.58% (1.12)% 6.40%Class R6 15.2322 1.0530 (0.6871) 0.3659 15.5981 2.40% (1.29)% 6.91%Class R7 16.0047 0.9347 (0.5781) 0.3566 16.3613 2.23% (1.46)% 5.90%Class R8 15.6626 1.0850 (0.7634) 0.3216 15.9842 2.05% (1.63)% 6.99%
(a) Per unit amounts are based on average daily units outstanding.
1041
FMT/PIMCO All Asset All Authority Fund

THE COLLECTIVE INVESTMENT FUNDS OF FIRST MERCANTILE TRUST COMPANY FMT/PIMCO All Asset All Authority Fund
Statement of Assets and Liabilities December 31, 2015
The accompanying notes are an integral part of these financial statements.
Assets Investments in securities, at fair value $ 2,786,264 Receivables
Dividends 80,518Total assets 2,866,782
Liabilities Trustee fees 1,777 Net assets $ 2,865,005 Components of net assets
Units of
Participation NAV
per Unit Net
Assets Class R1 110,016 $ 9.5569 $ 1,051,416Class R2 19,514 $ 9.2687 180,870Class R3 37,211 $ 8.7125 324,201Class R4 71,657 $ 8.7659 628,132Class R5 55,129 $ 9.3379 514,787Class R6 9,009 $ 8.4637 76,247Class R7 9,857 $ 9.0652 89,352
$ 2,865,005
1042

THE COLLECTIVE INVESTMENT FUNDS OF FIRST MERCANTILE TRUST COMPANY FMT/PIMCO All Asset All Authority Fund
Statement of Operations For the Year Ended December 31, 2015
The accompanying notes are an integral part of these financial statements.
Investment income
Dividends $ 169,195 Expenses
Trustee fees 29,863Custody fees 1,649Audit fees 1,200
32,712 Net investment income 136,483 Net realized loss from investments sold
Proceeds from sales of investments 3,549,244Cost of investments sold 4,221,228
Net realized loss from investments sold (671,984) Change in net unrealized appreciation (depreciation) on investments 69,148 Net realized and unrealized loss on investments (602,836) Net decrease in net assets resulting from operations $ (466,353)
1043

THE COLLECTIVE INVESTMENT FUNDS OF FIRST MERCANTILE TRUST COMPANY FMT/PIMCO All Asset All Authority Fund
Statement of Changes in Net Assets For the Year Ended December 31, 2015
The accompanying notes are an integral part of these financial statements.
Operations
Net investment income $ 136,483
Net realized loss from investments sold (671,984)
Change in net unrealized appreciation (depreciation) on investments 69,148
Net decrease in net assets resulting from operations (466,353) Participant transactions
Proceeds from units purchased 1,130,025Less payments for units redeemed 4,260,038
Decrease in net assets from participant transactions (3,130,013)
Total decrease in net assets (3,596,366) Net assets at beginning of year 6,461,371 Net assets at end of year $ 2,865,005
1044

THE COLLECTIVE INVESTMENT FUNDS OF FIRST MERCANTILE TRUST COMPANY FMT/PIMCO All Asset All Authority Fund
Schedule of Investments and Specific Fund Disclosures December 31, 2015
The accompanying notes are an integral part of these financial statements.
Investments Shares Fair Value ____________ ____________
Mutual fund (97.3%) PIMCO All Asset All Authority Fund (Cost $3,785,696) 364,218 $ 2,786,264 ____________________ Specific Fund Disclosures Fair value The inputs or methodology used for valuing securities may not be indicative of the risks associated with investing in those securities. For more information on valuation inputs, and their aggregation into the levels used in the table below, please refer to note 4 to the financial statements. The following table sets forth by level, within the fair value hierarchy, the Fund's investments measured at fair value.
Total Level 1 Level 2 Level 3
Mutual fund - Tactical Asset Allocation $ 2,786,264 $ 2,786,264 $ — $ —__________ __________ __________ ___________________ __________ __________ _________
Investment transactions The aggregate cost of purchases of investment securities and proceeds from sales of investment securities (other than temporary cash investments) totaled $472,870 and $3,549,244, respectively, for the year ended December 31, 2015. Class-specific expenses Class-specific trustee fees for the year ended December 31, 2015 were as follows: Class R1 $ 5,075 Class R2 802 Class R3 6,365 Class R4 7,592 Class R5 5,813 Class R6 2,357 Class R7 1,779 Class R8 80 $ 29,863
1045

THE COLLECTIVE INVESTMENT FUNDS OF FIRST MERCANTILE TRUST COMPANY FMT/PIMCO All Asset All Authority Fund
Schedule of Participant Transactions December 31, 2015
The accompanying notes are an integral part of these financial statements.
Participant transactions by class for the year ended December 31, 2015 were as follows: Dollars Units Purchases Redemptions Net change Purchases Redemptions Net change Class R1 $ 256,409 $ (1,496,666) $ (1,240,257) 24,648 (139,821) (115,173)Class R2 251,496 (137,632) 113,864 26,427 (14,896) 11,531Class R3 115,899 (1,174,358) (1,058,459) 11,824 (122,027) (110,203)Class R4 87,965 (564,946) (476,981) 9,180 (57,457) (48,277)Class R5 378,445 (254,920) 123,525 35,471 (24,846) 10,625Class R6 22,289 (345,832) (323,543) 2,324 (35,319) (32,995)Class R7 17,522 (61,719) (44,197) 1,742 (6,226) (4,484)Class R8 — (223,965) (223,965) — (23,196) (23,196) $ 1,130,025 $ (4,260,038) $ (3,130,013) 111,616 (423,788) (312,172)
1046
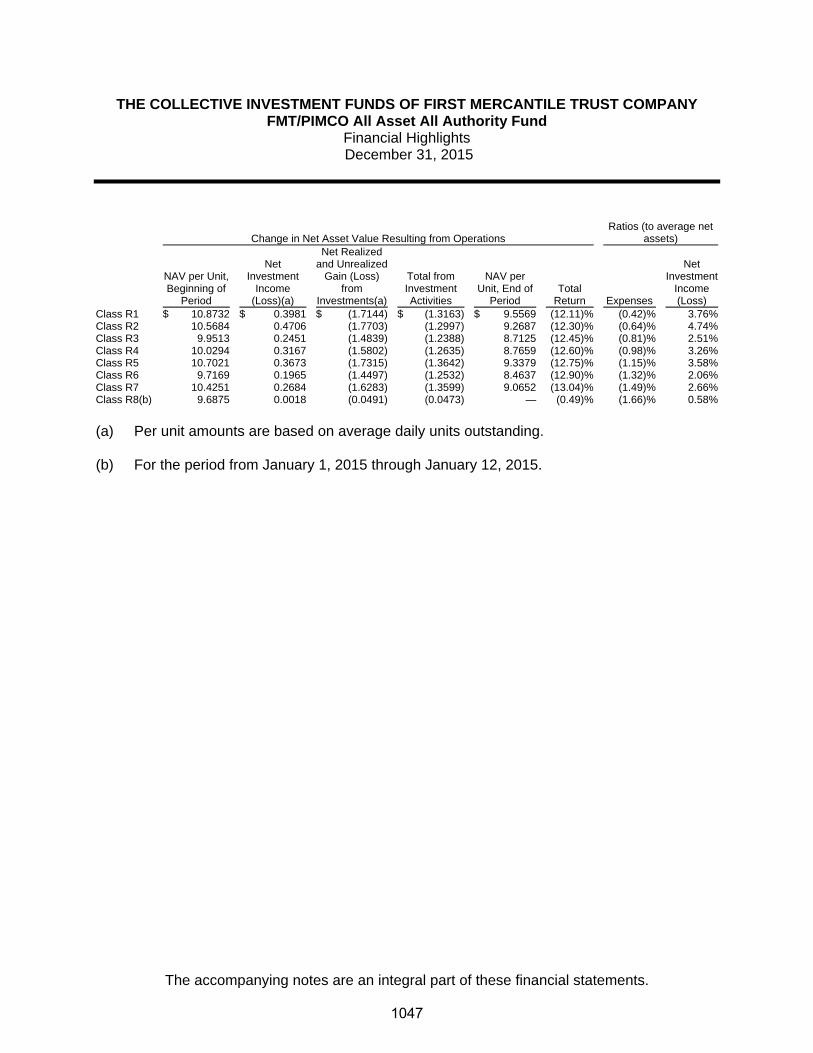
THE COLLECTIVE INVESTMENT FUNDS OF FIRST MERCANTILE TRUST COMPANY FMT/PIMCO All Asset All Authority Fund
Financial Highlights December 31, 2015
The accompanying notes are an integral part of these financial statements.
Change in Net Asset Value Resulting from Operations Ratios (to average net
assets)
NAV per Unit, Beginning of
Period
Net Investment
Income (Loss)(a)
Net Realized and Unrealized
Gain (Loss) from
Investments(a)
Total from Investment Activities
NAV per Unit, End of
Period Total
Return Expenses
Net Investment
Income (Loss)
Class R1 $ 10.8732 $ 0.3981 $ (1.7144) $ (1.3163) $ 9.5569 (12.11)% (0.42)% 3.76%Class R2 10.5684 0.4706 (1.7703) (1.2997) 9.2687 (12.30)% (0.64)% 4.74%Class R3 9.9513 0.2451 (1.4839) (1.2388) 8.7125 (12.45)% (0.81)% 2.51%Class R4 10.0294 0.3167 (1.5802) (1.2635) 8.7659 (12.60)% (0.98)% 3.26%Class R5 10.7021 0.3673 (1.7315) (1.3642) 9.3379 (12.75)% (1.15)% 3.58%Class R6 9.7169 0.1965 (1.4497) (1.2532) 8.4637 (12.90)% (1.32)% 2.06%Class R7 10.4251 0.2684 (1.6283) (1.3599) 9.0652 (13.04)% (1.49)% 2.66%Class R8(b) 9.6875 0.0018 (0.0491) (0.0473) — (0.49)% (1.66)% 0.58%
(a) Per unit amounts are based on average daily units outstanding.
(b) For the period from January 1, 2015 through January 12, 2015.
1047

FMT/SPDR Energy Sector ETF
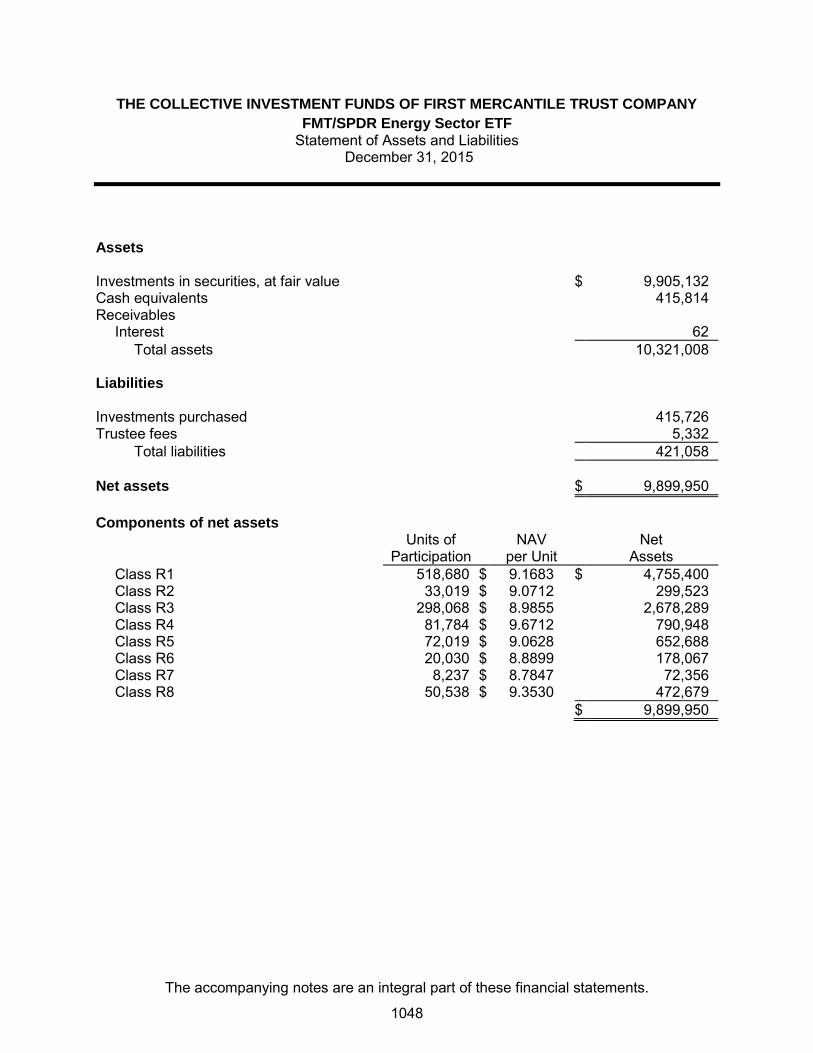
THE COLLECTIVE INVESTMENT FUNDS OF FIRST MERCANTILE TRUST COMPANY
FMT/SPDR Energy Sector ETF Statement of Assets and Liabilities
December 31, 2015
The accompanying notes are an integral part of these financial statements.
Assets Investments in securities, at fair value $ 9,905,132 Cash equivalents 415,814
Receivables
Interest 62
Total assets 10,321,008
Liabilities Investments purchased 415,726
Trustee fees 5,332
Total liabilities 421,058
Net assets $ 9,899,950
Components of net assets
Units of
Participation NAV
per Unit Net
Assets Class R1 518,680 $ 9.1683 $ 4,755,400
Class R2 33,019 $ 9.0712 299,523
Class R3 298,068 $ 8.9855 2,678,289
Class R4 81,784 $ 9.6712 790,948
Class R5 72,019 $ 9.0628 652,688
Class R6 20,030 $ 8.8899 178,067
Class R7 8,237 $ 8.7847 72,356
Class R8 50,538 $ 9.3530 472,679
$ 9,899,950
1048

THE COLLECTIVE INVESTMENT FUNDS OF FIRST MERCANTILE TRUST COMPANY
FMT/SPDR Energy Sector ETF Statement of Operations
For the Year Ended December 31, 2015
The accompanying notes are an integral part of these financial statements.
Investment income
Dividends $ 293,309
Interest 195
293,504
Expenses
Trustee fees 67,247
Custody fees 4,898
Audit fees 1,200
73,345
Net investment income 220,159
Net realized gain from investments sold
Proceeds from sales of investments 2,000,443
Cost of investments sold 1,999,429
Net realized gain from investments sold 1,014
Change in net unrealized appreciation (depreciation) on investments (2,525,688)
Net realized and unrealized loss on investments (2,524,674)
Net decrease in net assets resulting from operations $ (2,304,515)
1049

THE COLLECTIVE INVESTMENT FUNDS OF FIRST MERCANTILE TRUST COMPANY
FMT/SPDR Energy Sector ETF Statement of Changes in Net Assets
For the Year Ended December 31, 2015
The accompanying notes are an integral part of these financial statements.
Operations
Net investment income $ 220,159
Net realized gain from investments sold 1,014
Change in net unrealized appreciation (depreciation) on investments (2,525,688)
Net decrease in net assets resulting from operations (2,304,515)
Participant transactions
Proceeds from units purchased 6,451,659
Less payments for units redeemed 4,672,353
Increase in net assets from participant transactions 1,779,306
Total decrease in net assets (525,209)
Net assets at beginning of year 10,425,159
Net assets at end of year $ 9,899,950
1050

THE COLLECTIVE INVESTMENT FUNDS OF FIRST MERCANTILE TRUST COMPANY FMT/SPDR Energy Sector ETF
Schedule of Investments and Specific Fund Disclosures December 31, 2015
The accompanying notes are an integral part of these financial statements.
Investments Shares Fair Value ____________ ____________
Exchange-traded fund (100.1%) Energy Select Sector SPDR Fund (Cost $11,368,451) 163,586 $ 9,905,132 __________ __________
Specific Fund Disclosures
Fair value
The inputs or methodology used for valuing securities may not be indicative of the risks associated with investing in those securities. For more information on valuation inputs, and their aggregation into the levels used in the table below, please refer to note 4 to the financial statements. The following table sets forth by level, within the fair value hierarchy, the Fund's investments measured at fair value.
Total Level 1 Level 2 Level 3
Exchange-traded fund - Sector Specific - Energy $ 9,905,132 $ 9,905,132 $ — $ — __________ __________ __________ _________ __________ __________ __________ _________
Investment transactions
The aggregate cost of purchases of investment securities and proceeds from sales of investment securities (other than temporary cash investments) totaled $4,404,397 and $2,000,443, respectively, for the year ended December 31, 2015.
Class-specific expenses Class-specific trustee fees for the year ended December 31, 2015 were as follows: Class R1 $ 18,299 Class R2 1,972 Class R3 17,895 Class R4 8,673 Class R5 8,147 Class R6 2,899 Class R7 1,348 Class R8 8,014 $ 67,247
1051

THE COLLECTIVE INVESTMENT FUNDS OF FIRST MERCANTILE TRUST COMPANY
FMT/SPDR Energy Sector ETF Schedule of Participant Transactions
December 31, 2015
The accompanying notes are an integral part of these financial statements.
Participant transactions by class for the year ended December 31, 2015 were as follows: Dollars Units Purchases Redemptions Net change Purchases Redemptions Net change Class R1 $ 2,095,953 $ (1,497,817) $ 598,136 198,071 (140,615) 57,456 Class R2 248,288 (146,698) 101,590 23,681 (15,021) 8,660 Class R3 1,611,371 (441,677) 1,169,694 155,816 (41,637) 114,179 Class R4 1,628,437 (1,368,215) 260,222 155,188 (121,911) 33,277 Class R5 474,779 (896,051) (421,272) 45,614 (80,913) (35,299) Class R6 57,827 (173,211) (115,384) 5,697 (15,373) (9,676) Class R7 32,969 (31,509) 1,460 3,600 (3,567) 33 Class R8 302,035 (117,175) 184,860 26,979 (10,067) 16,912 $ 6,451,659 $ (4,672,353) $ 1,779,306 614,646 (429,104) 185,542
1052

THE COLLECTIVE INVESTMENT FUNDS OF FIRST MERCANTILE TRUST COMPANY
FMT/SPDR Energy Sector ETF Financial Highlights December 31, 2015
The accompanying notes are an integral part of these financial statements.
Change in Net Asset Value Resulting from Operations Ratios (to average net
assets)
NAV per Unit, Beginning of
Period
Net Investment
Income (Loss)(a)
Net Realized and Unrealized
Gain (Loss) from
Investments(a)
Total from Investment Activities
NAV per Unit, End of
Period Total
Return Expenses
Net Investment
Income (Loss)
Class R1 $ 11.6302 $ 0.2553 $ (2.7172) $ (2.4619) $ 9.1683 (21.17) % (0.41) % 2.38 % Class R2 11.5326 0.2367 (2.6981) (2.4614) 9.0712 (21.34) % (0.63) % 2.23 % Class R3 11.4433 0.2183 (2.6761) (2.4578) 8.9855 (21.48) % (0.80) % 2.08 % Class R4 12.3377 0.1846 (2.8511) (2.6665) 9.6712 (21.61) % (0.97) % 1.64 % Class R5 11.5813 0.1724 (2.6909) (2.5185) 9.0628 (21.75) % (1.14) % 1.61 % Class R6 11.3800 0.1475 (2.6376) (2.4901) 8.8899 (21.88) % (1.31) % 1.39 % Class R7 11.2647 0.1180 (2.5980) (2.4800) 8.7847 (22.02) % (1.48) % 1.14 % Class R8 12.0139 0.1254 (2.7863) (2.6609) 9.3530 (22.15) % (1.65) % 1.14 % (a) Per unit amounts are based on average daily units outstanding.
1053

FMT/SPDR Gold ETF

THE COLLECTIVE INVESTMENT FUNDS OF FIRST MERCANTILE TRUST COMPANY
FMT/SPDR Gold ETF Statement of Assets and Liabilities
December 31, 2015
The accompanying notes are an integral part of these financial statements.
Assets Investments in securities, at fair value $ 4,308,296 Cash equivalents 145,567
Receivables
Interest 91
Total assets 4,453,954
Liabilities Investments purchased 145,365
Trustee fees 3,474
Total liabilities 148,839
Net assets $ 4,305,115
Components of net assets
Units of
Participation NAV
per Unit Net
Assets Class R1 230,521 $ 6.3225 $ 1,457,461
Class R2 446 $ 6.3420 2,829
Class R3 56,481 $ 6.2103 350,770
Class R4 53,178 $ 6.4583 343,439
Class R5 28,146 $ 6.2031 174,590
Class R6 87,149 $ 5.7543 501,478
Class R7 139,949 $ 6.3267 885,415
Class R8 93,758 $ 6.2835 589,133
$ 4,305,115
1054

THE COLLECTIVE INVESTMENT FUNDS OF FIRST MERCANTILE TRUST COMPANY
FMT/SPDR Gold ETF Statement of Operations
For the Year Ended December 31, 2015
The accompanying notes are an integral part of these financial statements.
Investment income
Interest $ 156
Expenses
Trustee fees 45,640
Custody fees 4,788
Audit fees 1,200
51,628
Net investment loss (51,472)
Net realized loss from investments sold
Proceeds from sales of investments 1,741,588
Cost of investments sold 2,182,287
Net realized loss from investments sold (440,699)
Change in net unrealized appreciation (depreciation) on investments (82,194)
Net realized and unrealized loss on investments (522,893)
Net decrease in net assets resulting from operations $ (574,365)
1055

THE COLLECTIVE INVESTMENT FUNDS OF FIRST MERCANTILE TRUST COMPANY
FMT/SPDR Gold ETF Statement of Changes in Net Assets
For the Year Ended December 31, 2015
The accompanying notes are an integral part of these financial statements.
Operations
Net investment loss $ (51,472)
Net realized loss from investments sold (440,699)
Change in net unrealized appreciation (depreciation) on investments (82,194)
Net decrease in net assets resulting from operations (574,365)
Participant transactions
Proceeds from units purchased 1,748,303
Less payments for units redeemed 1,980,169
Decrease in net assets from participant transactions (231,866)
Total decrease in net assets (806,231)
Net assets at beginning of year 5,111,346
Net assets at end of year $ 4,305,115
1056

THE COLLECTIVE INVESTMENT FUNDS OF FIRST MERCANTILE TRUST COMPANY FMT/SPDR Gold ETF
Schedule of Investments and Specific Fund Disclosures December 31, 2015
The accompanying notes are an integral part of these financial statements.
Investments Shares Fair Value ____________ ____________
Exchange-traded fund (100.1%) SPDR Gold Shares (Cost $5,618,470) 42,463 $ 4,308,296 __________ __________
Specific Fund Disclosures
Fair value
The inputs or methodology used for valuing securities may not be indicative of the risks associated with investing in those securities. For more information on valuation inputs, and their aggregation into the levels used in the table below, please refer to note 4 to the financial statements. The following table sets forth by level, within the fair value hierarchy, the Fund's investments measured at fair value.
Total Level 1 Level 2 Level 3
Exchange-traded fund - Sector Specific - Precious Metals $ 4,308,296 $ 4,308,296 $ — $ — __________ __________ __________ _________ __________ __________ __________ _________
Investment transactions
The aggregate cost of purchases of investment securities and proceeds from sales of investment securities (other than temporary cash investments) totaled $1,173,751 and $1,741,588, respectively, for the year ended December 31, 2015.
Class-specific expenses Class-specific trustee fees for the year ended December 31, 2015 were as follows: Class R1 $ 6,873 Class R2 490 Class R3 2,747 Class R4 3,637 Class R5 1,947 Class R6 1,853 Class R7 18,832 Class R8 9,261 $ 45,640
1057
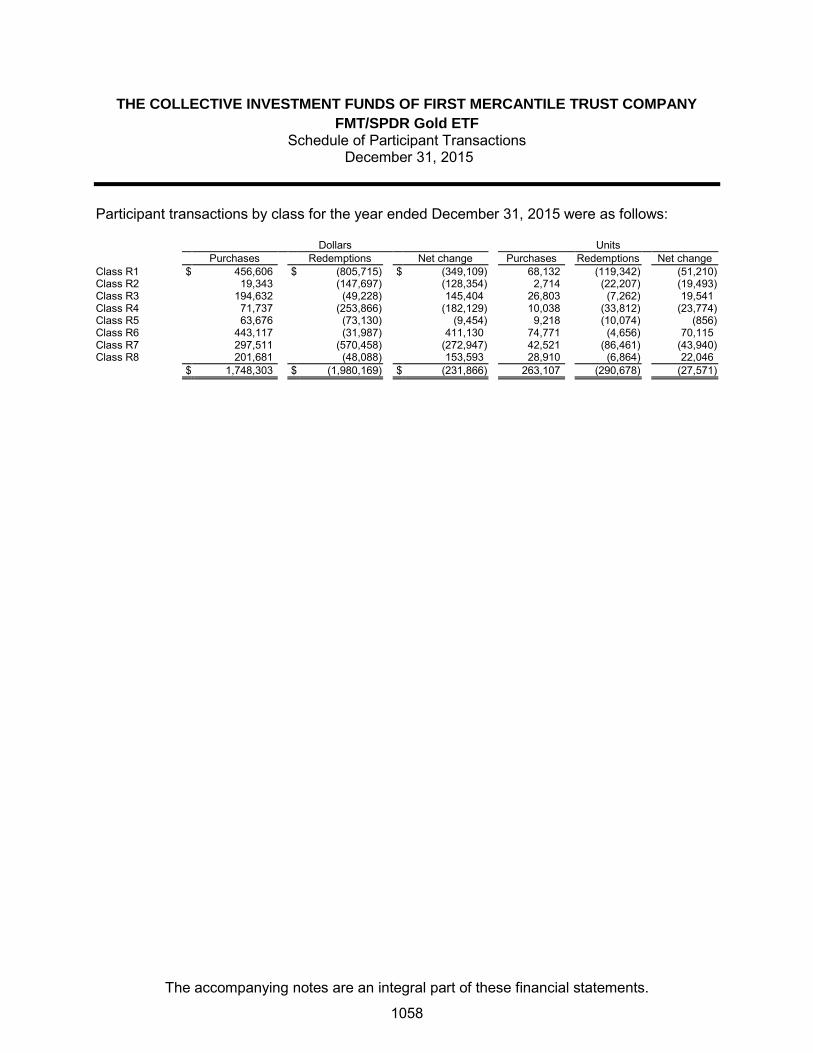
THE COLLECTIVE INVESTMENT FUNDS OF FIRST MERCANTILE TRUST COMPANY
FMT/SPDR Gold ETF Schedule of Participant Transactions
December 31, 2015
The accompanying notes are an integral part of these financial statements.
Participant transactions by class for the year ended December 31, 2015 were as follows: Dollars Units Purchases Redemptions Net change Purchases Redemptions Net change Class R1 $ 456,606 $ (805,715) $ (349,109) 68,132 (119,342) (51,210) Class R2 19,343 (147,697) (128,354) 2,714 (22,207) (19,493) Class R3 194,632 (49,228) 145,404 26,803 (7,262) 19,541 Class R4 71,737 (253,866) (182,129) 10,038 (33,812) (23,774) Class R5 63,676 (73,130) (9,454) 9,218 (10,074) (856) Class R6 443,117 (31,987) 411,130 74,771 (4,656) 70,115 Class R7 297,511 (570,458) (272,947) 42,521 (86,461) (43,940) Class R8 201,681 (48,088) 153,593 28,910 (6,864) 22,046 $ 1,748,303 $ (1,980,169) $ (231,866) 263,107 (290,678) (27,571)
1058
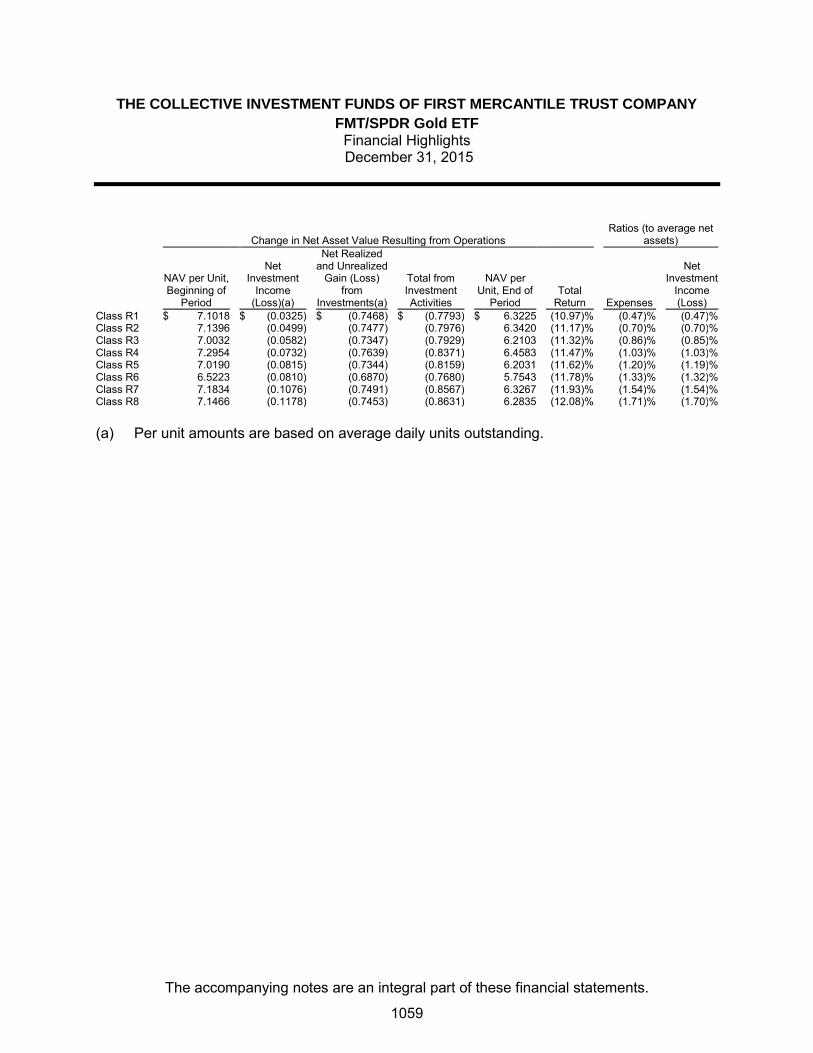
THE COLLECTIVE INVESTMENT FUNDS OF FIRST MERCANTILE TRUST COMPANY
FMT/SPDR Gold ETF Financial Highlights December 31, 2015
The accompanying notes are an integral part of these financial statements.
Change in Net Asset Value Resulting from Operations Ratios (to average net
assets)
NAV per Unit, Beginning of
Period
Net Investment
Income (Loss)(a)
Net Realized and Unrealized
Gain (Loss) from
Investments(a)
Total from Investment Activities
NAV per Unit, End of
Period Total
Return Expenses
Net Investment
Income (Loss)
Class R1 $ 7.1018 $ (0.0325) $ (0.7468) $ (0.7793) $ 6.3225 (10.97) % (0.47) % (0.47) % Class R2 7.1396 (0.0499) (0.7477) (0.7976) 6.3420 (11.17) % (0.70) % (0.70) % Class R3 7.0032 (0.0582) (0.7347) (0.7929) 6.2103 (11.32) % (0.86) % (0.85) % Class R4 7.2954 (0.0732) (0.7639) (0.8371) 6.4583 (11.47) % (1.03) % (1.03) % Class R5 7.0190 (0.0815) (0.7344) (0.8159) 6.2031 (11.62) % (1.20) % (1.19) % Class R6 6.5223 (0.0810) (0.6870) (0.7680) 5.7543 (11.78) % (1.33) % (1.32) % Class R7 7.1834 (0.1076) (0.7491) (0.8567) 6.3267 (11.93) % (1.54) % (1.54) % Class R8 7.1466 (0.1178) (0.7453) (0.8631) 6.2835 (12.08) % (1.71) % (1.70) % (a) Per unit amounts are based on average daily units outstanding.
1059

FMT/SPDR Health Care Sector ETF
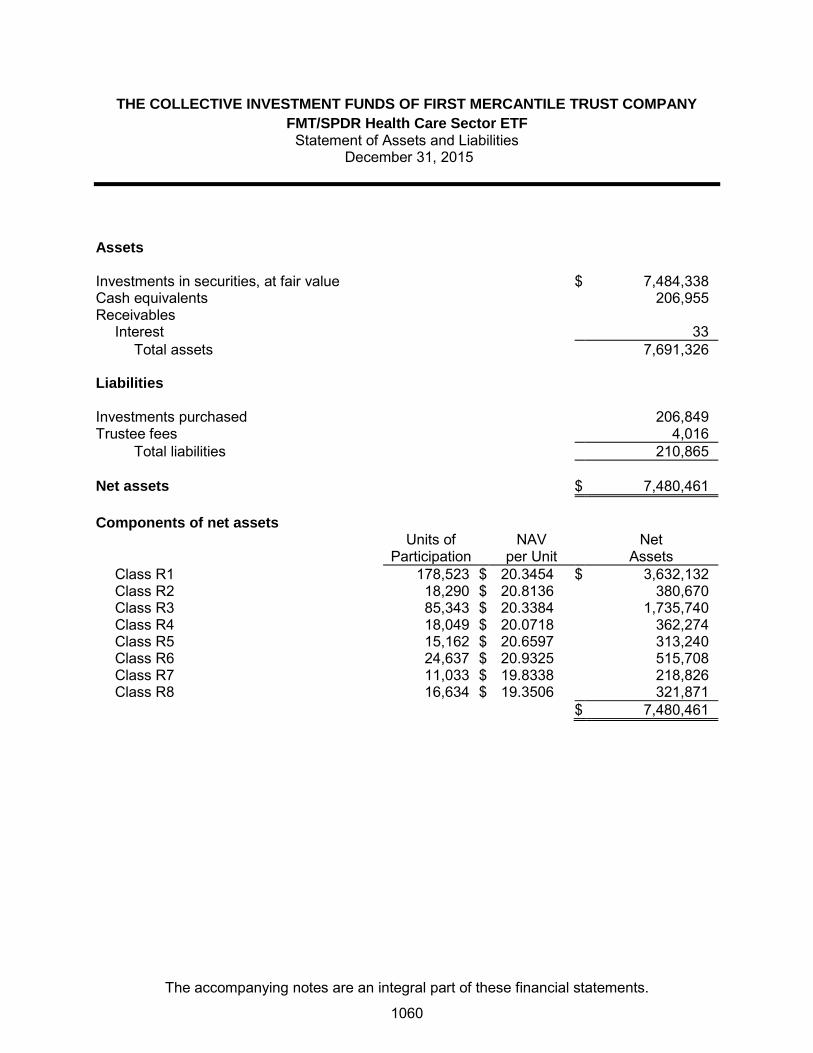
THE COLLECTIVE INVESTMENT FUNDS OF FIRST MERCANTILE TRUST COMPANY
FMT/SPDR Health Care Sector ETF Statement of Assets and Liabilities
December 31, 2015
The accompanying notes are an integral part of these financial statements.
Assets Investments in securities, at fair value $ 7,484,338 Cash equivalents 206,955
Receivables
Interest 33
Total assets 7,691,326
Liabilities Investments purchased 206,849
Trustee fees 4,016
Total liabilities 210,865
Net assets $ 7,480,461
Components of net assets
Units of
Participation NAV
per Unit Net
Assets Class R1 178,523 $ 20.3454 $ 3,632,132
Class R2 18,290 $ 20.8136 380,670
Class R3 85,343 $ 20.3384 1,735,740
Class R4 18,049 $ 20.0718 362,274
Class R5 15,162 $ 20.6597 313,240
Class R6 24,637 $ 20.9325 515,708
Class R7 11,033 $ 19.8338 218,826
Class R8 16,634 $ 19.3506 321,871
$ 7,480,461
1060

THE COLLECTIVE INVESTMENT FUNDS OF FIRST MERCANTILE TRUST COMPANY
FMT/SPDR Health Care Sector ETF Statement of Operations
For the Year Ended December 31, 2015
The accompanying notes are an integral part of these financial statements.
Investment income
Dividends $ 77,880
Interest 127
78,007
Expenses
Trustee fees 34,033
Custody fees 4,902
Audit fees 1,200
40,135
Net investment income 37,872
Net realized gain from investments sold
Proceeds from sales of investments 861,654
Cost of investments sold 578,295
Net realized gain from investments sold 283,359
Change in net unrealized appreciation (depreciation) on investments 49,456
Net realized and unrealized gain on investments 332,815
Net increase in net assets resulting from operations $ 370,687
1061

THE COLLECTIVE INVESTMENT FUNDS OF FIRST MERCANTILE TRUST COMPANY
FMT/SPDR Health Care Sector ETF Statement of Changes in Net Assets
For the Year Ended December 31, 2015
The accompanying notes are an integral part of these financial statements.
Operations
Net investment income $ 37,872
Net realized gain from investments sold 283,359
Change in net unrealized appreciation (depreciation) on investments 49,456
Net increase in net assets resulting from operations 370,687
Participant transactions
Proceeds from units purchased 4,277,370
Less payments for units redeemed 1,759,000
Increase in net assets from participant transactions 2,518,370
Total increase in net assets 2,889,057
Net assets at beginning of year 4,591,404
Net assets at end of year $ 7,480,461
1062
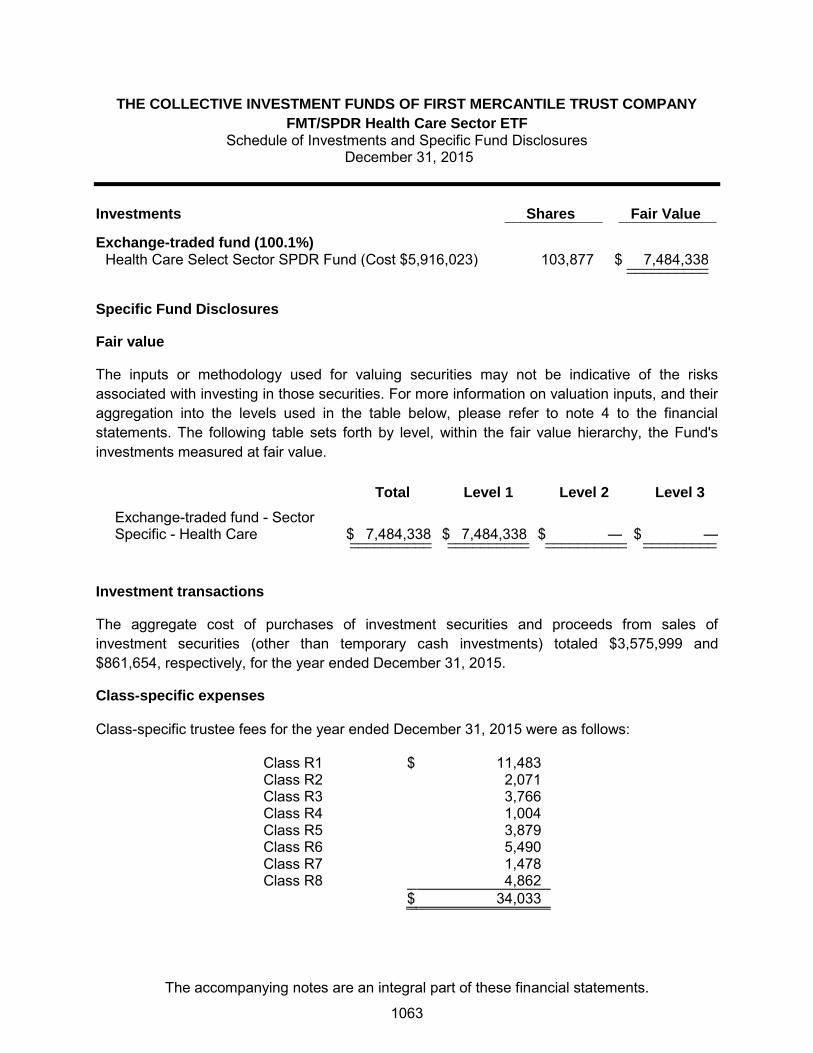
THE COLLECTIVE INVESTMENT FUNDS OF FIRST MERCANTILE TRUST COMPANY
FMT/SPDR Health Care Sector ETF Schedule of Investments and Specific Fund Disclosures
December 31, 2015
The accompanying notes are an integral part of these financial statements.
Investments Shares Fair Value ____________ ____________
Exchange-traded fund (100.1%) Health Care Select Sector SPDR Fund (Cost $5,916,023) 103,877 $ 7,484,338 __________ __________
Specific Fund Disclosures
Fair value
The inputs or methodology used for valuing securities may not be indicative of the risks associated with investing in those securities. For more information on valuation inputs, and their aggregation into the levels used in the table below, please refer to note 4 to the financial statements. The following table sets forth by level, within the fair value hierarchy, the Fund's investments measured at fair value.
Total Level 1 Level 2 Level 3
Exchange-traded fund - Sector Specific - Health Care $ 7,484,338 $ 7,484,338 $ — $ — __________ __________ __________ _________ __________ __________ __________ _________
Investment transactions
The aggregate cost of purchases of investment securities and proceeds from sales of investment securities (other than temporary cash investments) totaled $3,575,999 and $861,654, respectively, for the year ended December 31, 2015.
Class-specific expenses Class-specific trustee fees for the year ended December 31, 2015 were as follows: Class R1 $ 11,483 Class R2 2,071 Class R3 3,766 Class R4 1,004 Class R5 3,879 Class R6 5,490 Class R7 1,478 Class R8 4,862 $ 34,033
1063
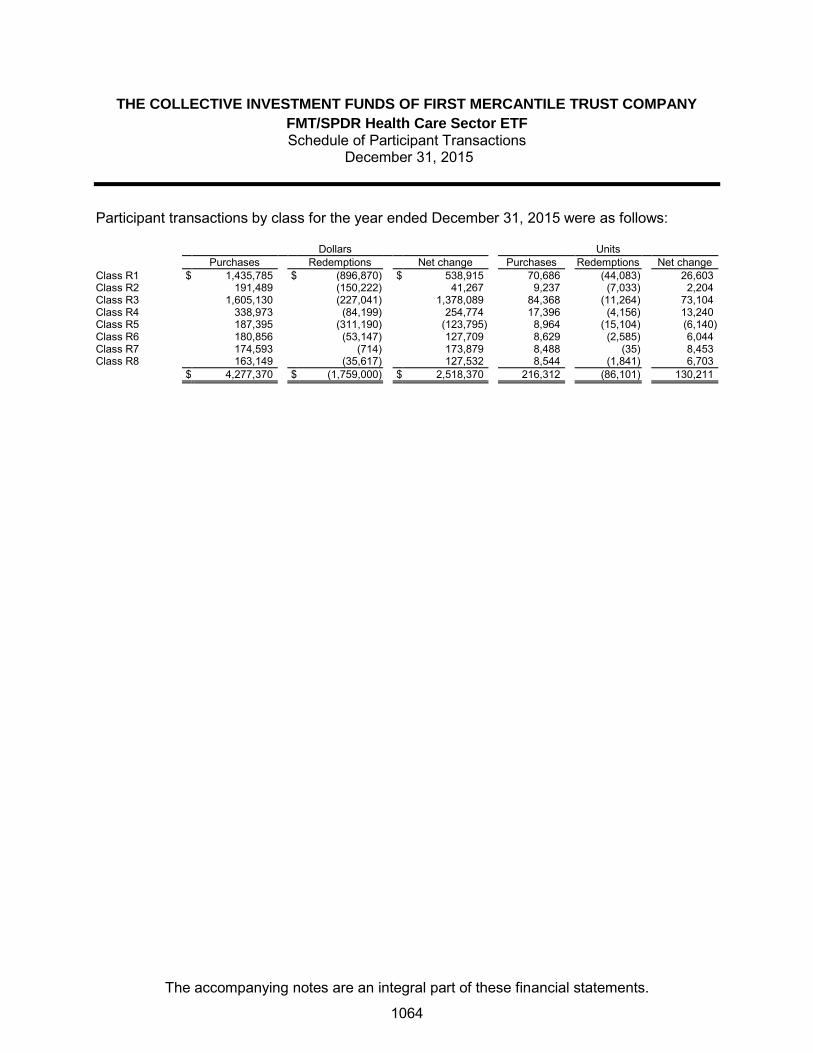
THE COLLECTIVE INVESTMENT FUNDS OF FIRST MERCANTILE TRUST COMPANY
FMT/SPDR Health Care Sector ETF Schedule of Participant Transactions
December 31, 2015
The accompanying notes are an integral part of these financial statements.
Participant transactions by class for the year ended December 31, 2015 were as follows: Dollars Units Purchases Redemptions Net change Purchases Redemptions Net change Class R1 $ 1,435,785 $ (896,870) $ 538,915 70,686 (44,083) 26,603 Class R2 191,489 (150,222) 41,267 9,237 (7,033) 2,204 Class R3 1,605,130 (227,041) 1,378,089 84,368 (11,264) 73,104 Class R4 338,973 (84,199) 254,774 17,396 (4,156) 13,240 Class R5 187,395 (311,190) (123,795) 8,964 (15,104) (6,140) Class R6 180,856 (53,147) 127,709 8,629 (2,585) 6,044 Class R7 174,593 (714) 173,879 8,488 (35) 8,453 Class R8 163,149 (35,617) 127,532 8,544 (1,841) 6,703 $ 4,277,370 $ (1,759,000) $ 2,518,370 216,312 (86,101) 130,211
1064

THE COLLECTIVE INVESTMENT FUNDS OF FIRST MERCANTILE TRUST COMPANY
FMT/SPDR Health Care Sector ETF Financial Highlights December 31, 2015
The accompanying notes are an integral part of these financial statements.
Change in Net Asset Value Resulting from Operations Ratios (to average net
assets)
NAV per Unit, Beginning of
Period
Net Investment
Income (Loss)(a)
Net Realized and Unrealized
Gain (Loss) from
Investments(a)
Total from Investment Activities
NAV per Unit, End of
Period Total
Return Expenses
Net Investment
Income (Loss)
Class R1 $ 19.2378 $ 0.1822 $ 0.9254 $ 1.1076 $ 20.3454 5.76 % (0.47) % 0.90 % Class R2 19.7241 0.1410 0.9485 1.0895 20.8136 5.52 % (0.69) % 0.68 % Class R3 19.3069 0.2273 0.8042 1.0315 20.3384 5.34 % (0.81) % 1.14 % Class R4 19.0864 0.0760 0.9094 0.9854 20.0718 5.16 % (1.01) % 0.38 % Class R5 19.6785 0.0323 0.9489 0.9812 20.6597 4.99 % (1.20) % 0.16 % Class R6 19.9728 0.0069 0.9528 0.9597 20.9325 4.81 % (1.36) % 0.03 % Class R7 18.9563 0.0265 0.8510 0.8775 19.8338 4.63 % (1.52) % 0.13 % Class R8 18.5265 (0.0662) 0.8903 0.8241 19.3506 4.45 % (1.71) % (0.34) % (a) Per unit amounts are based on average daily units outstanding.
1065

FMT/SPDR Technology Sector ETF

THE COLLECTIVE INVESTMENT FUNDS OF FIRST MERCANTILE TRUST COMPANY
FMT/SPDR Technology Sector ETF Statement of Assets and Liabilities
December 31, 2015
The accompanying notes are an integral part of these financial statements.
Assets Investments in securities, at fair value $ 5,454,144 Cash equivalents 219,001
Receivables
Dividends and interest 663
Total assets 5,673,808
Liabilities Investments purchased 218,939
Trustee fees 2,812
Total liabilities 221,751
Net assets $ 5,452,057
Components of net assets
Units of
Participation NAV
per Unit Net
Assets Class R1 222,969 $ 16.6345 $ 3,708,975
Class R2 9,053 $ 17.6857 160,117
Class R3 18,453 $ 16.7501 309,093
Class R4 3,851 $ 15.0593 57,991
Class R5 27,311 $ 16.7359 457,067
Class R6 14,221 $ 16.5796 235,775
Class R7 22,334 $ 16.3790 365,810
Class R8 11,063 $ 14.2128 157,229
$ 5,452,057
1066

THE COLLECTIVE INVESTMENT FUNDS OF FIRST MERCANTILE TRUST COMPANY
FMT/SPDR Technology Sector ETF Statement of Operations
For the Year Ended December 31, 2015
The accompanying notes are an integral part of these financial statements.
Investment income
Dividends $ 93,903
Interest 303
94,206
Expenses
Trustee fees 32,100
Custody fees 4,980
Audit fees 1,200
38,280
Net investment income 55,926
Net realized gain from investments sold
Proceeds from sales of investments 1,218,011
Cost of investments sold 803,885
Net realized gain from investments sold 414,126
Change in net unrealized appreciation (depreciation) on investments (224,675)
Net realized and unrealized gain on investments 189,451
Net increase in net assets resulting from operations $ 245,377
1067

THE COLLECTIVE INVESTMENT FUNDS OF FIRST MERCANTILE TRUST COMPANY
FMT/SPDR Technology Sector ETF Statement of Changes in Net Assets
For the Year Ended December 31, 2015
The accompanying notes are an integral part of these financial statements.
Operations
Net investment income $ 55,926
Net realized gain from investments sold 414,126
Change in net unrealized appreciation (depreciation) on investments (224,675)
Net increase in net assets resulting from operations 245,377
Participant transactions
Proceeds from units purchased 1,443,570
Less payments for units redeemed 1,574,663
Decrease in net assets from participant transactions (131,093)
Total increase in net assets 114,284
Net assets at beginning of year 5,337,773
Net assets at end of year $ 5,452,057
1068
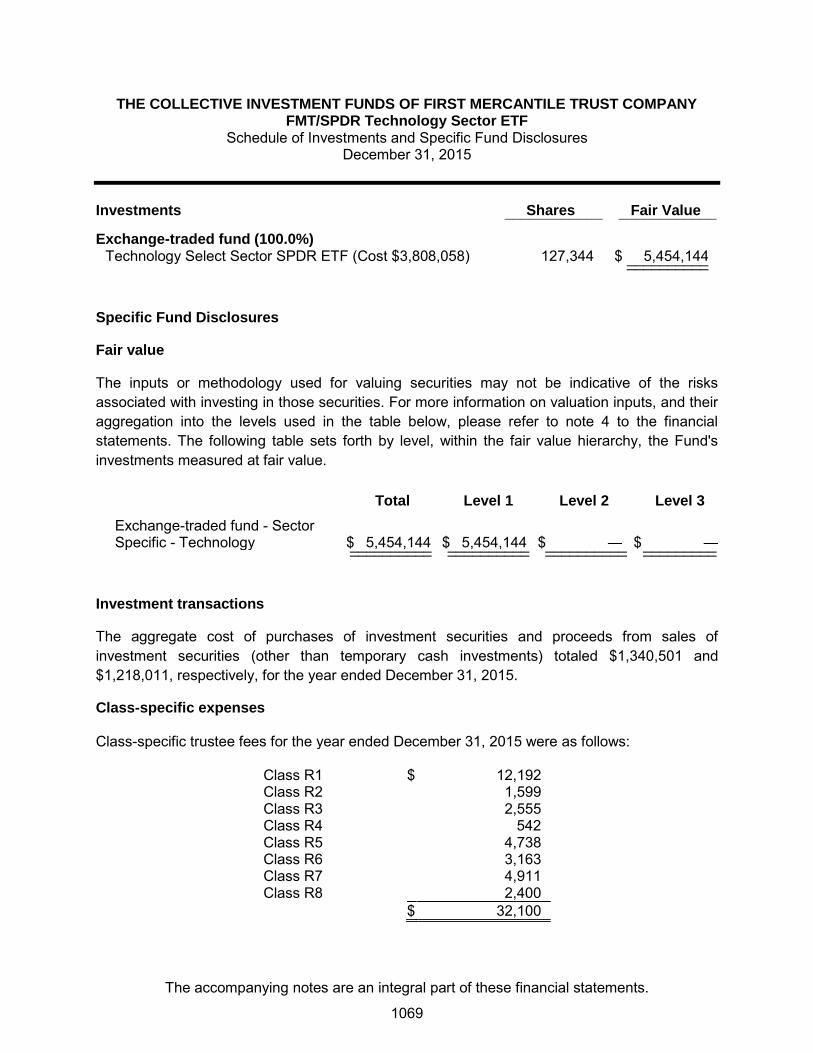
THE COLLECTIVE INVESTMENT FUNDS OF FIRST MERCANTILE TRUST COMPANY FMT/SPDR Technology Sector ETF
Schedule of Investments and Specific Fund Disclosures December 31, 2015
The accompanying notes are an integral part of these financial statements.
Investments Shares Fair Value ____________ ____________
Exchange-traded fund (100.0%) Technology Select Sector SPDR ETF (Cost $3,808,058) 127,344 $ 5,454,144 __________ __________
Specific Fund Disclosures
Fair value
The inputs or methodology used for valuing securities may not be indicative of the risks associated with investing in those securities. For more information on valuation inputs, and their aggregation into the levels used in the table below, please refer to note 4 to the financial statements. The following table sets forth by level, within the fair value hierarchy, the Fund's investments measured at fair value.
Total Level 1 Level 2 Level 3
Exchange-traded fund - Sector Specific - Technology $ 5,454,144 $ 5,454,144 $ — $ — __________ __________ __________ _________ __________ __________ __________ _________
Investment transactions
The aggregate cost of purchases of investment securities and proceeds from sales of investment securities (other than temporary cash investments) totaled $1,340,501 and $1,218,011, respectively, for the year ended December 31, 2015.
Class-specific expenses Class-specific trustee fees for the year ended December 31, 2015 were as follows: Class R1 $ 12,192 Class R2 1,599 Class R3 2,555 Class R4 542 Class R5 4,738 Class R6 3,163 Class R7 4,911 Class R8 2,400 $ 32,100
1069

THE COLLECTIVE INVESTMENT FUNDS OF FIRST MERCANTILE TRUST COMPANY
FMT/SPDR Technology Sector ETF Schedule of Participant Transactions
December 31, 2015
The accompanying notes are an integral part of these financial statements.
Participant transactions by class for the year ended December 31, 2015 were as follows: Dollars Units Purchases Redemptions Net change Purchases Redemptions Net change Class R1 $ 1,000,739 $ (821,833) $ 178,906 61,660 (50,895) 10,765 Class R2 82,249 (254,730) (172,481) 4,806 (14,801) (9,995) Class R3 92,761 (252,849) (160,088) 5,684 (15,430) (9,746) Class R4 30,165 (52,535) (22,370) 2,111 (3,583) (1,472) Class R5 78,542 (91,360) (12,818) 4,822 (5,558) (736) Class R6 45,705 (67,826) (22,121) 2,838 (4,221) (1,383) Class R7 36,705 (12,608) 24,097 2,368 (768) 1,600 Class R8 76,704 (20,922) 55,782 5,615 (1,516) 4,099 $ 1,443,570 $ (1,574,663) $ (131,093) 89,904 (96,772) (6,868)
1070
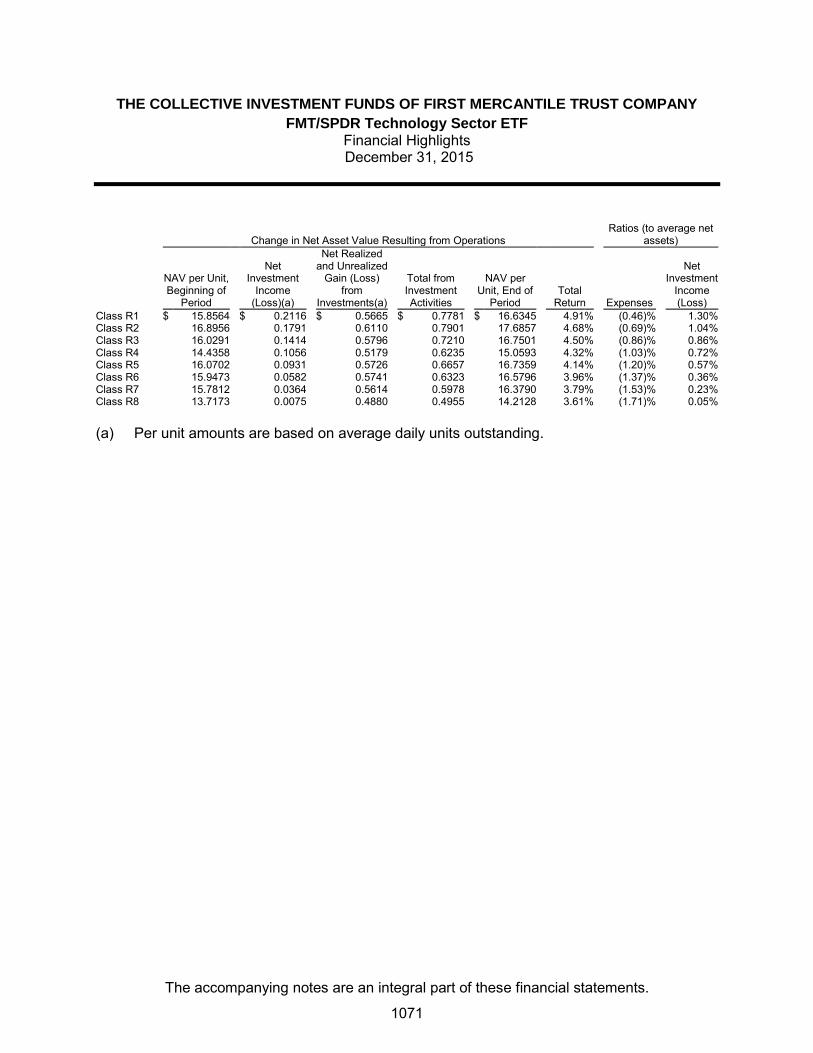
THE COLLECTIVE INVESTMENT FUNDS OF FIRST MERCANTILE TRUST COMPANY
FMT/SPDR Technology Sector ETF Financial Highlights December 31, 2015
The accompanying notes are an integral part of these financial statements.
Change in Net Asset Value Resulting from Operations Ratios (to average net
assets)
NAV per Unit, Beginning of
Period
Net Investment
Income (Loss)(a)
Net Realized and Unrealized
Gain (Loss) from
Investments(a)
Total from Investment Activities
NAV per Unit, End of
Period Total
Return Expenses
Net Investment
Income (Loss)
Class R1 $ 15.8564 $ 0.2116 $ 0.5665 $ 0.7781 $ 16.6345 4.91 % (0.46) % 1.30 % Class R2 16.8956 0.1791 0.6110 0.7901 17.6857 4.68 % (0.69) % 1.04 % Class R3 16.0291 0.1414 0.5796 0.7210 16.7501 4.50 % (0.86) % 0.86 % Class R4 14.4358 0.1056 0.5179 0.6235 15.0593 4.32 % (1.03) % 0.72 % Class R5 16.0702 0.0931 0.5726 0.6657 16.7359 4.14 % (1.20) % 0.57 % Class R6 15.9473 0.0582 0.5741 0.6323 16.5796 3.96 % (1.37) % 0.36 % Class R7 15.7812 0.0364 0.5614 0.5978 16.3790 3.79 % (1.53) % 0.23 % Class R8 13.7173 0.0075 0.4880 0.4955 14.2128 3.61 % (1.71) % 0.05 % (a) Per unit amounts are based on average daily units outstanding.
1071

FMT/T. Rowe Price Financial Services Fund

THE COLLECTIVE INVESTMENT FUNDS OF FIRST MERCANTILE TRUST COMPANY
FMT/T. Rowe Price Financial Services Fund Statement of Assets and Liabilities
December 31, 2015
The accompanying notes are an integral part of these financial statements.
Assets Investments in securities, at fair value $ 1,659,609 Liabilities Trustee fees 2,018
Net assets $ 1,657,591
Components of net assets
Units of
Participation NAV
per Unit Net
Assets Class R1 1,026 $ 18.5006 $ 18,984
Class R4 1,476 $ 9.6722 14,273
Class R5 435 $ 14.9848 6,515
Class R6 28,182 $ 12.9431 364,763
Class R7 38,366 $ 18.3758 705,013
Class R8 30,027 $ 18.2516 548,043
$ 1,657,591
1072

THE COLLECTIVE INVESTMENT FUNDS OF FIRST MERCANTILE TRUST COMPANY
FMT/T. Rowe Price Financial Services Fund Statement of Operations
For the Year Ended December 31, 2015
The accompanying notes are an integral part of these financial statements.
Investment income
Dividends $ 61,395
Expenses
Trustee fees 24,477
Audit fees 1,200
Custody fees 580
26,257
Net investment income 35,138
Net realized gain from investments sold
Proceeds from sales of investments 318,382
Cost of investments sold 218,988
Net realized gain from investments sold 99,394
Change in net unrealized appreciation (depreciation) on investments (164,105)
Net realized and unrealized loss on investments (64,711)
Other operating credits (charges) 2,534
Net decrease in net assets resulting from operations $ (27,039)
1073
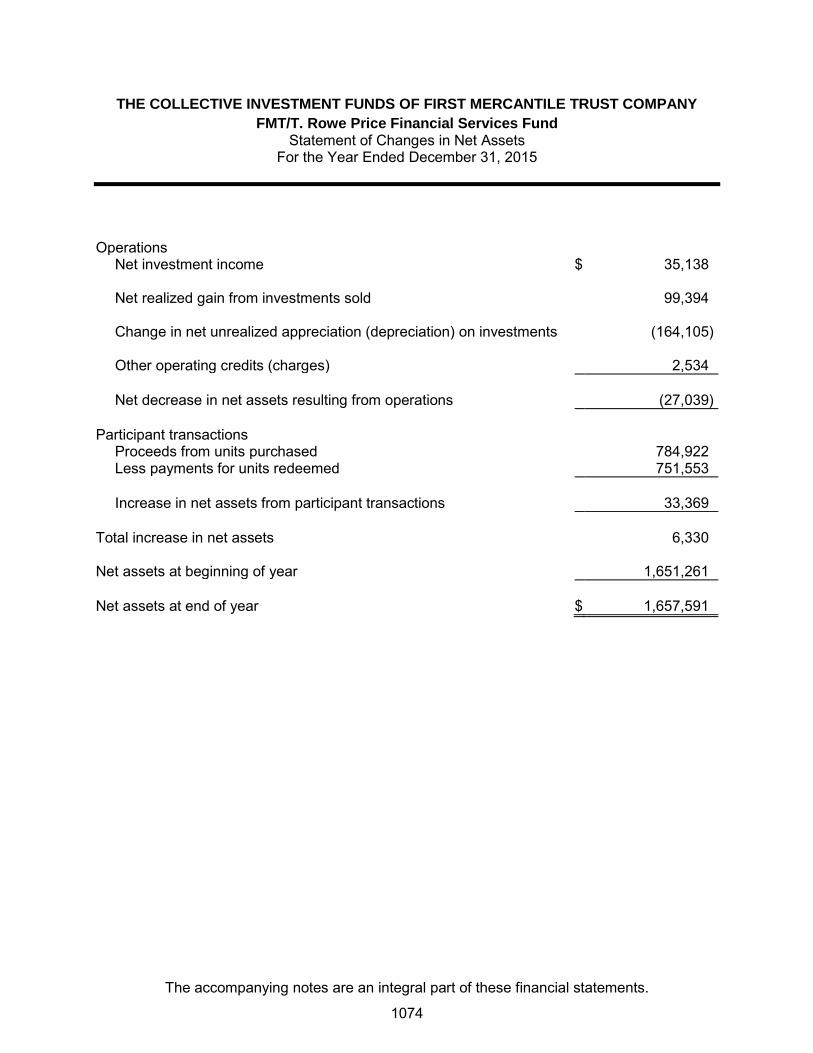
THE COLLECTIVE INVESTMENT FUNDS OF FIRST MERCANTILE TRUST COMPANY
FMT/T. Rowe Price Financial Services Fund Statement of Changes in Net Assets
For the Year Ended December 31, 2015
The accompanying notes are an integral part of these financial statements.
Operations
Net investment income $ 35,138
Net realized gain from investments sold 99,394
Change in net unrealized appreciation (depreciation) on investments (164,105)
Other operating credits (charges) 2,534
Net decrease in net assets resulting from operations (27,039)
Participant transactions
Proceeds from units purchased 784,922
Less payments for units redeemed 751,553
Increase in net assets from participant transactions 33,369
Total increase in net assets 6,330
Net assets at beginning of year 1,651,261
Net assets at end of year $ 1,657,591
1074

THE COLLECTIVE INVESTMENT FUNDS OF FIRST MERCANTILE TRUST COMPANY FMT/T. Rowe Price Financial Services Fund
Schedule of Investments and Specific Fund Disclosures December 31, 2015
The accompanying notes are an integral part of these financial statements.
Investments Shares Fair Value ____________ ____________
Mutual fund (100.1%) T. Rowe Price Financial Services Fund (Cost $1,312,140) 78,063 $ 1,659,609 __________ __________
Specific Fund Disclosures
Fair value
The inputs or methodology used for valuing securities may not be indicative of the risks associated with investing in those securities. For more information on valuation inputs, and their aggregation into the levels used in the table below, please refer to note 4 to the financial statements. The following table sets forth by level, within the fair value hierarchy, the Fund's investments measured at fair value.
Total Level 1 Level 2 Level 3
Mutual fund - Sector Specific - Financial Services $ 1,659,609 $ 1,659,609 $ — $ — __________ __________ __________ _________ __________ __________ __________ _________
Investment transactions
The aggregate cost of purchases of investment securities and proceeds from sales of investment securities (other than temporary cash investments) totaled $389,396 and $318,382, respectively, for the year ended December 31, 2015.
Class-specific expenses Class-specific trustee fees for the year ended December 31, 2015 were as follows: Class R1 $ 58 Class R4 225 Class R5 78 Class R6 715 Class R7 15,193 Class R8 8,208 $ 24,477
1075

THE COLLECTIVE INVESTMENT FUNDS OF FIRST MERCANTILE TRUST COMPANY
FMT/T. Rowe Price Financial Services Fund Schedule of Participant Transactions
December 31, 2015
The accompanying notes are an integral part of these financial statements.
Participant transactions by class for the year ended December 31, 2015 were as follows: Dollars Units Purchases Redemptions Net change Purchases Redemptions Net change Class R1 $ 12,860 $ (26,262) $ (13,402) 633 (1,456) (823) Class R4 78,892 (67,619) 11,273 7,871 (6,395) 1,476 Class R5 848 (2,338) (1,490) 54 (146) (92) Class R6 381,375 (14,894) 366,481 28,062 (1,108) 26,954 Class R7 143,133 (564,882) (421,749) 7,525 (29,214) (21,689) Class R8 167,814 (75,558) 92,256 8,984 (3,951) 5,033 $ 784,922 $ (751,553) $ 33,369 53,129 (42,270) 10,859
1076
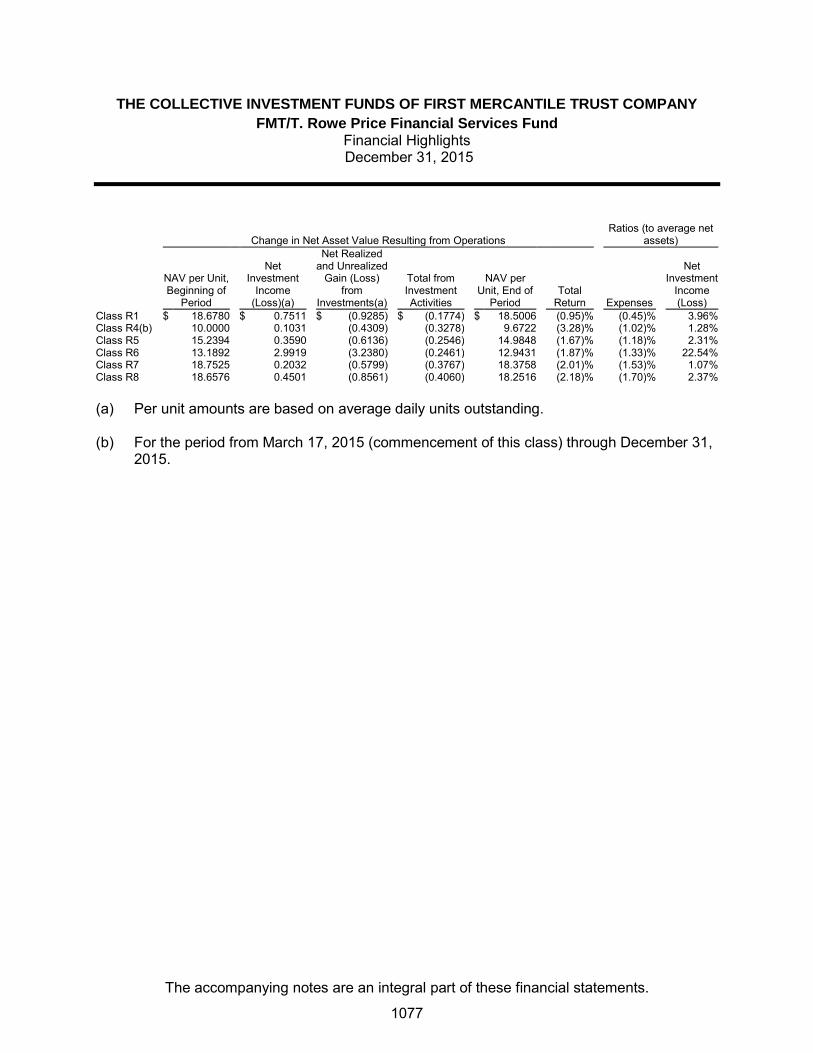
THE COLLECTIVE INVESTMENT FUNDS OF FIRST MERCANTILE TRUST COMPANY
FMT/T. Rowe Price Financial Services Fund Financial Highlights December 31, 2015
The accompanying notes are an integral part of these financial statements.
Change in Net Asset Value Resulting from Operations Ratios (to average net
assets)
NAV per Unit, Beginning of
Period
Net Investment
Income (Loss)(a)
Net Realized and Unrealized
Gain (Loss) from
Investments(a)
Total from Investment Activities
NAV per Unit, End of
Period Total
Return Expenses
Net Investment
Income (Loss)
Class R1 $ 18.6780 $ 0.7511 $ (0.9285) $ (0.1774) $ 18.5006 (0.95) % (0.45) % 3.96 % Class R4(b) 10.0000 0.1031 (0.4309) (0.3278) 9.6722 (3.28) % (1.02) % 1.28 % Class R5 15.2394 0.3590 (0.6136) (0.2546) 14.9848 (1.67) % (1.18) % 2.31 % Class R6 13.1892 2.9919 (3.2380) (0.2461) 12.9431 (1.87) % (1.33) % 22.54 % Class R7 18.7525 0.2032 (0.5799) (0.3767) 18.3758 (2.01) % (1.53) % 1.07 % Class R8 18.6576 0.4501 (0.8561) (0.4060) 18.2516 (2.18) % (1.70) % 2.37 % (a) Per unit amounts are based on average daily units outstanding.
(b) For the period from March 17, 2015 (commencement of this class) through December 31,
2015.
1077

FMT/T. Rowe Price Health Sciences Fund
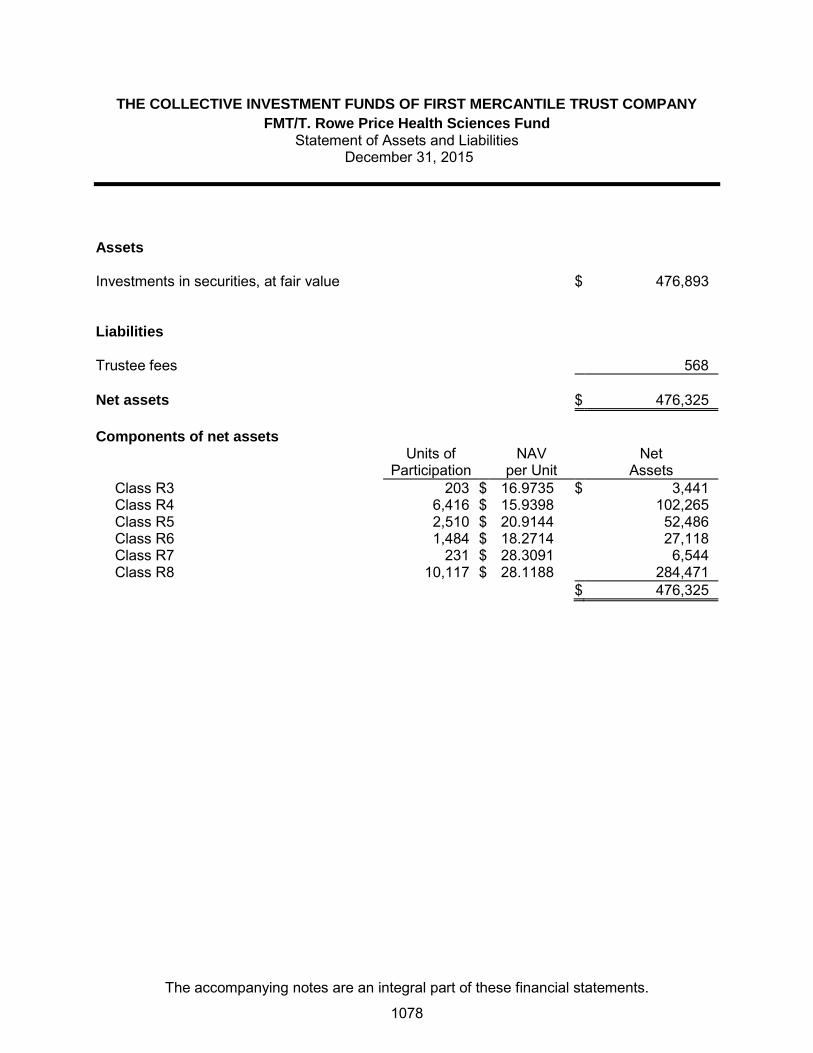
THE COLLECTIVE INVESTMENT FUNDS OF FIRST MERCANTILE TRUST COMPANY
FMT/T. Rowe Price Health Sciences Fund Statement of Assets and Liabilities
December 31, 2015
The accompanying notes are an integral part of these financial statements.
Assets Investments in securities, at fair value $ 476,893 Liabilities Trustee fees 568
Net assets $ 476,325
Components of net assets
Units of
Participation NAV
per Unit Net
Assets Class R3 203 $ 16.9735 $ 3,441
Class R4 6,416 $ 15.9398 102,265
Class R5 2,510 $ 20.9144 52,486
Class R6 1,484 $ 18.2714 27,118
Class R7 231 $ 28.3091 6,544
Class R8 10,117 $ 28.1188 284,471
$ 476,325
1078

THE COLLECTIVE INVESTMENT FUNDS OF FIRST MERCANTILE TRUST COMPANY
FMT/T. Rowe Price Health Sciences Fund Statement of Operations
For the Year Ended December 31, 2015
The accompanying notes are an integral part of these financial statements.
Investment income
Dividends $ 63,154
Expenses
Trustee fees 5,675
Audit fees 1,200
Custody fees 177
7,052
Net investment income 56,102
Net realized gain from investments sold
Proceeds from sales of investments 349,976
Cost of investments sold 321,935
Net realized gain from investments sold 28,041
Change in net unrealized appreciation (depreciation) on investments (51,980)
Net realized and unrealized loss on investments (23,939)
Other operating credits (charges) 774
Net increase in net assets resulting from operations $ 32,937
1079

THE COLLECTIVE INVESTMENT FUNDS OF FIRST MERCANTILE TRUST COMPANY
FMT/T. Rowe Price Health Sciences Fund Statement of Changes in Net Assets
For the Year Ended December 31, 2015
The accompanying notes are an integral part of these financial statements.
Operations
Net investment income $ 56,102
Net realized gain from investments sold 28,041
Change in net unrealized appreciation (depreciation) on investments (51,980)
Other operating credits (charges) 774
Net increase in net assets resulting from operations 32,937
Participant transactions
Proceeds from units purchased 462,854
Less payments for units redeemed 359,846
Increase in net assets from participant transactions 103,008
Total increase in net assets 135,945
Net assets at beginning of year 340,380
Net assets at end of year $ 476,325
1080

THE COLLECTIVE INVESTMENT FUNDS OF FIRST MERCANTILE TRUST COMPANY FMT/T. Rowe Price Health Sciences Fund
Schedule of Investments and Specific Fund Disclosures December 31, 2015
The accompanying notes are an integral part of these financial statements.
Investments Shares Fair Value ____________ ____________
Mutual fund (100.1%) T. Rowe Price Health Sciences Fund (Cost $482,345) 6,926 $ 476,893 __________ __________
Specific Fund Disclosures
Fair value
The inputs or methodology used for valuing securities may not be indicative of the risks associated with investing in those securities. For more information on valuation inputs, and their aggregation into the levels used in the table below, please refer to note 4 to the financial statements. The following table sets forth by level, within the fair value hierarchy, the Fund's investments measured at fair value.
Total Level 1 Level 2 Level 3
Mutual fund - Sector Funds - Health Sciences $ 476,893 $ 476,893 $ — $ — __________ __________ __________ _________ __________ __________ __________ _________
Investment transactions
The aggregate cost of purchases of investment securities and proceeds from sales of investment securities (other than temporary cash investments) totaled $510,137 and $349,976, respectively, for the year ended December 31, 2015.
Class-specific expenses Class-specific trustee fees for the year ended December 31, 2015 were as follows: Class R1 $ 567 Class R3 24 Class R4 1,018 Class R5 753 Class R6 265 Class R7 79 Class R8 2,969 $ 5,675
1081

THE COLLECTIVE INVESTMENT FUNDS OF FIRST MERCANTILE TRUST COMPANY
FMT/T. Rowe Price Health Sciences Fund Schedule of Participant Transactions
December 31, 2015
The accompanying notes are an integral part of these financial statements.
Participant transactions by class for the year ended December 31, 2015 were as follows: Dollars Units Purchases Redemptions Net change Purchases Redemptions Net change Class R1 $ 121,441 $ (197,039) $ (75,598) 6,101 (9,665) (3,564) Class R3 328 (4) 324 19 — 19 Class R4 88,188 (77,723) 10,465 5,511 (4,631) 880 Class R5 13,754 (69,588) (55,834) 652 (3,281) (2,629) Class R6 9,610 — 9,610 519 — 519 Class R7 4,845 (2,159) 2,686 169 (82) 87 Class R8 224,688 (13,333) 211,355 7,523 (469) 7,054 $ 462,854 $ (359,846) $ 103,008 20,494 (18,128) 2,366
1082

THE COLLECTIVE INVESTMENT FUNDS OF FIRST MERCANTILE TRUST COMPANY
FMT/T. Rowe Price Health Sciences Fund Financial Highlights December 31, 2015
The accompanying notes are an integral part of these financial statements.
Change in Net Asset Value Resulting from Operations Ratios (to average net
assets)
NAV per Unit, Beginning of
Period
Net Investment
Income (Loss)(a)
Net Realized and Unrealized
Gain (Loss) from
Investments(a)
Total from Investment Activities
NAV per Unit, End of
Period Total
Return Expenses
Net Investment
Income (Loss)
Class R1(b) $ 18.3420 $ 1.8490 $ 0.2704 $ 2.1194 $ — 11.55 % (0.60) % 8.85 % Class R3 15.1517 1.6632 0.1586 1.8218 16.9735 12.02 % (0.98) % 9.72 % Class R4 14.2537 1.3278 0.3583 1.6861 15.9398 11.83 % (1.16) % 8.26 % Class R5 18.7341 1.3529 0.8274 2.1803 20.9144 11.64 % (1.33) % 6.46 % Class R6 16.3948 2.0557 (0.1791) 1.8766 18.2714 11.45 % (1.49) % 11.15 % Class R7 25.4448 2.8238 0.0405 2.8643 28.3091 11.26 % (1.67) % 9.81 % Class R8 25.3167 3.8964 (1.0943) 2.8021 28.1188 11.07 % (1.83) % 13.70 % (a) Per unit amounts are based on average daily units outstanding.
(b) For the period from January 1, 2015 through December 21, 2015.
1083

THE COLLECTIVE INVESTMENT FUNDS OF FIRST MERCANTILE TRUST COMPANY
Notes to Financial StatementsDecember 31, 2015
Note 1 - Summary of significant accounting policies
Organization
The Collective Investment Funds of First Mercantile Trust Company (individually Fund, collectivelyFunds) are comprised of certain separately-presented collective trust funds available forinvestment for clients of First Mercantile Trust Company (FMTC). These clients consist entirely ofsponsors of various types of qualified retirement plans who make investments into the Fundsbased upon their respective investment objectives or the investment objectives of the planparticipants. FMTC is the trustee of the Funds. The custodians for the Funds are State StreetCorporation, National Financial Services LLC, BNP Paribas Investment Partners Trust Company,and Fifth Third Bank.
Basis of accounting
The accompanying Fund financial statements have been prepared in accordance with accountingprinciples generally accepted in the United States of America, which require management to makecertain estimates and assumptions at the date of the financial statements. Changes in theeconomic environment, financial markets, and any other parameters used in determining theseestimates and assumptions could cause actual results to differ.
Investments
The Funds' investments are stated at fair value. Fair value is the price that would be received tosell an asset in an orderly transaction between market participants at the measurement date. Seenote 4 for a discussion of fair value measurements.
Security transactions and investment income
Security transactions are recorded as of the date purchased or sold (trade date). Interest incomeis recognized on the accrual basis. Dividend income is recorded as of the ex-dividend date.Realized gains and losses on securities sold are generally determined on the basis of averagecost.
Foreign currency translations
The books and records of the Funds are maintained in U.S. dollars. Securities denominated incurrencies other than U.S. dollars are subject to changes in value due to fluctuations in exchangerates. Purchases and sales of securities and income and expenses are translated into U.S. dollarsat the prevailing exchange rate on the respective date of each transaction. The market values ofinvestment securities are translated into U.S. dollars daily. The Funds do not isolate the portion ofnet realized and unrealized gains or losses in security investments which are attributable tochanges in foreign exchange rates. Accordingly, the impact of such changes is included in therealized and unrealized gains or losses on the underlying securities.
1084

THE COLLECTIVE INVESTMENT FUNDS OF FIRST MERCANTILE TRUST COMPANY
Notes to Financial Statements (Continued)December 31, 2015
Note 1 - Summary of significant accounting policies (continued)
Participant transactions
The net asset values (NAV) of the Funds are determined daily, and net investment income andrealized and unrealized gains are not distributed but rather reinvested and reflected in the netasset values of the Funds. Units of participation are purchased and redeemed on a daily basis atthe net asset value. Such units of participation generally have no redemption restrictions, butexceptions could apply. Each class of units has equal rights as to net assets and earnings andlosses, except that each class separately bears certain class-specific expenses related toinvestment management and trustee fees.
Income, non-class-specific expenses, other operating charges and credits, and realized andunrealized gains and losses on investments are allocated to each class of units based upon itsrelative net assets. The units of participation outstanding as of December 31, 2015 for all classesof units have been rounded to the nearest whole unit.
Schedules of investments
Percentages reflected in the schedules of investments are calculated in relation to net assets.
Financial highlights
See the individual Fund financial statements for a summary of their respective financial highlights.Definitions common to all Funds are as follows:
Net Investment Income (Loss) - Per Unit
Net Investment Income (Loss) is the net of income and expense items including other operatingcredits and charges. Expenses represent actual amounts charged, while income represents a prorata allocation of the aggregate income of the Fund to each unit class based on the net assets ofeach unit class. Per unit amounts are calculated as the aggregate dollar value of net investmentincome (loss) for the period divided by the average daily units outstanding for the period (within theyear) during which the unit class was funded. For classes that were liquidated during the year, thelast unit price prior to liquidation was used to calculate income (loss) per unit.
Total Return - Ratio
Total Return is the change in price during the year, i.e., last price of the year versus earliest priceof the year. This return is net of the internal operating expenses of any underlying funds, e.g., amutual fund, in which the respective Fund invests. All dividends received are reinvested. Anindividual participant's return may differ due to certain factors including the timing of contributionsand withdrawals.
1085
THE COLLECTIVE INVESTMENT FUNDS OF FIRST MERCANTILE TRUST COMPANY
Notes to Financial Statements (Continued)December 31, 2015
Note 1 - Summary of significant accounting policies (continued)
Financial highlights (continued)
Expenses - Ratio
The expenses ratio is calculated by dividing the total Fund expenses for the period by the averagenet assets. Average net assets is calculated as the average of total net asset values during theyear.
Net Investment Income (Loss) - Ratio
Net Investment Income (Loss) is the net investment income (loss) for the period divided byaverage net assets.
Federal income taxes
The Funds qualify for tax-exempt status under Section 501(a) of the Internal Revenue Code of1986, as amended. Accordingly, no provision for income taxes is required in the individualfinancial statements of the Funds.
Note 2 - Investments in fully benefit-responsive funds
In general, accounting principles generally accepted in the United States of America require allinvestments held by an investment company to be reported at fair value. However, contract valueis the relevant measurement attribute for that portion of the net assets attributable to fully benefit-responsive investment contracts. The statements of assets and liabilities for fully benefit-responsive funds present the fair value of the investment in the underlying fund as well as theadjustment from fair value to contract value relating to the underlying fund. Two Funds includeinvestments in fully benefit-responsive funds: FMT/FFTW Income Plus Fund and FMT/Wells FargoStable Value Fund. See the individual Fund financial statements regarding the respective Fund'sinvestment in fully benefit-responsive funds.
Note 3 - Transactions with affiliates and service providers
The Funds pay trustee fees under the terms of agreements between the plan sponsors and FMTC.These fees are calculated by multiplying the applicable fee rate for each Fund by such Fund's netassets at the end of each business day. The trustee fees are paid monthly to FMTC and rangefrom an annual rate of 0.35% to 1.59% depending upon the type of Fund, the level of serviceprovided to each qualified employee benefit plan sponsor, and its classes of units.
1086

THE COLLECTIVE INVESTMENT FUNDS OF FIRST MERCANTILE TRUST COMPANY
Notes to Financial Statements (Continued)December 31, 2015
Note 3 - Transactions with affiliates and service providers (continued)
A portion of these trustee fees are payable by FMTC to investment consultants of the participatingretirement plans. Trustee fees paid to FMTC by the Funds in 2015 totaled $22,152,434. Feespaid by FMTC in 2015 to investment consultants of the participating retirement plans totaled$13,462,020 and fees paid by FMTC to sub-advisors of the Funds totaled $6,009,144.
FMTC charges specified investment management fees, a component of the trustee fee, for allcollective trust funds. However, FMTC is prohibited from charging an investment management feeon any collective trust fund which invests in an affiliated mutual fund. None of the Funds investedin affiliated mutual funds during the year.
Fees paid in 2015 to custodians for custodial and service provider fees totaled $1,412,369.
Note 4 - Fair value measurements
Fair value is the exchange price that would be received for an asset or paid to transfer a liability inthe principal or most advantageous market for the asset in an orderly transaction between marketparticipants on the measurement date. The fair value hierarchy requires an entity to maximize theuse of observable inputs and minimize the use of unobservable inputs when measuring fair value.Three levels of inputs may be used to measure fair value.
Level 1 - Quoted prices for identical securities in active markets that the Funds have theability to access as of the measurement date.
Level 2 - Other significant observable inputs other than Level 1 prices, including quotedprices for similar securities in active markets, quoted prices in markets that are not active,and other inputs that are observable or can be corroborated by observable market data.
Level 3 - Significant unobservable inputs including management's own assumptions usedto determine the fair value of securities.
The following is a description of valuation methodologies used for investments measured at fairvalue. There have been no changes in the methodologies used during 2015.
Common and preferred stocks: Valued using the latest quoted sales prices or officialclosing prices taken from the market in which each security trades.
Mutual funds: Valued at the closing net asset value per share of the mutual fund on theday of valuation as reflected on a national securities exchange.
Exchange-traded funds: Valued using the latest quoted sales prices or official closingprices taken from the market in which each security trades.
1087

THE COLLECTIVE INVESTMENT FUNDS OF FIRST MERCANTILE TRUST COMPANY
Notes to Financial Statements (Continued)December 31, 2015
Note 4 - Fair value measurements (continued)
Depository receipts: Valued using the latest quoted sales prices or official closing pricestaken from the market in which each security trades.
Limited partnerships: Valued using the latest quoted sales prices or official closing pricestaken from the market in which each security trades.
Debt securities: Valued at quoted market prices or valuations provided by commercialpricing services or the mean of the bid and ask prices provided by investment brokers.
Collective trust funds: Valued at the net asset value of units held by the Fund on the day ofvaluation based upon the market value of the underlying investments. The Fund has theability to redeem its investment in the underlying fund at net asset value per unit at thevaluation date.
Fully benefit-responsive funds: Reported at fair value (see note 2).
The preceding methods described may produce fair value calculations that may not be indicative ofnet realizable value or reflective of future fair values. Furthermore, although the Funds'management believes its valuation methods are appropriate and consistent with other marketparticipants, the use of different methodologies or assumptions to determine the fair value ofcertain financial instruments could result in a different fair value measurement as of the reportingdate. Changes in valuation techniques could result in transfers in or out of an investment'sassigned level within the hierarchy. See the individual Fund's Schedule of Investments andSpecific Fund Disclosures for aggregate value by class of investment and input level as ofDecember 31, 2015.
Note 5 - Fund changes
During the year ended December 31, 2015, certain of the Funds had changes in their sub-advisorsor changes in their names as follows:
FMT International Value Opportunities (Tradewinds) Fund is now FMT International ValueOpportunities (Harris) Fund.
Note 6 - Risks and Uncertainties
Investment securities in which the Funds invest are subject to various risks, such as market, creditand interest rate risks. Due to the level of risk associated with such securities, it is at leastreasonably possible that changes in the values of investment securities will occur in the near termand that such changes could materially affect the amounts reported in the financial statements.
1088
THE COLLECTIVE INVESTMENT FUNDS OF FIRST MERCANTILE TRUST COMPANY
Notes to Financial Statements (Continued)December 31, 2015
Note 7 - Subsequent events
Management has evaluated events and transactions that have occurred between December 31,2015 and June 10, 2016, which is the date that the financial statements were available to beissued, for possible recognition or disclosure in the financial statements.
Subsequent to December 31, 2015, the following Funds were closed:
FMT Aggressive International Growth (WCM) Fund
FMT Balanced Opportunities (Aristotle) Fund
FMT Equity Income (Sterling) Fund
FMT Special Opportunities (Sterling) Fund
FMT/Columbia Acorn Z Fund
FMT/Delaware High Yield Opportunity Fund
FMT/DFA U.S. Large Company Fund
FMT/FFTW Income Plus Fund
FMT/Fifth Third Equity Index Fund
FMT/Franklin Mutual Global Discovery Fund
FMT/iShares Russell 3000 Index ETF
FMT/Longleaf Partners Fund
FMT/SPDR S and P 500 ETF
FMT/SSgA Prime Money Market Fund
FMT/T. Rowe Price Health Sciences Fund
FMT/T. Rowe Price International Bond Fund
FMT/Third Avenue Value Fund
FMT/Wells Fargo Advantage Discovery Fund
1089


