Mon. Not. R. Astron. Soc. 000, 000–000 (0000) Printed 8 May 2007 (MN L A T E X style file v2.2) The Collision Between The Milky Way And Andromeda T. J. Cox ? and Abraham Loeb† Harvard-Smithsonian Center for Astrophysics, 60 Garden Street, Cambridge, MA 02138, USA 8 May 2007 ABSTRACT We use a N–body/hydrodynamic simulation to forecast the future encounter be- tween the Milky Way and the Andromeda galaxies, given current observational con- straints on their relative distance, relative velocity, and masses. Allowing for a com- parable amount of diffuse mass to fill the volume of the Local Group, we find that the two galaxies are likely to collide in a few billion years - within the Sun’s lifetime. During the first close encounter of the two galaxies, there is a 12% chance that the Sun will be pulled from its present position and reside in the extended tidal material. After the second close encounter, there is a 30% chance that the Sun will reside in the extended tidal material, and a 2.7% chance that our Sun will be more tightly bound to Andromeda than to the Milky Way. Eventually, after the merger has completed, the Sun is likely to be scattered to the outer halo and reside at much larger radii (> 30 kpc). The density profiles of the stars, gas and dark matter in the merger prod- uct resemble those of elliptical galaxies. Our Local Group model therefore provides a prototype progenitor of late–forming elliptical galaxies. Key words: galaxy:evolution — galaxies:evolution — galaxies:formation — galax- ies:interactions — Local Group — methods:N-body simulations. 1 INTRODUCTION It is well known that the Milky Way (MW) and Andromeda (M31) are the two largest members of the Local Group of galaxies. Together with their ∼ 40 smaller companions, the Milky Way and Andromeda comprise our galactic neigh- borhood, and as such, represent the nearest laboratory, and therefore the most powerful tool, to study the formation and evolution of galactic structure. Like most extragalactic groups, the Local Group is very likely to be decoupled from the cosmological expan- sion and is now a gravitationally bound collection of galax- ies. This notion is supported by the observed relative mo- tion between its two largest galaxies; namely, the Milky Way and Andromeda are moving toward each other at ∼ 120 km s -1 (Binney & Tremaine 1987). Unfortunately, this motion alone does not indicate whether the Local Group is bound or not. The unknown magnitude of Andromeda’s transverse velocity adds uncertainty into the present day or- bital parameters and therefore the past and future evolution of the Local Group. Barring the uncertain transverse velocity of An- dromeda, a considerable amount of information can be in- ? [email protected]† [email protected]ferred about the Local Group provided a plausible set of assumptions. Nearly 50 years ago Kahn & Woltjer (1959) pioneered the “timing argument,” in which the Milky Way and Andromeda are assumed to form within close proximity to each other, during the dense early stages of the Universe, before they were pulled apart by the general cosmological expansion. They have subsequently reversed their path and are approaching one another owing to their mutual gravi- tational attraction. According to the timing argument, the Milky Way and Andromeda have now traced out nearly a full period of their orbital motion which is governed by Kepler’s laws. By assuming that the system has no angular momen- tum, and given the current separation, velocity of approach, and the age of the Universe, the timing argument yields es- timates for the mass of the Local Group (> 3 × 10 12 Mfl), the semi–major axis of the orbit (< 580 kpc), and the time of the next close passage (> 4 Gyr) (see Sec. 10.2 of Binney & Tremaine 1987). While the seminal results of Kahn & Woltjer (1959) were an early indication of the large mass–to–light ratio in the Local Group and therefore the presence of dark matter, they also began a nearly five decade long quest to under- stand the past, present, and future of our Local Group. In particular, a number of studies have extended the original timing argument by allowing for various angular momenta, by including more realistic or time–dependent mass distri- c 0000 RAS
Transcript
Mon. Not. R. Astron. Soc. 000, 000–000 (0000) Printed 8 May 2007 (MN LATEX style file v2.2)
The Collision Between The Milky Way And Andromeda
T. J. Cox? and Abraham Loeb†Harvard-Smithsonian Center for Astrophysics, 60 Garden Street, Cambridge, MA 02138, USA
8 May 2007
ABSTRACT
We use a N–body/hydrodynamic simulation to forecast the future encounter be-tween the Milky Way and the Andromeda galaxies, given current observational con-straints on their relative distance, relative velocity, and masses. Allowing for a com-parable amount of diffuse mass to fill the volume of the Local Group, we find thatthe two galaxies are likely to collide in a few billion years - within the Sun’s lifetime.During the first close encounter of the two galaxies, there is a 12% chance that theSun will be pulled from its present position and reside in the extended tidal material.After the second close encounter, there is a 30% chance that the Sun will reside in theextended tidal material, and a 2.7% chance that our Sun will be more tightly boundto Andromeda than to the Milky Way. Eventually, after the merger has completed,the Sun is likely to be scattered to the outer halo and reside at much larger radii(> 30 kpc). The density profiles of the stars, gas and dark matter in the merger prod-uct resemble those of elliptical galaxies. Our Local Group model therefore provides aprototype progenitor of late–forming elliptical galaxies.
Key words: galaxy:evolution — galaxies:evolution — galaxies:formation — galax-ies:interactions — Local Group — methods:N-body simulations.
1 INTRODUCTION
It is well known that the Milky Way (MW) and Andromeda(M31) are the two largest members of the Local Group ofgalaxies. Together with their ∼ 40 smaller companions, theMilky Way and Andromeda comprise our galactic neigh-borhood, and as such, represent the nearest laboratory, andtherefore the most powerful tool, to study the formation andevolution of galactic structure.
Like most extragalactic groups, the Local Group isvery likely to be decoupled from the cosmological expan-sion and is now a gravitationally bound collection of galax-ies. This notion is supported by the observed relative mo-tion between its two largest galaxies; namely, the MilkyWay and Andromeda are moving toward each other at∼ 120 km s−1(Binney & Tremaine 1987). Unfortunately,this motion alone does not indicate whether the Local Groupis bound or not. The unknown magnitude of Andromeda’stransverse velocity adds uncertainty into the present day or-bital parameters and therefore the past and future evolutionof the Local Group.
Barring the uncertain transverse velocity of An-dromeda, a considerable amount of information can be in-
ferred about the Local Group provided a plausible set ofassumptions. Nearly 50 years ago Kahn & Woltjer (1959)pioneered the “timing argument,” in which the Milky Wayand Andromeda are assumed to form within close proximityto each other, during the dense early stages of the Universe,before they were pulled apart by the general cosmologicalexpansion. They have subsequently reversed their path andare approaching one another owing to their mutual gravi-tational attraction. According to the timing argument, theMilky Way and Andromeda have now traced out nearly a fullperiod of their orbital motion which is governed by Kepler’slaws. By assuming that the system has no angular momen-tum, and given the current separation, velocity of approach,and the age of the Universe, the timing argument yields es-timates for the mass of the Local Group (> 3 × 10¹²M¯),the semi–major axis of the orbit (< 580 kpc), and the timeof the next close passage (> 4 Gyr) (see Sec. 10.2 of Binney& Tremaine 1987).
While the seminal results of Kahn & Woltjer (1959)were an early indication of the large mass–to–light ratio inthe Local Group and therefore the presence of dark matter,they also began a nearly five decade long quest to under-stand the past, present, and future of our Local Group. Inparticular, a number of studies have extended the originaltiming argument by allowing for various angular momenta,by including more realistic or time–dependent mass distri-
butions, or by adding the effects of mass at scales beyondthat of the Local Group (see, e.g., Peebles et al. 1989; Fich &Tremaine 1991; Valtonen et al. 1993; Peebles 1994; Peebleset al. 2001; Sawa & Fujimoto 2005; Loeb et al. 2005).
One of the most intriguing developments stemmingfrom the various studies of the Local Group is an estimateof the transverse velocity of Andromeda. By employing theaction principle to the motions of galaxies within and near(< 20 Mpc) the Local Group, Peebles et al. (2001) con-cluded that the transverse velocity of Andromeda is lessthan 200 km s−1. Using the well measured transverse veloc-ity of M33 and numerical simulations that tracked the poten-tial tidal disruption during M33’s past encounters with An-dromeda, Loeb et al. (2005) found an even smaller estimate,∼ 100 km s−1, for the transverse velocity. While future as-trometric observations using SIM1 and GAIA2 will be ableto accurately measure the proper motion of Andromeda, thelow values favored by these papers suggests that the LocalGroup is indeed a gravitationally bound system.
Provided that the Local Group is gravitationally bound,and that the Milky Way and Andromeda are heading to-wards each other, one must admit the possibility that theywill eventually interact and merge. This outcome appearsinevitable given the massive halos of dark matter that likelysurround the Milky Way and Andromeda. Numerical exper-iments have robustly concluded that dark matter halos canexert significant dynamical friction, and are sponges thatsoak up energy and angular momentum leading to a rapidmerger (Barnes 1988).
Even though the eventual merger between the MilkyWay and Andromeda is common lore in Astronomy, themerger process has not been addressed by a comprehensivenumerical study. The one exception is a paper by Dubinskiet al. (1996) that presented a viable model for the LocalGroup and numerically simulated the eventual merger be-tween the Milky Way and Andromeda. However, Dubinskiet al. (1996) utilized this Local Group model and its numer-ical evolution to study the production of tidal tails duringsuch an encounter and the possibility to use the structure ofthis tidal material to probe the dark matter potential. Whilethe study by Dubinski et al. (1996) provided the first entic-ing picture of the future encounter between the Milky Wayand Andromeda, (for a more recent and higher resolutionversion of this simulation, see Dubinski 2006), it was nei-ther designed to detail the merger dynamics including inter-galactic material, nor outline the possible outcomes for thedynamics of our Sun, nor quantify properties of the mergerremnant. In addition, the last decade has produced a num-ber of improved models for the structure of the Milky Wayand Andromeda as well as the properties of the intragroupmedium.
In this paper we quantitatively predict when the inter-action and merger of the Milky Way and Andromeda willlikely occur and forecast the probable dynamics of the Sunduring this event. We achieve this goal by constructing amodel for the Local Group in §2 that satisfies all observa-tional constraints. We then evolve this model using a self-consistent N-body/hydrodynamic simulation, as described
in §3. The generic properties of the merger, including themerger timescale, the possible evolution of our Solar Sys-tem, and properties of the merger remnant, are outlined in§4. Finally, we conclude in §5.
2 A MODEL OF THE LOCAL GROUP
The distribution of mass within our Local Group of galaxieshas been a long–standing question in astrophysics. It is clearthat much of the matter is associated with the two largestgalaxies in the Local Group: the MilkyWay and Andromeda.Moreover, these two spiral galaxies are likely to be embeddedin an ambient medium of dark matter and gas.
There are a number of different models for both theMilky Way and Andromeda galaxies (see, e.g., Klypin et al.2002; Widrow & Dubinski 2005; Seigar et al. 2006, and ref-erence therein). These studies generally enlist a myriad ofobservational data to infer the distribution of baryons, whilethe dark matter, which dominates the gravitational poten-tial, is set to match distributions extracted from cosmologi-cal N-body simulations (e.g., Navarro et al. 1996). Together,these models specify the total mass distribution out to thevirial radius (∼ 200− 300 kpc).
In our model of the Local Group we start by adoptingthe models for the Milky Way and Andromeda favored byKlypin et al. (2002). Within these models, the baryons arecontained entirely within the rotationally supported expo-nential disk and central bulge. These components are thensurrounded by a massive dark–matter halo, which has nearly20 times the mass as the baryons, as specified by the massfractions,mb andmd, defined as the bulge and disk mass, re-spectively, divided by the total mass. The exponential disk,of radial disk scale radius Rd, also contains a set fraction fof its mass in collisional gas that can cool and form stars.Both the bulge and dark halo components are assumed tofollow the Hernquist (1990) profile. The bulge scale radiusa is fixed to be 20% of the radial disk scale radius Rd. Thedark–matter profile is defined by its concentration c, spinparameter λ, and total virial mass M200 and virial circu-lar velocity V200 (at the radius r200 where the average inte-rior density is 200 times the critical cosmic density today,rhocrit = 10−29 g cm−3), which are all listed in Table 1.The numerical construction of these models employs meth-ods commonly used to construct equilibrium disk galaxies(see, e.g., Hernquist 1993a; Springel & White 1999; Springel2000; Cox et al. 2006; Springel et al. 2005).
Given the adopted parameters of the two largest galax-ies in the Local Group, we must now define their orbitalparameters and any ambient medium in which the systemwill be embedded. There are a few empirical constraints thatmust be considered. First, at the current epoch, the sepa-ration between the Milky Way and Andromeda is 780 kpc(McConnachie et al. 2005; Ribas et al. 2005). Second, theMilky Way and Andromeda are approaching each other at aradial speed of 120 km s−1, assuming a local circular speedof 220 km s−1(see Sec. 10.2 of Binney & Tremaine 1987).These observational facts tightly constrain any dynamicalmodel of the Local Group since their fractional error barsare estimated to be less than ∼ 5%.
Less well constrained is the current estimate for thetransverse velocity of Andromeda. As mentioned in §1,
The Collision Between The Milky Way And Andromeda 3
Table 1. Properties of the Milky Way (MW) and Andromeda(M31) models used in the work (see text for definitions).
Property MW Andromeda
V200 (km s−1) 145 170
M200 (1012M¯) 1.0 1.6
c 12 12
λ 0.031 0.036md 0.041 0.044
Rd 2.2 3.6
f 0.3 0.3
mb 0.008 0.012
a 0.4 0.7
Ndm 475,500 755,200
Ndisk 14,350 24,640
Ngas 6,150 10,560
Nbulge 4,000 9,600
speeds of < 200 km s−1are favored by recent models (Pee-bles et al. 2001; Loeb et al. 2005), but depend upon assump-tions regarding the distribution of mass within the LocalGroup and its initial state. We will therefore gauge the suc-cess of our Local Group model by its ability to reproducethe above three observations, but it should be kept in mindthat the first two observations have significantly less leewaythan the third.
One plausible starting model for the Local Group isto follow the logic originally employed by the timing argu-ment (Kahn & Woltjer 1959), i.e., that the mass of the LocalGroup is entirely contained within the Milky Way and An-dromeda and their motion is a simple two body problemgoverned by Kepler’s equations. In practice, however, mostof the recent implementations of the timing argument (see,e.g., Binney & Tremaine 1987; Fich & Tremaine 1991) gen-erally yield masses for the Local Group (> 3 × 10¹² M¯)that exceed the total masses in our Milky Way and An-dromeda models (2.6×10¹² M¯). This discrepancy suggeststhat the Milky Way and Andromeda do not contain the en-tire quantity of mass in the Local Group and are insteadthe most massive concentrations of mass within a larger all–encompassing medium. This point of view is very naturalin a cosmological context where galaxies are not isolated is-lands, but rather mountain peaks within a vast continent ofland.
For these reasons our Local Group model supplementsthe Milky Way and Andromeda galaxy models with a diffuseand extended intragroup medium, as schematically depictedin Figure 1. Put within a cosmological framework this initialconfiguration may represent a point in time when the entireLocal Group has decoupled from the general Hubble flowand is in the process of collapsing to become a virializedstructure.
For simplicity, we assume that initially the Local Groupmedium is a constant density cube of 1.5 Mpc on a side com-posed of both dark matter and gas. The total diffuse masswithin this cube is set equal to the total mass of the twogalaxy halos today, 2.6× 10¹² M¯, yielding a net mass inte-rior to the MW/M31 orbit that is consistent with the tim-ing argument. Our choice is motivated by other cosmologicalsimulations (Gao et al. 2004) which indicate that a substan-tial fraction of the dark matter is likely to be diffuse, resid-
ing in between virialized halos (within the unvirialized LocalGroup) at the initial time of our simulation 5Gyr ago. 3 Wealso postulate that the Local Group volume contains closeto the cosmic mean value of baryons, namely 16% (Spergelet al. 2003). Since the Milky Way and Andromeda galaxymodels only include baryons in the galactic disk and bulgecomponents, they are far short of this value. We therefore setthe Local Group medium to be 20% primordial gas, by mass,so that the entire region approaches the cosmic mean value.The gaseous component, like the dark matter, is initializedto have a constant density, and its temperature is fixed tobe 3 × 10⁵ K, consistent with estimates for the warm–hotintergalactic medium at comparable overdensities from cos-mological simulations (see, e.g., Fig. 6 in Dave et al. 2001).We note that the gas temperature is far below the virializedtemperature of the Local Group, however this assumptionis consistent with the post–turn around, and pre–virializedinitial conditions that we adopt. Since most of the gas willbe shocked and heated during the collapse and relaxation ofthe Local Group, the basic results of our simulation do notdepend on this initial gas temperature.
Since the total mass of the diffuse medium is equiv-alent to the two galaxies, the two components are repre-sented with an equivalent number of particles; 1.3 million(1.04 million dark matter, and 260,000 gas). With these as-sumptions, the overdensity of our initial Local Group modelis δLG = ρLG/ρcrit ≈ 10.
Unfortunately, once the Local Group contains this ex-tended mass distribution the relative motion of the MilkyWay and Andromeda no longer becomes a trivial applica-tion of Kepler’s laws. The diffuse mass will steadily extractorbital energy and angular momentum owing to dynamicalfriction, and the deep potential wells of the galaxies willslowly accrete diffuse matter. Both of these effects act togradually extract energy from the binary system, hardeningits orbit, and accelerating the merging process.
Owing to the complicated nature of the orbit, and itsdeviation from simple two–body motion, we are left with afair degree of ambiguity regarding the initial state of ourLocal Group model. Because the configuration envisaged byFigure 1 resembles the cosmological collapse of an overdenseregion of the Universe, a natural starting point is when thisfluctuation decoupled from the general cosmological expan-sion, turned around, and began to collapse under its own selfgravity. Like the original timing argument, we then presumethat this scenario also occurred for the Milky Way and An-dromeda as well, i.e., we initialize their radial velocity to bezero as if they have just turned around and are now aboutto begin their gravitational collapse.
While some insight about the value of the turn aroundradius can be gained from an application of the timing argu-ment, in practice we find that the position and velocity of the
3 The initial scale of the Local group in our simulation is an
order of magnitude larger than the virial radius r200 of the Milky
Way or Andromeda galaxies. If one were to extend the Navarroet al. (1997) density profile of the envelope around each galaxy
(with an asymptotic radial dependence of r−3) out to our initial
Local Group scale, then one would roughly double the mass found
within the virial radius of each halo. The added mass in thatcase would be similar to the amount we indeed assume for the
Figure 1. Sketch of the initial configuration of our Local Group model, which consists of the Milky Way and Andromeda embedded ina diffuse, constant–density intragroup medium of equivalent mass. See the text in §2 and Table 1 for more details.
Milky Way and Andromeda quickly deviated from simpletwo–body motion owing to the diffuse intragroup medium.In general, the velocities quickly grew larger than the orig-inal orbit specified and the direction became highly radial.We therefore adopted a trial and error approach where webuild an initial model, run it until the Milky Way and An-dromeda are separated by 780 kpc (as this is their currentseparation), and inspect the relative velocity between thetwo galaxies to assess the validity of the model.
Employing this procedure results in a best fitting modelfor the Local Group that begins with an initial Milky Wayand Andromeda separation of 1.3 Mpc, and initializes thethe two objects on an eccentric orbit ε = 0.494, with adistance at perigalacticon of 450 kpc and apogalacticonof 1.3 Mpc. With this orbit the initial angular velocity is65 km s−1, which could likely originate from tidal torques(Gott & Thuan 1978; Raychaudhury & Lynden-Bell 1989).
3 NUMERICAL METHODS
To simulate the evolution of our Local Group and in partic-ular the interaction between the Milky Way and Andromedause the publically available N-body/hydrodynamic codeGADGET2 (Springel 2005). This version of the code em-ploys the “conservative–entropy” formulation of SmoothedParticle Hydrodynamics (SPH, Springel & Hernquist 2002)that conserves both energy and entropy (unlike earlier ver-sions of SPH; see e.g., Hernquist 1993b), while improving
shock-capturing. We assume that the gas is of primordialcomposition, and include the effects of radiative cooling.
Star formation and its associated feedback are both in-cluded in a manner very similar to that described in Coxet al. (2006). As is commonly assumed, stars are stochasti-cally formed at a rate determined by the SPH gas density(see, e.g. Katz 1992; Springel & Hernquist 2003; Springelet al. 2005; Cox et al. 2006) with an efficiency set to matchthe observed correlation between star formation and gasdensity (Kennicutt 1998).
Feedback from stellar winds and supernovae is treatedin a very simplistic manner, namely the SPH particles thathave sufficient density to form stars are fixed to have an ef-fective temperature of 105 K. This methodology is similar inprinciple to most of the currently favored models for feed-back (see, e.g., Springel 2000; Springel & Hernquist 2003;Stinson et al. 2006; Cox et al. 2006), and is easy to imple-ment. Since the focus of this work is the large–scale evolutionof the Local Group and the generic dynamics of the colli-sion between the Milky Way and Andromeda, the detailedtreatment of the inter–stellar medium does not influence ourprimary conclusions.
4 THE COLLISION BETWEEN THE MILKY
WAY AND ANDROMEDA
In Figures 2 through 6 we present the basic properties ofthe dynamical evolution of our Local Group, from 5 Gyrin the past and until 10 Gyr into the future, beyond the
The Collision Between The Milky Way And Andromeda 5
merger time between the Milky Way and Andromeda. Mostof the features present in these figures are generic to binarygalaxy interactions, and have been described in great detailby prior studies (see, e.g., Toomre & Toomre 1972; Barnes& Hernquist 1991, 1992; Mihos & Hernquist 1996; Cox et al.2006). However, we will review some of the details that areparticularly relevant to the Local Group, and subsequentlyhighlight the unique dynamics of the Sun as a test particlein this galaxy interaction process. The future evolution ofstructures beyond the local group was simulated elsewhere(Nagamine & Loeb 2003, 2004; Busha et al. 2003, 2005).
To begin, Figures 2 and 3 present the entire evolution ofthe Local Group from the point of view of a distant observer.These images begin at the start of our simulation, whenthe Milky Way and Andromeda are separated by 1.3 Mpc,and include the present state of the Local Group (labeled“Today”) and the eventual merger of the Milky Way andAndromeda. As a guide to the eye, each panel includes thetrajectory of both the Milky Way and Andromeda.
Shown in Figure 2 is the evolution of the stellar com-ponent, which in our simulation only has contributions fromthe Milky Way and Andromeda as we ignore any structuresmaller than the two largest galaxies in the Local Group.
Figure 3 presents the projected gas distribution duringthe interaction, with panels shown at the same times as inFigure 2. Here the color–scale has been stretched to empha-size the abundant quantity of low–density gas that is spreadthroughout the local group. The initial condition of our Lo-cal Group model assumes a uniform distribution of warmgas, however the gas quickly responds to the non–uniformpotential. In particular gas is accreted and shocked to forma hydrostatic halo of warm gas around the Milky Way andAndromeda galaxies. The gas distribution is also clearly af-fected by the interaction itself, as shocks develop once thegalaxy halos begin to interpenetrate at close separation.
While a detailed analysis of the diffuse gaseous intra-group medium is beyond the primary focus of our work,the basic properties of this component appear to be con-sistent with observations. In particular, our model predictsthat, at the present state, the intragroup medium is pre-dominantly warm 105 − 106 K, has a fairly low density,10−4 − 10−6 cm−3, and fills the entire volume that we sim-ulate. We note this medium is also expected to extend tolarger scales into what has been termed the “Warm-Hot In-tergalactic Medium” (Cen & Ostriker 1999; Hellsten et al.1998; Dave et al. 2001). While the presence of our intra-group medium is consistent with all current data (Osoneet al. 2002). Owing to the difficulty in directly observinggas in this state, most evidence for its existence comes fromindirect means. For example, Chandra and FUSE observa-tions of z ∼ 0 Oxygen and Neon absorption along numeroussightlines suggests the presence of a local, volume–filling,diffuse, warm medium (Nicastro et al. 2002, 2003; Sembachet al. 2003; Savage et al. 2003), although detailed analy-sis of the ionization states suggest that this is a complexmulti–phase medium that our simulation does not have theresolution to model.
While Figure 2 presented the dynamical evolution of thestellar mass on large scales, this vantage point makes it diffi-cult to distinguish the tell-tale signs of a galaxy merger. Wetherefore zoom into the central regions of the Local Groupand specifically show the merger between the Milky Way
Figure 5. The separation between the centers of Andromeda andthe Milky Way during the course of their merger. The currentseparation of ∼ 780 kpc is shown with a horizontal dashed lineand occurs at T ≈ 4.7 Gyr.
and Andromeda in Figure 4. From this viewpoint the classicsignatures of a galaxy interaction, such as tidal tails, plumes,and shells are clearly evident.
The physical separation between the Milky Way andAndromeda is presented in Figure 5. The current state ofthe Local Group occurs ∼ 5 Gyr after the start of our sim-ulation. For the standard set of cosmological parameters(Tegmark 2006), this implies that we initiate the simula-tion at a redshift of z ≈ 0.5, around the time when theSun was born in the Milky Way disk4. Figure 5 also clearlyshows the prediction that our models makes for the futurecollision between the Milky Way and Andromeda. Their firstclose passage will occur less than 2 Gyr from the present,and the centers are fully coalesced in less than 5 Gyr. Thesetime scales are comparable to the lifetime of our Sun (Sack-mann et al. 1993) and admit the possibility that an observerin the Solar System will witness some (or all) of the galaxycollision. We will return to this possibility in §4.2.2.
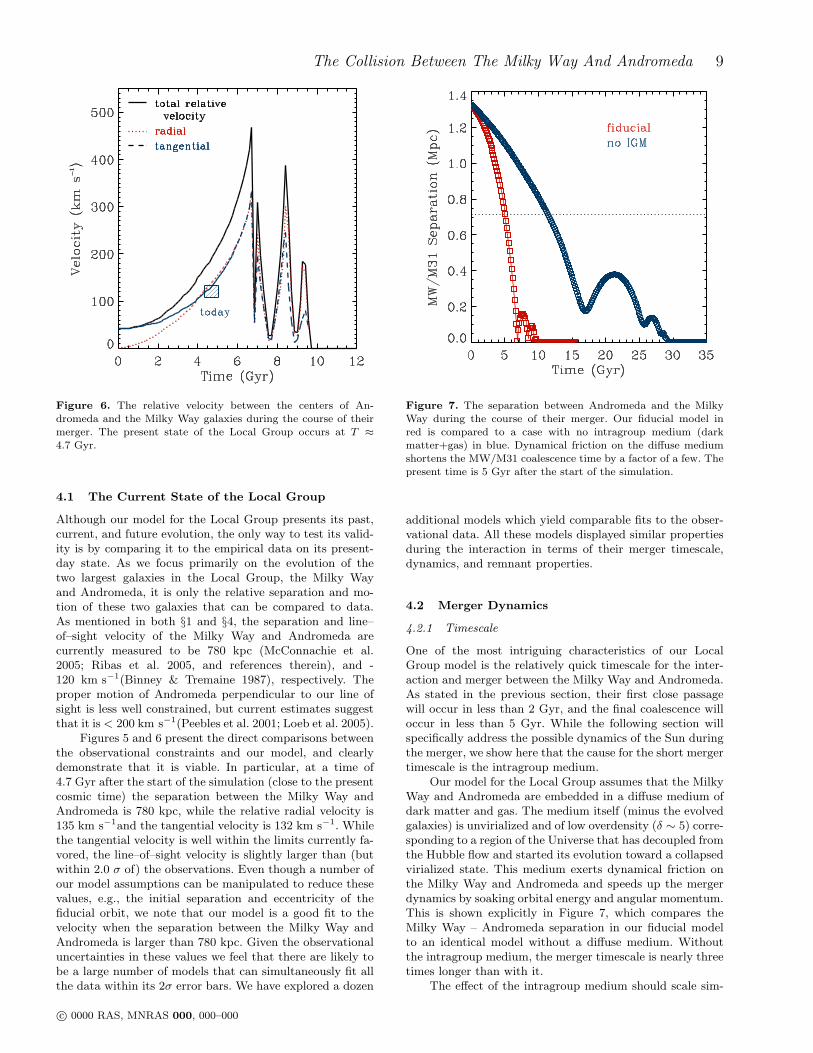
Finally, we present the relative velocity between theMilky Way and Andromeda in Figure 6. As in Figure 5 weclearly delineate the present state of the Local Group witha hatched region whose size corresponds to the errors esti-mated with the velocity measurements. We note that thevelocities presented are relative to each galaxies center ofmass, and do not correct for any motion relative to that.
Now that the general features of our Local Group modelhave been outlined, we next explore the validity of ourmodel, the merger dynamics, the star formation during theinteraction, and the properties of the merger remnant.
4 Note that extending the simulation to significantly earlier times
is not adequate since stellar ages imply that the two galactic disks
(and presumably their halos) have not been fully assembled at
The Collision Between The Milky Way And Andromeda 9
Figure 6. The relative velocity between the centers of An-dromeda and the Milky Way galaxies during the course of theirmerger. The present state of the Local Group occurs at T ≈
4.7 Gyr.
4.1 The Current State of the Local Group
Although our model for the Local Group presents its past,current, and future evolution, the only way to test its valid-ity is by comparing it to the empirical data on its present-day state. As we focus primarily on the evolution of thetwo largest galaxies in the Local Group, the Milky Wayand Andromeda, it is only the relative separation and mo-tion of these two galaxies that can be compared to data.As mentioned in both §1 and §4, the separation and line–of–sight velocity of the Milky Way and Andromeda arecurrently measured to be 780 kpc (McConnachie et al.2005; Ribas et al. 2005, and references therein), and -120 km s−1(Binney & Tremaine 1987), respectively. Theproper motion of Andromeda perpendicular to our line ofsight is less well constrained, but current estimates suggestthat it is < 200 km s−1(Peebles et al. 2001; Loeb et al. 2005).
Figures 5 and 6 present the direct comparisons betweenthe observational constraints and our model, and clearlydemonstrate that it is viable. In particular, at a time of4.7 Gyr after the start of the simulation (close to the presentcosmic time) the separation between the Milky Way andAndromeda is 780 kpc, while the relative radial velocity is135 km s−1and the tangential velocity is 132 km s−1. Whilethe tangential velocity is well within the limits currently fa-vored, the line–of–sight velocity is slightly larger than (butwithin 2.0 σ of) the observations. Even though a number ofour model assumptions can be manipulated to reduce thesevalues, e.g., the initial separation and eccentricity of thefiducial orbit, we note that our model is a good fit to thevelocity when the separation between the Milky Way andAndromeda is larger than 780 kpc. Given the observationaluncertainties in these values we feel that there are likely tobe a large number of models that can simultaneously fit allthe data within its 2σ error bars. We have explored a dozen
Figure 7. The separation between Andromeda and the MilkyWay during the course of their merger. Our fiducial model inred is compared to a case with no intragroup medium (dark
matter+gas) in blue. Dynamical friction on the diffuse mediumshortens the MW/M31 coalescence time by a factor of a few. The
present time is 5 Gyr after the start of the simulation.
additional models which yield comparable fits to the obser-vational data. All these models displayed similar propertiesduring the interaction in terms of their merger timescale,dynamics, and remnant properties.
4.2 Merger Dynamics
4.2.1 Timescale
One of the most intriguing characteristics of our LocalGroup model is the relatively quick timescale for the inter-action and merger between the Milky Way and Andromeda.As stated in the previous section, their first close passagewill occur in less than 2 Gyr, and the final coalescence willoccur in less than 5 Gyr. While the following section willspecifically address the possible dynamics of the Sun duringthe merger, we show here that the cause for the short mergertimescale is the intragroup medium.
Our model for the Local Group assumes that the MilkyWay and Andromeda are embedded in a diffuse medium ofdark matter and gas. The medium itself (minus the evolvedgalaxies) is unvirialized and of low overdensity (δ ∼ 5) corre-sponding to a region of the Universe that has decoupled fromthe Hubble flow and started its evolution toward a collapsedvirialized state. This medium exerts dynamical friction onthe Milky Way and Andromeda and speeds up the mergerdynamics by soaking orbital energy and angular momentum.This is shown explicitly in Figure 7, which compares theMilky Way – Andromeda separation in our fiducial modelto an identical model without a diffuse medium. Withoutthe intragroup medium, the merger timescale is nearly threetimes longer than with it.
The effect of the intragroup medium should scale sim-
ilarly to the standard (Chandrasekhar) formula for dynam-ical friction (Binney & Tremaine 1987, Eq. 7-18), in whichthe deceleration of a massive object is proportional to thebackground matter density, dv/dt ∝ ρ. Therefore, the rateat which angular momentum is extracted from the orbit de-pends on the assumed intragroup medium density, a quan-tity which is poorly constrained observationally. Once thedark matter halos begin to interpenetrate, i.e., when theMilky Way – Andromeda separation is ∼ 100 kpc, themerger completes relatively quickly because the dark matterhalos dominate over the background density.
This last point is particularly relevant to simulations ofbinary galaxy mergers, which typically omit any backgroundoverdensity. While this omission does not significantly al-ter the dynamical friction estimates once the halos overlapand therefore dominate the background density, it may stillchange the distribution of orbits in high density environ-ments where the galaxies traverse through significant over-densities prior to their interaction event. In this sense, themerger timescales extracted from binary merger simulationsmay be considered an upper limit that is most applicable togalaxies in the field.
4.2.2 The Fate of our Solar System
An interesting consequence of the short timescale for themerger between the Milky Way and Andromeda is the pos-sibility that a human (or decedent thereof) observer willwitness the interaction and merger. At the heart of this is-sue is the comparison between the lifetime of the Sun andthe interaction timescale.
Current evolutionary models (see, e.g., Sackmann et al.1993) predict that the Sun will steadily increase its sizeand luminosity for the next 7 Gyr as it slowly consumes allavailable hydrogen and evolves towards a red giant phase.While this places a strong upper limit to the extent of lifeon Earth, it is likely that much smaller changes (< 50%)in the Sun’s luminosity will significantly alter the Earth’satmosphere and thus its habitability within the next 1.1-3.5 Gyr (Kasting 1988). Korycansky et al. (2001) suggestedthat the onset of these effects could be delayed by increasingthe orbital radius of the Earth through a sequence of inter-actions with bodies in the outer Solar System, and we cannot rule out the possible colonization of habitable planetsin nearby stars, especially long-lived M-dwarfs (Udry et al.2007) whose lifetime may exceed 1012 years (Adams et al.2005). In short, it is conceivable that life may exists for aslittle as 1.1 Gyr into the future or, if interstellar travel ispossible, much longer.
Regardless of the prospects for life in the future, we canpredict what any potential observer at the solar Galactic cir-cle might see by tracking candidate Suns in our simulation.In particular, we flag all stellar particles with a galactocen-tric radius of 8±0.1 kpc, corresponding to the observed valuefor the Sun (Eisenhauer et al. 2003), and subsequently followthe location of these particles forward in time. The resultsare presented in Figure 8. Given the uncertainties in ourmodel parameters, it is not possible to forecast reliably theactual phase of the Galactic orbit of the Sun at the time ofclosest approach to Andromeda. Therefore we regard all thestellar particles at the galactocentric of the sun as equallyprobable of being the Sun.
Figure 9. The cumulative star-formation rate during the mergerof the Milky Way and Andromeda compared to the star formationfor models of the Milky Way and Andromeda evolved in isolation.
Figure 8 outlines the wide variety of potential locationsfor our candidate Suns during the future evolution of theLocal Group. For example, the top–right panel in Figure 8demonstrates the location of the candidate Suns after thefirst passage of Andromeda. At this point, the observer willmost likely still be in the (now disturbed) disk of the MilkyWay, but there exists a 12% chance that the Sun will betidally ejected and take part in the tidal tail material thatis > 20 kpc away from the Milky Way center.
The probability that the candidate Sun will be locatedfarther than 20 kpc from the Milky Way center steadily in-creases as the interaction progresses. At the second passage,the percentage of Suns that are farther than 20 kpc is 30%.This number increases to 48% after the second passage. andis 68% in the merger remnant. In fact, there is a 54% chancethat the Sun will be at radii larger than 30 kpc in the mergerremnant. However, we caution that this probability is de-rived at one point in time. Individual stars will generallyspend much of their orbital time at large radii, even if theirorbit is eccentric and they come much closer to the galacticcenter at other times.
One unexpected possibility for the location of the fu-ture Sun is demonstrated in the lower–middle panel of Fig-ure 8, namely the Sun may actually become bound to An-dromeda instead of the Milky Way before the two galax-ies coalesce. Such a situation occurs when material becomesloosely bound after the first passage and is later capturedby the gravitational potential of Andromeda during its sec-ond passage. While this outcome is unexpected and certainlyexciting, only 2.7% of the candidate Suns became bound toAndromeda and so this outcome is relatively unlikely.
The Collision Between The Milky Way And Andromeda 11
Figure 8. The possible location of the Sun during various stages of the merger between the Milky Way and Andromeda. The top panel
shows all stellar particles in our simulation that have a present-day galactocentric radius of 8±0.1 kpc with a red cross and tracks their
position into the future. The bottom panel presents a histogram of the radial distance from the center of the Milky Way.
4.3 Star Formation
There is mounting evidence that galaxy interactions are thepredominant mechanism for producing large bursts of starformation, such as in the ultra–luminous infrared galax-ies (ULIRGs, Sanders & Mirabel 1996; Barnes & Hern-quist 1992). During the interactions, gravitational torquesextract angular momentum from the gas and funnel it tothe center of the merger galaxy where it participates in acentrally–concentrated starburst. Because the future of theLocal Group entails a major galaxy merger, it is natural toexamine whether the merger of the Milky Way with An-dromeda will become a ULIRG.
This question is addressed explicitly in Figure 9, whichshows the star–formation rate during the entire evolution of
the Local Group, including the merger between the MilkyWay and Andromeda. Throughout the entire evolution ofthe Local Group, the star–formation rate steadily decreaseswith time, and hence we conclude that the merger LocalGroup will not become a ULIRG in the future. In fact, the fi-nal coalescence yields star formation that is barely enhancedabove the that which would occur if the Milky Way and An-dromeda has not participated in the merger at all.
The weak starburst event triggered by the merger be-tween the Milky Way and Andromeda is a direct result oftheir present low gas content. Moreover, a large fraction(> 75%) of this gas will be consumed by quiescent star for-mation by the time the merger actually occurs. In short,both disks will be extremely gas–poor during the final coa-lescence and there will be no fuel for the starburst.
While we have not explicitly tracked the black holes atthe center of the Milky Way and Andromeda, it is interest-ing to speculate whether the merger will produce a luminousquasar, which many models argue is intricately linked togalaxy mergers and starbursts (Hopkins et al. 2006). Eventhough Figure 9 demonstrates that there is not enough gasto fuel a powerful starburst, this gas content is clearly suf-ficient to ignite a luminous quasar if ∼ 1% of it is accretedby the black hole. While the current work cannot addressthis possibility in detail, our model provides a framework tostudy the formation of quasars in the future.
4.4 The Merger Remnant
Galaxy mergers have become an area of intense study ow-ing to their proposed role in shaping galaxy morphology. Inparticular, the “merger hypothesis” (Toomre 1977) positsthat the interaction and merger of two spiral galaxies leavesbehind a remnant that is morphologically and kinematicallysimilar to an elliptical galaxy. Since the future evolution ofthe Local Group contains such an event, it is natural toexamine whether the local group will eventually consist ofa single elliptical galaxy, and if so, how do the propertiesof this galaxy differ from present–day ellipticals which wereformed at earlier epochs.
Note that the morphology of the Milky Way and An-dromeda merger remnant, which we abbreviate hereafter asMilkomeda, was presented in Figure 4. This figure confirmsthe notion that galaxy mergers leave behind remnants thatare spheroidal in shape, contain stars with wide range of or-bits and a large velocity dispersion, and possess very modestnet rotation.
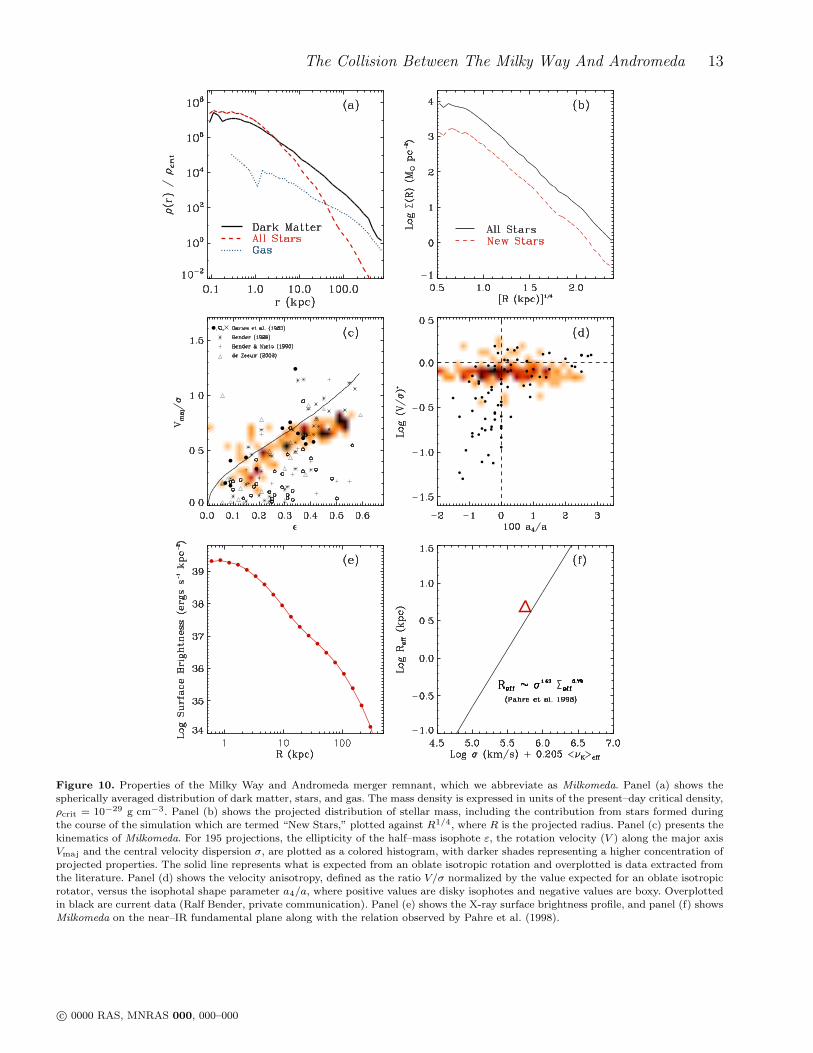
In Figure 10, we present a series of plots that furthersupport the assertion that Milkomeda resembles an ellipticalgalaxy and also serve to better quantify its properties. Inpanel (a), we present the spherically averaged mass profile,decomposed by the three components; dark matter, stellarand gaseous mass. At radii greater than ∼ 2 − 3 kpc, thedark matter dominates the mass density, and at radii greaterthan ∼ 20 kpc, the profile is well–fit by the NFW (Navarroet al. 1996) or Hernquist (Hernquist 1990) profile.
The projected mass distribution shown in panel (b) ofFigure 10 presents the first direct evidence that Milkomeda
resembles an elliptical galaxy. Specifically, the stellar surfacedensity is close to a pure R1/4 distribution, with the excep-tion of the inner ∼ 400 pc, where the surface density flattensto a nearly constant density core.
We have also quantified the kinematics and isophotalshape of the Milkomeda galaxy following the methods of Coxet al. (2006). Panel (c) in Figure 10 presents the anisotropydiagram, a measure of the half–mass isophote ellipticity ver-sus the maximum rotation along its major axis divided bythe central velocity dispersion. The shaded region representsthe distribution of values for Milkomeda if viewed from 195directions that uniformly sample the unit sphere (with an-gles selected using HEALPIX, Gorski et al. 2005). Also plot-ted in this figure is the relation expected from an oblateisotropic rotator as a solid line. Owing to the high concen-tration of projections that closely track the solid line, thisanalysis demonstrates that Milkomeda is nearly an oblateisotropic rotator. In addition, the deviations from a perfectellipse are also quantified and are presented in panel (d) in
Figure 10. Depending on the viewing direction, Milkomeda
may appear to be either disky or boxy, with a slightly largerfraction of views producing disky isophotes.
We have also analyzed the properties of the hot gasin and around Milkomeda. The evolution of this componentwas presented in Figure 3 and clearly demonstrates the for-mation of an extended gaseous halo, primarily accreted fromthe large reservoir of the intragroup medium. Although thegas temperature was originally 3×10⁵ K, it has been shock-heated to the virial temperature of ∼ 3×10⁶ K in Milkomeda
and has a gradient to cooler temperatures at large radii. Thishot gas leads to an X-ray surface brightness profile shownin panel (e) of Figure 10 and a total X-ray luminosity of∼ 1041 ergs s−1, which is consistent with present–day ellipti-cal galaxies of equivalent B-band luminosity (∼ 3×10¹⁰ L¯).
In general, Milkomeda resembles the remnants of gas–rich major mergers, which in–turn resemble the general pop-ulation of low– and moderate–luminosity elliptical galaxies(Naab et al. 2006; Cox et al. 2006). However, there are somesystematic differences that likely arise because of the muchsmaller gas content of the Milky Way and Andromeda whenthey merge. In particular, the inner regions of Milkomeda
have a much lower stellar density than present–day ellipti-cals, which are often observed to have steep spikes of newlyformed stars (Rothberg & Joseph 2004; Kormendy & Fischer2007). These central excesses arise from high gas concentra-tions that fuel nuclear starbursts during the merger event(see,e.g., Mihos & Hernquist 1994; Springel 2000; Cox et al.2006). This process does not occur during the formation ofMilkomeda (see §4.3), for which the stars formed during themerger simulation have an identical profile to the entire stel-lar population (see panel (b) in Figure 10).
The diffuse nature of Milkomeda is also evident if itis projected onto the near-IR fundamental plane as shownin panel (f) of Figure 10, where it lies above the observedrelation. The half–mass radius is 4.9 kpc, which is largerthan the mean relation found in the Sloan Digital Sky Sur-vey (Shen et al. 2003; Desroches et al. 2007) for galaxies ofequivalent stellar mass (1.3 × 10¹²M¯) or r–band absolutemagnitude (-21.2). These comparisons gives credence to theclaim that present–day ellipticals can not have formed fromthe merger of present day spirals (Naab & Ostriker 2007).
5 CONCLUSIONS
In this paper we have used an N-body/hydrodynamic sim-ulation to track the evolution of the Local Group, focusingprimarily upon the two most massive galaxies: the MilkyWay and Andromeda. In contrast to most prior work, whichtypically employed models for the Local Group to infer itstotal mass or the proper motion of its constituents, we sim-ulated the large-scale dynamics of all matter in the Lo-cal Group including dynamical friction on the intragroupmedium, leading to the eventual merger of the Milky Wayand Andromeda.
Owing to the diffuse intragroup medium that was as-sumed to pervade the Local Group with a total mass compa-rable to that the galaxies, we have found that the interactionand merger between the Milky Way and Andromeda will oc-cur in less than 5 Gyr, a timescale comparable to the lifetimeof the Sun (Sackmann et al. 1993). This Local Group model
The Collision Between The Milky Way And Andromeda 13
Figure 10. Properties of the Milky Way and Andromeda merger remnant, which we abbreviate as Milkomeda. Panel (a) shows the
spherically averaged distribution of dark matter, stars, and gas. The mass density is expressed in units of the present–day critical density,
ρcrit = 10−29 g cm−3. Panel (b) shows the projected distribution of stellar mass, including the contribution from stars formed duringthe course of the simulation which are termed “New Stars,” plotted against R1/4, where R is the projected radius. Panel (c) presents the
kinematics of Milkomeda. For 195 projections, the ellipticity of the half–mass isophote ε, the rotation velocity (V ) along the major axisVmaj and the central velocity dispersion σ, are plotted as a colored histogram, with darker shades representing a higher concentration of
projected properties. The solid line represents what is expected from an oblate isotropic rotation and overplotted is data extracted from
the literature. Panel (d) shows the velocity anisotropy, defined as the ratio V/σ normalized by the value expected for an oblate isotropic
rotator, versus the isophotal shape parameter a4/a, where positive values are disky isophotes and negative values are boxy. Overplotted
in black are current data (Ralf Bender, private communication). Panel (e) shows the X-ray surface brightness profile, and panel (f) showsMilkomeda on the near–IR fundamental plane along with the relation observed by Pahre et al. (1998).
therefore admits the possibility that future astronomers inthe Solar System will witness parts of, or the entire interac-tion and merger of the Milky Way and Andromeda.
With this in mind we have calculated the probable lo-cation of our Solar System during specific points of the fu-ture interaction and find several interesting outcomes. First,there is a 10% chance that the Sun will be ejected alongwith other tidal material into a long tidal tail following thefirst passage of Andromeda. Second, as a result of the dis-ruptive effects of two close tidal passages there is a 50%chance that the Sun will inhabit extended tidal features af-ter the second passage of Andromeda. Moreover, there isa 2.7% chance that the Sun will be more tightly bound toAndromeda at this point. In effect, Andromeda will capturethe Sun and future astronomers in the solar system mightsee the Milky Way as an external galaxy in the night sky.Finally, the merger remnant contains a significantly heatedstellar system compared to that of the Milky Way or An-dromeda. Within the merger remnant there is a 67% chancethat the Sun will reside at radii larger 20 kpc (at least forthe majority its orbit).
While this paper highlights the possible outcomes of thefuture interaction between the Milky Way and Andromeda,we emphasize that our model is likely to be one of manyplausible models within an ensemble of possibilities thatspan the uncertain value of the transverse velocity of An-dromeda and the density of the intragroup medium. Wehave performed an additional dozen runs which yield similaragreement to the observational constraints as the model pre-sented here and found little, if any, difference in our results.The results of these additional simulations suggest that ourfindings are robust to many of the modeling uncertainties.Nevertheless, a larger suite of models may provide betterstatistical confidence in the inferred merger timescale andthe fate of our Sun and Local Group. In addition, employ-ing higher resolution simulations with increased complexity,may shed light on the nature of the intragroup medium,the soft X-ray background (Osone et al. 2002), galactic sub-structure (Willman et al. 2005), the origin of the MagellanicClouds and Stream (Besla et al. 2007), and the future evo-lution of globular clusters (Forbes et al. 2000).
Finally, we note that the simulated views from the dis-tribution of locations for the candidate Suns in the mergerremnant (see Fig. 8) represent the only views available for afuture local astronomer. Extragalactic astronomy will cometo an end within 100 billion years if the cosmological con-stant will not evolve with time. Owing to the accelerated ex-pansion caused by a steady cosmological constant, all galax-ies not bound to the Local Group will eventually recedeaway from the Local Group and exit our event horizon (Loeb2002). At that point, the merger product of the Milky Wayand Andromeda (with its bound satellites) will constitutethe entire visible Universe (Nagamine & Loeb 2003).
ACKNOWLEDGMENTS
The simulations were performed at the Center for ParallelAstrophysical Computing at the Institute for Theory andComputation at the Harvard-Smithsonian Center for Astro-physics. We acknowledge helpful discussions with G. Besla,S. Dutta, L. Hernquist, P. Hopkins, and B. Robertson. We
thank Ralf Bender for kindly providing data used in Fig-ure 10.
Barnes J. E., 1988, ApJ, 331, 699Barnes J. E., Hernquist L., 1992, ARA&A, 30, 705Barnes J. E., Hernquist L. E., 1991, ApJL, 370, L65Besla G., Kallivayalil N., Hernquist L., Robertson B., CoxT. J., van der Marel R. P., Alcock C., 2007, ArXiv Astro-physics e-prints
Binney J., Tremaine S., 1987, Galactic dynamics. Prince-ton, NJ, Princeton University Press, 1987, 747 p.
Busha M. T., Adams F. C., Wechsler R. H., Evrard A. E.,2003, ApJ, 596, 713
Busha M. T., Evrard A. E., Adams F. C., Wechsler R. H.,2005, MNRAS, 363, L11
Cen R., Ostriker J. P., 1999, ApJ, 514, 1Cox T. J., Dutta S., Di Matteo T., Hernquist L., HopkinsP. F., Robertson B., Springel V., 2006, ApJ, 650, 791
Cox T. J., Jonsson P., Primack J. R., Somerville R. S.,2006, MNRAS, 373, 1013
Dave R., Cen R., Ostriker J. P., Bryan G. L., HernquistL., Katz N., Weinberg D. H., Norman M. L., O’Shea B.,2001, ApJ, 552, 473
Desroches L.-B., Quataert E., Ma C.-P., West A. A., 2007,MNRAS, 377, 402
Dubinski J., 2006, S&T, 112, 30Dubinski J., Mihos J. C., Hernquist L., 1996, ApJ, 462, 576Eisenhauer F., Schodel R., Genzel R., Ott T., Tecza M.,Abuter R., Eckart A., Alexander T., 2003, ApJL, 597,L121
Fich M., Tremaine S., 1991, ARA&A, 29, 409Forbes D. A., Masters K. L., Minniti D., Barmby P., 2000,A&A, 358, 471
Gao L., White S. D. M., Jenkins A., Stoehr F., SpringelV., 2004, MNRAS, 355, 819
Gorski K. M., Hivon E., Banday A. J., Wandelt B. D.,Hansen F. K., Reinecke M., Bartelmann M., 2005, ApJ,622, 759
Gott III J. R., Thuan T. X., 1978, ApJ, 223, 426Hellsten U., Gnedin N. Y., Miralda-Escude J., 1998, ApJ,509, 56
The Collision Between The Milky Way And Andromeda 15
Loeb A., Reid M. J., Brunthaler A., Falcke H., 2005, ApJ,633, 894
McConnachie A. W., Irwin M. J., Ferguson A. M. N., IbataR. A., Lewis G. F., Tanvir N., 2005, MNRAS, 356, 979
Mihos J. C., Hernquist L., 1994, ApJL, 437, L47Mihos J. C., Hernquist L., 1996, ApJ, 464, 641Naab T., Jesseit R., Burkert A., 2006, MNRAS, 372, 839Naab T., Ostriker J. P., 2007, ArXiv Astrophysics e-printsNagamine K., Loeb A., 2003, New Astronomy, 8, 439Nagamine K., Loeb A., 2004, New Astronomy, 9, 573Navarro J. F., Frenk C. S., White S. D. M., 1996, ApJ, 462,563
Navarro J. F., Frenk C. S., White S. D. M., 1997, ApJ, 490,493
Nicastro F., Zezas A., Drake J., Elvis M., Fiore F., Frus-cione A., Marengo M., Mathur S., Bianchi S., 2002, ApJ,573, 157
Nicastro F., Zezas A., Elvis M., Mathur S., Fiore F.,Cecchi-Pestellini C., Burke D., Drake J., Casella P., 2003,Nature, 421, 719
Osone S., Makishima K., Matsuzaki K., Ishisaki Y.,Fukazawa Y., 2002, PASJ, 54, 387
Pahre M. A., de Carvalho R. R., Djorgovski S. G., 1998,AJ, 116, 1606
Peebles P. J. E., 1994, ApJ, 429, 43Peebles P. J. E., Melott A. L., Holmes M. R., Jiang L. R.,1989, ApJ, 345, 108
Peebles P. J. E., Phelps S. D., Shaya E. J., Tully R. B.,2001, ApJ, 554, 104
Raychaudhury S., Lynden-Bell D., 1989, MNRAS, 240, 195Ribas I., Jordi C., Vilardell F., Fitzpatrick E. L., HilditchR. W., Guinan E. F., 2005, ApJL, 635, L37
Rothberg B., Joseph R. D., 2004, AJ, 128, 2098Sackmann I.-J., Boothroyd A. I., Kraemer K. E., 1993,ApJ, 418, 457
Sanders D. B., Mirabel I. F., 1996, ARA&A, 34, 749Savage B. D., Sembach K. R., Wakker B. P., Richter P.,Meade M., Jenkins E. B., Shull J. M., Moos H. W., Son-neborn G., 2003, ApJS, 146, 125
Sawa T., Fujimoto M., 2005, PASJ, 57, 429Seigar M. S., Barth A. J., Bullock J. S., 2006, ApJ submit-ted (astro-ph/0612228)
Sembach K. R., Wakker B. P., Savage B. D., Richter P.,Meade M., Shull J. M., Jenkins E. B., Sonneborn G., MoosH. W., 2003, ApJS, 146, 165
Shen S., Mo H. J., White S. D. M., Blanton M. R., Kauff-mann G., Voges W., Brinkmann J., Csabai I., 2003, MN-RAS, 343, 978
Spergel D. N., Verde L., Peiris H. V., Komatsu E., NoltaM. R., Bennett C. L., Halpern M., Hinshaw G., Jarosik N.,Kogut A., Limon M., Meyer S. S., Page L., Tucker G. S.,Weiland J. L., Wollack E., Wright E. L., 2003, ApJS, 148,175
Valtonen M. J., Byrd G. G., McCall M. L., Innanen K. A.,1993, AJ, 105, 886
Widrow L. M., Dubinski J., 2005, ApJ, 631, 838Willman B., Dalcanton J. J., Martinez-Delgado D., WestA. A., Blanton M. R., Hogg D. W., Barentine J. C., Brew-ington H. J., Harvanek M., Kleinman S. J., Krzesinski J.,Long D., Neilsen Jr. E. H., Nitta A., Snedden S. A., 2005,ApJL, 626, L85
Wyse R. F. G., 2007, in IAU Symposium Vol. 77 of IAUSymposium, Lessons from Surveys of The Galaxy. pp1036–1046


![arXiv:0705.1170v2 [astro-ph] 20 Feb 2008 · 2008. 2. 20. · The Collision Between The Milky Way And Andromeda 3 Table 1. Properties of the Milky Way (MW) and Andromeda (M31) models](https://static.documents.pub/doc/80x56/60aedc5bf75f59226b342917/arxiv07051170v2-astro-ph-20-feb-2008-2008-2-20-the-collision-between-the.jpg)


