Journal of Financial Economics 88 (2008) 499–533 The colors of investors’ money: The role of institutional investors around the world $ Miguel A. Ferreira a , Pedro Matos b, a ISCTE Business School, Av. Forc - as Armadas, 1600-189 Lisbon, Portugal b Marshall School of Business, University of Southern California, 3670 Trousdale Pkwy BRI308, Los Angeles, CA 90089, USA Received 12 April 2006; received in revised form 13 June 2007; accepted 17 July 2007 Available online 6 March 2008 Abstract We study the role of institutional investors around the world using a comprehensive data set of equity holdings from 27 countries. We find that all institutional investors have a strong preference for the stock of large firms and firms with good governance, while foreign institutions tend to overweight firms that are cross-listed in the U.S. and members of the Morgan Stanley Capital International World Index. Firms with higher ownership by foreign and independent institutions have higher firm valuations, better operating performance, and lower capital expenditures. Our results indicate that foreign and independent institutions, with potentially fewer business ties to firms, are involved in monitoring corporations worldwide. r 2008 Elsevier B.V. All rights reserved. JEL classification: G15; G24; G32; G34 Keywords: Institutional investors; Firm value; International capital markets; Monitoring 1. Introduction A key factor in global capital markets is the fast growing importance of institutional investors. According to the International Monetary Fund (2005) (IMF), these professional investors manage financial assets exceeding US$45 trillion (including over US$20 trillion in equities). Assets under management of institutions have tripled since the early 1990s. Further, institutional investors are major players not just in developed markets; their role is rapidly growing in emerging market countries (see Khorana, Servaes, and Tufano, 2005). ARTICLE IN PRESS www.elsevier.com/locate/jfec 0304-405X/$ - see front matter r 2008 Elsevier B.V. All rights reserved. doi:10.1016/j.jfineco.2007.07.003 $ We thank Yakov Amihud, Paul Bennett, John Griffin, Jay Hartzell, Andrew Karolyi, Luc Laeven, Ameziane Lasfer, Elias Papaioannou, Jose-Luis Peydro, Kristian Rydqvist, Michael Schill, Laura Starks, Francis Warnock, and an anonymous referee; seminar participants at the University of Southern California, University of Texas at Austin, and City University of London; and participants at the Darden/World Bank 5th Annual Conference on Emerging Markets, the ECB Conference on Financial Globalisation and Integration, 2006 Portuguese Finance Network, 2006 CEMAF/ISCTE Conference on Corporate Governance, and the 2007 Frontiers of Finance Conference for helpful comments. We also thank LionShares and Olivier de Bellescize for providing the institutional ownership data. This research is supported by a grant from the Fundac - a˜o para a Cieˆncia e Tecnologia (FCT/POCI 2010). Corresponding author. E-mail address: [email protected] (P. Matos).
Transcript
ARTICLE IN PRESS
0304-405X/$ - s
doi:10.1016/j.jfi
$We thank
Papaioannou, J
participants at
the Darden/Wo
2006 Portugues
Conference for
research is supp�CorrespondE-mail addr
Journal of Financial Economics 88 (2008) 499–533
www.elsevier.com/locate/jfec
The colors of investors’ money: The role of institutionalinvestors around the world$
Miguel A. Ferreiraa, Pedro Matosb,�
aISCTE Business School, Av. Forc-as Armadas, 1600-189 Lisbon, PortugalbMarshall School of Business, University of Southern California, 3670 Trousdale Pkwy BRI308, Los Angeles, CA 90089, USA
Received 12 April 2006; received in revised form 13 June 2007; accepted 17 July 2007
Available online 6 March 2008
Abstract
We study the role of institutional investors around the world using a comprehensive data set of equity holdings from 27
countries. We find that all institutional investors have a strong preference for the stock of large firms and firms with good
governance, while foreign institutions tend to overweight firms that are cross-listed in the U.S. and members of the Morgan
Stanley Capital International World Index. Firms with higher ownership by foreign and independent institutions have
higher firm valuations, better operating performance, and lower capital expenditures. Our results indicate that foreign and
independent institutions, with potentially fewer business ties to firms, are involved in monitoring corporations worldwide.
r 2008 Elsevier B.V. All rights reserved.
JEL classification: G15; G24; G32; G34
Keywords: Institutional investors; Firm value; International capital markets; Monitoring
1. Introduction
A key factor in global capital markets is the fast growing importance of institutional investors. According tothe International Monetary Fund (2005) (IMF), these professional investors manage financial assets exceedingUS$45 trillion (including over US$20 trillion in equities). Assets under management of institutions havetripled since the early 1990s. Further, institutional investors are major players not just in developed markets;their role is rapidly growing in emerging market countries (see Khorana, Servaes, and Tufano, 2005).
ee front matter r 2008 Elsevier B.V. All rights reserved.
neco.2007.07.003
Yakov Amihud, Paul Bennett, John Griffin, Jay Hartzell, Andrew Karolyi, Luc Laeven, Ameziane Lasfer, Elias
ose-Luis Peydro, Kristian Rydqvist, Michael Schill, Laura Starks, Francis Warnock, and an anonymous referee; seminar
the University of Southern California, University of Texas at Austin, and City University of London; and participants at
rld Bank 5th Annual Conference on Emerging Markets, the ECB Conference on Financial Globalisation and Integration,
e Finance Network, 2006 CEMAF/ISCTE Conference on Corporate Governance, and the 2007 Frontiers of Finance
helpful comments. We also thank LionShares and Olivier de Bellescize for providing the institutional ownership data. This
orted by a grant from the Fundac- ao para a Ciencia e Tecnologia (FCT/POCI 2010).
ARTICLE IN PRESSM.A. Ferreira, P. Matos / Journal of Financial Economics 88 (2008) 499–533500
In this paper we examine what drives institutional investors to firms and what role these investors play.Gillan and Starks (2003) posit that the rise of professional money managers as a large shareholder group incorporations worldwide offers the potential for increased monitoring of firm management. Institutions’involvement can range from threatening the sale of shares to the active use of corporate voting rights ormeetings with management.1 We are interested in whether these large investors are effective in influencingcorporate management and boards towards creating shareholder value. But there are reasons to expect thatnot all money managers are equally equipped or motivated to be active monitors. Foreign and moreindependent institutions are many times credited with taking a more active stance, while other institutions thathave business relations with local corporations may feel compelled to be loyal to management. For example,Fidelity is reported to be more aggressive on governance issues in Europe, but it is relatively acquiescent in theU.S. where it manages several corporate pension accounts (Business Week, 2006; Davis and Kim, 2006).Further, several empirical studies suggest that independent investment advisers and mutual funds are activemonitors (Brickley, Lease, and Smith, 1988; Almazan, Hartzell, and Starks, 2005; Chen, Harford, and Li,2007).
There is little evidence on the monitoring role of institutional investors outside the U.S., so we offer a firstexploration of this issue. Toward this end, we use a new comprehensive database of institutional stockholdings worldwide. The data set contains holdings at the stock-investor level of over 5,300 institutions in 27countries, with positions totaling US$ 18 trillion as of December 2005. Thus, the institutional ownership dataused in this paper represent nearly 40% of the world stock market capitalization.
For a better understanding of the role of institutional investors worldwide, we focus on non-U.S. firms inwhich institutions hold US$ 5.2 trillion.2 These institutional investors, depending on their geographic origin,could be a U.S.-based mutual fund manager (like Fidelity), a non-U.S.-based pension or endowment fund(like Norway’s State Petroleum Fund), or a domestic bank trust or insurance company (like BNP Paribas andAXA in France). Overall, U.S.-based institutions hold more than US$ 2 trillion overseas in non-U.S. stocks.This is matched by US$ 1.7 trillion held by non-U.S. foreign institutions and US$ 1.5 trillion by domesticinstitutions. Thus, while most research to date looks at U.S. institutions as the primary source of capital, wefind that the three groups of professional investors worldwide have similar pools of capital.
We start by exploring the revealed stock preferences of these three different institutional investor clienteles(U.S., non-U.S. foreign, and domestic money managers), and investigating which firm- and country-levelcharacteristics attract a particular group. Our results reveal preferences when investing at home, much likethose that U.S. institutions exhibit in U.S. markets (Gompers and Metrick, 2001), but money managersexhibit specific preferences when investing abroad.
First, we find that all institutional investors, whatever their geographic origin, share a preference for thestock of large and widely held firms (i.e., companies without large controlling blockholders), of firms incountries with strong disclosure standards, and of firms located physically near their home market. Second,foreign and domestic institutional investors diverge in some stock preferences. Foreign institutional investorshave a strong bias for firms in the Morgan Stanley Capital International (MSCI) World Index, firms that arecross-listed on a U.S. exchange, and firms that have external visibility through high foreign sales and analystcoverage. Domestic institutions underweight these same stocks. Foreign institutions also tend to avoid highdividend-paying stocks. Third, U.S. institutions diverge from non-U.S. foreign institutions in their preferencefor value over growth stocks, and a tendency to hold stocks in English-speaking countries and emergingmarkets. Thus, there is generally substantial diversity in the revealed stock preferences of various groups ofinstitutional investors depending on their geographic origin.
Another dimension of investor diversity is institution type. We can characterize professional moneymanagers as being of different ‘‘colors’’ in terms of their ability to actively monitor managers’ decisions.Because of potential business ties with the firms in which they invest, not all money managers act as
1For analyses of the effects of selling shares on corporate governance, see Admati and Pfleiderer (2006) and Parrino, Sias, and Starks
(2003). For surveys of shareholder activism, see Black (1999), Karpoff (2001), and Gillan and Starks (2007).2We focus on non-U.S. firms for three reasons: (1) most existent institutional investor studies examine only U.S. firms (e.g., Gompers
and Metrick, 2001); (2) most international corporate governance studies focus on non-U.S. firms (e.g., Doidge, Karolyi, and Stulz, 2004);
and (3) results are not affected by the fact that the number of U.S. firms is much larger than that of any other country. We describe later in
the paper some of the results for the sample of U.S. firms.
ARTICLE IN PRESSM.A. Ferreira, P. Matos / Journal of Financial Economics 88 (2008) 499–533 501
independent shareholders whose only consideration is shareholder value maximization. Following Brickley,Lease, and Smith (1988), Almazan, Hartzell, and Starks (2005), and Chen, Harford, and Li (2007), we divideinstitutions into two groups: independent institutions (mutual fund managers and investment advisers) andgrey institutions (bank trusts, insurance companies, and other institutions). Independent institutions tend tobe ‘‘pressure-resistant,’’ while grey institutions tend to be ‘‘pressure-sensitive’’ or loyal to corporatemanagement. For example, following Brickley, Lease, and Smith (1988), find that banks and insurancecompanies are more supportive of management actions than other types of institutional investors inantitakeover amendment proposals.
Using this classification, we first examine similarities and differences in investment preferences that mayarise out of distinct investment mandates and objectives. We find that both types of institutions share apreference for large, widely held, and visible stocks consistent with findings in the U.S. market (Bennett, Sias,and Starks, 2003). The results also show that independent managers invest more in firms with liquid stock andfirms in countries with strong legal environments, compared to grey managers (especially bank-controlledones).
Next, we examine which colors of investors matter in terms of monitoring and influencing managementdecisions. We investigate whether there are effects of institutional ownership on firm performance, particularlyfor different groups of institutions. Monitoring is usually considered to cost less for independent than for greyinstitutions, because the latter have a disadvantage in pressuring corporate managers for changes, as this mayharm their business relationships with the firm (Chen, Harford, and Li, 2007). Similarly, foreign institutionalinvestors are often believed to play more of a role in prompting changes in corporate governance practicesthan domestic money managers (Gillan and Starks, 2003).
We conjecture that the presence of foreign and independent institutions with large stakes has the potentialto enhance firm value through direct or indirect monitoring. By direct monitoring we mean the directintervention of institutions in voicing the interest of shareholders to corporate management (e.g., in proxycontests). By indirect monitoring we mean the effect of institutions on firm valuation if they act as a group todivest their investment in a company, thereby pushing up its cost of capital. As an alternative hypothesis, thevaluation gains associated with the presence of foreign and independent institutions can be transitory (ratherthan permanent), which is consistent with overvaluation or market timing. Recent work by Gozzi, Levine, andSchmukler (2006) and Sarkissian and Schill (2006) suggest that firms that access international markets havetransitory valuation gains.
To test these monitoring effects, we regress Tobin’s Q ratios of our global sample of firms on firm-, industry-, and country-level variables (as in Lins, 2003; Doidge, Karolyi, and Stulz, 2004), and also add the fraction ofshares held by different groups of institutional investors. We find that ownership by foreign and independentinstitutions has a significantly positive impact on firm valuation, unlike ownership by domestic and greyinstitutions. Because institutional ownership is likely to be jointly determined by firms’ Tobin’s Q ratios anddriven by other firm characteristics (as revealed by our tests on investor preferences), we re-estimate theTobin’s Q and institutional ownership equations as a system of simultaneous equations. We find consistentevidence of a strong positive relation between firm value and foreign and independent institutional ownership.No similar result obtains for domestic and grey investors.
To differentiate monitoring effects and overvaluation effects, we assess whether foreign and independentinstitutional ownership have a positive influence on a firm’s operating performance and investment policy aswell. We find a positive association of foreign and independent institutional ownership with returnon assets (ROA) and net profit margin (NPM). Furthermore, we find that the presence of foreign andindependent institutions also reduces capital expenditures (CAPEX), thereby suggesting that institutionalinvestor pressure curtails a manager’s incentives to (over)invest. Substantiating the monitoring interpretationof our findings, there is no similar relation between ownership by domestic and grey institutions and firmperformance.
We contribute to the literature on corporate governance around the world in speaking to the debate onwhether institutional investors’ monitoring and activism are effective. For the U.S., the evidence so far issomewhat mixed. Parrino, Sias, and Starks (2003) find that institutional selling influences the decision of theboard of directors to fire a CEO, while Gillan and Starks (2003) find typically modest stock price reactions toshareholder proposals by activist institutions. Other studies show that certain types of institutional investors
ARTICLE IN PRESSM.A. Ferreira, P. Matos / Journal of Financial Economics 88 (2008) 499–533502
have some influence on specific corporate events such as antitakeover amendments (Brickley, Lease, andSmith, 1988), research and development expenditures (Bushee, 1998), executive compensation (Almazan,Hartzell, and Starks, 2005), and merger and acquisition decisions (Gaspar, Massa, and Matos, 2005; Chen,Harford, and Li, 2007).
Our study of the effects of the colors of the firm’s shareholder base in an international capital marketssetting is an important contribution to the literature. Other papers analyze firms’ cost of capital and how it ispotentially reduced by a larger investor base (Merton, 1987; Foerster and Karolyi, 1999) and by cross-listingshares in the U.S. as a bonding mechanism (Doidge, Karolyi, and Stulz, 2004; Doidge, Karolyi, and Stulz,2007b). These authors document a positive valuation effect associated with cross-listing on a U.S. exchange.Our results go one step further to offer a direct link between foreign and independent institutional shareholderpresence and firm performance because of the monitoring role these institutions serve. We interpret thispositive valuation effect as a form of reputational bonding (Coffee, 2002; Stulz, 1999) that arises from thepresence of highly reputable institutions as large shareholders, rather than the legal bonding associated with aU.S. cross-listing.3
We use a more comprehensive data set than other studies of the revealed preferences of institutionalinvestors: domestic and foreign ownership in a single-destination country (the U.S. as in Gompers andMetrick, 2001; Japan as in Kang and Stulz, 1997; or Sweden as in Dahlquist and Robertsson, 2001); foreignholdings by investors from one single country (U.S. investors as in Aggarwal, Klapper, and Wysocki, 2005;Ammer, Holland, Smith, and Warnock, 2005; Leuz, Lins, and Warnock, 2005); country-level institutionalholdings or blockholdings (Chan, Covrig, and Ng, 2005; Li, Moshirian, Pham, and Zein, 2006); holdings fromjust one class of institutions (mutual funds as in Covrig, Lau, and Ng, 2006); or holdings for a single year.There are, of course, challenges with our data, which we also discuss.
The remainder of the paper is organized as follows. Section 2 presents the institutional holdings data, thesample of firms, and other variables. In Section 3, we conduct our tests to determine which firm and countrycharacteristics attract institutional investors. Section 4 studies the valuation effects of different groups ofinstitutions, and also their impact on operating performance and capital budgeting decisions. Section 5concludes and discusses the implications of our work.
2. Data description
2.1. Institutional investors holdings data
The stock holdings data are drawn from the FactSet/LionShares database, which is a leading informationsource for global institutional ownership.4 Institutions, which are defined as professional money managerswith discretionary control over assets (such as mutual funds, pension funds, bank trusts, and insurancecompanies), are frequently required to disclose publicly their holdings.
For equities traded in the U.S., FactSet/LionShares gathers institutional holdings from the mandatoryquarterly 13F filings with the Securities and Exchange Commission (SEC) as well as by rolling up the holdingsby individual mutual funds (N-30D filings with the SEC) managed by a particular fund managementcompany. For equities traded outside the U.S., FactSet/LionShares collects ownership data directly fromsources such as national regulatory agencies or stock exchange announcements (e.g., the Regulatory NewsService in the U.K.), local and offshore mutual funds, mutual fund industry directories (e.g., European FundIndustry Directory), and company proxies and annual reports.
We use the historical filings of the FactSet/LionShares database from January 2000 through December2005. We consider all types of stock holdings: ordinary shares, preferred shares, American DepositaryReceipts (ADR), Global Depositary Receipts (GDR), and dual listings. We handle the issue of different
3Licht (2003) and Siegel (2005) claim that U.S. enforcement is not fully effective in the case of non-U.S. firms that list on a U.S.
exchange, but the voluntary disclosure that results from cross-listing allows firms to bond themselves by building their reputation.4FactSet/LionShares data feed financial information providers such as Reuters and the Wall Street Journal. The Bank of New York
(www.adrbny.com) and J.P. Morgan (www.adr.com) rely on these data to report institutional holdings of ADRs.
ARTICLE IN PRESSM.A. Ferreira, P. Matos / Journal of Financial Economics 88 (2008) 499–533 503
reporting frequency by institutions from different countries by getting the latest holdings update at each year-end.5 The data cover institutions located in 27 different countries (K) and stock holdings from 48 destinationcountries’ stock markets (J).6 This data set offers a unique worldwide K � J set of panel data (whenaggregated at the country level) for each year over the 2000–2005 period. FactSet/LionShares providesholdings data for 5,337 different institutions in over 35,000 stocks worldwide, for a total market value of US$18 trillion as of December 2005.
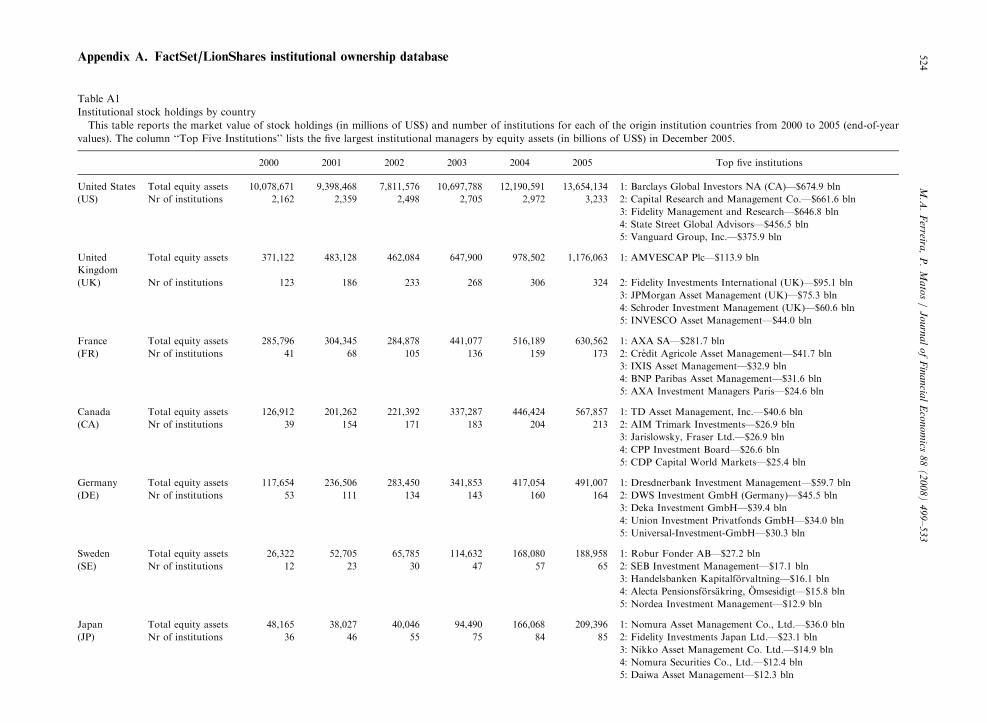
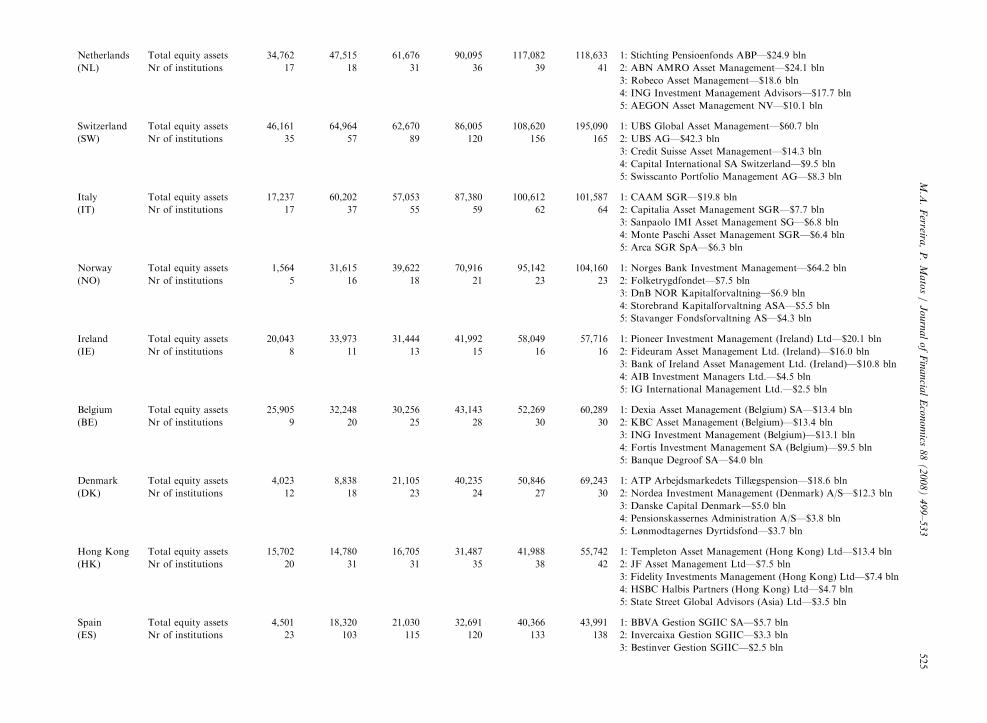
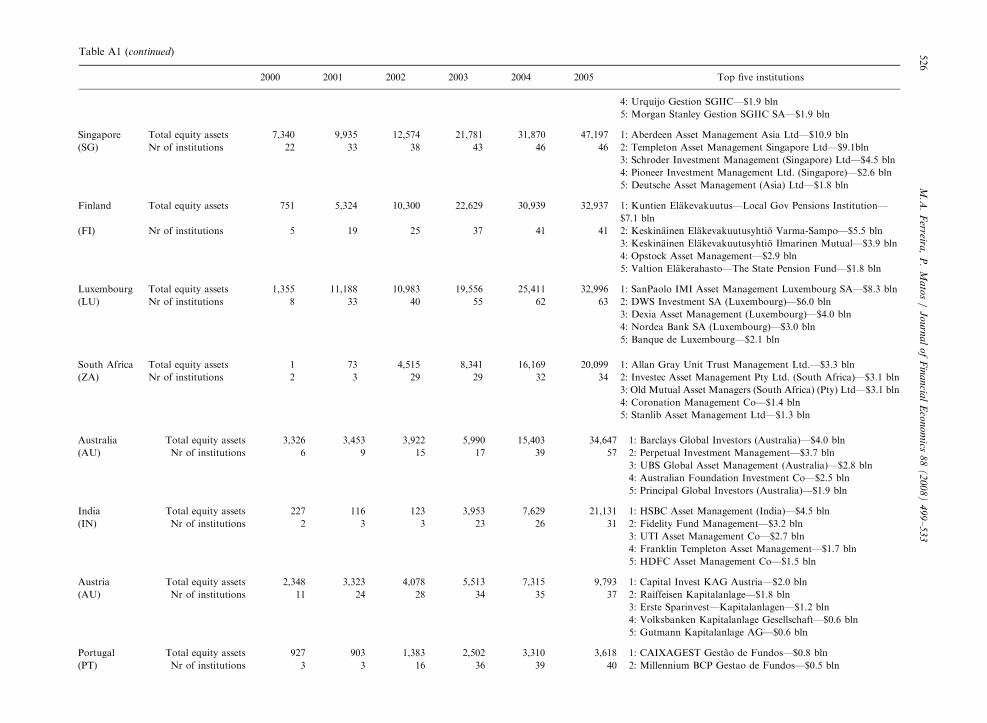
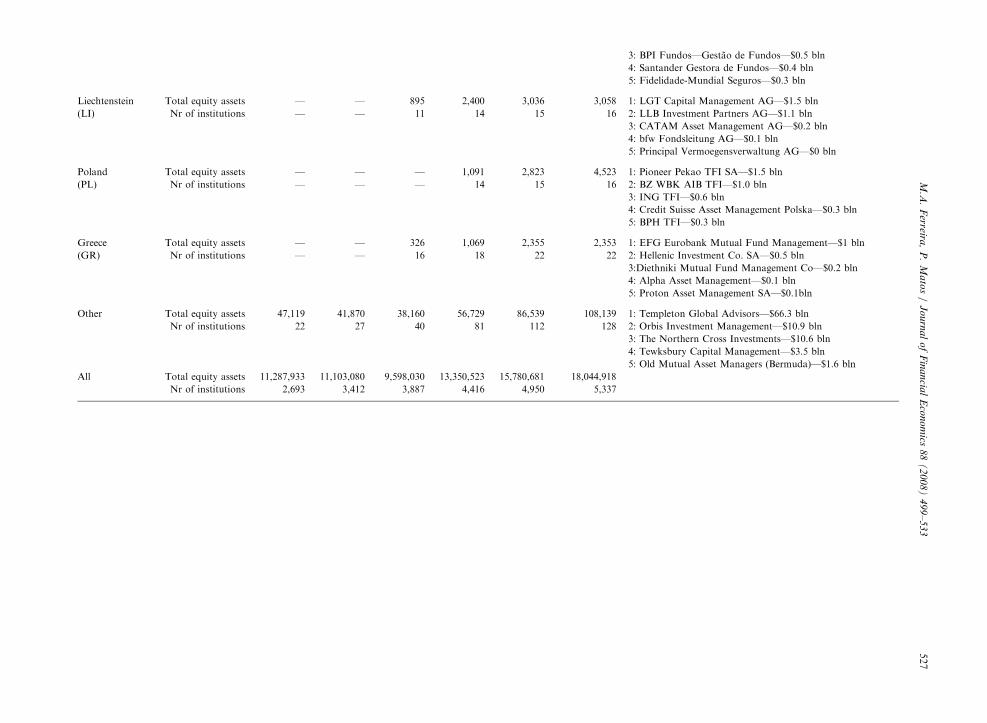
Table A1 in Appendix A presents equity assets held by institutions domiciled in each country at theend of each year. U.S.-based institutions are by far the largest group of professional managers of equityassets. Table A1 shows the top five institutions by equity assets under management per country as of December2005. Some of the leading institutions are fund families such as Barclays Global Investors, Capital Research andManagement, and Vanguard in the U.S. Other institutions are divisions of banks (e.g., Dresdner Bank inGermany, Credit Agricole in France, UBS in Switzerland), insurance companies (e.g., AXA in France), andpension funds (e.g., Canada Pension Plan, or Norway’s State Petroleum Fund managed by Norges Bank).
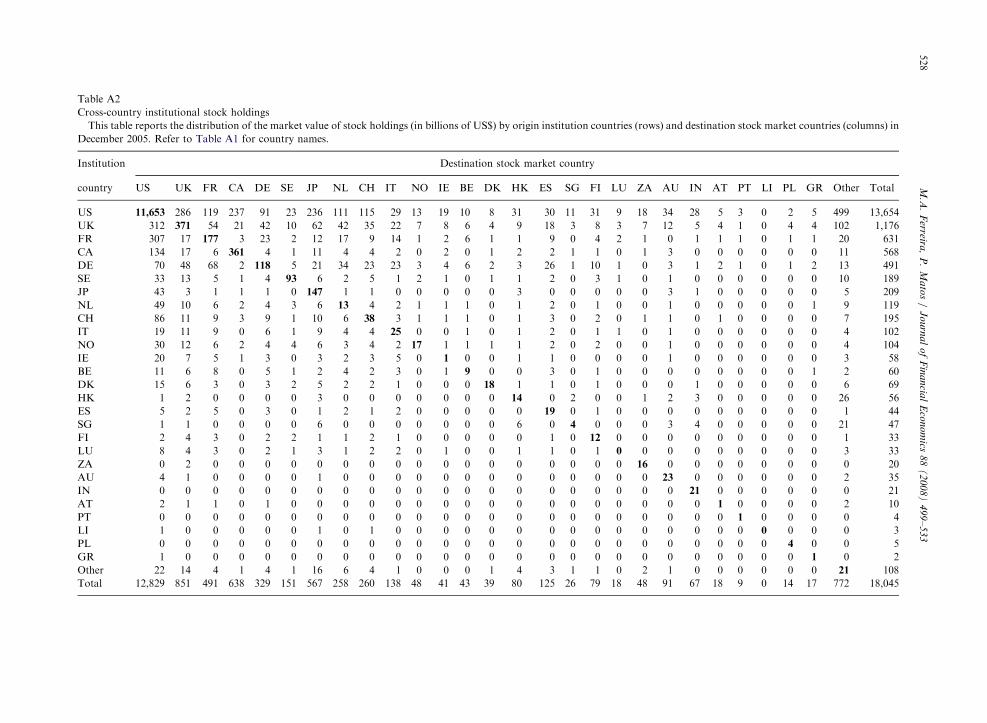
Table A2 presents the data in matrix form to summarize the holdings by country of origin of the institution(rows) and the destination stock market country (columns). Institutions covered by FactSet/LionSharesmanage a total of US$ 18 trillion of equity assets, of which US$ 5.2 trillion represents holdings in non-U.S.stocks in December 2005 (i.e., excluding the first column in the matrix—the U.S. as destination market).Focusing on all non-U.S. destination stock markets, we find that domestic institutional investors with amarket value of holdings of US$ 1.5 trillion (the sum of the diagonal elements of the matrix) are nearly on anequal footing with U.S. institutions that hold US$ 2 trillion (the sum of the elements in the first row of thematrix) and non-U.S. foreign institutions with US$ 1.7 trillion (the sum of the off-diagonal elements). Thus, inaggregate, non-U.S. firms across the world attract money from three institutional investor clienteles withsimilar pools of assets.
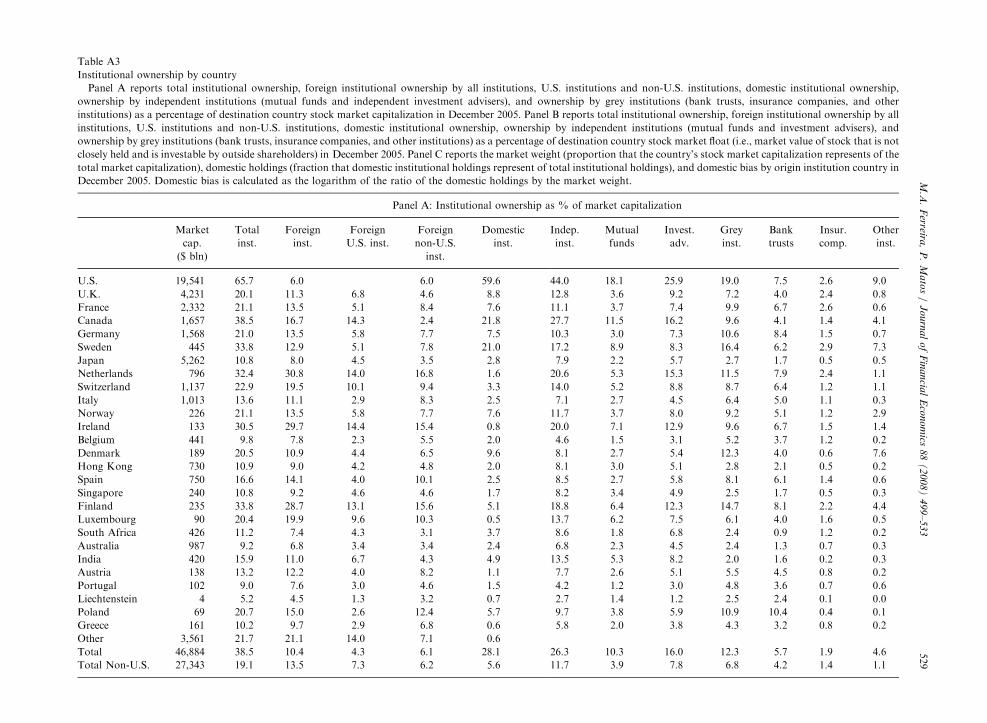
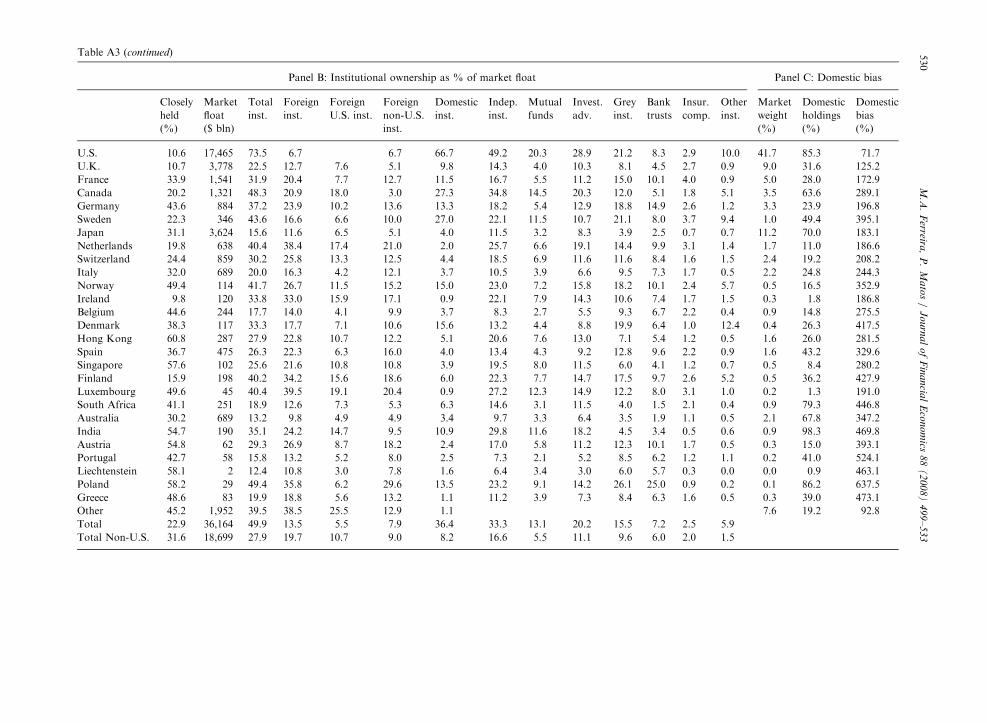
Panel A of Table A3 shows the fraction of each country’s stock market capitalization that was held byinstitutions in December 2005. Overall, according to FactSet/LionShares, institutional stock ownershipaccounts for 38.5% of world stock market capitalization. As expected, institutional ownership is highest in theU.S., but global institutional portfolio managers also hold large fractions of stock markets in countries such asCanada and Sweden. But not all stock issued by corporations can be held by institutions, as a significantfraction is closely held by large shareholders in some countries (Dahlquist, Pinkowitz, Stulz, and Williamson,2003). Panel B of Table A3. shows that institutional stock ownership accounts for 49.9% of the world stockmarket float (market capitalization times one minus the percentage of closely held shares).
To our knowledge, FactSet/LionShares data have been used only by Li, Moshirian, Pham, and Zein (2006).However, in that study, the authors study only the determinants of institutional blockholdings (stakes greaterthan 5%) at the country level using a single year. To better understand both the comprehensiveness and thelimitations of the FactSet/LionShares data coverage, we perform some comparisons using country-levelaggregate statistics and alternative data sets.
First, the market value of equity holdings of US$ 18 trillion reported by FactSet/LionShares is somewhatlower than the total value of US$ 20 trillion reported in IMF statistics.7 But FactSet/LionShares aggregateholdings are well above the holdings of the mutual funds segment as in Khorana, Servaes, and Tufano (2005)and Chan, Covrig, and Ng (2005). There are exceptions, however, as in the case of Japan and otherAsian countries where the FactSet/LionShares coverage seems to be better for mutual funds than for
5Reporting requirements vary across the world in terms of the minimum value of assets under management. Reporting frequencies also
vary across countries in our data set: quarterly (ES, FR, SE, US), semi-annual (AT, AU, BE, CA, DE, DK, FI, GR, HK, IE, LI, LU, NL,
NO, PT, UK, ZA), and annual (JP, IT). For example, there is a European Union Directive (UCITS III) that requires investment
companies to disclose their portfolio holdings at least semi-annually. The correspondence between country codes and names can be found
in Table A1. We restrict our analysis to year-end institutional holdings, rather than quarterly, for consistency across countries.6For a group of 21 countries (examples are Argentina, Brazil, China, and Czech Republic), LionShares/FactSet does not have
institutional holdings coverage but does have holdings of foreign institutions in local stocks. We keep these stock positions in our tests, but
our main results do not change if we restrict the sample to the 27 countries for which both domestic and foreign institutions’ coverage is
available.7To calculate the IMF total equity holdings, we multiply assets under management by the aggregate equity allocation per investor type
(insurance companies, pension funds, investment companies, and other) available for the major industrial countries.
ARTICLE IN PRESSM.A. Ferreira, P. Matos / Journal of Financial Economics 88 (2008) 499–533504
other institutions such as pension funds, so the overall equity holdings are somewhat underestimated inour study.8
Second, we analyze how representative FactSet/LionShares cross-border equity holdings are relative toaggregate statistics on cross-border equity holdings. The Coordinated Portfolio Investment Survey (CPIS)conducted by the IMF provides the most comprehensive aggregate information on cross-border holdings, butincludes equity holdings for all types of investors, institutional and retail alike. CPIS reports a total of US$ 2.6trillion invested by U.S. investors overseas in non-U.S. firms versus US$ 4 trillion invested by other foreignnon-U.S. investors in non-U.S. firms in 2004. The equivalent values in FactSet/LionShares are somewhatlower: US$ 2 trillion for U.S. investors, and US$ 1.7 trillion for non-U.S. foreign investors in non-U.S. firms(see Table A2), which can be explained by the fact that FactSet/LionShares covers only the institutionalsegment. Also, given that institutions have a greater presence in the U.S. than in other countries, the FactSet/LionShares data reveal a U.S. bias.9
Third, Panel C of Table A3 presents the domestic bias implicit in the FactSet/LionShares institutionalholdings by country. The domestic bias (calculated as the logarithm of the ratio of the percentage investeddomestically by institutions to the market weight of the domestic stock market in the world market) reportedby FactSet/LionShares is close to the bias implied by the CPIS and Chan, Covrig, and Ng (2005). Forexample, for U.S. investors, the domestic bias is 71.7% in FactSet/LionShares, close to the 70.5% for all U.S.investors in CPIS and 60.3% in Chan, Covrig, and Ng (2005).
2.2. Institutional ownership measures
We first define total institutional ownership (IO_TOTAL) as the sum of the holdings of all institutions in afirm’s stock divided by market capitalization at the end of each calendar year. We sum institutional positionsin local and ADR shares. Following Gompers and Metrick (2001), we set institutional ownership variables tozero if a stock is not held by any institution in FactSet/LionShares.10
We consider first the colors of institutional ownership according to the geographic origin of the institution:
�
8
fro
ma9
sta
Th
hol
U.S
cov1
1
(1)
ma
defi
ban
Domestic Institutional Ownership (IO_DOMESTIC): Sum of the holdings of all institutions domiciled inthe same country in which the stock is issued as a percentage of market capitalization.
� Foreign Institutional Ownership (IO_FOREIGN): Sum of the holdings of all institutions domiciled in a
country different from the country the stock is issued in as a percentage of market capitalization. We splitforeign institutional ownership into the percentage of shares held by U.S. domiciled institutions(IO_FOREIGN_US) and non-U.S. (foreign) domiciled institutions (IO_FOREIGN_NUS).
We also consider the colors of institutional ownership according to the institution type. Following Chen,Harford, and Li (2007), we classify institutions according to the potential for business ties to a corporation asindependent versus grey institutions11:
Although we do not focus on U.S. stocks in our analysis, we also compare our data with the aggregate 13-F holdings for U.S. stocks
m Thomson Financial Services (TFS, formerly CDA/Spectrum). The TFS holdings number of US$ 11.6 trillion in December 2005
tches almost exactly the first element in the matrix of Table A2.
With respect to U.S. data, there are additional sources to compare the FactSet/LionShares holdings against. A survey of U.S. Treasury
tistics based on reports from U.S. custodians estimates that U.S. investors held $2.6 trillion in non-U.S. stocks in 2004 (similar to CPIS).
e FactSet/LionShares covers only the institutional segment, so the equivalent figure in our data is US$ 2 trillion for U.S. institutional
dings overseas. Additionally, data from the Federal Reserve Board’s Flow of Funds indicate that foreign investors held $1.9 trillion in
. stocks in 2004. The equivalent figure in the FactSet/LionShares is $1.2 trillion (see the first column of the matrix in Table A2) as it
ers only institutional (and not all) foreign investors.0When we repeat the empirical analysis using only firms with positive holdings, our main results are not affected.1Naturally, the reader should be cautioned that relying on institutional categories to classify institutions on their activism is not perfect:
an institution is assigned to the institutional category where it has the largest fraction of its assets under management, though it may
nage simultaneously several investment vehicles—such as bank trusts and mutual funds; (2) there are cross-country differences between
nitions of institutional categories; and (3) there may be ‘‘shades of grey’’ in the demarcation of activism among institutions such as
k trusts and mutual funds.
ARTICLE IN PRESSM.A. Ferreira, P. Matos / Journal of Financial Economics 88 (2008) 499–533 505
�
Independent Institutional Ownership (IO_INDEP): Percentage of shares held by mutual fund managersand investment advisers. These institutions are more likely to collect information and face less regulatoryrestrictions or have fewer potential business relationships with the corporations they invest in. Weanticipate this group to be more involved in monitoring corporate management. Brickley, Lease, and Smith(1988) refer to these institutions as ‘‘pressure-resistant,’’ and Almazan, Hartzell, and Starks (2005) call them‘‘active.’’ � Grey Institutional Ownership (IO_GREY): Percentage of shares held by bank trusts, insurance companies,
and other institutions (e.g., pension funds, endowments). The current or prospective business relationshipsof these types of institutions with corporations tend to make this group more ‘‘pressure-sensitive’’ withrespect to corporate management. Alternatively, one can think of these groups of institutions as havinghigher monitoring costs. We anticipate this group to be more loyal to corporate management and thus tohold shares without reacting to management actions that are not in line with the interests of shareholders.Brickley, Lease, and Smith (1988) refer to these institutions ‘‘pressure-sensitive’’ and Almazan, Hartzell,and Starks (2005) call them ‘‘passive.’’
Using these institutional ownership variables we explore the colors of investors (geographic or institutionaltype) in terms of their willingness to be more or less active in monitoring manager actions. We expect foreignand independent institutions to be better equipped to play a monitoring role or to take more activist stances.
Table A3 offers aggregate statistics of institutional ownership by stock market. We can see that in mostmarkets outside the U.S., foreign institutional holdings exceed those of domestic money managers. Thepresence of independent versus grey investors varies across countries. For example, foreign institutions mattermore in France, while in Sweden domestic money managers hold a higher fraction of the market. The holdingsof independent and grey managers are equally matched in both countries.
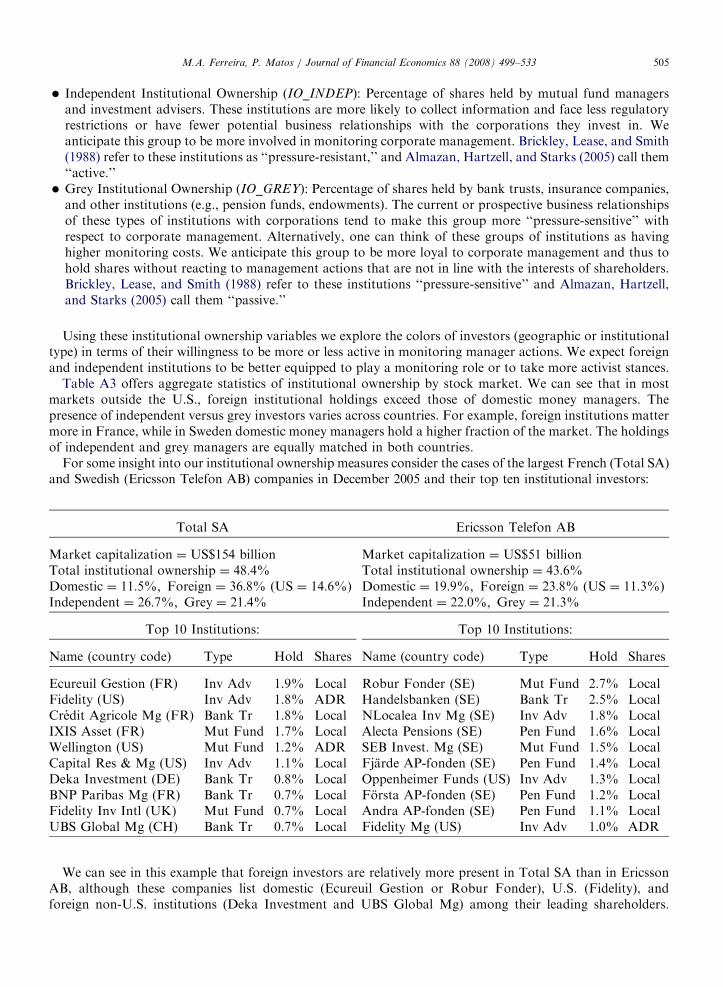
For some insight into our institutional ownership measures consider the cases of the largest French (Total SA)and Swedish (Ericsson Telefon AB) companies in December 2005 and their top ten institutional investors:
Type Hold Shares Name (country code) Type Hold Shares
Ecureuil Gestion (FR)
Inv Adv 1.9% Local Robur Fonder (SE) Mut Fund 2.7% Local Fidelity (US) Inv Adv 1.8% ADR Handelsbanken (SE) Bank Tr 2.5% Local Credit Agricole Mg (FR) Bank Tr 1.8% Local NLocalea Inv Mg (SE) Inv Adv 1.8% Local IXIS Asset (FR) Mut Fund 1.7% Local Alecta Pensions (SE) Pen Fund 1.6% Local Wellington (US) Mut Fund 1.2% ADR SEB Invest. Mg (SE) Mut Fund 1.5% Local Capital Res & Mg (US) Inv Adv 1.1% Local Fjarde AP-fonden (SE) Pen Fund 1.4% Local Deka Investment (DE) Bank Tr 0.8% Local Oppenheimer Funds (US) Inv Adv 1.3% Local BNP Paribas Mg (FR) Bank Tr 0.7% Local Forsta AP-fonden (SE) Pen Fund 1.2% Local Fidelity Inv Intl (UK) Mut Fund 0.7% Local Andra AP-fonden (SE) Pen Fund 1.1% Local UBS Global Mg (CH) Bank Tr 0.7% Local Fidelity Mg (US) Inv Adv 1.0% ADR
We can see in this example that foreign investors are relatively more present in Total SA than in EricssonAB, although these companies list domestic (Ecureuil Gestion or Robur Fonder), U.S. (Fidelity), andforeign non-U.S. institutions (Deka Investment and UBS Global Mg) among their leading shareholders.
ARTICLE IN PRESSM.A. Ferreira, P. Matos / Journal of Financial Economics 88 (2008) 499–533506
Also, investors choose local shares or ADRs differently, even among U.S. institutions (like Fidelity versusCapital Research Management). Additionally, we can see that independent and grey institutions are equallyimportant in Total SA and Ericsson Telefon AB.
2.3. Sample construction and summary statistics
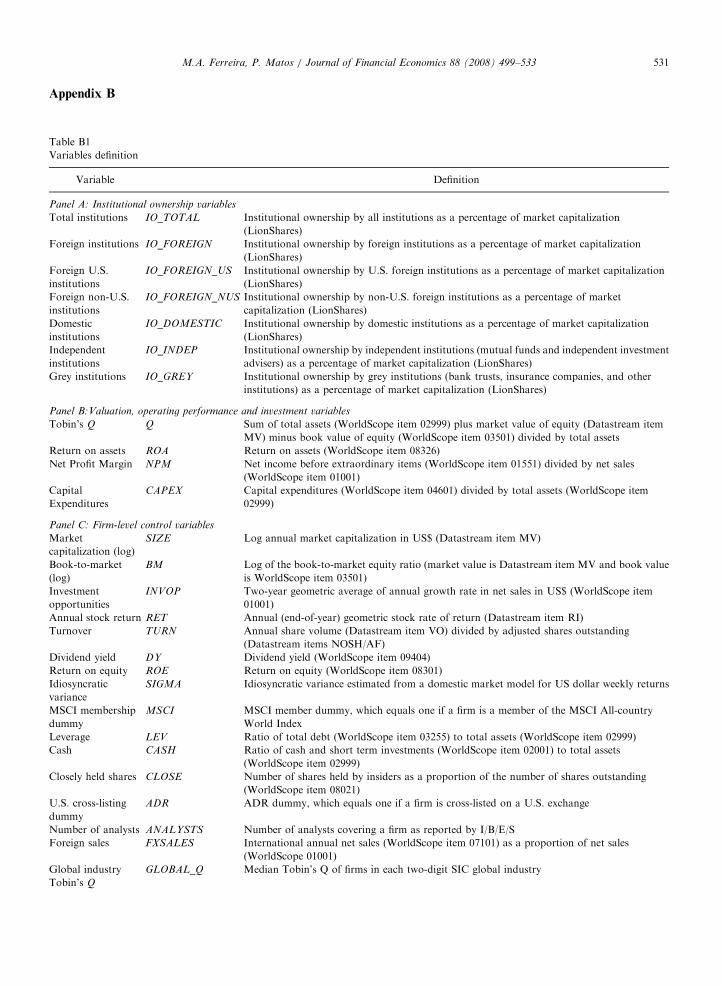
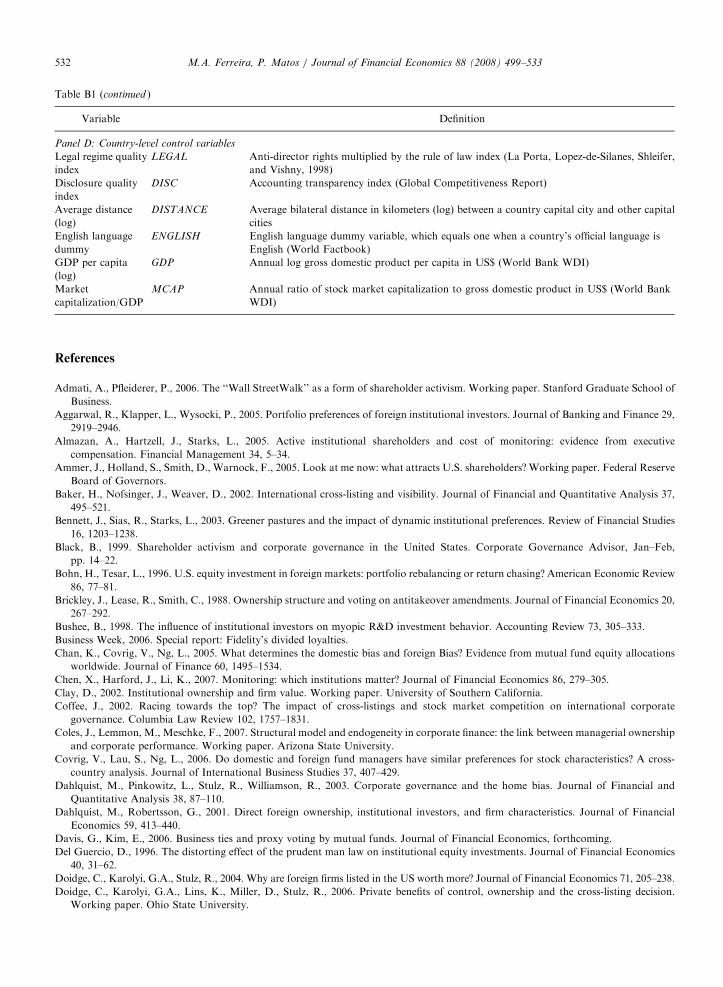
The initial sample includes all firms in the Datastream/WorldScope (DS/WS) database excluding financialfirms (SIC codes 6000-6999) for the years 2000 through 2005. We combine this sample of firms with theinstitutional holdings data from FactSet/LionShares at the end of each year using SEDOL codes (only fornon-U.S. firms), CUSIP codes (only for U.S. firms), and ISIN codes. The firm-level stock market and financialdata are drawn from DS/WS. We use several data sources to determine which non-U.S. firms are cross-listedin the U.S., when they initiated and ended the listing, and the type of listing (exchange-listed or non-exchange-listed).12 The final sample includes 11,224 unique non-U.S. firms, for a total of 38,064 firm-year observationsfor which we have data for the main variables of interest. Table B1 in Appendix B details the definitions anddata sources for all variables. Table 1 provides summary statistics on institutional ownership variables andfirm- and country-level control variables (we winsorize financial ratios such as return on equity and leverage atthe bottom and top 1% levels).
Average total institutional ownership by domestic institutions is 7.4% for non-U.S. firms but this is anequally weighted average, and institutional ownership is higher among large firms (in the last row of Panel Aof Table A3, we can see that the value-weighted institutional ownership for the sample of non-U.S. firms is19.1%). Furthermore, as discussed earlier, when we correct for shares that are closely held, total institutionalownership is 27.9% of market float (Panel B of Table A3). When we categorize total institutional ownershipby the institution’s geographic origin, we find that average (equal-weighted) domestic institutional ownership(3.8%) and foreign institutional ownership (3.6%) are similar. When we categorize total institutionalownership by institution type, we can see that ownership by independent institutions (5.0%) is greater, onaverage, than by grey institutions (2.4%).
The average non-U.S. firm in the sample has a market capitalization of US$ 157 million, 14.9% are MSCIindex members, and 3.9% are cross-listed on a U.S. exchange. About 27% of the observations are fromEnglish-speaking countries.
3. Determinants of institutional ownership
We investigate the determinants of institutional ownership worldwide, in particular, the fraction held bydifferent institution groups. We first examine the preferences of domestic versus foreign institutions. We thenexamine the preferences of independent versus grey institutions. Finally, we conduct several robustness checksand consider extensions of our primary results.
3.1. What attracts foreign and domestic institutions?
We start by examining which firm- and country-level characteristics drive foreign versus domesticinstitutional ownership in non-U.S. firms. Table 2 presents the estimates of the institutional ownership panelregressions: total, foreign (divided into U.S.-based and non-U.S.-based), and domestic. We estimate twospecifications: (1) one with firm- and country-level variables; and (2) one with firm-level variables and countryfixed effects.13 For total institutional ownership, we also run a first specification in Table 2 with only firm-levelvariables. This specification exhibits a high R2, suggesting that firm-level characteristics explain a considerable
12Data on non-U.S. firms listing in the U.S. market (Level 2 and 3 ADRs, over-the-counter, and Rule 144a private placements) are
obtained from the major depository institutions, Citibank, Bank of New York, JP Morgan, and Deutsche Bank. We add to this
information data collected directly from the stock exchanges on the ordinary listings of non-U.S. firms (including Canadian and Israeli
firms that list directly on the U.S. exchanges).13Following Petersen (2007), the standard errors of these panel data regressions are adjusted for clustering at the firm level and include
year dummies to account for residual correlation across years for a given firm (time-series dependence) and residual correlation across
firms in a given year (cross-sectional dependence).
ARTICLE IN PRESS
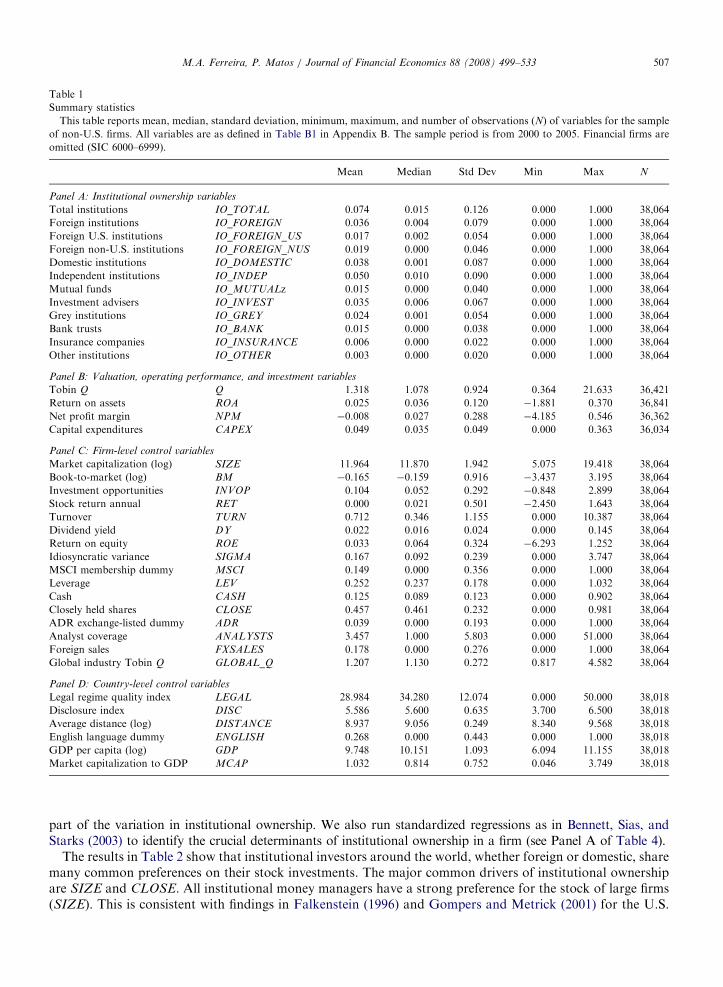
Table 1
Summary statistics
This table reports mean, median, standard deviation, minimum, maximum, and number of observations (N) of variables for the sample
of non-U.S. firms. All variables are as defined in Table B1 in Appendix B. The sample period is from 2000 to 2005. Financial firms are
omitted (SIC 6000–6999).
Mean Median Std Dev Min Max N
Panel A: Institutional ownership variables
Total institutions IO_TOTAL 0.074 0.015 0.126 0.000 1.000 38,064
Disclosure index DISC 5.586 5.600 0.635 3.700 6.500 38,018
Average distance (log) DISTANCE 8.937 9.056 0.249 8.340 9.568 38,018
English language dummy ENGLISH 0.268 0.000 0.443 0.000 1.000 38,018
GDP per capita (log) GDP 9.748 10.151 1.093 6.094 11.155 38,018
Market capitalization to GDP MCAP 1.032 0.814 0.752 0.046 3.749 38,018
M.A. Ferreira, P. Matos / Journal of Financial Economics 88 (2008) 499–533 507
part of the variation in institutional ownership. We also run standardized regressions as in Bennett, Sias, andStarks (2003) to identify the crucial determinants of institutional ownership in a firm (see Panel A of Table 4).
The results in Table 2 show that institutional investors around the world, whether foreign or domestic, sharemany common preferences on their stock investments. The major common drivers of institutional ownershipare SIZE and CLOSE. All institutional money managers have a strong preference for the stock of large firms(SIZE). This is consistent with findings in Falkenstein (1996) and Gompers and Metrick (2001) for the U.S.
ARTICLE IN PRESS
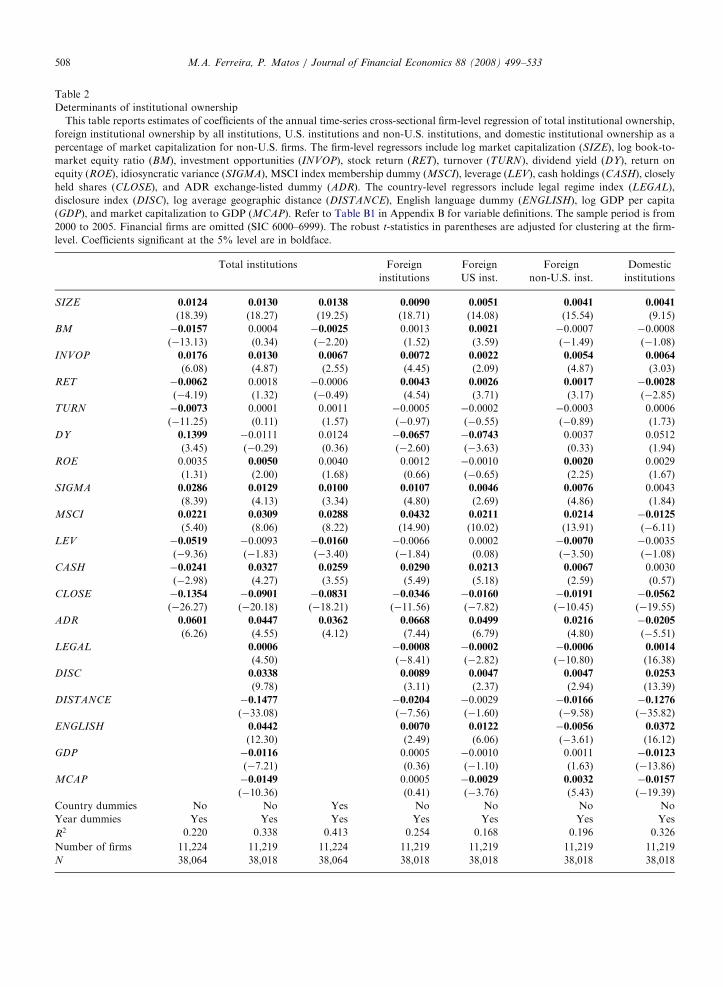
Table 2
Determinants of institutional ownership
This table reports estimates of coefficients of the annual time-series cross-sectional firm-level regression of total institutional ownership,
foreign institutional ownership by all institutions, U.S. institutions and non-U.S. institutions, and domestic institutional ownership as a
percentage of market capitalization for non-U.S. firms. The firm-level regressors include log market capitalization (SIZE), log book-to-
market equity ratio (BM), investment opportunities (INVOP), stock return (RET), turnover (TURN), dividend yield (DY), return on
Number of firms 11,224 11,219 11,224 11,219 11,219 11,219 11,219
N 38,064 38,018 38,064 38,018 38,018 38,018 38,018
M.A. Ferreira, P. Matos / Journal of Financial Economics 88 (2008) 499–533508
ARTICLE IN PRESSM.A. Ferreira, P. Matos / Journal of Financial Economics 88 (2008) 499–533 509
market and in Dahlquist and Robertsson (2001) for the Swedish market. Firm size is an importantfactor in international investment because institutions have concerns about liquidity and transaction costs.A one-standard deviation increase in firm size (i.e., an increase from US$ 157 million to US$1.1 billion for theaverage market capitalization) is associated with a 2.5 percentage point increase in total institutionalownership. All institutional investors hold fewer shares of firms that are closely held or that are associatedwith concentrated control rights (CLOSE). Leuz, Lins, and Warnock (2005) and Doidge, Karolyi, Lins,Miller, and Stulz (2006) find that U.S. institutions invest less in poorly governed firms, that is, firms with largeblock ownership by insiders (e.g., managers and families).
There are also common investment preferences among different groups of institutions in terms of other stockcharacteristics. For example, all institutions have a tendency to invest in companies with investment opportunitiesand proven profitability (INVOP and ROE), consistent with the ‘‘prudent man’’ rules that professional moneymanagers are likely to follow (Del Guercio, 1996). However, contrary to the predictions of the ‘‘prudent man’’rules, institutional ownership is higher for high idiosyncratic volatility stocks (SIGMA). Gompers and Metrick(2001) also find that money managers in the U.S. do not particularly avoid high risk stocks.14
But the three different groups of managers display diverse investment preferences in terms of other stockcharacteristics. Institutions’ preferences diverge mainly on two factors: MSCI and ADR. Both U.S. and otherforeign investors have a bias for companies in the MSCI World Index, the leading index used in internationalasset management as shown by the positive MSCI coefficient. Index membership matters as foreigninstitutional ownership is roughly four percentage points higher for MSCI firms. The negative MSCI coefficientfor domestic institutions indicates that this investor group fills the void in non-MSCI stocks. Additionally,foreign investors prefer to invest in cross-listed firms. The positive ADR coefficient for both U.S. and non-U.S.foreign institutional investors illustrates the positive effect of cross-listing on a U.S. exchange.15 Foreigninstitutional ownership is roughly six percentage points higher for firms with a U.S. cross-listing. When theyinvest domestically, institutions do not seem to prefer cross-listing firms. This finding is consistent with theresults in Ammer, Holland, Smith, and Warnock (2005) for U.S. investors. In untabulated regressions, wecontrol for selection bias (i.e., firms with higher foreign ownership are more likely to cross-list in the first place)and find that the positive relation between cross-listing and foreign ownership is robust.16
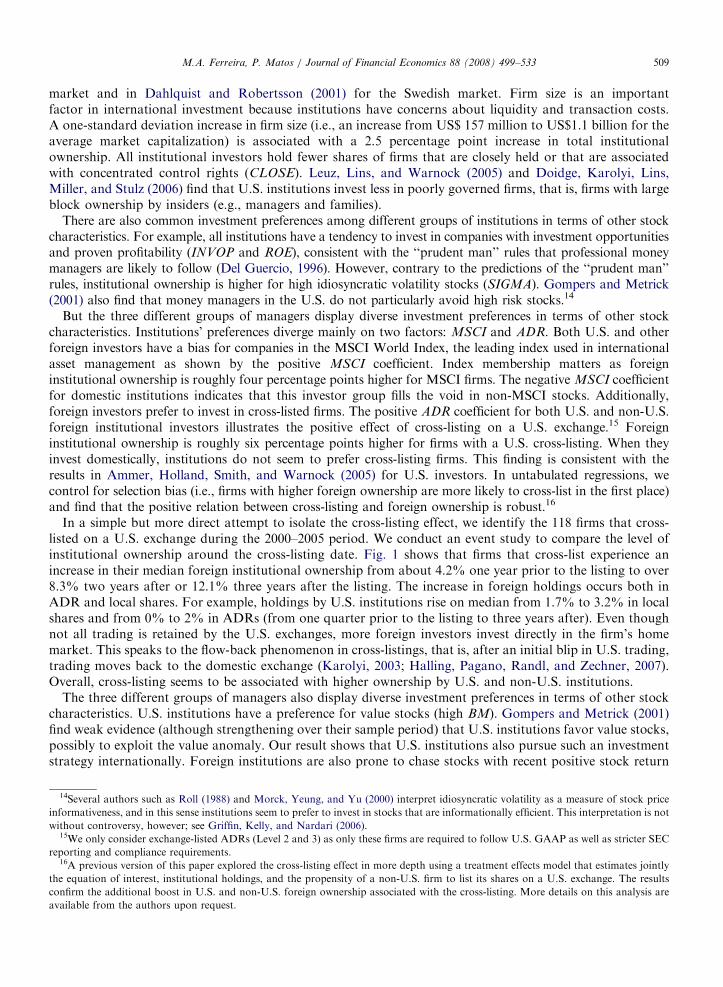
In a simple but more direct attempt to isolate the cross-listing effect, we identify the 118 firms that cross-listed on a U.S. exchange during the 2000–2005 period. We conduct an event study to compare the level ofinstitutional ownership around the cross-listing date. Fig. 1 shows that firms that cross-list experience anincrease in their median foreign institutional ownership from about 4.2% one year prior to the listing to over8.3% two years after or 12.1% three years after the listing. The increase in foreign holdings occurs both inADR and local shares. For example, holdings by U.S. institutions rise on median from 1.7% to 3.2% in localshares and from 0% to 2% in ADRs (from one quarter prior to the listing to three years after). Even thoughnot all trading is retained by the U.S. exchanges, more foreign investors invest directly in the firm’s homemarket. This speaks to the flow-back phenomenon in cross-listings, that is, after an initial blip in U.S. trading,trading moves back to the domestic exchange (Karolyi, 2003; Halling, Pagano, Randl, and Zechner, 2007).Overall, cross-listing seems to be associated with higher ownership by U.S. and non-U.S. institutions.
The three different groups of managers also display diverse investment preferences in terms of other stockcharacteristics. U.S. institutions have a preference for value stocks (high BM). Gompers and Metrick (2001)find weak evidence (although strengthening over their sample period) that U.S. institutions favor value stocks,possibly to exploit the value anomaly. Our result shows that U.S. institutions also pursue such an investmentstrategy internationally. Foreign institutions are also prone to chase stocks with recent positive stock return
14Several authors such as Roll (1988) and Morck, Yeung, and Yu (2000) interpret idiosyncratic volatility as a measure of stock price
informativeness, and in this sense institutions seem to prefer to invest in stocks that are informationally efficient. This interpretation is not
without controversy, however; see Griffin, Kelly, and Nardari (2006).15We only consider exchange-listed ADRs (Level 2 and 3) as only these firms are required to follow U.S. GAAP as well as stricter SEC
reporting and compliance requirements.16A previous version of this paper explored the cross-listing effect in more depth using a treatment effects model that estimates jointly
the equation of interest, institutional holdings, and the propensity of a non-U.S. firm to list its shares on a U.S. exchange. The results
confirm the additional boost in U.S. and non-U.S. foreign ownership associated with the cross-listing. More details on this analysis are
Fig. 1. Median institutional ownership around cross-listing. This figure plots median institutional ownership in local and ADR shares as a
percentage of market capitalization using a sample of 118 cross-listings on U.S. exchanges from 2000 to 2005. The areas give institutional
ownership (from bottom to top) of domestic institutions in local shares (2.2% three years after listing), U.S. institutions in local shares
(2% three years after listing), U.S. institutions in ADRs (2.2% three years after listing), non-U.S. foreign institutions in local shares (4.6%
three years after listing), and non-U.S. foreign institutions in ADRs (0.4% three years after listing). Domestic institutions holdings in
ADRs are insignificant so they are not shown in the figure.
M.A. Ferreira, P. Matos / Journal of Financial Economics 88 (2008) 499–533510
performance (RET) and domestic investors seem to exhibit contrarian behavior. This is consistent with someideas that foreign institutions represent hot money chasing hot markets (Tesar and Werner, 1995; Bohn andTesar, 1996; Grinblatt and Keloharju, 2000). Furthermore, domestic institutions prefer high dividend-payingstocks (DIV), but foreign institutions seem to avoid them, perhaps because of tax withholding concerns(Dahlquist and Robertsson, 2001; Ammer, Holland, Smith, and Warnock, 2005). Gompers and Metrick(2001) find that U.S. mutual funds seem averse to stocks with high dividend yields.
Finally, we look at country-level variables. All institutions reveal a preference for stocks from countries withgood disclosure standards (DISC). Investors prefer stocks from countries that are physically closer to theirlocal market (DISTANCE). U.S. institutions show a clear preference for English-speaking countries(ENGLISH) and less developed markets (MCAP), while non-U.S. institutions reveal the opposite. Thesefindings illustrate that groups of institutional investors have different reasons for investing abroad. Thequality of a country’s legal environment (LEGAL) is positively related to the presence of domestic institutionalinvestors, but we find the opposite result with respect to attracting foreign institutions. This is contrary towhat the law and finance literature would suggest (La Porta, Lopez-de-Silanes, Shleifer, and Vishny, 1998).Our interpretation is that an investor’s decision to invest abroad balances weak shareholder protection againststrong investment prospects or diversification benefits. This argument may explain why U.S. investors seem toprefer emerging markets over European markets when investing overseas.
3.2. What attracts independent and grey institutions?
We now examine the revealed preferences of different types of institutions, particularly independentinstitutions (mutual funds and investment advisers) versus grey institutions (bank trusts, insurancecompanies, and others). Different types of institutions are subject to distinct investment mandates andregulations. This may cause them to prefer investing in stocks that most help them satisfy investmentconstraints such as those of the prudent man rules (Del Guercio, 1996).
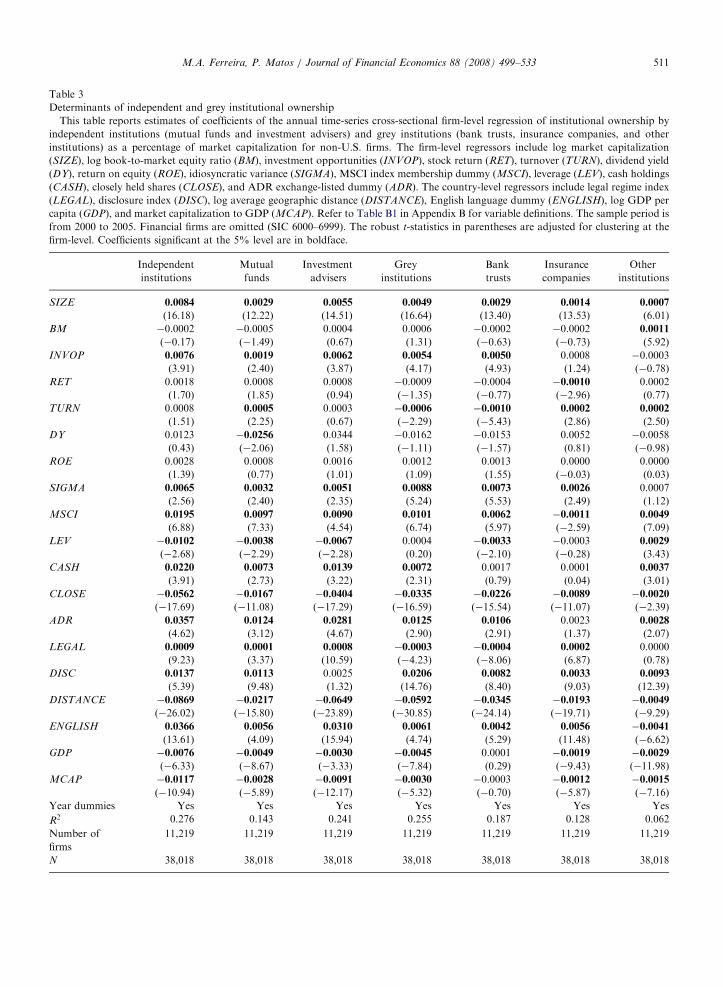
Table 3 presents estimates of the determinants of institutional ownership by institution type. In aggregate,independent and grey institutional investors share many common investment preferences. They have a strong
ARTICLE IN PRESS
Table 3
Determinants of independent and grey institutional ownership
This table reports estimates of coefficients of the annual time-series cross-sectional firm-level regression of institutional ownership by
independent institutions (mutual funds and investment advisers) and grey institutions (bank trusts, insurance companies, and other
institutions) as a percentage of market capitalization for non-U.S. firms. The firm-level regressors include log market capitalization
M.A. Ferreira, P. Matos / Journal of Financial Economics 88 (2008) 499–533 513
preference for large firms and visible firms (U.S. cross-listed and MSCI members), and firms with strongcorporate governance indicators (widely held). When we run standardized regressions (see Panel A of Table 4), wefind that SIZE, MSCI , and CLOSE and are the most important common factors driving institutional ownership.
There is, however, some variation in investment preferences of different types of institutions. Independentinstitutions are present more in liquid stocks (TURN), while grey institutions seem to shy away from these
ARTICLE IN PRESSM.A. Ferreira, P. Matos / Journal of Financial Economics 88 (2008) 499–533514
stocks. This speaks to the liquidity versus monitoring trade-off that large investors face (e.g., Kahn andWinton, 1998). Our results indicate a complementary relation in that activist shareholders prefer easilytraded shares from which they can pull out more quickly. Independent institutions also invest more in stockswith recent positive stock return performance, while grey institutions (especially insurance companies)seem to exhibit contrarian behavior. Insurance companies are the least sensitive to MSCI membership andU.S. cross-listing. Finally, we find more ownership by independent institutions in countries with a strong legalenvironment (LEGAL), but less ownership by grey institutions (especially bank trusts).
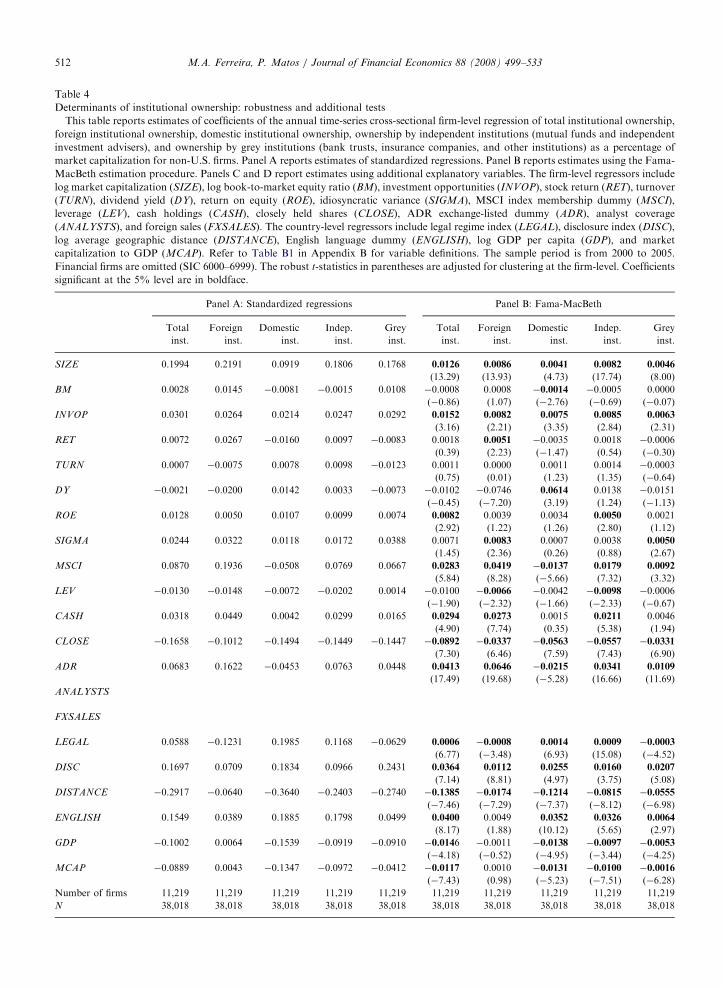
3.3. Robustness checks and additional tests
Table 4 presents several robustness checks and extensions of our primary results on investment preferences.Panel A of Table 4 presents the standardized regressions coefficients, which give an indication of theimportance of each variable for institutional ownership, as discussed above.17
The presence of cross-sectional dependence is a potential concern with panel regression results. Our resultsso far account for time-series and cross-sectional dependence using firm-clustered standard errors and yeardummies, as suggested by Petersen (2007). An alternative solution is to use the Fama-MacBeth procedureestimating a separate regression for each cross-section and then taking the time-series mean of the coefficients.Panel B of Table 4 shows that our results are robust to this procedure.
Our results are also robust in other ways. In the interest of brevity, in untabulated regressions we consider:(1) institutional ownership measured as a fraction of market float (instead of market capitalization); (2) thepotential censoring of the dependent variable by estimating a Tobit model, as a considerable number of firmshave zero institutional ownership; (3) a sample of firms of only the 27 countries that have institutionsdomiciled locally in our data set; (4) the ratio of the stock weight in the institutions’ portfolio relative to thestock weight in the market portfolio to see which firms are overweighted and underweighted by investors; (5) asample of firms that only have positive institutional holdings; and (6) industry dummies or standard errorsclustered by country. Finally, as a benchmark exercise, we consider the determinants of institutionalinvestment in U.S. stocks (instead of non-U.S. stocks). Our results match earlier findings by Gompers andMetrick (2001). Like these authors, we find a preference for large, liquid, and value stocks.
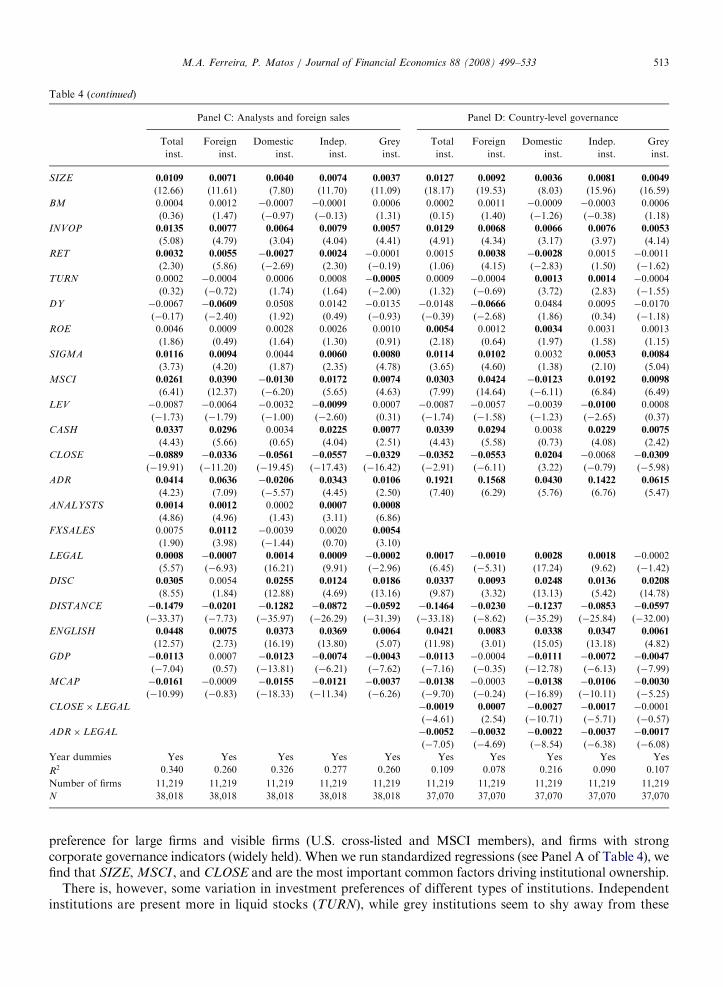
Panel C of Table 4 extends the results on institutional investor preferences in terms of the firm’s externalvisibility. We address the role of a firm’s visibility in more detail by adding as an explanatory variable thenumber of analysts covering a firm (ANALYSTS), a proxy for the level of information available to investors(Baker, Nofsinger, and Weaver, 2002), and the percentage of foreign sales (FXSALES), which is a proxy for‘‘name value’’ abroad. We find that the firm’s visibility serves to attract more foreign investment byinstitutions, but not domestic investment. Independent and grey institutions are both attracted by firmvisibility.
Panel D of Table 4 examines how sensitive institutional money managers are to country-level governance,particularly the quality of legal institutions and enforcement (LEGAL). The results indicate that allinstitutional investors pay special attention to firm-level characteristics (in particular, those related to firm-level governance such as ADR and CLOSE) when they decide to invest abroad in countries with weak investorprotection environments (i.e., countries with low scores for the variable). The interaction ADR� LEGAL
variable has a negative and significant coefficient, implying less of a preference by foreign institutions for U.S.cross-listing stocks if the firm is originally from a country with strong investor protection. The interactionCLOSE � LEGAL variable is negative and significant, so institutions seem to avoid more closely held firmswhen these firms are located in countries with weak legal environments.
4. Institutional ownership and firm performance
We want to investigate the relation between institutional ownership and firm performance for non-U.S.firms in order to understand the role institutional investors play in monitoring and influencing management
17The interpretation of the standardized regression coefficient is the expected standard deviation change in the dependent variable
(institutional ownership) given a one-standard deviation change in the independent variable.
ARTICLE IN PRESSM.A. Ferreira, P. Matos / Journal of Financial Economics 88 (2008) 499–533 515
decisions. Following Gompers, Ishii, and Metrick (2003) on the impact of corporate governance on firmperformance, we first test the effect of institutional ownership on firm valuation.18 The hypothesis is thatforeign and independent institutional ownership is associated with higher firm value, as these institutions playa monitoring role. Next we check whether foreign and independent institutional ownership also have aninfluence on firms’ operating performance and capital expenditures.
4.1. Impact on firm value
To investigate the relation between institutional ownership and firm value, we adopt Tobin’s Q as a measureof firm value, calculated as the book value of total assets plus the market value of equity minus the book valueof equity divided by total assets (Gompers, Ishii, and Metrick, 2003; Doidge, Karolyi, and Stulz, 2004).
We estimate regressions of a firm’s Tobin’s Q on variables associated with firm value such as SIZE,growth opportunities (INVOP), leverage (LEV), cash holdings (CASH), cross-listing (ADR), and medianTobin’s Q for the firm’s global industry following Doidge, Karolyi, and Stulz (2004). We also include country-level variables that are usually considered in the literature. Most important, we include the institutionalownership variables that are our focus, namely, total, foreign and domestic, and independent and greyinstitutional ownership.
It is well known that Tobin’s Q is an imperfect measure of firm value. Gompers, Ishii, and Metrick (2006)point out several problems with using ordinary least squares (OLS) pooled cross-sectional and time-seriesregressions. A first problem is that Q is estimated with error. To alleviate this problem, we follow Gompers, Ishii,and Metrick (2006) in using median regressions and two alternative transformations of Q: logðQÞ and �1=Q. Asecond problem is cross-sectional dependence across firms in a given year. We address this issue by usingstandard errors adjusted for clustering at the firm level. A third problem is that errors are correlated across timefor a given firm (time-series dependence). We address this issue by including year dummies in our panelregressions (Petersen, 2007). In robustness tests, we also run Fama-MacBeth cross-sectional regressions as analternative procedure. A final problem is the endogeneity of institutional holdings. This is particularly true in ourcontext, given that we have reported results on what drives institutional investor ownership (see Section 3). Wehandle the potential endogeneity issue that firm valuation and institutional ownership are jointly determined in asystem of simultaneous equations for ownership and firm’s valuation using three-stage least squares.
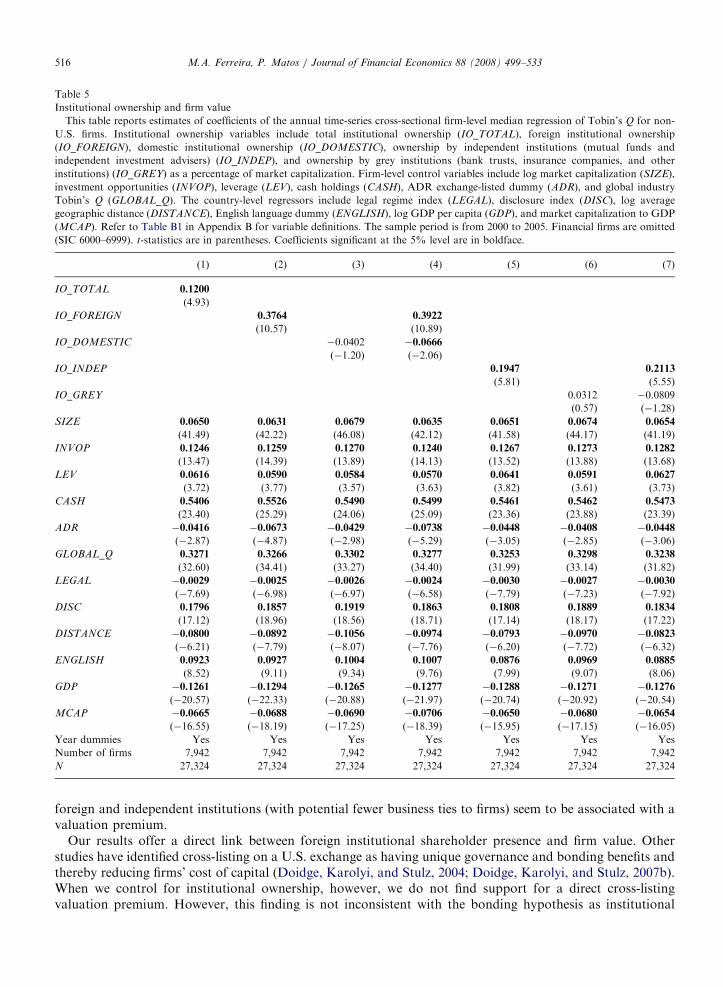
Table 5 presents the estimates of the median panel regressions for Tobin’s Q for the sample of non-U.S.firms located in countries with institutions domiciled locally.19 We find a positive and significantrelation between total institutional ownership and firm value in column (1). The IO_TOTAL coefficient ispositive and statistically significant. McConnell and Servaes (1990) also find a positive effect of institutionalequity ownership for U.S. firms. In columns (2)–(4) we disentangle the effects in terms of foreign and domesticinstitutional ownership. In column (2), we find that foreign institutions (IO_FOREIGN) have a positive andsignificant effect on firm value, but in column (3) there is no evidence that more domestic institutionalownership is associated with higher firm value. Column (4) includes both foreign and domestic institutionalownership as determinants of firm value, where we see that foreign institutional ownership remains positiveand significant. These results hint at the value-enhancing role of foreign investors for corporations worldwide.Next, in columns (5)–(7) we find that independent institutional ownership (IO_INDEP) is associated withhigher firm value, while grey institutional ownership is insignificantly related to firm value.
The magnitudes of the coefficients also indicate that the effects are economically significant. The coefficienton IO_FOREIGN in column (4) indicates that a ten-percentage point increase in institutional ownership isassociated with an increase in Q by 0.039 (roughly 3% of the average Tobin’s Q). The coefficient onIO_INDEP in column (7) indicates that a ten-percentage point increase in institutional ownership is associatedwith an increase in Q by 0.021 (roughly 2% of the average Tobin’s Q). Overall, our results suggest that only
18Related work includes Klapper and Love (2004) and Durnev and Kim (2005), who find a positive relation between governance and
valuation, and Gompers and Metrick (2001), who find a positive relation between stock returns and institutional ownership in the U.S.19We consider the sample of non-U.S. firms of only 27 countries with institutions domiciled locally in our data set because the
performance regressions include both domestic and foreign institutional ownership as explanatory variables. We want to make sure that
there is data coverage for domestic institutions. Results (not tabulated here) using the sample of all non-U.S. firms are consistent with the
finding that firms with higher foreign and independent ownership have higher firm valuation.
ARTICLE IN PRESS
Table 5
Institutional ownership and firm value
This table reports estimates of coefficients of the annual time-series cross-sectional firm-level median regression of Tobin’s Q for non-
U.S. firms. Institutional ownership variables include total institutional ownership (IO_TOTAL), foreign institutional ownership
(IO_FOREIGN), domestic institutional ownership (IO_DOMESTIC), ownership by independent institutions (mutual funds and
independent investment advisers) (IO_INDEP), and ownership by grey institutions (bank trusts, insurance companies, and other
institutions) (IO_GREY) as a percentage of market capitalization. Firm-level control variables include log market capitalization (SIZE),
investment opportunities (INVOP), leverage (LEV), cash holdings (CASH), ADR exchange-listed dummy (ADR), and global industry
Tobin’s Q (GLOBAL_Q). The country-level regressors include legal regime index (LEGAL), disclosure index (DISC), log average
geographic distance (DISTANCE), English language dummy (ENGLISH), log GDP per capita (GDP), and market capitalization to GDP
(MCAP). Refer to Table B1 in Appendix B for variable definitions. The sample period is from 2000 to 2005. Financial firms are omitted
(SIC 6000–6999). t-statistics are in parentheses. Coefficients significant at the 5% level are in boldface.
Number of firms 7,942 7,942 7,942 7,942 7,942 7,942 7,942
N 27,324 27,324 27,324 27,324 27,324 27,324 27,324
M.A. Ferreira, P. Matos / Journal of Financial Economics 88 (2008) 499–533516
foreign and independent institutions (with potential fewer business ties to firms) seem to be associated with avaluation premium.
Our results offer a direct link between foreign institutional shareholder presence and firm value. Otherstudies have identified cross-listing on a U.S. exchange as having unique governance and bonding benefits andthereby reducing firms’ cost of capital (Doidge, Karolyi, and Stulz, 2004; Doidge, Karolyi, and Stulz, 2007b).When we control for institutional ownership, however, we do not find support for a direct cross-listingvaluation premium. However, this finding is not inconsistent with the bonding hypothesis as institutional
ARTICLE IN PRESSM.A. Ferreira, P. Matos / Journal of Financial Economics 88 (2008) 499–533 517
ownership increases following cross-listing, especially by those institutions involved in monitoring such asforeign institutions (see Fig. 1). Institutional ownership may explain in part the premium and governancebenefits for non-U.S. firms that list on a U.S. exchange.20 Thus, we interpret this positive valuation effect as aform of reputational bonding (Coffee, 2002; Stulz, 1999) stemming from monitoring by highly reputableinstitutions, rather than the legal bonding associated with a U.S. cross-listing. Other control variablecoefficients are generally consistent with previous findings: large firms, cash-rich firms, firms with investmentopportunities, and more levered firms have higher valuations.
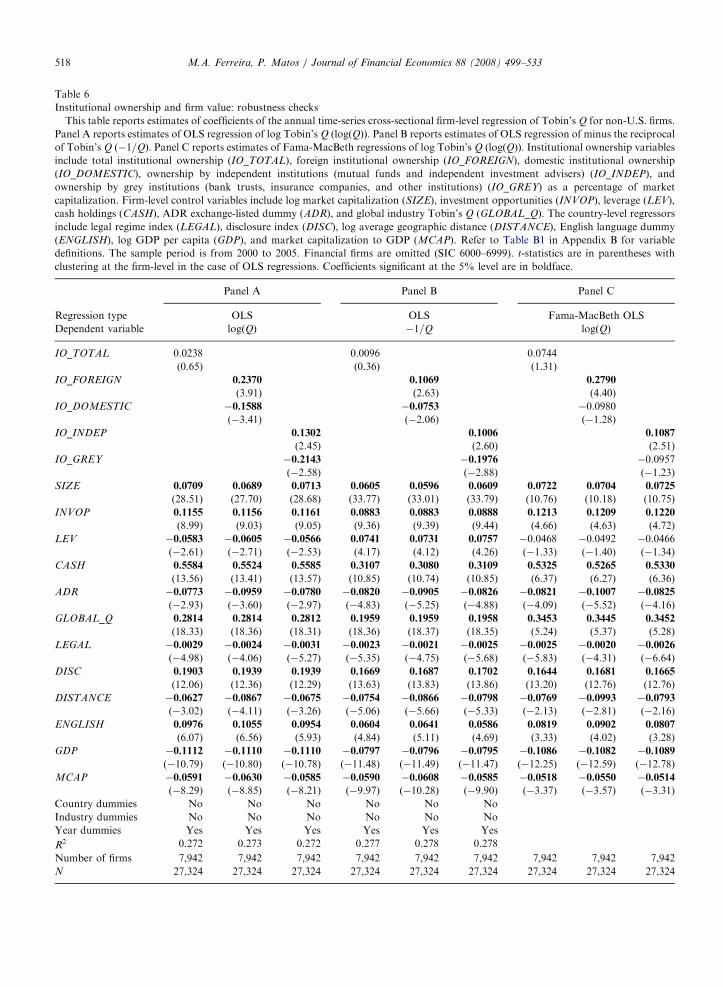
Table 6 presents several robustness checks of the relation between firm value and institutional ownership.Panels A and B use OLS regressions for logðQÞ and �1=Q to address the potential measurement error of Q.We also estimate standard errors adjusted for firm-level clustering to correct for the fact that errors areunlikely to be independent across time and include year dummies (Petersen, 2007). Panel C uses Fama-MacBeth cross-sectional OLS regressions (dependent variable is logðQÞ) to take into account the possibilitythat errors are not independent across firms.21 In each panel we include three specifications in terms ofinstitutional ownership variables: total; foreign and domestic; independent and grey.
The results in Panels A–C are consistent with our primary finding of a positive relation between firm valueand foreign and independent institutional ownership. In contrast to Table 5, however, we do not find apositive relation between total institutional ownership and firm value. The evidence points toward thepossibility that monitoring efforts come mainly from foreign and independent institutions, rather than allinstitutions. Indeed, the relation between firm value and domestic and grey institutional ownership is eitherinsignificant or negative.
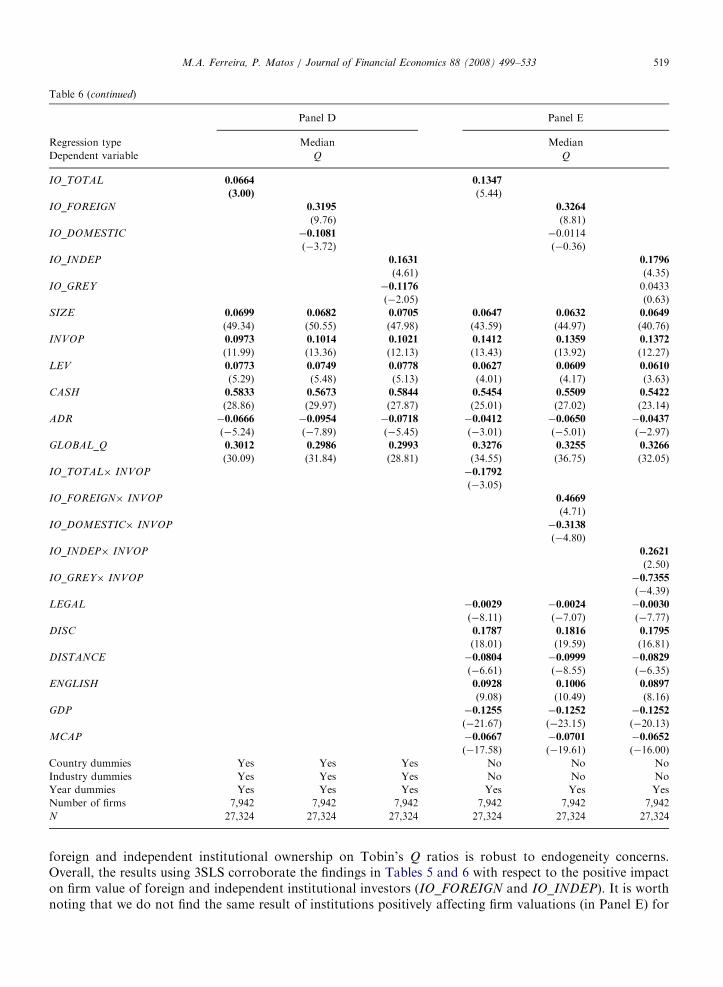
In Panel D we estimate median panel regressions of Tobin’s Q including industry and country dummies (inaddition to year dummies); there is no significant difference here from our primary findings. Finally, in PanelE of Table 6 we add interaction variables between institutional ownership and INVOP to examine whether theimpact on valuation of monitoring by institutions is conditional on the level of investment opportunitiesavailable to a firm (i.e., how a unit of sales growth impacts firm value). We find that, indeed, the coefficients onthe interaction variables of INVOP with IO_FOREIGN and IO_INDEP are positive and significant. This isconsistent with the idea that the monitoring effects of foreign and independent institutions are stronger infirms with strong investment opportunities. The coefficients on IO_FOREIGN and IO_INDEP remainpositive and significant.
One important concern is that institutional ownership is likely to be jointly determined with firm value anddriven by similar firm and country characteristics. Given our results on the determinants of institutionalinvestment (see Section 3), the issue is the direction of a causal relation between institutional ownership andfirm value. For example, do foreign institutions prompt governance improvements in firms, or do firms withbetter governance attract more foreign capital? Which way does the causality run?
To address this issue, we re-estimate the Tobin’s Q and institutional ownership regressions as a system ofsimultaneous equations.22 Identification is achieved by the independent variables included in the institutionalownership equation that are not related to Tobin’s Q, in particular, MSCI membership, dividend yield, andidiosyncratic volatility. For example, the inclusion of a stock in the MSCI index drives up foreign ownership,but it is not likely to directly affect firm value.23
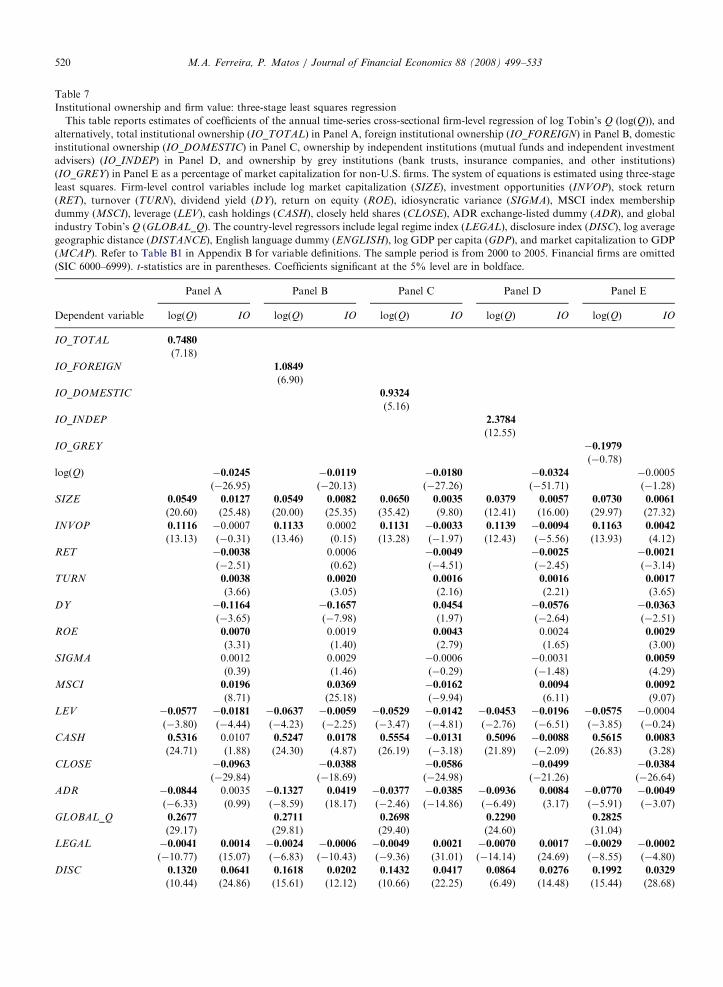
Table 7 reports the results of three-stage least squares (3SLS) regressions of a system of simultaneousequations for logðQÞ and each institutional ownership variable one at a time. We find that the positive effect of
20We find evidence of a positive cross-listing premium when we run valuation regressions similar to those in Doidge, Karolyi, and Stulz
(2007b), that is, without controlling for institutional ownership. Indeed, the point estimate of the cross-listing (exchange-listed) coefficient
implies a premium of roughly 12% in the 2000–2005 period. Recent papers argue that firm valuation benefits of internationalization are
transitory and dynamic (Gozzi, Levine, and Schmukler, 2006; Sarkissian and Schill, 2006), and occur mainly before a cross-listing. Their
internationalization events, however, include events other than U.S. exchange cross-listings such as over-the-counter ADRs and U.K.
listings.21We obtain similar results applying the Fama-MacBeth procedure for Tobin’s Q median regressions.22There are, of course, limitations to this analysis. Coles, Lemmon, and Meschke (2007) argue that a standard instrumental variables
approach to identify the impact of ownership on valuations does not perform well.23This empirical strategy is similar to the use of S&P 500 membership in U.S. studies (e.g., Clay, 2002). Index membership seems to drive
institutional demand but is not expected to increase firm value, with the exception perhaps for transitory valuation gains associated with
the added institutional ownership.
ARTICLE IN PRESS
Table 6
Institutional ownership and firm value: robustness checks
This table reports estimates of coefficients of the annual time-series cross-sectional firm-level regression of Tobin’s Q for non-U.S. firms.
Panel A reports estimates of OLS regression of log Tobin’s Q (logðQÞÞ. Panel B reports estimates of OLS regression of minus the reciprocal
of Tobin’s Q (�1=Q). Panel C reports estimates of Fama-MacBeth regressions of log Tobin’s Q (logðQÞÞ. Institutional ownership variables
include total institutional ownership (IO_TOTAL), foreign institutional ownership (IO_FOREIGN), domestic institutional ownership
(IO_DOMESTIC), ownership by independent institutions (mutual funds and independent investment advisers) (IO_INDEP), and
ownership by grey institutions (bank trusts, insurance companies, and other institutions) (IO_GREY) as a percentage of market
capitalization. Firm-level control variables include log market capitalization (SIZE), investment opportunities (INVOP), leverage (LEV),
cash holdings (CASH), ADR exchange-listed dummy (ADR), and global industry Tobin’s Q (GLOBAL_Q). The country-level regressors
include legal regime index (LEGAL), disclosure index (DISC), log average geographic distance (DISTANCE), English language dummy
(ENGLISH), log GDP per capita (GDP), and market capitalization to GDP (MCAP). Refer to Table B1 in Appendix B for variable
definitions. The sample period is from 2000 to 2005. Financial firms are omitted (SIC 6000–6999). t-statistics are in parentheses with
clustering at the firm-level in the case of OLS regressions. Coefficients significant at the 5% level are in boldface.
Number of firms 7,942 7,942 7,942 7,942 7,942 7,942
N 27,324 27,324 27,324 27,324 27,324 27,324
Table 6 (continued)
M.A. Ferreira, P. Matos / Journal of Financial Economics 88 (2008) 499–533 519
foreign and independent institutional ownership on Tobin’s Q ratios is robust to endogeneity concerns.Overall, the results using 3SLS corroborate the findings in Tables 5 and 6 with respect to the positive impacton firm value of foreign and independent institutional investors (IO_FOREIGN and IO_INDEP). It is worthnoting that we do not find the same result of institutions positively affecting firm valuations (in Panel E) for
ARTICLE IN PRESS
Table 7
Institutional ownership and firm value: three-stage least squares regression
This table reports estimates of coefficients of the annual time-series cross-sectional firm-level regression of log Tobin’s Q (logðQÞÞ; andalternatively, total institutional ownership (IO_TOTAL) in Panel A, foreign institutional ownership (IO_FOREIGN) in Panel B, domestic
institutional ownership (IO_DOMESTIC) in Panel C, ownership by independent institutions (mutual funds and independent investment
advisers) (IO_INDEP) in Panel D, and ownership by grey institutions (bank trusts, insurance companies, and other institutions)
(IO_GREY) in Panel E as a percentage of market capitalization for non-U.S. firms. The system of equations is estimated using three-stage
least squares. Firm-level control variables include log market capitalization (SIZE), investment opportunities (INVOP), stock return
(RET), turnover (TURN), dividend yield (DY), return on equity (ROE), idiosyncratic variance (SIGMA), MSCI index membership
dummy (MSCI), leverage (LEV), cash holdings (CASH), closely held shares (CLOSE), ADR exchange-listed dummy (ADR), and global
industry Tobin’s Q (GLOBAL_Q). The country-level regressors include legal regime index (LEGAL), disclosure index (DISC), log average
geographic distance (DISTANCE), English language dummy (ENGLISH), log GDP per capita (GDP), and market capitalization to GDP
(MCAP). Refer to Table B1 in Appendix B for variable definitions. The sample period is from 2000 to 2005. Financial firms are omitted
(SIC 6000–6999). t-statistics are in parentheses. Coefficients significant at the 5% level are in boldface.
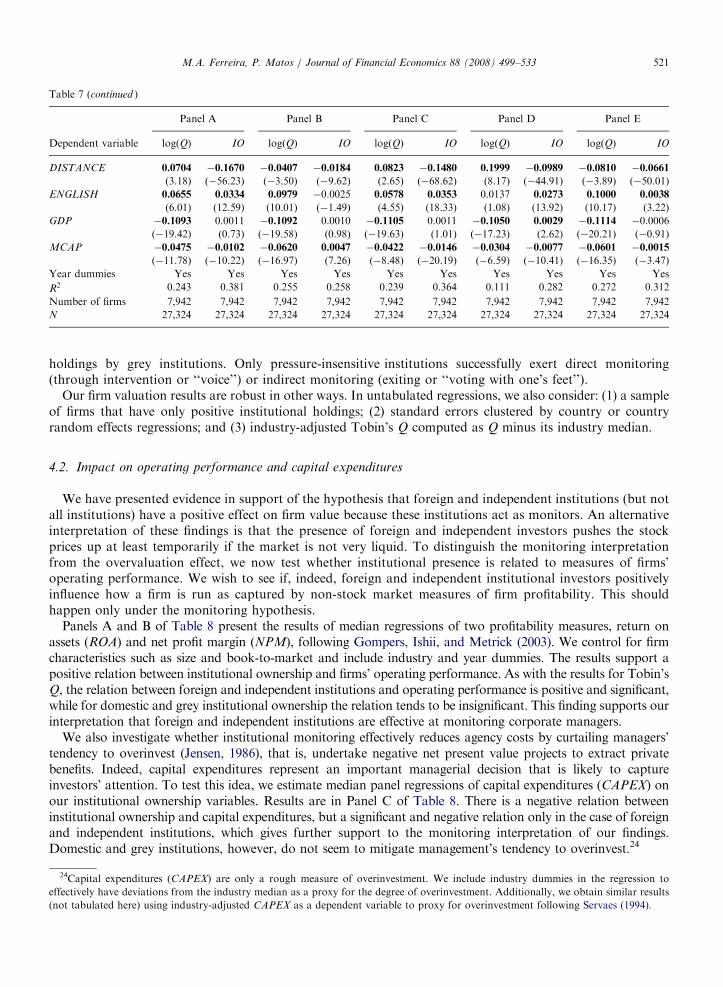
M.A. Ferreira, P. Matos / Journal of Financial Economics 88 (2008) 499–533 521
holdings by grey institutions. Only pressure-insensitive institutions successfully exert direct monitoring(through intervention or ‘‘voice’’) or indirect monitoring (exiting or ‘‘voting with one’s feet’’).
Our firm valuation results are robust in other ways. In untabulated regressions, we also consider: (1) a sampleof firms that have only positive institutional holdings; (2) standard errors clustered by country or countryrandom effects regressions; and (3) industry-adjusted Tobin’s Q computed as Q minus its industry median.
4.2. Impact on operating performance and capital expenditures
We have presented evidence in support of the hypothesis that foreign and independent institutions (but notall institutions) have a positive effect on firm value because these institutions act as monitors. An alternativeinterpretation of these findings is that the presence of foreign and independent investors pushes the stockprices up at least temporarily if the market is not very liquid. To distinguish the monitoring interpretationfrom the overvaluation effect, we now test whether institutional presence is related to measures of firms’operating performance. We wish to see if, indeed, foreign and independent institutional investors positivelyinfluence how a firm is run as captured by non-stock market measures of firm profitability. This shouldhappen only under the monitoring hypothesis.
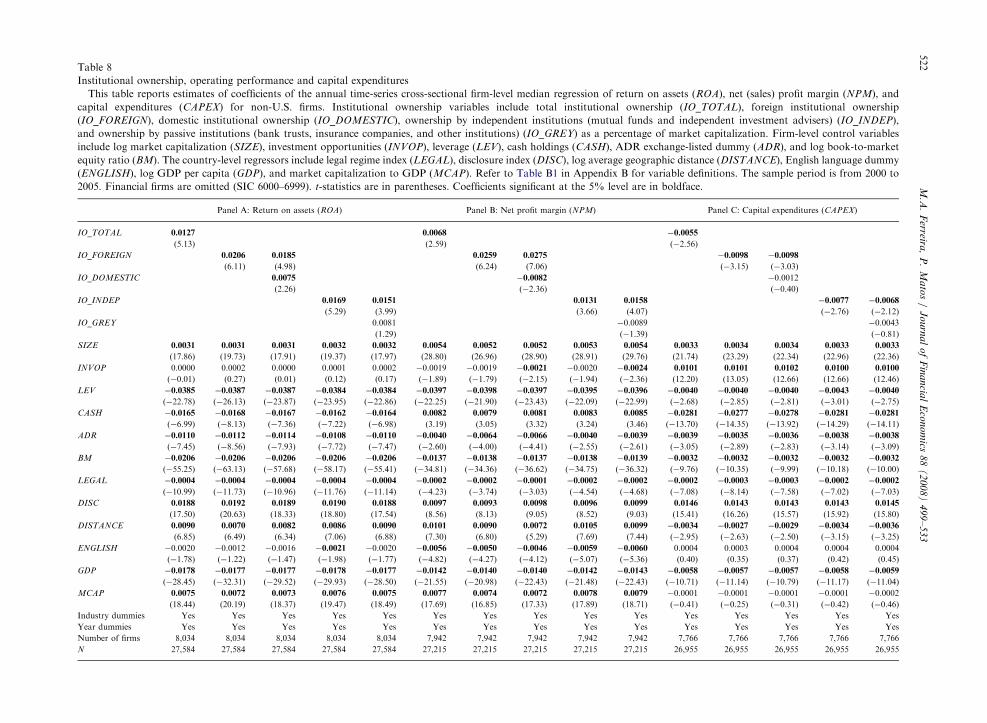
Panels A and B of Table 8 present the results of median regressions of two profitability measures, return onassets (ROA) and net profit margin (NPM), following Gompers, Ishii, and Metrick (2003). We control for firmcharacteristics such as size and book-to-market and include industry and year dummies. The results support apositive relation between institutional ownership and firms’ operating performance. As with the results for Tobin’sQ, the relation between foreign and independent institutions and operating performance is positive and significant,while for domestic and grey institutional ownership the relation tends to be insignificant. This finding supports ourinterpretation that foreign and independent institutions are effective at monitoring corporate managers.
We also investigate whether institutional monitoring effectively reduces agency costs by curtailing managers’tendency to overinvest (Jensen, 1986), that is, undertake negative net present value projects to extract privatebenefits. Indeed, capital expenditures represent an important managerial decision that is likely to captureinvestors’ attention. To test this idea, we estimate median panel regressions of capital expenditures (CAPEX) onour institutional ownership variables. Results are in Panel C of Table 8. There is a negative relation betweeninstitutional ownership and capital expenditures, but a significant and negative relation only in the case of foreignand independent institutions, which gives further support to the monitoring interpretation of our findings.Domestic and grey institutions, however, do not seem to mitigate management’s tendency to overinvest.24
24Capital expenditures (CAPEX) are only a rough measure of overinvestment. We include industry dummies in the regression to
effectively have deviations from the industry median as a proxy for the degree of overinvestment. Additionally, we obtain similar results
(not tabulated here) using industry-adjusted CAPEX as a dependent variable to proxy for overinvestment following Servaes (1994).
ARTIC
LEIN
PRES
STable 8
Institutional ownership, operating performance and capital expenditures
This table reports estimates of coefficients of the annual time-series cross-sectional firm-level median regression of return on assets (ROA), net (sales) profit margin (NPM), and
capital expenditures (CAPEX) for non-U.S. firms. Institutional ownership variables include total institutional ownership (IO_TOTAL), foreign institutional ownership
(IO_FOREIGN), domestic institutional ownership (IO_DOMESTIC), ownership by independent institutions (mutual funds and independent investment advisers) (IO_INDEP),
and ownership by passive institutions (bank trusts, insurance companies, and other institutions) (IO_GREY) as a percentage of market capitalization. Firm-level control variables
include log market capitalization (SIZE), investment opportunities (INVOP), leverage (LEV), cash holdings (CASH), ADR exchange-listed dummy (ADR), and log book-to-market
equity ratio (BM). The country-level regressors include legal regime index (LEGAL), disclosure index (DISC), log average geographic distance (DISTANCE), English language dummy
(ENGLISH), log GDP per capita (GDP), and market capitalization to GDP (MCAP). Refer to Table B1 in Appendix B for variable definitions. The sample period is from 2000 to
2005. Financial firms are omitted (SIC 6000–6999). t-statistics are in parentheses. Coefficients significant at the 5% level are in boldface.
Panel A: Return on assets (ROA) Panel B: Net profit margin (NPM) Panel C: Capital expenditures (CAPEX)
ARTICLE IN PRESSM.A. Ferreira, P. Matos / Journal of Financial Economics 88 (2008) 499–533 523
The magnitudes of the coefficients indicate that the effects on operating performance are economicallysignificant. The coefficients on IO_FOREIGN and IO_INDEP indicate that a ten-percentage point increase ininstitutional ownership is associated with an increase in ROA of roughly 8% relative to the sample mean. Theeffect on capital expenditures is also economically significant as a ten-percentage point increase inIO_FOREIGN or IO_INDEP is associated with a decrease in CAPEX of roughly 2% relative to the samplemean.
Overall, we find that the presence of foreign and independent institutions as shareholders has a positiveimpact on firm value and operating performance. Through their monitoring efforts, these groups ofinstitutions seem able to reduce any tendency toward overinvestment. The same cannot be said for domesticand grey institutions; they do not have the same impact on firm performance and investment policy. Thus, weare confident that our results are not spurious and we can conclude that institutions with fewer business ties tofirms are a powerful force in monitoring corporations around the world.
5. Conclusion
We use a comprehensive database of equity holdings over the 2000–2005 period to investigate the role ofinstitutional investors around the world. Focusing on non-U.S. firms, we document that institutions arebecoming prominent shareholders in companies worldwide. Investments by foreign institutions exceed thoseof domestic institutions in some markets. Foreign capital is not of a single color, in that U.S. and non-U.S.foreign institutions control comparable pools of capital.
We offer a global view of what attracts international institutions to invest in corporations aroundthe world. We find that all institutional investors seek large firms and firms with strong governanceindicators, but foreigners overweight firms in the MSCI index and firms cross-listed on a U.S. exchange.Some country-level factors are relevant (e.g., all investors prefer countries with strict disclosure standards),but a significant part of the cross-sectional variation in institutional holdings is explained by firm-levelcharacteristics. This suggests that institutional money actively selects which firms to invest in, beyondjust following country-level allocations. These findings support a substitution role, rather than acomplementary role, for firm-level and country-level mechanisms, at least in institutional investors’ portfoliodecisions. This gives additional insights into research showing that firm-level governance levels are in largepart driven by country characteristics (Stulz, 2005; Doidge, Karolyi, and Stulz, 2007a). Our findings suggestthat investors do track firm-level governance indicators, and there is some hope for a ‘‘good firm’’ in a ‘‘bad’’country.
Our findings suggest that some (but not all) institution groups are effective monitors of the firmsthey invest in. The presence of foreign and independent institutions enhances shareholder value.These institutions are able to exert pressure because they have fewer business relations with thefirm to jeopardize, unlike domestic or grey institutions. Our tests show that firms held by foreign andindependent institutions have higher valuations; there is no similar evidence for ownership by domesticand grey institutions. We also document that foreign and independent institutions are associatedwith better operating performance and reduced capital expenditures. These results are robust in severalways, including the potential endogeneity of institutional ownership. This positive performance effect isindicative of a form of reputational bonding that stems from firms associating with large and independentinstitutional investors.
As foreign and independent institutional investors are increasingly playing an important governance role incorporations around the world, we believe it is worth exploring in more depth the particular ways in whichthey exert their influence. In this paper we examine outcomes (Tobin’s Q, return on assets, net profit margin,capital expenditures) rather than direct corporate choices (research and development expenditures,mergers and acquisitions decisions, CEO turnover and compensation). Institutional shareholders can pushfor change by directly voicing their interests to corporate management, or indirectly, by influencing managers’actions by exiting (the ‘‘Wall Street walk’’). It would be interesting to look at the impact institutional investorshave on changes in corporate governance practices in firms around the world as well as their role in specificcorporate events.
ARTIC
LEIN
PRES
SAppendix A. FactSet/LionShares institutional ownership database
Table A1
Institutional stock holdings by country
This table reports the market value of stock holdings (in millions of US$) and number of institutions for each of the origin institution countries from 2000 to 2005 (end-of-year
values). The column ‘‘Top Five Institutions’’ lists the five largest institutional managers by equity assets (in billions of US$) in December 2005.
2000 2001 2002 2003 2004 2005 Top five institutions
United States Total equity assets 10,078,671 9,398,468 7,811,576 10,697,788 12,190,591 13,654,134 1: Barclays Global Investors NA (CA)—$674.9 bln
(US) Nr of institutions 2,162 2,359 2,498 2,705 2,972 3,233 2: Capital Research and Management Co.—$661.6 bln
(PL) Nr of institutions — — — 14 15 16 2: BZ WBK AIB TFI—$1.0 bln
3: ING TFI—$0.6 bln
4: Credit Suisse Asset Management Polska—$0.3 bln
5: BPH TFI—$0.3 bln
Greece Total equity assets — — 326 1,069 2,355 2,353 1: EFG Eurobank Mutual Fund Management—$1 bln
(GR) Nr of institutions — — 16 18 22 22 2: Hellenic Investment Co. SA—$0.5 bln
3:Diethniki Mutual Fund Management Co—$0.2 bln
4: Alpha Asset Management—$0.1 bln
5: Proton Asset Management SA—$0.1bln
Other Total equity assets 47,119 41,870 38,160 56,729 86,539 108,139 1: Templeton Global Advisors—$66.3 bln
Nr of institutions 22 27 40 81 112 128 2: Orbis Investment Management—$10.9 bln
3: The Northern Cross Investments—$10.6 bln
4: Tewksbury Capital Management—$3.5 bln
5: Old Mutual Asset Managers (Bermuda)—$1.6 bln
All Total equity assets 11,287,933 11,103,080 9,598,030 13,350,523 15,780,681 18,044,918
Nr of institutions 2,693 3,412 3,887 4,416 4,950 5,337
M.A
.F
erreira,
P.
Ma
tos
/J
ou
rna
lo
fF
ina
ncia
lE
con
om
ics8
8(
20
08
)4
99
–5
33
527
ARTIC
LEIN
PRES
S
Table A2
Cross-country institutional stock holdings
This table reports the distribution of the market value of stock holdings (in billions of US$) by origin institution countries (rows) and destination stock market countries (columns) in
December 2005. Refer to Table A1 for country names.
Institution Destination stock market country
country US UK FR CA DE SE JP NL CH IT NO IE BE DK HK ES SG FI LU ZA AU IN AT PT LI PL GR Other Total
Panel A reports total institutional ownership, foreign institutional ownership by all institutions, U.S. institutions and non-U.S. institutions, domestic institutional ownership,
ownership by independent institutions (mutual funds and independent investment advisers), and ownership by grey institutions (bank trusts, insurance companies, and other
institutions) as a percentage of destination country stock market capitalization in December 2005. Panel B reports total institutional ownership, foreign institutional ownership by all
institutions, U.S. institutions and non-U.S. institutions, domestic institutional ownership, ownership by independent institutions (mutual funds and investment advisers), and
ownership by grey institutions (bank trusts, insurance companies, and other institutions) as a percentage of destination country stock market float (i.e., market value of stock that is not
closely held and is investable by outside shareholders) in December 2005. Panel C reports the market weight (proportion that the country’s stock market capitalization represents of the
total market capitalization), domestic holdings (fraction that domestic institutional holdings represent of total institutional holdings), and domestic bias by origin institution country in
December 2005. Domestic bias is calculated as the logarithm of the ratio of the domestic holdings by the market weight.
Panel A: Institutional ownership as % of market capitalization
Market Total Foreign Foreign Foreign Domestic Indep. Mutual Invest. Grey Bank Insur. Other