Page 1
The combined use of order tracking techniques for
enhanced Fourier analysis of order components
K. S. Wang and P. S. Heyns
Dynamic Systems Group, Department of Mechanical and Aeronautical Engineering,
University of Pretoria, Pretoria, 0002, South Africa
Corresponding author: KeSheng Wang (Tel:(+27)12 4203724; Fax:(+27)12
3625087 Email:[email protected] )
Abstract
Order tracking is one of the most important vibration analysis techniques for
diagnosing faults in rotating machinery. It can be performed in many different ways,
each of these with distinct advantages and disadvantages. However, in the end the
analyst will often use Fourier analysis to transform the data from a time series to
frequency or order spectra. It is therefore surprising that the study of the Fourier
analysis of order-tracked systems seems to have been largely ignored in the literature.
This paper considers the frequently used Vold-Kalman filter-based order tracking and
computed order tracking techniques. The main pros and cons of each technique for
Fourier analysis are discussed and the sequential use of Vold-Kalman filtering and
computed order tracking is proposed as a novel idea to enhance the results of Fourier
analysis for determining the order components. The advantages of the combined use
of these order tracking techniques are demonstrated numerically on an SDOF rotor
simulation model. Finally, the approach is also demonstrated on experimental data
from a real rotating machine.
Keywords: Computed order tracking (COT), Fourier analysis, Order tracking
(OT), Rotating machinery, Vold-Kalman filtering and computed order tracking
(VKC –OT), Vold-Kalman filter-based order tracking (VKF-OT).
1. Introduction
Order tracking (OT) is one of the most important vibration analysis techniques for
diagnosing faults in rotating machinery. The main advantage of OT over other
vibration analysis techniques lies in the analysis of non-stationary noise and vibration,
which vary in frequency with the rotation of a reference shaft or shafts. Order domain
analysis relates the vibration signal to the rotating speed of the shaft, instead of to an
absolute frequency base. In this way, the vibration components that are proportional to
multiples of the running speed can easily be identified. OT can be performed in many
different ways, each of these with distinct advantages and disadvantages.
Page 2
Among the OT techniques, two approaches are frequently employed. The first is angle
domain sampling-based order tracking (AD-OT) or computed order tracking (COT).
Various papers discussing the theory and implementation of this approach are available
(see for example the work by Fyfe and Munk [1]). The significance of AD-OT or COT
is that the re-sampled data have the same properties as stationary frequency data, but the
data still need to be processed further by Fourier analysis in terms of uniform angular
intervals, instead of uniform time intervals. The re-sampling process is performed,
however, subject to artificial assumptions for re-sampling the data, therefore
unavoidable errors are introduced. Although COT has some limitations due to the
re-sampling and the Fourier analysis process, it remains a very useful tool for analyzing
rotating machinery signals in industry, as has indeed been demonstrated by authors such
as Eggers et al. [2].
Another approach is what is called waveform reconstruction OT, a typical example of
which is Vold-Kalman filter-based order tracking (VKF-OT). This approach to OT can
overcome many of the limitations of other OT techniques, such as allowing the
high-performance tracking of harmonic responses or orders, and allowing the
beat-free extraction of close and crossing orders. Compared to COT, therefore, it
captures much shorter transients with no phase bias or slew rate limitations [3]. One
of the major differences of this approach compared to the others is that the time signal
corresponding to a specific order can be extracted from the raw data, with its amplitude
and phase. This comparatively new order tracking technique has been studied over
the past ten years [4, 5, and 6]. The characteristics of Vold-Kalman filters were also
considered by Herlufsen et al. [7]. Recently, Tůma [5] dealt with the often-neglected
issue of setting the filter pass band, which is fundamental to the theory of the
MATLAB-based Vibratools scripts [8]. This made the application of VKF-OT more
readily accessible to engineers.
Subsequent to the OT itself, Fourier analysis is generally used to transform
re-sampled data (i.e. COT) or time series (i.e. VKF-OT) into the order or frequency
domains. But the study of Fourier analysis in the context of OT seems to have been
ignored in the literature. In fact, meaningful Fourier analysis is relies heavily on the
nature of the data to be analyzed. Howell [9] deals comprehensively with the
mathematics of Fourier analysis. Most of these theories are derived from the
assumptions of continuity, smoothness and periodicity or stationarity. It follows that
Fourier analysis is only valid under strict assumptions which, when violated, lead to
results that make little physical sense. However, real machine vibration data may not
be ideally suited to Fourier analysis. Since real machinery may not behave linearly
or may be operating in a noisy environment, the data obtained from these systems
may be distorted harmonic waves, or be contaminated with excessive noise, etc.
Besides, the machinery may be operating in a non-stationary way (i.e. fluctuating
rotating speeds in rotating machinery) and then the measured vibration data will not
be periodic or stationary. As a result, the final Fourier analysis figures may appear to
be messy. A technique to obtain clear order spectra via Fourier analysis for
Page 3
non-stationary and noisy real machinery systems is consequently of great practical
importance for the diagnostic process.
A novel approach which combines the use of two different order tracking techniques
is presented to deal with this problem. Combining VKF-OT and COT actually
exploits the advantages of both order tracking techniques while overcoming their
limitations. A simple single-degree-of-freedom rotor system model is then employed
to demonstrate the advantages of the proposed technique in simulated environments.
Finally, an experimental study is presented, demonstrating the advantages of the
proposed technique on an actual rotating machine.
2. Exploring the two-order-tracking approaches
Combining the use of the two OT approaches to improve the subsequent Fourier
analysis requires an understanding of the nature of these techniques and how their
characteristics affect the Fourier analysis.
2.1 Vold-Kalman filter-based order tracking
Herlufsen et al. [7] describe order tracking as the art and science of extracting the
sinusoidal content of measurements, with the sinusoidal content or orders/harmonics
at frequencies that are multiples of the fundamental rotational frequency. To this end,
VKF-OT relies on two equations to complete the filtering, namely the data equation
and the structural equation. These equations define local constraints, which ensure
that the unknown phase assigned orders are smooth and that the sum of the orders
should approximate the total measured signal. Tůma [5] mathematically described
data and structural equations to investigate the often neglected issue of setting the
pass bandwidth in Vold-Kalman filter order tracking. In-depth consideration of the
two equations reveals fundamental characteristics of filtered orders from a
Vold-Kalman filter. Firstly, the order signal contained in the data equation is the
convolution of a complex envelope and a sinusoidally natured complex carrier wave
in which rotational frequency is used to determine the complex carrier wave. Due to
the possible non-stationary character of rotational speed in rotating machines, the
resultant complex carrier wave could be non-stationary and therefore the filtered
order will retain its non-stationary nature. Secondly, the structural equation enforces
successive digital points of filtered order signal by fitting a low order polynomial. A
low order polynomial enforcement to signal sequence is a sufficient condition for
smoothness of filtered order [7]. By considering the data and structural equations,
one may conclude that the order components extracted from the Vold-Kalman filter
are smooth and harmonic waves, but they may be non-stationary.
2.2 Computed order tracking
Computed order tracking is a very commonly performed and effective order tracking
Page 4
technique. Although inevitable errors will be introduced during the re-sampling
process and its artificial assumptions [1], the technique still renders very useful results,
and effectively transforms non-stationary time domain data to stationary angular
domain data for rotating machinery. Blough [10] uses a graphic representation to
explain this transformation process on a simple sine wave. It is clearly demonstrated
that the re-sampled data has the same properties as a stationary frequency sine wave
sampled at uniform time intervals. This uniformly spaced re-sampled data or
stationary re-sampled data can be effectively processed by using the Fourier transform
to obtain clear estimates of the orders of interest. This implies a clearer analysis of the
signal using the Fourier transform and also indicates that the re-sampling process can
be applied to harmonic waves and is not confined to data on rotating machinery
vibration. However, COT does not address the quality of the raw data. Imperfections,
such as distorted harmonic waves and noise, continue to exist. Besides, COT can only
deal with the raw data as a whole and therefore loses the ability to separate each
different order from the raw signal.
In paragraph 2.1 it is argued that the Vold-Kalman filter enforces the smoothness as
well as the harmonic nature of the filtered data. The harmonic nature does not,
however, ensure a stationary harmonic wave, although the re-sampling process can
transform data from a non-stationary harmonic wave to a stationary harmonic wave in
frequency. This suggests the possibility of using a Vold-Kalman filter to obtain
smooth but possibly varying frequency harmonic waves and then transforming them
to become stationary in frequency by using the re-sampling process of computed
order tracking.
2.3 Combined use of Vold-Kalman filtering and computed order tracking
(VKC-OT)
The main ideas from paragraphs 2.1 and 2.2 may be summarized as follows:
Order components from the Vold-Kalman filter are clearly harmonic in nature
and smooth waves.
Order components may be harmonic waves of varying frequency due to the
possible of varying rotational speed.
It can be seen from paragraph 2.2 that the re-sampling process can transform
varying frequency harmonic waves to stationary frequency harmonic waves. A
Fourier analysis is then used to transform the re-sampled time domain data to the
order domain.
Therefore, if data are obtained from a non-stationary and noisy real machinery
system and the data are then processed through a Vold-Kalman filter to extract
order/orders of interest, and the filtered order signals are subsequently used as an
input to COT, one obtains order waves that are smooth, stationary frequency
harmonic waves. Under these conditions the stringent requirements of Fourier
Page 5
analysis are largely satisfied. One may therefore expect clean and clear order spectra
by means of this process. Based upon the above reasoning it follows that if the two
order tracking methods are applied in sequence (VKF-OT and then COT), the
restrictions of Fourier analysis can be largely satisfied to render clean order spectra.
This combined use of order tracking techniques may be referred to as Vold-Kalman
filter and computed order tracking (VKC-OT). Figure 1 describes graphically the
advantages of the combined use of the two order tracking techniques in sequence.
Figure 1 Advantages of VKC-OT
3. Simulation study
3.1 Simulation of a single degree-of-freedom (SDOF) rotor model response
The following simulation studies illustrate the use of the VKC-OT approach. Since
order tracking is primarily used for vibration signals from rotating machines, the first
example considers a very simple SDOF rotor system. Here the lateral response of a
symmetric rotor is modelled as two uncoupled SDOF systems (see Figure 2).
VKF-OT
COT
Smooth, stationary frequency harmonic
waves and therefore clean and clear
order spectrum via Fourier analysis.
Possible raw data characteristics:
1. Imperfections, e.g. noise
contaminated and distorted harmonic
waves, etc.
2. Varying in frequency
Page 6
y
x
urm
c
k
c
k
c
k
c
k
u
Figure 2 Rotor model
It is assumed that a rotor of mass m is mounted on bearings of total stiffness k and
damping coefficient c, in both the x and y directions. The rotor rotates at an
increasing speed. The external excitation forces comprise two harmonic components
with quadratically increasing frequency (in each direction). The system response
with and without random noise scenarios are studied. Detailed characteristics are
shown in Table 1.
Table 1 Characteristics of the SDOF rotor model
Parameter Value
Rotor mass m 20 kg
Damping coefficient c 100 Ns/m
Stiffness k 500 000 N/m
Eccentricity ur 0.1 m
Unbalance mass um 0.05 kg
Page 7
Initial time 0t 0 s
Final time ft 5 s
Time steps 4096
Number of revolutions 100
Number of resampling
samples
100
Angular speed 20796.15 t
Scenario 1 Excitation: )6sin()3sin( 22 trmtrmF uuuu .
Scenario 2 Excitation: )6sin()3sin( 22 trmtrmF uuuu
Final System response = system response to F +Noise
Noise: )1,4096(100 randn
(normally distributed random noise with mean zero
and standard deviation one).
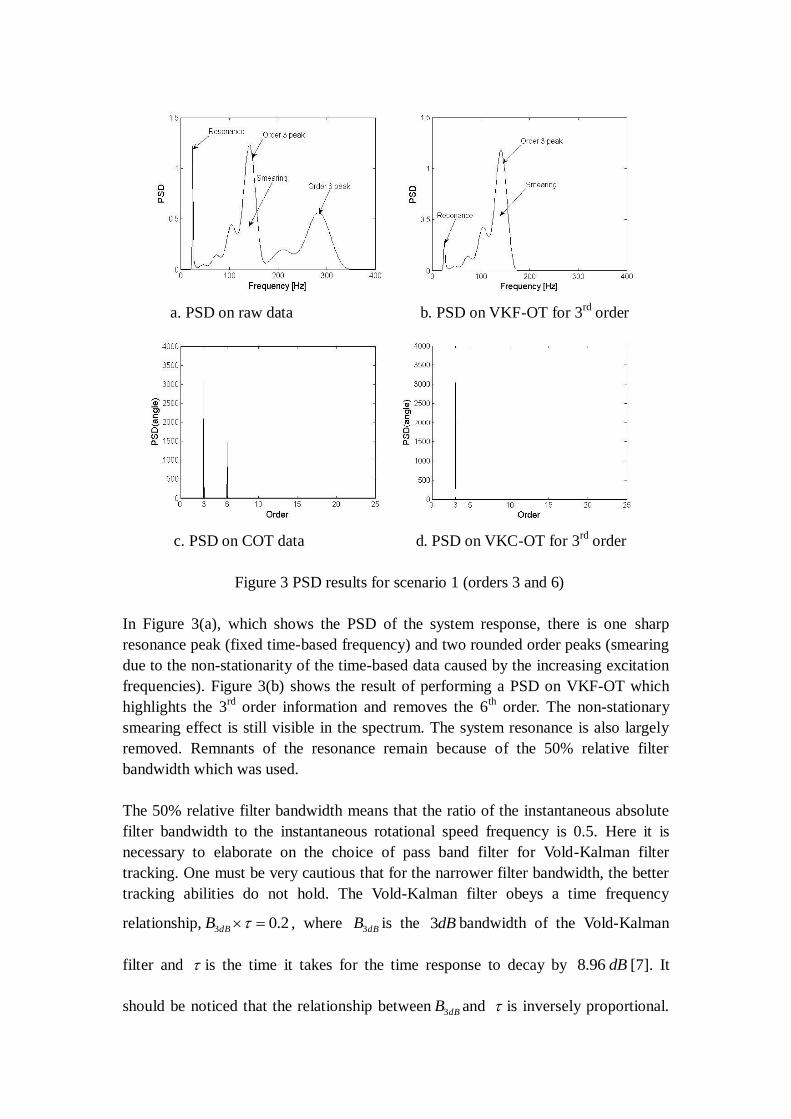
Firstly, scenario 1 (orders 3 and 6 only – see Table 1) is considered and the Power
Spectral Density (PSD) results of different techniques are presented in Figure 3.
Page 8
a. PSD on raw data b. PSD on VKF-OT for 3rd
order
c. PSD on COT data d. PSD on VKC-OT for 3rd
order
Figure 3 PSD results for scenario 1 (orders 3 and 6)
In Figure 3(a), which shows the PSD of the system response, there is one sharp
resonance peak (fixed time-based frequency) and two rounded order peaks (smearing
due to the non-stationarity of the time-based data caused by the increasing excitation
frequencies). Figure 3(b) shows the result of performing a PSD on VKF-OT which
highlights the 3rd
order information and removes the 6th order. The non-stationary
smearing effect is still visible in the spectrum. The system resonance is also largely
removed. Remnants of the resonance remain because of the 50% relative filter
bandwidth which was used.
The 50% relative filter bandwidth means that the ratio of the instantaneous absolute
filter bandwidth to the instantaneous rotational speed frequency is 0.5. Here it is
necessary to elaborate on the choice of pass band filter for Vold-Kalman filter
tracking. One must be very cautious that for the narrower filter bandwidth, the better
tracking abilities do not hold. The Vold-Kalman filter obeys a time frequency
relationship, 2.03 dBB , where dBB3 is the dB3 bandwidth of the Vold-Kalman
filter and is the time it takes for the time response to decay by dB96.8 [7]. It
should be noticed that the relationship between dBB3 and is inversely proportional.
Page 9
Therefore, a narrower filter pass band will result in a longer time response to track
the changes of signals. As a result, the narrow pass band reduces the permissible rate
of change in rotational speed. The choice of filter bandwidth needs to be done very
carefully. For example analysis the reader may refer to [11] and for details on the
choice of the filter bandwidth, the reader may refer to [7].
Figure 3(c) displays the result of COT, namely that there are two clear peaks in the
order spectrum at the 3rd
and 6th
orders respectively. This is because the data are
being generated for an ideal linear system with sinusoidal external excitation, and
because the re-sampling process of COT rearranges the data to become stationary.
The data therefore represent stationary harmonic waves which are ideal for Fourier
analysis.
It should be noted that the numerical values of the PSDs in Figure 3(a and b) and 3(c
and d) differ significantly. Again, here it should be emphasized that the input signal
to COT analysis is the filtered order signal from VKF-OT. Since the simulated
responses were calculated at 4096 points in time using the model, the filtered 3rd
order also contains 4096 time points. The given rotor rotates 100 revolutions within
5s and each revolution is evenly sampled with 100 angular intervals, therefore the
resultant samples for COT analysis becomes 10000 instead of 4096. Besides, in
Figure 3(a and b) the PSD describes how the energy associated with the time domain
series is distributed with frequency. The unit is Hzsm /)/( 22 . Figure 3(c and d)
however describes how the energy of an angular domain series is distributed with
order. Fundamentally the energy associated with a particular order is distributed over
a wide range of frequencies on the time domain-based PSD, owing to the
non-stationary nature of the rotating speed. However, on an angle domain based PSD
the energy associated with a specific order is reflected at only one order value. The
unit is ordersm /)/( 22 . It is actually a sum of the distributed energies in a frequency
domain for a specific order. So as not to confuse readers, the units of PSD are not
marked in all figures. However, the acronym PSD is marked on the figures of time
domain-based Power Spectra Density, whereas the figures of angle domain based
PSD are marked with PSD (angle).
It can be seen that Figure 3(c) present clear peaks, but it should still be borne in mind
that the re-sampling process of the angle domain-based method changes the number
of samples of raw data (in this case 100 samples per revolution were used to
resample the data). In this case, the re-sampling is performed under the assumption
of zero rotational acceleration within each revolution, in this way re-sampling the
signals in each revolution at equal intervals. Note that the value of the samples per
revolution is a parameter that the analyzer may choose arbitrarily. As a result, it may
render a different number of re-sampled samples as well as a variation in the value of
the re-sampled amplitude and may as such also influence the final result in numerical
Page 10
values. Therefore, the process should be kept consistent in the re-sampling samples
in all applications of the technique once it has been chosen. What is most important,
however, is the angle domain based PSD(angle) cleans up the smearing spectrum
from frequency domain into order domain and it features distinct and clear amplitude
orders.
Besides, it should also be observed that the system resonance can hardly be
recognized in Figure 3(c). This is because the re-sampling occurs in the angular
domain, which means the sampling interval changes to a constant angle rather than a
constant time interval, and the Fourier analysis actually captures only periodic
signals with respect to angle instead of time (as is the case for resonance). Thus COT
de-emphasizes the system resonance after the re-sampling.
If the VKC-OT procedure suggested in paragraph 2.3 is applied, however, Figure 3(d)
is obtained. This figure shows a single clear 3rd
order peak in the spectrum, and
illustrates the advantage of the combined use of VKF-OT and COT to obtain
diagnostic information about a system. Although Figure 3(c) and (d) both clearly
indicate the system information, Figure 3(d) separates the individual 3rd
order from
the raw data, which makes it possible to investigate further the 3rd
order information
itself and therefore has an advantage compared to Figure 3(c).
In the above simulation, the response data are generated from an ideal linear system
with ideal sinusoidal external excitation, which simplifies the interpretation of the
spectra. However, if external noise is added to the system response, the resultant
observed response data = response to the external force + noise. To illustrate this, the
simulation model uses scenario 2 (in Table 1) and the corresponding PSD results for
different techniques are now shown in Figure 4.
Page 11
a. PSD on raw data b. PSD on VKF-OT for 3rd
order
c. PSD on COT data d. PSD on VKC-OT for 3rd
order
Figure 4 PSD results for scenario 2 (with noise)
Little can be learnt from the spectrum in Figure 4(a) because of the noise. Figure 4(b)
and 4(c) show the PSD and PSD(angle) after VKF-OT and COT respectively, and do
give some insight into the system, albeit limited compared to Figure 3. It should also
be noted that the energy in Figure 4(b) is far lower than that in Figure 4(a). This
indicates that the VKF-OT technique largely excludes the influence of noise and
focuses on the order of interest. Finally, however, Figure 4(d) provides another clear
3rd
order peak, largely excluding the influence of noise and non-stationarity. This
result further demonstrates that the combined use of VKF-OT and COT can
significantly enhance the result obtained from Fourier analysis.
4 Experimental results
4.1 Rotating electrical machinery
Wang and Heyns [11] established an experimental test rig to investigate the ability of
VKF-OT in condition monitoring. Typical run-up data (vibration and tachometer
signals) from an automotive alternator were obtained. The experimental setup is
shown in Figure 5.
Page 12
Figure 5 Automotive alternator set-up
A typical set of measured data and the corresponding rotational speed are plotted in
Figure 6, and show how the vibration as well as the speed changes with time.
a. Measured data b. RPM
Figure 6 Raw data set
Using this data, the same techniques as were discussed in the SDOF rotor simulation
study are again applied here, and the four PSDs are plotted in Figure 7. Since there
are 36 stator bars in the alternator, the Vold-Kalman filter is used here to extract the
36th order.
Page 13
a. PSD on raw data b. PSD on VKF-OT for 36th order
c. PSD on COT data d. PSD on VKC-OT for 36th order
Figure 7 PSD results for alternator data
Figure 7(a) shows the PSD of the raw data. There are several frequency peaks at
around 50, 100 and 150 Hz, and some higher-frequency peaks around 700 – 1000 Hz,
and 1500 – 1700 Hz. Since the alternator output frequency is 50 Hz, it is expected to
have frequencies at 50 Hz and its multiples. Besides, based upon the rotating speed,
the full speed of the alternator nearly approached 1400 RPM or 23.3 Hz.
Considering the physical structure of the alternator, namely that there are 36 stator
bars, therefore 3.2336 838.8 Hz or its multiples may appear, i.e.
3.2372 1677.6 Hz. These two frequencies are apparently within these
higher-frequency peaks. It is difficult however to obtain any definite information
from Figure 7(a). Then, if Vold-Kalman filter-based order tracking is performed with
a relative filter bandwidth of 30%, the associated PSD spectrum is plotted in Figure
7(b) for the 36th order. In order to see the filtered 36
th order clearly, the abscissa
zoomed in the range from 700 Hz to 1000 Hz. Order 36 is now much clearer than in
Figure 7(a), but the smearing effect is still present and it is still not ideal for
monitoring purposes. Figure 7(c) is the PSD(angle) of the COT result. It can be
clearly seen that order 36 and its sideband orders are all included in the figure and
also the lower orders at around 4 as well as higher orders at around 72. It is quite
clear however that it cannot focus on one order, so it features several order peaks in
the figure, which is not ideal for the purpose of condition monitoring either. Finally,
Page 14
VKC-OT is applied to the data to extract the 36th order in Figure 7(d). It can be seen
that a clear and clean 36th order peak exists, which effectively excludes other
sideband orders as well as the smearing effect.
5 Conclusion
Vold-Kalman filter-based order tracking and computed order tracking have different
advantages and limitations. The distinct advantage of the re-sampling process of
COT is its ability to transform non-stationary data into stationary data, but it does
nothing with the data to eliminate the imperfections of the data and does not have the
ability to focus on individual orders. One of the main limitations of VKF-OT is that
the filtered data will retain the non-stationary effect of the raw data, but the filtering
process enforces smoothness and the harmonic nature of the data, which are
important factors for meaningful Fourier analysis. Through the combined use of
Vold-Kalman filter and computed order tracking (VKC-OT), the limitations of
Fourier analysis are largely avoided. The benefits of VKC-OT are demonstrated by a
simulated SDOF rotor model and the measured data from an automotive alternator.
Both studies confirmed the advantages of VKC-OT in order tracking analysis.
In short, a novel approach VKC-OT has been presented in this paper. The technique
takes the advantages of VKF-OT in its ability to extract focused, smooth and
harmonic nature order waveform and of COT in its ability to transform
non-stationary time domain data into stationary angle domain data, so that the novel
VKC-OT method provides a clear and focused perspective for the analyst to examine
order components by using simple Fourier analysis which would be an intractable
problem when using any other order tracking techniques alone.
References
[1] Fyfe, K. R. and Munck, E. D. S., Analysis of computed order tracking.
Mechanical Systems and Signal Processing, 11(2), 1997, pp.187-205.
[2] Eggers, B. L., Heyns, P. S. and Stander, C. J., Using computed order tracking
to detect gear condition aboard a dragline. The Journal of Southern African
Institute of Mining and Metallurgy, 107, 2007, pp.1-8.
[3] Brüel and Kjær, Product Data: Vold-Kalman order tracking filter - Type 7703
for Pulse. Available at: http://www.bksv.com/pdf/bp1760.pdf/
[Accessed: 11 Sep 2007.]
[4] Vold, H., Mains, M. and Blough, J., Theoretical foundations for high
performance order tracking with the Vold-Kalman tracking filter. SAE Paper
972007, 1997, pp.1083–1088.
[5] Tůma, J., Setting the pass bandwidth in the Vold-Kalman order tracking filter.
Twelfth International Congress on Sound and Vibration, 11-14 July 2005,
Lisbon.
[6] Pan, M. Ch. and Lin Y. F., Further exploration of Vold-Kalman filtering order
Page 15
tracking with shaft-speed information-I: Theoretical part, numerical
implementation and parameter investigations. Mechanical Systems and
Signal Processing 20(5), 2006, pp.1134-1154.
[7] Herlufsen, H., Gade, S. and Konstantin-Hansen, H., Characteristics of the
Vold/Kalman order tracking filter. Proceedings of the 17th
International
Modal Analysis Conference, Kissimmee, FL, March 1999.
[8] Vibrotools in MATLAB. Available at :http://www.vibratools.com/
[Accessed: 11 Sep 2007.]
[9] Howell, K. B., Principles of Fourier analysis, Chapman & Hall/CRC, 2001.
[10] Blough, J. R., A survey of DSP methods for rotating machinery analysis, what
is needed, what is available. Journal of Sound and Vibration, 262, 2003,
pp.707-720.
[11] Wang, K. S. and Heyns, P. S., Vold-Kalman filter order tracking in vibration
monitoring of electrical machines. Journal of Vibration and Control, 2009,
15(9), pp.1325-1347.