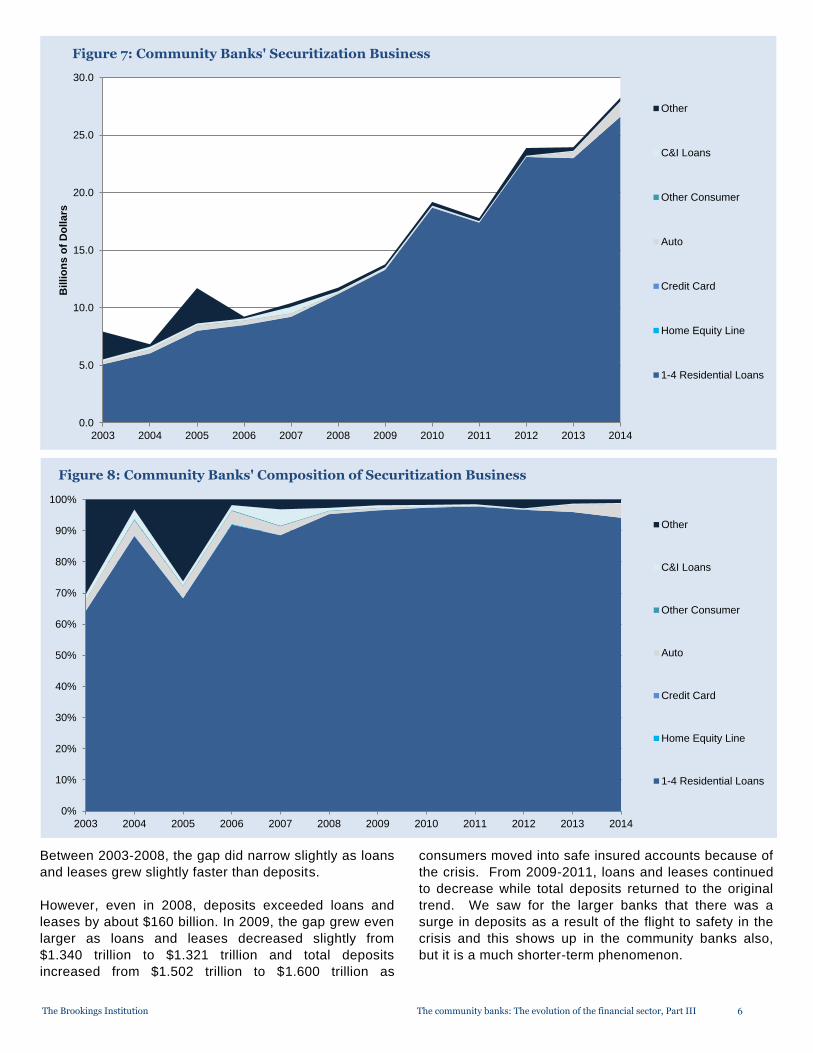
December 2015 The community banks: The evolution of the financial sector, Part III Martin Neil Baily and Nicholas Montalbano Executive Summary This report is the third installment of a series analyzing the ways in which the financial sector has changed since the financial crisis and the changes in financial regulations, notably the Dodd-Frank Act of 2010. Part I of this series examined the Big Four banks and Part II of this series examined a panel of 15 regional banks. This third part examines the community banks. Community banks serve an important function in local communities and in the economy as a whole. They provide traditional banking services to local households and provide lending to nearby small businesses. Unlike larger banks which work with groups nationwide, community banks tend to obtain deposits and make loans locally. They service key segments of the commercial bank lending market, including agriculture, real estate, and small business loans. While the largest banks generate revenue from noninterest income sources such as trading, venture capital, and investment banking activities, community banks get most of their revenue from traditional banking activities. 1 In addition, these banks often engage in personal and nonstandardized lending since they have specialized knowledge and expertise of their communities and customers, leading to their being called “relationship” bankers. Because of these banks’ close relationship with small businesses, they can drive an important segment of economic growth. Compared to all other banks (and to credit unions), small banks devote the greatest share of their assets to small business loans. 2 The community banks use relationship banking while the larger banks rely more on a models-based approach. There is an important caveat about community banks. Recall the lesson of the savings and loan crisis of the 1980s when small banks, whose lending was very concentrated in their local markets, were vulnerable to a local downturn (such as the Texas oil price bust of that period or the California housing cycle). Perhaps as a sign that community banks are aware of this problem, we find that prior to the crisis, they were placing a smaller fraction of their deposit base in loans than were the larger banks (thus hedging their bets). The crisis and its aftermath then widened this gap between deposits and loans by a significant margin. After the crisis, community banks have slowly begun to close the gap. One reason for the high level of concern about community banks is that the number of such banks is declining and our research confirms that pattern. However, we find that it is only among the smallest banks (less than $100 million) that we see this decline. These very small banks are such a tiny part of the banking sector that their impact on the overall economy has been rather limited.
Transcript
December 2015
The community banks:
The evolution of the financial sector, Part III
Martin Neil Baily and Nicholas Montalbano
Executive Summary This report is the third installment of a series analyzing the ways in which the financial sector has changed since the financial crisis and the changes in financial regulations, notably the Dodd-Frank Act of 2010. Part I of this series examined the Big Four banks and Part II of this series examined a panel of 15 regional banks. This third part examines the community banks.
Community banks serve an important function in local communities and in the economy as a whole. They provide traditional banking services to local households and provide lending to nearby small businesses. Unlike larger banks which work with groups nationwide, community banks tend to obtain deposits and make loans locally. They service key segments of the commercial bank lending market, including agriculture, real estate, and small business loans. While the largest banks generate revenue from noninterest income sources such as trading, venture capital, and investment banking activities, community banks get most of their revenue from traditional banking activities.
1
In addition, these banks often engage in personal and nonstandardized lending since they have specialized knowledge and expertise of their communities and customers, leading to their being called “relationship” bankers. Because of these banks’ close relationship with small businesses, they can drive an important segment of economic growth. Compared to all other banks (and to credit unions), small banks devote the greatest share of their assets to small business loans.
2 The community banks use relationship banking while the larger banks rely
more on a models-based approach. There is an important caveat about community banks. Recall the lesson of the savings and loan crisis of the
1980s when small banks, whose lending was very concentrated in their local markets, were vulnerable to a local downturn (such as the Texas oil price bust of that period or the California housing cycle). Perhaps as a sign that community banks are aware of this problem, we find that prior to the crisis, they were placing a smaller fraction of their deposit base in loans than were the larger banks (thus hedging their bets). The crisis and its aftermath then widened this gap between deposits and loans by a significant margin. After the crisis, community banks have slowly begun to close the gap.
One reason for the high level of concern about community banks is that the number of such banks is declining and our research confirms that pattern. However, we find that it is only among the smallest banks (less than $100 million) that we see this decline. These very small banks are such a tiny part of the banking sector that their impact on the overall economy has been rather limited.
The Brookings Institution The community banks: The evolution of the financial sector, Part III 1
Declining Number of Community Banks
We use the FDIC definition of community banks3 which
does not just use fixed size limits to determine which
banks belong in our sample. The FDIC incorporates
other factors, such as the extent to which a bank uses
the relationship approach and its geographic scope, into
the equation.
As shown in Figure 1, the number of community banks
has been steadily declining since 2003 (and before).
This drop has been simultaneous with the consolidation
of the banking industry as a whole, which has been
underway since the 1980s.4 Most of the decline within
the community banking industry has come from the steep
drop in the smallest banking organizations.5 Banking
organizations with total consolidated assets of less than
$100 million have dropped sharply while larger
community banks (greater than $300 million in total
consolidated assets) have increased in number.
In 2003, banking organizations with less than $100
million in assets (2009 dollars) totaled 3,255 and made
up 43.7 percent of all community banks. In 2014, these
figures dropped to 1,919 and 32.9 percent, respectively.
While the number of banks in the $100 million to $300
million asset class decreased by a small margin, this
asset class increased as a share of the community bank
population, from 35.6 percent in 2003 to 38.8 percent in
2014. As shown in Figure 2, similar proportional
increases were found for all banking organizations with
greater than $100 million in consolidated assets, and
those banks with $300 million or more in assets grew
modestly in number over this time period and grew even
more strongly as a proportion of banks by asset class.
The decline in the smallest asset class of banks is
significant and has persisted throughout the time
sample, from 2003 to 2014. However, the post-crisis
decline in the number of banks is not due to changes in
the rate of exit from banking. In an important study by
McCord and Prescott (2014, op cit.), they note that the
exit rate of banks from 2008-2013 was not that different
from the exit rate from 2002-2007.6 Crucially, they find
that most of the decline in banks can be attributed to the
lack of entry into commercial banking. New banks start
small and either fail or eventually move into larger asset
classes, and this lack of entry by what are called de novo
banks has been the primary cause of the recent decline
of the smallest banks. The authors conclude that there
would have been 10.7 percent more banks in this
smallest size class if pre-crisis entry patterns had
prevailed.
Three possible reasons for the lack of new banks are
restrictive banking regulations, a reduced interest
margin, and weak demand for bank services. McCord
and Prescott acknowledge the recent lower net interest
0
500
1000
1500
2000
2500
3000
3500
Less than $100 m $100 m to $300 m $300 m to $500 m $500 m to $1 b Greater than $1 b
# o
f B
an
ks
Total Assets (2009$)
Figure 1: Number of Banks In Each Asset Class, 2003-2014
2003
2004
2005
2006
2007
2008
2009
2010
2011
2012
2013
2014
The Brookings Institution The community banks: The evolution of the financial sector, Part III 2
margin as a factor, but do not identify it as the main
reason for lack of entry. They do find some evidence to
support the view that regulation is more burdensome to
smaller banks and that obtaining permission to open a
new bank is slower and more difficult than before the
crisis, but they do not find the evidence to be definitive.
The third and probably most likely explanation for the
lack of startup banks is the weak demand for bank
services, and perhaps especially community bank
services, in the recession and the slow recovery. As well
as the direct recession effects, small banks face some
structural problems with respect to their lending
opportunities that we discuss further below.
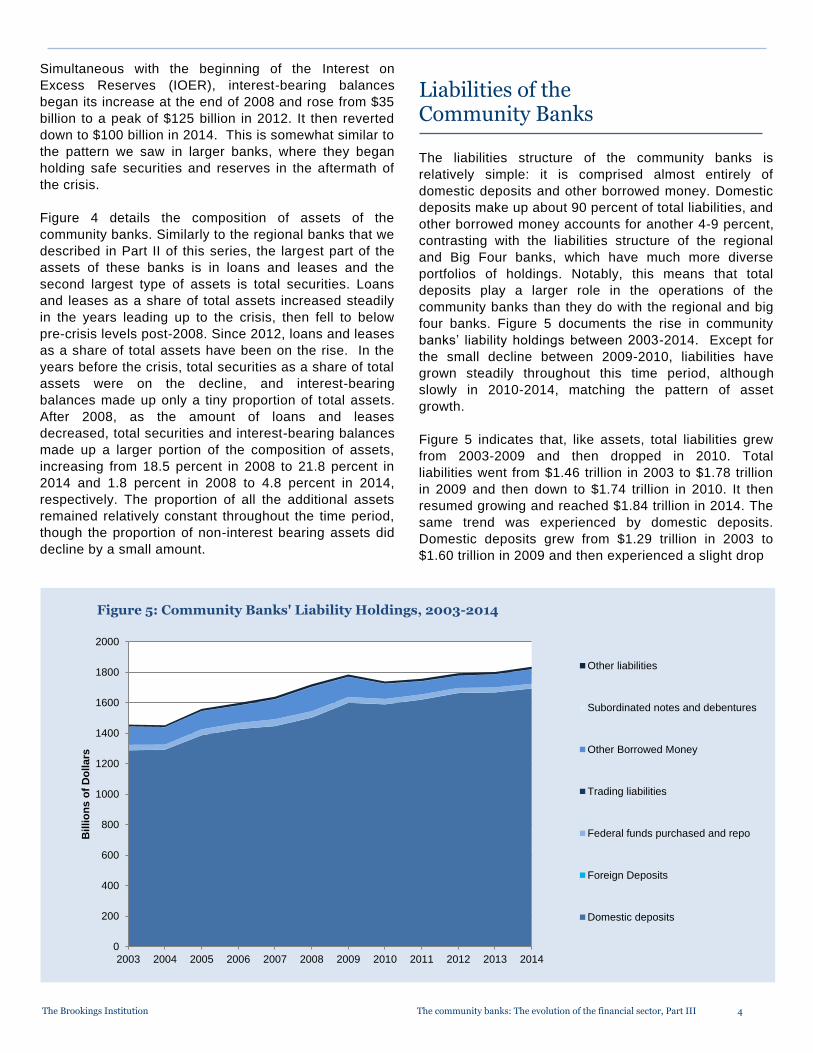
Assets of the Community Banks
Figure 3 shows that total assets of the community banks
increased strongly from $1.62 trillion in 2003 to $1.98
trillion in 2009, an increase of 22.5 percent (adjusted for
inflation, the increase was 7 percent). Assets then fell
slightly, 2.3 percent, between 2009 and 2010, before
growing steadily in the subsequent years. The
community banks avoided the prolonged or large-scale
losses faced by other banks in the crisis. Looking at the
level of assets after 2010, the rate of growth was quite
slow, rising only 6.7 percent from the end of 2010 to
2014, roughly flat after inflation. The assets of the
community banks recovered after the crisis but have
grown slowly in the post-crisis period.
The growth in total assets of the community banks
combined with the decline in the number of such banks
means that the average size of banks has increased. In
2003, the average size of a community bank was $195.6
million and by 2014 the average size was $341.9 million.
This result holds even when adjusting for inflation (total
assets per bank rose by 74.8 percent while the GDP
deflator rose by 23.9 percent).
0
0.05
0.1
0.15
0.2
0.25
0.3
0.35
0.4
0.45
0.5
Less than $100 m $100 m to $300 m $300 m to $500 m $500 m to $1 b Greater than $1 b
Pro
po
rtio
n
Total Assets (2009$)
Figure 2: Percentage of Banks In Each Asset Class, 2003-2014
2003
2004
2005
2006
2007
2008
2009
2010
2011
2012
2013
2014
Box A For our analysis detailing the decline in smallest banking organizations, we use mid-year data from 2003 to 2014 on bank holding companies (BHC) and standalone commercial banks (those banks that are not a part of a holding company). This level of aggregation is typically used by regulatory agencies and gives us a more accurate picture of the size of each organization than would the individual banks. Total assets are then reported relative to 2009 dollars. In the analysis of the banks’ balance sheets we use end-of-year data at the individual bank level. This analysis uses aggregated levels across each category (e.g. total assets of all banks in the sample) so it is unimportant whether the observation is of an individual bank, or of the bank holding company—the totals will be summed up the same in either case. These totals are in nominal terms unless otherwise stated.
Our sample ranges from $3.6 million to $27.3 billion in total assets in 2014 and includes 6037 FDIC-insured charters. From here on, the individual FDIC-insured banks and thrifts will simply be referred to as “banks.” More information on the dataset can be found in Appendix 1.
The Brookings Institution The community banks: The evolution of the financial sector, Part III 3
The holdings of securities by community banks had been
on a steady decline from $395 billion in 2003 to $349
billion in 2007, dropping from 24.4 percent of total assets
to 19.1 percent of total assets. The holdings began to
increase again in 2008, growing from $353 billion to
$462 billion from 2008 through 2012, and then leveling
off after. In 2014, securities accounted for 21.8 percent
of total assets, up from 18.5 percent at the end of 2008.
While both smaller and larger banks have increased their
holdings of securities post-crisis, larger banks have
increased their proportion by a larger amount.7 This
could be due to the new Dodd-Frank regulations, which
impose liquidity requirements on larger banks, but not