This paper was first written as a submission to the conference "Visualising andPresenting Indicator Systems," organized by the Swiss Federal Bureau of Statistics,Neuchâtel, Switzerland, 14-16 March 2005.
AbstractThe Compass Index of Sustainability is a method for clustering, aggregating, and scaling indicators andevaluation results on an absolute 0-100 performance scale, where "0" is set equal to worst-case or system-collapse conditions, and "100" is set to ideal or perfect long-term sustainable conditions. The method wascreated in 1997 and implemented for the first time in 2000, initially at the regional/community scale. Thispaper reviews five years of experience in using the method (in whole or in part) in a variety of contexts andsectors, ranging from small communities to larger regions, and from small companies targeted for privateinvestment to large, global, publicly traded companies. It examines the factors leading to success or failurein the application of the method by looking at case studies, two each in the public and private sector. It alsomakes some observations about the use of aggregated indices in sustainable development generally.
In June of 2000, in the city of Orlando, Florida, USA, we presented the first example of anew methodology for clustering, aggregating, and scaling indicators of sustainability.Called the "Compass Index," the method was built on interpretations of theoretical workin sustainability by Herman Daly, Donella Meadows and others. Its purpose was to (1)simplify and visualize a complex indicator set in ways that decision-makers, the media,and the general public could readily understand; and (2) put sustainability performanceassessment on an absolute, rather than relative, performance scale, so that progress isbeing measured and assessed against the required conditions for sustainability instead ofagainst the performance of other cities, companies, or other actors. The methodology,and our first experience of working with it, was documented in the Journal ofEnvironmental Assessment Policy and Management (AtKisson et al., 2001).
Since then, the Compass Index has been applied — in whole or in part — to a variety ofcities, regions, and communities, as well as to large corporations and to smaller, fast-growing companies targeted for investment. It has also been integrated into a largerprocess for strategic planning and training in sustainable development. This paperreviews our experience to date with the method: its strengths, problems, and impacts. Itfirst reviews the methodology, then summarizes the current applications, before goinginto a discussion of lessons learned and next steps in the method's development.
AtKisson et al. - "The Compass Index of Sustainability: A Five-Year Review" - DRAFT 2
THE COMPASS INDEX METHOD: THREE INNOVATIONS
We begin with four clustering categories, which borrow the symbolism as well as theinitial letters of the English-language compass: North, South, East, West. Nature,Economy, Society, Well-Being.
These four categories were introduced by economist Herman Daly (and laterreinterpreted by systems scientist Donella H. Meadows) as a way of conceptualizing keyfactors in a sustainable society, and the relationship between means and ends. Dalyframed these four elements -- Nature, Economy, Society, and individual human Well-Being -- as different hierarchical levels in a triangle ("Daly's Triangle"). Nature is the"ultimate means," the source of all energy and resources. The Economy, the"intermediate means," converts nature into usable goods and services. This in turnsupports the institutional arrangements and collective human patterns we call Society,which are the "intermediate ends." The "ultimate ends" are human health, satisfaction,and happiness. (Meadows, 1998)
Our first innovation was to map the same fourcategories onto the compass, taking advantageof the serendipitous alignment of initial letters(N, E, S, W) as well as the compass's circularform. These categories became the clusteringframework for our indicator sets. (Figure 1)
This modification of the "Daly Triangle"accomplished three things:
(1) The move from "Triangle" to "Compass"removed the means-to-ends hierarchy, whichparticipating experts in a variety of internationalmeetings on indicators had judged to becontroversial and not amenable to differences in cultural perspective. The circularcompass form emphasizes equal importance of the dynamics among the four clusters, atleast for sustainability assessment.
(2) The Compass emphasized the system linkages among the four cluster areas (and thespecific elements contained within them). For example, it is not the case that naturalsystems interact with human health and well-being only through the intermediaries of theeconomy and social institutions. The connections among all four "Compass Points" aredirect and often complex, and the circular Compass format also makes this easier tomodel.
(3) Finally, the image of the Compass supported the metaphor of the compass: orientingoneself, finding one's direction, knowing where to go. This metaphor worked particularly
AtKisson et al. - "The Compass Index of Sustainability: A Five-Year Review" - DRAFT 3
well with indicator systems designed to engage multi-stakeholder or multi-disciplinarygroups who are seeking consensus on common objectives.
We had previously worked extensively on the process elements of indicator development(AtKisson, 1999), and in defining quality guidelines for such processes (Hardi et al.,1997). These we incorporated as the process elements in the Compass Index method.
Our second innovation was to aggregate and scale the indicators based on absoluteperformance criteria for sustainability. To make the interpretation of the aggregatedindicators intuitive and familiar-feeling, we chose a 0-100 scale for representingsustainability performance, where "0" equals "systemic collapse conditions," and "100"equals "perfect performance and/or ideal sustainability conditions." Conversion of rawtrend data to this performance scale requires the consideration of relevant scientific,historical, and/or normative standards (including those set by policy). Such conversion ishardly non-controversial, but reasonable judgments can be made and defended. Threeillustrations of this method in practice:
• Data on energy consumption has been scaled with "100% renewable" as the topor "100" end of the scale, and emission levels (including CO2 emissions) thatwere judged life-threatening or otherwise "very dangerous" at the bottom or "0"end of the scale. Setting the "0" end of the scale has often been guided, forexample, by the current consensus of the Intergovernmental Panel on ClimateChange.
• Data on infant mortality and low birthweight has been scaled based on nationalpolicy goals on the top end (with the understanding that biology limits how lowthe incidence of these problems can be driven), and with current worst-casefigures in zones of extreme domestic poverty at the bottom end.
• Data on unemployment has set 3% equal to the "100" level of ideal performance,since there is general consensus among economists that 2-3% unemployment isequivalent to "full" employment (allowing for desirable mobility between jobs).The "0" level has been set equal to levels reached during times of severeeconomic depression.
The method also takes into account the need to adjust the scales so that they make senseto the average person. For example, if the air looks visibly smoggy, but the performancescale suggests that air quality is "almost sustainable", obviously the performance scale isnot going to have credibility, especially with environmental activists.
The third innovation, relative to other sustainability assessment structures, is the specificinclusion of individual "Well-Being" dimension. This innovation is actually deriveddirectly from our adoption of Daly's framework, so it is not original to our method. Itresults, however, in a significant and innovative difference from other frameworks, whichusually concentrate on social and institutional issues, but not on the individual. Thecomponent elements of the Well-Being dimension generally include individual health and
AtKisson et al. - "The Compass Index of Sustainability: A Five-Year Review" - DRAFT 4
longevity measures that are often categorized under "Social," but it also includes moresubjective factors such as experienced quality of life, fulfillment of educational potential,and a sensitivity to aesthetics. We believe the inclusion of these factors more accuratelyreflects features of an overall system that most people want to sustain, in addition tonatural systems health, economic vitality, and social cohesion.
The results or products of using this method are:
(1) A basic disaggregated, comprehensive, sustainability indicator report, using theCompass categories as clustering categories.
Figure 2. Performance chart from 2004 Regional Indicators Report for SouthwesternPennsylvania, USA. Source: Sustainable Pittsburgh
(2) Comparable performance assessment for individual indicators. These performanceindicators are fit to a common 0-100 scale, using similar sustainability-related criteria,and therefore reasonably comparable in terms of which trends should receive priorityattention. These results also show change in performance over time, allowing forcomparisons among indicators regarding which trends are getting "better" or "worse",and at what rate of change. (See Figure 2.)
AtKisson et al. - "The Compass Index of Sustainability: A Five-Year Review" - DRAFT 5
(3) Aggregated performance indices by "Compass Point", showing the averagesustainability performance level and trend for all the indicators in Nature, Economy,Society and Wellbeing. (See Figure 3.)
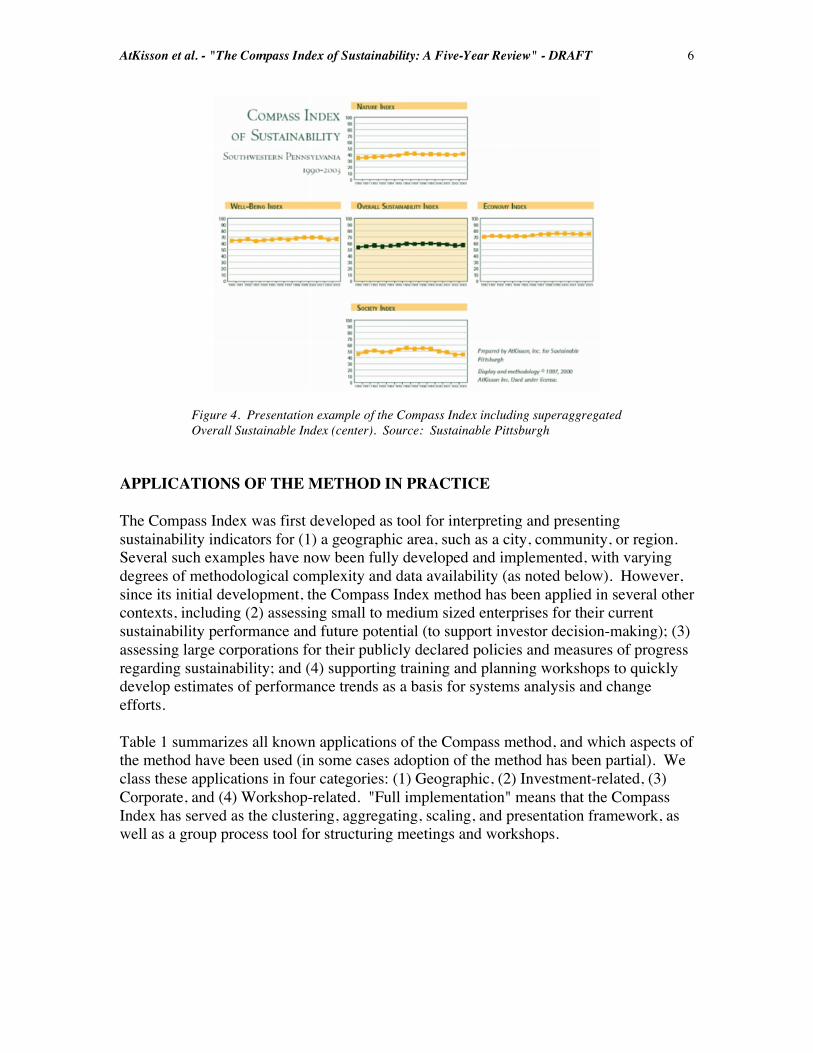
(4) An "Overall Sustainability Index," which is a super-aggregate of the four CompassPoint subindices and shows whether, on average, the performance of the entire indicatorset is improving or worsening over time, and at what level of "sustainable performance"the whole system in question can be judged to be. (See Figure 4.)
A simple average is used to construct the performance indices in order to keep themethod understandable to the average person and as transparent as possible, as well as toavoid irresolvable debates on appropriate weighting of individual factors. Note, however,that inclusion or non-inclusion of an indicator is already a fundamental weighting choice,as is the scaling method chosen to evaluate its performance.
Figure 3. Presentation example of the Compass Point subindices. Source:Sustainable Pittsburgh
AtKisson et al. - "The Compass Index of Sustainability: A Five-Year Review" - DRAFT 6
Figure 4. Presentation example of the Compass Index including superaggregatedOverall Sustainable Index (center). Source: Sustainable Pittsburgh
APPLICATIONS OF THE METHOD IN PRACTICE
The Compass Index was first developed as tool for interpreting and presentingsustainability indicators for (1) a geographic area, such as a city, community, or region.Several such examples have now been fully developed and implemented, with varyingdegrees of methodological complexity and data availability (as noted below). However,since its initial development, the Compass Index method has been applied in several othercontexts, including (2) assessing small to medium sized enterprises for their currentsustainability performance and future potential (to support investor decision-making); (3)assessing large corporations for their publicly declared policies and measures of progressregarding sustainability; and (4) supporting training and planning workshops to quicklydevelop estimates of performance trends as a basis for systems analysis and changeefforts.
Table 1 summarizes all known applications of the Compass method, and which aspects ofthe method have been used (in some cases adoption of the method has been partial). Weclass these applications in four categories: (1) Geographic, (2) Investment-related, (3)Corporate, and (4) Workshop-related. "Full implementation" means that the CompassIndex has served as the clustering, aggregating, scaling, and presentation framework, aswell as a group process tool for structuring meetings and workshops.
AtKisson et al. - "The Compass Index of Sustainability: A Five-Year Review" - DRAFT 7
Table 1: Known Applications of the Compass Index Method in PracticeSource: AtKisson, Inc.
Name, Location ofProject Category Aspects Used Description and Notes
Most RecentActivity
Healthy CommunityInitiative, "Legacy"series, Orlando, USA
Geographic Fullimplementation
County-scale sustainabilityreport. The Compass alsoprovides the organizingstructure for awardsrecognizing "Champions ofSustainability"
2002 report,2004 awardsevent (firstpublished2000)
Nantucket SustainableDevelopment Corp.,Nantucket, USA
Community sustainabilityreport complete, chose not totake additional step ofperformance indexing fordata and budget reasons
2003, report
Angels with Attitude,LLC, Seattle, USA
Investment Fullimplementation
Venture capital fund usingthe "Compass Index forInvestors" to evaluate targetcompanies
2004
Baltic 21, NorthernEurope / Baltic SeaRegion
Workshop Partial: Use ofCompass tocluster and assesspublishedindicators in astrategic planningworkshop
The Compass was used as anoverlay on a completedindicator set to structure asystemic review of trends aspart of a strategic planningprocess focused on the elevennations around the Baltic Sea
2004
Compass AssessmentSurvey 2004
Corporate Fullimplementation
Internal study of top-ratedsustainability-reportingcompanies, using a newvariation on the Compassmethodology. Not publiclyreleased
2004
State of SouthAustralia
Geographic,Workshop
Partial, notpublicly credited:Indicatorselection, andevaluation in aclosed workshopenvironment
The Compass format wasused in the internal processof framing and selectingindicators to support theState's strategic plan, butdifferent terminology wasused in the published version.The Compass indexingmethod was used to evaluatethe indicators in a planningworkshop that addressedgreenhouse gas emissionreduction initiatives.
This U.S. Army base, incollaboration with itssurrounding community, isusing Compass to frameindicators and dimensions ofsustainability, but not yet forindexing or scaling indicators
2004,workshopsandmeetings
SustainablePittsburgh, USA
Geographic Fullimplementation
Region-scale sustainabilityreport. The performanceindex is treated as an"Appendix" to the bi-annualregional indicators report
2005 report(firstpublished2002)
Top 10 by 2010, NewOrleans, USA
Geographic Fullimplementation
Region-scale sustainabilityreport. The performanceindex has never been releasedpublicly, but was reviewedby participating decisionmakers
2005 update(firstpublished2003)
HOW THE METHOD HAS FARED IN PRACTICE: CASE STUDIES
When the Compass Index was first developed and published (in July of 2000), as the coreof the Healthy Community Initiative of Greater Orlando's "Legacy 2000" sustainabilityreport, it received significant local and indeed some national media attention. The reportwas released first in Washington, DC, USA at an event held at the National Press Club,and the public service cable television service C-SPAN covered the release. The next dayit was released in Orlando, where it led the news on all major channels and receivedfront-page attention. (See AtKisson, et. al., 2001)
In terms of public attention to the full methodology of the Compass Index, the firstOrlando report represents the high water mark. While other projects and reports havereceived significant press attention, no project has managed to generate the considerablebuzz that surrounded "Legacy 2000." Just two years later, when the Orlando report wasupdated, revised, and re-released (HCI, 2002), the newspapers and other media wereactively avoided by project leaders: it was believed that because of changes in mediaownership and political climate, both the newspaper and television media would be morehostile to the "Legacy 2002" report. Instead, a quieter strategy of one-on-one meetingswith key leaders in the region was pursued, to good effect.
AtKisson et al. - "The Compass Index of Sustainability: A Five-Year Review" - DRAFT 9
These two episodes in the Orlando story are instructive, in that they highlight a keyreflection on the use of the method. In 2000, the Compass Index itself was interesting tothe media, and it was useful to gain their attention and the attention of the public, therebygaining the attention of political and other leaders. But in 2002, the performance indexhad less perceived value, because the opportunities for using it in the media werecurtailed. The quieter "executive briefing" led to greater emphasis on the summaryqualitative findings about key trends and how they were linked together in systemicways.
The following case studies therefore focus on the Compass process as a whole, not justthe performance index, which has had variable prominence and perceived utility,depending entirely on the context of the method's use. We now attempt to identify thefactors that led to the method's success or failure in application, looking at four caseswhere the implementation has been full and complete (which one exception, as noted).Two of the cases are multi-sectoral regional development projects; one is a globalbusiness; and one is a venture capital investment fund.
Case 1: Sustainable Pittsburgh, Southwestern Pennsylvania, USA
In 1998, our firm was engaged to help design and launch a civic initiative in thePittsburgh region of Pennsylvania, USA, in connection with a visit by the U.S. President'sCouncil on Sustainable Development. The process brought together over a 100 leadersfrom that region, and they created a consensus statement on regional sustainability goals.The goals framed the development of indicators to measure the region's progress towardthose goals.
Local researchers prepared a draft indicator report, and our firm was engaged to expandand improve upon it. We proceeded to reformulate the report according to the CompassIndex method, in both process and technical terms. This involved:
• Framing the existing document as a "consultation draft," and holding a series ofmeetings with existing regional leadership groups to get feedback on the choice ofindicators and their method of presentation.
• Expanding the indicators based on that community input, as well as additionaltechnical input from regional experts.
• Preparing and publishing the resulting report, with the Compass as its clusteringframework and with the Compass Index as a supplemental interpretation andanalysis tool.
Whereas the Orlando, Florida Compass Index report had presented the aggregatedCompass Index prominently — including using the resulting overall index score as a wayto attract media attention — the steering group in Pittsburgh opted for an entirely
AtKisson et al. - "The Compass Index of Sustainability: A Five-Year Review" - DRAFT 10
different strategy. The report was summarized in more traditional, "Executive Summary"terms, and the aggregated and scaled Compass Index was published as an Appendix.
Assessment of Success and Impact: The "Regional Indicators Report for SouthwesternPennsylvania" has now been published twice, and its impact appears to be growing. Ithas been used as a reference tool for strategic planning by a variety of local groups andactors.
The report has been used to (1) frame strategic action priorities for the sponsoringSustainable Pittsburgh initiative, (2) provide formal feedback to the strategic planningprocesses of leading regional foundations, and (3) provide the basis for regional planningworkshops on addressing linked chronic problems like sprawl and inner-city poverty.The Compass format has been generally accepted as a useful clustering framework;however, the Compass Index has not attracted significant attention. The impact of theIndex is indirect: results are used "behind the scenes" as an analysis tool by the reportwriters, who then use those results to select and highlight the indicators and trendsrequiring urgent attention. That information is then presented in traditional ExecutiveSummary text format.
Factors Affecting Success and Impact: The key factors affecting success here are arelatively conservative and polarized local political culture, and a skeptical expert groupunwilling to fully endorse definitions of sustainability and unsustainability in indicatorperformance.
The Compass-based clustering format was non-controversial and generally acceptedwithout comment. The placement of the Compass Index as an appendix was the result ofexpert skepticism regarding the indexing methods; an advisory group found it difficult tocome to consensus on where to set the performance scales of individual indicators, andseveral participants worried that they could be attacked by conservative critics onmethodological grounds. To avoid this risk, my firm, as the consulting organizationpreparing the report, offered to make independent decisions, and to present the results asan "experiment." This made the Index available for use as a strategic reflection tool, eventhough it was not highlighted in presentations to the public.
Case 2: Top 10 by 2010, New Orleans, USA
The "Top 10 by 2010" initiative is a multi-stakeholder project with joint sponsorshipfrom a wide variety of business, foundation, non-profit, and local government actors inthe region of Southeast Louisiana. The region covers ten counties (called "parishes")situated around the delta region of the Mississippi River. The initiative was intended as aten-year push for regional advancement, with the goal making the New Orleans region"one of the ten best places to live and work in the United States." The co-chairs of theproject were well-known real-estate developers, one from a prominent Democraticfamily, the other a conservative Republican who had formerly served in political office.
AtKisson et al. - "The Compass Index of Sustainability: A Five-Year Review" - DRAFT 11
The Compass method provided the framework for the opening stages of this initiative,serving both as an organizing symbol (drawing people together from every Compasspoint, in both geographic and sectoral terms), and as the methodological frame for thedevelopment of long-term regional indicators. To emphasize the symbolism, theCompass was integrated into the logo of the initiative, and key chains with actualcompasses were distributed to all participants.
As the first step in developing regional strategic goals and indicators, we surveyed 2,600citizens from around the region (this number was required in order to get a statisticallyvalid sample in each of the ten parishes). We asked them to name strengths andweaknesses in their communities, both now and in their imagined future, ten years fromnow. We then analyzed their free-form answers, which were recorded by the survey-takers in each citizen's own words, to identify key phrases and issues. These were thenpresented to a "Civic Panel" of one hundred regional leaders, and sixty "TechnicalAdvisors." A nine-month process of facilitated meetings with both groups, bothseparately and together, coupled with a decision-process involving about twenty-fiveleaders on a Steering Committee, produced a relatively robust consensus on a set of forty-five indicators, spread among the four Compass Points.
These indicators were researched, and the resulting report was disseminated throughoutthe region and written up in the regional press. A separate report interpreting theindicators on the aggregated Compass Index performance scale was also produced indraft form, but this report was only circulated to the Steering Committee, Civil Panel, andTechnical Experts.
The theory of change motivating the use of sustainability indicators produced by thisformat and using the Compass Index format rested on three key assumptions:
(1) That one of the region's key problems was a lack of regional cooperation, and that thedevelopment of common regional indicators would help to build regional identity andnew patterns of regional collaboration.
(2) That focusing on regional improvement through a highly integrated sustainabledevelopment lens would help improve the externally perceived economic vitality andquality of life in the region.
(3) That the indicators would serve effectively as a base and common point of referencefor multi-sectoral, region-wide initiatives.
At the time of writing, it is difficult to assess the success of this project. The catastrophethat occurred in the region because of Hurricane Katrina has changed everything, andwhile regional leaders have signaled that they expect the indicators to be useful inguiding reconstruction, it is impossible to say what that will mean in practice.
But the impact prior to the hurricane appears to have been positive. Just prior to Katrina,we had updated the region's indicators. Some indicators showed significant improvement
AtKisson et al. - "The Compass Index of Sustainability: A Five-Year Review" - DRAFT 12
in regional conditions, and one indicator suggested that the region was moving rapidlytoward its goal of being perceived as a "Top Ten" city. This indicator, the region'splacement on the Forbes/Milken list of "Best Places to Do Business in the United States,"showed a jump from number 194 in 2002 to number 110 in 2004 -- an improvement of 84places, and nearly halfway to the goal.
However, the extent to which these improvements can be credited to the indicator projectis unknown. We do know that the project had a number of important impacts on regionalplanning and economic development strategy, that may have been quite crucial to other,parallel regional improvement processes. Also, the fact that the Top 10 by 2010 SteeringCommittee, after a nearly two-year period of dormancy, had re-engaged our firm toupdate the indicators with most-recent data suggests that the project was considered avaluable strategic tool for use by regional development leaders.
Assessment of Success and Impact: The Top 10 by 2010 Regional Indicators have beenused to frame the strategies of regional foundations as well as to inform the neweconomic development strategy of the region's leading business alliance. The CompassIndex performance scale has been part of that process, in entirely non-public ways. Tothat extent, the initiative can be called successful and to have had significant impact.
However, in terms of the project's stated goals for fostering regional collaboration andperformance improvement, judgment must at best be withheld. Conditions for meetingthose goals and declaring overall success within the originally envisioned time framemust eventually be re-evaluated in the context of Hurricane Katrina.
Factors Affecting Success and Impact: This project was framed as the launch of a 10-year initiative, with strong public declarations of commitment being made by its leaders.In practice, however, political and other events overwhelmed the capacity of projectleadership to attend to this initiative consistently. A mayoral election, coupled with amajor overhaul of the board, executive leadership, and public identity of the sponsoringorganization (formerly the New Orleans Regional Chamber of Commerce, now known as"Greater New Orleans Inc.), created extreme political turbulence and consumed the timeof many key project leaders. During this period, the Top 10 by 2010 project directorbecame the Acting President of the sponsoring organization, and her new duties severelylimited the time she could devote to implementation of the Top 10 process. At the sametime, one of the Chairs became caught up in public controversies regarding his company'sbusiness development projects in the city of New Orleans. Also, a local business reporterstrongly attacked the process (and myself, as the lead consultant) on political grounds,partly in conjunction with the other organizational changes that were happening; and thisslowed work for a time. Funding for the process dried up during this period as well, asfocus shifted elsewhere; and uncertainty about where the project was to be housed overthe long-term contributed as well.
In sum, the initiative was beset by challenges. And yet the Compass approach wascredited by many local actors as having created new relationships, changed regional
AtKisson et al. - "The Compass Index of Sustainability: A Five-Year Review" - DRAFT 13
expectations, and raised levels of awareness regarding key trends that have been veryimportant to strategic planning and decision-making in various contexts.
To cite one very poignant example, issues like accelerating coastal erosion andvulnerability to flooding were not on the "radar screen" of local business leaders; after theTop 10 by 2010 process, environmental actors were participating in regional businessdevelopment strategy, and conservative business leaders were at least talking privatelyabout the risk of flooding. (Unfortunately, this increase in awareness and engagementcame far too late to affect the political decisions that ultimately left the city unprotectedfrom Hurricane Katrina.)
Similarly, cultural groups, who manage one of the regions key economic assets (NewOrleans is the birthplace of jazz among other distinctions), had never been formallyengaged in regional economic processes until the Top 10 initiative brought them intodirect dialog with leaders in that context. We were surprised to learn that even basiceconomic data -- such as levels of venture capital investment or patent production -- hadnot been researched prior to the Top 10 indicators process; and these were now includedthe strategic planning processes of local business development strategists.
Finally, perhaps the most important piece of information to emerge from the Top 10process was the finding, at the earliest stages of surveying regional citizens, that they hadextreme difficulty imagining a changed or better future (by comparison with, say, citizensof northern California, whom one of our associates had previously surveyed). Thisfinding strongly affected the thinking of regional strategy leaders and encouraged them topromote a greater sense of vision and optimism about the region's future.
Case 3: Angels with Attitude I, LLC, Seattle, USA
In 2001 we were approached by a newly-created venture capital investment fund whoseinvestment strategy including selecting companies with high sustainability performance.They invited us to create a company assessment tool using the Compass Index methodbut adapted to the needs of early equity investors and small, fast-growing companies. Theintent of the tool was to provide the investment group with much more extensive analysisof a companies targeted for investment than the information provided by the usual "duediligence" process. This sustainability analysis was expected to help investors pick"future winners" with greater accuracy, on the theory that companies with relatively highsustainability performance now (as well the potential for high future performance) weremore likely to succeed in the emerging marketplace and provide greater exit returns forthe venture investor.
We developed a tool called "the Compass Index for Investors" that extensively evaluatedcompanies in terms of the four Compass Point categories. The tool covers one hundredparameters, twenty per Compass Point, and incorporates traditional economic/financialand other due diligence-related assessments. It also assesses twenty overarchingparameters in the category of "Integration," having to do with how well the company
AtKisson et al. - "The Compass Index of Sustainability: A Five-Year Review" - DRAFT 14
plans and manages in a systemic way, taking all areas of sustainable performance intoaccount and seeking linkages and synergies among them. The assessment parameterswere also harmonized to other leading sustainability and assessment frameworks,including the Global Reporting Initiative, the Dow Jones Sustainability Index, the so-called "System Conditions" promoted by The Natural Step. The tool was peer-reviewedby a group of experts in the field of sustainable investing, through a project coordinatedby a Harvard Business School MBA student.
In practice, the method involves an extensive review of company documents, surveyfeedback from senior managers, and interviews. Where actual data is not available — asis often the case with small companies — the evaluator uses technical and sustainability-related experience to estimate the relevant performance score based on the informationthat is provided. The quality and reliability of information affects the performance scoreas well; and the method adjusts for the relevance of particular parameters to thatcompany. It generally takes an experienced evaluator approximately three days to reviewmaterials and complete an evaluation. Compass Index scores and interpretive evaluationsare then presented to the investment group, and a set of 10-15 "Investment PerformanceIndicators" are selected from the assessment parameters provide both the company andinvestment group with a simplified way of tracking progress in the short term. Theoverall results are presented using the same 0-100 performance score, with subindexscores on the same scale for the four Compass Points, plus the "Integration" dimension.(See Figure 5.)
Figure 5. Presentation example of the Compass Index for Investors, with "Integrationand Synergy" score in the center, represented by a "+". Source: AtKisson, Inc., forAngels with Attitude I, LLC.
The Angels with Attitude I fund is now fully invested, and we have reviewed ninecompanies using the Compass Index tool. The fund manager, Kristin Martinez, hasdeclared the assessment process a success, though in application, the process was notwithout challenges. For example, assessments were supposed to be completed prior toinvestment decision-making; in practice, the full assessment has often been completedonly after a decision to invest had been made. Market factors have driven fasterinvestment decisions, while data limitations and slow information flow from companieshas lengthened the period required to complete an assessment.
AtKisson et al. - "The Compass Index of Sustainability: A Five-Year Review" - DRAFT 15
Assessment of Success and Impact: Part of the intent of the sustainability assessmentprocess was to sensitive emerging companies to sustainability performance criteria, andto motivate them to integrate sustainability into their strategic planning and developmentmuch earlier in their growth. The assessment has definitely accomplished this goal.
Fund manager Kristin Martinez writes:
It was sometimes awkward to talk to company founders and managersabout focusing on improving their sustainability scores when all of theirother investors were only talking to them about improving sales, grossmargins, and cash burn. It was difficult to be the only one asking aboutwhy there weren’t any women engineers in the factory, or plans to offerpaid time off to employees who volunteered in the community.
It was worth it, though, when management teams who hadn’t known theterm “sustainability” when we invested, pointed with pride to significantreductions in energy use or the creation of viable alternatives to toxicmaterials that had been caused by their products and services. (Martinez,2004)
What we cannot yet assess, however, is whether the assessment has helped to pickwinning companies in pure market terms, as none of the companies in the portfolio hasyet matured to the point of being sold or publicly traded.
Factors Affecting Success and Impact: The success of this approach depending on threekey factors: (1) the commitment of the investment fund and its manager to asustainability-based strategy and sustainability assessment (and our commitment tothem); (2) the direct linking of that assessment process to the investment process; and (3)the engagement of a very experienced evaluator.
From the outset, we viewed the sustainability assessment process and our businessrelationship with the investors as a long-term process, and our contractual relationshipreflected that. Companies seeking capital from Angels with Attitude I were required toparticipate in the assessment as a condition for receiving the equity investment, and theirinvestment agreements reflected that condition. Finally, our lead evaluator had nearlythirty years of cumulative experience in engineering, business management, andsustainability issues; this made it possible to conduct credible evaluations on limitedinformation in a reasonable period of time.
Case 4: A Global Corporation
Confidentiality agreements prohibit us from revealing certain details of this case, but weare permitted to describe it in general terms.
AtKisson et al. - "The Compass Index of Sustainability: A Five-Year Review" - DRAFT 16
We were engaged to support the indicator and index development of a major corporationbased in the United States. In this case, their interest was in the aggregation, weighting,and scaling methodology of the Compass Index, but not in the Compass symbol itself orits clustering categories. Instead, we developed a sports metaphor that was moreappropriate to the company's culture, and developed the specifications for a"sustainability decathlon," consisting of ten subindex categories for aggregating andscaling their performance indicators. Five indices were grouped under the generalheading of "Environmental" and five under "Social" (creating two "pentathlons" thatadded up to a decathlon).
With the exception of this alternative clustering framework, the methodology wasvirtually identical to our other projects, involving multi-disciplinary input to develop acomprehensive indicator set, setting absolute performance standards for each indicator in"collapse" and "ideal sustainability" terms, and displaying the results on a 0-100 scale.(See Figure 6.)
Figure 6. Application of Compass Index aggregation and scaling methodology toa different metaphorical and clustering framework, for a major globalcorporation.
Assessment of Success and Impact: Because this is a long-term project that will bephased in over the course of several years, it is too early to evaluate success. Moreover,we do not have full or continuous access to the project, but instead have simply providedthe company with a methodology, and with training in how to use it; no results have beenmade public. However, we can report that inter-departmental meetings to review themodel and select indicators have been considered successful, and have accomplishedtheir objective of giving disparate actors within the corporation a sense of common
AtKisson et al. - "The Compass Index of Sustainability: A Five-Year Review" - DRAFT 17
purpose and a sustainability goal. Most importantly, the indexing methodology ha helpedto institutionalize absolute standards for sustainability with regard long-term specificgoals, such as the elimination of toxic compounds, zero tolerance for child labor, and nonet contribution to global warming.
Factors Affecting Success and Impact: The company has a clear and publiccommitment to sustainability, as well as long-term committed leaders in the relevantdepartments who share a sustainability vision. While external and market forces are alsoin play, the importance of internal leadership and vision cannot be overemphasized, sincethese become translated into committed action over the long term, as well as to consistentresources for the work in terms of time and budget.
LESSONS LEARNED
The detailed review of these three cases, together with our observation of the CompassIndex method in practice elsewhere (including the Orlando project where the method wasfirst introduced), leads us to a number of preliminary conclusions regarding the strengthsand weaknesses of this specific method, as well as of aggregated sustainabilityperformance scales in general.
1. Success of an integrated, sustainability-oriented indicator system depends first andforemost on people and organizations.
The factor most correlated with success in our observation has not been issues regardingthe method itself, but people, and specifically the consistent and long-term commitmentof leaders and project managers. In Orlando, the program remained robust as long as theproject director — who was strongly committed to the project — was there. Once sheleft, the project was no longer prioritized by the sponsoring organization.
The lengthier summary of the New Orleans project underscores this point more intensely.In that case, commitment to the project has waxed and waned; the usefulness of theindicators has accordingly waxed and waned as well. As project participants refocustheir attention and interest swells, time and money are found to invest in it; and asattention gets diverted to other priorities driven by changes in organizations or personalinterest, the indicators get perceived as less important as well. In contrast, where leadersmaintain a clear vision of the indexing system as a critically important tool, the systemavoids the up-and-down fate associated with those more negative examples.
2. Continued development and support for an integrated indicator project depends onusers experiencing it as having practical and strategic utility.
Useful application of a complex and scaled indicator set creates a typical "virtuouscircle," where successful use leads to continued development, which leads to still moresuccessful use. For example, the Sustainable Pittsburgh Compass-based indicator projecthas received consistently high priority from its sponsoring organization and funding
AtKisson et al. - "The Compass Index of Sustainability: A Five-Year Review" - DRAFT 18
agencies, partly because of leadership (as noted above), but partly because the producthas consistently proven itself to be useful to them and to others in the region, particularlyin a strategic planning context.
3. Performance scales can be useful in public communication, but their usefulness inthat regard is entirely dependent on political and cultural context.
In a highly skeptical or polarized cultural context, whether in the public or private sphere,aggregation and scaling methodology can become an easy target for stirring upcontroversy, which can in turn distract the public from an engagement with the issues.For example, in Orlando, the use of the Compass Index scale was deemed extremelyuseful as an attention-getter on first release in 2000, and nearly irrelevant two years later.This change was due entirely to (perceived) changes in the political and cultural climateof the region, just in that period, and the expectation that wide publication of the indexwould make it — and the sponsoring organization — the target of hostile attention. InPittsburgh, an existing plethora of indicator-based studies and a culture of skepticismamong opinion-leaders made the Compass Index performance scale only useful inspecific, strategic planning contexts.
In the business-and-investment context, however, the Compass Index methodology wasimmediately accepted after its logic was explained, and it was considered highly usefuland relevant. Perhaps this because business people, and particularly investment decision-makers, are used to working with highly aggregated performance measures. Theyunderstand the usefulness of having an overall trend measure that can also be drilled into,in order to retrieve details on causative factors and important constituent trends.
4. Performance scales appear to be most consistently useful in a strategic planningand decision-making context.
In every instance of the Compass Index's full implementation, the primary benefitsappear to be in the presentation of a systemically sophisticated overview of conditions inthe region or company, and in identifying areas in need of priority attention. As thedevelopers of the Compass Index performance scale, we interpret this as good news,because promoting sustainability standards and systems-thinking in decision-making wasthe primary reason for the development of the methodology.
5. Methodology questions relating to selecting, aggregating, weighting and scalingindicators are only controversial among indicator and data experts.
In our experience, neither the media nor most decision-makers expressed critical interestin the actual methodology behind the Compass Index performance scale. There is abenefit to this inattention to the details, of course: conversations about the Index resultstend not to get stuck on technical questions, and are focused instead on the trendsthemselves and on strategic responses to them. The weakness is similarly apparent, inthat a lack of critical engagement means a lack of understanding. Since the purpose ofthe Compass Index methodology is, in part, to "raise the bar" on sustainability
AtKisson et al. - "The Compass Index of Sustainability: A Five-Year Review" - DRAFT 19
understanding, including what "collapse" and "sustainable" conditions mean in concreteterms, this finding is a bit of a disappointment. The scales still do their job, we believe,by orienting people in the right direction in performance terms, regardless of whetherpeople understand them or not. But it is not clear that users will understanding thereasons for urgency in their action, in sustainability terms, unless the use of the scale isaccompanied by continuous messaging about what sustainability means (for eachparameter or indicator) and why it is important to strive for sustainability and avoidconditions that could lead to systemic collapse.
On the other hand, where the groups are professionally sophisticated about the use ofdata, indicators, and indices, the Compass Index method has not been as successful,because these groups find it difficult to come to agreement on the range of technicaldecisions that must be made to create such an index. Development of the Compass Indexinvolves indicator selection, data gathering, clustering, weighting, aggregating andperformance scaling on an absolute scale. Each part of that process can reasonably bequestioned and challenged, and among more technically oriented groups, virtually all ofthem are. The fact that the Compass Index chooses simple solutions over complicatedones (for example, simple averaging instead of more complicated weighting schemes) inorder to maximize transparency does not reduce the opportunities for controversy. Wedetermine that where technically sophisticated groups are the primary target audience,indexing schemes of this general type are not recommended, because they will distractsuch groups away from an engagement with the primary data.
Technical critique is hardly unique to the Compass Index, however. All such indicesreceive their share of skeptical challenge from informed experts, and some experts holdrigorously to a general principle that "indexing is bad," because it hides data details in a"black box." We submit that in a world demanding simple interpretations of increasinglycomplex and plentiful data, indexing is a "necessary evil." Our view is that one must useit judiciously and transparently, and as the above points note, with careful attention to thecultural, political, and organizational context.
CONCLUSIONS
Five years of experimentation with the Compass Index methodology leave us optimistic.While we have noted problems in use of the method in this paper, we should emphasizethat most groups respond well to our presentations of the Compass Index and even itsunderlying methodology. Indexing generally does not, in our experience, lead to areduced engagement with underlying trend data; it increases that engagement, by makingthe data more approachable, and by awakening a curiosity about the details.
More importantly, the Compass Index has helped to establish ideal or absolute systems-based performance standards as the operational goal for a wide variety of sustainabledevelopment initiatives, in both the public and private sphere. In a world wheresustainability continues to be critiqued for "vagueness" and "attempting to be all things toall people," we believe a methodology of this type provides a powerful counter-argument,
AtKisson et al. - "The Compass Index of Sustainability: A Five-Year Review" - DRAFT 20
and can provide clear strategic guidance to those seeking to make sustainabledevelopment a reality.
REFERENCES
AtKisson, Alan. "Developing Indicators of Sustainable Community: Lessons fromSustainable Seattle." The Earthscan Reader in Sustainable Cities, David Satterthwaite,Ed., Earthscan, 1999.
AtKisson, Alan, and R. Lee Hatcher. "The Compass Index of Sustainability: Prototypefor a Comprehensive Sustainability Information System." Journal of EnvironmentalAssessment Policy and Management, Vol. 3, No. 4 (December 2001).
"Best Places for Business and Careers 2005," Forbes Magazine Online,<http://www.forbes.com/2005/05/05/05bestplaces.html>.
Hardi, Peter, and Terrence Zdan. "The Bellagio Principles for Assessment," in"Assessing Sustainable Development: Principles in Practice." International Institute forSustainable Development, 1997.
Healthy Community Initiative of Greater Orlando (HCI). "Legacy 2000 Report,"Orlando, USA, 2000; and "Legacy 2002 Report". See http://www.hciflorida.org.
Martinez, Kristin. "Measuring Sustainability in the Angels with Attitude I, LLCInvestment Portfolio." Unpublished paper, presented privately at investment meetingsand conferences. Contact the author at <[email protected]>.
Meadows, Donella H. "Indicators and Information Systems for SustainableDevelopment." Sustainability Institute, 1998. Available for download from<http://www.sustainer.org>.
Sustainable Pittsburgh. "Regional Indicators Report for Southwestern Pennsylvania2002" and "Regional Indicators Report for Southwestern Pennsylvania 2004". Seewww.sustainablepittsburgh.org.
Top 10 by 2010. "Regional Indicators of Sustainable Development for SoutheastLouisiana 2002." Available for download from www.top10by2010.org.
See also links available at www.AtKisson.com.
Contact Information:
Alan AtKissonAtKisson Europe ABTel: +46 709 926 979
AtKisson et al. - "The Compass Index of Sustainability: A Five-Year Review" - DRAFT 21