The Competitive Causes and Consequences of Customer Satisfaction Selected Paper prepared for presentation at the American Agricultural Economics Association Annual Meeting, Providence, Rhode Island, July 24-27, 2005 Daniel H. Simon Department of Applied Economics and Management Cornell University 354 Warren Hall Ithaca, NY 14853 Phone: (607) 255-1626 Email: [email protected]Miguel I. Gómez Department of Applied Economics and Management Cornell University 149 Warren Hall Ithaca, NY 14853 Phone: (607) 255-8472 E-mail: [email protected]May, 2005 Copyright 2005 by Daniel H. Simon and Miguel I. Gómez. All rights reserved. Readers may make verbatim copies of this document for non-commercial purposes by any means, provided that this copyright notice appears on such copies.
Transcript
The Competitive Causes and Consequences of Customer Satisfaction
Selected Paper prepared for presentation at the American Agricultural Economics Association Annual Meeting, Providence, Rhode Island, July 24-27, 2005
Daniel H. Simon Department of Applied Economics and Management
Cornell University 354 Warren Hall Ithaca, NY 14853
Copyright 2005 by Daniel H. Simon and Miguel I. Gómez. All rights reserved. Readers may make verbatim copies of this document for non-commercial purposes by any means, provided that this
copyright notice appears on such copies.
2
The Competitive Causes and Consequences of Customer Satisfaction
ABSTRACT
We conduct two studies to test three hypotheses: (1) Competition increases a firm’s customer
1995), more inelastic demand (Anderson, 1996), and reduced costs for attracting new customers and other
costs associated with poor quality, defects and complaints (Anderson, Fornell, & Rust, 1997). Reflecting
these benefits, customer satisfaction has been found to positively affect a firm’s profitability (Anderson,
Fornell, & Lehmann, 1994; Aaker & Jacobson, 1994; Capon, Farley, & Hoeni, 1990), and its market
value (Aaker & Jacobson, 1994; Ittner & Larcker, 1998).
While extant literature provides evidence for the positive effect of a firm’s customer satisfaction,
little if any research has considered the effect of rivals’ customer satisfaction on a firm’s performance.
Yet, a firm’s performance, particularly its revenues, may also be impacted by rivals’ customer
satisfaction. As rivals offer higher quality, better service, and/or lower prices, customers are likely to
switch to those firms. These customers’ perception of the focal firm’s offerings may remain unchanged.
However, if their perceptions of a rival(s)’s quality, service, and/or price improve (they recognize an
opportunity to get a better product or service at the same or lower price), then they are likely to seize it.
In this spirit, Januszewski (2004) studies the impact of airline on-time performance on demand
for air travel. She shows that while an airline’s on-time performance increases its demand, rivals’ on-time
performance reduces its demand, holding constant its own level of on-time performance. We further
examine this relationship, considering overall customer satisfaction as well as each dimension of
customer satisfaction, with the following hypothesis:
H3: Rivals’ customer satisfaction has a negative effect on a firm’s sales performance.
10
To test our hypotheses, we conduct two separate studies. Study One uses a single-industry, store-
level dataset of customer satisfaction ratings, while Study Two uses a multi-industry dataset of brand-
level customer satisfaction ratings. Using customer satisfaction ratings to measure firms’ provision of
customer satisfaction offers many benefits while creating some challenges. The advantage of customer
satisfaction ratings is that they allow us to measure customers’ perceptions, which should ultimately drive
purchase decisions. However, customer satisfaction ratings are a somewhat noisy measure of the actions a
firm takes to satisfy customers for two reasons. First, customers may rate rival stores on a relative basis; a
customer’s satisfaction with firm i may be a function of her satisfaction with rivals of firm i. As a result,
customers may lower their satisfaction ratings for firm i as their satisfaction with rival firms increases.
Second, unobserved factors may cause firms’ customer satisfaction to vary even if they take no actions.
For example, during good economic times customers may be more satisfied even if quality, service, and
prices do not change. We further discuss each of these issues below and explain how we control for them.
STUDY ONE
Data
In this study we use data from a major supermarket firm operating in the Eastern US. The dataset
includes observations for 189 stores located in two states, spanning the years 1998-2002. Customer
satisfaction data are collected annually in each store’s trading area via random phone interviews
conducted by an independent market research firm during a one-week period.1 On average, about 200
households are interviewed in each trading area each year. A trading area is defined as the census tract in
which a store is located, and there is only one focal store per trading area (according to the US Census
Bureau, on average, about 4000 people live in a census tract). Respondents provide information for up to
five grocery stores with which they are familiar. Respondents rate each store on a 1 (poor) - 5 (excellent)
scale on 15 items related to customer satisfaction with specific aspects of the store and one item
1 In 2002, the supermarket chain converted the customer satisfaction data collection to a daily basis. Interviewers conducted roughly one survey per day per store until they had surveyed about 200 respondents per store.
11
measuring overall satisfaction (Appendix A). They also indicate their most convenient store, and they
provide demographic characteristics such as household size, gender and age, among others.
In the customer satisfaction survey, the interviewers do not reveal the name of the grocery store
chain for which they are conducting the survey. Customers rate up to five grocery stores with which they
are familiar. This feature of the survey allows us to capture data on rivals’ satisfaction. Moreover, the
blind nature of the survey increases the credibility of customer responses, because customers feel no
pressure to provide higher ratings for any particular store. Not all respondents rate the focal store (the
store in the trading area owned by the chain that provided the data). On average, they rate three stores.
Using these data, we construct customer satisfaction measures for the focal store and for rivals.
The focal store’s customer satisfaction is based on the average ratings of respondents in the focal trading
area who rate the focal store, while rivals’ customer satisfaction is based on respondents’ average ratings
for all stores in the trading area other than the focal store.
In addition to the customer satisfaction data, we collected data on focal store sales performance
and on store characteristics. For each focal store in our sample, we obtained monthly sales for the entire
period of the study. From an annual employee survey and from various company reports we obtained
information regarding labor-force variables at the store level such as number of employees, full or part-
time status, and employee turnover rate. Additionally, we collected data on store remodels during the
study period. We believe that the collection and integration of these data represent an important
contribution of our work because they allow us to link customer satisfaction and firm performance in a
competitive setting while controlling for the influence of customer and store characteristics.
Variables
Customer Satisfaction of Focal Store. To measure a focal store’s overall customer satisfaction,
we use its customers’ average responses to the overall satisfaction survey item (item 16 in Appendix A).
For example, for focal store i, overall customer satisfaction is the average response to the overall
satisfaction item by respondents that rated focal store i.
12
We also measure the three dimensions of customer satisfaction: quality, service, and price. Nine
survey items describe the store’s quality in the following areas: bakery, seafood, fruits and vegetables,
fresh meats, deli meats and salads, dairy, community involvement, availability of brands, and store
cleanliness. Three items capture service: fast check-out, helpfulness of employees, and quality of service
in the deli. Finally, three items measure satisfaction with prices: low everyday prices, great discounts, and
availability of advertised items (see Table 1 for a list of the items used to measure each dimension of
customer satisfaction). The reliability alphas indicate that the survey measures the three dimensions of
customer satisfaction in a useful way (0.87, 0.94, and 0.75 for service, quality and price, respectively).
[Insert Table 1 about here]
To measure each dimension at the store level, we take the store’s average rating across the items
corresponding to that dimension. For example, to measure satisfaction with service for focal store i, we
first calculate the average rating for store i, for each of the three service-related items: extremely helpful
employees, fast check out service, and excellent service in the deli. Next, we calculate store i's
satisfaction with service by taking the average of the store’s averages for each of the three service-related
items. Mathematically, if Xi1,…,Xi3 are store i's averages for the three service-related items, satisfaction
with service for store i equals (Xi1 + Xi2 +Xi3)/3). We do the same for quality and for price.
Rivals’ Customer Satisfaction. We use a similar approach to measure rival customer satisfaction.
Rivals’ overall customer satisfaction is the average response to the overall satisfaction item given by
respondents rating all stores, other than the focal store, in a focal store’s trading area. For example, for
focal store i in trading area j, rival overall customer satisfaction is the average response to the overall
satisfaction item for all stores, other than store i, rated by customers in trading area j. Similarly, we create
measures of rival satisfaction with service, quality, and price by taking the average rating for rivals on the
three service-related items, the nine quality-related items, and the three price-related items.
Market Structure. To measure market structure, we count the number of stores, other than focal
store i, rated by customers in trading area j. Using customer responses is effective in eliciting the relevant
rivals for each store, avoiding any arbitrary construction of market boundaries.
13
Sales Performance. We measure the focal store’s sales during the one-year period following the
month in which the customer satisfaction survey was administered. For example, if the customer
satisfaction survey is conducted in March, then we compute sales by adding up thirteen four-week periods
of sales, beginning with April, and continuing through March of the following year.2
Control Variables. We control for the age, income, number of children, and marital status of
respondents. We also control for the store’s number of employees, the percentage of employees that are
full-time, and the store’s annual employee turnover rate. Additionally, we include a dummy variable
indicating whether the store is being remodeled. Lastly, we include store and year fixed effects. Store
fixed effects control for differences across stores that might influence competitive conditions, customer
satisfaction, and/or sales, while year fixed effects control for changes over time that affect these variables.
Results
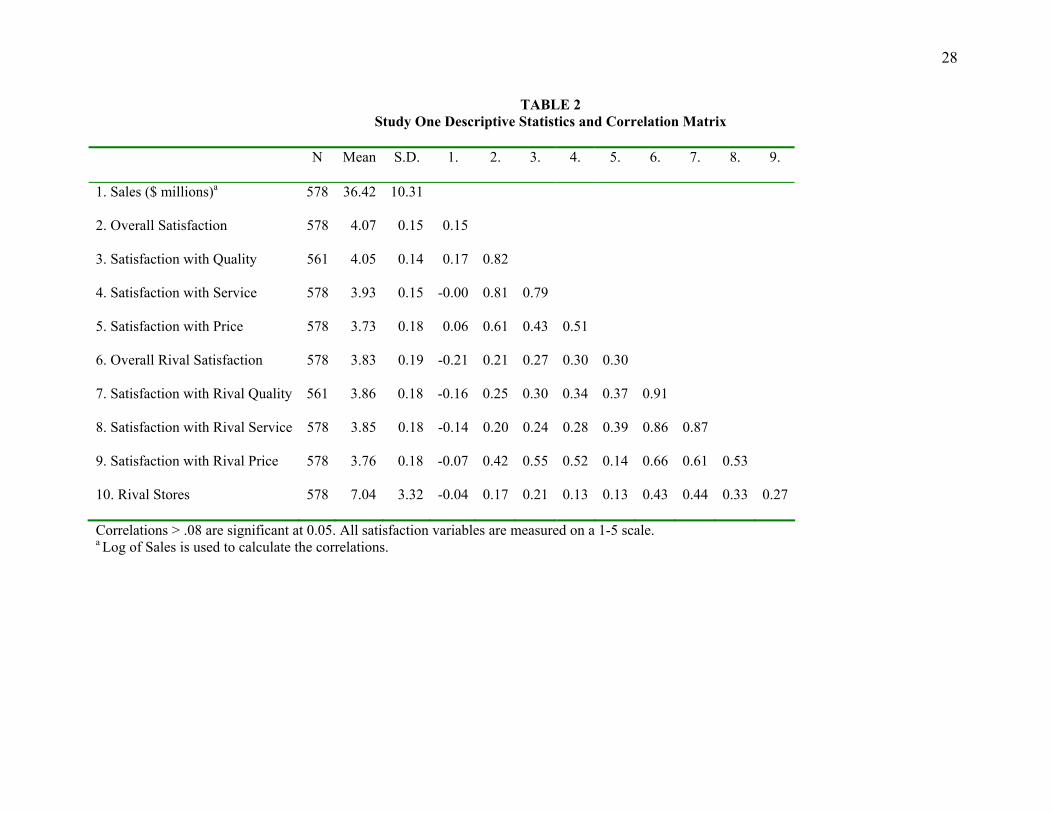
The dataset includes 578 focal store-year observations. Table 2 reports descriptive statistics and a
correlation matrix for the key variables. Mean focal store sales are about $36 million. Moreover, the focal
chain has higher ratings than its rivals on overall satisfaction, as well as on satisfaction with quality, but
its scores are about the same as rivals’ on ratings of service and price. This suggests that the focal chain
tends to emphasize quality in its strategy.3 On average, each focal store has about seven rivals.
[Insert Table 2 about here]
Table 3 reports the results for the tests of H1. In the first column, we examine the impact of
market structure on overall customer satisfaction. Our results suggest that the number of rival stores has
no impact on a store’s overall level of customer satisfaction. We find similar results when we examine the
impact of market structure on each of the three dimensions of customer satisfaction (quality, service, and
2 As noted above, in 2002 the supermarket chain converted the customer satisfaction data collection to a daily basis. To keep the timing of our sales data consistent with previous years, we use those surveys that were conducted prior to the month in which the survey was conducted during the previous year. For example, prior to 2002 Division 1 stores conducted the customer satisfaction survey during September. Therefore, in 2002, we use customer satisfaction ratings data that were collected between January and September. As a result the period in which we measure sales remains constant in each year, and we avoid seasonal inconsistencies in our sales measure. 3 Conversations with company executives and industry experts indicate that the focal chain’s strategy emphasizes quality, although in many markets it is not the highest-quality store. However, the focal store is very rarely the lowest-priced supermarket in a local area.
14
price). These results provide no support for H1, indicating that the number of rival stores does not affect a
store’s level of customer satisfaction.
[Insert Table 3 about here]
To test Hypothesis 2, we add rival satisfaction to our model. We report the results in Table 4. In
column 1, we consider the impact of rivals’ overall customer satisfaction on the focal store’s overall
customer satisfaction. We find that rivals’ overall satisfaction has no effect on a store’s overall level of
customer satisfaction. This result fails to provide support for H2 which posits that by increasing the
store’s incentive to respond, rival satisfaction should positively affect a store’s own level of satisfaction.
[Insert Table 4 about here]
To further test Hypothesis 2, we examine the impact of rival customer satisfaction on focal store
customer satisfaction for each dimension of customer satisfaction. In column 2, we find that a one-point
increase in rivals’ customer satisfaction with quality yields a 0.18-point increase in a store’s customer
satisfaction with quality. Similarly, in columns 3 and 4, we find that a one-point increase in rival
satisfaction with service (price) produces a 0.27 (0.16)-point increase in focal store customer satisfaction
with service (price). These results provide support for H2.
While these results are consistent with H2, which posits that rivals’ satisfaction positively
influences a firm’s own provision of customer satisfaction, an alternative explanation for these results is
that one or more unobserved variables influences satisfaction for all stores within a local area. Although
year fixed effects control for unobserved changes that may influence customer satisfaction at all stores
(e.g. if wholesale food prices decline, resulting in lower retail prices, then customer satisfaction will rise
for all stores), there may be local factors that influence customer satisfaction for all stores within the same
area. For example, if the local economy is thriving, customers may tend to rate all local stores higher.
To examine this alternative explanation, we include customer satisfaction for ‘sibling’ stores:
other stores owned by the focal chain, which are outside of the focal store’s trading area but are rated by
customers in the focal store’s trading area. For example, some customers living in trading area x where
focal store i is located may shop at another store j, owned by the focal chain, but in neighboring trading
15
area y, perhaps because it’s closer to where they work. Because sibling stores are owned by the focal
chain, they should not compete with each other. However, if there are unobserved changes that affect
local stores and underlie the positive relationship between own and rival satisfaction, then we should
observe the same positive relationship between the satisfaction of sibling stores located near each other.
Table 5 reports the results of this analysis, which includes the satisfaction of sibling stores rated
by shoppers in the focal trading area. As in Table 4, the effect of rivals’ overall customer satisfaction
remains statistically insignificant, and the effect of sibling stores’ overall customer satisfaction is also
insignificant. Importantly, the effects of each of the three components of rival satisfaction remain positive
and statistically significant. Satisfaction with quality and service of sibling stores also has positive and
statistically significant effects on the focal store’s level of satisfaction. These results provide some
evidence that there are local factors affecting customer satisfaction for all nearby stores. However, F-tests
indicate that, for all three components of customer satisfaction, the effect of rival satisfaction is
significantly greater than the effect of sibling satisfaction. Consequently, although there may be local
factors that cause the satisfaction ratings of all nearby stores to move together over time, rival satisfaction
has an additional effect on a store’s level of customer satisfaction. We posit that this effect reflects the
competitive dynamics of firms responding to efforts by rivals to steal market share.
[Insert Table 5 about here]
To test Hypothesis 3, we first examine the impact of rival satisfaction on focal store sales
performance (Table 6). The results, reported in column 1, show that rivals’ overall customer satisfaction
has a negative and statistically significant effect on store sales, providing support for Hypothesis 3. In
columns 2-4 of Table 6 we examine the impact of each of the three components of rival satisfaction. The
results indicate that rival satisfaction with quality and service has a negative and statistically significant
impact on a store’s sales, while the effect of rival satisfaction with price is statistically insignificant.
[Insert Table 6 about here]
These results provide additional support for Hypothesis 3, indicating that rivals’ customer
satisfaction has a negative impact on a store’s sales performance. Moreover, these results suggest that
16
price competition has relatively little impact on the focal chain, while service and quality appear to be the
more important competitive variables. This is consistent with the fact that the focal chain emphasizes
service and quality, rather than prices, in its competitive strategy.
The results in Table 6 also show that the effect of rival customer satisfaction is often larger than
the effect of the focal store’s own customer satisfaction. For example, the coefficient on rivals’ overall
customer satisfaction (-0.09) indicates that a one-point increase in rivals’ overall customer satisfaction lts
yields a nine-percent decline in store sales (a one-standard deviation increase in rivals’ overall customer
satisfaction (0.19) yields a 1.7% decline in store sales performance). By comparison, a one-point increase
in a store’s own overall customer satisfaction only increases sales by six percent (a one-standard deviation
increase in overall customer satisfaction (0.15) increases sales by less than one percent).
Taken together, the results suggest that rival customer satisfaction has a direct negative effect and
an indirect positive effect on a store’ sales. As rivals increase their customer satisfaction they steal
customers from the focal store. This causes the focal store to increase its own customer satisfaction,
which in turn yields higher sales. To assess the net effect of rival customer satisfaction, we reestimate the
models in Table 6, excluding own customer satisfaction. We report these results in Table 7.
[Insert Table 7 about here]
When we omit own customer satisfaction, the effect of rivals’ overall customer satisfaction
remains unchanged (column 1), but the coefficient on each dimension of customer satisfaction becomes
less negative (columns 2-4). However, the negative effects of rival customer satisfaction remain. These
results show that the net effect of rival customer satisfaction on sales is negative, but that the negative
effect is weakened by the focal store’s increasing their provision of customer satisfaction in response to
the threat of rivals increasing their customer satisfaction.
STUDY TWO
While the above results provide support for two of our hypotheses, their generalizability is
limited because they are based on data from a single firm in one industry. For this reason, we conduct a
second study using a multi-industry dataset of customer satisfaction ratings. Although this dataset is less
17
detailed and includes fewer control variables, it does allow us to consider the same relationships in a wide
variety of industries. Moreover, it spans a longer time period and has more observations than the dataset
used in Study One, allowing us to estimate relationships more precisely.
Data
The ACSI is designed to measure customer satisfaction with the quality of consumer goods and
services available in the United States (ACSI, 2001). The brands included in the ACSI are broadly
representative of the US economy serving household consumers (ACSI, 1999), spanning more than forty
industries in seven economic sectors, and comprising about 40% of US GDP (ACSI, 2001). The ACSI is
a quarterly survey. Each quarter, roughly 250 telephone interviews are conducted with randomly selected
current customers for about one quarter of the brands in the Index. With a few exceptions, each brand’s
customers are surveyed in the same quarter every year (each year, a different group of customers is
surveyed for each brand). After excluding government agencies and observations with missing data, our
sample includes 1621 annual observations, comprising 212 brands, in 35 different industries, spanning a
ten-year period 1994-2003 (some brands have fewer than ten observations because they do not enter the
ACSI until after 1994, or because they drop out of the sample through consolidation).
Variables
Customer Satisfaction. ACSI uses a multiple indicator approach to measure customer
satisfaction. A brand’s overall customer satisfaction is measured as a composite of three measures: (1) an
overall rating of satisfaction, (2) the degree to which performance falls short of or exceeds expectations,
and (3) a rating of performance relative to the customers’ ideal good or service in the category (Fornell,
Johnson, Anderson, Cha, & Bryant, 1996). Each of these three items is measured on a 10-point scale.
Customers’ responses are aggregated to the brand level, and overall customer satisfaction is reported on a
0-100 scale (Fornell et. al., 1996). Each brand’s rating represents “its customers’ overall evaluation of
total purchase and consumption experience, both actual and anticipated” (Fornell et. al., 1996: 7).
Rivals’ Customer Satisfaction. We compute the average customer satisfaction of all brands in the
same industry with distinct ownership. In some cases, the same corporation has more than one brand in
18
the same industry. For example, in the automobile industry, there are several different brands owned by
Ford Motor Co., each with a separate customer satisfaction rating. For each of these brands, we exclude
the satisfaction of the other brands owned by Ford in determining customer satisfaction with rival brands.
Market Structure. To measure market structure, we count the number of rival brands in the
industry. This measure is analogous to the count of rival stores used in Study One.
Sales Performance. We obtain annual sales data from Compustat.4 These data are usually
available only at the firm level. In a small number of cases, we are able to link segment-level sales data to
individual brands for firms that have brands in different industries. However, firms that have more than
one brand in the same industry receive the same sales value for each brand.
Merger Dummy. We control for the effect of acquisitions by including a merger dummy that
takes a value of one if the brand has changed ownership during any previous year within the study, or if
the brand’s parent company acquired another brand within the sample. For example, Hewlett-Packard
acquired Compaq in 2002. Therefore, the merger dummy takes a value of one for both Hewlett-Packard
and Compaq during 2002 and 2003.
Fixed Effects. We include brand, year, and quarter fixed effects. Brand fixed effects control for
differences across brands that might influence competitive conditions as well as the brand’s customer
satisfaction and/or sales. For example, more successful brands may have higher levels of customer
satisfaction and compete in markets with more competitors than their less successful counterparts. Year
fixed effects control for annual variation in customer satisfaction and sales. For example, during high
demand periods there may be both high levels of customer satisfaction and increasing numbers of rivals.
Quarter fixed effects control for seasonality differences affecting sales and customer satisfaction ratings.
Results
4 In this study, we measure sales in the same year that we measure customer satisfaction because lagging the customer satisfaction measure one year creates a very long lag for those firms whose ratings are determined in the first or second quarter of the year. When we lag customer satisfaction one year for all firms, the effect of rival customer satisfaction becomes statistically insignificant. However, when we lag customer satisfaction only for brands whose customers were surveyed in the third and fourth quarter, we find that the link between sales performance and rival’s customer satisfaction reported below is stronger than what we report below.
19
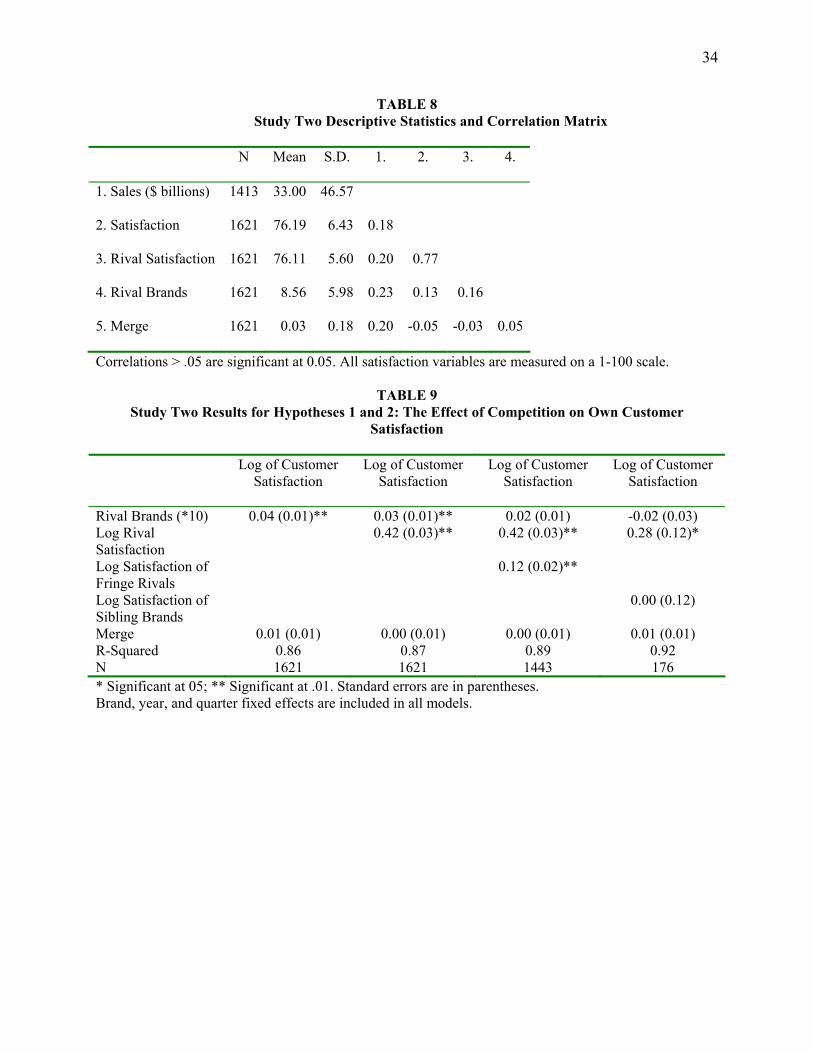
Table 8 provides descriptive statistics and a correlation matrix. Mean annual sales are about $33
billion, indicating that these are all leading national brands owned by large firms. The mean level of
customer satisfaction is 76, and there are no substantial differences between own and rival customer
satisfaction. The mean number of rival brands in a market is almost nine.
[Insert Table 8 about here]
To test our hypotheses, we conduct analyses similar to those that we carried out in Study One.
Table 9 reports the results for H1 and H2. We first examine the impact of market structure on a brand’s
customer satisfaction (H1). We report these results in column 1. The results indicate that the number of
rivals in the market has a positive impact on a brand’s own customer satisfaction. This result provides
support for H1. Each additional rival brand yields a 0.4% increase in a firm’s customer satisfaction rating.
To test H2, we include rivals’ customer satisfaction. Column 2 reports the results, which reveal that
rivals’ satisfaction has a positive effect on a brand’s own level of customer satisfaction. This provides
support for H2, indicating that a one percent increase in rivals’ customer satisfaction yields a 0.42 percent
increase in customer satisfaction of the focal brand. To further examine the impact of rivals’ satisfaction,
column 3 includes the average customer satisfaction rating for a set of smaller rivals (in each industry,
ACSI includes an aggregate customer satisfaction rating for a group of smaller brands that it labels “All
Others.”). The results indicate that satisfaction with these smaller rivals also has a positive, though
smaller impact on customer satisfaction (0.12 versus 0.42 for the major rivals). These results suggest that
the leading brands are more influenced by other market leaders than by smaller rivals in the industry.
[Insert Table 9 about here]
While these results are consistent with Hypothesis 2, which posits that rivals’ customer
satisfaction influences a firm’s own provision of customer satisfaction, we note above alternative
explanation for these results: some unobserved variable(s) may influence all firms’ satisfaction levels.
Although year and quarter fixed effects control for economy-wide changes in customer satisfaction, there
may be industry-specific factors that affect customer satisfaction. For example, the quality of a widely-
used input may increase, resulting in an industry-wide improvement in product quality.
20
To test this alternative explanation, we follow a similar approach to the one that we used in Study
One. Specifically, we compare the impact of the satisfaction of rival brands with the satisfaction of
“sibling” brands: brands in the same industry owned by the same parent company. For example, in the car
industry, Chevrolet and Buick are sibling brands, because they are both owned by General Motors. While
we expect rival brands to have a positive impact on a firm’s own level of customer satisfaction, we do not
expect sibling brands to do so, because they are not rivals. However, if there is some unobservable
factor(s) causing the satisfaction levels of all brands in the industry to rise, then this should result in a
positive correlation between a focal brand’s level of satisfaction and the satisfaction scores of its siblings.
We report the results of this analysis in column 4 of Table 9. The sample is much smaller because
there are only 176 observations in which a brand has at least one sibling brand in the same industry.
While rivals’ customer satisfaction continues to exert a positive effect on a brand’s customer satisfaction,
customer satisfaction of sibling brands has no effect. These results provide additional support for H2,
showing that the positive relationship between own and rival customer satisfaction reflects firms’ efforts
to respond to the threat posed by rivals improving their customer satisfaction and is not confounded by
unobserved factors that affect all brands’ customer satisfaction ratings.
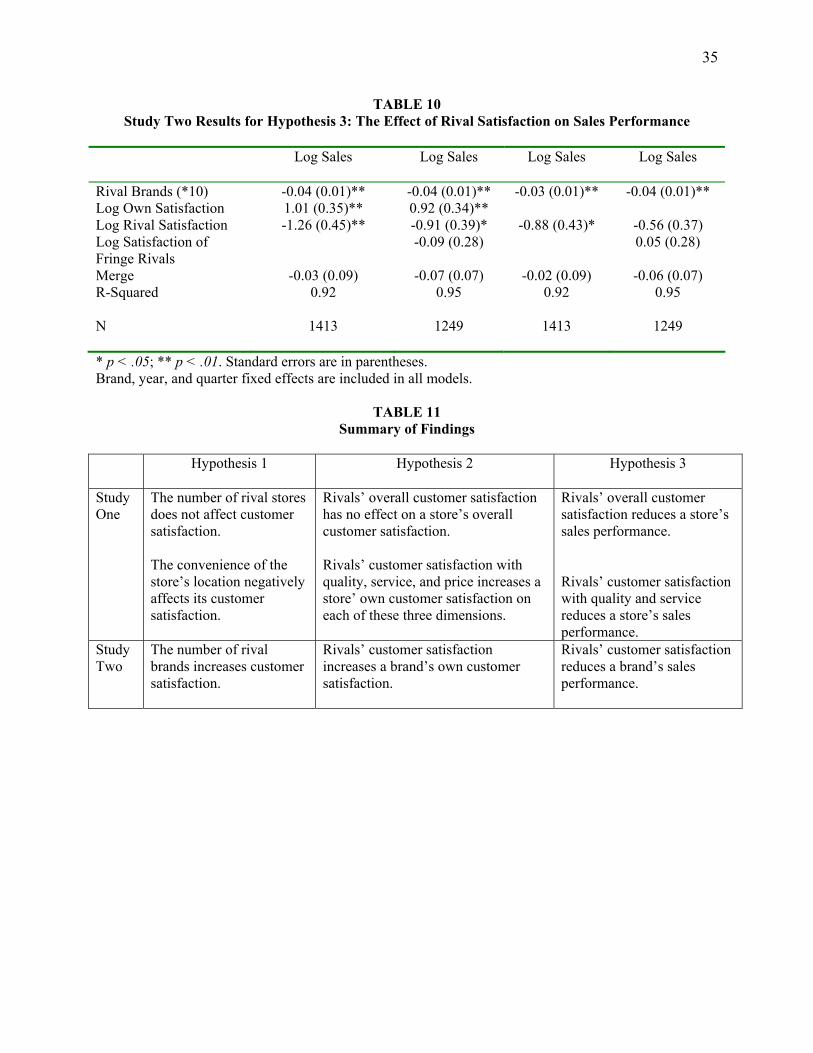
To test H3, we examine the impact of rival satisfaction on sales performance (Table 10). Column
1 includes a brand’s customer satisfaction along with the customer satisfaction of rival brands. While the
brand’s own customer satisfaction has a positive effect on its sales, rivals’ customer satisfaction has a
negative and statistically significant effect. This latter result provides support for H3. Moreover,
consistent with the results of Study One, the effect of rival satisfaction is larger than the effect of own
satisfaction. As rivals’ satisfaction increases by one percent, a brand’s sales declines by 1.26 percent,
while a one percent increase in own satisfaction yields only a 1.01 percent increase in sales. In column 2
we include the satisfaction of the smaller rival brands. The satisfaction level of the smaller rival brands
has no effect on sales. This again suggests that smaller rivals pose less of a threat to industry leaders.
[Insert Table 10 about here]
21
The results in the first two columns of Table 10 reveal the direct negative effect of rival customer
satisfaction. However, the results again suggest a positive indirect effect of rivals’ customer satisfaction,
through its positive effect on a brand’s own satisfaction. To assess the net effect of rivals’ customer
satisfaction on sales, we exclude the brand’s own customer satisfaction from the model. We report the
results in column 3. As we found in Study One, the effect of rivals’ customer satisfaction remains
negative, but is smaller, when we do not control for own customer satisfaction. This provides further
evidence that the net effect of rivals’ customer satisfaction is negative, and that this effect is weakened by
the focal firm’s response to the threat posed by rivals increasing their provision of customer satisfaction.
Taken together, these results provide strong support for Hypotheses 1-3. The results suggest that
the number of rival brands in an industry has a positive effect on customer satisfaction ratings, as does the
satisfaction ratings of these rivals. Moreover, rivals’ customer satisfaction ratings are economically
meaningful, as rival satisfaction has a negative and statistically significant effect on brand sales.
DISCUSSION AND CONCLUSION
Our results provide evidence that the amount of competition and the conduct of competitors
impact the provision of customer satisfaction, and that rivals’ customer satisfaction impacts a firm’s sales
performance (see Table 11 for a summary of our findings). The results extend two different perspectives
on competition, SCP and competitive dynamics, into the area of customer satisfaction, and show that
firms compete to provide better customer satisfaction, with this competition affecting sales.
[Insert Table 11 about here]
Regarding the impact of market structure, the results of Study One provide no evidence of a
relationship between the number of rival stores and customer satisfaction in the supermarket industry.
However, in Study Two we do find that the number of rival brands positively affects a brand’s customer
satisfaction. These results provide partial support for the SCP framework, which posits that the amount of
competition in a market positively influences the competitive conduct of firms in that market. While
many studies find that market structure affects prices, our results indicate that this relationship extends to
a firm’s overall customer satisfaction.
22
The mixed results that we find regarding the effect of market structure on customer satisfaction
may reflect the endogeneity of the market structure. For example, customers who are less satisfied with a
focal grocery store may be more likely to try other grocery stores. In addition, customers may be more
likely to evaluate firms on a relative basis (i.e, comparing the focal firm with its rivals) when there are
more grocery stores. Interestingly, in results not reported here, we find some evidence that initially
customer satisfaction increases with the number of rival stores, but then falls at higher levels. This
suggests that as the number of stores increases, the effect of relative rating and/or dissatisfied customers
switching to other stores may become more important.
Regarding the effect of rivals’ customer satisfaction, we find that grocery stores improve their
customer satisfaction ratings when rivals do. On each dimension of customer satisfaction we find a
positive relationship between own and rival satisfaction. These results show that customer satisfaction is
not simply a proxy for low prices in our data. They indicate that supermarkets compete on service and
quality, as well as on prices. In Study Two, we also find a positive relationship between own and rival
customer satisfaction. These results provide support for the competitive dynamics framework, which
emphasizes that firms’ competitive behavior is influenced by the competitive attacks of rivals.
Taken together, these results support our claim that customer satisfaction ratings may be used as
an indicator of a firm’s behavior. Underlying our hypotheses is the premise that a firm can influence its
customer satisfaction ratings through its actions. More intense competition and competitive attacks spur
firms to improve their customer satisfaction. We should not find support for these hypotheses if customer
satisfaction ratings do not reflect a firm’s efforts to enhance quality, service, and/or price. If not, it seems
likely that relative rating may induce a positive negative correlation between own and rival satisfaction,
which may help to explain why we do not find a positive relationship between own and rival overall
customer satisfaction in Study One. Relative rating seems likely in this context, where consumers rate
multiple stores, and especially so for overall customer satisfaction, where the survey does not focus on
any particular aspect of the store. The possibility of consumers using relative rating schemes makes the
23
positive effect of each dimension of rival satisfaction on own satisfaction even more notable, and suggests
that firms compete aggressively on customer satisfaction.
An alternative explanation for the positive relationship between own and rival customer
satisfaction is that other factors cause all firms’ satisfaction ratings to move together. But, we exclude this
possibility by showing that the same positive relationship does not exist between the satisfaction ratings
of stores (brands) owned by the same corporate parent. This provides strong evidence that it is the threat
created by rivals’ improving satisfaction that drives a firm to improve its own satisfaction.
Both studies provide evidence that rival satisfaction not only influences a firm’s behavior but also
impacts its sales. When rivals’ satisfaction rises, the focal firm’s sales declines. However, in both studies,
the net effect of rival satisfaction on sales is weakened by the focal firm’s efforts to improve its own
customer satisfaction when rivals increase their customer satisfaction.
Limitations and Future Research
A limitation of both studies is the use of customer satisfaction ratings to measure firm efforts to
enhance customer satisfaction. As we discuss above, while customer satisfaction ratings are a good
measure of consumer perceptions, they are a noisy measure of firms’ efforts to influence those
perceptions. Customers’ satisfaction with a firm may depend on their satisfaction with rival firms and on
other factors outside of the firm’s control. Despite this, we find support for our hypotheses, suggesting
that our results are robust. An additional limitation of both studies is the potential endogeneity of market
structure in the customer satisfaction models. It may be that unobserved changes in market conditions
may influence both competition and customer satisfaction. For example, if demand for a product
increases, then we might expect both entry and higher customer satisfaction, yielding a spurious positive
correlation between competition and customer satisfaction. There are some additional limitations in our
multi-industry analysis (Study Two). First, in most cases, the sales data are measured at the parent-
company level, rather than at the brand level. Second, our measure of market structure is noisy, as it
varies over time mainly due to consolidation and changes in the brands included in the ACSI.
24
Nonetheless, we believe that the results of Study Two suggest that the results regarding the effects of rival
customer satisfaction that we find for grocery stores in Study One generalize to a wide range of settings.
Future research should focus on identifying and measuring the specific actions that companies
take to increase their level of satisfaction with service, quality and price. This will help managers to
assess the costs of incorporating customer satisfaction into the competitive strategy of the firm as well as
its implications for profits. It will also help managers to determine which rival actions most threaten their
firm’s own customer satisfaction.
Conclusion
In this paper, we examine the competitive causes and consequences of customer satisfaction. We
provide evidence that competitive pressures spur firms to improve their provision of customer
satisfaction, that firms compete on multiple dimensions of customer satisfaction, and that this competition
impacts the firm’s revenues. We hope that our findings spur more research by scholars regarding the use
and effects of customer satisfaction as a competitive, strategic variable.
25
REFERENCES
Aaker, D., R. Jacobson. 1994. The financial information content of perceived quality. Journal of Marketing Research, 31 191-201. ACSI, 1999, 2001. American Customer Satisfaction Index Report. University of Michigan Business School: Ann Arbor. Anderson, E. 1996. Customer satisfaction and price tolerance. Marketing Letters, 7: 265-274. Anderson, E., Fornell, C., & Lehmann, D. 1994. Customer satisfaction, market share, and Profitability: Findings from Sweden. Journal of Marketing, 58: 53-66. Anderson, E., Fornell, C., & Rust, R. 1997. Customer satisfaction, productivity, and profitability: Differences between goods and services. Marketing Science, 16: 129-145. Baum, J. & Korn, H. 1996. Competitive dynamics of interfirm rivalry. Academy of Management Journal, 39: 255-291. Bresnahan, T., 1989. Empirical studies of industries with market power. In Handbook of Industrial Organization, Volume 2: 1011-1057. New York: Elsevier Science. Capon, N., Farley, J., & Hoeni, S. 1990. Determinants of financial performance: a meta-analysis. Management Science, 36: 1143-1159. Chen, M.J. 1996. Competitor analysis and interfirm rivalry: Toward a theoretical integration. Academy of Management Review, 21: 100-134. Chen, M.J. & Miller, D. 1994. Competitive attack, retaliation, and performance: An expectancy- valence framework. Strategic Management Journal, 15: 85-102. Chen, M.J., Smith, K.G., & Grimm, C. 1991. Action characteristics as predictors of responses. Management Science, 38: 439-455. Cohen, A., & Mazzeo, M. 2004. Competition, product differentiation and quality provision: An empirical equilibrium analysis of bank branching decisions. The Federal Reserve Board Finance and Economics Discussion Series, 2004-46. Dranove, D., & White, W. 1994. Recent theory and evidence on competition in hospital markets. Journal of Economics and Management Strategy, 3: 169-209. Domberger, S., & Sherr, A. 1989. The impact of competition on pricing and quality of legal services. International Review of Law and Economics, 9: 41-56. Estelami, H. 2000. Competitive and procedural determinants of delight and disappointment in consumer complaint outcomes. Journal of Service Research, 2: 285-300. Ferrier, W., Smith, K.G., & Grimm, C. 1999. The role of competitive action in market share erosion and industry dethronement: A study of industry leaders and challengers. Academy of Management Journal, 42: 372-388.
26
Fornell, C., 2001. The science of satisfaction. Harvard Business Review, 79: 120-121. Fornell, C., Johnson, M., Anderson, E., Cha, J., & Bryant, B. 1996. The American Customer Satisfaction Index: Nature, purpose, and findings. Journal of Marketing, 60: 7-18. Fornell, C., & Robinson, W. 1983. Industrial organization and consumer satisfaction/dissatisfaction. The Journal of Consumer Research, 9: 403-412. Gómez, M., McLaughlin, E., & Wittink, D. 2004. Customer satisfaction and retail sales performance: An empirical investigation. Journal of Retailing. 80: 265-278. Ittner, C., D. Larker. 1998. Are non-financial measures leading indicators of financial performance? An analysis of customer satisfaction. Journal of Accounting Research, 36 1-35. Januszewski, S. 2004. The effect of air traffic delays on airline prices. Social Science Research Network Working Paper Series. Liao, H., & Chuang, A. 2004. A multilevel investigation of factors influencing employee service performance and customer outcomes. Academy of Management Journal, 47: 41-58. Mazzeo, M. 2003. Competition and service quality in the U.S. airline industry. Review of Industrial Organization, 22: 275–296.
Post, J., Preston, L., & Sachs, S. 2002. Managing the extended enterprise: The new stakeholder view. California Management Review, 45: 6-28.
Rust, R., Zahorik, A., & Keiningham, T. 1995. Return on quality (ROQ): Making service quality financially accountable. Journal of Marketing, 59: 58-70. Young, G. Smith, K.G., & Grimm, C. 1996. Austrian and industrial organization perspectives on firm-level competitive activity and performance. Organization Science, 7: 243-254.
27
TABLE 1 Customer Satisfaction Dimensions and Survey Items
Satisfaction Dimension Survey Items
Service Reliability Alpha = 0.87
Fast check out service Extremely helpful employees Excellent service in the deli
Quality Reliability Alpha = 0.94
High quality in-store bakery High quality seafood Excellent quality fresh fruits and vegetables High quality deli meats and salads High quality fresh meat Carries all the grocery items, brands, and sizes Fresh, high quality dairy products Strict sanitation standards
Price Reliability Alpha = 0.75
Overall, has low everyday prices Has great sales in its store circular Always has the items advertised in their circular in stock.
28
TABLE 2 Study One Descriptive Statistics and Correlation Matrix
N Mean S.D. 1. 2. 3. 4. 5. 6. 7. 8. 9.
1. Sales ($ millions)a 578 36.42 10.31
2. Overall Satisfaction 578 4.07 0.15 0.15
3. Satisfaction with Quality 561 4.05 0.14 0.17 0.82
4. Satisfaction with Service 578 3.93 0.15 -0.00 0.81 0.79
Correlations > .08 are significant at 0.05. All satisfaction variables are measured on a 1-5 scale. a Log of Sales is used to calculate the correlations.
29
TABLE 3 Study One Results for Hypothesis 1: The Effect of Market Structure on Customer Satisfaction
Married -0.03 (0.05) -0.02 (0.05) -0.00 (0.05) 0.03 (0.05) Children -0.00 (0.04) 0.03 (0.04) 0.04 (0.04) 0.02 (0.04) Age 0.06 (0.03)* 0.05 (0.03) 0.08 (0.03)* 0.07 (0.03)* Income 0.04 (0.02) 0.03 (0.02) 0.05 (0.02)* 0.05 (0.02)* Remodel 0.01 (0.01) 0.00 (0.01) -0.01 (0.02) 0.01 (0.02) R-Squared 0.69 0.68 0.64 0.74 N 578 561 578 578 * Significant at 05; ** Significant at .01. Standard errors are in parentheses. Store and year fixed effects are included in all models. a Logarithm.
31
TABLE 5 Study One Additional Results for Hypothesis 2: Controlling for Satisfaction of Sibling Stores
Overall
Customer Satisfaction
Satisfaction with Quality
Satisfaction with Service
Satisfaction with Price
Overall Rival Customer Satisfaction
-0.03 (0.05)
Satisfaction with Rival Quality 0.17 (0.05)** Satisfaction with Rival Service 0.26 (0.05)** Satisfaction with Rival Price 0.15 (0.06)** Overall Sibling Satisfaction -0.02 (0.02) Satisfaction with Sibling Quality
0.05 (0.02)*
Satisfaction with Sibling Service
0.05 (0.02)*
Satisfaction with Sibling Price -0.01 (0.02) Rival Stores (*10) 0.01 (0.03) 0.01 (0.03) 0.00 (0.03) 0.02 (0.03) Most Convenient -0.66 (0.10)** -0.50 (0.10)** -0.54 (0.10)** -0.91 (0.11)** Employeesa 0.07 (0.06) 0.07 (0.05) 0.17 (0.06)** 0.14 (0.07)* Turnover Rate 0.07 (0.04) 0.06 (0.04) 0.15 (0.05)** 0.07 (0.05) Percent Full-Time Employees -0.03 (0.06) -0.01 (0.06) -0.11 (0.07) 0.17 (0.07)* Married -0.02 (0.05) -0.01 (0.05) 0.00 (0.05) 0.05 (0.05) Children 0.00 (0.04) 0.02 (0.04) 0.02 (0.04) 0.03 (0.05) Age 0.07 (0.03)* 0.05 (0.03) 0.08 (0.03)* 0.08 (0.04)* Income 0.03 (0.02) 0.02 (0.02) 0.04 (0.02) 0.05 (0.02)* Remodel 0.01 (0.01) 0.00 (0.01) -0.01 (0.02) 0.02 (0.02) R-Squared 0.69 0.68 0.65 0.72 N 551 532 547 550 * Significant at 05; ** Significant at .01. Standard errors are in parentheses. Store and year fixed effects are included in all models. a Logarithm.
32
TABLE 6 Study One Results for Hypothesis 3: The Effect of Rival Customer Satisfaction on Store Sales
Performance
Log Sales Performance
Log Sales Performance
Log Sales Performance
Log Sales Performance
Overall Customer Satisfaction
0.06 (0.03)*
Satisfaction with Quality
0.03 (0.03)
Satisfaction with Service
0.07 (0.03)*
Satisfaction with Price 0.04 (0.03) Overall Rival Customer Satisfaction
Married 0.03 (0.03) 0.01 (0.03) 0.02 (0.03) 0.02 (0.03) Children -0.05 (0.02)* -0.05 (0.02)* -0.05 (0.02)* -0.05 (0.02)* Age -0.03 (0.02) -0.03 (0.02) -0.03 (0.02) -0.03 (0.02) Income 0.01 (0.01) 0.01 (0.01) 0.01 (0.01) 0.01 (0.01) Remodel 0.01 (0.01) 0.01 (0.01) 0.01 (0.01) 0.01 (0.01) R-Squared 0.97 0.97 0.97 0.97 N 578 561 578 578 * Significant at 05; ** Significant at .01. Standard errors are in parentheses. Store and year fixed effects are included in all models. a Logarithm.
33
TABLE 7 Study One Additional Analysis: The Net Effect of Rival Customer Satisfaction on Store Sales
Married 0.03 (0.03) 0.01 (0.03) 0.02 (0.03) 0.03 (0.03) Children -0.05 (0.02)* -0.05 (0.02)* -0.05 (0.02)* -0.05 (0.02)* Age -0.03 (0.02) -0.03 (0.02) -0.03 (0.02) -0.03 (0.02) Income 0.01 (0.01) 0.01 (0.01) 0.01 (0.01) 0.01 (0.01) Remodel 0.01 (0.01) 0.01 (0.01) 0.01 (0.01) 0.01 (0.01) R-Squared 0.97 0.97 0.97 0.97 N 578 561 578 578 * Significant at 05; ** Significant at .01. Standard errors are in parentheses. Store and year fixed effects are included in all models. a Logarithm.
34
TABLE 8 Study Two Descriptive Statistics and Correlation Matrix
N Mean S.D. 1. 2. 3. 4.
1. Sales ($ billions) 1413 33.00 46.57
2. Satisfaction 1621 76.19 6.43 0.18
3. Rival Satisfaction 1621 76.11 5.60 0.20 0.77
4. Rival Brands 1621 8.56 5.98 0.23 0.13 0.16
5. Merge 1621 0.03 0.18 0.20 -0.05 -0.03 0.05
Correlations > .05 are significant at 0.05. All satisfaction variables are measured on a 1-100 scale.
TABLE 9 Study Two Results for Hypotheses 1 and 2: The Effect of Competition on Own Customer
Merge 0.01 (0.01) 0.00 (0.01) 0.00 (0.01) 0.01 (0.01) R-Squared 0.86 0.87 0.89 0.92 N 1621 1621 1443 176 * Significant at 05; ** Significant at .01. Standard errors are in parentheses. Brand, year, and quarter fixed effects are included in all models.
35
TABLE 10 Study Two Results for Hypothesis 3: The Effect of Rival Satisfaction on Sales Performance
* p < .05; ** p < .01. Standard errors are in parentheses. Brand, year, and quarter fixed effects are included in all models.
TABLE 11 Summary of Findings
Hypothesis 1 Hypothesis 2 Hypothesis 3
Study One
The number of rival stores does not affect customer satisfaction. The convenience of the store’s location negatively affects its customer satisfaction.
Rivals’ overall customer satisfaction has no effect on a store’s overall customer satisfaction. Rivals’ customer satisfaction with quality, service, and price increases a store’ own customer satisfaction on each of these three dimensions.
Rivals’ overall customer satisfaction reduces a store’s sales performance. Rivals’ customer satisfaction with quality and service reduces a store’s sales performance.
Study Two
The number of rival brands increases customer satisfaction.
Rivals’ customer satisfaction increases a brand’s own customer satisfaction.
Rivals’ customer satisfaction reduces a brand’s sales performance.
36
APPENDIX A
Elements of the Customer Satisfaction Survey
1. Having strict sanitation standards.
2. Carrying all the grocery items, brands, and sizes you use.
3. Always having fresh, high quality dairy products.
4. Having excellent quality fresh fruits & vegetables.
5. Having high quality fresh meat
6. Having high quality deli meats and salads.
7. Providing excellent service in the deli.
8. Having extremely helpful employees.
9. Having fast check out service.
10. Overall, having low everyday prices.
11. Having great sales in its weekly store circular.
12. Always having the items advertised in their circular in stock.