Learn when it’s best to utilize short put strategies, how to build, evaluate and manage these strategies.
2 2
Disclosures
Options’ trading entails significant risk and is not appropriate for all investors. Certain complex options strategies carry additional risk. Before trading options, please read Characteristics and Risks of Standardized Options, and call 800-544- 5115 to be approved for options trading. Supporting documentation for any claims, if applicable, will be furnished upon request.
Examples in this presentation do not include transaction costs (commissions, margin interest, fees) or tax implications, but they should be considered prior to entering into any transactions.
The information in this presentation, including examples using actual securities and price data, is strictly for illustrative and educational purposes only and is not to be construed as an endorsement or recommendation.
Goal of this webinar: To educate traders on when they can utilize short put strategies. Also to show how to build, evaluate, and manage these trades.
What we will cover:
➢ Explanation of the strategy
➢ Different reasons for selling puts
➢ Ways to generate put selling opportunities
➢ Choosing the appropriate strike and expiration to match your outlook and objective
➢ Evaluating the risks of the strategy
➢ Discuss different ways to manage the strategy
4 4
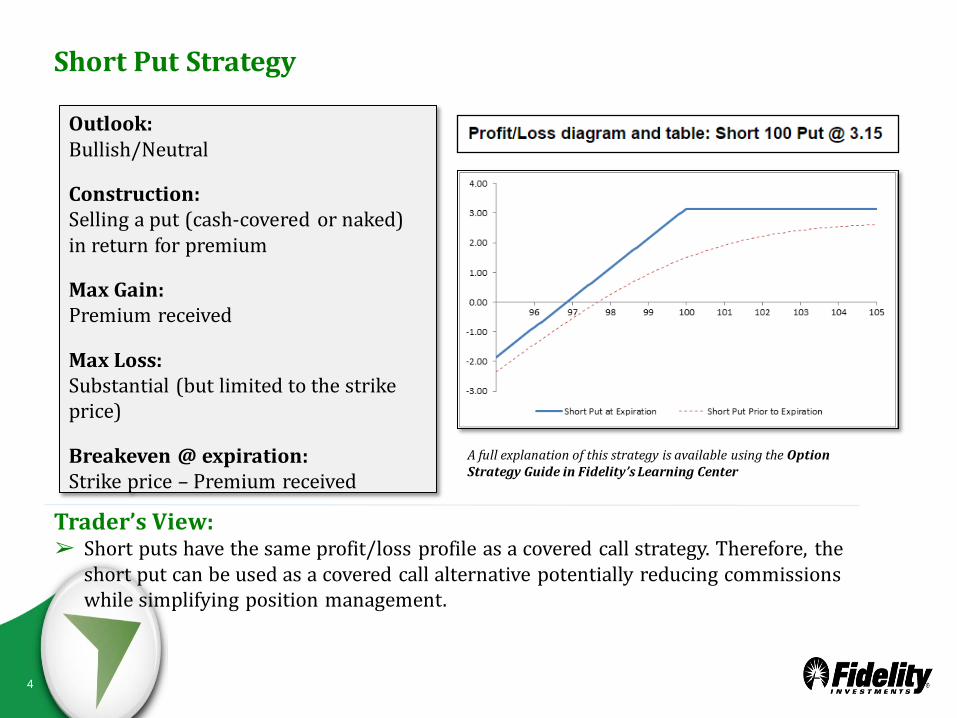
Outlook: Bullish/Neutral Construction: Selling a put (cash-covered or naked) in return for premium Max Gain: Premium received Max Loss: Substantial (but limited to the strike price) Breakeven @ expiration: Strike price – Premium received
A full explanation of this strategy is available using the Option Strategy Guide in Fidelity’s Learning Center
Short Put Strategy
Trader’s View: ➢ Short puts have the same profit/loss profile as a covered call strategy. Therefore, the
short put can be used as a covered call alternative potentially reducing commissions while simplifying position management.
5 5
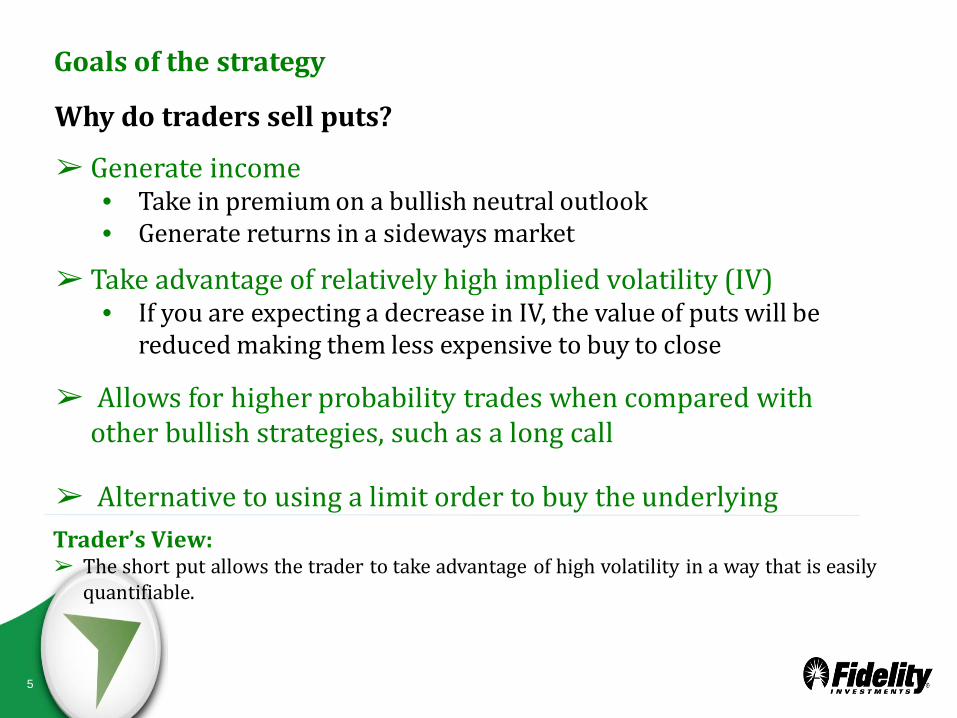
Why do traders sell puts?
➢ Generate income • Take in premium on a bullish neutral outlook • Generate returns in a sideways market
➢ Take advantage of relatively high implied volatility (IV) • If you are expecting a decrease in IV, the value of puts will be
reduced making them less expensive to buy to close
➢ Allows for higher probability trades when compared with other bullish strategies, such as a long call
➢ Alternative to using a limit order to buy the underlying
Goals of the strategy
Trader’s View: ➢ The short put allows the trader to take advantage of high volatility in a way that is easily
quantifiable.
6 6
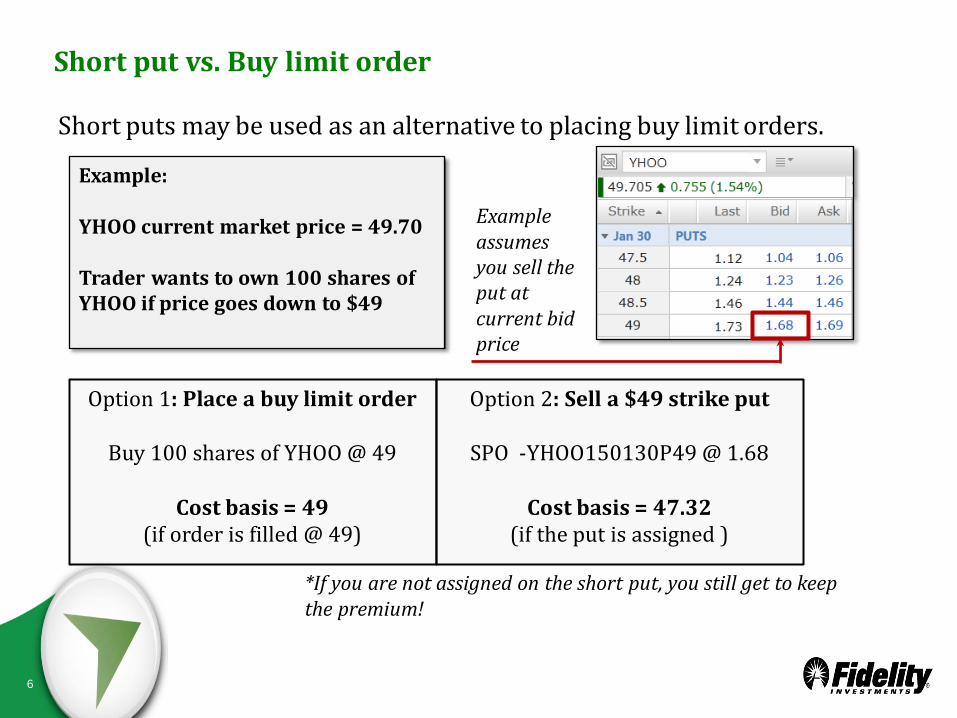
Short put vs. Buy limit order
Short puts may be used as an alternative to placing buy limit orders.
Example: YHOO current market price = 49.70 Trader wants to own 100 shares of YHOO if price goes down to $49
Option 1: Place a buy limit order
Buy 100 shares of YHOO @ 49
Cost basis = 49 (if order is filled @ 49)
Option 2: Sell a $49 strike put
SPO -YHOO150130P49 @ 1.68
Cost basis = 47.32 (if the put is assigned )
Example assumes you sell the put at current bid price
*If you are not assigned on the short put, you still get to keep the premium!
7 7
Risk Management
Profit/Loss calculator in ATP: Simulated a short GLD Feb 20 121 Put, GLD trading @ 124.31
The Greek exposure of a short put might be the reason a trader chooses this strategy over another bullish strategy, such as a long call.
Bullish directional bias : 32 long share exposure Accelerated losses, decelerated gains Profit $4.45 with each passing day Profit $12.58 with each 1% decrease in IV
Delta (+) Gamma (-) Theta (+) Vega (-)
8 8
Implied Volatility Short puts allow the trader to capitalize when anticipating a decrease in implied volatility (IV).
Short GLD Feb 121 Put
➢Vega = -12.57
➢Strategy gains $12.57 with a 1% decrease in IV
➢Strategy loses $12.57 with a 1% increase in IV
9 9
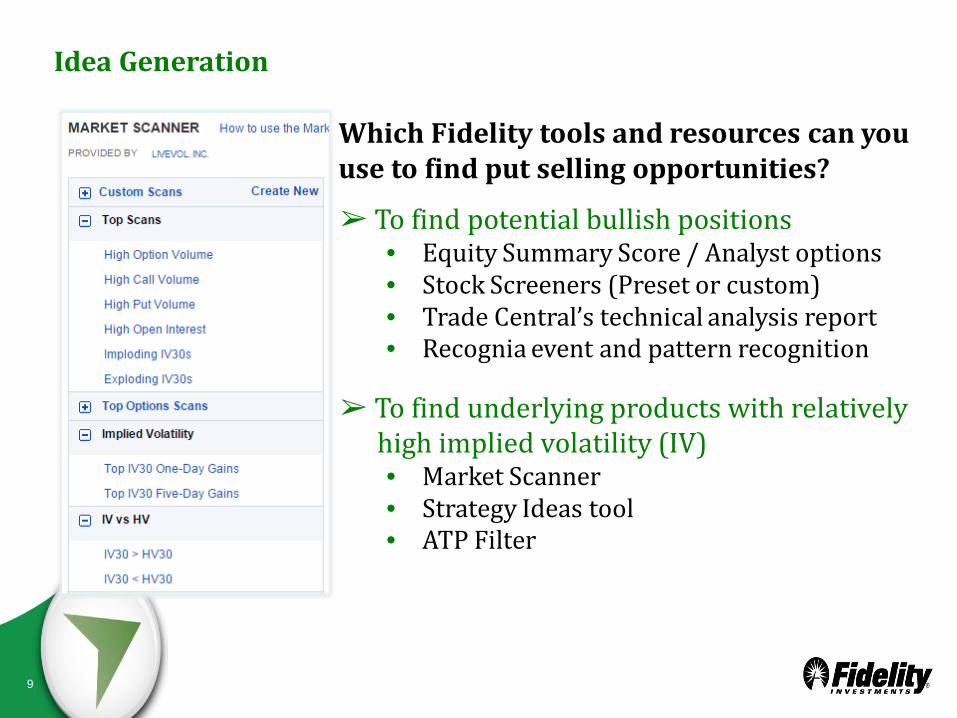
Which Fidelity tools and resources can you use to find put selling opportunities?
➢ To find underlying products with relatively high implied volatility (IV)
• Market Scanner • Strategy Ideas tool • ATP Filter
Idea Generation
10 10
Idea Generation
➢ Strategy Ideas tool – Cash Covered Puts
Looks for high yields on OTM puts by comparing Yield to Strike (YTS) Bid/Strike price = .56/6 = .093 = 9.30% YTS
11 11
Strike Selection
ITM $16 Put ➢ Premium received = $1.58 ➢ Break-even = $14.42 ➢ Probability of assignment 61%
ATM $15 Put
➢ Premium received = $.97 ➢ Break-even = $14.03 ➢ Probability of assignment 46%
OTM $14 Put ➢ Premium received = $.54 ➢ Break-even = $13.46 ➢ Probability of assignment 31%
Consider tradeoffs when choosing strikes :
Trader’s View: ➢ Selling an ITM put is a strategy which may be used in an attempt to acquire the stock at a
discount. Be careful though – if the price goes up, you could miss out on the opportunity.
12 12
Strike Selection
In-the-Money (ITM)
At-the-Money (ATM)
Out-of-the Money (OTM)
Common Use An alternative to placing a buy limit order
ATM options have the most time value
Income generation Premium selling
Probability Highest probability of being assigned
Probability of being assigned≈ 50%
Lowest probability of being assigned
Premium/ Risk
Highest premium received
Offers the most exposure to time decay (highest
Theta)
Highest gamma risk
Lowest premium received
Position Management
More Aggressive (More bullish)
Balance exposure to small
price moves by ≈ 50%
More conservative (Less bullish)
Consider your goals and objective for the trade:
13 13
Additional forms of analysis may cause a trader to be more aggressive or passive in their strike selection…looking at key support levels is one example
Strike Selection
14 14
Expiration Selection
Time decay typically accelerates as expiration comes closer, meaning shorter term options have the highest time decay.
15 15
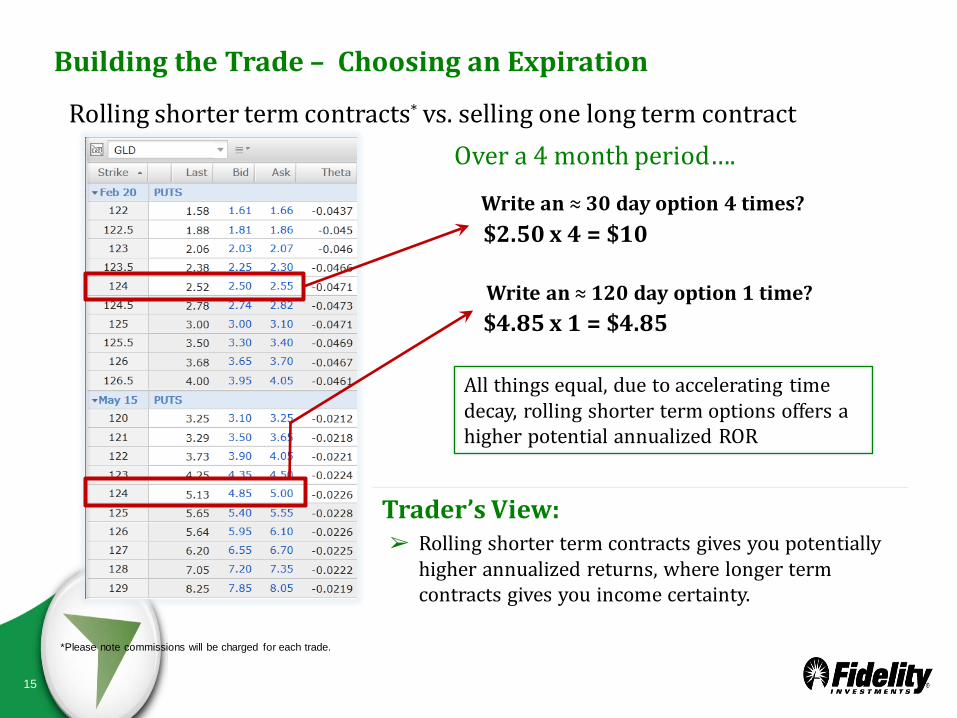
Rolling shorter term contracts* vs. selling one long term contract
Building the Trade – Choosing an Expiration
Over a 4 month period….
Write an ≈ 30 day option 4 times? $2.50 x 4 = $10 Write an ≈ 120 day option 1 time? $4.85 x 1 = $4.85
All things equal, due to accelerating time decay, rolling shorter term options offers a higher potential annualized ROR
Trader’s View: ➢ Rolling shorter term contracts gives you potentially
higher annualized returns, where longer term contracts gives you income certainty.
*Please note commissions will be charged for each trade.
16 16
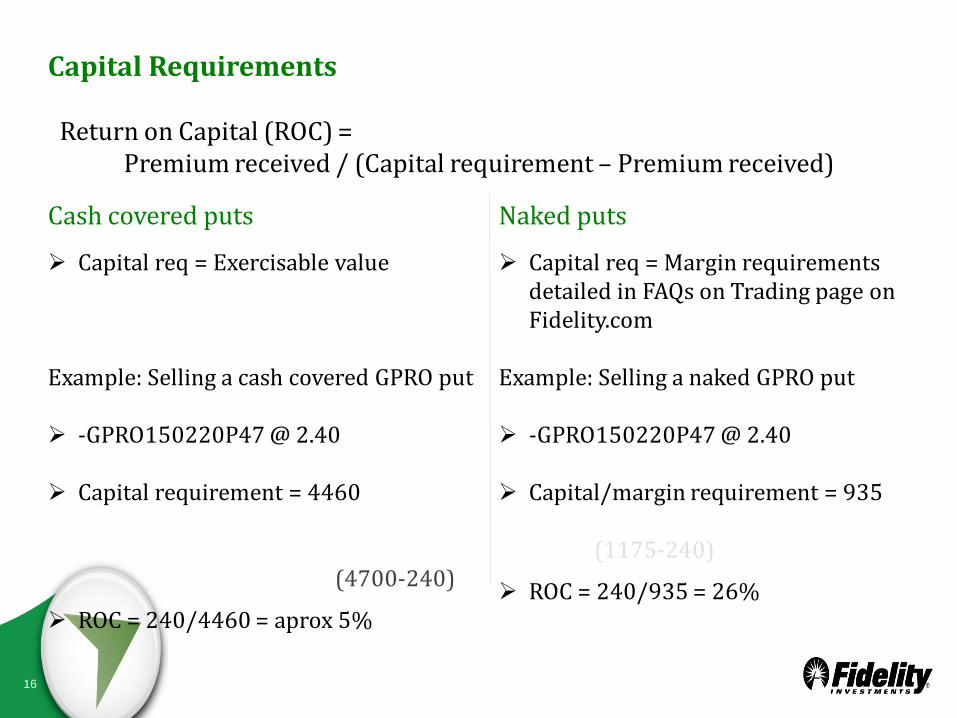
Capital Requirements
Return on Capital (ROC) = Premium received / (Capital requirement – Premium received)
Cash covered puts
Capital req = Exercisable value
Example: Selling a cash covered GPRO put -GPRO150220P47 @ 2.40 Capital requirement = 4460
(4700-240)
ROC = 240/4460 = aprox 5%
Naked puts
Capital req = Margin requirements detailed in FAQs on Trading page on Fidelity.com
Example: Selling a naked GPRO put -GPRO150220P47 @ 2.40
Capital/margin requirement = 935
(1175-240)
ROC = 240/935 = 26%
17 17
Position Management
A trader has 3 ways they can manage any strategy:
Trader’s View: Be honest with yourself when re-evaluating an existing trade and manage accordingly. Don’t
fall into the trap of making adjustments without considering the end objective of the trade.
Option 1: Leave the strategy alone Makes Sense When: I would put the same trade on today
Option 2: Close the strategy Makes Sense When: The strategy no longer aligns with the outlook
Option 3: Adjust the strategy Makes Sense When: The existing strategy can be altered to better align with the
outlook
18 18
Exit strategy: Upside: If stock is above strike price, you can potentially keep the full premium.
• Trader receives max gain if put is held to expiration - No commission charged • Establish a predetermined profit target to close trade Less profit potential but the trade off is a higher probability of profit
Downside: Potential for substantial loss if stock falls. • Have predefined risk levels in place should this happen (i.e., percentage of loss
you are willing to accept, falls below major support level or change in trend)
Potential adjustments: Let stock be assigned, potentially sell covered calls against it Roll the option out (new outlook on stock should match strategy) Define risk from the beginning by creating a spread
Position Management
19 19
➢ Selling puts is a popular strategy used to generate income on an underlying product that a trader has a neutral to bullish outlook and a bearish volatility outlook
➢ Selling a put can be used instead of placing a buy limit order when a trader is looking to
establish a long stock position at a specified price. The benefit is that the premium can potentially reduce the cost basis of the long shares if assigned. However, like a buy limit order getting the long shares of stock is not guaranteed.
➢ Fidelity has tools and resources to help you generate ideas for this strategy whether your objective is to generate income, establish bullish directional exposure, take advantage of decreasing implied volatility or to get long shares of the underlying.
➢ Tradeoffs should be considered during the strike selection process. Consider the
potential rate of return vs. the risks being taken (probability of assignment, probability of profit, etc.)
➢ Proper risk management is being able to look at a strategy and determine if it makes
Thank you for attending. To Register, please visit the Fidelity.com Learning Center https://www.fidelity.com/learning-center For additional support, please contact a Fidelity representative at (877) 907-4429.