1 The Compression of Electric Signal Waveforms for Smart Grids: State of the Art and Future Trends Michel P. Tcheou, Member, IEEE, Lisandro Lovisolo, Member, IEEE, Moises V. Ribeiro, Senior Member, IEEE, Eduardo A. B. da Silva, Senior Member, IEEE, Marco A. M. Rodrigues, Senior Member, IEEE, João M. T. Romano, Senior Member, IEEE, Paulo S. R. Diniz, Fellow, IEEE Abstract—In this paper, we discuss the compression of wave- forms obtained from measurements of power system quantities and analyze the reasons why its importance is growing with the advent of smart grid systems. While generation and transmission networks already use a considerable number of automation and measurement devices, a large number of smart monitors and meters are to be deployed in the distribution network to allow broad observability and real-time monitoring. This situation cre- ates new requirements concerning the communication interface, computational intelligence and the ability to process data or signals and also to share information. Therefore, a considerable increase in data exchange and in storage is likely to occur. In this context, one must achieve an efficient use of channel communi- cation bandwidth and a reduced need of storage space for power system data. Here, we review the main compression techniques devised for electric signal waveforms providing an overview of the achievements obtained in the past decades. Additionally, we envision some smart grid scenarios emphasizing open research issues regarding compression of electric signal waveforms. We expect that this paper will contribute to motivate joint research efforts between electrical power system and signal processing communities in the area of signal waveform compression. Index Terms—electric power systems, signal compression, smart grid, data compression. I. I NTRODUCTION There has been a growing need to correctly characterize the behavior of electric power systems [1]–[4]. Around two decades ago, due to worldwide electric power energy sector deregulation, end users and utility companies started being concerned with the impacts caused by power quality problems. These problems also arise due to the massive use of non- linear loads and electronic-based equipment in residences, commercial centers, and industrial plants. In addition, it was perceived that those impairments could escalate if not correctly tackled. Therefore, the monitoring of electric power systems in real-time, along with off-line analysis using both centralized and decentralized schemes, has grown in importance. Several technologies have arisen aiming at monitoring the behavior of electric power systems in different levels: high voltage (HV), medium voltage (MV) and low-voltage (LV) [5]. Those factors pushed forward the development of mathe- matical tools, which are often based on digital signal pro- cessing techniques, for analyzing electric power system ap- plications [1]–[4], [6]. These techniques have been used to extract relevant features, characteristics and information from measured quantities and their waveforms in order to feed high- level monitoring, diagnosis, metering and modeling, as well as prediction solutions [2]–[4], [6]–[8]. Currently, the electric energy sector is facing a new rev- olution with the purpose of making the electrical grid more flexible, reliable, reconfigurable, efficient, secure, green, sus- tainable, intelligent, adaptable, and observable at all volt- age levels. Therefore, smart(er) grids are being investigated and deployed to change the way electric power systems are planned, designed, managed, monitored, and operated. Smart grids congregate the use of information and communication technologies, sensing, measurement, monitoring and control technologies to deal with the complex system that consti- tutes the electric power systems [9]–[14]. Anticipating this tendency, nations around the world, standardization forums, regulatory authorities as well as companies and Research, Development and Innovation institutes have started to work on this challenging and promising field. According to the smart grid concepts [9]–[14], devices connected to power grids have a communication interface, some intelligence and ability to process data or signals and also to share information. Therefore, a considerable increase in data exchange and storage is likely to occur. In this context, one must seek an efficient use of channel communication band- width and a reduced storage requirement for power system data with for both immediate and long availabilities. Data compression encompasses techniques capable of representing information in a compact form. These compact representations are obtained by identifying and using structures that exist in the data. When digitizing a constant envelope sinusoid, we would spend a great amount of bits to encode its samples. However, we could represent this signal in a compact form with respect to amplitude, frequency and phase. Instead of encoding a large amount of samples, we could encode only three parameters. Therefore, the development of efficient algo- rithms for the compression of signal waveforms and ancillary data is of paramount importance for devising smart and powerful monitoring, diagnosis, and metering equipments that will contribute to successful smart grid deployments [9]–[22]. Although one notes that a considerable amount of effort was spent in this field in the past two decades [16]–[20], [23]– [56], an analysis of the main contributions reveals that the compression of signal waveforms from power systems (that we will refer to as “electric signals” for simplicity and for being in accordance with the literature) is far from being as mature as for speech, image, and video compression. Therefore, there is room for research, development and improvements in this field. In fact, smart grids will demand electric signal and ancillary data compression techniques that are suitable for distinct applications, such as protection, monitoring, metering, synchrophasor measurements, and diagnosis, just to mention a few. Most electric signals compression techniques try to address the needs related to power quality analysis, which depend upon the characterization of electric signals (voltage and current). There are a few works that analyze the role of lossless compression techniques applied to data gathered in a power monitor or power meter [7], [17], [44], [46], [57], [58]. One of the leading power quality storage formats for electric power
Transcript
1
The Compression of Electric Signal Waveforms forSmart Grids: State of the Art and Future Trends
Michel P. Tcheou,Member, IEEE,Lisandro Lovisolo,Member, IEEE,Moises V. Ribeiro,Senior Member, IEEE,Eduardo A. B. da Silva,Senior Member, IEEE,Marco A. M. Rodrigues,Senior Member, IEEE,
João M. T. Romano,Senior Member, IEEE,Paulo S. R. Diniz,Fellow, IEEE
Abstract—In this paper, we discuss the compression of wave-forms obtained from measurements of power system quantitiesand analyze the reasons why its importance is growing with theadvent of smart grid systems. While generation and transmissionnetworks already use a considerable number of automation andmeasurement devices, a large number of smart monitors andmeters are to be deployed in the distribution network to allowbroad observability and real-time monitoring. This situation cre-ates new requirements concerning the communication interface,computational intelligence and the ability to process dataorsignals and also to share information. Therefore, a considerableincrease in data exchange and in storage is likely to occur. In thiscontext, one must achieve an efficient use of channel communi-cation bandwidth and a reduced need of storage space for powersystem data. Here, we review the main compression techniquesdevised for electric signal waveforms providing an overview ofthe achievements obtained in the past decades. Additionally, weenvision some smart grid scenarios emphasizing open researchissues regarding compression of electric signal waveforms. Weexpect that this paper will contribute to motivate joint researchefforts between electrical power system and signal processingcommunities in the area of signal waveform compression.
Index Terms—electric power systems, signal compression,smart grid, data compression.
I. I NTRODUCTION
There has been a growing need to correctly characterizethe behavior of electric power systems [1]–[4]. Around twodecades ago, due to worldwide electric power energy sectorderegulation, end users and utility companies started beingconcerned with the impacts caused by power quality problems.These problems also arise due to the massive use of non-linear loads and electronic-based equipment in residences,commercial centers, and industrial plants. In addition, itwasperceived that those impairments could escalate if not correctlytackled. Therefore, the monitoring of electric power systemsin real-time, along with off-line analysis using both centralizedand decentralized schemes, has grown in importance. Severaltechnologies have arisen aiming at monitoring the behaviorofelectric power systems in different levels: high voltage (HV),medium voltage (MV) and low-voltage (LV) [5].
Those factors pushed forward the development of mathe-matical tools, which are often based on digital signal pro-cessing techniques, for analyzing electric power system ap-plications [1]–[4], [6]. These techniques have been used toextract relevant features, characteristics and information frommeasured quantities and their waveforms in order to feed high-level monitoring, diagnosis, metering and modeling, as well asprediction solutions [2]–[4], [6]–[8].
Currently, the electric energy sector is facing a new rev-olution with the purpose of making the electrical grid moreflexible, reliable, reconfigurable, efficient, secure, green, sus-tainable, intelligent, adaptable, and observable at all volt-age levels. Therefore, smart(er) grids are being investigated
and deployed to change the way electric power systems areplanned, designed, managed, monitored, and operated. Smartgrids congregate the use of information and communicationtechnologies, sensing, measurement, monitoring and controltechnologies to deal with the complex system that consti-tutes the electric power systems [9]–[14]. Anticipating thistendency, nations around the world, standardization forums,regulatory authorities as well as companies and Research,Development and Innovation institutes have started to workon this challenging and promising field.
According to the smart grid concepts [9]–[14], devicesconnected to power grids have a communication interface,some intelligence and ability to process data or signals andalsoto share information. Therefore, a considerable increase in dataexchange and storage is likely to occur. In this context, onemust seek an efficient use of channel communication band-width and a reduced storage requirement for power systemdata with for both immediate and long availabilities. Datacompression encompasses techniques capable of representinginformation in a compact form. These compact representationsare obtained by identifying and using structures that existinthe data. When digitizing a constant envelope sinusoid, wewould spend a great amount of bits to encode its samples.However, we could represent this signal in a compact formwith respect to amplitude, frequency and phase. Instead ofencoding a large amount of samples, we could encode onlythree parameters. Therefore, the development of efficient algo-rithms for the compression of signal waveforms and ancillarydata is of paramount importance for devising smart andpowerful monitoring, diagnosis, and metering equipments thatwill contribute to successful smart grid deployments [9]–[22].
Although one notes that a considerable amount of effort wasspent in this field in the past two decades [16]–[20], [23]–[56], an analysis of the main contributions reveals that thecompression of signal waveforms from power systems (that wewill refer to as “electric signals” for simplicity and for beingin accordance with the literature) is far from being as matureas for speech, image, and video compression. Therefore, thereis room for research, development and improvements in thisfield. In fact, smart grids will demand electric signal andancillary data compression techniques that are suitable fordistinct applications, such as protection, monitoring, metering,synchrophasor measurements, and diagnosis, just to mentiona few. Most electric signals compression techniques try toaddress the needs related to power quality analysis, whichdepend upon the characterization of electric signals (voltageand current).
There are a few works that analyze the role of losslesscompression techniques applied to data gathered in a powermonitor or power meter [7], [17], [44], [46], [57], [58]. Oneof the leading power quality storage formats for electric power
2
system waveforms is the PQDIF (Power Quality Data Inter-change Format) which is defined by the IEEE1159 WorkingGroup and also provides a lossless compression option [59].From a signal processing point of view, the lossy compressionalgorithms proposed so far for electric signals can be groupedinto three main classes: (i) transform-based coding [20], [23]–[26], [29]–[47], [60]; (ii) parametric coding [48]–[50] and (iii)mixed parametric and transform coding [51]–[55], [61].
This paper is organized as follows: Section II gives a generaloverview of the power system infrastructure and outlines theintrinsic phenomena normally recorded or measured in electricsignals. Being aware of these phenomena allows compact sig-nal representations, which is a important feature for the designof efficient compression frameworks; Section III presents themethods found in literature so far applied for compressingelectric signals and reports their compression performance;Section IV indicates the future trends and open issues forresearch and development of compression techniques for smartgrid applications; finally, Section V presents the concludingremarks.
II. CHARACTERISTICS OF ELECTRIC SIGNALS
Electric power systems may be modeled as consisting offour main components: i) production or generation and cogen-eration; ii) transmission; iii) distribution; iv) consumption. Asimplified diagram for an electric power system is depictedin Fig. 1. Generally, the generator delivers energy at 13.8kV level and this voltage is stepped up in the generationsubstation so that the energy is transmitted by using highvoltage transmission lines, ranging from 138 kV up to 1000kV, referred to as high voltage (HV) and ultra-high voltage(UHV), respectively. When the energy reaches the distributionsubstation, the voltage is stepped down to the medium voltage(MV) level again, characterizing the distribution networkingrids. Usually, the primary distribution feeders leave from thissubstation at 13.8 kV level (MV) and are less than 10 km inlength, except for rural sections where they may be longer,as demands for electricity are relatively scarce and scattered.Distribution transformers are connected to the primary feeders,in many points, to reduce the voltage level from 13.8 kV to127 V, 220 V or 380 V (approximately) to energize distributionsecondary feeders reaching the end users. Then secondaryelectric distribution system corresponds to the low voltage(LV) feeders.
A. Characteristics of Electric Disturbance Signals
The aim of power system monitoring is to access theevolution in time of disturbance phenomena, regardless of thequantities measured. These phenomena consist, in general,ofsinusoidal oscillations of increasing or decreasing amplitudes,and are highly influenced by circuit switching, as well asby non-linear equipments. In order to analyze and compresssignals from power systems it is important to use modelsthat are capable of precisely representing signal componentsconsistent with these phenomena, which can be classified as:• Harmonics – steady-state low-frequency phenomena rang-
ing from 50/60 Hz (the system fundamental frequency) to3000 Hz. Their main sources are semiconductor appara-tuses (power electronic devices), arc furnaces, transform-ers (due to their non-linear flux-current characteristics),rotational machines, and aggregate loads (a group of loadstreated as a single component) [62].
• Transients – impulses or high frequency oscillations.Oscillations are observed superimposed to the voltagesor currents of fundamental frequency (50/60 Hz) or toexponential DC and exponentially modulated components.They can be classified as normal and abnormal. Thenormal ones correspond to common operation events ofthe system, involving switched capacitor based AC/DCdevices, tap changing and load switching. On the otherhand, the abnormal correspond to those that are notcommon operation events and are somehow random,such as lightning, voltage dips, and other faults in thesystem [6], [63]. The frequency range of transients mayspan up to hundreds of thousands of Hz, although themeasurement system (and the power line itself) usuallyfilters components above few thousands of Hz.
• Inter-harmonics – sinusoidal components of frequenciesthat are not in multiples of the fundamental one [64]. Theytend to have much shorter duration and lower power thanthe fundamental and harmonic components. They appeardue to the high availability of power converters and loadsnot pulsating synchronously with the fundamental powersystem frequency.
• Swells and Sags – increase or decrease, respectively, inthe RMS voltage of duration from half cycle to 1 minute(approximately) [62]. Usually, the variations are dividedinto small (voltage variations or voltage fluctuations) andlarge (voltage dips or sags, over-voltages or swells andinterruptions) [3].
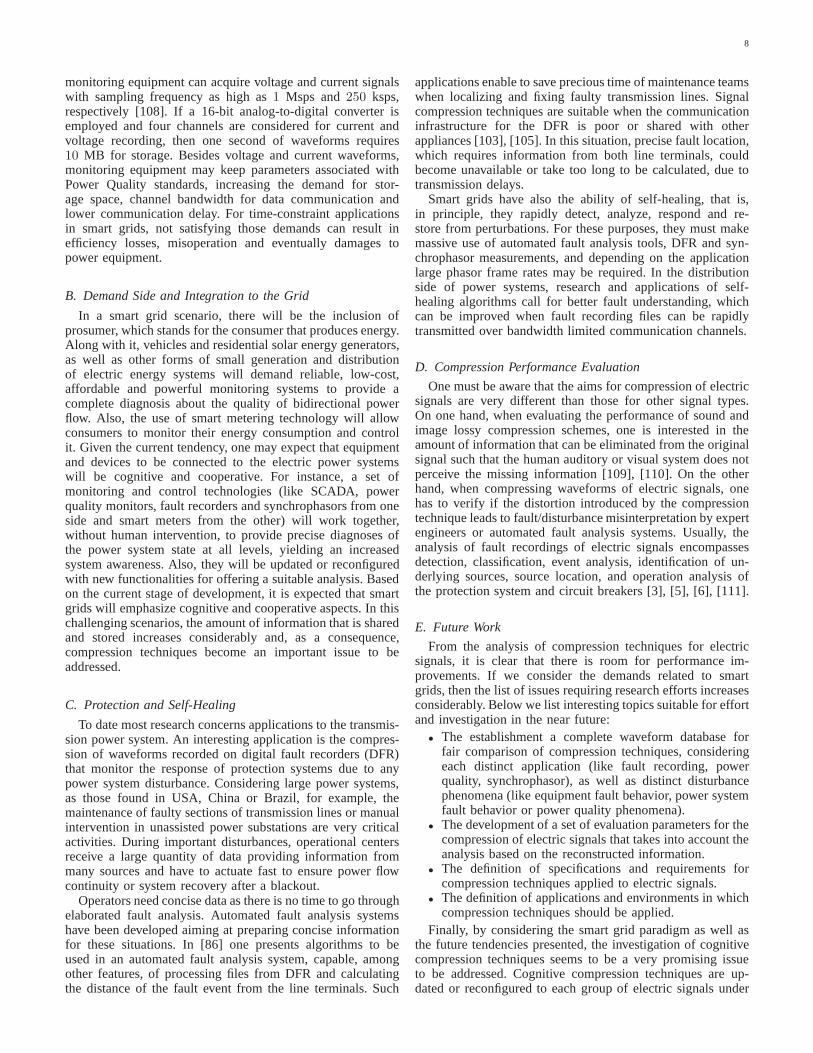
A sample of an MV electric signal showing the occurrenceof an event is depicted in Fig. 2. The underlying phenomenafound in such waveforms are heavily dependent on the voltagelevel of the electric grid as well as on the magnitude andlinearity of the load connected to it [6], [63].
Fig. 2. A disturbance detected in a voltage signal measured in an MV electriccircuit [65], showing transients and sags.
B. Modeling Electric Disturbance Signals
When analyzing disturbance signals, it is interesting to becapable of detecting, segmenting, modeling and identifyingthe relevant phenomena [3]. Some techniques commonly em-ployed for modeling and analyzing disturbance in electricsignals are: Fourier filtering [66], [67]; Prony analysis [68],[69]; auto regressive moving average models [70]; state spacetracking methods [70] and Wavelets [68], [71]–[77]. In somecases, these methods are used along with artificial intelligencestrategies [69], [78]–[81].
The components of electric signals can considerably varyregarding their origins (HV, MV, and LV electric grids) aswell as the kinds of connected loads. Despite that, several
3
MV HV HV MV LV
Generation Substation
Transmission Line
Substation Distribution Transformer
Primary Feeders
Network Conections
Network Conections
Secondary Feeders
Fig. 1. A typical power system scheme (LV – low voltage, MV – medium voltage and HV – high voltage).
contributions, aiming at modeling transmission and distribu-tion electric systems, have pointed out that a general modelfor the observed voltage and current signals can be expressedin the discrete time domain as [5], [6], [48], [63], [82]
is the sampling period,the signalsf [n], h[n], i[n], t[n], and v[n] denote the powersupply signal (or fundamental component), harmonics, inter-harmonics, transient, and background noise, respectively. Thepower supply signal can be expressed as
f [n] = A0 cos
(
2πf0
fsn+ θ0
)
, (2)
in which A0, f0, and θ0 denote its magnitude, fundamentalfrequency, and phase, respectively. Harmonics are given by
h[n] =
M∑
m=1
hm[n], (3)
wherehm[n] refers to them-th harmonic, expressed as
hm[n] = Ah,m cos
(
2πmf0
fsn+ φh,m
)
rect(n, nh,sm , nh,em)
(4)where Ah,m is its magnitude,φh,m is its phase,nh,sm
and nh,em define its time support region, that isrect(n, nh,sm , nh,em) = u(n− nh,sm) − u(n− nh,em)– u(·) corresponds to the step function. Inter-harmonics are
i[n] =
J∑
j=1
ij [n], (5)
whereij[n], the j-th inter-harmonic, is given by
ij[n] = AI,j cos
(
2πfI,j
fsn+ φI,j
)
rect(
n, ni,sj , ni,ej
)
(6)
AI,j , fI,j, andφI,j are its magnitude, frequency and phase,respectively, andnisj
andniejdefine its time support region.
Transient components can be decomposed as
t[n] = tspi[n] + tnot[n] + tdec[n] + tdam[n], (7)
wheretspi[n] denotes spikes,tnot[n] denotes notches,tdec[n]denotes decaying oscillations andtdam[n] represents dampedexponentials. These transients can be expressed as
tspi[n] =
Nspi∑
l=1
tspi,l[n]rect(n, nspi,sl , nspi,el) , (8)
tnot[n] =
Nnot∑
l=1
tnot,l[n]rect(n, nnot,sl , nnot,el) , (9)
tdec[n] =Ndec∑
l=1
Adec,l cos(
2πfdec,lfs
n+ φdec,l
)
e−αdec,l(n−ndec,l)rect(n, ndec,sl , ndec,el) ,
(10)
and
tdam[n] =Ndam∑
l=1
Adam,le−αdam,l(n−ndam,l)
rect(n, ndam,sl , ndam,el) .(11)
Note that tspi,l[n] and tnot,l[n] are the n-th samples ofthe l-th spike and notch transients, for instance. Also, thepairs (nspi,sl ;nspi,el), (nnot,sl ;nnot,el), (ndec,sl ;ndec,el), and(ndam,sl ;ndam,el) define the duration of these components.
It should be highlighted that noise encompasses differentcontributions. For example, the noise that is actually present inthe power system (real noise) and the noise that is introducedby the signal conditioning and analog-to-digital conversionprocesses (electronic noise). The electronic noise may nottobe random white noise, but rather be somehow predictablebased on the oscillatory frequencies of the electronic circuitryused to capture the waveforms from the power system. How-ever, in general, noise (v[n]) is assumed to be independent andidentically distributed (i.i.d.) and usually modeled as normalN (0, σ2
v), and also as independent off [n], h[n], i[n], andt[n].The discussed model is effective in representing several dis-
turbances that appear in electric signals because the estimationof its parameters may provide valuable information regardingmonitoring and diagnosis. Note that equation (10) may modelcapacitor switchings as well as signals resulting from powersystem faults. Equation (11) defines the decaying exponentialas well asdirect current(DC) components (αdam = 0), whichmay result from Geo-magnetic disturbances, for instance.
III. M AIN COMPRESSION TECHNIQUES FOR ELECTRICSIGNALS
Data compression schemes can be divided in two broadclasses: lossless and lossy compression schemes [83]. Inlossless compression, the reconstructed signal is identicalto the original signal and the performance is measured bycompression ratio. On the other hand, in lossy compression thereconstructed signal may differ from the original one and theperformance must now be measured by the compromise be-tween compression ratio and distortion. When one controllablyintroduces distortion in the signal without compromising itsuse or application, it is possible to achieve higher compressionratios than lossless compression approaches. In the following,we describe some of the techniques that have been presentedfor the compression of electric signals.
A. Lossless Coding
Lossless methods have been employed for coding powerquality data [7], [17], [44], [46], [57]. Lempel-Ziv, Huffman
4
and arithmetic coding methods [83], [84] are used to compresselectric power signals in [44]. Lossless coding techniqueswereemployed in electric signals comprising events such as flicker,sag, swell, impulse and harmonics [7], [17], [44], [46], [57].
In [46], one presents compression results for electric signalswhen using lossless off-the-shelf CODECs developed for au-dio and image signals, as well as entropy coders such as LZP2,FLAC, TTAEnc, MP3, ZIP (Lempel-Ziv variant), JPEG-LS,SPIHT-lossless and JPEG2000-lossless. Besides, the PQDIFfile format comprises a lossless compression option that alsoconsists of a Lempel-Ziv variant [59]. When using the PQDIFcompression option, we can expect the same compressionperformance seen in [46] referring to the ZIP method.
Often one attempts to encode electric power system signalsusing image encoders [46], [47]. In order to use image coders,it is necessary to convert the electric power signal into a matrixrepresentation where the rows correspond to non-overlappingsegments of the signal. It is important to note that 2D codersenable the exploitation of redundancy across vertical sam-ples providing more compact signal representations than one-dimensional coders [46]. Different 1D and 2D lossless coderswere employed to compress a dataset of voltage waveformswith 800,000 samples captured at 20 kHz. It could be verifiedthat among 1D coders a Lempel-Ziv variant technique achievesthe highest compression performance with a compression ratioof 5:1 on the average. Among 2D coders, the JPEG2000 inlossless mode accomplishes the highest compression ratio onaverage, of around 9:1. Another 2D coder based on DCT waspresented in [85].
In [17], it is proposed a lossless compression algorithmusing high-order delta modulation along with Huffman coding.It carries out multiple differential operations over the signalsto reduce their magnitudes so that fewer bits are required forcoding. This compression approach is tested in distinct typesof power quality events achieving a compression ratio of 2:1.
B. Transform Coding
In order to achieve higher compression levels, one wouldneed to make use of lossy coding schemes which lead to signaldegradation. However, the signal degradation must be suchthat the signal is still useful for analysis or diagnosis [86].Aiming at this, coding techniques must accomplish a tradeoffbetween compression ratio and measured distortion such thatcompressed signals remain useful and effective for the analysisand diagnosis of electric disturbances.
Transform coding is a commonly used lossy compressionframework. In this case, the encoding process is essentiallycomposed by three steps:i. transformation of the input signalproducing uncorrelated coefficients,ii. quantization of eachcoefficient (usually scalar quantization and eventually vectorquantization), andiii. entropy coding.
Many transform-based compression techniques have beendeveloped with the purpose of reducing the size of electricsignals. Some techniques employ linear transformation such asthe Hartley Transform, Lapped Orthogonal Transform(LOT)and theDiscrete Cosine Transform(DCT) [47], [87]. However,a significant number of compression systems applied to elec-tric signals use theDiscrete Wavelet Transform(DWT) andthe Wavelet Packet Transform(WPT) [20], [24], [30]–[33],[35]–[46], which we highlight here.
The transform approach whose basic components areformed by sine and cosine functions such as DFT (discrete
Fourier transform) and DCT are effective for the analysisof predominantly sinusoidal, periodic and stationary signals,since they provide good localization in the frequency do-main. Since disturbances in electric signals are normallysubjected to non-periodic and transient components and topower frequency variations, the DFT alone can be inadequateto provide compact representations. This is the reason whywavelet-based transforms are so broadly used for compressingelectric disturbance signals. They provide good localization inboth frequency and time domains [88], and have the abilityof concentrating a great portion of the signal energy in afew coefficients even when its underlying patterns comprisetransient and non-periodic components. In what follows weanalyze wavelet and wavelet packet transforms in more depth.
1) Discrete Wavelet Transform:The wavelet transform ofa discrete signalx = [x1 x2 . . . xN ]T , whereN is the signallength, can be written as [30], [36], [38], [41]:
α = Wx (12)
whereα denotes the coefficients vector,W is anN×N matrixconsisting of row basis vectors. Thus the signal is representedas a linear combination of the row basis weighted by thecoefficients inα. This signal representation can be obtainedthrough a hierarchical filter bank which is implemented us-ing a recursive algorithm known as multi-resolution pyramiddecomposition [88].
Initially, the signalx is decomposed into coarse and detailsignals,a1 andd1, using a low-pass and high-pass filters andfollowed by decimation by two. The same process is applied tothe coarse signals. This process is repeated inN stages, (whereeach stage is associated to a scale or level of resolution. Asresult one obtains the approximation/scaling coefficientsvectora3 and the details/wavelet coefficients vectorsd1, d2 andd3.Note that as the signals are decimated by two at each resolutionlevel, the number of wavelet transform coefficients remainsthesame as the number of samples of the original signal. There aredifferent types of wavelet filters that can be employed, suchasDaubechies, Symlets, Coiflets, among others [88], [89]. Fig. 3shows the detail bands and the approximation band of thecoarsest scale of a voltage dip signal obtained by using theDWT with Daubechies four coefficients filters. Note that thewavelet transform is able to capture the several occurrenceson the signal, especially the transients.
Fig. 3. Detail and approximation bands for a voltage dip signal taken fromIEEE project group 1159.2, where the sampling rate is 15,360Hz. The topplot corresponds to the original signal, and the detail bands are shown, fromtop to bottom, in increasing scale (decreasing frequency) order. The bottomplot corresponds to the approximation band of the coarsest scale.
5
The compression techniques proposed in [30], [36], [38],[41] essentially employ the discrete wavelet transform, withthe coefficients below some pre-determined threshold valuebeing discarded and the remaining coefficients being coded.In [30], one uses a Daubechies’ wavelet with a four-coefficientfilter along with a threshold of 10% of the maximum absolutevalue at each resolution level. This compression techniqueis employed to encode signals with 1500 samples, yieldingcompression ratios between 6:1 to 3:1 andNormalized MeanSquare Error(NMSE) of 10−5 to 10−6. In [37], the authorsalso utilize the DWT with Daubechies’ four-coefficient fil-ter, in conjunction with the Huffman coding technique. Thethresholding process is chosen so that the NMSE remains inthe order of10−4. In this case, the proposed compressionmethod could achieve a compression ratio of 3.43:1. In [36],one uses theSlantlet Transform(SLT) which is an orthogonaldiscrete wavelet transform with two zero moments and withimproved time localization. The simulation results presentedin [36] show that the SLT-based compression technique canachieve a compression ratio of 10:1 with aMean Square Error(MSE) of -19 dB at least. In [38], [41], a DWT withB-splinefilters is employed. In addition, in [41] a neural-network basedbit allocation procedure is used, achieving a compression ratioof 15:1 with MSE of at least -25 dB.
2) Wavelet Packet Transform:The WPT is a direct structureexpansion of the DWT tree algorithm to a complete binarytree. Differently from the DWT where only the low-passoutput signals passes through the two-band analysis processrepeatedly, in the WPT both coarse and detail signals can befurther decomposed to generate the next resolution level. Themain advantage of WPT over the DWT is that, starting fromthe complete tree, one can prune subtrees of it, enabling thesearch for a better signal representation. This is equivalent toselecting the best basis for the signal expansion where eachsubtree denotes a subspace formed by the scaling and waveletfunctions [43].
In [33], [43], a WPT is employed in the signal trans-formation stage. The work in [33] also applies the losslessLZW(Lempel-Ziv-Welch) technique [83] reaching a compres-sion ratio of 10:1 withPercentage Root Mean Square Differ-ence(PRD) below 10%. In [43], the WPT is used along withthe arithmetic coding as the entropy coding technique. It wasable to achieve a compression ratio of 6.9:1 with NMSE inthe order of10−5 .
3) Embedded Zero-tree Wavelet:The Embedded Zero-treeWavelet (EZW) algorithm is a wavelet-based progressivecompression method that encodes a signal into a bitstreamwith increasing accuracy. This method has the ability ofcompressing the signal at different bitrates according to theavailable bandwidth of the transmission channel.
First, one performs a discrete wavelet transform obtainingthe coefficients for a number of scales. These coefficientsare organized in a data structure called thezerotree. Eachcoefficient at a given scale is parent of all coefficients in thesame spatial location at the next finer scale. The coefficientsare encoded in decreasing order of scale in several passes usinga simple uniform quantizer. Initially, the quantization thresholdis defined at half the absolute value of the maximum waveletcoefficient. Then, for the consecutive passes the thresholdisprogressively divided by two. In summary, if the coefficientislarger than a threshold it is encoded and subtracted from thesignal, otherwise, it is left for the next pass.
In [32], [44], the EZW coding technique, introduced in [90]
originally for images, is used for the compression of powersystem electric signals. It provides compression ratios from10:1 to 16:1 with low distortion (NMSE in the order of10−5).
C. Mixed Parametric and Transform Coding
As the electric power system signals of interest are formedby both transient (non-stationary) and sinusoidal (stationary)components, wavelet-based transform coding schemes do notcompletely exploit the signal’s sparsity. In fact, wavelets aresuitable for processing transient or short-time events, the onesproduced by fast load transients or generation disconnection,faults, dips, lightning strokes, and disturbances of otherkindscovering a broad frequency spectrum from kilohertz up tomegahertz. In addition, the wavelet transform basis functions,when well localized in frequency are poorly localized intime, and when well localized in time are poorly localizedin frequency. Therefore the short bandwidth and arbitraryfrequency of sinusoidal signals make them unsuitable foran efficient representation in the wavelet transform domain.On the other hand, it has the ability to capture transientcomponents as seen in Fig. 3. This motivated the researchon hybrid coding techniques.
In [51]–[55], a compression framework using a mixedparametric and transform coding approach is proposed. Thetechnique starts from an estimation of the fundamental andharmonics components of the signal under analysis, so thatthese components can be subtracted from the electric signalyielding a residue consisting predominantly of transient (non-stationary) components. After that, a wavelet transform isapplied to this residue. This is exemplified in Fig. 4 thatshows a voltage signal and the residue that results afterthe subtraction of the fundamental component. Since thefundamental component (sinusoidal one) can be thoroughlyspecified with five parameters (starting and ending samples,amplitude, frequency and phase), then improved performancecan be reached. Usage of such approach is discussed in [61].
Fig. 4. Voltage signal corrupted by periodic transient events and residueobtained by subtracting the sinusoidal component.
In [51]–[54], one proposes a divide and conquer approachfor compressing electric disturbance signals, the so-calledEnhanced Disturbance Compression Method(EDCM). Inprinciple, one performs the estimation of the amplitude andphase parameters by a Kalman filter algorithm [91] and thefrequency parameter is estimated through an adaptive notchfilter [92], [93]. Then a fundamental component waveformis generated based on the previously estimated parameters.This can be done adopting a simple solution using a second-order infinite impulse response (IIR) digital filter [94]. The ac-quired signal is synchronized with the generated fundamentalcomponent waveform. Then, it is subtracted from the delayed
6
acquired signal frame, producing a residue that is subsequentlyprocessed through DWT. The transform coefficients are com-pared to a threshold and are lossless encoded along withthe fundamental component parameters by using the LZWtechnique. The selection block is responsible for selecting theamplitude, phase and frequency estimated according to thetime information generated by the timer block that providesthe information about the corresponding time instant of thesignal frame.
In [55], some improvements were introduced in the EDCMcompression method generating the so calledFundamental,Harmonic and Transient Coding Method(FHTCM). Actually,this is a generalization of the EDCM with two fundamentaldifferences. The FHTCM generates the estimation of theamplitude, phase and frequency of the fundamental and har-monics components by employing theNotch Filtering-WarpedDiscrete Fourier Transform(NF-WDFT) technique, instead ofusing the Kalman filter algorithm along with the adaptive notchfiltering.
The second difference between EDCM and FHTCM isrelated to the transformation stage and the lossy compressionof the transform coefficients. For an effective removal ofsignal redundancy, we need to obtain the appropriate basisfor signal decomposition to provide compact representations.In [95]–[99], this subject had been addressed by considering astatistical model for the distribution of wavelet coefficients andby using theMinimum Description Length(MDL) criterionintroduced by Rissanen [100], [101]. In [35], one has appliedthe Saito’s MDL criterion [95] to power disturbance eventcompression in order to select both the optimal bases (DWT orWPT) and number of retained wavelet coefficients. However,the MDL criterion used in [35] does not consider quantizationin its formulation. In [99], the authors have used the MDLcriterion taking into account the quantization for the compres-sion of image signals. By merging the ideas introduced in [35]and [99], it is possible to employ in FHTCM an MDL criterionthat considers simultaneously a dictionary comprising severalwavelet bases, an adaptive tree-structured decompositionandthe quantization level of transform coefficients. Originally,the EDCM only employed a hard threshold over the thecoefficients obtained through pyramid-structure decomposi-tion. With these improvements, the FHTCM could achieve 1bit/sample with MSE around -30 dB. A new technique thatexplores the mixed parametric and transform coding conceptwas introduced in [61].
D. Parametric Coding
Roughly, we can consider that electric signals are basicallyformed by sources, loads, and transmission lines, i.e., RLCcircuits, whose transient behavior can be modeled by dampedsinusoids. There are also discontinuities in these signalsdue toswitching. Following these premises, a discrete-time versionof an electric signal can be approximated via [48]:
x[n] =M−1∑
i=0
αie−ρi(n−nsi
) cos
(
2πkif0
fsn+ φi
)
· (13)
·rect(n, nsi , nei) ,
whereM is the number of expansion elements,f0 is the powerfrequency (50/60 Hz) and each element is represented by a 6-tuple (αi, ki, ρi, φi, nsi , nei), whereαi is the amplitude,kiis an integer multiple of the fundamental frequency,ρi is the
decaying factor,φi is the phase,nsi andnei are the startingand ending samples, andu(·) corresponds to the unit stepfunction. One should note that using this model the signal isrepresented as a sequence of parameter sets{γ(k)}k∈K, beingeachγ(i) = (αi, ki, ρi, φi, nsi , nei).
As the reader may observe, the idea behind parametriccoding (as presented here) is to employ parameterized func-tions or signals called atoms to model the signal to be coded.Signal coding thus resides in analyzing the signal and choosinga set of parameter sets to model the signal. The differentparameter sets correspond to different atoms that summed upapproximate the signal. Fig. 5 shows examples of differentparameterized functions and their modeling parameters.
Fig. 5. Examples of parameterized atoms.
Based on the signal model given by equation (13), in [48]is proposed a compression technique of electric signals thatemploys parameterized dictionaries of damped sinusoids. Thedictionary choice (parameter quantizer used) must be informedto the decoder as side information. An atomic decompositionusing a parameterized dictionary of damped sinusoids withcontinuous parameters through the matching pursuit (MP)algorithm [48] is employed. After finding the parameterizedmodel for an electric signal, the parameters of the atoms arequantized along with the coefficients. Details are as follows.
1) Decomposition Algorithm: Atomic decompositionsrepresent signals using linear combinations of elemen-tary functions, called atoms, drawn from a dictionary.In equation (13), each atom is given bygγ(i) =
e−ρi(n−nsi) cos
(
2π kif0fs
n+ φi
)
being defined byγ(i) =
(ki, ρi, φi, nsi , nei) and weighted byαi. When based ona redundant dictionary – a collection of signals spanningthe signal space – atomic decompositions can provide goodadaptive signal approximations. The approximation is adaptivesince the atoms are selected from the dictionary according tothe signal being decomposed. The use of highly redundantdictionaries enables efficient decompositions of a wide rangeof signals. Several methods have been used to obtain theserepresentations [88]. A popular one is the MP algorithm [102].It performs successive approximations of signals iterativelyemploying the dictionary elements. At the first iteration, theMP algorithm chooses the atom with the highest correlationwith the signal. The chosen atom is then scaled and subtractedfrom the signal obtaining a residue. The process is iteratedwith the residue until its energy becomes sufficiently smallor until another stopping criterion is met [88], [102]. In moreprecise terms, a signalx[n] can be approximated by an atomicdecomposition as:
x[n] =
M−1∑
i=0
αigγ(i)[n], (14)
7
TABLE ICOMPARISON OF SOME TECHNIQUES EMPLOYED FOR THE COMPRESSION OF ELECTRIC SIGNALS.
Group Category Basic Compression Distortion Distortion ReferenceTechnique Ratio Metric Value
in which the atomsgγ(i)[n] are selected from a redundantdictionaryD, being indexed by the mappingγ(i). If CD is thedictionary cardinality, this mapping is defined asγ : Z+ →{1, . . . , CD}. In compression applications, one encodes thenumber of termsM , the coefficientsαi and atom indexesγ(i).
2) Improving Signal Model Coherence:The use of thegreedy algorithm to search for the parameters of the dampedsinusoidal signals that model a given electric signal accordingto equation (13) may lead to largely mismatched dampedsinusoids with respect to the signal structures [50]. As aconsequence, the signal model may not be coherent withthe physical phenomena represented in the electric signal.The coherence between the electric signal and the signalrepresentation is improved by introducing some heuristicsin the greedy MP loop [48]. These heuristics lead to morephysically interpretable representations of the electricsignalscorrupted by disturbances.
3) Achieving Compression:At the end of the decom-position, one obtains the signal approximation in equa-tion (14) represented by the sequence of pairs(αi, γ(i)),i = 0, . . . ,M − 1, whereα(i) is the atom coefficient andγ(i) = (ρi, ξi, φi, nsi , nei) is the atom parameter as inequation (13). For compression, the coefficients and atomsparameters have to be quantized after the decomposition [48].
In [49], the quantization of the parameter vectorγ(i) isinterpreted as the generation of a set of redundant dictionariesdescribed asD = {Dk}k=1,...,K , in which K is the numberof dictionaries included inD. In this case, the dictionaryused must be indicated to the decoder as side information.The optimum rate-distortion (R-D) performance correspondsto the trade-off among the bits spent on side information (thatcorresponds to the atom indexes), and coefficients leading tothe minimum distortion. The solution to this trade-off usuallyinvolves high computational demands, that increase with thenumber of distinct dictionaries inD. In [49], two signals werecompressed using this paradigm achieving an SNR of 31.65dB at 0.95 bits/sample and an SNR of 31.12 dB at 0.584bits/sample, respectively.
E. Summary of Electric Signal Compression Results
We have reviewed some of the techniques employed so farfor the compression of electrical signals. Table I summarizesthe results (as presented by their authors) collected in theliter-ature for the techniques here discussed. As we have observed
very different approaches for compressing electric signals havebeen proposed. They range from lossless to lossy compressionschemes using different although promising approaches. InTable I we kept the evaluation metrics as employed by theauthors of the different techniques in their works. As can beobserved, an important issue for the development of techniquesfor compressing electric signals is an agreement on whichmetric shall be employed for evaluating the different lossycompression schemes.
IV. SMART GRIDS: NEW SCENARIO AND DEMANDS FORTHE COMPRESSION OFELECTRIC SIGNALS
The scenario of modern power systems has a number ofnew challenges that can not be faced by the technologyused to date in the field. The growing complexity in systemoperation due to the introduction of distributed and renewablegeneration, environmental restrictions to the construction oflarge power plants and transmission lines increase demand forelectricity with acceptable quality, regulatory and economicissues, etc. Automation strategies have been widely appliedin the generation and transmission side of the power systemsince the 1980’s, while, due to the high costs involved fewerapplications in the distribution side were implemented since.The Smart Grid concept emerges to congregate all thesetechnologies already in use, taking advantage of the new andcheap information, communication, sensing, measurement,monitoring and control technologies. Particularly, most of thefocus of Smart Grids are on the distribution, or demand side.Insmart grids, each load connected to the electric power systemswill have an interface to share information and to update itsfirmware, and also an affordable hardware to process informa-tion. Therefore, telecommunications infrastructure withqualityof service (QoS) related to the power system requirementsis sparking a huge research effort for introducing a newgeneration of equipment that enables to fulfill the demandsand needs associated with the smart grid concept [103]–[105].
A. Communication Infrastructure
A large number of smart monitors and meters will bedeployed and distributed in the power systems to allowbroad observability and real-time monitoring [3], [106], [107].Therefore, it is fundamental to verify the bulk of waveformdata produced by these equipments and its impact on thecommunication infrastructure. For instance, power quality
8
monitoring equipment can acquire voltage and current signalswith sampling frequency as high as1 Msps and250 ksps,respectively [108]. If a 16-bit analog-to-digital converter isemployed and four channels are considered for current andvoltage recording, then one second of waveforms requires10 MB for storage. Besides voltage and current waveforms,monitoring equipment may keep parameters associated withPower Quality standards, increasing the demand for stor-age space, channel bandwidth for data communication andlower communication delay. For time-constraint applicationsin smart grids, not satisfying those demands can result inefficiency losses, misoperation and eventually damages topower equipment.
B. Demand Side and Integration to the Grid
In a smart grid scenario, there will be the inclusion ofprosumer, which stands for the consumer that produces energy.Along with it, vehicles and residential solar energy generators,as well as other forms of small generation and distributionof electric energy systems will demand reliable, low-cost,affordable and powerful monitoring systems to provide acomplete diagnosis about the quality of bidirectional powerflow. Also, the use of smart metering technology will allowconsumers to monitor their energy consumption and controlit. Given the current tendency, one may expect that equipmentand devices to be connected to the electric power systemswill be cognitive and cooperative. For instance, a set ofmonitoring and control technologies (like SCADA, powerquality monitors, fault recorders and synchrophasors fromoneside and smart meters from the other) will work together,without human intervention, to provide precise diagnoses ofthe power system state at all levels, yielding an increasedsystem awareness. Also, they will be updated or reconfiguredwith new functionalities for offering a suitable analysis.Basedon the current stage of development, it is expected that smartgrids will emphasize cognitive and cooperative aspects. Inthischallenging scenarios, the amount of information that is sharedand stored increases considerably and, as a consequence,compression techniques become an important issue to beaddressed.
C. Protection and Self-Healing
To date most research concerns applications to the transmis-sion power system. An interesting application is the compres-sion of waveforms recorded on digital fault recorders (DFR)that monitor the response of protection systems due to anypower system disturbance. Considering large power systems,as those found in USA, China or Brazil, for example, themaintenance of faulty sections of transmission lines or manualintervention in unassisted power substations are very criticalactivities. During important disturbances, operational centersreceive a large quantity of data providing information frommany sources and have to actuate fast to ensure power flowcontinuity or system recovery after a blackout.
Operators need concise data as there is no time to go throughelaborated fault analysis. Automated fault analysis systemshave been developed aiming at preparing concise informationfor these situations. In [86] one presents algorithms to beused in an automated fault analysis system, capable, amongother features, of processing files from DFR and calculatingthe distance of the fault event from the line terminals. Such
applications enable to save precious time of maintenance teamswhen localizing and fixing faulty transmission lines. Signalcompression techniques are suitable when the communicationinfrastructure for the DFR is poor or shared with otherappliances [103], [105]. In this situation, precise fault location,which requires information from both line terminals, couldbecome unavailable or take too long to be calculated, due totransmission delays.
Smart grids have also the ability of self-healing, that is,in principle, they rapidly detect, analyze, respond and re-store from perturbations. For these purposes, they must makemassive use of automated fault analysis tools, DFR and syn-chrophasor measurements, and depending on the applicationlarge phasor frame rates may be required. In the distributionside of power systems, research and applications of self-healing algorithms call for better fault understanding, whichcan be improved when fault recording files can be rapidlytransmitted over bandwidth limited communication channels.
D. Compression Performance Evaluation
One must be aware that the aims for compression of electricsignals are very different than those for other signal types.On one hand, when evaluating the performance of sound andimage lossy compression schemes, one is interested in theamount of information that can be eliminated from the originalsignal such that the human auditory or visual system does notperceive the missing information [109], [110]. On the otherhand, when compressing waveforms of electric signals, onehas to verify if the distortion introduced by the compressiontechnique leads to fault/disturbance misinterpretation by expertengineers or automated fault analysis systems. Usually, theanalysis of fault recordings of electric signals encompassesdetection, classification, event analysis, identificationof un-derlying sources, source location, and operation analysisofthe protection system and circuit breakers [3], [5], [6], [111].
E. Future Work
From the analysis of compression techniques for electricsignals, it is clear that there is room for performance im-provements. If we consider the demands related to smartgrids, then the list of issues requiring research efforts increasesconsiderably. Below we list interesting topics suitable for effortand investigation in the near future:
• The establishment a complete waveform database forfair comparison of compression techniques, consideringeach distinct application (like fault recording, powerquality, synchrophasor), as well as distinct disturbancephenomena (like equipment fault behavior, power systemfault behavior or power quality phenomena).
• The development of a set of evaluation parameters for thecompression of electric signals that takes into account theanalysis based on the reconstructed information.
• The definition of specifications and requirements forcompression techniques applied to electric signals.
• The definition of applications and environments in whichcompression techniques should be applied.
Finally, by considering the smart grid paradigm as well asthe future tendencies presented, the investigation of cognitivecompression techniques seems to be a very promising issueto be addressed. Cognitive compression techniques are up-dated or reconfigured to each group of electric signals under
9
analysis, which might result in improved compression ratioand reduced distortion. Cooperative compression techniquesshare information from signals acquired in different locationsin order to generate more concise collective representations.A technique that unconsciously addresses this is presentedin[112].
V. CONCLUSION
The main goal of this paper was to bring the attention to achallenging, thought-provoking, and timely research problemfor automation, measurement and control of power systems inthe near future. Special attention was given to the developmentattained so far regarding compression techniques for electricsignals. The need for the introduction of powerful compressiontechniques for smart grid applications as well as some of themost important research challenges were addressed. Work onsuch challenges will contribute to the advent of novel, and low-cost devices for the widespread and successful introductionand adoption of smart sensing, monitoring, metering, diagno-sis, and protection in the next generation of electric powersystems, that is, for smart(er) grids.
REFERENCES
[1] I. Y.-H. Gu and E. Styvaktakis, “Bridge the gap: signal processingfor power quality applications,”Electric Power Sys. Research, vol. 66,no. 1, pp. 83–96, Jul. 2003.
[2] M. V. Ribeiro, J. Szczupak, M. R. Iravani, I. Y.-H. Gu, P. K.Dash, and A. V. Mamishev, “Emerging signal processing techniquesfor power quality applications,”EURASIP J. Adv. Signal Process,vol. 2007, no. 2, pp. 16–16, Jun. 2007. [Online]. Available:http://dx.doi.org/10.1155/2007/87425
[3] M. H. J. Bollen, I. Y.-H. Gu, S. Santoso, M. F. Mcgranaghan, P. A.Crossley, M. V. Ribeiro, and P. F. Ribeiro, “Bridging the gapbetweensignal and power,”IEEE Signal Proc. Mag., vol. 26, no. 4, pp. 12–31,Jul. 2009.
[4] M. H. J. Bollen, P. F. Ribeiro, I. Y.-H. Gu, and C. A. Duque,“Trends,challenges and opportunities in power quality research,”EuropeanTrans. on Electrical Power, vol. 4, no. 1, pp. 2–18, 2009.
[5] M. H. J. Bollen, Understanding Power Quality Problems – VoltageSags and Interruptions. Piscataway, NJ: IEEE Press, 2000.
[6] M. H. J. Bollen and I. Y.-H. Gu,Signal Proc. of Power QualityDisturbances. Wiley-IEEE Press, 2006.
[7] K. Mehta and B. D. Russell, “Data compression for digitaldata frompower systems disturbances: requirements and technique evaluation,”IEEE Trans. on Power Delivery, vol. 4, no. 3, pp. 1683–1688, Jul.1989.
[8] L. Toivonen and J. Morsky, “Measurement and processing of distortionquantities in a portable, multi-purpose analyzer,”IEEE Trans. on PowerDelivery, vol. 8, no. 4, pp. 1736–1746, Oct. 1993.
[9] Department of Energy, “Smart grid,”http://www.oe.energy.gov/smartgrid.htm, June 2011.
[10] S. M. Amin and B. Wollenberg, “Toward a smart grid: powerdeliveryfor the 21st century,”IEEE Power and Energy Mag., vol. 3, no. 5, pp.34–41, Sept.-Oct. 2005.
[11] K. Vu, M. M. Begouic, and D. Novosel, “Grids get smart protectionand control,” IEEE Comp. Apps. in Power, vol. 10, no. 4, pp. 40–44,Oct. 1997.
[12] A. Vojdani, “Smart integration,”IEEE Power and Energy Mag., vol. 6,no. 6, pp. 71–79, Nov.-Dec. 2008.
[13] A. Ipakchi and F. Albuyeh, “Grid of the future,”IEEE Power andEnergy Mag., vol. 7, no. 2, pp. 52–62, Mar.-Apr. 2009.
[14] EPRI, “Smart grid demonstration–integration of distributed energyresources,” http://www.smartgrid.epri.com/Demo.aspx,June 2011.
[15] M. M. Albu, R. Neurohr, D. Apetrei, I. Silvas, and D. Federenciuc,“Monitoring voltage and frequency in smart distribution grids. a casestudy on data compression and accessibility,” inProc. of the IEEE PESGeneral Meeting, 2010, pp. 1 –6.
[16] A. Abart, A. Lugmair, and A. Schenk, “Smart metering features formanaging low voltage distribution grids,” inProc. of the 20th CIRED- Part 2, 2009, p. 1.
[17] D. Zhang, Y. Bi, and J. Zhao, “A new data compression algorithmfor power quality online monitoring,” inProc. of the SUPERGEN ’09,2009, pp. 1–4.
[18] G. Chicco, “Challenges for smart distribution systems: Data represen-tation and optimization objectives,” inProc. of the 12th OPTIM, 2010,pp. 1236–1244.
[19] M. M. Albu, R. Neurohr, D. Apetrei, I. Silvas, and D. Federenciuc,“Monitoring voltage and frequency in smart distribution grids. a casestudy on data compression and accessibility.” inProc. of the PESGeneral Meeting, 2010, pp. 1–6.
[20] J. Ning, J. Wang, W. Gao, and C. Liu, “A wavelet-based data com-pression technique for smart grid,”IEEE Trans. on Smart Grid, vol. 2,no. 1, pp. 212–218, Mar. 2011.
[21] S. Das and P. Rao, “Principal component analysis based compressionscheme for power system steady state operational data,” inIEEE PESInnovative Smart Grid Technologies - India, 2011, pp. 95–100.
[22] R. Parseh, S. S. Acevedo, K. Kansanen, M. Molinas, and T.A. Ram-stad, “Real-time compression of measurements in distribution grids,” inIEEE Third International Conference on Smart Grid Communications(SmartGridComm),, 2012, pp. 223–228.
[23] IEEE P1159/P6,Recommended practice on monitoring electric powerquality, 2009.
[24] R. P. Bingham, D. Kreiss, and S. Santoso, “Advances in data reductiontechniques for power quality instrumentation,” inProc. of the ThirdEuropean Power Quality Conf., Bremen, Germany, 1995.
[25] W. A. Wilkinson and M. D. Cox, “Discrete wavelet analysis of powersystem transients,”IEEE Trans. on Power Sys., vol. 11, no. 4, pp.2038–2044, Nov. 1996.
[26] P. Pillay and A. Bhattacharjee, “Application of wavelets to model short-term power system disturbances,”IEEE Trans. on Power Sys., vol. 11,no. 4, pp. 2031–2037, Nov. 1996.
[27] L. Toivonen and J. Morsky, “Measurement and processingof distortionquantities in a portable, multi-purpose analyzer,”IEEE Trans. on PowerDelivery, vol. 8, no. 4, pp. 1736 –1746, Oct. 1993.
[28] A. K. Khan, “Monitoring power for the future,”Power Eng. Journal,vol. 15, no. 2, pp. 81 –85, Apr. 2001.
[29] G. T. Heydt and E. Gunther, “Post-measurement processing of electricpower quality data,”IEEE Trans. on Power Delivery, vol. 11, no. 4,pp. 1853–1859, Oct. 1996.
[30] S. Santoso, E. J. Powers, and W. M. Grady, “Power qualitydisturbancedata compression using wavelet transform methods,”IEEE Trans. onPower Delivery, vol. 12, no. 3, pp. 1250–1257, Jul. 1997.
[31] C.-T. Hsieh, S.-J. Huang, and C.-L. Huang, “Data reduction of powerquality disturbances–a wavelet transform approach,”Electric PowerSys. Research, vol. 47, no. 2, pp. 79–86, 1998.
[32] J. Chung, E. J. Powers, W. Grady, and S. C. Bhatt, “Variable ratepower disturbance signal compression using embedded zerotree wavelettransform coding,” inProc. of the 1999 IEEE Power Eng. SocietyWinter Meeting, vol. 2, Jan.-4 Feb. 1999, pp. 1305–1309.
[33] T. B. Littler and D. J. Morrow, “Wavelets for the analysis andcompression of power system disturbances,”IEEE Trans. on PowerDelivery, vol. 14, no. 2, pp. 358–364, Apr. 1999.
[34] G. T. Heydt and S. C. Bhatt, “Present and future trends and needs inelectric power quality sensors and instrumentation,”Electric MachinesPower System, vol. 27, no. 7, pp. 691–700, 1999.
[35] E. Y. Hamid and Z.-I. Kawasaki, “Wavelet-based data compressionof power system disturbances using the minimum descriptionlengthcriterion,” IEEE Trans. on Power Delivery, vol. 17, no. 2, pp. 460–466, Apr. 2002.
[36] G. Panda, P. K. Dash, A. K. Pradhan, and S. K. Meher, “Datacompression of power quality events using the slantlet transform,” IEEETrans. on Power Delivery, vol. 17, no. 2, pp. 662–667, Apr. 2002.
[37] C.-T. Hsieh and S.-J. Huang, “Disturbance data compression of a powersystem using the huffman coding approach with wavelet transformenhancement,”IEE Proc. on Gen., Trans. and Dist., vol. 150, no. 1,pp. 7–14, Jan. 2003.
[38] P. K. Dash, B. K. Panigrahi, D. K. Sahoo, and G. Panda, “Powerquality disturbance data compression, detection, and classificationusing integrated spline wavelet and s-transform,”IEEE Trans. on PowerDelivery, vol. 18, no. 2, pp. 595–600, Apr. 2003.
[39] C.-J. Wu, T.-H. Fu, and C.-P. Huang, “Data compression techniquein recording electric arc furnace voltage and current waveforms fortracking power quality,” inProc. of the IEEE PES Trans. and Dist.Conf. and Exp., vol. 1, 2003, pp. 383–388.
[40] L. Shang and J. J. R. Krebs, “Efficiency analysis of data compressionof power system transients using wavelet transform,” inProc. the IEEEBologna Power Tech Conference, vol. 4, 2003, p. 6 pp.
[41] S. K. Meher, A. K. Pradhan, and G. Panda, “An integrated datacompression scheme for power quality events using spline wavelet andneural network,”Electric Power Sys. Research, vol. 69, no. 2-3, pp.213–220, 2004.
[42] O. N. Gerek and D. Ece, “2-d analysis and compression of power-quality event data,”IEEE Trans. on Power Delivery, vol. 19, no. 2, pp.791–798, Apr. 2004.
[43] S.-J. Huang and M.-J. Jou, “Application of arithmetic coding forelectric power disturbance data compression with wavelet packet en-hancement,”IEEE Trans. on Power Sys., vol. 19, no. 3, pp. 1334–1341,Aug. 2004.
[44] F. Lorio and F. Magnago, “Analysis of data compression methods forpower quality events,” inProc. of the IEEE Power Eng. Society GeneralMeeting, vol. 1, 2004, pp. 504–509.
10
[45] Y. Yuan, X. Yu, and H. Du, “Power system fault data compressionusing the wavelet transform and vector quantification,” inProc. of IEEEPOWERCOM, Oct. 2006, pp. 1–6.
[46] O. N. Gerek and D. G. Ece, “Compression of power quality event datausing 2d representation,”Electric Power Sys. Research, vol. 78, no. 6,pp. 1047–1052, 2008.
[47] A. Qing, Z. Hongtao, H. Zhikun, and C. Zhiwen, “A compressionapproach of power quality monitoring data based on two-dimensiondct,” in Proc. of the ICMTMA’2011, vol. 1, 2011, pp. 20–24.
[48] L. Lovisolo, E. A. B. da Silva, M. A. M. Rodrigues, and P. S. R.Diniz, “Efficient coherent representations of power systems signalsusing damped sinusoids,”IEEE Trans. on Signal Proc., vol. 53, no. 10,pp. 3831–3846, Oct. 2005.
[49] M. P. Tcheou, L. Lovisolo, E. A. B. da Silva, M. A. M. Rodrigues,and P. S. R. Diniz, “Optimum rate-distortion dictionary selection forcompression of atomic decompositions of electric disturbance signals,”IEEE Signal Proc. Letters, vol. 14, no. 2, pp. 81–84, Feb. 2007.
[50] L. Lovisolo, M. P. Tcheou, E. A. B. da Silva, M. A. M. Rodrigues, andP. S. R. Diniz, “Modeling of electric disturbance signals using dampedsinusoids via atomic decompositions and its applications,” EURASIPJournal on Advances in Signal Proc., vol. 2007, pp. Article ID 29 507,15 pp., 2007.
[51] M. V. Ribeiro, J. M. T. Romano, and C. Duque, “An enhanceddatacompression method for applications in power quality analysis,” inProc. of the 27th IEEE IECON, vol. 1, 2001, pp. 676–681.
[52] M. V. Ribeiro and C. A. Duque, “The word length influence onwaveform coding techniques based on wavelet transform applied todisturbance compression,” inProc. of the 10th IEEE ICHQP, vol. 1,2002, pp. 139–143.
[53] F. R. Ramos, M. V. Riberto, J. M. T. Romano, and C. A. Duque, “Onsignal processing approach for event detection and compression appliedto power quality evaluation,” inProc. of the 10th IEEE ICHQP, vol. 1,2002, pp. 133–138.
[54] M. V. Ribeiro, J. M. T. Romano, and C. A. Duque, “An improvedmethod for signal processing and compression in power quality eval-uation,” IEEE Trans. on Power Delivery, vol. 19, no. 2, pp. 464–471,Apr. 2004.
[55] M. V. Ribeiro, S. H. Park, J. M. T. Romano, and S. K. Mitra,“A novelMDL-based compression method for power quality applications,” IEEETrans. on Power Delivery, vol. 22, no. 1, pp. 27–36, Jan. 2007.
[56] Z. Yun, L. Xiaoming, A. Lingxu, S. Jian, and W. Lihui, “Researchon encoding/decoding method of electric physical information basedon lms-adpcm algorithm,” inInternational Conference on AdvancedPower System Automation and Protection, vol. 1, 2011, pp. 795–800.
[57] J. Kraus, T. Tobiska, and V. Bubla, “Looseless encodings and com-pression algorithms applied on power quality datasets,” inProc. of the2th IEEE CIRED - Part 1, 2009, pp. 1–4.
[58] J. Kraus, P. Stepan, and L. Kukacka, “Optimal data compressiontechniques for smart grid and power quality trend data,” inProc. ofIEEE ICHQP, 2012, pp. 707–712.
[59] IEEEP1159.3/D9,Recommended Practice Recommended practice forthe transfer of power quality data.
[60] N. C. F. Tse, J. Y. C. Chan, and L. L. Lai, “Development of asmartmetering scheme for building smart grid system,” inProc. of the 8thAPSCOM, 2009, pp. 1–5.
[61] M. Zhang, K. Li, and Y. Hu, “A high efficient compression methodfor power quality applications,”IEEE Trans. on Instrumentation andMeasurement,, vol. 60, no. 6, pp. 1976 –1985, June 2011.
[62] W. Xu, “Component modeling issues for power quality assessment,”IEEE Power Eng. Review, vol. 21, no. 11, pp. 12–15,17, Nov. 2001.
[63] M. V. Ribeiro and J. L. R. Pereira, “Classification of single and multipledisturbances in electric signals,”EURASIP J. Adv. Signal Process, vol.2007, no. 2, p. 18 pp., Jun. 2007.
[64] IEEE Task Force on Harmonics Modeling and Simulation, “Inter-harmonics: Theory and modeling,”IEEE Trans. on Power Delivery,vol. 22, no. 4, pp. 2335–2348, Oct. 2007.
[65] IEEE PES Working Group 1433 Power Quality,http://grouper.ieee.org/1433/.
[66] E. O. Schweitzer III and D. Hou, “Filtering for protective relays,” inIEEE WESCANEX, 1993, pp. 15–23.
[67] D. Wiot, “A new adaptive transient monitoring scheme for detection ofpower system events,”IEEE Trans. on Power Delivery, vol. 19, no. 1,pp. 42–48, 2004.
[68] T. Lobos, J. Rezmer, and H.-J. Koglin, “Analysis of power systemstransients using wavelets and prony method,” inProc. IEEE PortoPower Tech Conf., vol. 4, 2001, p. 4 pp.
[69] M. M. Tawfik and M. M. Morcos, “ANN-based techniques for esti-mating fault location on transmission lines using Prony method,” IEEETrans. on Power Delivery, vol. 16, no. 2, pp. 219 – 224, Apr. 2001.
[70] B. J. Bujanowski, J. W. Pierre, S. M. Hietpas, T. L. Sharpe, and D. A.Pierre, “A comparison of several system identification methods withapplication to power systems,” inProc. of the 36th MWSCAS, vol. 1,1993, pp. 64–67.
[71] A. W. Galli, G. T. Heydt, and P. F. Ribeiro, “Exploring the powerof wavelet analysis,”IEEE Comp. Apps. in Power, vol. 9, no. 4, pp.37–41, Oct. 1996.
[72] J. Chung, E. J. Powers, W. M. Grady, and S. C. Bhatt, “Electric powertransient disturbance classification using wavelet-basedhidden Markovmodels,” in IEEE ICASSP, vol. 6, 2000, pp. 3662–3665.
[73] P. Pillay and A. Bhattachrjee, “Application of wavelets to model short-term power system disturbances,”IEEE Trans. on Power Sys., vol. 11,no. 4, pp. 2031–2037, Nov. 1996.
[74] O. Poisson, P. Rioual, and M. Meunier, “Detection and measurementof power quality disturbances using wavelet transforms,”IEEE Trans.on Power Delivery, vol. 15, no. 3, pp. 1039–1044, July 2000.
[75] H. Y. C. Liao, “A de-noising scheme for enhancing wavelet-basedpower quality monitoring systems,”IEEE Trans. on Power Delivery,vol. 16, no. 3, pp. 353–360, July 2001.
[76] S. Santoso, W. M. Grady, E. J. Powers, J. Lamoore, and S. C. Bhatt,“Characterization of distribution power quality events with fourier andwavelets transforms,”IEEE Trans. on Power Delivery, vol. 15, no. 1,pp. 247–254, Jan. 2000.
[77] M. Karimi, H. Mokhtari, and M. R. Iravani, “Wavelet based on-linedisturbance detection for power quality applications,”IEEE Trans. onPower Delivery, vol. 15, no. 4, pp. 1212–1220, Oct. 2000.
[78] W. R. A. Ibrahim and M. M. Morcos, “Artificial intelligence andadvanced mathematical tools for power quality applications: A survey,”IEEE Trans. on Power Delivery, vol. 17, no. 2, pp. 668–673, Apr. 2002.
[79] A. K. Gosh and D. L. Lubkeman, “The classification of power systemdisturbance waveforms using a neural network approach,”IEEE Trans.on Power Delivery, vol. 10, no. 1, pp. 109–115, Jan. 1995.
[80] L. Lovisolo, K. T. Figueiredo, L. de Menezes Laporte, J.A. M. Neto,and J. C. dos Santos Rocha, “Location of faults generating shortduration voltage variations in distribution systems regions from recordscaptured at one point and decomposed into damped sinusoids,” IET-Gen., Trans. and Dist., Accepted for publication.
[81] Q. Yang, J. Wang, W. Sima, L. Chen, and T. Yuan, “Mixed over-voltage decomposition using atomic decompositions based on a dampedsinusoids atom dictionary,”Energies, vol. 4, no. 9, pp. 1410–1427,2011.
[82] M. V. Ribeiro, C. A. G. Marques, C. A. Duque, A. S. Cerqueira, andJ. L. R. Pereira, “Detection of disturbances in voltage signals for powerquality analysis using HOS,”EURASIP J. Adv. Signal Process, vol.2007, no. 2, p. 13 pp., Jun. 2007.
[83] K. Sayood,Introduction to Data Compression, 2nd ed. San Francisco,USA: Morgan Kaufman, 2000.
[84] T. C. Bell, I. H. Witten, and J. G. Cleary,Text Compression / TimothyC. Bell, John G. Cleary, Ian H. Witten. Englewood Cliffs, USA:Prentice Hall, 1990.
[85] A. Qing, Z. Hongtao, H. Zhikun, and C. Zhiwen, “A compressionapproach of power quality monitoring data based on two-dimensiondct,” in Proc. of the 3rd ICMTMA, vol. 1, 2011, pp. 20 –24.
[86] M. P. Tcheou, A. L. Miranda, L. Lovisolo, E. A. da Silva, M. A.Rodrigues, and P. S. Diniz, “How far can one compress digitalfaultrecords? analysis of a matching pursuit-based algorithm,”DigitalSignal Proc., vol. 22, no. 2, pp. 288 – 297, 2012.
[87] F. A. O. Nascimento, “Data compression algorithm for transientrecording system,” inProc. of IEEE ISIE, vol. 3, 1997, pp. 1126–1130.
[88] S. Mallat, A Wavelet Tour of Signal Proc., 2nd ed. California, USA:Academic Press, 1998.
[89] I. Daubechies,Ten Lectures on Wavelets. Philadelphia, PA: SIAM,1991.
[90] J. M. Shapiro, “Embedded image coding using zerotrees of waveletcoefficients,” IEEE Trans. on Signal Proc., vol. 41, no. 12, pp. 3445–3462, Dec. 1993.
[91] S. Liu, “An adaptive kalman filter for dynamic estimation of harmonicsignals,” inProc. of the 8th IEEE ICHQP, vol. 2, 1998, pp. 636–640.
[92] J. M. T. Romano and M. Bellanger, “Fast least squares adaptive notchfiltering,” IEEE Trans. on Acoustics, Speech and Signal Proc., vol. 36,no. 9, pp. 1536–1540, Sep. 1988.
[93] P. S. R. Diniz,Adaptive Filtering: Algorithms and Practical Implemen-tations, 3rd ed. Boston, MA: Springer, 2008.
[94] Y. T. Cheng, “TMS320C62x algorithm: sine wave generation,” TexasInstruments, Texas, USA, Tech. Rep., Nov. 2000.
[95] N. Saito, “Simultaneous noise suppression and signal compressionusing a library of orthonormal bases and the minimum descriptionlength criterion,” inWavelets in Geophysics. Academic Press, 1994,pp. 299–324.
[96] H. Krim, D. Tucker, and S. M. D. Donoho, “On denoising andbestsignal representation,”IEEE Trans. on Inf. Theory, vol. 45, no. 7, pp.2225–2238, Nov. 1999.
[97] H. Krim and I. C. Schick, “Minimax description length for signaldenoising and optimized representation,”IEEE Trans. on Inf. Theory,vol. 45, no. 3, pp. 898–908, Apr. 1999.
[98] M. Hansen and B. Yu, “Wavelet thresholding via MDL for naturalimages,” IEEE Trans. on Inf. Theory, vol. 46, no. 5, pp. 1778–1788,Aug. 2000.
11
[99] S. G. Chang, B. Yu, and M. Vitterli, “Adaptive wavelet thresholdingfor image denoising and compression,”IEEE Trans. on Image Proc.,vol. 9, no. 9, pp. 1532–1546, Sept. 2000.
[100] J. Rissanen, “Modeling by shortest data description,” Automatica,vol. 14, pp. 465–471, 1978.
[101] A. Barron, J. Rissanen, and B. Yu, “The minimum description lengthprinciple in coding and modeling,”IEEE Trans. on Inf. Theory, vol. 44,no. 6, pp. 2743–2760, Oct. 1998.
[102] S. Mallat and Z. Zhang, “Matching pursuits with time-frequencydictionaries,” IEEE Trans. on Signal Proc., vol. 41, no. 12, pp. 3397–3415, Dec. 1993.
[103] S. Galli, A. Scaglione, and Z. Wang, “For the grid and through thegrid: The role of power line communications in the smart grid,” Proc.of the IEEE, vol. 99, no. 6, pp. 998–1027, Jun. 2011.
[104] H. Gharavi and B. Hu, “Multigate communication network for smartgrid,” Proc. of the IEEE, vol. 99, no. 6, pp. 1028–1045, Jun. 2011.
[105] T. Sauter and M. Lobashov, “End-to-end communicationarchitecturefor smart grids,”IEEE Trans. on Ind. Electronics, vol. 58, no. 4, pp.1218–1228, Apr. 2011.
[106] A. Gomez-Exposito, A. Abur, A. de la Villa Jaen, and C. Gomez-Quiles, “A multilevel state estimation paradigm for smart grids,” Proc.of the IEEE, vol. 99, no. 6, pp. 952–976, Jun. 2011.
[107] G. W. Arnold, “Challenges and opportunities in smart grid: A positionarticle,” Proc. of the IEEE, vol. 99, no. 6, pp. 922–927, Jun. 2011.
[108] Power Monitors Inc., http://www.powermonitors.com/.[109] ITU-R Rec. BS.1387, “Method for objective measurements of per-
ceived audio quality,” ITU, Geneva, Switzerland, 1998.[110] Z. Wang, A. C. Bovik, H. R. Sheikh, and E. P. Simoncelli,“Image
quality assessment: From error visibility to structural similarity,” IEEETrans. on Image Proc., vol. 13, no. 4, pp. 600–612, Apr. 2004.
[111] M. Kezunovic and M. Rikalo, “Automating the analysis of faults andpower quality,”IEEE Comp. Apps. in Power, vol. 12, no. 1, pp. 46–50,Jan. 1999.
[112] V. Stankovic, L. Stankovic, W. Shuang, and S. Cheng, “Distributedcompression for condition monitoring of wind farms,”IEEE Transac-tions on Sustainable Energy, vol. 4, no. 1, pp. 174–181, Jan. 2013.
Michel P. Tcheou was born in Rio de Janeiro,Brazil. He received the Engineering degree in elec-tronics from Federal University of Rio de Janeiro(UFRJ) in 2003, the M.Sc. and D.Sc. degrees inElectrical Engineering from COPPE/UFRJ in 2005and 2011, respectively. He has worked at the ElectricPower Research Center (Eletrobras Cepel) in Riode Janeiro, Brazil, from 2006 to 2011. Since 2012he has been with the Department of Electronicsand Communications Engineering (the undergradu-ate dept.) at Rio de Janeiro State University (UERJ).He has also been with the Postgraduate in Electron-
ics Program. His research interests are in signal processing, communications,data compression and numerical optimization.
Lisandro Lovisolo was born in Neuquen, Argentina,but considers himself brazilian. He received theElectronics Engineering degree from UniversidadeFederal do Rio de Janeiro, in 1999, the M.Sc. degreein Electrical Engineering in 2001, and the D.Scdegree in Electrical Engineering both from Univer-sidade Federal do Rio de Janeiro (COPPE/UFRJ).Since 2003 he has been with the Department ofElectronics and Communications Engineering (theundergraduate dept.), UERJ. He has also been withthe Postgraduate in Electronics Program, since 2008.His research interests lie in the fields of digital signal
and image processing, communications, and computer science.
Moisés V. Ribeiro (S’03, M’05, SM’10) receivedBachelor Degree in Electrical Engineering from theFederal University of Juiz de Fora (UFJF), Brazil,in 1999; M.Sc. and D.Sc. Degrees in ElectricalEngineering from the University of Campinas (UNI-CAMP), Brazil, in 2001 and 2005, respectively. Hewas Visiting Scholar at University of California inSanta Barbara in 2004. Also, He was a VisitingProfessor at UFJF from 2005 to 2007. He has beenan Assistant Professor at UFJF since 2007. He wasthe General Chair of the 2010 IEEE ISPLC andGuest Co-Editor for Special Issues in the EURASIP
Journal on Advances in Signal Processing and EURASIP Journal of Electricaland Computer Engineering. He had served as the Secretary of the IEEE Com-Soc TC-PLC. He was awarded Fulbright Visiting Professorship at StanfordUniversity in 2011 and at Princeton University in 2012. He was awardedStudent Awards from IECON’01 and ISIE’03. Dr. Ribeiro co-founded Smarti9Ltda in 2012.
Eduardo A. B. da Silva (M’95, SM’05) was born inRio de Janeiro, Brazil. He received the ElectronicsEngineering degree from Instituto Militar de En-genharia (IME), Brazil, in 1984, the M.Sc. degreein Electrical Engineering from Universidade Federaldo Rio de Janeiro (COPPE/UFRJ) in 1990, and thePh.D. degree in Electronics from the University ofEssex, England, in 1995.
In 1987 and 1988 he was with the Departmentof Electrical Engineering at Instituto Militar de En-genharia, Rio de Janeiro, Brazil. Since 1989 he hasbeen with the Department of Electronics Engineer-
ing (the undergraduate dept.), UFRJ. He has also been with the Departmentof Electrical Engineering (the graduate studies dept.), COPPE/UFRJ, since1996. His teaching and research interests lie in the fields ofdigital signal,image and video processing. In these fields, he has publishedover 200 peerreviewed papers. He won the British Telecom Postgraduate Publication Prizein 1995, for his paper on aliasing cancellation in subband coding. He isalso co-author of the book "Digital Signal Processing - System Analysis andDesign", published by Cambridge University Press, in 2002,that has also beentranslated to the Portuguese and Chinese languages, whose second edition hasbeen published in 2010.
He has served as associate editor of the IEEE Transactions onCircuits andSystems - Part I, in 2002, 2003, 2008 and 2009, of the IEEE Transactions onCircuits and Systems - Part II in 2006 and 2007, and of Multidimensional,Systems and Signal Processing, Springer since 2006. He has been a Distin-guished Lecturer of the IEEE Circuits and Systems Society in2003 and 2004.He was Technical Program Co-Chair of ISCAS2011. He is a senior memberof the IEEE, of the Brazilian Telecommunication Society, and also a memberof the Brazilian Society of Television Engineering. His research interests liein the fields of signal and image processing, signal compression, digital TVand pattern recognition, together with its applications totelecommunicationsand the oil and gas industry.
Marco Antonio Macciola Rodrigues was born inRio de Janeiro, Brazil, in 1964. He received theEngineering degree in electronics, the M.S. and theD.S. degrees in electrical engineering from the Uni-versity of Rio de Janeiro in 1986, 1991, and 1999,respectively. He has been working at the ElectricPower Research Center (Eletrobras Cepel) in Riode Janeiro, Brazil, since 1987, in data acquisitionsystems design, software design, algorithms for dataanalysis, control and signal processing applicationsrelated to power systems.
João Marcos T. Romano was born in Rio deJaneiro in 1960. He received the B.S. and M.S.degree in Electrical Engineering from the Universityof Campinas (UNICAMP), Brazil, in 1981 and 1984respectively. In 1987 he received the Ph.D. degreefrom the University of Paris-XI, Orsay. In 1988 hejoined the School of Electrical and Computer Engi-neering at UNICAMP, where he is now Professor. Healso served as an Invited Professor at the UniversityRené Descartes in Paris, in the Communicationsand Electronic Laboratory - CNAM/Paris and in theSATIE Lab at the École Normale Supérieure de
Cachan.He is the head of the Signal Processing for Communications Laboratory
at UNICAMP and his research interest concern adaptive and unsupervisedsignal processing with applications in telecommunications and geophysics.
Prof. Romano was the President of the Brazilian Communications Society(SBrT), a sister society of ComSoc-IEEE, from 2000 to 2004 and he is now theEditor-in-Chief of the IEEE/SBrT Journal of Communications and InformationSystems (JCIS). He was the Vice-Director of the School of Electrical andComputer Engineering – UNICAMP from 2003 to 2007. Since 1988, he is arecipient of the Research Fellowship of CNPq-Brazil. He is aSenior Memberof IEEE and SBrT.
Paulo S. R. Diniz was born in Niterói, Brazil.He received the Electronics Eng. degree (CumLaude) from the Federal University of Rio deJaneiro (UFRJ) in 1978, the M.Sc. degree fromCOPPE/UFRJ in 1981, and the Ph.D. from Concor-dia University, Montreal, P.Q., Canada, in 1984, allin electrical engineering.
Since 1979 he has been with the Departmentof Electronic Engineering (the undergraduate dept.)UFRJ. He has also been with the Program ofElectrical Engineering (the graduate studies dept.),COPPE/UFRJ, since 1984, where he is presently a
Professor. He served as Undergraduate Course Coordinator and as Chairmanof the Graduate Department. He has received the Rio de Janeiro State Scientistaward, from the Governor of Rio de Janeiro state.
12
From January 1991 to July 1992, he was a visiting Research Associatein the Department of Electrical and Computer Engineering ofUniversity ofVictoria, Victoria, B.C., Canada. He also held a Docent position at HelsinkiUniversity of Technology. From January 2002 to June 2002, hewas a MelchorChair Professor in the Department of Electrical Engineering of Universityof Notre Dame, Notre Dame, IN, USA. His teaching and researchinterestsare in analog and digital signal processing, adaptive signal processing, dig-ital communications, wireless communications, multiratesystems, stochasticprocesses, and electronic circuits. He has published several refereed papersin some of these areas and wrote the text booksADAPTIVE FILTERING:Algorithms and Practical Implementation, Fourth Edition, Springer, NY, 2013,and DIGITAL SIGNAL PROCESSING: System Analysis and Design, SecondEdition, Cambridge University Press, Cambridge, UK, 2010 (with E. A. B. daSilva and S. L. Netto), and the monographBLOCK TRANSCEIVERS: OFDMand Beyond, Morgan & Claypool, New York, NY, 2012 (W. A. Martins, andM. V. S. Lima).
He has served as the Technical Program Chair of the 1995 MWSCASheld in Rio de Janeiro, Brazil. He was the General co-Chair ofthe IEEEISCAS2011, and Technical Program co-Chair of the IEEE SPAWC2008. Hehas also served Vice President for region 9 of the IEEE Circuits and SystemsSociety and as Chairman of the DSP technical committee of thesame Society.He is also a Fellow of IEEE. He has served as associate editor for thefollowing Journals: IEEE Transactions on Circuits and Systems II: Analogand Digital Signal Processing from 1996 to 1999, IEEE Transactions onSignal Processing from 1999 to 2002, and the Circuits, Systems and SignalProcessing Journal from 1998 to 2002. He was a distinguishedlecturer of theIEEE Circuits and Systems Society for the year 2000 to 2001. In 2004 heserved as distinguished lecturer of the IEEE Signal Processing Society andreceived the 2004 Education Award of the IEEE Circuits and Systems Society.He also holds some best-paper awards from conferences and from an IEEEjournal.