THE CONNECTICUT ECONOMIC DIGEST 1 April 2018 APRIL 2018 Economic Indicators on the Overall Economy ......................... 5 Individual Data Items ......................... 6-8 Comparative Regional Data .............. 9 Economic Indicator Trends ........ 10-11 Help Wanted OnLine ........................ 15 Business and Employment Changes Announced in the News Media ...... 19 Labor Market Areas: Nonfarm Employment .................... 12-17 Sea. Adj. Nonfarm Employment .......... 14 Labor Force ............................................ 18 Hours and Earnings .............................. 19 Cities and Towns: Labor Force ..................................... 20-21 Housing Permits .................................... 22 Technical Notes ............................... 23 At a Glance ....................................... 24 Connecticut Exports: 2017 in Review ......................... 1-3 Connecticut’s Path to More Affordable Housing ........ 4-5 IN THIS ISSUE... In February... Nonfarm Emplo yment Connecticut ..................... 1,692,000 Change over month ........... +0.15% Change over year ............... +0.48% United States .............. 148,177,000 Change over month ........... +0.21% Change over year ............... +1.56% Unemplo yment Rate Connecticut ............................. 4.6% United States .......................... 4.1% Consumer Price Inde x United States ...................... 248.991 Change over year .................. +2.2% 2 Connecticut Exports: 2017 in Review E CONOMIC D IGEST THE CONNECTICUT Vol.23 No.4 A joint publication of the Connecticut Department of Labor & the Connecticut Department of Economic and Community Development By Laura Jaworski, Office of International and Domestic Business Development, DECD 017 was a year in which international relations dominated the news headlines. Whether it was talk of the renegotiation of NAFTA and other free trade agreements, the status of the Trans-Pacific Partnership, currency manipulation and commodity dumping, the threat of a nuclear armed North Korea or entry and/or withdrawal from global pacts, geopolitics was front and center. Recently, President Trump signed an order on new tariffs on imported steel and aluminum. With such tariff increases, analysis must happen as to the potential impact on the defense industry, its subcontractors and supply chain. Will trade partners retaliate? What will be the impact on sales? As a defense-oriented state, Connecticut must monitor the evolution of such discussions. In the meantime, a review of the state’s 2017 export position follows. Annual Export Figures In 2017, Connecticut’s commodity exports totaled $14.75 billion, a 2.53% increase and positive upswing from the $14.39 billion registered in 2016. It is important to note, as significant as commodity exports are, they omit service exports, for which the collection of data is inexact and unavailable at the state level. All U.S. states face this data gap. This means that export figures for a state like Connecticut- with a large concentration of insurance, financial and other services- understate the true magnitude of its overall export value. 1 Data indicates that 5,717 companies exported from Connecticut in 2014. 89% of these companies were small and medium-sized enterprises (SMEs) with fewer than 500 employees. SMEs account for 23% of Connecticut commodity exports. In 2015, 70,038 U.S. jobs were supported by goods exported from Connecticut. 2 Connecticut’s export ranking among the states has held steady for many years. As in previous years, in 2017 Connecticut ranked 27 th in the U.S. Texas, California, Washington, New York and Illinois were the top five export states in 2017, ranked in terms of export commodity dollars. Among all the states, West Virginia experienced the greatest percentage increase in 2017 at 42.29%, likely due to a surge in the state’s coal and natural gas exports. U.S. Exports U.S. commodity exports rebounded in 2017 and totaled more than $1.54 trillion in 2017, representing a 6.60% increase over the $1.45 trillion recorded in 2016. Due to geographic proximity and NAFTA, it should come as no surprise that Canada and Mexico were the top two destinations for U.S. exports in
Transcript
THE CONNECTICUT ECONOMIC DIGEST 1April 2018
APRIL 2018
Economic Indicators on the Overall Economy ......................... 5 Individual Data Items ......................... 6-8Comparative Regional Data .............. 9Economic Indicator Trends ........ 10-11Help Wanted OnLine ........................ 15Business and Employment ChangesAnnounced in the News Media ...... 19Labor Market Areas: Nonfarm Employment .................... 12-17 Sea. Adj. Nonfarm Employment ..........14 Labor Force ............................................ 18 Hours and Earnings .............................. 19Cities and Towns: Labor Force ..................................... 20-21 Housing Permits .................................... 22Technical Notes ............................... 23At a Glance ....................................... 24
Connecticut’s Path to MoreAffordable Housing ........ 4-5
IN THIS ISSUE...
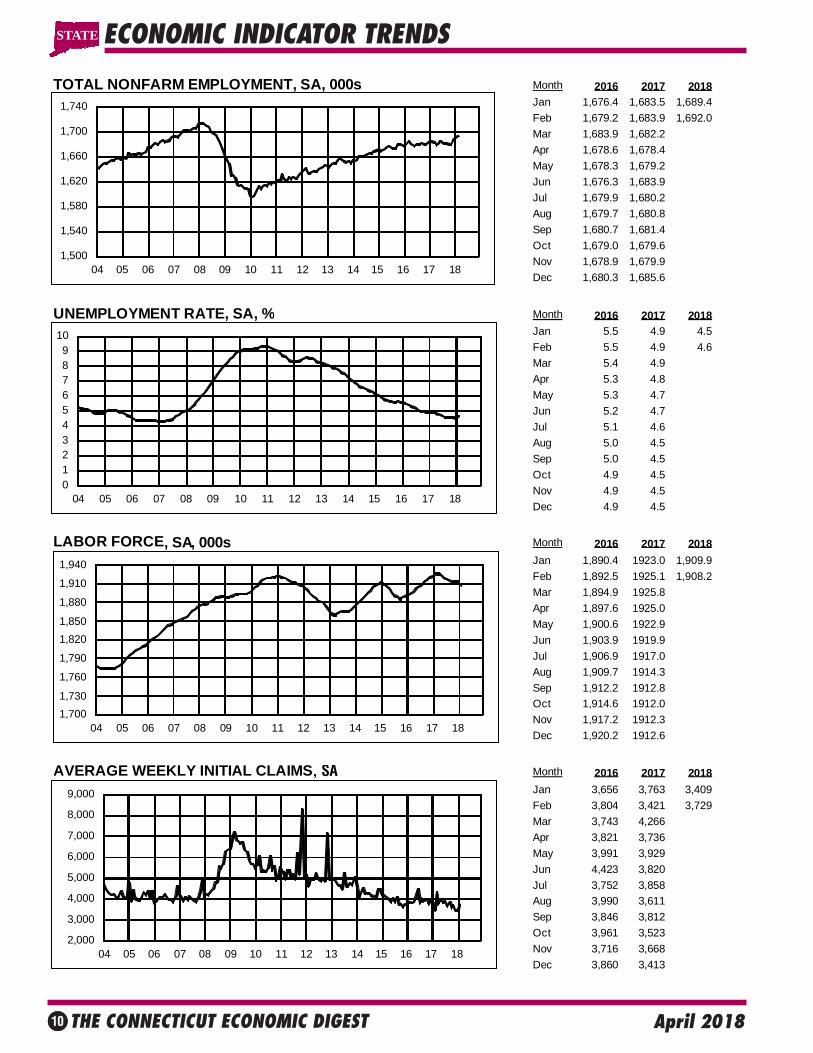
In February...Nonfarm Employment Connecticut..................... 1,692,000 Change over month ........... +0.15% Change over year ............... +0.48%
United States .............. 148,177,000 Change over month ........... +0.21% Change over year ............... +1.56%
Unemployment Rate Connecticut............................. 4.6% United States .......................... 4.1%
Consumer Price Index United States ...................... 248.991 Change over year .................. +2.2%
2
Connecticut Exports: 2017in Review
ECONOMIC DIGESTTHE CONNECTICUT
Vol.23 No.4 A joint publication of the Connecticut Department of Labor & the Connecticut Department of Economic and Community Development
By Laura Jaworski, Office of International and Domestic BusinessDevelopment, DECD
017 was a year in whichinternational relations
dominated the news headlines.Whether it was talk of therenegotiation of NAFTA and otherfree trade agreements, the statusof the Trans-Pacific Partnership,currency manipulation andcommodity dumping, the threatof a nuclear armed North Koreaor entry and/or withdrawal fromglobal pacts, geopolitics was frontand center. Recently, PresidentTrump signed an order on newtariffs on imported steel andaluminum. With such tariffincreases, analysis must happenas to the potential impact on thedefense industry, itssubcontractors and supply chain.Will trade partners retaliate?What will be the impact on sales?As a defense-oriented state,Connecticut must monitor theevolution of such discussions. Inthe meantime, a review of thestate’s 2017 export positionfollows.
Annual Export Figures In 2017, Connecticut’scommodity exports totaled $14.75billion, a 2.53% increase andpositive upswing from the $14.39billion registered in 2016. It isimportant to note, as significantas commodity exports are, theyomit service exports, for whichthe collection of data is inexactand unavailable at the state level.All U.S. states face this data gap.This means that export figures for
a state like Connecticut- with alarge concentration of insurance,financial and other services-understate the true magnitude ofits overall export value.1
Data indicates that 5,717companies exported fromConnecticut in 2014. 89% of thesecompanies were small andmedium-sized enterprises (SMEs)with fewer than 500 employees.SMEs account for 23% ofConnecticut commodity exports.In 2015, 70,038 U.S. jobs weresupported by goods exported fromConnecticut.2
Connecticut’s export rankingamong the states has held steadyfor many years. As in previousyears, in 2017 Connecticut ranked27th in the U.S. Texas, California,Washington, New York and Illinoiswere the top five export states in2017, ranked in terms of exportcommodity dollars. Among all thestates, West Virginia experiencedthe greatest percentage increase in2017 at 42.29%, likely due to asurge in the state’s coal andnatural gas exports.
U.S. Exports U.S. commodity exportsrebounded in 2017 and totaledmore than $1.54 trillion in 2017,representing a 6.60% increaseover the $1.45 trillion recorded in2016. Due to geographicproximity and NAFTA, it shouldcome as no surprise that Canadaand Mexico were the top twodestinations for U.S. exports in
THE CONNECTICUT ECONOMIC DIGEST2 April 2018
ConnecticutDepartment of Labor
Connecticut Departmentof Economic andCommunity Development
THE CONNECTICUT
The Connecticut Economic Digest ispublished monthly by the ConnecticutDepartment of Labor, Office of Research, andthe Connecticut Department of Economic andCommunity Development. Its purpose is toregularly provide users with a comprehensivesource for the most current, up-to-date dataavailable on the workforce and economy of thestate, within perspectives of the region andnation.
The annual subscription is $50. Sendsubscription requests to: The ConnecticutEconomic Digest, Connecticut Department ofLabor, Office of Research, 200 Folly BrookBoulevard, Wethersfield, CT 06109-1114.Make checks payable to the ConnecticutDepartment of Labor. Back issues are $4 percopy. The Digest can be accessed free ofcharge from the DOL Web site. Articles fromThe Connecticut Economic Digest may bereprinted if the source is credited. Please sendcopies of the reprinted material to the ManagingEditor. The views expressed by the authors aretheirs alone and may not reflect those of theDOL or DECD.
Managing Editor: Jungmin Charles Joo
Associate Editor: Erin C. Wilkins
We would like to acknowledge the contributionsof many DOL Research and DECD staff andRob Damroth to the publication of the Digest.
Scott D. Jackson, CommissionerKurt Westby, Deputy Commissioner
Andrew Condon, Ph.D., DirectorOffice of Research200 Folly Brook BoulevardWethersfield, CT 06109-1114Phone: (860) 263-6275Fax: (860) 263-6263E-Mail: [email protected]: http://www.ctdol.state.ct.us/lmi
ECONOMIC DIGEST2017, followed by China, Japanand the United Kingdom.
New England Exports In New England in 2017, onlyMassachusetts’ exports valueranked higher than Connecticut’s,as has been the case since 2005.As a regional trading block, NewEngland’s commodity exportstotaled more than $55.25 billion in2017, a 5.11% increase from2016. The top five exportdestinations for New Englandcommodities were Canada,Mexico, Germany, China and theUnited Kingdom.
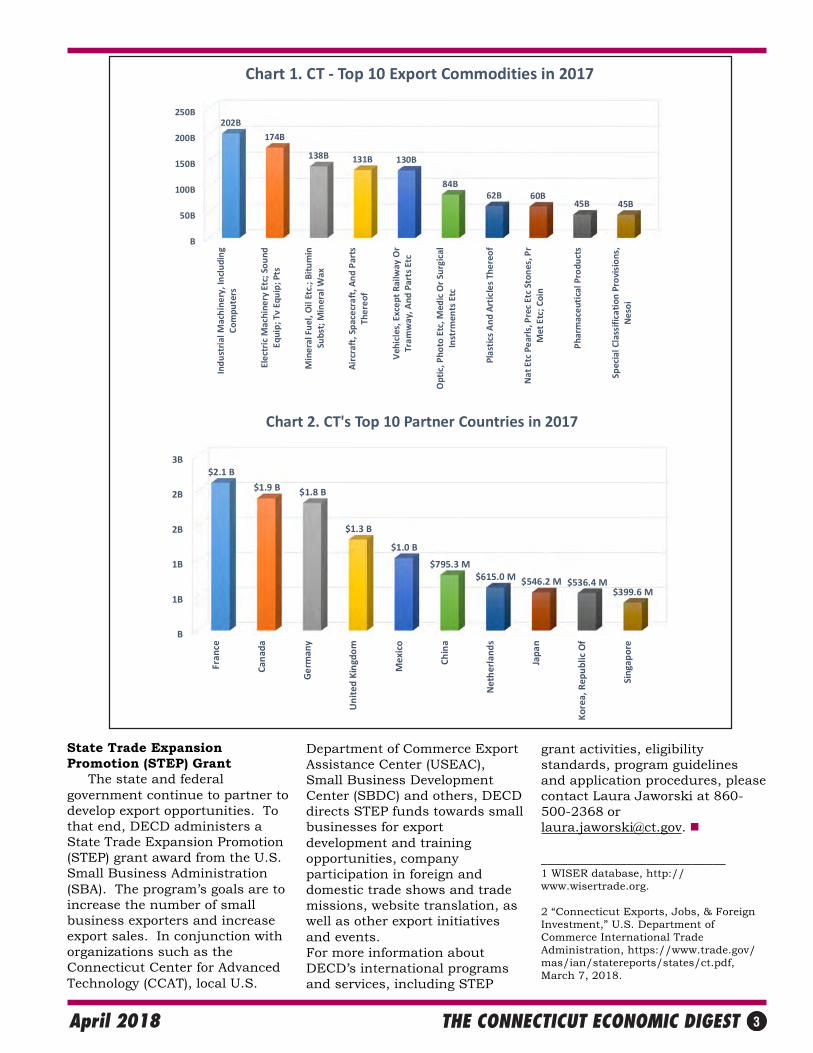
Connecticut ExportComposition Connecticut’s top exportcommodities mirror the state’sadvanced manufacturingstrengths and there is ademonstrated consistency amongthe state’s top exports. 2017 wasno exception. Last year at thetwo-digit Harmonized System (HS)commodity code level,Connecticut’s top five exportcommodities were (1) aircraft,spacecraft and parts thereof; (2)industrial machinery, includingcomputers; (3) optic, photo,medical or surgical instruments;(4) electric machinery, soundequipment, TV equipment, partsand (5) special classificationprovisions, not elsewhere specifiedor indicated (Nesoi). The bulk ofspecial classification provisionswere composed of exports ofrepaired imports. Please refer tothe associated Chart 1 for greatervisibility as to the state’s exportstrengths and composition. Drilling down an additionallayer into the HS commodity codesfor greater export insight revealsthe transportation sector’sdominance of Connecticut exportsin the aerospace and defenseindustry. At the four-digit HSlevel, the state’s top exportsincluded civilian aircraft, engines,parts; exports of repaired imports;and turbojets, turbopropellers. To put these figures intonational and regional context, the
U.S. and New England states’ topexport commodities were similarto Connecticut’s. In 2017, thetop five U.S. export commoditieswere (1) industrial machinery,including computers; (2) electricmachinery, sound equipment, TVequipment, parts; (3) mineralfuel, oil, bitumin substances,mineral wax; (4) aircraft,spacecraft and parts thereof and(5) vehicles, except railway ortramway, and parts. In 2017, theNew England region’s top fiveexport commodities were (1)electric machinery, soundequipment, TV equipment, parts;(2) industrial machinery,including computers; (3) optic,photo, medical or surgicalinstruments; (4) aircraft,spacecraft, and parts thereof and(5) natural or cultured pearls,precious stones, precious metalclad materials, imitation jewelryand coins.
State Export Partners The state’s top ten commodityexport destinations were France,Canada, Germany, the UnitedKingdom, Mexico, China, theNetherlands, Japan, Korea andSingapore (Chart 2). Connecticutexported over $1 billion to eachof its top five trade partners in2017, with over $2.11 billiondirected to France. Among thestate’s top ten partners, all buttwo experienced export increases,the most significant percentageincreases belonging to the UnitedKingdom (45.72%) and SouthKorea (47.10%). Connecticutexports of aircraft, spacecraft,parts and organic chemicalsincreased substantially to theU.K., while state exports ofelectric machinery; stone,plaster, cement; and railway,tramway stock and traffic signalequipment increased markedly toSouth Korea, perhaps due tobuild-out and ramp up for theinfrastructure and events of thePyeongChang 2018 WinterOlympics.
THE CONNECTICUT ECONOMIC DIGEST 3April 2018
State Trade ExpansionPromotion (STEP) Grant The state and federalgovernment continue to partner todevelop export opportunities. Tothat end, DECD administers aState Trade Expansion Promotion(STEP) grant award from the U.S.Small Business Administration(SBA). The program’s goals are toincrease the number of smallbusiness exporters and increaseexport sales. In conjunction withorganizations such as theConnecticut Center for AdvancedTechnology (CCAT), local U.S.
Department of Commerce ExportAssistance Center (USEAC),Small Business DevelopmentCenter (SBDC) and others, DECDdirects STEP funds towards smallbusinesses for exportdevelopment and trainingopportunities, companyparticipation in foreign anddomestic trade shows and trademissions, website translation, aswell as other export initiativesand events.For more information aboutDECD’s international programsand services, including STEP
B
50B
100B
150B
200B
250B
Industrial M
achinery, Including
Computers
Electric Machinery Etc; Sound
Equip; Tv Equip; Pts
Mineral Fuel, O
il Etc.; Bitumin
Subst; Mineral W
ax
Aircraft, Spacecraft, A
nd Parts
Thereof
Vehicles, Except Railway Or
Tramway, A
nd Parts Etc
Optic, Photo Etc, M
edic Or Surgical
Instrm
ents Etc
Plastics And Articles Thereof
Nat Etc Pearls, Prec Etc Stones, Pr
Met Etc; Coin
Pharmaceutical Products
Special Classification Provisions,
Nesoi
202B
174B
138B 131B 130B
84B62B 60B
45B 45B
Chart 1. CT ‐ Top 10 Export Commodities in 2017
B
1B
1B
2B
2B
3B
Fran
ce
Can
ada
Germ
any
United
Kingdom
Mexico
China
Netherlands
Japan
Korea, Rep
ublic Of
Singapore
$2.1 B
$1.9 B $1.8 B
$1.3 B
$1.0 B
$795.3 M$615.0 M $546.2 M $536.4 M
$399.6 M
Chart 2. CT's Top 10 Partner Countries in 2017
grant activities, eligibilitystandards, program guidelinesand application procedures, pleasecontact Laura Jaworski at 860-500-2368 [email protected].
2 “Connecticut Exports, Jobs, & ForeignInvestment,” U.S. Department ofCommerce International TradeAdministration, https://www.trade.gov/mas/ian/statereports/states/ct.pdf,March 7, 2018.
THE CONNECTICUT ECONOMIC DIGEST4 April 2018
S
Connecticut’s Path to More Affordable HousingBy Al Sylvestre, Research Analyst, DOL
residential market is a significantchallenge for the state’s workforce.What follows is a brief overview ofsome of the conundrum’scomponents and some methods landuse planners and policy makersemploy to smooth the path to moreaffordable housing.
Challenges According to the Partnership forStrong Communities, Connecticuthas the sixth highest housing cost inthe US while nearly a third of thepopulation in 102 of its 169 citiesand towns are spending at least 30%of their incomes on housing asshown on the map. As the housingcost burden rises with age, morehouseholds headed by persons overage 60 in a state with the sixth oldestpopulation in the nation will findtheir incomes stretched more thinly.As people with disabilities and thoseabove age 60 re-enter or remain inthe workforce longer, access tohousing becomes more difficultbecause:
• Fewer unmodified homes in the
northeast are accessible to older
residents who must cope withstairs and narrow doorways;
• Half of Connecticut’s population
older than 60 live in automobile-dependent communities;
• Members of the baby boom
generation (born 1946-1964) willhave difficulty selling their largehomes to offspring who cannotafford to buy them; and
• Younger generations are uncertain
about home ownership that isinconsistent with their desire tolive in smaller homes or move outof state to find better-paying jobs.
As baby boomers live and worklonger, mobility impairmentbecomes an independent-livingbarrier, as younger people move todensely populated areas and out ofstate. For the so-called millennialgeneration (born 1985-2003),housing affordability challenges aremanifested in the same and differentways as their elders’. The 2008-2010 recession slowed householdformation raising the question:
• Will millennials buy or rent their
elders’ homes?
While:
• The Urban Land Institute says 13%
of millennials live in central citiesand
• Many do not want the expense and
inconvenience of car ownership;
Substantial student loan debt hascaused some millennials to delayhome purchase decisions. Othersmay opt for condominium ratherthan detached-house ownership thatrequires more maintenance and islikely to be farther away fromtransportation.
Elements of Successful AffordableHousing Production To overcome affordable housingbarriers, planners, developers, andelected leaders of Connecticut’s citiesand towns must educate theircommunities about the need for suchhousing. Community-buildingconsultant David Fink stated that:
• Grand list (the municipality’s
combined value of real andpersonal property) losses orstagnation affect 152 ofConnecticut’s 169 cities and towns;
• Half of the two million people living
in New York who were bornbetween 1985 and 2003 willrelocate;
• In the town of Fairfield, 86% of its
housing is for single family usewhile 2% of its housing isaffordable to people earning lessthan 80% of area median income(AMI).
In early 2018, the Partnership forStrong Communities broughttogether planning and developmentprofessionals with public officials todiscuss the methods they use toincrease affordable housingproduction. The town of Fairfield’s communitydevelopment office strives to attract
THE CONNECTICUT ECONOMIC DIGEST 5April 2018
GENERAL ECONOMIC INDICATORS
Sources: *Dr. Steven P. Lanza, University of Connecticut **Farmington Bank ***Federal Reserve Bank of Philadelphia
General Drift Indicators are composite measures of the four-quarter change in three coincident (Connecticut Manufacturing Production Index, nonfarm employment, andreal personal income) and three leading (housing permits, manufacturing average weekly hours, and initial unemployment claims) economic variables, and are indexed so1996 = 100.
The Farmington Bank Business Barometer is a measure of overall economic growth in the state of Connecticut that is derived from non-manufacturing employment,real disposable personal income, and manufacturing production.
The Philadelphia Fed’s Coincident Index summarizes current economic condition by using four coincident variables: nonfarm payroll employment, average hoursworked in manufacturing, the unemployment rate, and wage and salary disbursements deflated by the consumer price index (U.S. city average).
affordable housing by making it aneconomic development goal.Framing the issue as one of localcontrol and oversight promotesdiscussion and action on affordablehousing. This approach helpspersuade Fairfield residents that it isin their interest to support affordablehousing production. As a result,community groups developconsensus on the town’s approach toaffordable housing. From thosediscussions, an inclusionary zoningordinance proposal requiring a 10%set-aside of affordable units indevelopments of ten or moreresidences was written. The town of Bethel’s affordablehousing production experienceincludes working with its housingauthority while developers have usedprovisions of CGS 8-30g1 to produceaffordable units. In addition toestablishing an affordable housingtrust fund, Bethel won an incentivehousing zone (IHZ) grant from thestate Office of Policy andManagement to plan for a zoningordinance supporting affordablehousing. Town leaders discussedtransit oriented development withcommunity participants resulting ina TOD plan calling for both theelderly and young people to benefitfrom a 20% set-aside of affordableunits that included increasingdensity from 10 to 30 units per acre.Building rental housing is anothersolution to Bethel’s affordablehousing shortage. New Canaan’s affordable housingincludes 113 recently-built units, 34(30%) of which are affordable; town
officials worked with developers andthe housing authority to expand thenumber from 34 to 40 (35%). Thetown planning and zoningcommission (TPZ) chairmanfamiliarized himself with CGS 8-30gto identify parcels suitable foraffordable housing. New Canaan’shousing authority used 8-30gprovisions to develop affordablehousing on its property. Finally, thetown established an affordablehousing trust funded by a 1%assessment on all town-issuedbuilding permits. Recognition of its affordablehousing need led Newtown toencourage developments of greaterdensity in the five villages thatcomprise the town as its electedleaders persuade town residentsthat this is path to ensuring aprosperous future for Newtown’syounger generations to establishfamilies of their own. To that end,the town commissioned a build-outstudy to determine Newtown’sdevelopment potential. The studyfound that large-lot zoning impedesaffordable housing production. As aresult, the TPZ met with developersto discuss ways to increaseaffordable housing production.Newtown then won an IHZ grant tofind affordable housing locationsand facilitate implementation of itsplan of conservation anddevelopment (POCD).
Conclusion While land use planning,legislation, and technical elements ofaffordable housing development areessential to increasing itsavailability, community engagementand acceptance from elected officialsas well as municipal boards andcommissions are essential to moreaffordable housing production.Education about the benefits ofmaking homes affordable across theincome spectrum will overcomeconcerns about the character andlocation of such housing.Community engagement withpatience and openness broughtaffordable housing to a variety ofcommunities with moreopportunities to come. ______________________________1 Connecticut General Statute Section 8-
30g is the affordable housing statutethat permits developers to use anappeals process for an affordable-housing . . . development applicationdenial that requires the subjectmunicipality—in which less than 10%of its housing is . . . affordable tohouseholds earning 60% to 80% ofmedian income—to demonstrate that itis making substantial efforts to providesuch housing in order to prevail in itsdenial of the application. “Medianincome” means . . . the lesser of thestate median income or the areamedian income for the area in whichthe municipality containing theaffordable housing development islocated, as determined by the UnitedStates Department of Housing andUrban Development (ConnecticutGeneral Statutes Chapter 126).
4Q 4Q CHANGE 3Q(Seasonally adjusted) 2017 2016 NO. % 2017General Drift Indicator (1996=100)* Leading NA NA NA NA NA Coincident NA NA NA NA NAFarmington Bank Business Barometer (1992=100)** 135.8 135.7 0.1 0.1 135.8
Philadelphia Fed's Coincident Index (July 1992=100)*** Feb Feb Jan(Seasonally adjusted) 2018 2017 2018 Connecticut 124.09 120.30 3.8 3.2 124.13 United States 122.34 118.96 3.4 2.8 122.02
THE CONNECTICUT ECONOMIC DIGEST6 April 2018
EMPLOYMENT BY INDUSTRY SECTOR
INCOME
Average weekly initial
claims rose from a year
ago.
UNEMPLOYMENT
The production worker
weekly earnings rose
over the year.
MANUFACTURING ACTIVITY
ECONOMIC INDICATORSTotal nonfarm
employment increased
over the year.
Personal income for third
quarter 2018 is
forecasted to increase 1.6
percent from a year
earlier.
Source: Connecticut Department of Labor * Includes Native American tribal government employment
Sources: Connecticut Department of Labor; U.S. Bureau of Labor Statistics
Sources: Connecticut Department of Labor; U.S. Department of Energy*Latest two months are forecasted.
Source: Bureau of Economic Analysis*Forecasted by Connecticut Department of Labor
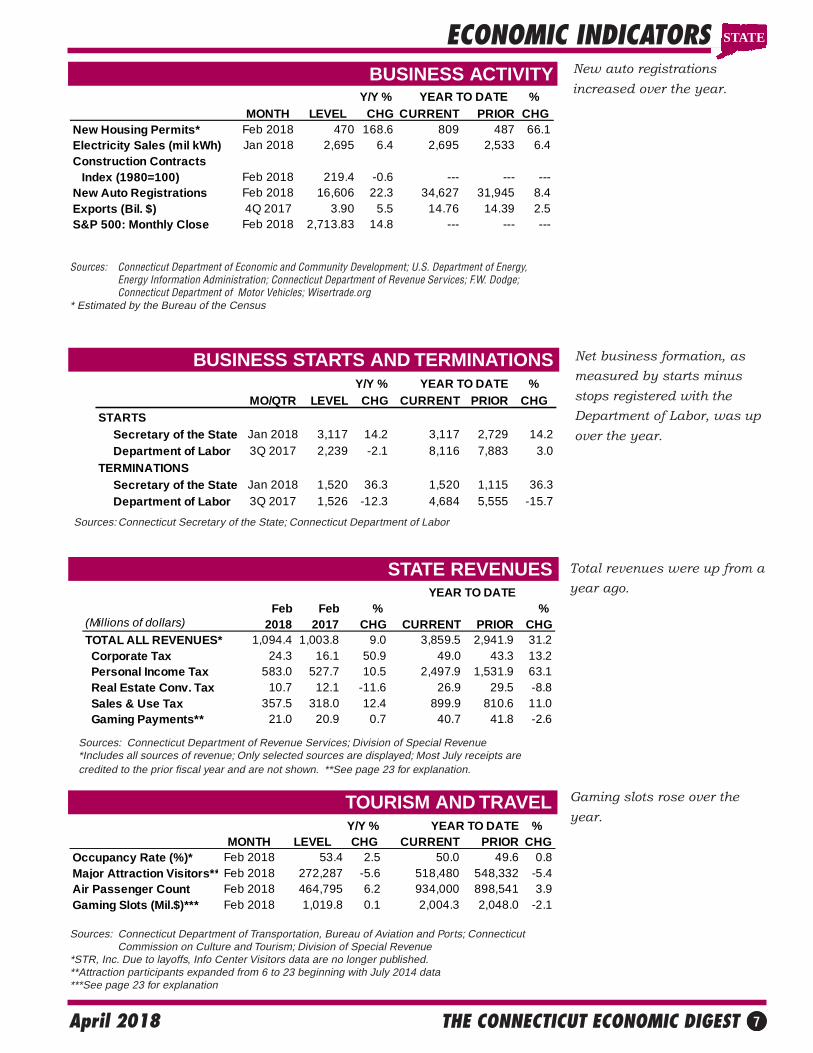
ECONOMIC INDICATORSBUSINESS ACTIVITY New auto registrations
increased over the year.
Gaming slots rose over the
year.
BUSINESS STARTS AND TERMINATIONS Net business formation, as
measured by starts minus
stops registered with the
Department of Labor, was up
over the year.
STATE REVENUES
Sources: Connecticut Department of Economic and Community Development; U.S. Department of Energy,Energy Information Administration; Connecticut Department of Revenue Services; F.W. Dodge;Connecticut Department of Motor Vehicles; Wisertrade.org
* Estimated by the Bureau of the Census
Sources: Connecticut Secretary of the State; Connecticut Department of Labor
Feb Feb % % (Millions of dollars) 2018 2017 CHG CURRENT PRIOR CHGTOTAL ALL REVENUES* 1,094.4 1,003.8 9.0 3,859.5 2,941.9 31.2 Corporate Tax 24.3 16.1 50.9 49.0 43.3 13.2 Personal Income Tax 583.0 527.7 10.5 2,497.9 1,531.9 63.1 Real Estate Conv. Tax 10.7 12.1 -11.6 26.9 29.5 -8.8 Sales & Use Tax 357.5 318.0 12.4 899.9 810.6 11.0 Gaming Payments** 21.0 20.9 0.7 40.7 41.8 -2.6
YEAR TO DATE
Sources: Connecticut Department of Revenue Services; Division of Special Revenue*Includes all sources of revenue; Only selected sources are displayed; Most July receipts arecredited to the prior fiscal year and are not shown. **See page 23 for explanation.
Sources: Connecticut Department of Transportation, Bureau of Aviation and Ports; ConnecticutCommission on Culture and Tourism; Division of Special Revenue
*STR, Inc. Due to layoffs, Info Center Visitors data are no longer published.**Attraction participants expanded from 6 to 23 beginning with July 2014 data***See page 23 for explanation
Y/Y % YEAR TO DATE % MONTH LEVEL CHG CURRENT PRIOR CHG
Occupancy Rate (%)* Feb 2018 53.4 2.5 50.0 49.6 0.8Major Attraction Visitors** Feb 2018 272,287 -5.6 518,480 548,332 -5.4Air Passenger Count Feb 2018 464,795 6.2 934,000 898,541 3.9Gaming Slots (Mil.$)*** Feb 2018 1,019.8 0.1 2,004.3 2,048.0 -2.1
Y/Y % %MO/QTR LEVEL CHG CURRENT PRIOR CHG
STARTS Secretary of the State Jan 2018 3,117 14.2 3,117 2,729 14.2 Department of Labor 3Q 2017 2,239 -2.1 8,116 7,883 3.0
TERMINATIONS Secretary of the State Jan 2018 1,520 36.3 1,520 1,115 36.3 Department of Labor 3Q 2017 1,526 -12.3 4,684 5,555 -15.7
YEAR TO DATE
STATE
Total revenues were up from a
year ago.
Y/Y % YEAR TO DATE % MONTH LEVEL CHG CURRENT PRIOR CHG
New Housing Permits* Feb 2018 470 168.6 809 487 66.1Electricity Sales (mil kWh) Jan 2018 2,695 6.4 2,695 2,533 6.4Construction Contracts Index (1980=100) Feb 2018 219.4 -0.6 --- --- ---New Auto Registrations Feb 2018 16,606 22.3 34,627 31,945 8.4Exports (Bil. $) 4Q 2017 3.90 5.5 14.76 14.39 2.5S&P 500: Monthly Close Feb 2018 2,713.83 14.8 --- --- ---
THE CONNECTICUT ECONOMIC DIGEST8 April 2018
CONSUMER NEWS
EMPLOYMENT COST INDEXCompensation cost for the
nation rose 2.6 percent
over the year.
Conventional mortgage
rate rose to 4.33 percent
over the month.
INTEREST RATES
ECONOMIC INDICATORS
U.S. inflation rate
was up by 2.2 percent
over the year.
Source: U.S. Department of Labor, Bureau of Labor Statistics
Sources: U.S. Department of Labor, Bureau of Labor Statistics; The Conference Board*Change over prior monthly or quarterly period**The Boston CPI can be used as a proxy for New England and is measured every other month.
Sources: Federal Reserve; Federal Home Loan Mortgage Corp.
Feb Jan Feb(Percent) 2018 2018 2017Prime 4.50 4.50 3.75
Federal Funds 1.42 1.41 0.66
3 Month Treasury Bill 1.59 1.43 0.53
6 Month Treasury Bill 1.79 1.62 0.65
1 Year Treasury Note 1.96 1.80 0.82
3 Year Treasury Note 2.36 2.15 1.47
5 Year Treasury Note 2.60 2.38 1.90
7 Year Treasury Note 2.78 2.51 2.2210 Year Treasury Note 2.86 2.58 2.42
20 Year Treasury Note 3.02 2.73 2.76
Conventional Mortgage 4.33 4.03 4.17
Seasonally Adjusted Not Seasonally AdjustedPrivate Industry Workers Dec Sep 3-Mo Dec Dec 12-Mo(Dec. 2005 = 100) 2017 2017 % Chg 2017 2016 % ChgUNITED STATES TOTAL 130.6 130.0 0.5 130.5 127.2 2.6 Wages and Salaries 130.7 129.9 0.6 130.6 127.1 2.8
Benefit Costs 130.5 130.0 0.4 130.2 127.3 2.3
NORTHEAST TOTAL --- --- --- 132.0 128.7 2.6 Wages and Salaries --- --- --- 131.7 128.3 2.7
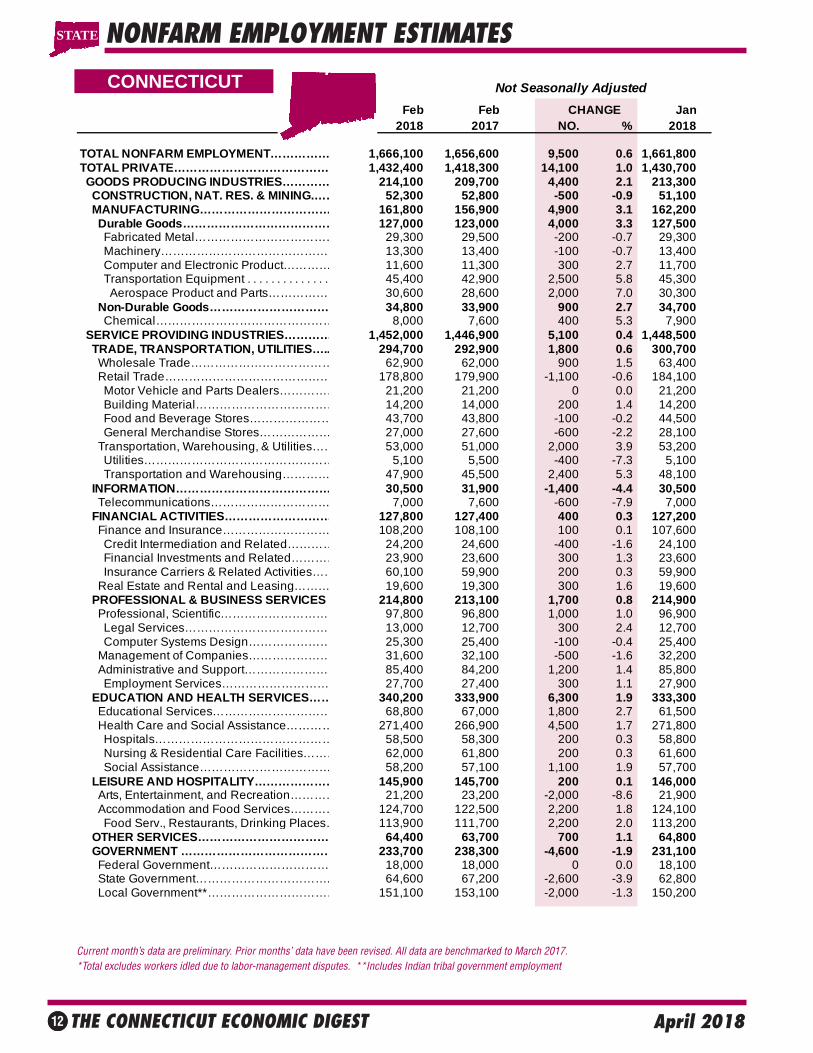
Current month’s data are preliminary. Prior months’ data have been revised. All data are benchmarked to March 2017. *Total excludes workers idled due to labor-management disputes. **Includes Indian tribal government employment
STATE
THE CONNECTICUT ECONOMIC DIGEST 13April 2018
DANBURY LMA
BRIDGEPORT -STAMFORD LMA
NONFARM EMPLOYMENT ESTIMATES
Current month’s data are preliminary. Prior months’ data have been revised. All data are benchmarked to March 2017. *Total excludes workers idled due to labor-management disputes.
Current month’s data are preliminary. Prior months’ data have been revised. All data are benchmarked to March 2017.*Total excludes workers idled due to labor-management disputes
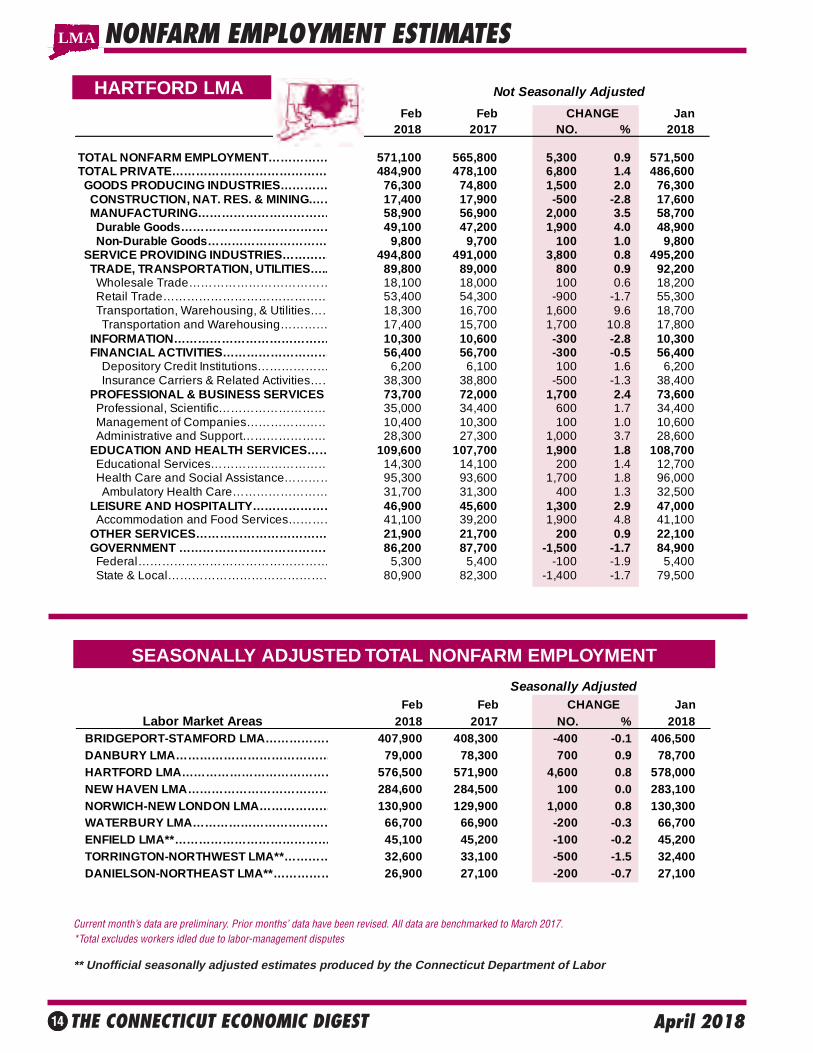
** Unofficial seasonally adjusted estimates produced by the Connecticut Department of Labor
Current month’s data are preliminary. Prior months’ data have been revised. All data are benchmarked to March 2017. *Total excludes workers idled due to labor-management disputes. **Value less than 50
LMA
HELP WANTED ONLINE
* A percent of advertised vacancies per 100 persons in labor forceSource: The Conference Board
CT online labor demandfell 4,600 in February
The Conference Board’s HelpWanted OnLine (HWOL) datareported that there were 68,500advertisements for Connecticut-based jobs in February 2018, a6.3 percent decrease over themonth and a 4.2 percent de-crease over the year. There were3.60 advertised vacancies forevery 100 persons inConnecticut’s labor force, whilenationally it was 2.93 percent.Among the New England states,Massachusetts had the highestlabor demand rate (3.86), whileRhode Island had the lowest rate(2.71).
The Conference Board Help Wanted OnLine® Data Series (HWOL) measures the number ofnew, first-time online jobs and jobs reposted from the previous month for over 16,000 Internet jobboards, corporate boards and smaller job sites that serve niche markets and smaller geographicareas. Background information and technical notes and discussion of revisions to the series areavailable at: www.conference-board.org/data/helpwantedonline.cfm.
Feb Feb Jan(Seasonally adjusted) 2018 2017 2018CT Vacancies (000s) 68.5 71.5 73.1
Hartford Vac. (000s) 27.3 28.3 28.1
Connecticut 3.60 3.76 3.84
United States 2.93 2.84 3.04
Maine 2.87 2.55 3.00
Massachusetts 3.86 3.83 3.84
New Hampshire 3.20 3.19 3.22Rhode Island 2.71 2.66 2.68
Vermont 3.25 3.22 3.33
Labor Demand Rate *
THE CONNECTICUT ECONOMIC DIGEST16 April 2018
NORWICH-NEW LONDON-WESTERLY, CT-RI LMA
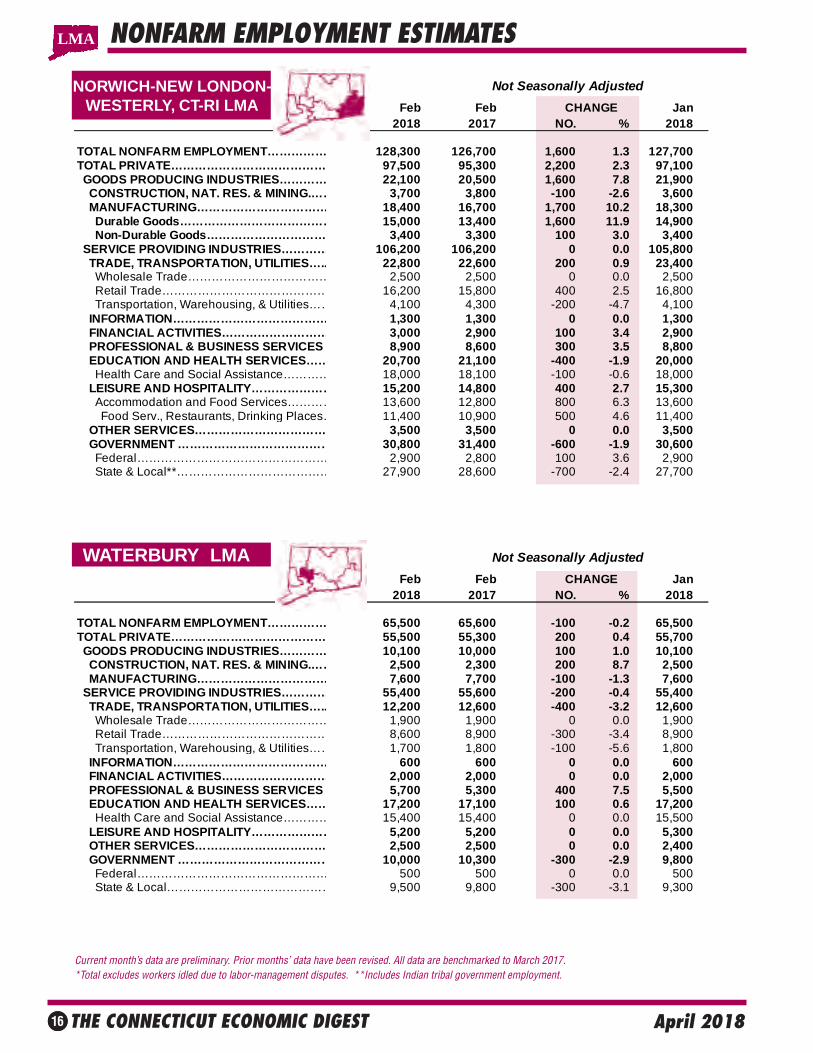
Current month’s data are preliminary. Prior months’ data have been revised. All data are benchmarked to March 2017. *Total excludes workers idled due to labor-management disputes. **Includes Indian tribal government employment.
NOTE: More industry detail data is available for the State and its nine labor market areas at: http://www.ctdol.state.ct.us/lmi/202/covered.htm. The data published there differ from the data in the preced-ing tables in that they are developed from a near-universe count of Connecticut employment covered bythe unemployment insurance (UI) program, while the data here is sample-based. The data drawn fromthe UI program does not contain estimates of employment not covered by unemployment insurance, andis lagged several months behind the current employment estimates presented here.
SMALLER LMAS*
Current month’s data are preliminary. Prior months’ data have been revised. All data are benchmarked to March 2017. *Total excludes workers idled due to labor-management disputes.
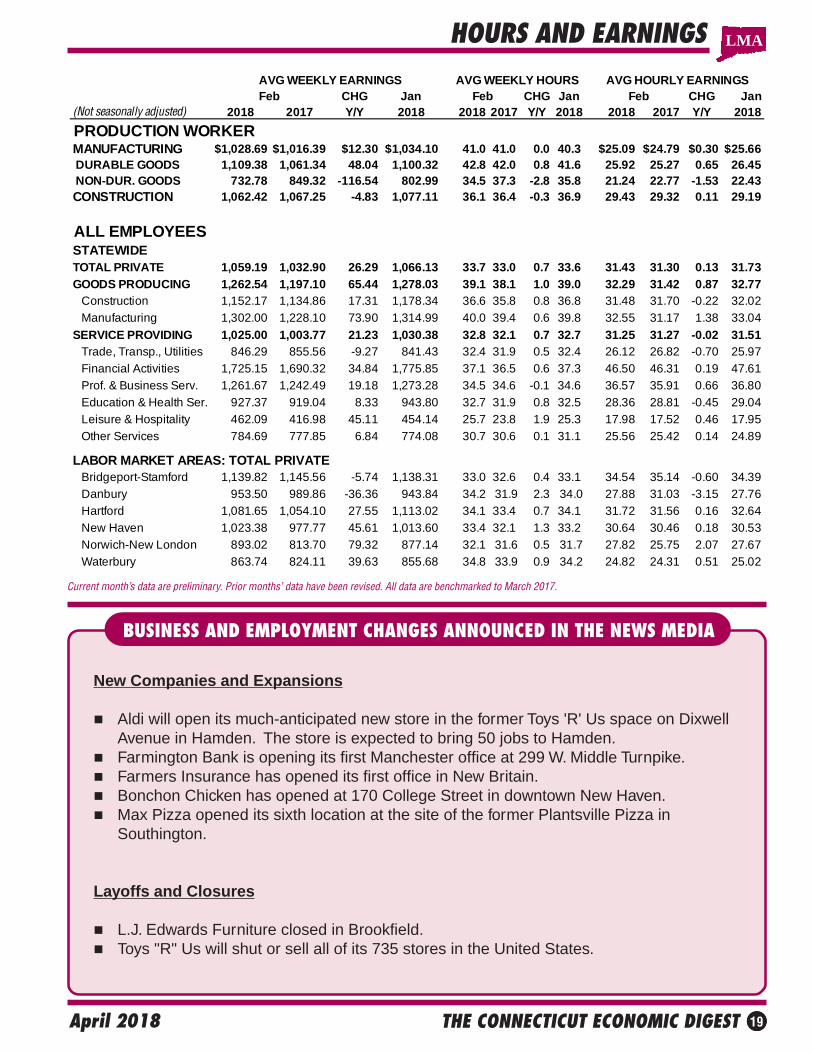
BUSINESS AND EMPLOYMENT CHANGES ANNOUNCED IN THE NEWS MEDIA
New Companies and Expansions
Aldi will open its much-anticipated new store in the former Toys 'R' Us space on DixwellAvenue in Hamden. The store is expected to bring 50 jobs to Hamden.
Farmington Bank is opening its first Manchester office at 299 W. Middle Turnpike. Farmers Insurance has opened its first office in New Britain. Bonchon Chicken has opened at 170 College Street in downtown New Haven. Max Pizza opened its sixth location at the site of the former Plantsville Pizza in
Southington.
Layoffs and Closures
L.J. Edwards Furniture closed in Brookfield. Toys "R" Us will shut or sell all of its 735 stores in the United States.
THE CONNECTICUT ECONOMIC DIGEST20 April 2018
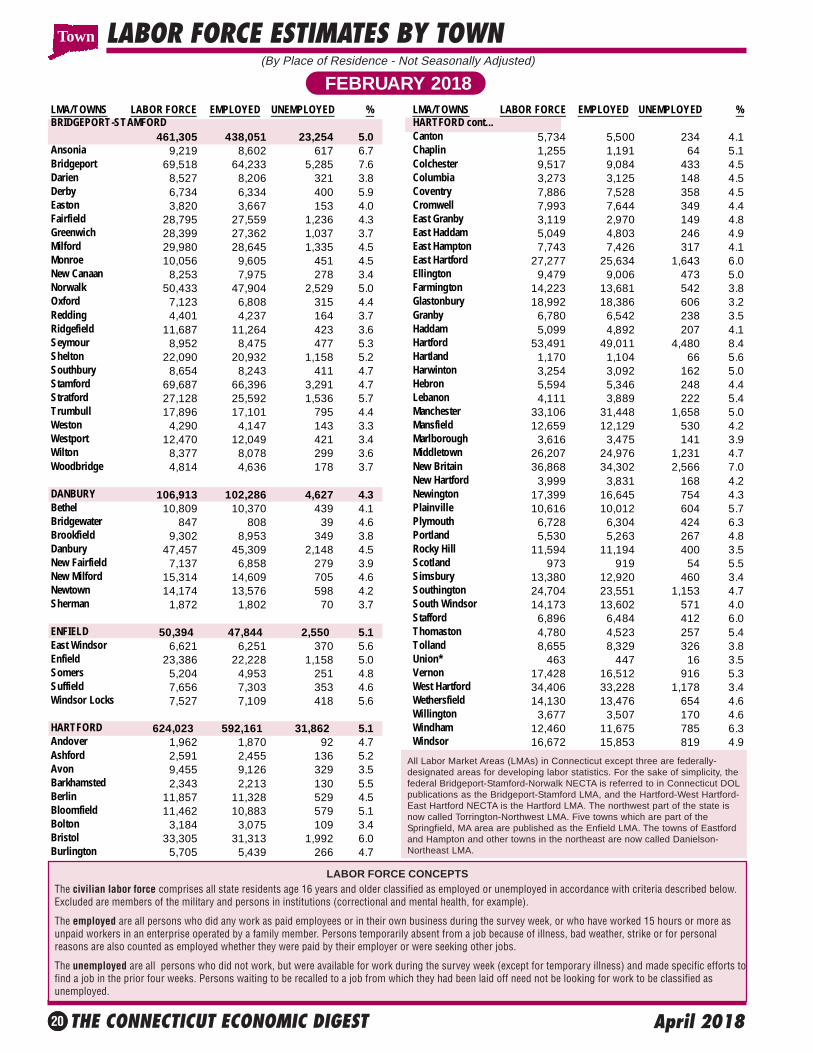
LABOR FORCE ESTIMATES BY TOWN
FEBRUARY 2018(By Place of Residence - Not Seasonally Adjusted)
The civilian labor force comprises all state residents age 16 years and older classified as employed or unemployed in accordance with criteria described below.Excluded are members of the military and persons in institutions (correctional and mental health, for example).
The employed are all persons who did any work as paid employees or in their own business during the survey week, or who have worked 15 hours or more asunpaid workers in an enterprise operated by a family member. Persons temporarily absent from a job because of illness, bad weather, strike or for personalreasons are also counted as employed whether they were paid by their employer or were seeking other jobs.
The unemployed are all persons who did not work, but were available for work during the survey week (except for temporary illness) and made specific efforts tofind a job in the prior four weeks. Persons waiting to be recalled to a job from which they had been laid off need not be looking for work to be classified asunemployed.
LABOR FORCE CONCEPTS
Town
All Labor Market Areas (LMAs) in Connecticut except three are federally-designated areas for developing labor statistics. For the sake of simplicity, thefederal Bridgeport-Stamford-Norwalk NECTA is referred to in Connecticut DOLpublications as the Bridgeport-Stamford LMA, and the Hartford-West Hartford-East Hartford NECTA is the Hartford LMA. The northwest part of the state isnow called Torrington-Northwest LMA. Five towns which are part of theSpringfield, MA area are published as the Enfield LMA. The towns of Eastfordand Hampton and other towns in the northeast are now called Danielson-Northeast LMA.
LMA/TOWNS LABOR FORCE EMPLOYED UNEMPLOYED % LMA/TOWNS LABOR FORCE EMPLOYED UNEMPLOYED %BRIDGEPORT-STAMFORD HARTFORD cont...
The unemployment rate represents the number unemployed as a percent of the civilian labor force.
With the exception of those persons temporarily absent from a job or waiting to be recalled to one, persons with no job and who are not actively looking for oneare counted as "not in the labor force".
Over the course of a year, the size of the labor force and the levels of employment undergo fluctuations due to such seasonal events as changes in weather,reduced or expanded production, harvests, major holidays and the opening and closing of schools. Because these seasonal events follow a regular pattern eachyear, their influence on statistical trends can be eliminated by adjusting the monthly statistics. Seasonal Adjustment makes it easier to observe cyclical and othernonseasonal developments.
Not Seasonally Adjusted:CONNECTICUT 1,895,000 1,797,900 97,100 5.1
*Connecticut portion only. For whole NECTA,including RI part, see below. UNITED STATES 161,494,000 154,403,000 7,091,000 4.4NORWICH-NEW LONDON-WESTERLY, CT-RI
142,941 135,563 7,378 5.2 Seasonally Adjusted:RI part 16,156 15,183 973 6.0 CONNECTICUT 1,908,200 1,821,200 86,900 4.6(Hopkinton and Westerly) UNITED STATES 161,921,000 155,215,000 6,706,000 4.1
THE CONNECTICUT ECONOMIC DIGEST22 April 2018
HOUSING PERMIT ACTIVITY BY TOWN
For further information on the housing permit data, contact Kolie Sun of DECD at (860) 270-8167.
Town
TOWN FEB YR TO DATE TOWN FEB YR TO DATE TOWN FEB YR TO DATE2018 2018 2017 2018 2018 2017 2018 2018 2017
Andover 0 0 1 Griswold 1 2 0 Preston 0 0 1Ansonia na na na Groton na na na Prospect 2 4 2Ashford na na na Guilford na na na Putnam na na naAvon 2 2 3 Haddam 0 0 0 Redding 0 0 0Barkhamsted na na na Hamden na na na Ridgefield 1 2 0Beacon Falls na na na Hampton na na na Rocky Hill 0 1 1Berlin 1 2 0 Hartford 0 0 0 Roxbury na na naBethany na na na Hartland 0 0 0 Salem na na naBethel 5 18 12 Harwinton na na na Salisbury na na naBethlehem na na na Hebron 1 1 2 Scotland na na na
Bloomfield 0 0 0 Kent 0 3 0 Seymour na na naBolton 1 2 1 Killingly na na na Sharon na na naBozrah na na na Killingworth 0 1 1 Shelton 3 7 11Branford 1 3 1 Lebanon 0 0 2 Sherman 0 0 1Bridgeport 7 12 13 Ledyard na na na Simsbury 0 1 2Bridgewater 0 0 0 Lisbon na na na Somers 0 0 1Bristol 0 1 1 Litchfield na na na South Windso 8 14 1Brookfield 0 1 1 Lyme 0 1 0 Southbury na na naBrooklyn 0 1 1 Madison na na na Southington 1 5 8Burlington 2 3 3 Manchester 7 8 1 Sprague 0 0 0
Canaan na na na Mansfield 1 1 2 Stafford 1 1 0Canterbury na na na Marlborough 0 0 0 Stamford 1 6 0Canton 0 0 1 Meriden na na na Sterling na na naChaplin na na na Middlebury na na na Stonington na na naCheshire 1 2 2 Middlefield 1 1 0 Stratford 2 2 3Chester 0 0 1 Middletown 1 2 14 Suffield 3 3 5Clinton 1 2 2 Milford 14 25 30 Thomaston na na naColchester 0 6 2 Monroe 0 0 2 Thompson na na naColebrook na na na Montville na na na Tolland 1 1 2Columbia 0 0 1 Morris na na na Torrington na na na
Cornwall na na na Naugatuck na na na Trumbull 1 1 1Coventry 0 0 2 New Britain 2 2 0 Union 0 0 1Cromwell 0 0 4 New Canaan 1 3 7 Vernon 7 15 20Danbury 4 11 26 New Fairfield 0 0 1 Voluntown 0 0 0Darien 2 5 8 New Hartford na na na Wallingford 1 2 2Deep River 0 0 0 New Haven 279 280 4 Warren na na naDerby na na na New London 3 5 6 Washington na na naDurham 0 0 1 New Milford na na na Waterbury 0 0 24East Granby 1 1 0 Newington 0 0 2 Waterford na na naEast Haddam 0 1 0 Newtown 2 2 1 Watertown na na na
East Hampton 2 4 3 Norfolk na na na West Hartford 6 12 12East Hartford 0 0 0 North Branford na na na West Haven na na naEast Haven na na na North Canaan na na na Westbrook 2 2 2East Lyme 0 1 2 North Haven na na na Weston 1 2 0East Windsor 1 123 3 North Stoningto na na na Westport 4 11 7Eastford na na na Norwalk 3 16 79 Wethersfield 0 0 1Easton 0 1 0 Norwich 7 7 12 Willington 0 0 0Ellington 8 15 11 Old Lyme na na na Wilton 0 0 2Enfield 0 0 1 Old Saybrook 15 30 1 Winchester na na naEssex 0 1 1 Orange na na na Windham 1 1 1
Fairfield 7 13 8 Oxford 7 7 1 Windsor 1 1 2Farmington 0 1 1 Plainfield na na na Windsor Lock 2 4 4Franklin na na na Plainville 0 0 1 Wolcott 1 1 1Glastonbury 2 4 6 Plymouth na na na Woodbridge na na naGoshen na na na Pomfret na na na Woodbury 0 0 2Granby 0 0 17 Portland 0 0 0 Woodstock na na naGreenwich 9 17 18
THE CONNECTICUT ECONOMIC DIGEST 23April 2018
TECHNICAL NOTESBUSINESS STARTS AND TERMINATIONSRegistrations and terminations of business entities as recorded with the Secretary of the State and the ConnecticutDepartment of Labor (DOL) are an indication of new business formation and activity. DOL business starts include newemployers which have become liable for unemployment insurance taxes during the quarter, as well as new establish-ments opened by existing employers. DOL business terminations are those accounts discontinued due to inactivity (noemployees) or business closure, and accounts for individual business establishments that are closed by still activeemployers. The Secretary of the State registrations include limited liability companies, limited liability partnerships, andforeign-owned (out-of-state) and domestic-owned (in-state) corporations.
CONSUMER PRICE INDEXThe Consumer Price Index (CPI), computed and published by the U.S. Bureau of Labor Statistics, is a measure of theaverage change in prices over time in a fixed market basket of goods and services. It is based on prices of food, clothing,shelter, fuels, transportation fares, charges for doctors’ and dentists’ services, drugs and other goods and services thatpeople buy for their day-to-day living. The Northeast region is comprised of the New England states, New York, NewJersey and Pennsylvania.
EMPLOYMENT COST INDEXThe Employment Cost Index (ECI) covers both wages and salaries and employer costs for employee benefits for alloccupations and establishments in both the private nonfarm sector and state and local government. The ECI measuresemployers’ labor costs free from the influences of employment shifts among industries and occupations. The base periodfor all data is December 2005 when the ECI is 100.
GAMING DATAIndian Gaming Payments are amounts received by the State as a result of the slot compact with the two Federallyrecognized tribes in Connecticut, which calls for 25 percent of net slot receipts to be remitted to the State. IndianGaming Slots are the total net revenues from slot machines only received by the two Federally recognized Indian tribes.
HOURS AND EARNINGS ESTIMATESProduction worker earnings and hours estimates include full- and part-time employees working within manufacturingindustries. Hours worked and earnings data are computed based on payroll figures for the week including the 12th of themonth. Average hourly earnings are affected by such factors as premium pay for overtime and shift differential as well aschanges in basic hourly and incentive rates of pay. Average weekly earnings are the product of weekly hours worked andhourly earnings. These data are developed in cooperation with the U.S. Department of Labor, Bureau of Labor Statistics.
INITIAL CLAIMSAverage weekly initial claims are calculated by dividing the total number of new claims for unemployment insurancereceived in the month by the number of weeks in the month. A minor change in methodology took effect with datapublished in the March 1997 issue of the DIGEST. Data have been revised back to January 1980.
INSURED UNEMPLOYMENT RATEPrimarily a measure of unemployment insurance program activity, the insured unemployment rate is the 13-weekaverage of the number of people claiming unemployment benefits divided by the number of workers covered by theunemployment insurance system.
LABOR FORCE ESTIMATESLabor force estimates are a measure of the work status of people who live in Connecticut. Prepared under the direction ofthe U.S. Bureau of Labor Statistics, the statewide estimates are the product of a signal-plus noise model, which usesresults from the Current Population Survey (CPS), a monthly survey of Connecticut households, counts of claimants forunemployment benefits, and establishment employment estimates. The 2015 LAUS Redesign includes improved time-series models for the census divisions, states, select substate areas, and the balances of those states; an improved real-time benchmarking procedure to the national Current Population Survey (CPS) estimates; an improved smoothedseasonal adjustment procedure; and improved treatment of outliers. Non-modeled area estimation improvements in-clude: updated Dynamic Residency Ratios (DRR); more accurate estimates for all-other employment; more accurateestimation of agricultural employment; and improved estimation of non-covered agricultural unemployment. Handbookestimation is now done at the city/town level instead of at the Labor Market Area (LMA) level in Connecticut, whichbetter reflects local conditions. The Redesign also introduces estimation inputs from the American Community Survey(ACS) to replace inputs that were previously obtained from the decennial census long-form survey. Labor force data,reflecting persons employed by place of residence, are not directly comparable to the place-of-work industry employmentseries. In the labor force estimates, workers involved in labor disputes are counted as employed. The labor force data alsoincludes agricultural workers, unpaid family workers, domestics and the self-employed. Because of these conceptualdifferences, total labor force employment is almost always different from nonfarm wage and salary employment.
LABOR MARKET AREASAll Labor Market Areas (LMAs) in Connecticut except three are federally-designated areas for developing labor statistics.For the sake of simplicity, the federal Bridgeport-Stamford-Norwalk NECTA is referred to in Connecticut DOL publica-tions as the Bridgeport-Stamford LMA, and the Hartford-West Hartford-East Hartford NECTA is the Hartford LMA. Thenorthwest part of the state is now called Torrington-Northwest LMA. Five towns which are part of the Springfield, MAarea are published as the Enfield LMA. The towns of Eastford and Hampton and other towns in the northeast are nowcalled Danielson-Northeast LMA. Industry employment and labor force data estimates contained in Connecticut Depart-ment of Labor publications are prepared following the same statistical procedures developed by the U.S. Department ofLabor, Bureau of Labor Statistics, whether for federally designated or state-determined areas.
NONFARM EMPLOYMENT ESTIMATESNonfarm employment estimates are derived from a survey of businesses to measure jobs by industry. The estimatesinclude all full- and part-time wage and salary employees who worked during or received pay for the pay period whichincludes the 12th of the month. Excluded from these estimates are proprietors, self-employed workers, private householdemployees and unpaid family workers. In some cases, due to space constraints, all industry estimates are not shown.These data are developed in cooperation with the U.S. Department of Labor, Bureau of Labor Statistics.
UI COVERED WAGESUI covered wages is the total amount paid to those employees who are covered under the Connecticut’s UnemploymentInsurance (UI) law for services performed during the quarter. The fluctuations in the 1992-93 period reflect the effect ofthe changes in the tax law and the massive restructuring in the state’s economy.
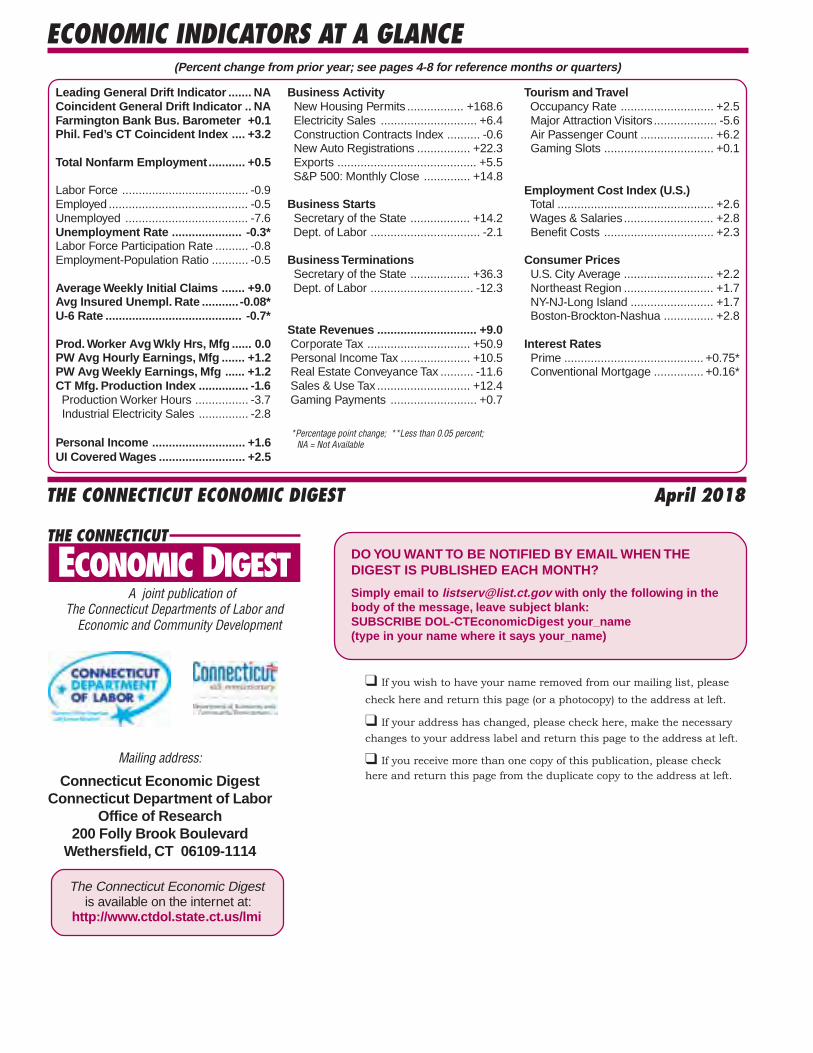
ECONOMIC INDICATORS AT A GLANCE
Leading General Drift Indicator ....... NACoincident General Drift Indicator .. NAFarmington Bank Bus. Barometer +0.1Phil. Fed’s CT Coincident Index .... +3.2
Total Nonfarm Employment........... +0.5
Labor Force ...................................... -0.9Employed .......................................... -0.5Unemployed ..................................... -7.6Unemployment Rate ..................... -0.3*Labor Force Participation Rate .......... -0.8Employment-Population Ratio ........... -0.5
Personal Income ............................ +1.6UI Covered Wages .......................... +2.5
Business Activity New Housing Permits ................. +168.6 Electricity Sales ............................. +6.4 Construction Contracts Index .......... -0.6 New Auto Registrations ................ +22.3 Exports .......................................... +5.5 S&P 500: Monthly Close .............. +14.8
Business Starts Secretary of the State .................. +14.2 Dept. of Labor ................................. -2.1
Business Terminations Secretary of the State .................. +36.3 Dept. of Labor ............................... -12.3
State Revenues .............................. +9.0 Corporate Tax ............................... +50.9 Personal Income Tax ..................... +10.5 Real Estate Conveyance Tax .......... -11.6 Sales & Use Tax ............................ +12.4 Gaming Payments .......................... +0.7
Tourism and Travel Occupancy Rate ............................ +2.5 Major Attraction Visitors................... -5.6 Air Passenger Count ...................... +6.2 Gaming Slots ................................. +0.1
Employment Cost Index (U.S.) Total ............................................... +2.6 Wages & Salaries........................... +2.8 Benefit Costs ................................. +2.3
Consumer Prices U.S. City Average ........................... +2.2 Northeast Region ........................... +1.7 NY-NJ-Long Island ......................... +1.7 Boston-Brockton-Nashua ............... +2.8
Interest Rates Prime .......................................... +0.75* Conventional Mortgage ............... +0.16*
Mailing address:
Connecticut Economic DigestConnecticut Department of Labor
Office of Research200 Folly Brook Boulevard
Wethersfield, CT 06109-1114
THE CONNECTICUT ECONOMIC DIGEST
*Percentage point change; **Less than 0.05 percent; NA = Not Available
The Connecticut Economic Digest is available on the internet at:
http://www.ctdol.state.ct.us/lmi
April 2018
(Percent change from prior year; see pages 4-8 for reference months or quarters)
THE CONNECTICUT
A joint publication of The Connecticut Departments of Labor and Economic and Community Development
ECONOMIC DIGEST
If you wish to have your name removed from our mailing list, please
check here and return this page (or a photocopy) to the address at left.
If your address has changed, please check here, make the necessary
changes to your address label and return this page to the address at left.
If you receive more than one copy of this publication, please check
here and return this page from the duplicate copy to the address at left.
DO YOU WANT TO BE NOTIFIED BY EMAIL WHEN THEDIGEST IS PUBLISHED EACH MONTH?
Simply email to [email protected] with only the following in thebody of the message, leave subject blank:SUBSCRIBE DOL-CTEconomicDigest your_name(type in your name where it says your_name)