44
SmartMarket Brief The Construction Cost Management Report PREMIER PARTNER
SmartMarket Brief
The Construction Cost Management Report
PREMIER PARTNER
1 © Dodge Data & Analytics www.construction.com Premier Partner: Procore Technologies, Inc. SmartMarket Brief: The Construction Cost Management Report
Introduction
In the last two decades we’ve seen a rapid evolution in construction technology and the pace of change is increasing. 30 years ago, we were living in an analog world. Today, we live in a world where nearly every tool used to manage a job is in some way digitized. Until now, construction’s digital transformation has focused on digitizing drawing and documentation management, while largely ignoring cost management. Today we have drones taking progress project photos, robots surveying job sites, and contracts being executed on iPads, yet we still use the same 25-year-old forecast spreadsheets. Advancements in cost management technology are powering the next wave of construction’s digital evolution and only a fraction of the industry is currently taking advantage of them.
Procore is excited about the opportunity to partner with Dodge Data & Analytics to better understand the state of cost management, as well as where the industry is headed. We surveyed professionals throughout the construction industry on the capabilities, challenges, and current solutions associated with cost management.
Procore is thrilled to be at the forefront of construction cost management’s digital transformation as our goal is to provide the people in construction with technology that makes their lives easier, safer, and more productive.
Tooey Courtemanche CEO and Founder Procore Technologies Inc.
MESSAGE FROM PROCOREABOUT THIS SMARTMARKET BRIEFCost management is critically important for construction projects. A recent study of contractors by Dodge Data & Analytics (Dodge) shows that 33% of typical projects come in over budget, and even among projects identified by contractors as their best performing, over one in five fails to meet budget.
THE GLOBAL COST MANAGEMENT REPORTThis report is based on a survey by Dodge of 243 owners (122 public, 121 private), 240 general contractors and 241 specialty trade contractors. These respondents are equally divided across the USA, Canada, the United Kingdom and Australia/New Zealand. It specifically addresses cost management capabilities, challenges, solutions, internal processes, and needs for future improvement.
By establishing a baseline of current practices and experiences around the world this study is intended to enhance mutual awareness of cost management challenges and needs between owners and contractors with the goal of improving cost management performance for everyone.
Dodge wishes to thank Procore Technologies, Inc. for sponsoring this research.
The Construction Cost Management Report
SmartMarket Brief
CONTENTS1 Introduction
2 Current State of Cost Management Capabilities
5 Cost Management Challenges
10 Cost Management Solutions 11 Number of Solutions 16 Types of Solutions
20 Satisfaction With Current Solutions
29 Cost Management Processes 30 Measuring Success 31 Spending Levels 32 Collaboration Methods
33 Future Needs for Cost Management
38 Key Trends Summary
41 Methodology
42 Contacts & Resources
TH
E C
ON
ST
RU
CT
ION
CO
ST
MA
NA
GE
ME
NT
RE
PO
RT
© Dodge Data & Analytics www.construction.com Premier Partner: Procore Technologies, Inc. SmartMarket Brief: The Construction Cost Management Report 2
TH
E C
ON
ST
RU
CT
ION
CO
ST
MA
NA
GE
ME
NT
RE
PO
RT
IN
TRO
DU
CTI
ON
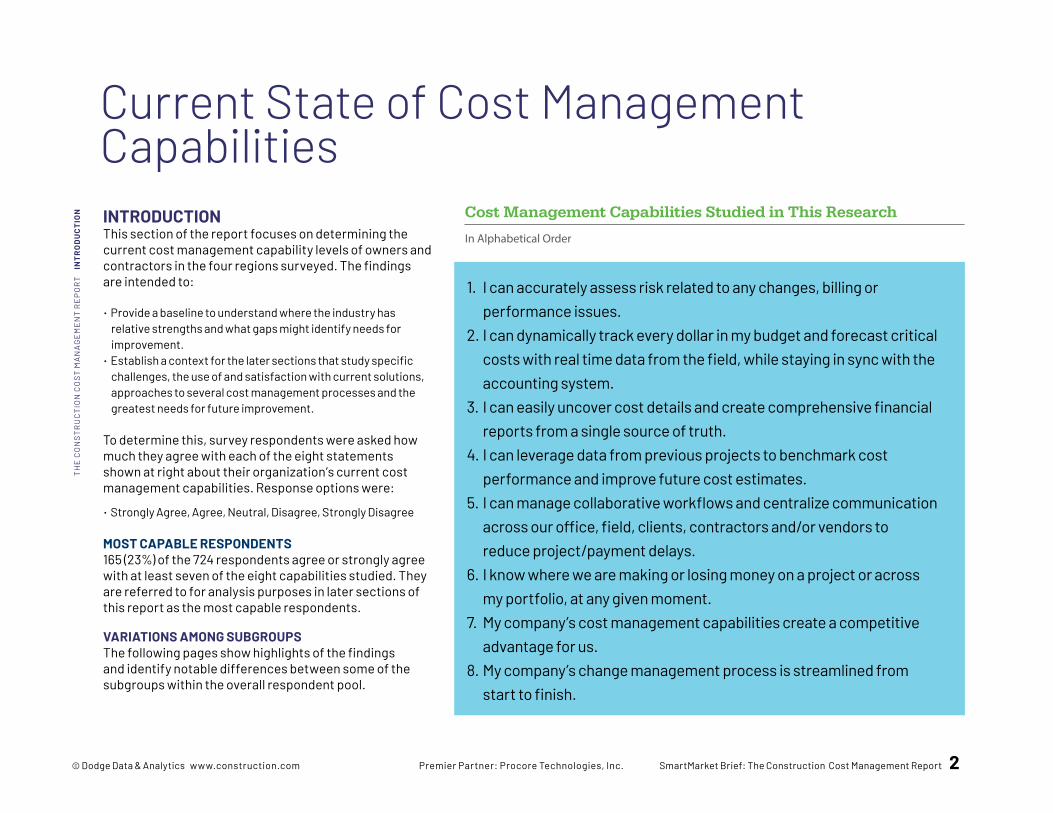
Current State of Cost Management CapabilitiesINTRODUCTIONThis section of the report focuses on determining the current cost management capability levels of owners and contractors in the four regions surveyed. The findings are intended to:
• Provide a baseline to understand where the industry has relative strengths and what gaps might identify needs for improvement.
• Establish a context for the later sections that study specific challenges, the use of and satisfaction with current solutions, approaches to several cost management processes and the greatest needs for future improvement.
To determine this, survey respondents were asked how much they agree with each of the eight statements shown at right about their organization’s current cost management capabilities. Response options were:
• Strongly Agree, Agree, Neutral, Disagree, Strongly Disagree
MOST CAPABLE RESPONDENTS165 (23%) of the 724 respondents agree or strongly agree with at least seven of the eight capabilities studied. They are referred to for analysis purposes in later sections of this report as the most capable respondents.
VARIATIONS AMONG SUBGROUPSThe following pages show highlights of the findings and identify notable differences between some of the subgroups within the overall respondent pool.
Cost Management Capabilities Studied in This Research
In Alphabetical Order
1. I can accurately assess risk related to any changes, billing or performance issues.2. I can dynamically track every dollar in my budget and forecast critical costs with real time data from the field, while staying in sync with the accounting system.3. I can easily uncover cost details and create comprehensive financial reports from a single source of truth.4. I can leverage data from previous projects to benchmark cost performance and improve future cost estimates.5. I can manage collaborative workflows and centralize communication across our office, field, clients, contractors and/or vendors to reduce project/payment delays.6. I know where we are making or losing money on a project or across my portfolio, at any given moment.7. My company’s cost management capabilities create a competitive advantage for us.8. My company’s change management process is streamlined from start to finish.
3 © Dodge Data & Analytics www.construction.com Premier Partner: Procore Technologies, Inc. SmartMarket Brief: The Construction Cost Management Report
Current State of Cost Management Capabilities (CONTINUED)
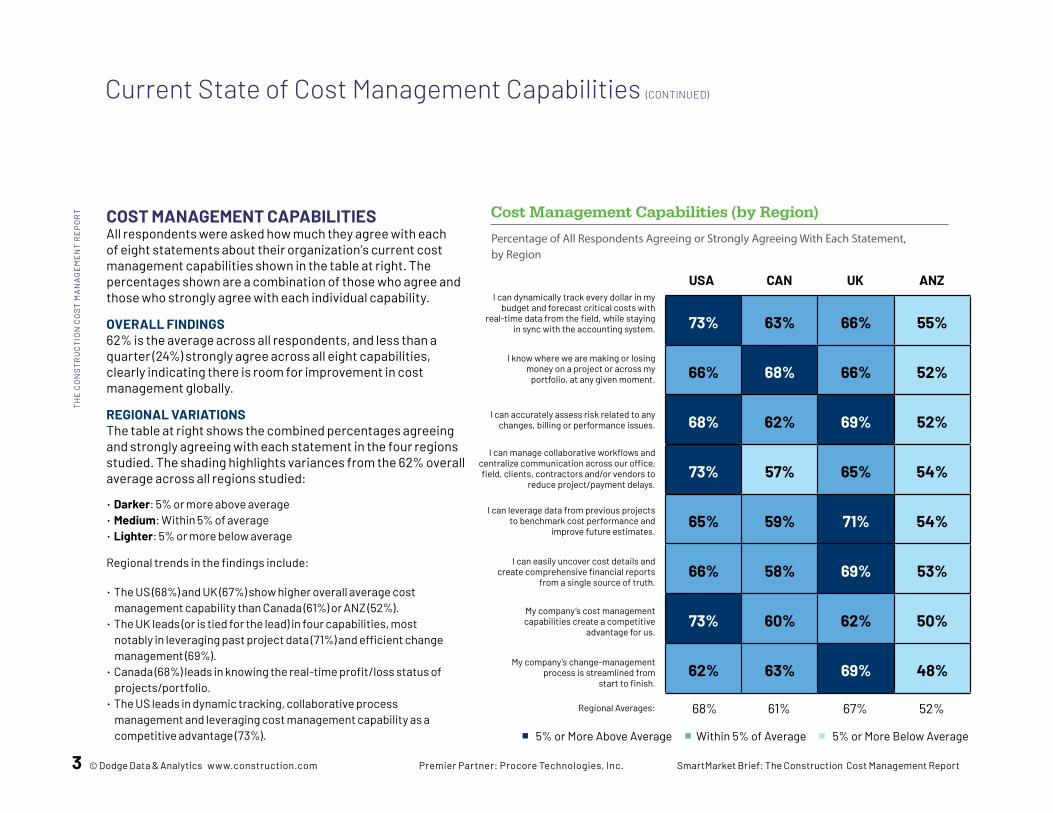
Cost Management Capabilities (by Region)COST MANAGEMENT CAPABILITIES All respondents were asked how much they agree with each of eight statements about their organization’s current cost management capabilities shown in the table at right. The percentages shown are a combination of those who agree and those who strongly agree with each individual capability.
OVERALL FINDINGS62% is the average across all respondents, and less than a quarter (24%) strongly agree across all eight capabilities, clearly indicating there is room for improvement in cost management globally.
REGIONAL VARIATIONSThe table at right shows the combined percentages agreeing and strongly agreeing with each statement in the four regions studied. The shading highlights variances from the 62% overall average across all regions studied:
• Darker: 5% or more above average• Medium: Within 5% of average• Lighter: 5% or more below average Regional trends in the findings include:
• The US (68%) and UK (67%) show higher overall average cost management capability than Canada (61%) or ANZ (52%).
• The UK leads (or is tied for the lead) in four capabilities, most notably in leveraging past project data (71%) and efficient change management (69%).
• Canada (68%) leads in knowing the real-time profit/loss status of projects/portfolio.
• The US leads in dynamic tracking, collaborative process management and leveraging cost management capability as a competitive advantage (73%).
Percentage of All Respondents Agreeing or Strongly Agreeing With Each Statement, by Region
73% 63% 66% 55%
66% 68% 66% 52%
68% 62% 69% 52%
73% 57% 65% 54%
65% 59% 71% 54%
66% 58% 69% 53%
73% 60% 62% 50%
62% 63% 69% 48%
I can dynamically track every dollar in my budget and forecast critical costs with
real-time data from the field, while staying in sync with the accounting system.
USA CAN UK ANZ
68% 61% 67% 52%Regional Averages:
I know where we are making or losing money on a project or across my
portfolio, at any given moment.
I can accurately assess risk related to any changes, billing or performance issues.
I can manage collaborative workflows and centralize communication across our office, field, clients, contractors and/or vendors to
reduce project/payment delays.
I can leverage data from previous projects to benchmark cost performance and
improve future estimates.
I can easily uncover cost details and create comprehensive financial reports
from a single source of truth.
My company’s cost management capabilities create a competitive
advantage for us.
My company’s change-management process is streamlined from
start to finish.
5% or More Above Average Within 5% of Average 5% or More Below Average
TH
E C
ON
ST
RU
CT
ION
CO
ST
MA
NA
GE
ME
NT
RE
PO
RT
© Dodge Data & Analytics www.construction.com Premier Partner: Procore Technologies, Inc. SmartMarket Brief: The Construction Cost Management Report 4
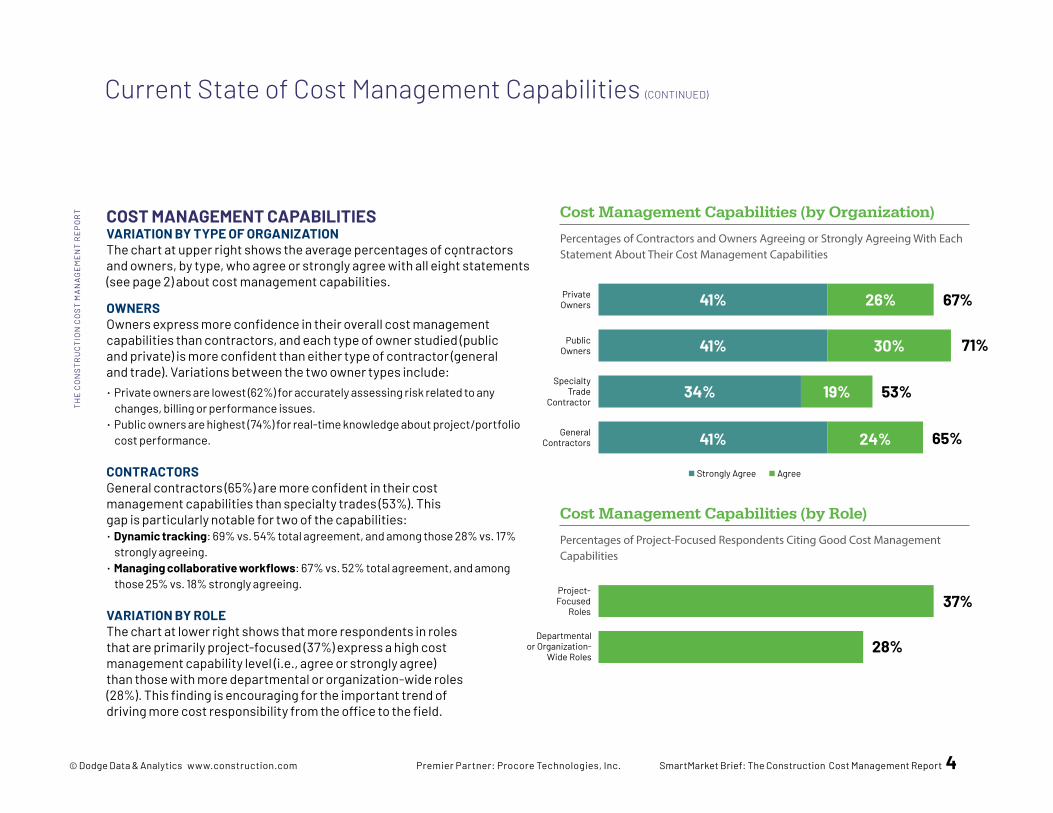
COST MANAGEMENT CAPABILITIESVARIATION BY TYPE OF ORGANIZATIONThe chart at upper right shows the average percentages of contractors and owners, by type, who agree or strongly agree with all eight statements (see page 2) about cost management capabilities.
OWNERSOwners express more confidence in their overall cost management capabilities than contractors, and each type of owner studied (public and private) is more confident than either type of contractor (general and trade). Variations between the two owner types include: • Private owners are lowest (62%) for accurately assessing risk related to any
changes, billing or performance issues. • Public owners are highest (74%) for real-time knowledge about project/portfolio
cost performance. CONTRACTORSGeneral contractors (65%) are more confident in their cost management capabilities than specialty trades (53%). This gap is particularly notable for two of the capabilities:• Dynamic tracking: 69% vs. 54% total agreement, and among those 28% vs. 17%
strongly agreeing. • Managing collaborative workflows: 67% vs. 52% total agreement, and among
those 25% vs. 18% strongly agreeing.
VARIATION BY ROLEThe chart at lower right shows that more respondents in roles that are primarily project-focused (37%) express a high cost management capability level (i.e., agree or strongly agree) than those with more departmental or organization-wide roles (28%). This finding is encouraging for the important trend of driving more cost responsibility from the office to the field.
Current State of Cost Management Capabilities (CONTINUED)
Cost Management Capabilities (by Organization)
TH
E C
ON
ST
RU
CT
ION
CO
ST
MA
NA
GE
ME
NT
RE
PO
RT
Percentages of Contractors and Owners Agreeing or Strongly Agreeing With Each Statement About Their Cost Management Capabilities
Strongly Agree Agree
Private Owners 67%26%41%
PublicOwners 30%41% 71%
Specialty Trade
Contractor53%19%34%
General Contractors 24%41% 65%
Cost Management Capabilities (by Role)
Percentages of Project-Focused Respondents Citing Good Cost Management Capabilities
Project-Focused
Roles37%
Departmental or Organization-
Wide Roles28%
5 © Dodge Data & Analytics www.construction.com Premier Partner: Procore Technologies, Inc. SmartMarket Brief: The Construction Cost Management Report
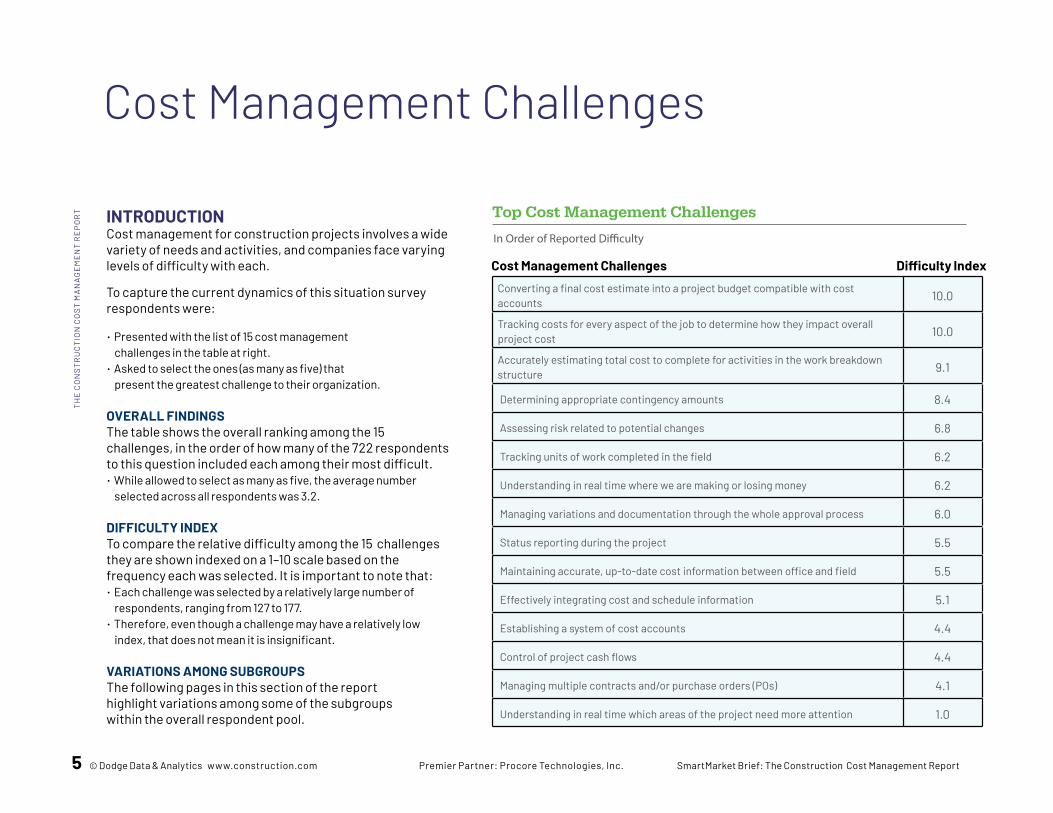
INTRODUCTIONCost management for construction projects involves a wide variety of needs and activities, and companies face varying levels of difficulty with each.
To capture the current dynamics of this situation survey respondents were:
• Presented with the list of 15 cost management challenges in the table at right.
• Asked to select the ones (as many as five) that present the greatest challenge to their organization.
OVERALL FINDINGSThe table shows the overall ranking among the 15 challenges, in the order of how many of the 722 respondents to this question included each among their most difficult. • While allowed to select as many as five, the average number
selected across all respondents was 3.2.
DIFFICULTY INDEXTo compare the relative difficulty among the 15 challenges they are shown indexed on a 1–10 scale based on the frequency each was selected. It is important to note that:• Each challenge was selected by a relatively large number of
respondents, ranging from 127 to 177. • Therefore, even though a challenge may have a relatively low
index, that does not mean it is insignificant. VARIATIONS AMONG SUBGROUPSThe following pages in this section of the report highlight variations among some of the subgroups within the overall respondent pool.
Cost Management Challenges
Top Cost Management Challenges
In Order of Reported Difficulty
Converting a final cost estimate into a project budget compatible with cost accounts 10.0
Tracking costs for every aspect of the job to determine how they impact overall project cost 10.0
Accurately estimating total cost to complete for activities in the work breakdown structure 9.1
Determining appropriate contingency amounts 8.4
Assessing risk related to potential changes 6.8
Tracking units of work completed in the field 6.2
Understanding in real time where we are making or losing money 6.2
Managing variations and documentation through the whole approval process 6.0
Status reporting during the project 5.5
Maintaining accurate, up-to-date cost information between office and field 5.5
Effectively integrating cost and schedule information 5.1
Establishing a system of cost accounts 4.4
Control of project cash flows 4.4
Managing multiple contracts and/or purchase orders (POs) 4.1
Understanding in real time which areas of the project need more attention 1.0
Cost Management Challenges Difficulty Index
TH
E C
ON
ST
RU
CT
ION
CO
ST
MA
NA
GE
ME
NT
RE
PO
RT
© Dodge Data & Analytics www.construction.com Premier Partner: Procore Technologies, Inc. SmartMarket Brief: The Construction Cost Management Report 6
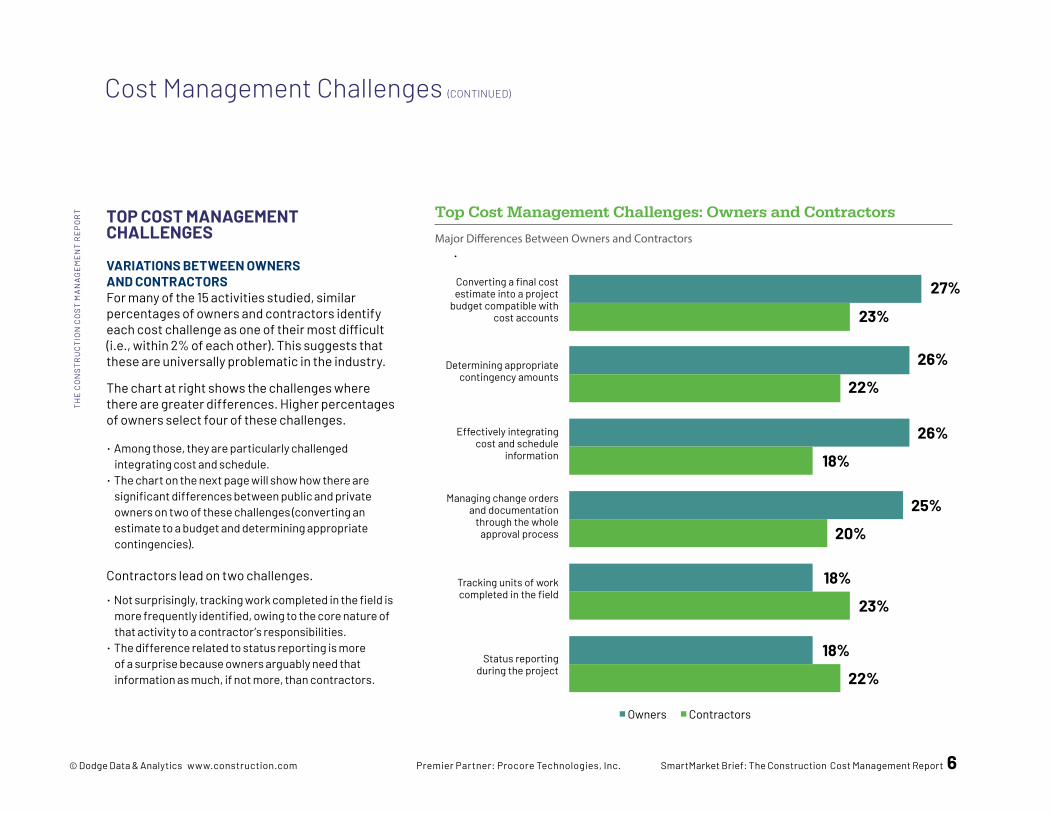
TOP COST MANAGEMENT CHALLENGES VARIATIONS BETWEEN OWNERS AND CONTRACTORSFor many of the 15 activities studied, similar percentages of owners and contractors identify each cost challenge as one of their most difficult (i.e., within 2% of each other). This suggests that these are universally problematic in the industry.
The chart at right shows the challenges where there are greater differences. Higher percentages of owners select four of these challenges.
• Among those, they are particularly challenged integrating cost and schedule.
• The chart on the next page will show how there are significant differences between public and private owners on two of these challenges (converting an estimate to a budget and determining appropriate contingencies).
Contractors lead on two challenges.
• Not surprisingly, tracking work completed in the field is more frequently identified, owing to the core nature of that activity to a contractor’s responsibilities.
• The difference related to status reporting is more of a surprise because owners arguably need that information as much, if not more, than contractors.
Top Cost Management Challenges: Owners and Contractors
Major Differences Between Owners and Contractors
Owners Contractors
Converting a final cost estimate into a project
budget compatible with cost accounts
27%
23%
Determining appropriate contingency amounts
26%
22%
Effectively integrating cost and schedule
information
26%
18%
Managing change orders and documentation
through the whole approval process
25%
20%
Tracking units of work completed in the field
18%
23%
Status reporting during the project
18%
22%
Cost Management Challenges (CONTINUED)
TH
E C
ON
ST
RU
CT
ION
CO
ST
MA
NA
GE
ME
NT
RE
PO
RT
7 © Dodge Data & Analytics www.construction.com Premier Partner: Procore Technologies, Inc. SmartMarket Brief: The Construction Cost Management Report
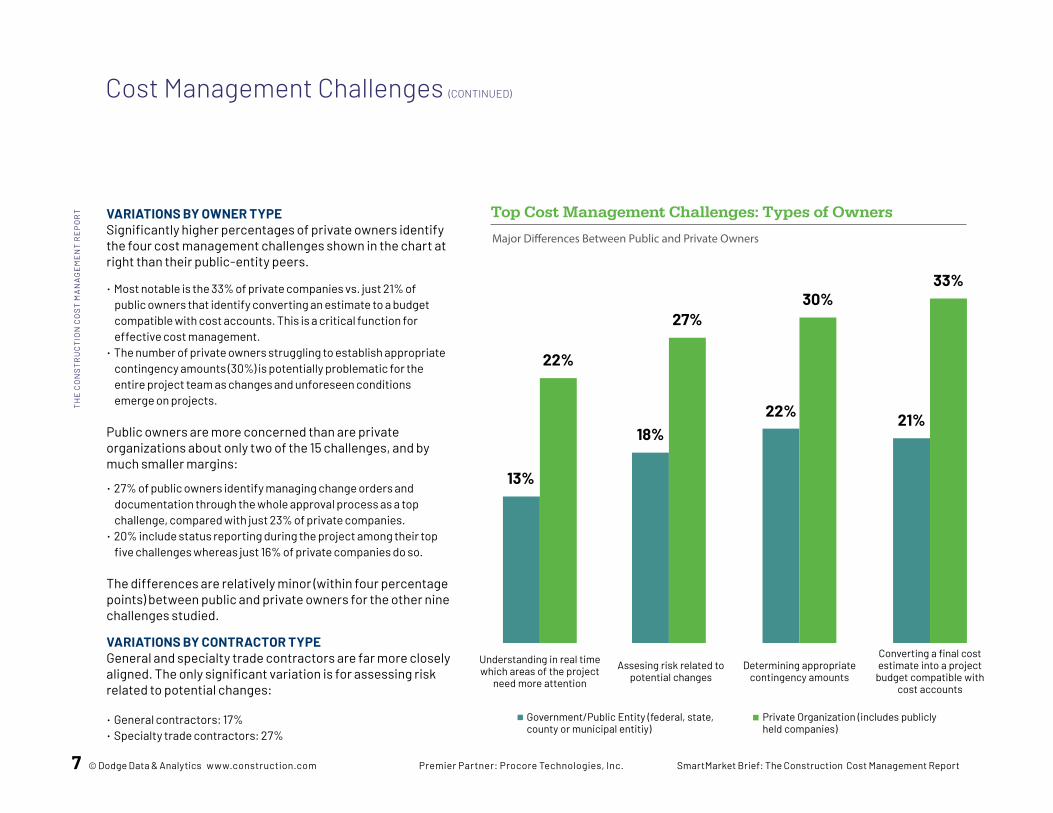
VARIATIONS BY OWNER TYPESignificantly higher percentages of private owners identify the four cost management challenges shown in the chart at right than their public-entity peers.
• Most notable is the 33% of private companies vs. just 21% of public owners that identify converting an estimate to a budget compatible with cost accounts. This is a critical function for effective cost management.
• The number of private owners struggling to establish appropriate contingency amounts (30%) is potentially problematic for the entire project team as changes and unforeseen conditions emerge on projects.
Public owners are more concerned than are private organizations about only two of the 15 challenges, and by much smaller margins:
• 27% of public owners identify managing change orders and documentation through the whole approval process as a top challenge, compared with just 23% of private companies.
• 20% include status reporting during the project among their top five challenges whereas just 16% of private companies do so.
The differences are relatively minor (within four percentage points) between public and private owners for the other nine challenges studied.
VARIATIONS BY CONTRACTOR TYPEGeneral and specialty trade contractors are far more closely aligned. The only significant variation is for assessing risk related to potential changes:
• General contractors: 17%• Specialty trade contractors: 27%
Top Cost Management Challenges: Types of Owners
Major Differences Between Public and Private Owners
Understanding in real time which areas of the project
need more attention
13%
22%
18%
27%
22%
30%
21%
33%
Government/Public Entity (federal, state, county or municipal entitiy)
Private Organization (includes publicly held companies)
Assesing risk related to potential changes
Determining appropriate contingency amounts
Converting a final cost estimate into a project
budget compatible with cost accounts
Cost Management Challenges (CONTINUED)
TH
E C
ON
ST
RU
CT
ION
CO
ST
MA
NA
GE
ME
NT
RE
PO
RT

© Dodge Data & Analytics www.construction.com Premier Partner: Procore Technologies, Inc. SmartMarket Brief: The Construction Cost Management Report 8
VARIATIONS BY ROLEThis page examines the differences between respondents who are primarily involved with project-specific cost management activities and those more departmental or organization-wide in their role. For simplicity these are referred to below as project- and office-related roles.
A key trend revealed in the detailed findings is that:
• Higher percentages of office-related staff select 10 of the 15 challenges as among their top five most difficult.
• The other five are within 2% of each other, so not meaningfully different.
This correlates to the earlier finding (see page 4) that project-related staff report feeling more capable of successfully conducting cost management activities.
The chart at right shows the five challenges with the greatest differences (7% or more) between project-related and office-related respondents.
Top Cost Management Challenges (Variation Between Roles)
Determining appropriate contingency amounts
27%
23%
Control of project cash flows
26%
22%
Understanding in real time where we are
making or losing money
26%
18%
Managing multiple contracts and/or
purchase orders (POs)
25%
20%
Effectively integrating cost and schedule
information
18%
23%
Challenges With the Greatest Differences Reported Between Employees With Project-Related Roles and Departmental or Organization-Wide Roles
Departmental or Organization-Wide Roles Project-Focused Roles
Cost Management Challenges (CONTINUED)
TH
E C
ON
ST
RU
CT
ION
CO
ST
MA
NA
GE
ME
NT
RE
PO
RT
9 © Dodge Data & Analytics www.construction.com Premier Partner: Procore Technologies, Inc. SmartMarket Brief: The Construction Cost Management Report
Cost Management Challenges (CONTINUED)
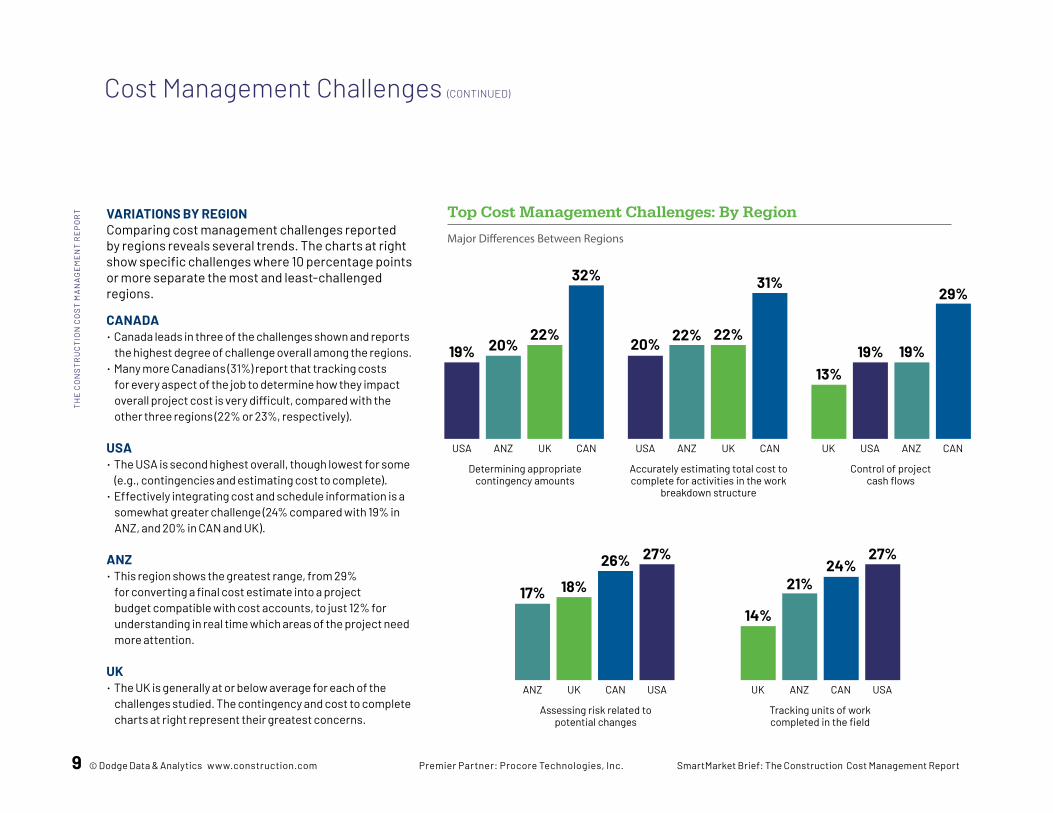
Top Cost Management Challenges: By RegionVARIATIONS BY REGIONComparing cost management challenges reported by regions reveals several trends. The charts at right show specific challenges where 10 percentage points or more separate the most and least-challenged regions.
CANADA• Canada leads in three of the challenges shown and reports
the highest degree of challenge overall among the regions. • Many more Canadians (31%) report that tracking costs
for every aspect of the job to determine how they impact overall project cost is very difficult, compared with the other three regions (22% or 23%, respectively).
USA• The USA is second highest overall, though lowest for some
(e.g., contingencies and estimating cost to complete).• Effectively integrating cost and schedule information is a
somewhat greater challenge (24% compared with 19% in ANZ, and 20% in CAN and UK).
ANZ• This region shows the greatest range, from 29%
for converting a final cost estimate into a project budget compatible with cost accounts, to just 12% for understanding in real time which areas of the project need more attention.
UK• The UK is generally at or below average for each of the
challenges studied. The contingency and cost to complete charts at right represent their greatest concerns.
Major Differences Between Regions
Determining appropriate contingency amounts
22%20%19%
32%
Accurately estimating total cost to complete for activities in the work
breakdown structure
Control of project cash flows
USA ANZ UK CAN USA ANZ UK CAN UK USA ANZ CAN
22%22%20%
31%
19%19%13%
29%
Assessing risk related to potential changes
Tracking units of work completed in the field
ANZ UK CAN USA UK ANZ CAN USA
26%
18%17%
27%24%
21%
14%
27%
TH
E C
ON
ST
RU
CT
ION
CO
ST
MA
NA
GE
ME
NT
RE
PO
RT
© Dodge Data & Analytics www.construction.com Premier Partner: Procore Technologies, Inc. SmartMarket Brief: The Construction Cost Management Report 10
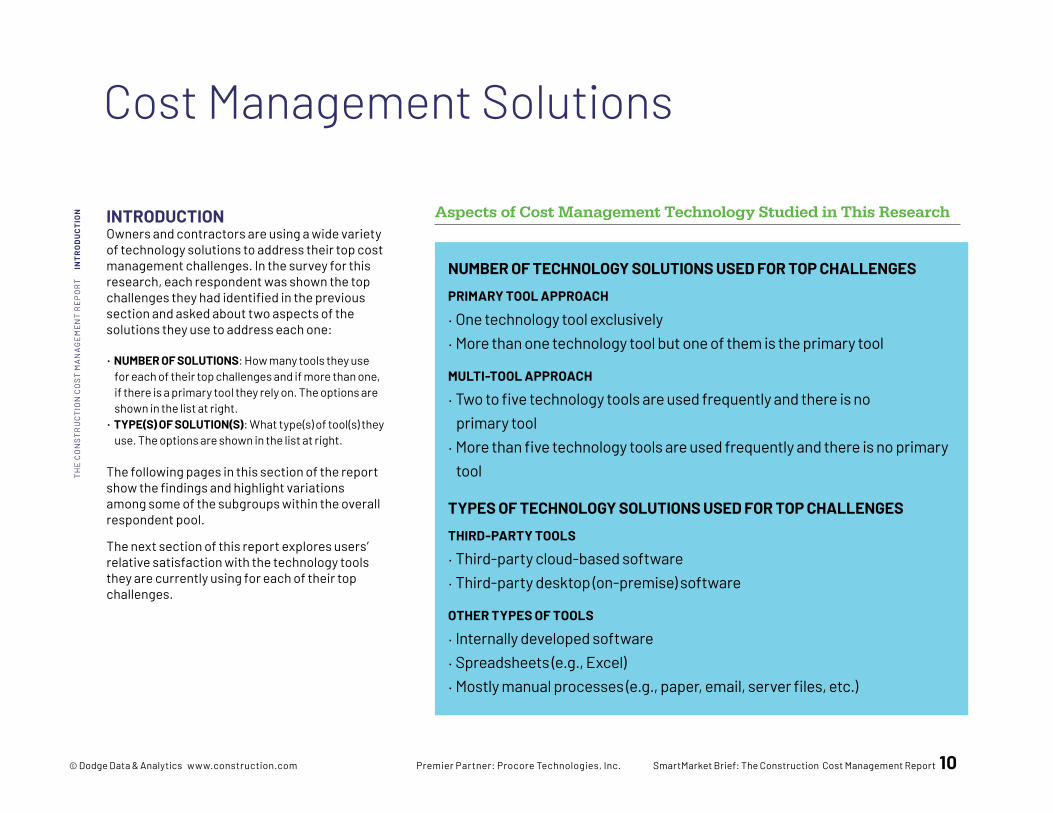
INTRODUCTIONOwners and contractors are using a wide variety of technology solutions to address their top cost management challenges. In the survey for this research, each respondent was shown the top challenges they had identified in the previous section and asked about two aspects of the solutions they use to address each one:
• NUMBER OF SOLUTIONS: How many tools they use for each of their top challenges and if more than one, if there is a primary tool they rely on. The options are shown in the list at right.
• TYPE(S) OF SOLUTION(S): What type(s) of tool(s) they use. The options are shown in the list at right.
The following pages in this section of the report show the findings and highlight variations among some of the subgroups within the overall respondent pool.
The next section of this report explores users’ relative satisfaction with the technology tools they are currently using for each of their top challenges.
Cost Management Solutions
Aspects of Cost Management Technology Studied in This Research
NUMBER OF TECHNOLOGY SOLUTIONS USED FOR TOP CHALLENGES
PRIMARY TOOL APPROACH
• One technology tool exclusively• More than one technology tool but one of them is the primary tool MULTI-TOOL APPROACH
• Two to five technology tools are used frequently and there is no primary tool
• More than five technology tools are used frequently and there is no primary tool
TYPES OF TECHNOLOGY SOLUTIONS USED FOR TOP CHALLENGES
THIRD-PARTY TOOLS
• Third-party cloud-based software • Third-party desktop (on-premise) software OTHER TYPES OF TOOLS
• Internally developed software • Spreadsheets (e.g., Excel)• Mostly manual processes (e.g., paper, email, server files, etc.)
TH
E C
ON
ST
RU
CT
ION
CO
ST
MA
NA
GE
ME
NT
RE
PO
RT
IN
TRO
DU
CTI
ON
11 © Dodge Data & Analytics www.construction.com Premier Partner: Procore Technologies, Inc. SmartMarket Brief: The Construction Cost Management Report
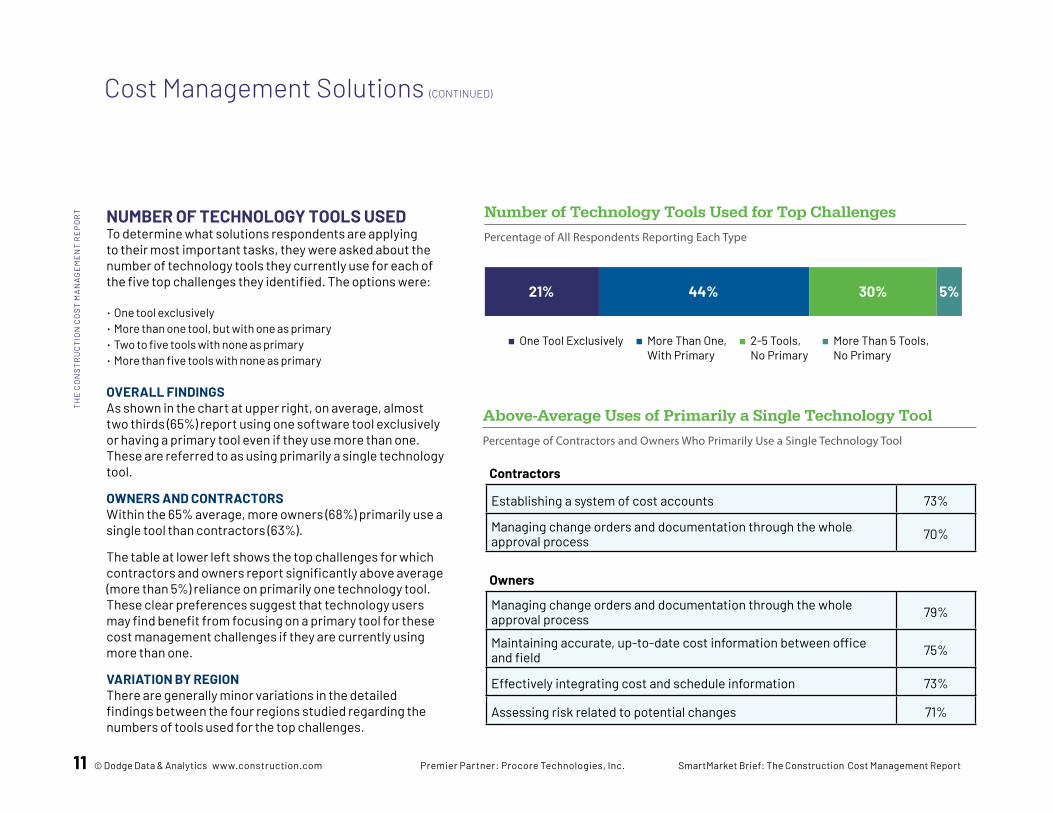
NUMBER OF TECHNOLOGY TOOLS USED To determine what solutions respondents are applying to their most important tasks, they were asked about the number of technology tools they currently use for each of the five top challenges they identified. The options were:
• One tool exclusively• More than one tool, but with one as primary• Two to five tools with none as primary• More than five tools with none as primary OVERALL FINDINGSAs shown in the chart at upper right, on average, almost two thirds (65%) report using one software tool exclusively or having a primary tool even if they use more than one. These are referred to as using primarily a single technology tool.
OWNERS AND CONTRACTORSWithin the 65% average, more owners (68%) primarily use a single tool than contractors (63%).
The table at lower left shows the top challenges for which contractors and owners report significantly above average (more than 5%) reliance on primarily one technology tool. These clear preferences suggest that technology users may find benefit from focusing on a primary tool for these cost management challenges if they are currently using more than one.
VARIATION BY REGIONThere are generally minor variations in the detailed findings between the four regions studied regarding the numbers of tools used for the top challenges.
Number of Technology Tools Used for Top Challenges
Percentage of All Respondents Reporting Each Type
30%44%21% 5%
One Tool Exclusively More Than One, With Primary
2-5 Tools, No Primary
More Than 5 Tools, No Primary
Above-Average Uses of Primarily a Single Technology Tool
Percentage of Contractors and Owners Who Primarily Use a Single Technology Tool
Establishing a system of cost accounts 73%
Managing change orders and documentation through the whole approval process 70%
Contractors
Managing change orders and documentation through the whole approval process 79%
Maintaining accurate, up-to-date cost information between office and field 75%
Effectively integrating cost and schedule information 73%
Assessing risk related to potential changes 71%
Owners
Cost Management Solutions (CONTINUED)
TH
E C
ON
ST
RU
CT
ION
CO
ST
MA
NA
GE
ME
NT
RE
PO
RT

© Dodge Data & Analytics www.construction.com Premier Partner: Procore Technologies, Inc. SmartMarket Brief: The Construction Cost Management Report 12
Number of Tools Used to Address the Most Difficult Challenges
Cost Management Solutions (CONTINUED)
NUMBER OF TECHNOLOGY TOOLS USEDThe table at right shows the overall percentages selecting each type for 11 of the 15 challenges that were rated by respondents as most difficult (i.e., Difficulty Index of five or more on a scale of 10. See page 5 for more information on the Difficulty Index.)
VARIATIONS FROM AVERAGEAverages for each type are at the bottom of the table. Cells are shaded to show variations above and below the averages:
• Darker: 3% or more above average• Medium: Within 3% of average• Lighter: 3% or more below average While the total percentage in each cell is the leading metric for this analysis, variations from average indicate concentrations of user preferences.
• Except for determining appropriate contingency amounts, the above-average ratings for other challenges are either in the first two columns (third-party tools) or in the last three columns (other types of solutions).
• Managing change orders is the most frequent for those using a primary tool.
• Tracking units of work completed in the field is the most frequent for those with no primary tool.
Most Difficult Cost Management Challenges (Index of 5 or higher)
19% 45% 32% 3%
17% 46% 32% 5%
26% 42% 31% 1%
26% 35% 33% 7%
18% 44% 33% 6%
13% 46% 34% 8%
19% 43% 28% 10%
25% 48% 20% 6%
19% 48% 29% 4%
26% 45% 22% 7%
20% 47% 27% 6%
One ToolMore Than One
Tool, With Primary2-5 Tools,
No Primary
More Than 5 Tools,
No Primary
Converting a final cost estimate into a project budget compatible with cost accounts
Tracking costs for every aspect of the job to determine how they impact overall
project cost
Accurately estimating total cost to complete for activities in the work breakdown structure
Determining appropriate contingency amounts
Assessing risk related to potential changes
Tracking units of work completed in the field
Understanding in real time where we are making or losing money
Managing change orders and documentation through the whole approval process
Status reporting during the project
Maintaining accurate, up-to-date cost information between office and field
Effectively integrating cost and schedule information
Average Percentages: 21% 44% 30% 5%
Average Percentages Using Each Type of Tool for Their Most Difficult Challenges
3% or More Above Average Within 3% of Average 3% or More Below Average
TH
E C
ON
ST
RU
CT
ION
CO
ST
MA
NA
GE
ME
NT
RE
PO
RT
13 © Dodge Data & Analytics www.construction.com Premier Partner: Procore Technologies, Inc. SmartMarket Brief: The Construction Cost Management Report
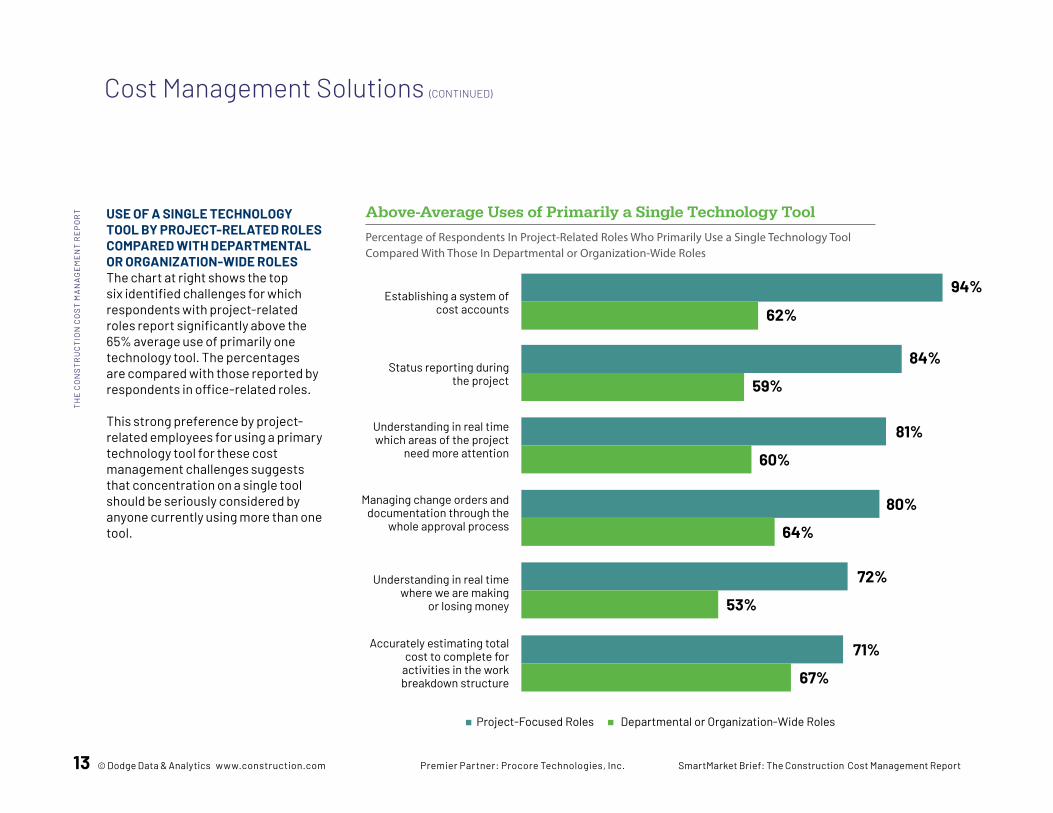
USE OF A SINGLE TECHNOLOGY TOOL BY PROJECT-RELATED ROLES COMPARED WITH DEPARTMENTAL OR ORGANIZATION-WIDE ROLESThe chart at right shows the top six identified challenges for which respondents with project-related roles report significantly above the 65% average use of primarily one technology tool. The percentages are compared with those reported by respondents in office-related roles. This strong preference by project-related employees for using a primary technology tool for these cost management challenges suggests that concentration on a single tool should be seriously considered by anyone currently using more than one tool.
Above-Average Uses of Primarily a Single Technology Tool
Percentage of Respondents In Project-Related Roles Who Primarily Use a Single Technology Tool Compared With Those In Departmental or Organization-Wide Roles
Establishing a system of cost accounts
94%
62%
Status reporting during the project
84%
59%
Understanding in real time which areas of the project
need more attention
81%
60%
Managing change orders and documentation through the
whole approval process
80%
64%
Understanding in real time where we are making
or losing money
72%
53%
Departmental or Organization-Wide RolesProject-Focused Roles
Accurately estimating total cost to complete for
activities in the work breakdown structure
71%
67%
Cost Management Solutions (CONTINUED)
TH
E C
ON
ST
RU
CT
ION
CO
ST
MA
NA
GE
ME
NT
RE
PO
RT
© Dodge Data & Analytics www.construction.com Premier Partner: Procore Technologies, Inc. SmartMarket Brief: The Construction Cost Management Report 14
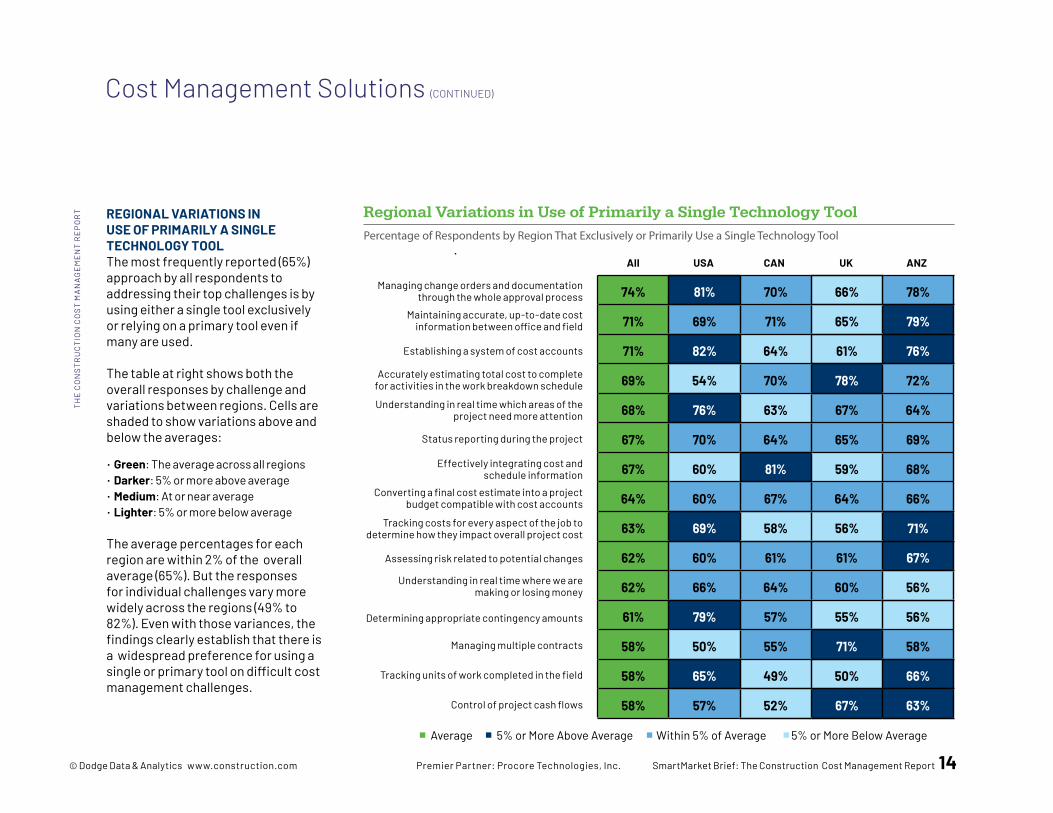
REGIONAL VARIATIONS IN USE OF PRIMARILY A SINGLE TECHNOLOGY TOOLThe most frequently reported (65%) approach by all respondents to addressing their top challenges is by using either a single tool exclusively or relying on a primary tool even if many are used. The table at right shows both the overall responses by challenge and variations between regions. Cells are shaded to show variations above and below the averages:
• Green: The average across all regions• Darker: 5% or more above average • Medium: At or near average• Lighter: 5% or more below average The average percentages for each region are within 2% of the overall average (65%). But the responses for individual challenges vary more widely across the regions (49% to 82%). Even with those variances, the findings clearly establish that there is a widespread preference for using a single or primary tool on difficult cost management challenges.
Regional Variations in Use of Primarily a Single Technology ToolPercentage of Respondents by Region That Exclusively or Primarily Use a Single Technology Tool
Cost Management Solutions (CONTINUED)
All USA CAN UK
Managing change orders and documentation through the whole approval process
Maintaining accurate, up-to-date cost information between office and field
Establishing a system of cost accounts
Accurately estimating total cost to complete for activities in the work breakdown schedule
Understanding in real time which areas of the project need more attention
Status reporting during the project
Effectively integrating cost and schedule information
Converting a final cost estimate into a project budget compatible with cost accounts
Tracking costs for every aspect of the job to determine how they impact overall project cost
Assessing risk related to potential changes
Understanding in real time where we are making or losing money
ANZ
74% 81% 70% 66% 78%
71% 69% 71% 65% 79%
71% 82% 64% 61% 76%
69% 54% 70% 78% 72%
68% 76% 63% 67% 64%
67% 70% 64% 65% 69%
67% 60% 81% 59% 68%
64% 60% 67% 64% 66%
63% 69% 58% 56% 71%
62% 60% 61% 61% 67%
62% 66% 64% 60% 56%
61% 79% 57% 55% 56%
58% 50% 55% 71% 58%
58% 65% 49% 50% 66%
58% 57% 52% 67% 63%
Determining appropriate contingency amounts
Managing multiple contracts
Tracking units of work completed in the field
Control of project cash flows
5% or More Above Average Within 5% of Average 5% or More Below AverageAverage
TH
E C
ON
ST
RU
CT
ION
CO
ST
MA
NA
GE
ME
NT
RE
PO
RT
15 © Dodge Data & Analytics www.construction.com Premier Partner: Procore Technologies, Inc. SmartMarket Brief: The Construction Cost Management Report
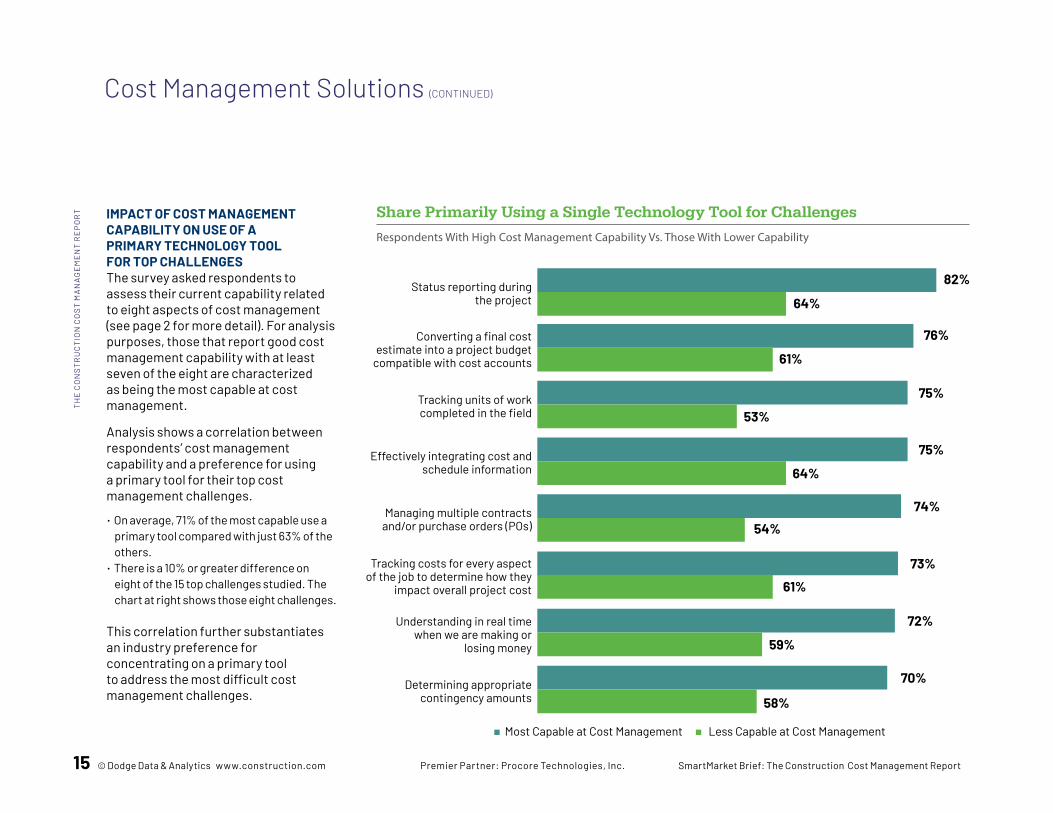
IMPACT OF COST MANAGEMENT CAPABILITY ON USE OF A PRIMARY TECHNOLOGY TOOL FOR TOP CHALLENGESThe survey asked respondents to assess their current capability related to eight aspects of cost management (see page 2 for more detail). For analysis purposes, those that report good cost management capability with at least seven of the eight are characterized as being the most capable at cost management.
Analysis shows a correlation between respondents’ cost management capability and a preference for using a primary tool for their top cost management challenges.
• On average, 71% of the most capable use a primary tool compared with just 63% of the others.
• There is a 10% or greater difference on eight of the 15 top challenges studied. The chart at right shows those eight challenges.
This correlation further substantiates an industry preference for concentrating on a primary tool to address the most difficult cost management challenges.
Status reporting during the project
82%
64%
Converting a final cost estimate into a project budget
compatible with cost accounts
76%
61%
Tracking units of work completed in the field
75%
53%
Effectively integrating cost and schedule information
75%
64%
Managing multiple contracts and/or purchase orders (POs)
74%
54%
Tracking costs for every aspect of the job to determine how they
impact overall project cost
73%
61%
Share Primarily Using a Single Technology Tool for Challenges
Respondents With High Cost Management Capability Vs. Those With Lower Capability
72%
59%
70%
58%
Understanding in real time when we are making or
losing money
Determining appropriate contingency amounts
Less Capable at Cost ManagementMost Capable at Cost Management
Cost Management Solutions (CONTINUED)
TH
E C
ON
ST
RU
CT
ION
CO
ST
MA
NA
GE
ME
NT
RE
PO
RT

© Dodge Data & Analytics www.construction.com Premier Partner: Procore Technologies, Inc. SmartMarket Brief: The Construction Cost Management Report 16
TYPES OF TECHNOLOGY TOOLS USEDIn addition to examining the number of technology tools respondents currently use, they were also asked what types of tools they are deploying for each of the top challenges they selected. The five options were:
• Two types of third-party commercially available software products:1. Desktop (on-premise)2. Cloud-based
• Other types of solutions, including:3. Internally developed tools4. Spreadsheets (e.g., Excel)5. Mostly manual processes (e.g., email, server files)
FREQUENCY OF USING VARIOUS TYPES OF TECHNOLOGYThe chart at right shows the average percentages among all respondents who report using each of the five types of solutions studied for their top challenges.
• On average, about half (47%) are using third-party tools, divided about 60/40 between traditional desktop applications and newer cloud-accessible ones. This proportion can be expected to continue to shift toward the cloud as available functionality increases.
• Among the other types:• Internally developed tools (32%) may decrease as third-party tools improve
customization capabilities and users face the ongoing costs of maintaining and improving their home-grown solutions.
• At 16%, spreadsheets maintain a foothold, but can also be expected to decline in frequency as third-party solutions become more widely adopted.
• A small handful of users (4%) report very limited use of technology and still rely mainly on many manual processes. But again, this should decline as more digital natives enter the workforce and both the functionality, ubiquity and security of commercial software improves.
Types of Technology Tools Used for Top ChallengesAverage Percentage Using Each Type for Their Top Challenges
48%
Third-party cloud-based
software
Third-party desktop
(on-premise) software
18%
30%
Third-Party Solutions
52%
Internally developed software
Spreadsheets (e.g., Excel)
32%
16%
Other Solutions
4%Mostly manual processes (e.g., paper, email, server files)
Cost Management Solutions (CONTINUED)
TH
E C
ON
ST
RU
CT
ION
CO
ST
MA
NA
GE
ME
NT
RE
PO
RT
17 © Dodge Data & Analytics www.construction.com Premier Partner: Procore Technologies, Inc. SmartMarket Brief: The Construction Cost Management Report
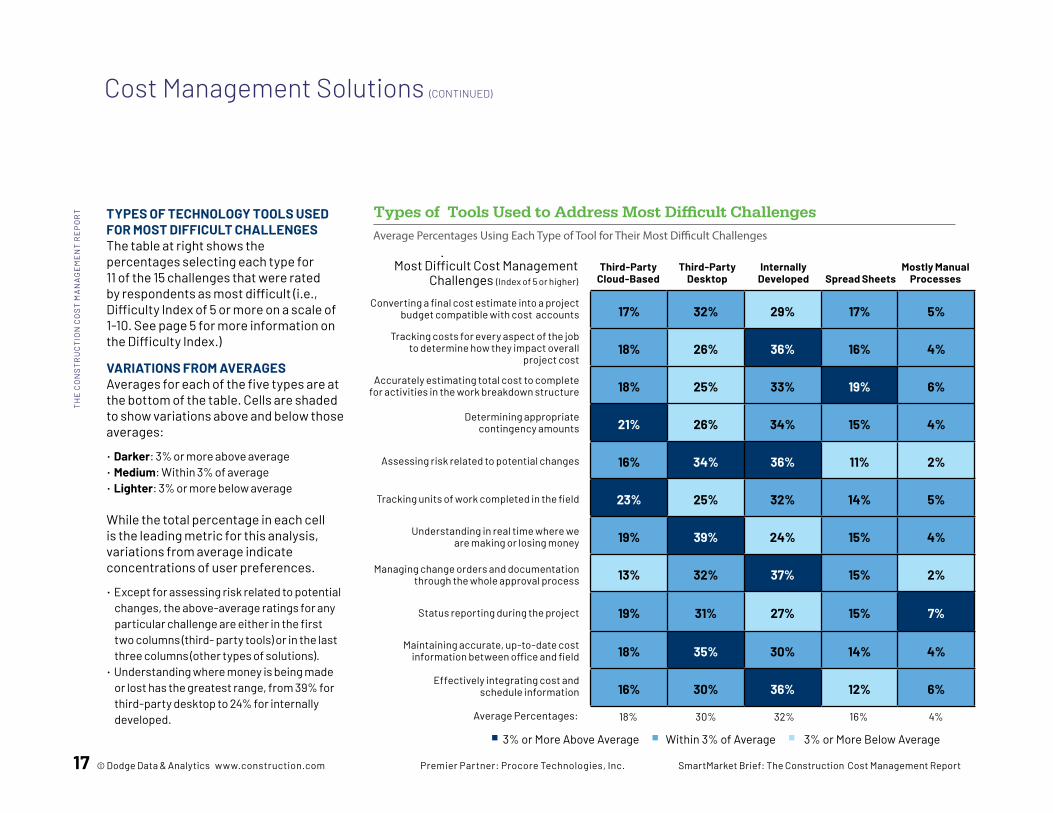
TYPES OF TECHNOLOGY TOOLS USED FOR MOST DIFFICULT CHALLENGESThe table at right shows the percentages selecting each type for 11 of the 15 challenges that were rated by respondents as most difficult (i.e., Difficulty Index of 5 or more on a scale of 1-10. See page 5 for more information on the Difficulty Index.)
VARIATIONS FROM AVERAGESAverages for each of the five types are at the bottom of the table. Cells are shaded to show variations above and below those averages:
• Darker: 3% or more above average• Medium: Within 3% of average• Lighter: 3% or more below average While the total percentage in each cell is the leading metric for this analysis, variations from average indicate concentrations of user preferences.
• Except for assessing risk related to potential changes, the above-average ratings for any particular challenge are either in the first two columns (third- party tools) or in the last three columns (other types of solutions).
• Understanding where money is being made or lost has the greatest range, from 39% for third-party desktop to 24% for internally developed.
Types of Tools Used to Address Most Difficult Challenges
Most Difficult Cost Management Challenges (Index of 5 or higher)
17% 32% 29% 17% 5%
18% 26% 36% 16% 4%
18% 25% 33% 19% 6%
21% 26% 34% 15% 4%
16% 34% 36% 11% 2%
23% 25% 32% 14% 5%
19% 39% 24% 15% 4%
13% 32% 37% 15% 2%
19% 31% 27% 15% 7%
18% 35% 30% 14% 4%
16% 30% 36% 12% 6%
Third-Party Cloud-Based
Third-Party Desktop
Internally Developed Spread Sheets
Converting a final cost estimate into a project budget compatible with cost accounts
Tracking costs for every aspect of the job to determine how they impact overall
project cost
Accurately estimating total cost to complete for activities in the work breakdown structure
Determining appropriate contingency amounts
Assessing risk related to potential changes
Tracking units of work completed in the field
Understanding in real time where we are making or losing money
Managing change orders and documentation through the whole approval process
Status reporting during the project
Maintaining accurate, up-to-date cost information between office and field
Effectively integrating cost and schedule information
Average Percentages: 18% 30% 32% 16%
3% or More Above Average Within 3% of Average 3% or More Below Average
Average Percentages Using Each Type of Tool for Their Most Difficult Challenges
Mostly Manual Processes
4%
Cost Management Solutions (CONTINUED)
TH
E C
ON
ST
RU
CT
ION
CO
ST
MA
NA
GE
ME
NT
RE
PO
RT
© Dodge Data & Analytics www.construction.com Premier Partner: Procore Technologies, Inc. SmartMarket Brief: The Construction Cost Management Report 18
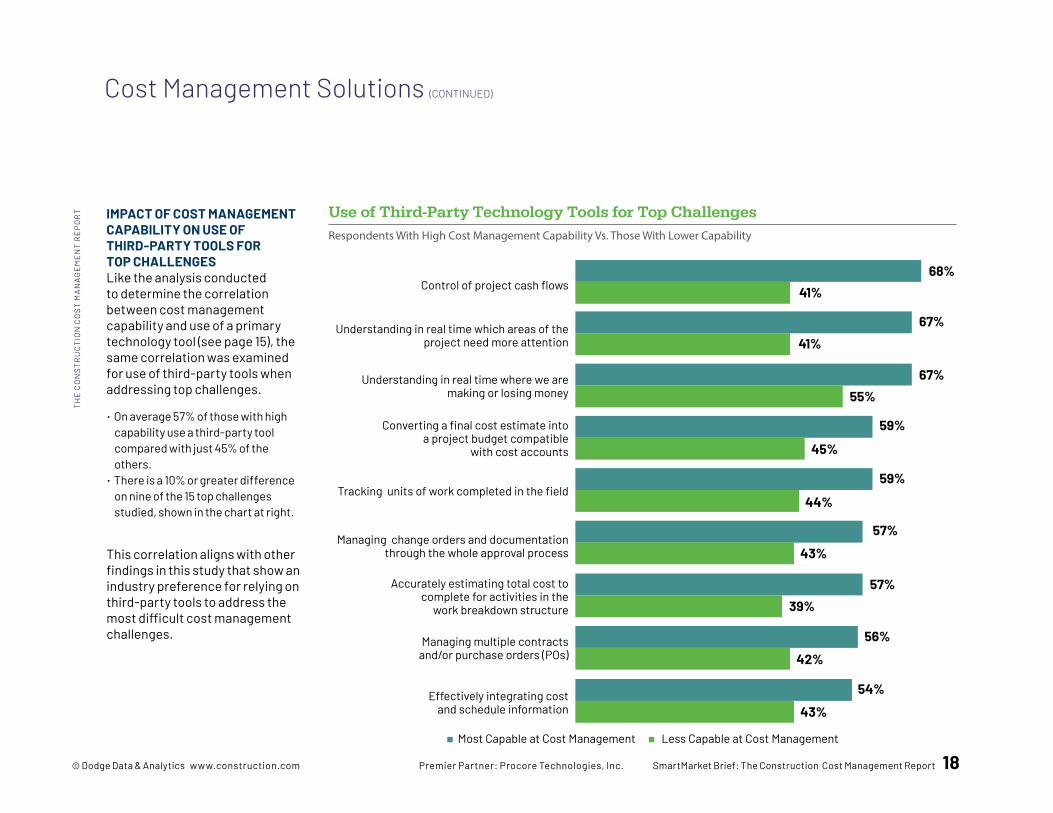
Use of Third-Party Technology Tools for Top ChallengesIMPACT OF COST MANAGEMENT CAPABILITY ON USE OF THIRD-PARTY TOOLS FOR TOP CHALLENGESLike the analysis conducted to determine the correlation between cost management capability and use of a primary technology tool (see page 15), the same correlation was examined for use of third-party tools when addressing top challenges.
• On average 57% of those with high capability use a third-party tool compared with just 45% of the others.
• There is a 10% or greater difference on nine of the 15 top challenges studied, shown in the chart at right.
This correlation aligns with other findings in this study that show an industry preference for relying on third-party tools to address the most difficult cost management challenges.
Cost Management Solutions (CONTINUED)
Control of project cash flows68%
41%
Understanding in real time which areas of the project need more attention
67%41%
Understanding in real time where we are making or losing money
67%55%
Converting a final cost estimate into a project budget compatible
with cost accounts
59%
45%
Tracking units of work completed in the field59%
44%
Managing change orders and documentation through the whole approval process
57%
43%
57%39%
56%
42%
Accurately estimating total cost to complete for activities in the
work breakdown structure
Managing multiple contracts and/or purchase orders (POs)
Less Capable at Cost ManagementMost Capable at Cost Management
Respondents With High Cost Management Capability Vs. Those With Lower Capability
Effectively integrating cost and schedule information
54%
43%
TH
E C
ON
ST
RU
CT
ION
CO
ST
MA
NA
GE
ME
NT
RE
PO
RT

19 © Dodge Data & Analytics www.construction.com Premier Partner: Procore Technologies, Inc. SmartMarket Brief: The Construction Cost Management Report
USE OF THIRD-PARTY TECHNOLOGY TOOLS, BY REGIONWhile about half (49%) of all respondents report that they prefer to use a third-party tool for their most challenging cost management activities, the percentages vary significantly for specific challenges across the regions studied.
The table at right shows the averages for each challenge in the left-hand column. Other cells are shaded to show variations above and below the averages in each region:
• Darker: 5% or more above average• Medium: Within 5% of average• Lighter: 5% or more below average
Total averages per region are in a close range (USA: 49%; CAN: 51%; UK: 43%; ANZ: 50%). But most challenges display wide variation between regions.
• The average difference between highest and lowest percentage for each challenge is 21%
• The greatest gap is 39% for establishing a system of cost accounts (82% in ANZ, 44% in CAN)
These findings show that while the use of third-party technology for cost management is relatively consistent globally, there is significant variation in how it is applied to different challenges regionally.
Use of Third-Party Technology Tools to Address Top Challenges, by Region
Average Percentages Using Third-Party Tools for Their Most Difficult Challenges
All USA CAN UK
Establishing a system of cost accounts
Understanding in real time where we are making or losing money
Maintaining accurate, up-to-date cost information between office and field
Assessing risk related to potential changes
Status reporting during the project
Converting a final cost estimate into a project budget compatible with cost accounts
Tracking units of work completed in the field
Determining appropriate contingency amounts
Control of project cash flows
Managing multiple contracts
Effectively integrating cost and schedule information
ANZ
59% 54% 44% 55% 82%
57% 68% 60% 43% 55%
53% 71% 45% 50% 48%
50% 50% 50% 50% 50%
50% 46% 69% 36% 44%
49% 42% 50% 39% 60%
48% 59% 33% 31% 56%
47% 44% 52% 45% 45%
47% 45% 56% 38% 45%
46% 45% 50% 41% 53%
46% 46% 48% 50% 39%
46% 50% 57% 40% 35%
45% 36% 50% 41% 64%
44% 38% 53% 41% 41%
42% 45% 44% 48% 32%
Managing change orders and documentation through the whole approval process
Understanding in real time which areas of the project need more attention
Tracking costs for every aspect of the job to determine how they impact overall project cost
Accurately estimating total cost to complete for activities in the work breakdown schedule
5% or More Above Average Within 5% of Average 5% or More Below AverageAverage
Cost Management Solutions (CONTINUED)
TH
E C
ON
ST
RU
CT
ION
CO
ST
MA
NA
GE
ME
NT
RE
PO
RT

© Dodge Data & Analytics www.construction.com Premier Partner: Procore Technologies, Inc. SmartMarket Brief: The Construction Cost Management Report 20
SATISFACTION WITH TECHNOLOGY TOOLS Respondents were asked about their relative level of satisfaction with the technology tools they are using to address their top identified cost management challenges. Options were none, low, medium, high and very high.
OVERALL FINDINGSThe table at right shows the 15 challenges studied in the order of how many respondents express either high or very high satisfaction with the technology (ies) they currently use.
• On average, 43% rate their satisfaction as either high or very high.
• Medium is the most frequent rating in every case, ranging from 31% to 56%.
• The low or none ratings are least frequent, ranging from 9% to 19%, with only seven having any nones.
SATISFACTION INDEXTo compare relative satisfaction, the 15 top challenges are shown indexed on a 1-10 scale based on the percentages expressing satisfaction (high or very high) for each.
• The very high ratings ranged from 2% to 14%. • The high satisfaction ratings ranged from 26% to 44%. • So, even though a challenge may have a relatively low overall
satisfaction index, there are a significant number of users who express either high or very high satisfaction for technology usage on each one.
VARIATIONS IN SATISFACTION The following pages highlight how satisfaction varies among subgroups of respondents.
Satisfaction With Technology to Address Top Challenges
In Order of Reported High/Very High Satisfaction
Satisfaction With Cost Management Solutions
Converting a final cost estimate into a project budget compatible with cost accounts 10.0
Managing change orders and documentation through the whole approval process 8.6
Assessing risk related to potential changes 7.8
Status reporting during the project 7.8
Accurately estimating total cost to complete for activities in the work breakdown schedule 7.2
Maintaining accurate, up-to-date cost information between office and field 6.0
Effectively integrating cost and schedule information 5.6
Control of project cash flows 5.4
Tracking costs for every aspect of the job to determine how they impact overall project cost 5.4
Determining appropriate contingency amounts 5.2
Managing multiple contracts 4.8
Tracking units of work completed in the field. 4.4
Understanding in real time where we are making or losing money 4.4
Establishing a system of cost accounts 2.8
Understanding in real time which areas of the project need more attention 1.0
Cost Management Challenges Satisfaction Index
TH
E C
ON
ST
RU
CT
ION
CO
ST
MA
NA
GE
ME
NT
RE
PO
RT
21 © Dodge Data & Analytics www.construction.com Premier Partner: Procore Technologies, Inc. SmartMarket Brief: The Construction Cost Management Report
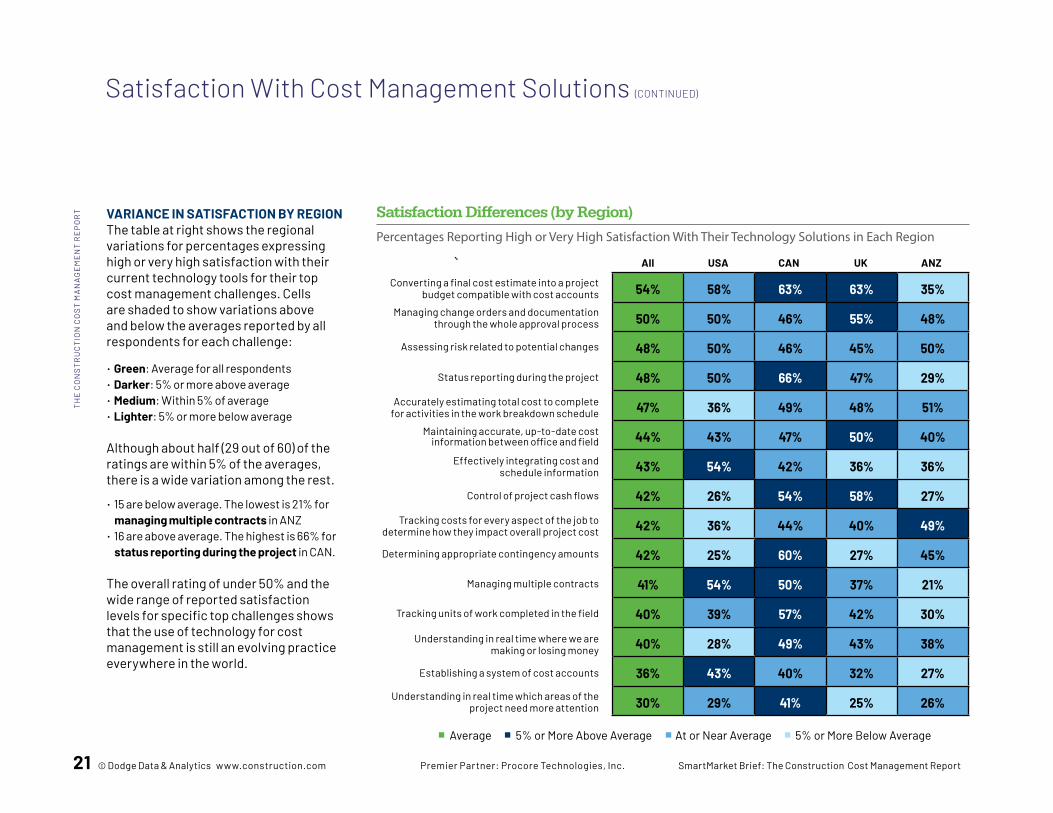
VARIANCE IN SATISFACTION BY REGIONThe table at right shows the regional variations for percentages expressing high or very high satisfaction with their current technology tools for their top cost management challenges. Cells are shaded to show variations above and below the averages reported by all respondents for each challenge:
• Green: Average for all respondents• Darker: 5% or more above average• Medium: Within 5% of average• Lighter: 5% or more below average Although about half (29 out of 60) of the ratings are within 5% of the averages, there is a wide variation among the rest.
• 15 are below average. The lowest is 21% for managing multiple contracts in ANZ
• 16 are above average. The highest is 66% for status reporting during the project in CAN.
The overall rating of under 50% and the wide range of reported satisfaction levels for specific top challenges shows that the use of technology for cost management is still an evolving practice everywhere in the world.
Satisfaction With Cost Management Solutions (CONTINUED)
Satisfaction Differences (by Region)
Percentages Reporting High or Very High Satisfaction With Their Technology Solutions in Each Region
All USA CAN UK
Converting a final cost estimate into a project budget compatible with cost accounts
Managing change orders and documentation through the whole approval process
Assessing risk related to potential changes
Status reporting during the project
Accurately estimating total cost to complete for activities in the work breakdown schedule
Maintaining accurate, up-to-date cost information between office and field
Effectively integrating cost and schedule information
Control of project cash flows
Tracking costs for every aspect of the job to determine how they impact overall project cost
Determining appropriate contingency amounts
Managing multiple contracts
ANZ
54% 58% 63% 63% 35%
50% 50% 46% 55% 48%
48% 50% 46% 45% 50%
48% 50% 66% 47% 29%
47% 36% 49% 48% 51%
44% 43% 47% 50% 40%
43% 54% 42% 36% 36%
42% 26% 54% 58% 27%
42% 36% 44% 40% 49%
42% 25% 60% 27% 45%
41% 54% 50% 37% 21%
40% 39% 57% 42% 30%
40% 28% 49% 43% 38%
36% 43% 40% 32% 27%
30% 29% 41% 25% 26%
Tracking units of work completed in the field
Understanding in real time where we are making or losing money
Establishing a system of cost accounts
Understanding in real time which areas of the project need more attention
5% or More Above Average At or Near Average 5% or More Below AverageAverage
TH
E C
ON
ST
RU
CT
ION
CO
ST
MA
NA
GE
ME
NT
RE
PO
RT
© Dodge Data & Analytics www.construction.com Premier Partner: Procore Technologies, Inc. SmartMarket Brief: The Construction Cost Management Report 22
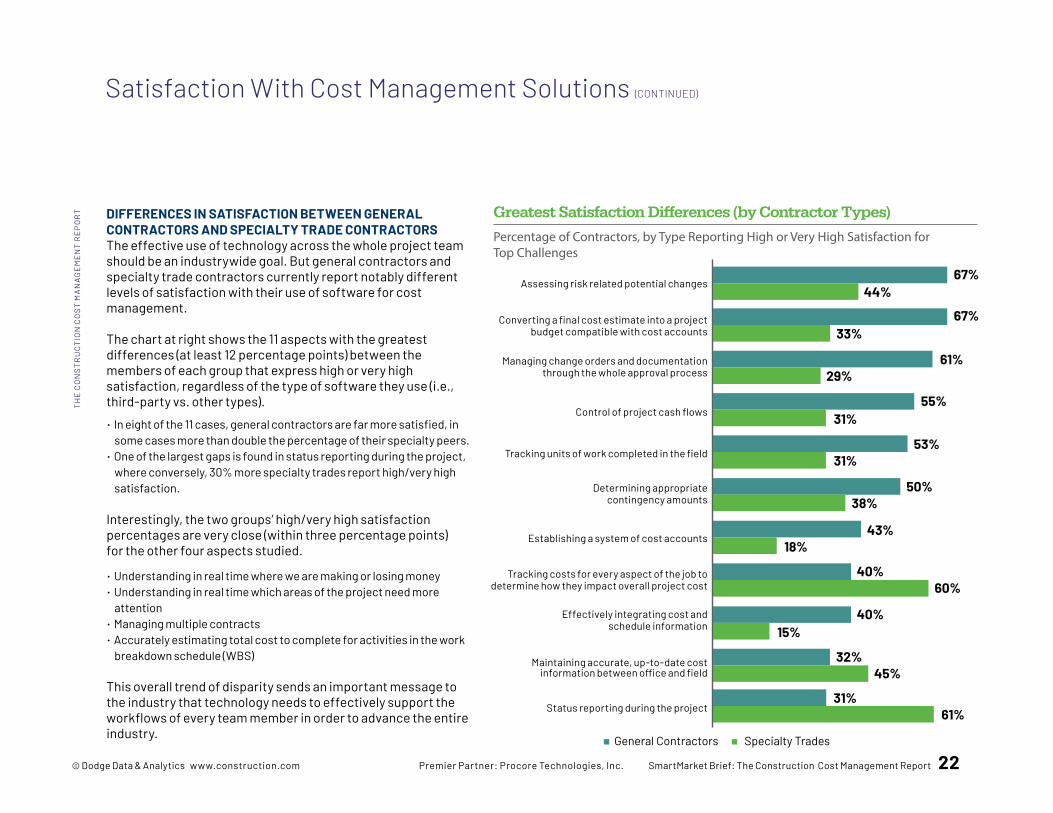
Greatest Satisfaction Differences (by Contractor Types)
Percentage of Contractors, by Type Reporting High or Very High Satisfaction for Top Challenges
DIFFERENCES IN SATISFACTION BETWEEN GENERAL CONTRACTORS AND SPECIALTY TRADE CONTRACTORSThe effective use of technology across the whole project team should be an industrywide goal. But general contractors and specialty trade contractors currently report notably different levels of satisfaction with their use of software for cost management. The chart at right shows the 11 aspects with the greatest differences (at least 12 percentage points) between the members of each group that express high or very high satisfaction, regardless of the type of software they use (i.e., third-party vs. other types). • In eight of the 11 cases, general contractors are far more satisfied, in
some cases more than double the percentage of their specialty peers. • One of the largest gaps is found in status reporting during the project,
where conversely, 30% more specialty trades report high/very high satisfaction.
Interestingly, the two groups’ high/very high satisfaction percentages are very close (within three percentage points) for the other four aspects studied.
• Understanding in real time where we are making or losing money• Understanding in real time which areas of the project need more
attention• Managing multiple contracts• Accurately estimating total cost to complete for activities in the work
breakdown schedule (WBS) This overall trend of disparity sends an important message to the industry that technology needs to effectively support the workflows of every team member in order to advance the entire industry.
Satisfaction With Cost Management Solutions (CONTINUED)
Assessing risk related potential changes67%
Specialty TradesGeneral Contractors
Converting a final cost estimate into a project budget compatible with cost accounts
Managing change orders and documentation through the whole approval process
Control of project cash flows
Tracking units of work completed in the field
Determining appropriate contingency amounts
Establishing a system of cost accounts
Tracking costs for every aspect of the job to determine how they impact overall project cost
Effectively integrating cost and schedule information
Maintaining accurate, up-to-date cost information between office and field
Status reporting during the project
44%
67%33%
61%29%
55%31%
53%31%
50%38%
43%18%
40%60%
40%15%
32%45%
31%61%
TH
E C
ON
ST
RU
CT
ION
CO
ST
MA
NA
GE
ME
NT
RE
PO
RT
23 © Dodge Data & Analytics www.construction.com Premier Partner: Procore Technologies, Inc. SmartMarket Brief: The Construction Cost Management Report
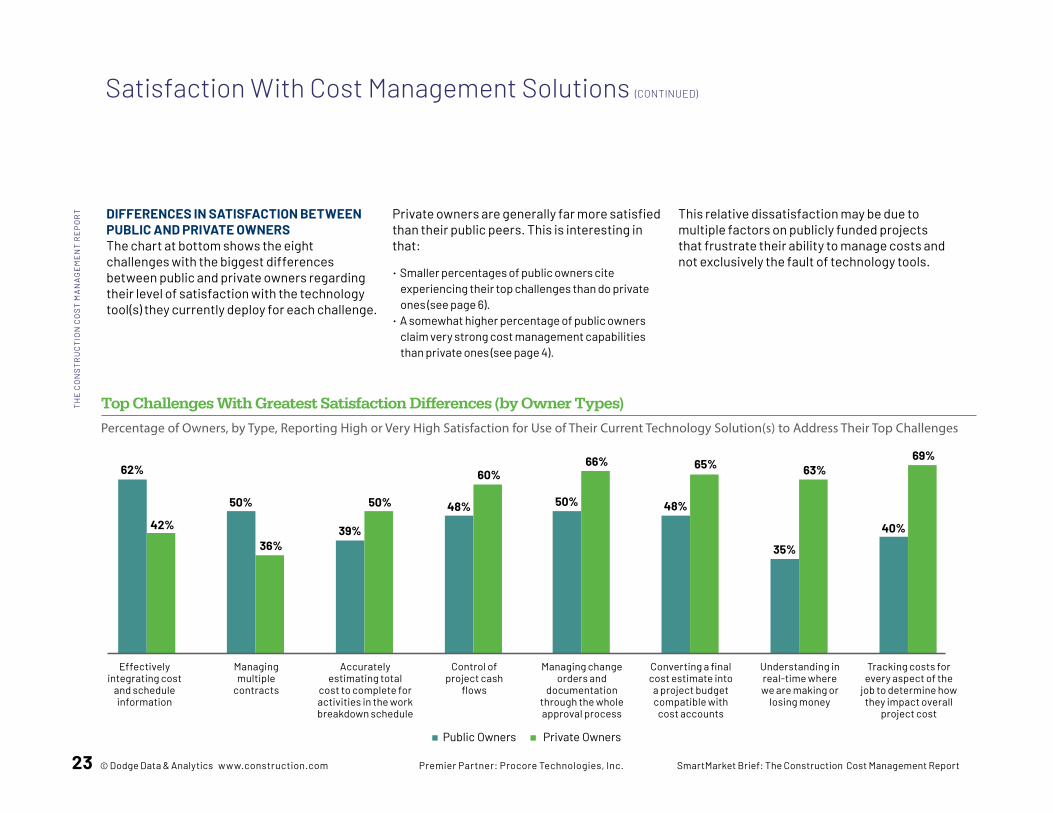
Top Challenges With Greatest Satisfaction Differences (by Owner Types)
Percentage of Owners, by Type, Reporting High or Very High Satisfaction for Use of Their Current Technology Solution(s) to Address Their Top Challenges
DIFFERENCES IN SATISFACTION BETWEEN PUBLIC AND PRIVATE OWNERSThe chart at bottom shows the eight challenges with the biggest differences between public and private owners regarding their level of satisfaction with the technology tool(s) they currently deploy for each challenge.
Private owners are generally far more satisfied than their public peers. This is interesting in that:
• Smaller percentages of public owners cite experiencing their top challenges than do private ones (see page 6).
• A somewhat higher percentage of public owners claim very strong cost management capabilities than private ones (see page 4).
This relative dissatisfaction may be due to multiple factors on publicly funded projects that frustrate their ability to manage costs and not exclusively the fault of technology tools.
Private OwnersPublic Owners
62%
Effectively integrating cost
and schedule information
42%
50%
Managing multiple
contracts
36%39%
Accurately estimating total
cost to complete for activities in the work breakdown schedule
50% 48%
Control of project cash
flows
60%
50%
Managing change orders and
documentation through the whole approval process
66%
48%
Converting a final cost estimate into a project budget compatible with
cost accounts
65%
35%
Understanding in real-time where we are making or
losing money
63%
40%
Tracking costs for every aspect of the
job to determine how they impact overall
project cost
69%
TH
E C
ON
ST
RU
CT
ION
CO
ST
MA
NA
GE
ME
NT
RE
PO
RT
Satisfaction With Cost Management Solutions (CONTINUED)
© Dodge Data & Analytics www.construction.com Premier Partner: Procore Technologies, Inc. SmartMarket Brief: The Construction Cost Management Report 24
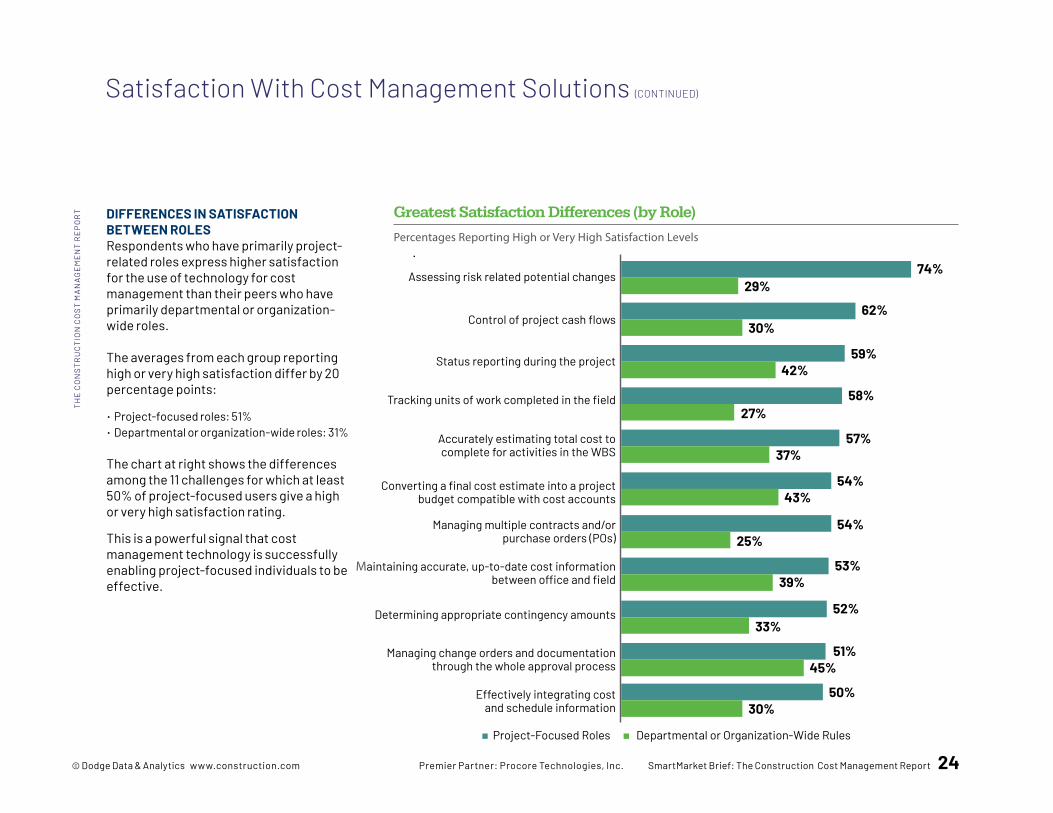
DIFFERENCES IN SATISFACTION BETWEEN ROLESRespondents who have primarily project-related roles express higher satisfaction for the use of technology for cost management than their peers who have primarily departmental or organization-wide roles. The averages from each group reporting high or very high satisfaction differ by 20 percentage points:
• Project-focused roles: 51%• Departmental or organization-wide roles: 31% The chart at right shows the differences among the 11 challenges for which at least 50% of project-focused users give a high or very high satisfaction rating.
This is a powerful signal that cost management technology is successfully enabling project-focused individuals to be effective.
Satisfaction With Cost Management Solutions (CONTINUED)
Greatest Satisfaction Differences (by Role)
Percentages Reporting High or Very High Satisfaction Levels
Assessing risk related potential changes 74%
Departmental or Organization-Wide RulesProject-Focused Roles
Control of project cash flows
Status reporting during the project
Tracking units of work completed in the field
Accurately estimating total cost to complete for activities in the WBS
Converting a final cost estimate into a project budget compatible with cost accounts
Managing multiple contracts and/or purchase orders (POs)
Maintaining accurate, up-to-date cost information between office and field
Determining appropriate contingency amounts
Managing change orders and documentation through the whole approval process
Effectively integrating cost and schedule information
29%
62%30%
59%42%
58%27%
57%37%
54%43%
54%25%
53%39%
52%33%
51%45%
50%30%
TH
E C
ON
ST
RU
CT
ION
CO
ST
MA
NA
GE
ME
NT
RE
PO
RT
25 © Dodge Data & Analytics www.construction.com Premier Partner: Procore Technologies, Inc. SmartMarket Brief: The Construction Cost Management Report
Greatest Satisfaction Differences (by Types of Tools Used)
Percentages Reporting High or Very High Satisfaction With Third-Party and Other Technology Tools
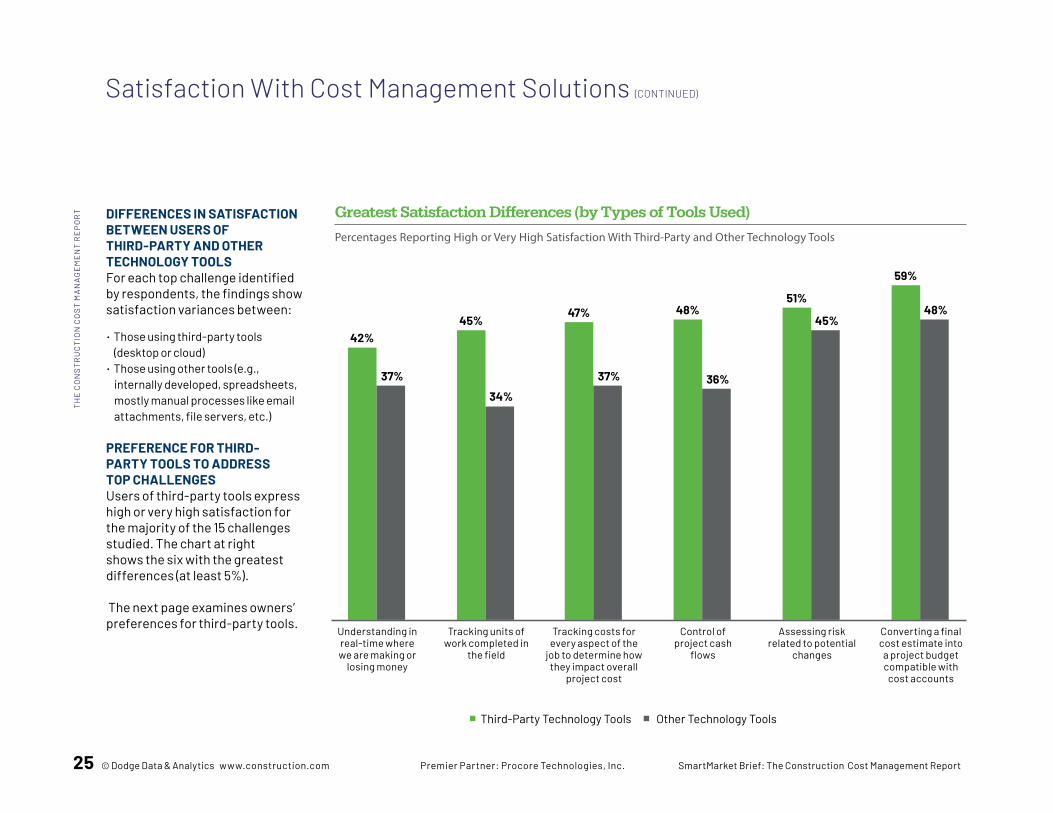
DIFFERENCES IN SATISFACTION BETWEEN USERS OF THIRD-PARTY AND OTHER TECHNOLOGY TOOLS For each top challenge identified by respondents, the findings show satisfaction variances between:
• Those using third-party tools (desktop or cloud)
• Those using other tools (e.g., internally developed, spreadsheets, mostly manual processes like email attachments, file servers, etc.)
PREFERENCE FOR THIRD-PARTY TOOLS TO ADDRESS TOP CHALLENGESUsers of third-party tools express high or very high satisfaction for the majority of the 15 challenges studied. The chart at right shows the six with the greatest differences (at least 5%). The next page examines owners’ preferences for third-party tools.
42%
Understanding in real-time where we are making or
losing money
37%
45%
Tracking units of work completed in
the field
34%
47%
Tracking costs for every aspect of the
job to determine how they impact overall
project cost
37%
48%
Control of project cash
flows
36%
51%
Assessing risk related to potential
changes
45%
59%
Converting a final cost estimate into a project budget compatible with
cost accounts
48%
Other Technology ToolsThird-Party Technology Tools
TH
E C
ON
ST
RU
CT
ION
CO
ST
MA
NA
GE
ME
NT
RE
PO
RT
Satisfaction With Cost Management Solutions (CONTINUED)
26 © Dodge Data & Analytics www.construction.com Premier Partner: Procore Technologies, Inc. SmartMarket Brief: The Construction Cost Management Report
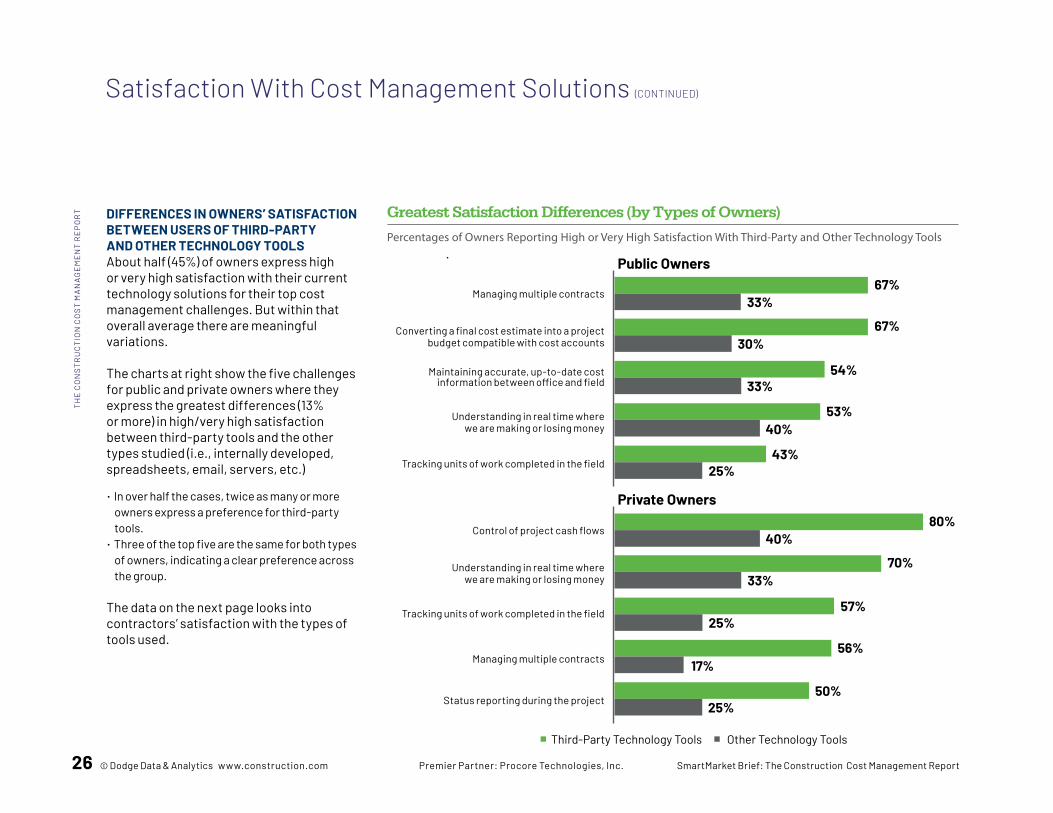
DIFFERENCES IN OWNERS’ SATISFACTION BETWEEN USERS OF THIRD-PARTY AND OTHER TECHNOLOGY TOOLSAbout half (45%) of owners express high or very high satisfaction with their current technology solutions for their top cost management challenges. But within that overall average there are meaningful variations. The charts at right show the five challenges for public and private owners where they express the greatest differences (13% or more) in high/very high satisfaction between third-party tools and the other types studied (i.e., internally developed, spreadsheets, email, servers, etc.)
• In over half the cases, twice as many or more owners express a preference for third-party tools.
• Three of the top five are the same for both types of owners, indicating a clear preference across the group.
The data on the next page looks into contractors’ satisfaction with the types of tools used.
Greatest Satisfaction Differences (by Types of Owners)
Percentages of Owners Reporting High or Very High Satisfaction With Third-Party and Other Technology Tools
Managing multiple contracts67%
Converting a final cost estimate into a project budget compatible with cost accounts
Maintaining accurate, up-to-date cost information between office and field
Understanding in real time where we are making or losing money
Tracking units of work completed in the field
33%
67%30%
54%33%
53%40%
43%25%
Public Owners
Other Technology ToolsThird-Party Technology Tools
Control of project cash flows80%
Understanding in real time where we are making or losing money
Tracking units of work completed in the field
Managing multiple contracts
Status reporting during the project
40%
70%33%
57%25%
56%17%
50%25%
Private Owners
TH
E C
ON
ST
RU
CT
ION
CO
ST
MA
NA
GE
ME
NT
RE
PO
RT
Satisfaction With Cost Management Solutions (CONTINUED)
27 © Dodge Data & Analytics www.construction.com Premier Partner: Procore Technologies, Inc. SmartMarket Brief: The Construction Cost Management Report
Satisfaction With Cost Management Solutions (CONTINUED)
Greatest Satisfaction Differences (by Types of Contractors)
Percentages of Owners Reporting High or Very High Satisfaction With Third-Party and Other Technology Tools
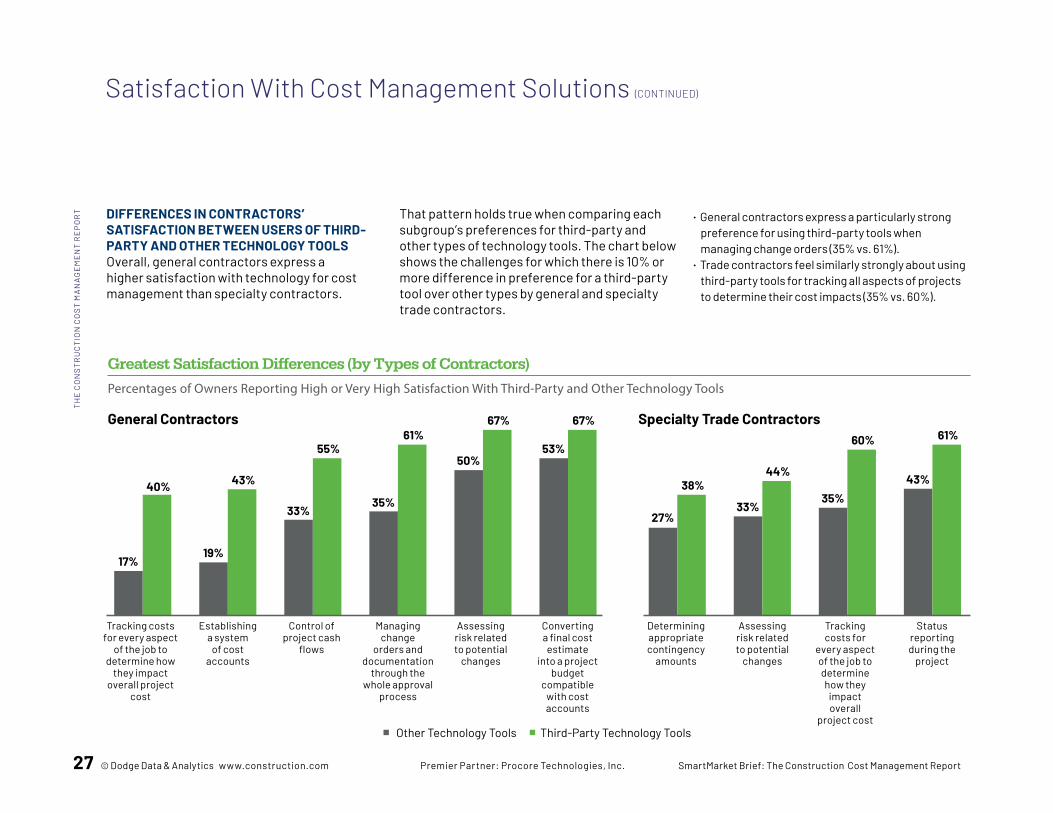
DIFFERENCES IN CONTRACTORS’ SATISFACTION BETWEEN USERS OF THIRD- PARTY AND OTHER TECHNOLOGY TOOLSOverall, general contractors express a higher satisfaction with technology for cost management than specialty contractors.
That pattern holds true when comparing each subgroup’s preferences for third-party and other types of technology tools. The chart below shows the challenges for which there is 10% or more difference in preference for a third-party tool over other types by general and specialty trade contractors.
• General contractors express a particularly strong preference for using third-party tools when managing change orders (35% vs. 61%).
• Trade contractors feel similarly strongly about using third-party tools for tracking all aspects of projects to determine their cost impacts (35% vs. 60%).
17%
Tracking costs for every aspect
of the job to determine how
they impact overall project
cost
40%
Other Technology Tools Third-Party Technology Tools
19%
43%
33%
55%
35%
61%
50%
67%
53%
67%
Establishing a system
of cost accounts
Control of project cash
flows
Managing change
orders and documentation
through the whole approval
process
Assessing risk related to potential
changes
Converting a final cost estimate
into a project budget
compatible with cost accounts
27%
38%
33%
44%
35%
60%
43%
61%
Determining appropriate contingency
amounts
Assessing risk related to potential
changes
Tracking costs for
every aspect of the job to determine how they
impact overall
project cost
Status reporting during the
project
General Contractors Specialty Trade Contractors
TH
E C
ON
ST
RU
CT
ION
CO
ST
MA
NA
GE
ME
NT
RE
PO
RT
© Dodge Data & Analytics www.construction.com Premier Partner: Procore Technologies, Inc. SmartMarket Brief: The Construction Cost Management Report 28
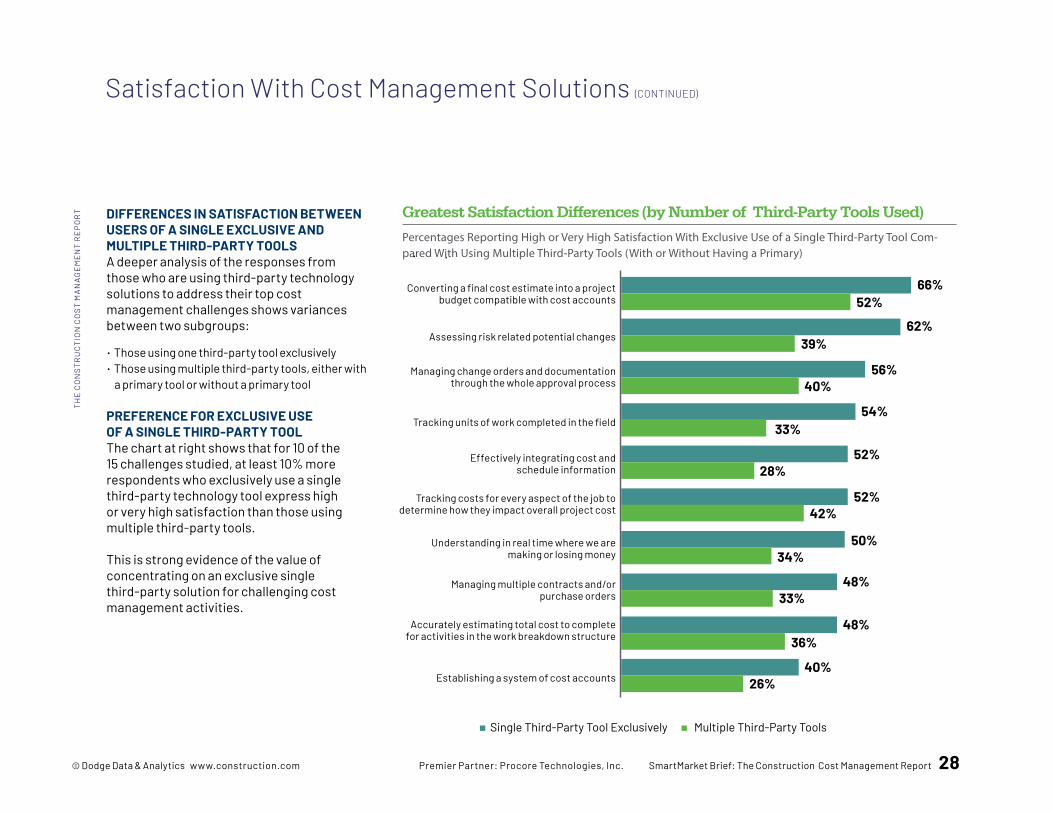
DIFFERENCES IN SATISFACTION BETWEEN USERS OF A SINGLE EXCLUSIVE AND MULTIPLE THIRD-PARTY TOOLSA deeper analysis of the responses from those who are using third-party technology solutions to address their top cost management challenges shows variances between two subgroups:
• Those using one third-party tool exclusively• Those using multiple third-party tools, either with
a primary tool or without a primary tool
PREFERENCE FOR EXCLUSIVE USE OF A SINGLE THIRD-PARTY TOOLThe chart at right shows that for 10 of the 15 challenges studied, at least 10% more respondents who exclusively use a single third-party technology tool express high or very high satisfaction than those using multiple third-party tools. This is strong evidence of the value of concentrating on an exclusive single third-party solution for challenging cost management activities.
Greatest Satisfaction Differences (by Number of Third-Party Tools Used)
Percentages Reporting High or Very High Satisfaction With Exclusive Use of a Single Third-Party Tool Com-pared With Using Multiple Third-Party Tools (With or Without Having a Primary)
Converting a final cost estimate into a project budget compatible with cost accounts
66%
Multiple Third-Party ToolsSingle Third-Party Tool Exclusively
Assessing risk related potential changes
Managing change orders and documentation through the whole approval process
Tracking units of work completed in the field
Effectively integrating cost and schedule information
Tracking costs for every aspect of the job to determine how they impact overall project cost
Understanding in real time where we are making or losing money
Managing multiple contracts and/or purchase orders
Accurately estimating total cost to complete for activities in the work breakdown structure
Establishing a system of cost accounts
52%
62%39%
56%40%
54%33%
52%28%
52%42%
50%34%
48%33%
48%36%
40%26%
TH
E C
ON
ST
RU
CT
ION
CO
ST
MA
NA
GE
ME
NT
RE
PO
RT
Satisfaction With Cost Management Solutions (CONTINUED)
29 © Dodge Data & Analytics www.construction.com Premier Partner: Procore Technologies, Inc. SmartMarket Brief: The Construction Cost Management Report
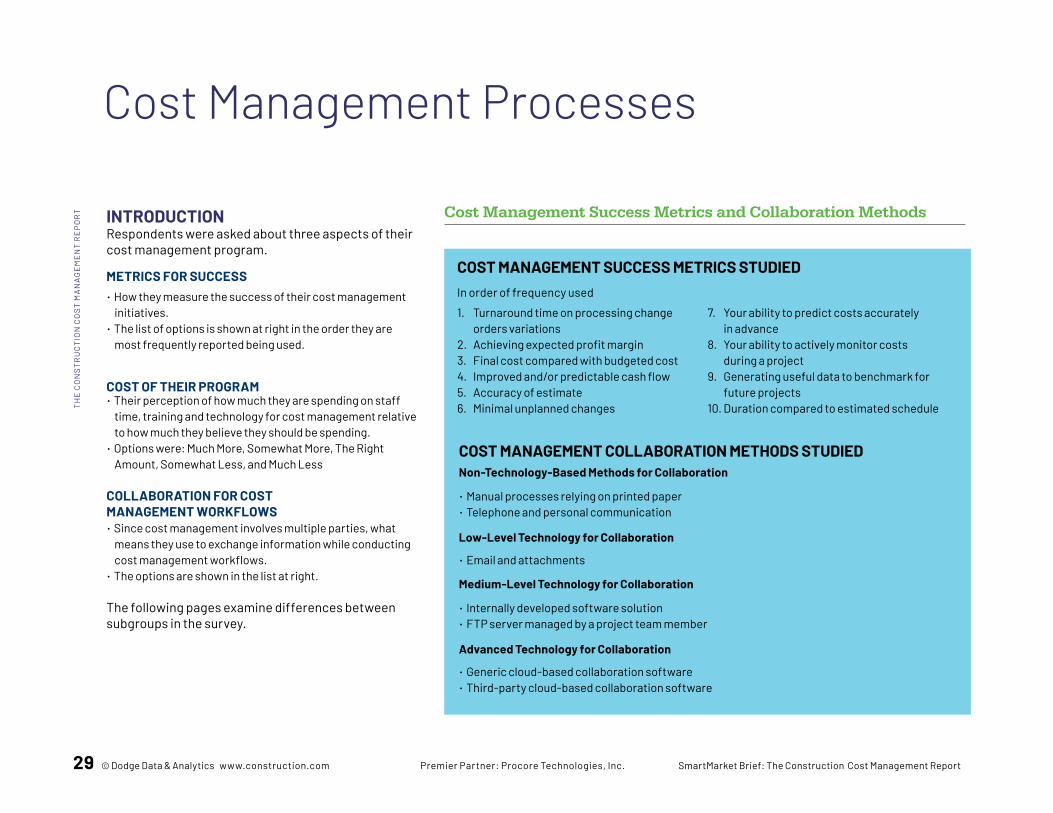
INTRODUCTIONRespondents were asked about three aspects of their cost management program.
METRICS FOR SUCCESS• How they measure the success of their cost management
initiatives.• The list of options is shown at right in the order they are
most frequently reported being used.
COST OF THEIR PROGRAM• Their perception of how much they are spending on staff
time, training and technology for cost management relative to how much they believe they should be spending.
• Options were: Much More, Somewhat More, The Right Amount, Somewhat Less, and Much Less
COLLABORATION FOR COST MANAGEMENT WORKFLOWS• Since cost management involves multiple parties, what
means they use to exchange information while conducting cost management workflows.
• The options are shown in the list at right. The following pages examine differences between subgroups in the survey.
Cost Management Processes
Cost Management Success Metrics and Collaboration Methods
COST MANAGEMENT SUCCESS METRICS STUDIEDIn order of frequency used
1. Turnaround time on processing change orders variations2. Achieving expected profit margin3. Final cost compared with budgeted cost4. Improved and/or predictable cash flow5. Accuracy of estimate6. Minimal unplanned changes
COST MANAGEMENT COLLABORATION METHODS STUDIED Non-Technology-Based Methods for Collaboration
• Manual processes relying on printed paper • Telephone and personal communication Low-Level Technology for Collaboration
• Email and attachments Medium-Level Technology for Collaboration
• Internally developed software solution• FTP server managed by a project team member
Advanced Technology for Collaboration
• Generic cloud-based collaboration software • Third-party cloud-based collaboration software
7. Your ability to predict costs accurately in advance8. Your ability to actively monitor costs during a project9. Generating useful data to benchmark for future projects10. Duration compared to estimated scheduleT
HE
CO
NS
TR
UC
TIO
N C
OS
T M
AN
AG
EM
EN
T R
EP
OR
T
© Dodge Data & Analytics www.construction.com Premier Partner: Procore Technologies, Inc. SmartMarket Brief: The Construction Cost Management Report 30
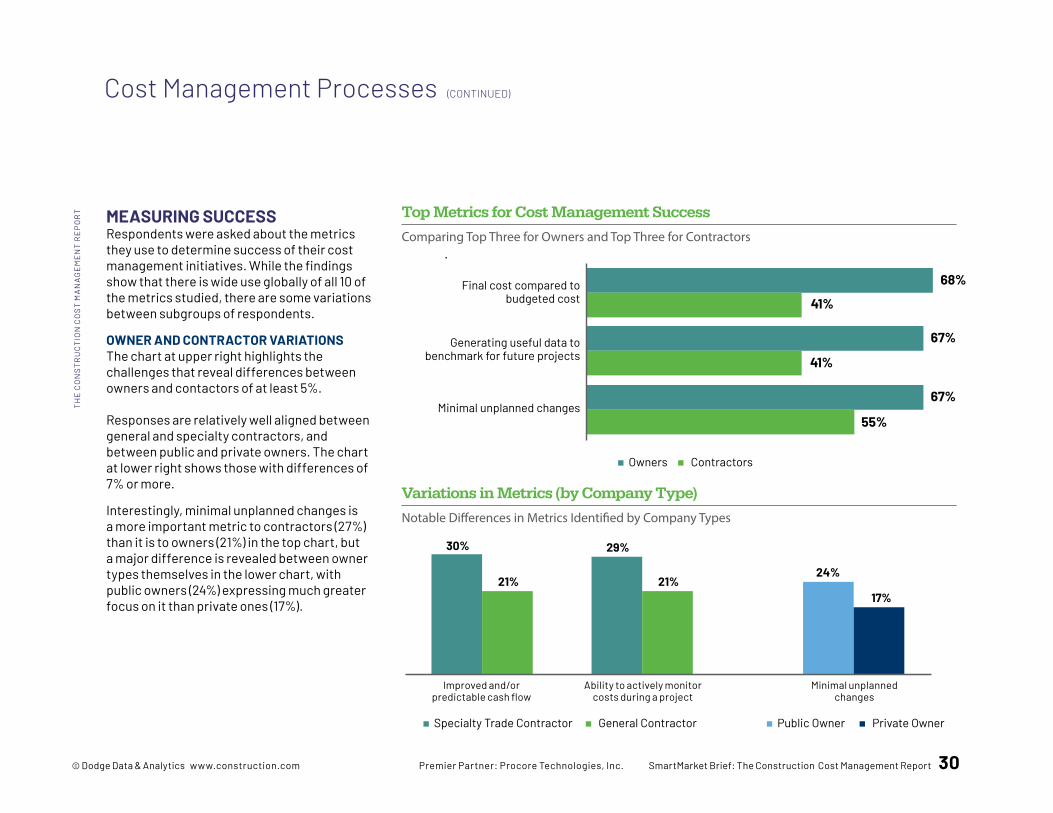
MEASURING SUCCESS Respondents were asked about the metrics they use to determine success of their cost management initiatives. While the findings show that there is wide use globally of all 10 of the metrics studied, there are some variations between subgroups of respondents.
OWNER AND CONTRACTOR VARIATIONSThe chart at upper right highlights the challenges that reveal differences between owners and contactors of at least 5%. Responses are relatively well aligned between general and specialty contractors, and between public and private owners. The chart at lower right shows those with differences of 7% or more.
Interestingly, minimal unplanned changes is a more important metric to contractors (27%) than it is to owners (21%) in the top chart, but a major difference is revealed between owner types themselves in the lower chart, with public owners (24%) expressing much greater focus on it than private ones (17%).
Cost Management Processes (CONTINUED)
Top Metrics for Cost Management Success
Comparing Top Three for Owners and Top Three for Contractors
Final cost compared to budgeted cost
68%
41%
Generating useful data to benchmark for future projects
67%
41%
Minimal unplanned changes67%
55%
ContractorsOwners
Variations in Metrics (by Company Type)
Notable Differences in Metrics Identified by Company Types
General ContractorSpecialty Trade Contractor Private OwnerPublic Owner
30%
Improved and/or predictable cash flow
21%
29%
Ability to actively monitor costs during a project
21%24%
Minimal unplanned changes
17%
TH
E C
ON
ST
RU
CT
ION
CO
ST
MA
NA
GE
ME
NT
RE
PO
RT
31 © Dodge Data & Analytics www.construction.com Premier Partner: Procore Technologies, Inc. SmartMarket Brief: The Construction Cost Management Report
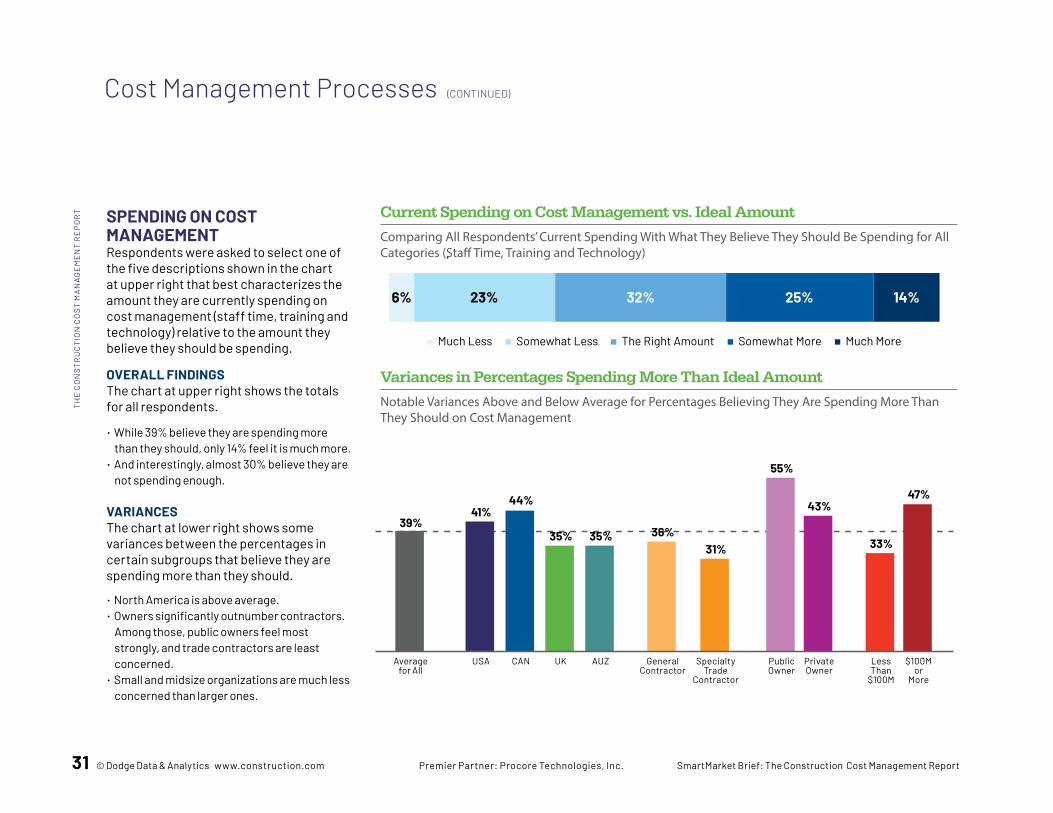
SPENDING ON COST MANAGEMENTRespondents were asked to select one of the five descriptions shown in the chart at upper right that best characterizes the amount they are currently spending on cost management (staff time, training and technology) relative to the amount they believe they should be spending.
OVERALL FINDINGSThe chart at upper right shows the totals for all respondents.
• While 39% believe they are spending more than they should, only 14% feel it is much more.
• And interestingly, almost 30% believe they are not spending enough.
VARIANCESThe chart at lower right shows some variances between the percentages in certain subgroups that believe they are spending more than they should.
• North America is above average.• Owners significantly outnumber contractors.
Among those, public owners feel most strongly, and trade contractors are least concerned.
• Small and midsize organizations are much less concerned than larger ones.
Cost Management Processes (CONTINUED)
Current Spending on Cost Management vs. Ideal Amount
Comparing All Respondents’ Current Spending With What They Believe They Should Be Spending for All Categories (Staff Time, Training and Technology)
32%23%6% 14%
Much Less Somewhat Less The Right Amount Somewhat More Much More
25%
Variances in Percentages Spending More Than Ideal Amount
Notable Variances Above and Below Average for Percentages Believing They Are Spending More Than They Should on Cost Management
Average for All
39%
USA
41%
CAN
44%
UK AUZ General Contractor
31%
Public Owner
55%
Private Owner
43%
Specialty Trade
Contractor
35% 35%
Less Than
$100M
33%
$100M or
More
47%
36%
TH
E C
ON
ST
RU
CT
ION
CO
ST
MA
NA
GE
ME
NT
RE
PO
RT
© Dodge Data & Analytics www.construction.com Premier Partner: Procore Technologies, Inc. SmartMarket Brief: The Construction Cost Management Report 32
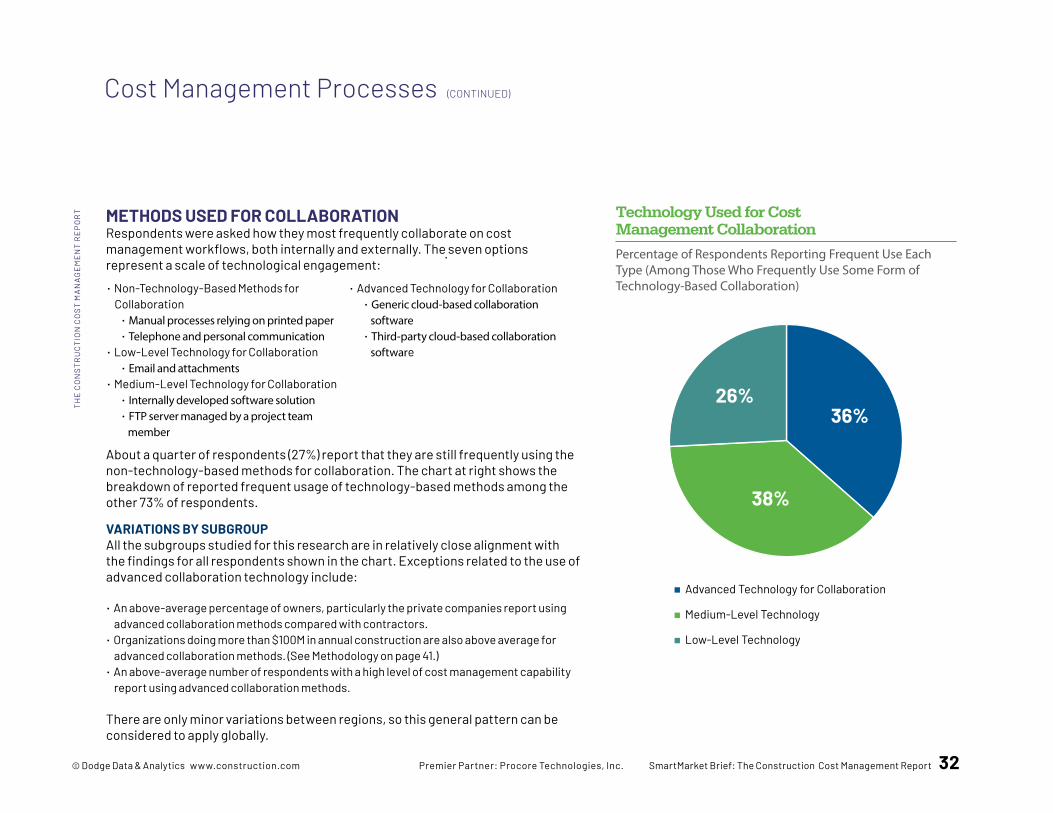
About a quarter of respondents (27%) report that they are still frequently using the non-technology-based methods for collaboration. The chart at right shows the breakdown of reported frequent usage of technology-based methods among the other 73% of respondents.
VARIATIONS BY SUBGROUPAll the subgroups studied for this research are in relatively close alignment with the findings for all respondents shown in the chart. Exceptions related to the use of advanced collaboration technology include:
• An above-average percentage of owners, particularly the private companies report using advanced collaboration methods compared with contractors.
• Organizations doing more than $100M in annual construction are also above average for advanced collaboration methods. (See Methodology on page 41.)
• An above-average number of respondents with a high level of cost management capability report using advanced collaboration methods.
There are only minor variations between regions, so this general pattern can be considered to apply globally.
Technology Used for Cost Management Collaboration
Percentage of Respondents Reporting Frequent Use Each Type (Among Those Who Frequently Use Some Form of Technology-Based Collaboration)
Advanced Technology for Collaboration
Medium-Level Technology
Low-Level Technology
26%36%
38%
METHODS USED FOR COLLABORATIONRespondents were asked how they most frequently collaborate on cost management workflows, both internally and externally. The seven options represent a scale of technological engagement:• Non-Technology-Based Methods for
Collaboration• Manual processes relying on printed paper • Telephone and personal communication
• Low-Level Technology for Collaboration• Email and attachments
• Medium-Level Technology for Collaboration• Internally developed software solution• FTP server managed by a project team
member
• Advanced Technology for Collaboration• Generic cloud-based collaboration
software • Third-party cloud-based collaboration
software
TH
E C
ON
ST
RU
CT
ION
CO
ST
MA
NA
GE
ME
NT
RE
PO
RT
Cost Management Processes (CONTINUED)
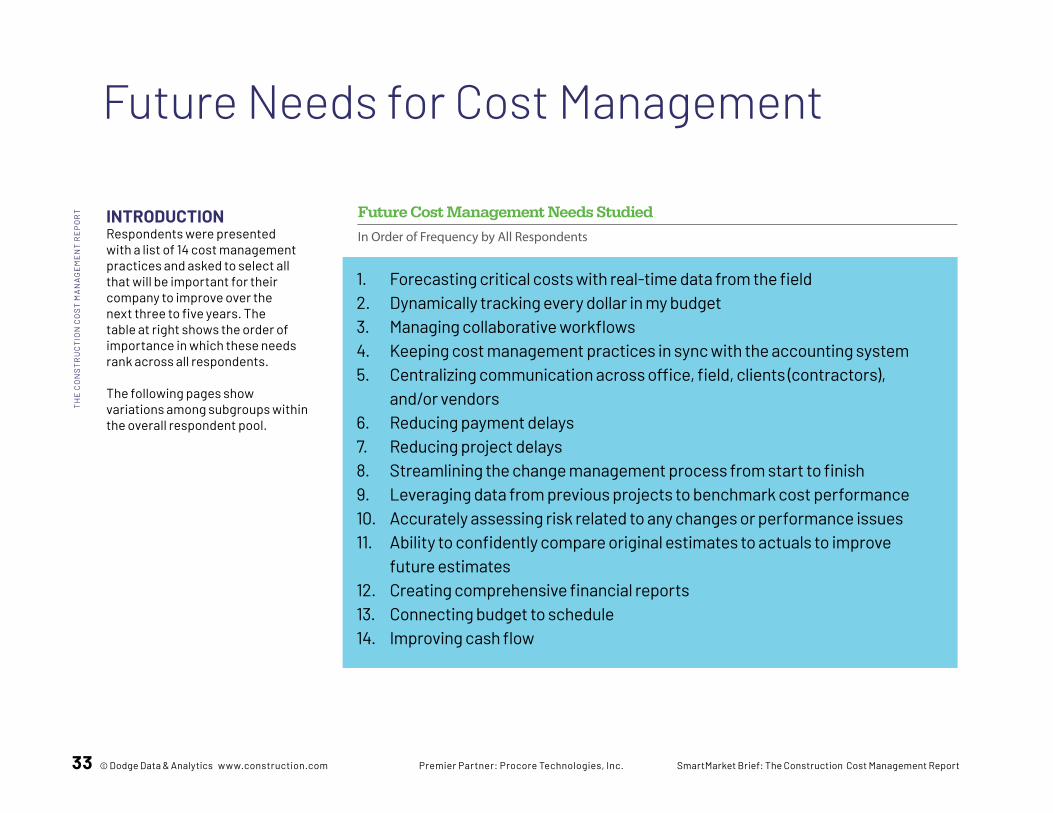
33 © Dodge Data & Analytics www.construction.com Premier Partner: Procore Technologies, Inc. SmartMarket Brief: The Construction Cost Management Report
INTRODUCTIONRespondents were presented with a list of 14 cost management practices and asked to select all that will be important for their company to improve over the next three to five years. The table at right shows the order of importance in which these needs rank across all respondents. The following pages show variations among subgroups within the overall respondent pool.
Future Needs for Cost Management
Future Cost Management Needs Studied
In Order of Frequency by All Respondents
1. Forecasting critical costs with real-time data from the field2. Dynamically tracking every dollar in my budget3. Managing collaborative workflows4. Keeping cost management practices in sync with the accounting system5. Centralizing communication across office, field, clients (contractors), and/or vendors6. Reducing payment delays7. Reducing project delays8. Streamlining the change management process from start to finish9. Leveraging data from previous projects to benchmark cost performance10. Accurately assessing risk related to any changes or performance issues11. Ability to confidently compare original estimates to actuals to improve future estimates12. Creating comprehensive financial reports13. Connecting budget to schedule14. Improving cash flow
TH
E C
ON
ST
RU
CT
ION
CO
ST
MA
NA
GE
ME
NT
RE
PO
RT
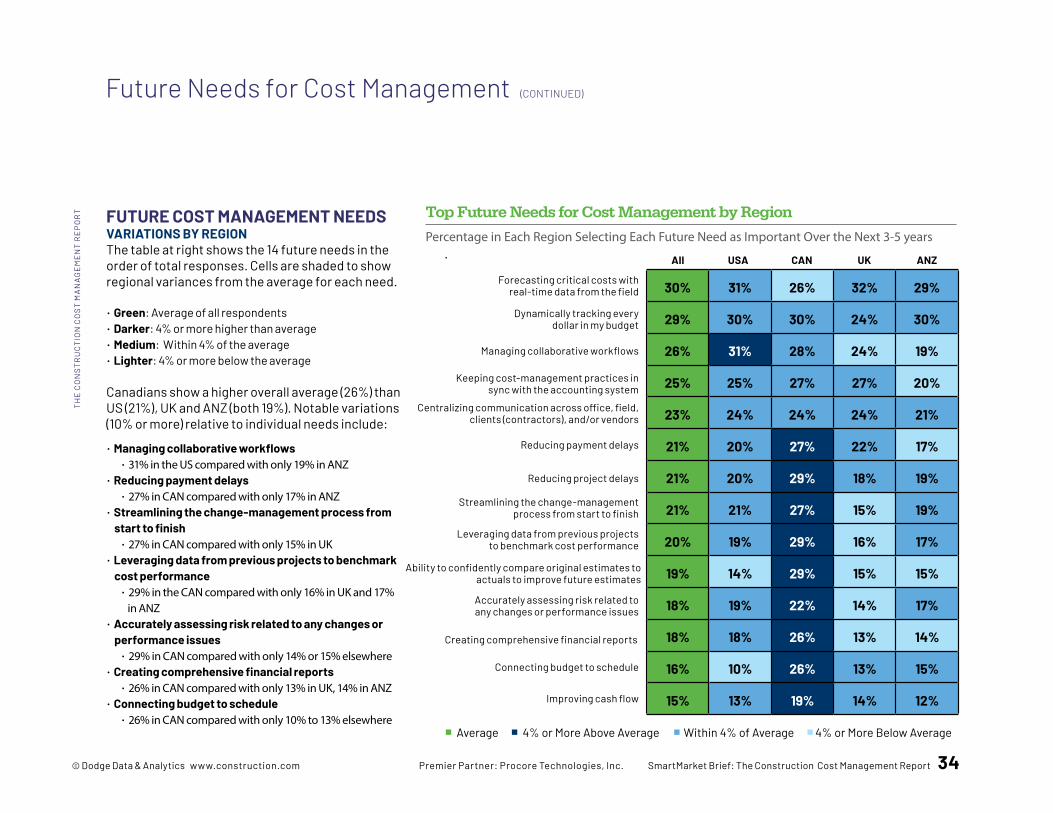
© Dodge Data & Analytics www.construction.com Premier Partner: Procore Technologies, Inc. SmartMarket Brief: The Construction Cost Management Report 34
FUTURE COST MANAGEMENT NEEDSVARIATIONS BY REGIONThe table at right shows the 14 future needs in the order of total responses. Cells are shaded to show regional variances from the average for each need.
• Green: Average of all respondents• Darker: 4% or more higher than average• Medium: Within 4% of the average• Lighter: 4% or more below the average Canadians show a higher overall average (26%) than US (21%), UK and ANZ (both 19%). Notable variations (10% or more) relative to individual needs include:
• Managing collaborative workflows• 31% in the US compared with only 19% in ANZ
• Reducing payment delays• 27% in CAN compared with only 17% in ANZ
• Streamlining the change-management process from start to finish
• 27% in CAN compared with only 15% in UK• Leveraging data from previous projects to benchmark
cost performance• 29% in the CAN compared with only 16% in UK and 17%
in ANZ• Accurately assessing risk related to any changes or
performance issues• 29% in CAN compared with only 14% or 15% elsewhere
• Creating comprehensive financial reports• 26% in CAN compared with only 13% in UK, 14% in ANZ
• Connecting budget to schedule• 26% in CAN compared with only 10% to 13% elsewhere
Future Needs for Cost Management (CONTINUED)
Top Future Needs for Cost Management by Region
Percentage in Each Region Selecting Each Future Need as Important Over the Next 3-5 years
All USA CAN UK
Forecasting critical costs with real-time data from the field
Dynamically tracking every dollar in my budget
Managing collaborative workflows
Keeping cost-management practices in sync with the accounting system
Centralizing communication across office, field, clients (contractors), and/or vendors
Reducing payment delays
Reducing project delays
Streamlining the change-management process from start to finish
Leveraging data from previous projects to benchmark cost performance
Accurately assessing risk related to any changes or performance issues
Ability to confidently compare original estimates to actuals to improve future estimates
ANZ
30% 31% 26% 32% 29%
29% 30% 30% 24% 30%
26% 31% 28% 24% 19%
25% 25% 27% 27% 20%
23% 24% 24% 24% 21%
21% 20% 27% 22% 17%
21% 20% 29% 18% 19%
21% 21% 27% 15% 19%
20% 19% 29% 16% 17%
19% 14% 29% 15% 15%
18% 19% 22% 14% 17%
18% 18% 26% 13% 14%
16% 10% 26% 13% 15%
15% 13% 19% 14% 12%
Creating comprehensive financial reports
Connecting budget to schedule
Improving cash flow
4% or More Above Average Within 4% of Average 4% or More Below AverageAverage
TH
E C
ON
ST
RU
CT
ION
CO
ST
MA
NA
GE
ME
NT
RE
PO
RT
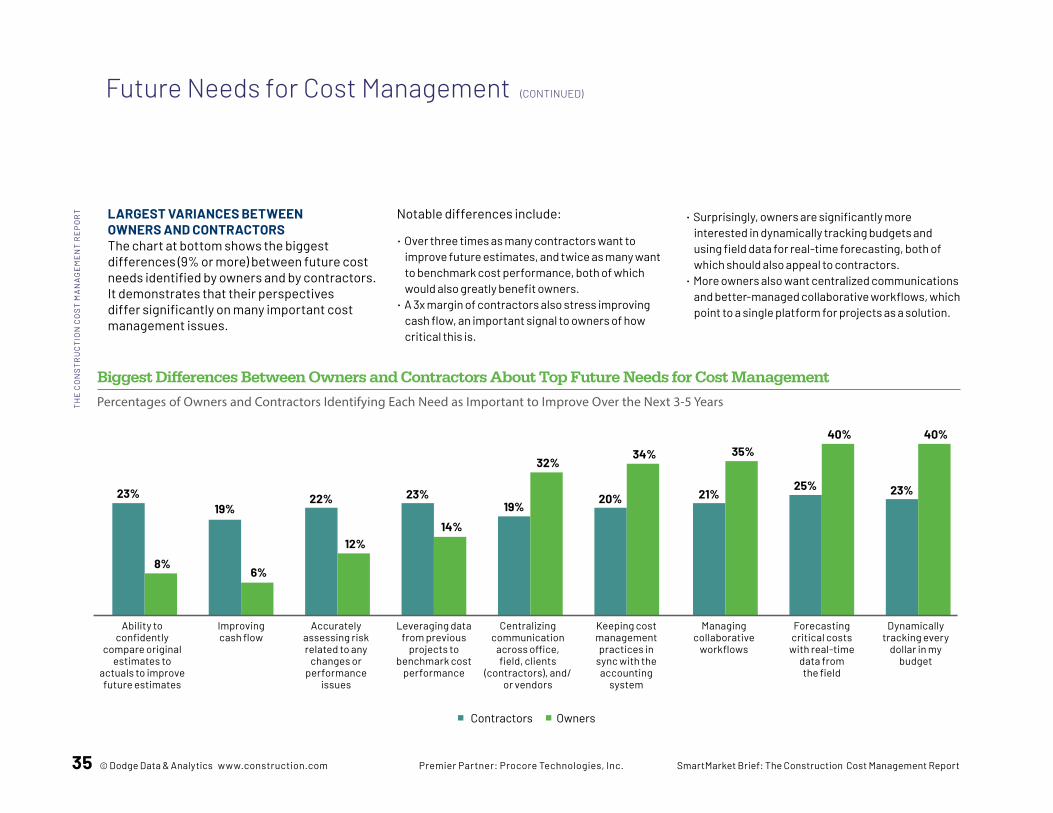
35 © Dodge Data & Analytics www.construction.com Premier Partner: Procore Technologies, Inc. SmartMarket Brief: The Construction Cost Management Report
Future Needs for Cost Management (CONTINUED)
Biggest Differences Between Owners and Contractors About Top Future Needs for Cost Management
Percentages of Owners and Contractors Identifying Each Need as Important to Improve Over the Next 3-5 Years
LARGEST VARIANCES BETWEEN OWNERS AND CONTRACTORS The chart at bottom shows the biggest differences (9% or more) between future cost needs identified by owners and by contractors. It demonstrates that their perspectives differ significantly on many important cost management issues.
Notable differences include:
• Over three times as many contractors want to improve future estimates, and twice as many want to benchmark cost performance, both of which would also greatly benefit owners.
• A 3x margin of contractors also stress improving cash flow, an important signal to owners of how critical this is.
• Surprisingly, owners are significantly more interested in dynamically tracking budgets and using field data for real-time forecasting, both of which should also appeal to contractors.
• More owners also want centralized communications and better-managed collaborative workflows, which point to a single platform for projects as a solution.
Contractors Owners
23%
Ability to confidently
compare original estimates to
actuals to improve future estimates
8%
19%
6%
22%
12%
23%
14%
19%
32%
20%
34%
Improving cash flow
Accurately assessing risk related to any
changes or performance
issues
Leveraging data from previous
projects to benchmark cost
performance
Centralizing communication
across office, field, clients
(contractors), and/or vendors
Keeping cost management practices in
sync with the accounting
system
21%
35%
25%
40%
23%
40%
Managing collaborative
workflows
Forecasting critical costs
with real-time data from the field
Dynamically tracking every
dollar in my budget
TH
E C
ON
ST
RU
CT
ION
CO
ST
MA
NA
GE
ME
NT
RE
PO
RT
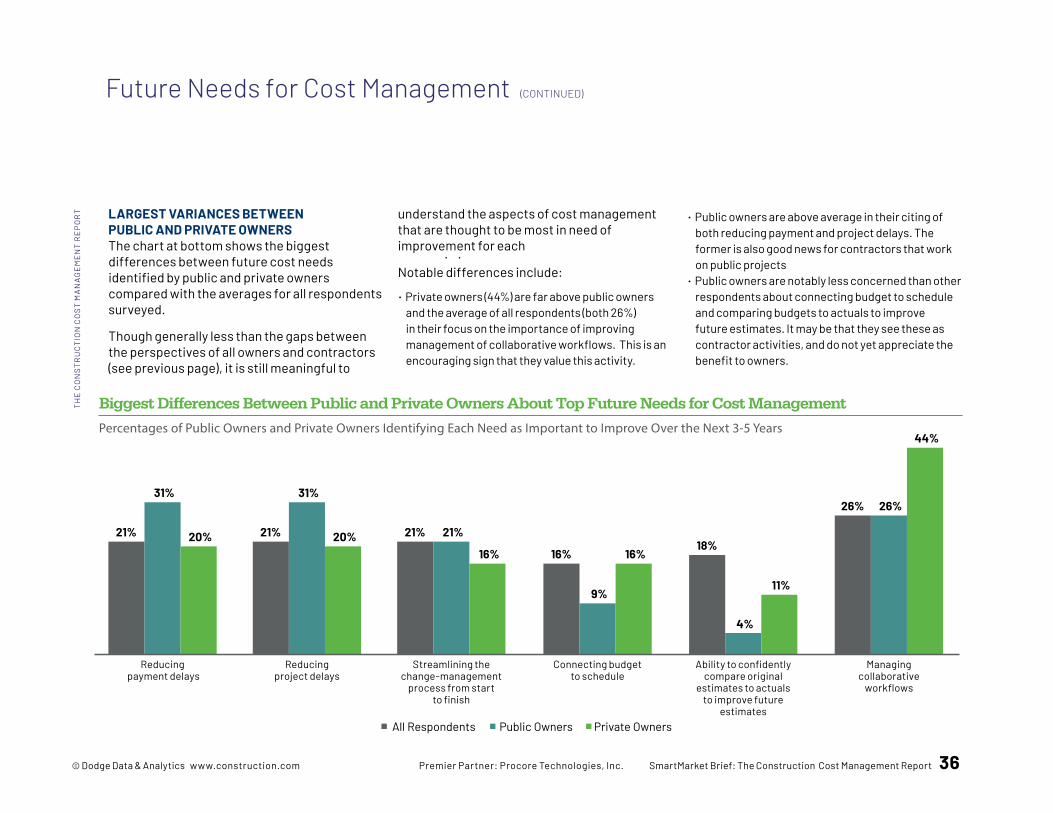
© Dodge Data & Analytics www.construction.com Premier Partner: Procore Technologies, Inc. SmartMarket Brief: The Construction Cost Management Report 36
All Respondents Public Owners Private Owners
Biggest Differences Between Public and Private Owners About Top Future Needs for Cost Management
Percentages of Public Owners and Private Owners Identifying Each Need as Important to Improve Over the Next 3-5 Years
LARGEST VARIANCES BETWEEN PUBLIC AND PRIVATE OWNERS The chart at bottom shows the biggest differences between future cost needs identified by public and private owners compared with the averages for all respondents surveyed.
Though generally less than the gaps between the perspectives of all owners and contractors (see previous page), it is still meaningful to
understand the aspects of cost management that are thought to be most in need of improvement for each
Notable differences include:
• Private owners (44%) are far above public owners and the average of all respondents (both 26%) in their focus on the importance of improving management of collaborative workflows. This is an encouraging sign that they value this activity.
• Public owners are above average in their citing of both reducing payment and project delays. The former is also good news for contractors that work on public projects
• Public owners are notably less concerned than other respondents about connecting budget to schedule and comparing budgets to actuals to improve future estimates. It may be that they see these as contractor activities, and do not yet appreciate the benefit to owners.
21%
Reducing payment delays
31%
20% 21%
Reducing project delays
31%
20% 21%
Streamlining the change-management
process from start to finish
21%
16% 16%
Connecting budget to schedule
9%
16%18%
Ability to confidently compare original
estimates to actuals to improve future
estimates
4%
11%
26%
Managing collaborative
workflows
26%
44%
TH
E C
ON
ST
RU
CT
ION
CO
ST
MA
NA
GE
ME
NT
RE
PO
RT
Future Needs for Cost Management (CONTINUED)
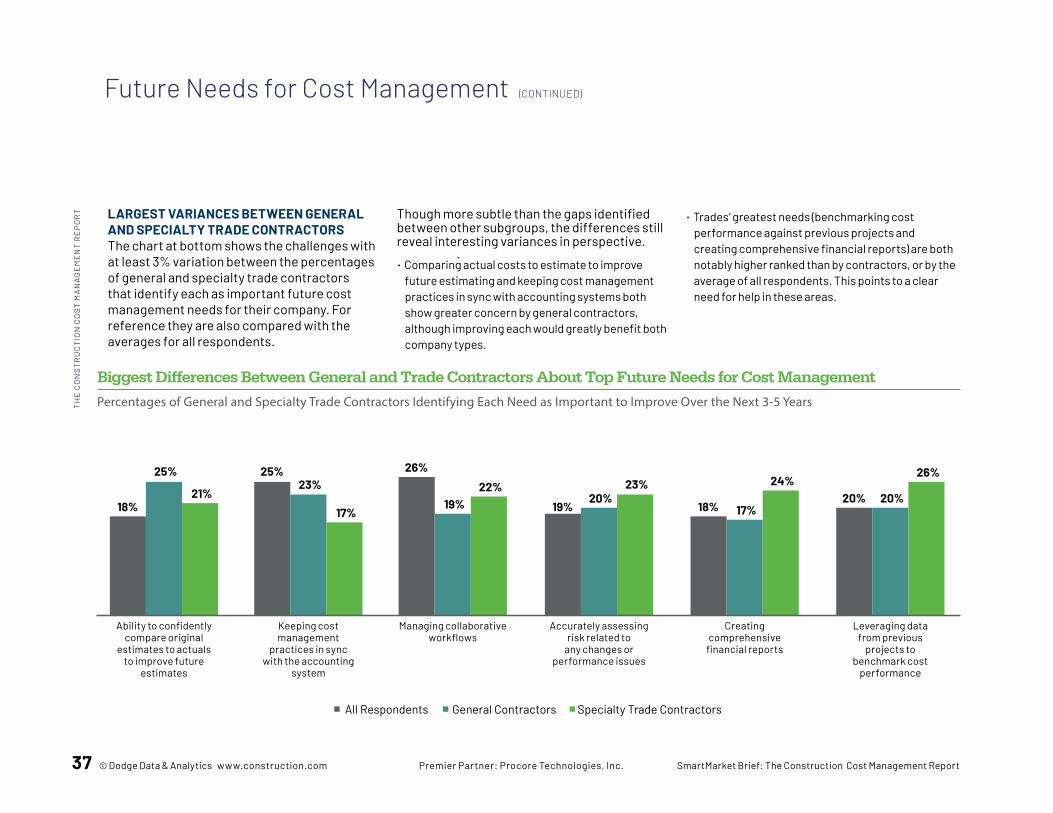
37 © Dodge Data & Analytics www.construction.com Premier Partner: Procore Technologies, Inc. SmartMarket Brief: The Construction Cost Management Report
Future Needs for Cost Management (CONTINUED)
Biggest Differences Between General and Trade Contractors About Top Future Needs for Cost Management
Percentages of General and Specialty Trade Contractors Identifying Each Need as Important to Improve Over the Next 3-5 Years
LARGEST VARIANCES BETWEEN GENERAL AND SPECIALTY TRADE CONTRACTORS The chart at bottom shows the challenges with at least 3% variation between the percentages of general and specialty trade contractors that identify each as important future cost management needs for their company. For reference they are also compared with the averages for all respondents.
Though more subtle than the gaps identified between other subgroups, the differences still reveal interesting variances in perspective.
• Comparing actual costs to estimate to improve future estimating and keeping cost management practices in sync with accounting systems both show greater concern by general contractors, although improving each would greatly benefit both company types.
• Trades’ greatest needs (benchmarking cost performance against previous projects and creating comprehensive financial reports) are both notably higher ranked than by contractors, or by the average of all respondents. This points to a clear need for help in these areas.
All Respondents General Contractors Specialty Trade Contractors
18%
Ability to confidently compare original
estimates to actuals to improve future
estimates
25%
21%
25%
Keeping cost management
practices in sync with the accounting
system
23%
17%
26%
Managing collaborative workflows
19%22%
19%
Accurately assessing risk related to
any changes or performance issues
20%23%
18%
Creating comprehensive
financial reports
17%
24%20%
Leveraging data from previous
projects to benchmark cost
performance
20%
26%
TH
E C
ON
ST
RU
CT
ION
CO
ST
MA
NA
GE
ME
NT
RE
PO
RT
© Dodge Data & Analytics www.construction.com Premier Partner: Procore Technologies, Inc. SmartMarket Brief: The Construction Cost Management Report 38
Key Trends From the Research
COST MANAGEMENT CAPABILITIESAll respondents believe they have good cost management capabilities for at least some of the eight studied (see page 2). The overall average claiming that level across all the individual challenges is 62%. But less than a quarter (23%) say they have good capabilities for at least seven out of the eight, so there is a lot of room for improvement globally.
On average, across all eight cost management capabilities:
• Owners are generally more confident in their capabilities than contractors.
• And among those groups, general contractors exceed specialty trades, and public owners exceed private ones.
• Regionally, the USA and UK have more respondents who believe they have good cost management capabilities than CAN or ANZ.
COST MANAGEMENT CHALLENGESRespondents identified as many as five of their most difficult cost management challenges from a list of 15 possible ones. The three reported most frequently among the most difficult are:
• Converting a final cost estimate into a project budget compatible with cost accounts
• Tracking costs for every aspect of the job to determine how they impact overall project cost
• Accurately estimating total cost to complete for activities in the work breakdown structure
Variations among subgroups include:
• Private owners generally express more difficulty with cost management than public entities.
• So do the respondents with departmental or organization-wide roles compared with those with field/project-related roles, which is a positive sign for shifting more cost management responsibility to the project staff.
• Assessing risk related to potential changes has the greatest difference between general (17%) and trade (27%) contractors, highlighting a potential opportunity to help advance this skill among specialty trades.
• Among regions, Canadian respondents express the most difficulty, varying by as much as 16% from the least troubled region.
COST MANAGEMENT SOLUTIONSNUMBER OF TOOLSRespondents identified how many technology tools they use for their most difficult cost management challenges. On average:• 21% use one tool exclusively• 44% use more than one tool, but with one as primary• 33% use two to five tools with none as primary• 5% use more than five tools with none as primary This usage pattern varies somewhat by subgroup, but there is a consistent pattern of preference for using a single or primary tool on the most difficult cost management challenges.
TYPE(S) OF TOOL(S)Respondents also identified what kinds of technology tools they use for their most difficult cost management challenges. The average responses are divided about equally between third-party tools and other types:
• Two types of third-party commercially available software products:
• 30% desktop (on-premise)• 18% cloud-based
• Other types of technology solutions, including:• 32% internally developed tools• 16% spreadsheets (e.g., Excel)• 4% mostly manual processes (e.g., email, server
files, etc.)
Although the usage pattern also varies by subgroup, some key trends emerge, such as:
• A strong preference for using third-party tools by the most capable cost managers.
• Above-average preference for third-party tools for these top challenges:
• Establishing a system of cost accounts• Understanding in real time where we are making or
losing money• Maintaining accurate, up-to-date cost information
between office and field Overall, technology users prefer fewer tools and also express a preference for third-party solutions for cost management activities.
TH
E C
ON
ST
RU
CT
ION
CO
ST
MA
NA
GE
ME
NT
RE
PO
RT

39 © Dodge Data & Analytics www.construction.com Premier Partner: Procore Technologies, Inc. SmartMarket Brief: The Construction Cost Management Report
Key Trends From The Research (CONTINUED)
SATISFACTION WITH COST MANAGEMENT SOLUTIONSAll respondents were asked to assess their satisfaction with the current tools they are using for their identified top challenges. Overall, about 42% of users express high or very high satisfaction with their current technology tools. The challenges that rated highest for current satisfaction are (in descending order of satisfaction):• Converting a final cost estimate into a project
budget compatible with cost accounts• Managing change orders and documentation
through the whole approval process• Assessing risk related to potential changes• Status reporting during the project• Accurately estimating total cost to complete for
activities in the work breakdown schedule The five where users are least satisfied with their current technology solutions are (in descending order of dissatisfaction):• Understanding in real time which areas of the project
need more attention.• Establishing a system of cost accounts• Understanding in real time where we are making or
losing money• Tracking units of work completed in the field• Managing multiple contracts VARIATIONS BY ORGANIZATION AND ROLENotable variations include: • In general, more private owners report high/very
high satisfaction with their current technology for
cost management challenges than public entities. • In contrast, the reported satisfaction levels of
general and trade contractors are closely aligned. • Respondents with project-focused roles tend to be
less challenged than their peers in departmental or organization-wide roles, reinforcing the trend toward shifting cost management responsibilities to the field.
SATISFACTION WITH THIRD-PARTY COST MANAGEMENT TOOLS COMPARED WITH OTHER TYPESIn general, both owners and contractors more frequently express high/very high satisfaction with using third-party cost management tools for their top challenges than with other types (e.g., internally developed, spreadsheets, email with attachments, etc.).
REGIONAL VARIATIONS• Users in Canada are the most satisfied with third-
party tools, while users in Australia/New Zealand are the least satisfied with the other types of tools.
• The greatest variation on a single challenge is among US users about converting a final cost estimate into a project budget compatible with cost accounts. 82% are satisfied with third-party tools and only 33% with other tools.
SATISFACTION WITH USING A PRIMARY TECHNOLOGY TOOL FOR COST MANAGEMENT COMPARED WITH MULTIPLE TOOLSSatisfaction varies according to the number of technology tools used. A pattern in the findings shows that more users express high/very high satisfaction when they are using either a single
tool exclusively or have a primary tool even if they are using multiple ones. • There is as much as a 40% difference between
percentages preferring either a single tool or at least a focus on a primary tool among several, compared with those using multiple tools.
• For 10 of the 15 challenges studied, more of those respondents prefer a single tool rather than even having a primary tool among several, suggesting a trend towards centralizing technology selection on fewer, more functional tools.
COST MANAGEMENT PROCESSES MEASURING COST MANAGEMENT SUCCESS Respondents were asked to select among 10 metrics to identify ones they frequently use to determine success in cost management. The top three are: • Turnaround time on processing change orders/
variations• Achieving expected profit margin• Final cost compared to budgeted cost Owners’ most frequent metrics are:
• Final cost compared to budgeted cost (30%), one of the top three overall.
• But the other top metric is generating useful data to benchmark for future projects (26%), which is only ninth most frequent overall, Indicating a much higher importance to owners.
Contractors most frequently report minimal unplanned changes as their top success metric.
TH
E C
ON
ST
RU
CT
ION
CO
ST
MA
NA
GE
ME
NT
RE
PO
RT
© Dodge Data & Analytics www.construction.com Premier Partner: Procore Technologies, Inc. SmartMarket Brief: The Construction Cost Management Report 40
Key Trends From The Research (CONTINUED)
TH
E C
ON
ST
RU
CT
ION
CO
ST
MA
NA
GE
ME
NT
RE
PO
RT SPENDING LEVELS ON COST MANAGEMENT
Owners and contractors are about evenly split between:
• 39% who believe they are spending more than they should have to
• 32% who think are spending the right amount• 29% who say they are spending less than they should
Several variations appear between subgroups.
• Owners are more likely to believe they are spending too much, especially public entities (55%).
• Conversely, contractors are least likely, especially trades (31%).
• Large organizations (over $500M annual project volume) are also much more likely to believe they are spending too much (47%) than their smaller peers (33%).
METHODS OF COLLABORATIONMost respondents are using some type of technology for collaboration, both internally and with other parties. They are divided between:
• 26%: Low-Level Technology (i.e., email and attachments)
• 38%: Medium-Level Technology (i.e., internally developed technology or an ftp server managed by a project team member)
• 36%: Advanced Technology (i.e., either generic or third-party cloud-based collaboration software)
There are only minor variations between any of the subgroups studied.
MOST IMPORTANT FUTURE NEEDS FOR IMPROVING COST MANAGEMENTFrom a list of 14 options, respondents selected the most important cost management improvements their organization needs to make over the next three to five years. The top five are (in descending order of selection frequency):
• Forecasting critical costs with real-time data from the field
• Dynamically tracking every dollar in my budget.• Managing collaborative workflows• Keeping cost management practices in sync with the
accounting system• Centralizing communication across office, field,
clients (contractors) and/or vendors The findings show significant diversity between the needs identified by owners and contractors. Within those two groups there is much closer alignment between general contractors and specialty trades, and between public and private owners. Future needs are also relatively closely aligned across the four regions studied.
TOP TAKEAWAYS FOR OWNERS AND CONTRACTORSCLOSER ALIGNMENT BETWEEN OWNERS AND CONTRACTORSThe variation identified above between the most important future needs of contractors and owners represents an opportunity to adopt a new perspective on cost management as an integrated project team-wide practice. For example:
• Improving cash flow is a top need for contractors. So, owners need to prioritize improving that, which will
importantly contribute to overall project health. • Conversely, owners are far more focused on
improving their ability to forecast critical costs with real-time data from the field. But this requires active cooperation from contractors, who need to appreciate and support its importance to their owners.
ENGAGING PROJECT-FOCUSED STAFF MORE ACTIVELY IN COST MANAGEMENTSupporting the theme of cost management as a team-wide practice, many of the findings in this report indicate that project-focused staff are ready and able to participate in a more holistic and integrated approach instead of the traditional office-based function with just discrete, periodic inputs from the field. For example, on average, project-based staff report:
• Higher levels of cost management capabilities• Lower levels of difficulty with their most challenging
cost management activities• Greater satisfaction using technology to address
them CONCLUSIONFocusing on using fewer, more comprehensive technology tools, engaging all key stakeholders in a shared approach to cost management and driving responsibility for it deeper into both owner and contractor organizations will generate better cost-related outcomes for all parties.
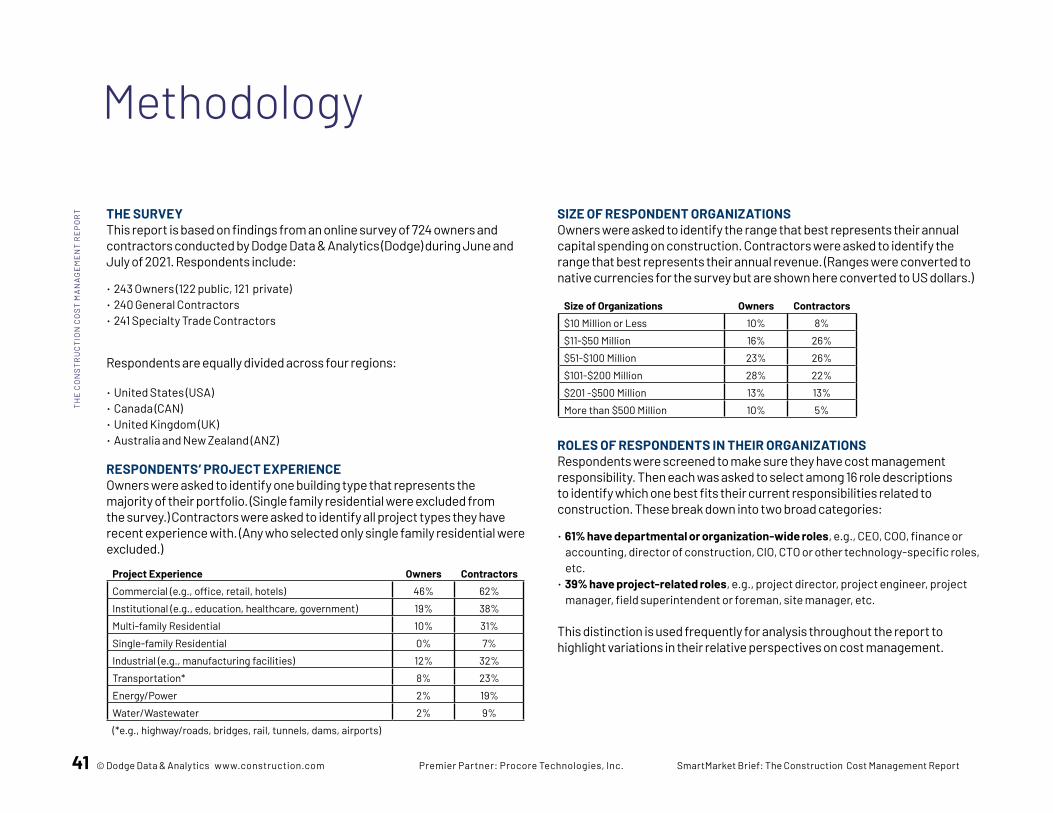
41 © Dodge Data & Analytics www.construction.com Premier Partner: Procore Technologies, Inc. SmartMarket Brief: The Construction Cost Management Report
THE SURVEYThis report is based on findings from an online survey of 724 owners and contractors conducted by Dodge Data & Analytics (Dodge) during June and July of 2021. Respondents include:
• 243 Owners (122 public, 121 private)• 240 General Contractors • 241 Specialty Trade Contractors
Respondents are equally divided across four regions:
• United States (USA)• Canada (CAN)• United Kingdom (UK)• Australia and New Zealand (ANZ)
RESPONDENTS’ PROJECT EXPERIENCEOwners were asked to identify one building type that represents the majority of their portfolio. (Single family residential were excluded from the survey.) Contractors were asked to identify all project types they have recent experience with. (Any who selected only single family residential were excluded.)
SIZE OF RESPONDENT ORGANIZATIONSOwners were asked to identify the range that best represents their annual capital spending on construction. Contractors were asked to identify the range that best represents their annual revenue. (Ranges were converted to native currencies for the survey but are shown here converted to US dollars.)
ROLES OF RESPONDENTS IN THEIR ORGANIZATIONSRespondents were screened to make sure they have cost management responsibility. Then each was asked to select among 16 role descriptions to identify which one best fits their current responsibilities related to construction. These break down into two broad categories:
• 61% have departmental or organization-wide roles, e.g., CEO, COO, finance or accounting, director of construction, CIO, CTO or other technology-specific roles, etc.
• 39% have project-related roles, e.g., project director, project engineer, project manager, field superintendent or foreman, site manager, etc.
This distinction is used frequently for analysis throughout the report to highlight variations in their relative perspectives on cost management.
Methodology
Size of Organizations Owners Contractors$10 Million or Less 10% 8%
$11-$50 Million 16% 26%
$51-$100 Million 23% 26%
$101-$200 Million 28% 22%
$201 -$500 Million 13% 13%
More than $500 Million 10% 5%
Project Experience Owners ContractorsCommercial (e.g., office, retail, hotels) 46% 62%
Institutional (e.g., education, healthcare, government) 19% 38%
Multi-family Residential 10% 31%
Single-family Residential 0% 7%
Industrial (e.g., manufacturing facilities) 12% 32%
Transportation* 8% 23%
Energy/Power 2% 19%
Water/Wastewater 2% 9%
(*e.g., highway/roads, bridges, rail, tunnels, dams, airports)
TH
E C
ON
ST
RU
CT
ION
CO
ST
MA
NA
GE
ME
NT
RE
PO
RT
© Dodge Data & Analytics www.construction.com Premier Partner: Procore Technologies, Inc. SmartMarket Brief: The Construction Cost Management Report 42
Procore is committed to advancing the construction industry by improving the lives of people working in construction, driving technology innovation, and building a global community of groundbreakers. Our connected global construction platform unites all stakeholders working on a project with unlimited access to support and a business model designed for the construction industry.
From preconstruction to closeout and beyond, Owners, GCs and Specialty Contractors have access to a unified and single source of data for accurate, real-time information across the entire project lifecycle. Our App Marketplace has over 300+ partner solutions that give our customers the freedom to customize with seamless integrations.
www.procore.com
DD&A EDITORIAL TEAMStephen A. Jones leads DD&A’s Industry Insights Research division and is the primary author of this report. He is active in numerous industry organizations and frequently speaks at industry events around the world. Before DD&A, Jones was a vice president with Primavera Systems (now part of Oracle). Prior to that, he was principal and a Board of Directors member with Burt Hill, a major A/E firm (now Stantec). He holds a BA from Johns Hopkins and an MBA from Wharton. [email protected]
Donna Laquidara-Carr currently provides editorial direction, analysis and content to DD&A’s SmartMarket Reports. Prior to this position, she worked for nearly 20 years with DD&A’s Dodge editorial team, where she gained detailed insight into the construction industry. She holds a Ph.D. from Tulane University, an MA from Boston University and a BA from Middlebury College. [email protected].
Stephen A. JonesSenior Director
Industry Insights
Dodge Data & Analytics: Main Website: construction.com Dodge Construction Central: construction.com/products Market & Competitive Intelligence: construction.com/products/construction-market-data Sweets: construction.com/products/sweets SmartMarket Reports: construction.com/toolkit/reports
ADDITIONAL RESOURCES
TH
E C
ON
ST
RU
CT
ION
CO
ST
MA
NA
GE
ME
NT
RE
PO
RT
Contacts & Resources
Donna Laquidara-CarrPh.D., LEED APResearch Director Industry Insights

■ Design and Construction Intelligence
SmartMarket Briefwww.construction.com
Dodge Data & Analytics SmartMarket Reports™
Get smart about the latest industry trends.
For more information on these reports and others, visit
www.construction.com/toolkit/reports


