20
Title 1 The Context April 16 th 2018

Title
1
The ContextApril 16th 2018

Title
2
The Context
Inside this week’s edition:
Know the Flows - by Cameron Brandt, p3
Trading Headlines, Adult Swim Versus Kiddie Pool - by David Ader, p4
Sanctions Are Clearly Disruptive, But There’s No Financial Crisis Ahead For Russia - by Robert Graystone, p5-6
Equity Markets Brace, Policymakers Look On - US Earnings Season Is Here– by Marcus Dewsnap, p7-8
The Gbp Week – Bias Is Bullish – by Tony Nyman, p9
End Of Cheap Money To Cost UK Banks Gbp 800mn – Moody’s- by Anil Mayre, p10-11
Published weekly
How Long Can the Cad Remain Q2's Best Performer?- by Tony Nyman, p12-13
Q1 APAC Usd Bond Issuance Curtailed By Volatility– by Haikal Razak, p14
Indonesia In Focus After Moody’s Upgrade- by Freda Yeo, p15-16
Asian Bond Funds Eying Further Inflows Post Boao –by Tim Cheung & Riki Zhang, p17
NZD/JPY – Advances From Strong Base Over 75.68/54 Lows– by Andy Dowdell, p18
UK 5Yr Breakeven – Awaits Completion Of A Key Higher Base Over 2.820 – by Ed Blake, p19
The second week of April saw risk appetite among mutual fundinvestors stage a modest recovery, buoyed by anticipation of bumperQ1 US earnings and cooling of the trade-related rhetoric.
It's a big UK week and we have to say this is a very bullish market.We get the first-tier triple salvo.
When I started out as a strategist over 30 years ago, I had thearrogance of youth, a long-term investing horizon and less wealth toworry about. Those elements worked well back then, not so much now.
These latest sanctions are considered by some to be the most severesince 2014, which were a major catalyst for Russia’s most recentfinancial crisis.
Given the recent volatility, 'precarious' level of the S&P500 just aboveits 200-dma, the soft, nay 'transitory', Q1 economic performance …there is possibly more attention than usual on this set of corporatenumbers.
The higher cost of BoE policy tightening will hit consumers’ pockets aswell as bank balance sheets. Timing remains uncertain as eyes turn tothe next rate hike and plans for alternatives to cheap money schemes.
This week, it's the BoC. Decision wise, we cannot see any surprises. As ever, tone will be key.
Despite headwinds from the US-China trade conflict, Fed tightening andexpensive valuations; sentiment towards Asia bonds remains supported.
APAC USD issuance for 1Q2018 saw an 11.31% y/y decline toUSD108.356bn despite strong issuance volumes in January.
The upgrade is bound to draw renewed attention to the market, the effect may be more muted than seen last year from the Fitch upgrade.
Further gains are anticipated, targeting 84.61. Below 77.18 threatens further congestion/drift lower.
Buy into near term corrective easing towards 2.953 as we await aneventual clearance of the 3.031/3.087 barrier targeting 3.148. Place astop under 2.871.

Title
3
Know the Flows
The Context
By Cameron Brandt, Director of Research
The second week of April saw risk appetite among mutual fundinvestors stage a modest recovery, buoyed by anticipation of a bumperfirst quarter earnings season for US companies and a cooling of thetrade-related rhetoric between the US and China. EPFR-tracked HighYield Bond Funds posted their first inflow since early January, investorscommitted over $2.5 billion to Emerging Markets Equity Funds andboth China and US Equity Funds posted solid inflows. The week ended,however, with markets caught in the downdrafts created by events inSyria, where accusations that Russian backed forces have deployedchemical weapons increased the odds of a direct military confrontationbetween Russia and NATO.
When former US President Barak Obama's "red line" on the issue ofchemical weapon deployment in Syria was being tested in 2013, itsimpact on fund flows was muted by his measured approach andsubsumed by the response - the so-called 'taper tantrum' - to theFederal Reserve's signals that the era of ultra-accommodativemonetary policy was coming to an end. "But, over the past four yearsor so, investors have become conditioned to viewing geopolitical eventsas buying opportunities," observed EPFR Research Director CameronBrandt. "Flows this week into the Russia Equity Funds we track climbedto a seven-week high with much of that money arriving at the end ofthe reporting period.“
Overall, EPFR-tracked Equity Funds absorbed a net $7.03 billion duringthe week ending April 11 while Bond Funds took in $8.8 billion, a 12-week high, and Money Market Funds posted consecutive weeklyinflows for the first time since early January as Japan Money MarketFunds snapped their 10-week redemption streak. Alternative Funds,meanwhile, recorded their second biggest weekly outflow year-to-date.
For further information on EPFR, please visit:https://financialintelligence.informa.com/products-and-services/data-analysis-and-tools/epfr
At the asset class and single country fund levels, Mortgage Backed BondFunds took in fresh money for the 14th straight week and InflationProtected Bond Funds for the 23rd time in the past 25 weekswhile Municipal Bond Funds posted consecutive weekly outflows foronly the fifth time since the beginning of 2017. South Africa EquityFunds saw their longest run of inflows since 4Q11 come to anend, South Africa Bond Funds had their best week on recordand Singapore Equity Funds tallied their biggest inflow in over sevenyears.
Back to Index Page

Title
4
Trading Headlines, Adult Swim Versus Kiddie Pool
The Context
By David Ader, Chief Macro Strategist
When I started out as a strategist more than 30 years ago, I had thearrogance of youth, a long-term investing horizon and less wealth toworry about. Those three elements worked well back then, but not somuch now.
I have the wealth alright to face a comfortable retirement…at themoment. What I don’t have is the time left to sleep easily at night inthe event the stock market enters a serious bear market. I’m not alone;the 55+ folks are a larger portion of the population than they’ve everbeen. We’re 35% of the country and growing. Compare that to 27.4%in 2000 and 31% in 2008 and keep those years in mind.
When you consider the recent gyrations in equities in the context of theaging population, logic follows that folks facing or in retirement will bemuch more defensive in their behavior now than in the past. And ifthat means they will be quicker to get out, and stay out of equities inthe next correction, their impact will be significant for a long while.
That's especially true given where wealth lies: older people have it butneither the time nor psyche to recover from a bear market no matterhow many times they hear their stockbroker utter encouraging wordssuch as, "despite short-term market gyrations, it's important tomaintain a long-term perspective, based on your goals and financialplan.”
My camp -- the baby boomer camp -- is unlikely to see a surge ininterest rates that will provide a comfortable return of, say, 5 percent to6 percent in long-term, safe munis. Total returns in the bond marketare going to be modest -- forever.
My generation has been here before in an economic sense. Approaching2000, we all knew the dot-come fueled Nasdaq Composite Index wasblowing up into a bubble, but greed and a belief that we were smarterthan everyone else kept us riding the momentum until we wished wehadn’t. But then we were, 40 or 45 years old, and arguably had 20 to 25working years left to make up for the momentary loss. Bothered, yes,but younger with time on our side.
All went well, especially the value of our homes. We didn’t worry aboutmeek wage gains because our wealth was growing. Plus, if we neededmoney we could just borrow it -- almost no questions asked. We mayhave looked askance at rising government deficits, but that would besomeone else’s problem down the road.
Then came 2008. We were a bit older and dealing with our second --and vastly more serious -- crisis in 10 years. That gets you thinking, andexplains why the baby boomers joined in late to this current bullmarket.
This is an excerpt from Ader’s Musings. For the full article, please click HERE.
Back to Index Page

Title
5
Sanctions Are Clearly Disruptive, But There’s No Financial Crisis Ahead For Russia
The Context
The past week has seen a sharp sell-off in Russian assets accompaniedby a spike in volatility on the back of fresh US sanctions against Russianindividuals and companies that were announced by the US TreasuryDepartment on April 6th.
These latest sanctions are considered by some to be the most severesince 2014, which were a major catalyst for Russia’s most recentfinancial crisis, and have clearly sparked significant price action.However, as mentioned earlier fund flow figures show no major loss ofconfidence, suggesting that the knee-jerk market reaction may besomewhat overblown.
The Russian sell-off
USD/RUB hit a 17-month high above 65.000 as at-the-money 1-monthoption volatility broke through 20.000 for the first time since mid-2016 -when Russia was in the midst of its 2014-17 financial crisis.
By Robert Graystone, Emerging Markets Analyst
The MICEX 10 erased its ca 10% YTD gains in just one day before staginga modest rebound towards the end of the week. That being said, EPFRdata shows positive flows into Russia-focused equity funds as foreign &institutional investors looked for an attractive level to buy Russianstocks (in USD terms, the index was briefly at its cheapest since mid-2016).
A look back at 2014-2017As noted above, some pundits/analysts are drawing parallels with thesevere sanctions which preceded the 2014-17 financial crisis and wereput in place by the US as a reaction to Russia’s military action in theUkraine.
This, combined with tumbling oil prices, saw the Russian 5yr creditdefault swap blow out to over 625bp in January 2015 from around200bp just 6 months earlier as the economy entered an economicrecession.
As EPFR flows data (below) shows, there was a significant loss ofconfidence in Russian equities and bonds in the run-up to the crisis, andthis has not been repeated at such a significant scale over the lastmonth.
Continued p6

Title
6
Sanctions Are Clearly Disruptive, But There’s No Financial Crisis Ahead For Russia … Cont’d
The Context
Back to Index Page
So, what has changed?
Firstly, the latest round of punitive measures on Russia by the US aresignificantly less severe than those implemented in 2014. Additionally,from a very broad perspective, domestic conditions are more favourable- Russia ranked 35th globally in the World Bank’s Ease of Doing Businessreport for 2018, a marked improvement from 64th back in 2014 at thestart of its financial crisis.
Additionally, the free-floating nature of the Rouble has taken the stingout of the recent sell-off for certain parts of the economy; combinedwith a broad oil rally, the currency’s depreciation has pushed front-month Brent denominated in Roubles to a record high aboveRUB4300/brl. This should impact positively on revenues for exporters &producers of oil as well as the government itself.
Overall, we would argue that the unique combination of factors (incl. oilcrash & sanctions) which preceded Russia’s 2014-17 financial crisis are,for the most part, no longer present. As such, we will be keeping an eyeon fund flows for an indication of any major changes in investorconfidence, but would otherwise look to fade the sharp sell-off inRussian assets over the medium-term.
Risks of further deterioration
Of course, no outlook is without its risks, and there are several factorswhich could potentially weigh on the outlook for Russian assets.
The most obvious would be an expansion of sanctions to cover the OFZmarket, but this has been on investors’ radar since the middle of 2017,and largely dismissed as an unlikely escalation of tensions. Additionally,“worldwide malign activity” leaves the US Treasury Department withvery broad scope, so it is difficult to examine whether or not sanctionswill be expanded but 2016 election meddling may prove to be onepossible reason.
It is also worth noting that Russia’s 2014-17 financial crisis wascharacterised by significant intervention on the part of both thegovernment and the central bank; the latter raised their key rate to ashigh as 17% in an effort to prop up the Rouble. In comments this week,CBR Dep Gov Shvetsov refused to rule out resuming FX repo operationsthat were implemented during the crisis, but the Finance Ministryreiterated that has no intention of scaling back FX purchases. Overall,this represents a risk as any unforeseen intervention on worseningsanctions is likely to have a significant, unpredictable impact.

Title
7
Equity Markets Brace, Policymakers Look On - US Earnings Season Is Here
The Context
By Marcus Dewsnap, Senior Editor/Analyst
US Q1 earnings season is here. Given the recent volatility, 'precarious'level of the S&P500 just above its 200-dma (a break seen by some as thebeginning of an equity market capitulation), the soft, nay 'transitory'(according to the Fed), Q1 economic performance … there is possiblymore attention than usual on this set of corporate numbers.
Earnings have a lot to live up to after the tax reform. As the next graphshows, and this is unusual in itself, EPS forecasts have been revisedsignificantly higher over the course of this year.
There is a discomforting element in that sales and operating earningsestimates are lagging far behind EPS forecast. If all hit projections, thissuggests better headline outturns come with relative declining earnings
quality … not typically a positive sign.Continued p8
Title
8
Equity Markets Brace, Policymakers Look On - US Earnings Season Is Here … Cont’d
The Context
Back to Index Page
And it's not as though companies have been charging consumerssignificantly more. Then again, corporates tend to trade more with eachother than consumers and PPI has accelerated to a 6-year high 3% y/y(see graph above).
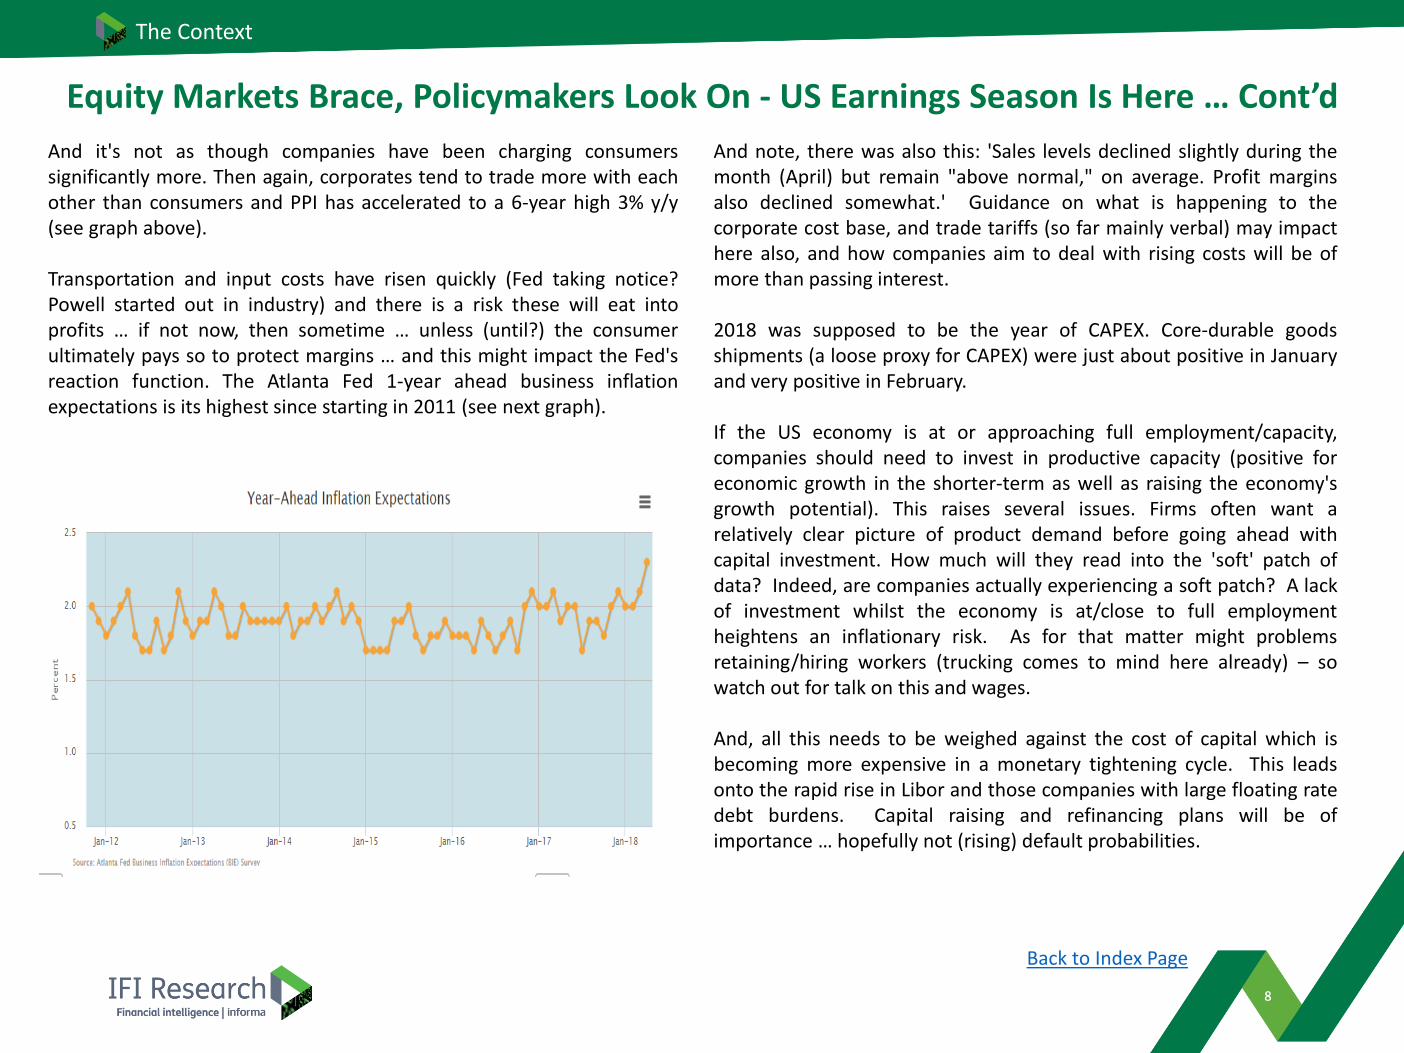
Transportation and input costs have risen quickly (Fed taking notice?Powell started out in industry) and there is a risk these will eat intoprofits … if not now, then sometime … unless (until?) the consumerultimately pays so to protect margins … and this might impact the Fed'sreaction function. The Atlanta Fed 1-year ahead business inflationexpectations is its highest since starting in 2011 (see next graph).
And note, there was also this: 'Sales levels declined slightly during themonth (April) but remain "above normal," on average. Profit marginsalso declined somewhat.' Guidance on what is happening to thecorporate cost base, and trade tariffs (so far mainly verbal) may impacthere also, and how companies aim to deal with rising costs will be ofmore than passing interest.
2018 was supposed to be the year of CAPEX. Core-durable goodsshipments (a loose proxy for CAPEX) were just about positive in Januaryand very positive in February.
If the US economy is at or approaching full employment/capacity,companies should need to invest in productive capacity (positive foreconomic growth in the shorter-term as well as raising the economy'sgrowth potential). This raises several issues. Firms often want arelatively clear picture of product demand before going ahead withcapital investment. How much will they read into the 'soft' patch ofdata? Indeed, are companies actually experiencing a soft patch? A lackof investment whilst the economy is at/close to full employmentheightens an inflationary risk. As for that matter might problemsretaining/hiring workers (trucking comes to mind here already) – sowatch out for talk on this and wages.
And, all this needs to be weighed against the cost of capital which isbecoming more expensive in a monetary tightening cycle. This leadsonto the rapid rise in Libor and those companies with large floating ratedebt burdens. Capital raising and refinancing plans will be ofimportance … hopefully not (rising) default probabilities.
Title
9
The Context
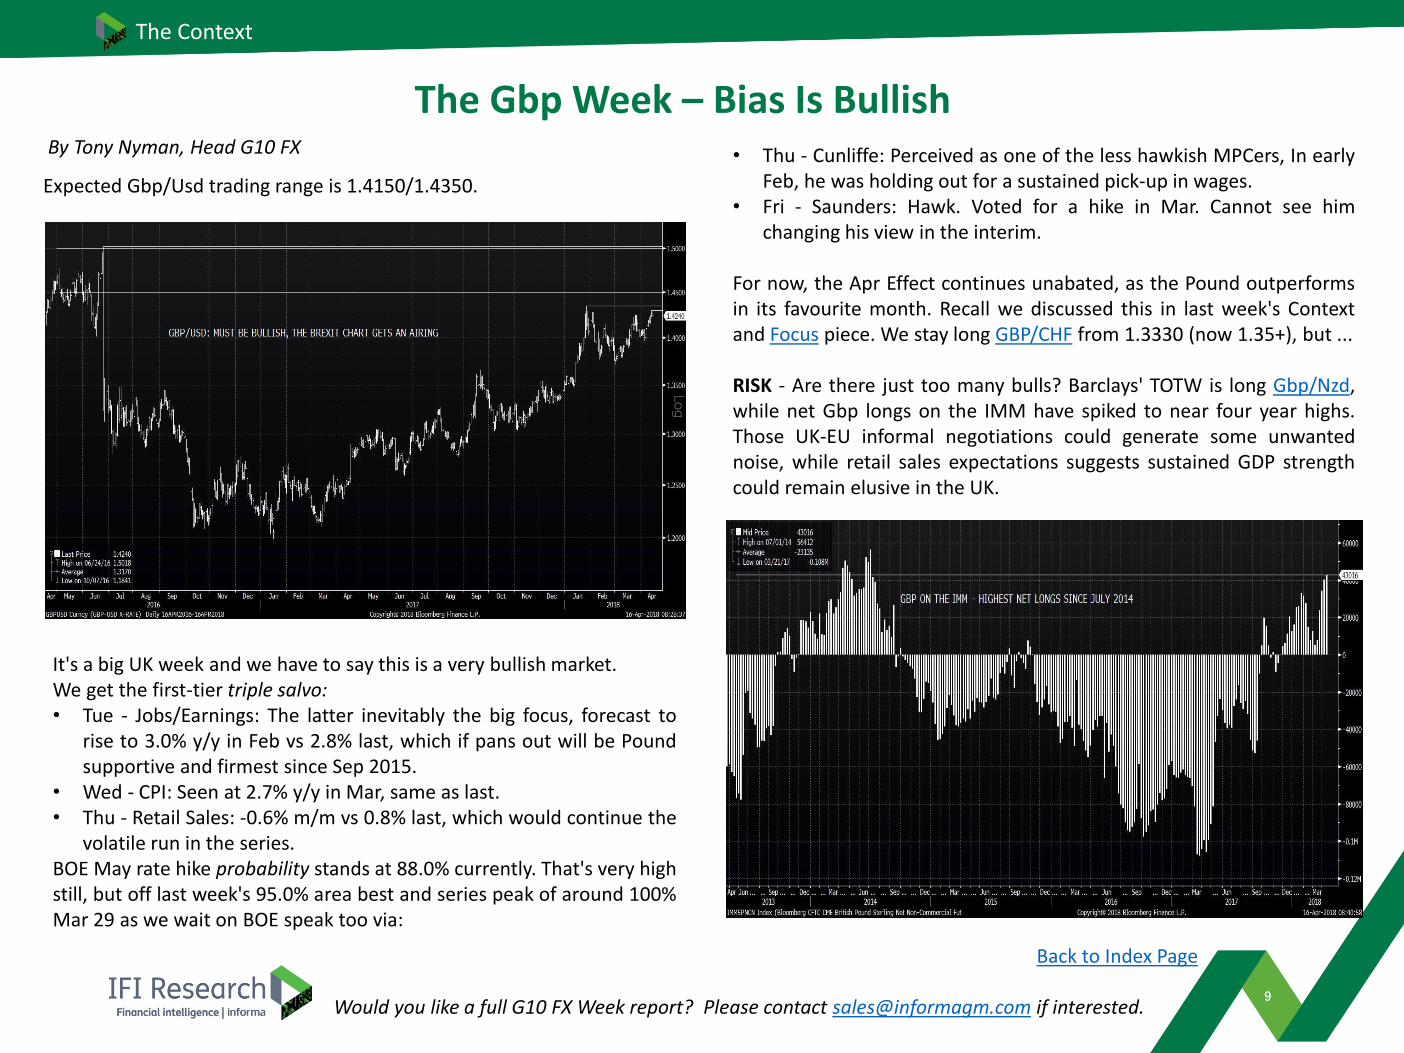
Expected Gbp/Usd trading range is 1.4150/1.4350.
The Gbp Week – Bias Is Bullish
Back to Index Page
By Tony Nyman, Head G10 FX
It's a big UK week and we have to say this is a very bullish market.We get the first-tier triple salvo:• Tue - Jobs/Earnings: The latter inevitably the big focus, forecast to
rise to 3.0% y/y in Feb vs 2.8% last, which if pans out will be Poundsupportive and firmest since Sep 2015.
• Wed - CPI: Seen at 2.7% y/y in Mar, same as last.• Thu - Retail Sales: -0.6% m/m vs 0.8% last, which would continue the
volatile run in the series.BOE May rate hike probability stands at 88.0% currently. That's very highstill, but off last week's 95.0% area best and series peak of around 100%Mar 29 as we wait on BOE speak too via:
• Thu - Cunliffe: Perceived as one of the less hawkish MPCers, In earlyFeb, he was holding out for a sustained pick-up in wages.
• Fri - Saunders: Hawk. Voted for a hike in Mar. Cannot see himchanging his view in the interim.
For now, the Apr Effect continues unabated, as the Pound outperformsin its favourite month. Recall we discussed this in last week's Contextand Focus piece. We stay long GBP/CHF from 1.3330 (now 1.35+), but ...
RISK - Are there just too many bulls? Barclays' TOTW is long Gbp/Nzd,while net Gbp longs on the IMM have spiked to near four year highs.Those UK-EU informal negotiations could generate some unwantednoise, while retail sales expectations suggests sustained GDP strengthcould remain elusive in the UK.
Would you like a full G10 FX Week report? Please contact [email protected] if interested.

Title
10
The Context
End Of Cheap Money To Cost UK Banks Gbp 800mn – Moody’s
The higher cost of the Bank of England policy tightening will hitconsumers’ pockets as well as bank balance sheets, but timing remainsuncertain as the eyes turn to the next rate hike and plans are laid out foralternatives to cheap money schemes.
The FLS and TFS closed to new drawdowns in January and February
respectively. The former launched in 2012, and was subsequently
changed to focus on SME lending away from the residential sector and
had GBP31bn of drawings, and the latter participants grabbed
GBP127bn from the TFS in 17 months.
The decision now facing banks is how to replace that. But given the
cheapness of TFS, charged at just 50bp, plus a scheme fee, whichever
option they chose will be costlier. The average cost of term deposits is
97bp, according to Moody’s, and bond issuance will be pricier too.
As a result, the agency estimates a hike in UK banks’ interest bill of
around GBP800m. The impact will be moderate, but still shaves 3bp off
net interest margins.
One interesting statistic from Moody’s is an estimate that TFS provided
funds equivalent to 98% of total lending for banks that had previously
securitised. And the smaller firms were proportionally higher users of
the scheme.
Overall, the agency estimates that retail deposits will replace around
60% of maturing TFS and FLS loans, with the remainder coming from
RMBS and covered bonds.
This could add GBP10bn of RMBS issuance in the next two or three
years versus 2016-2017, which would be welcome supply for a sector
that saw volumes plummet from 2012 following the launch of FLS.
Continued p11
The BoE had announced the Term Funding Scheme (TFS), from whichbanks could borrow at much cheaper levels than through traditionalmarket funding, alongside the 25bp rate cut that followed the EUreferendum in 2016. And this came four years after the Funding forLending Scheme (FLS).
The rationale for the TFS was that with rates already so low banks couldnot feasibly cut savings rates any lower that could allow them to easelending rates, and in turn reinforce the transmission of the rate cut tothe real economy.
That 25bp cut has since been reversed, and while recent data releasessuggested that the May MPC meeting could mark the start of the gradualtightening procession, the clouds of doubt appear a little denser due toweak housing demand.
The Royal Institute of Chartered Surveyors said new home buyerenquiries fell for a 12th straight month. And the RICS chief economistSimon Rubinsohn said it could make the “Bank of England deliberationsaround a May hike in interest rates, which is pretty much odds-on at themoment, a little more finely balanced than would otherwise be thecase.”
How soon the BoE moves remains to be seen, but one thing is certainand that is the current phase of cheap money is over.
By Anil Mayre, Senior Credit Analyst
Despite the BoE’s good intentions in launching the FLS and TFS, Moody’ssees them as moderately credit negative – because the loans will haveto be replaced by more expensive funding.

Title
11
The Context
End Of Cheap Money To Cost UK Banks Gbp 800mn – Moody’s … Cont’d
The downside for the RMBS market of both FLS and TFS was reduced
supply. But the tipping of the supply/demand imbalance in favour of the
sellers led to tighter spreads as investors chased fewer bonds. When
considering redemptions, supply was net negative.
General market tightening notwithstanding, the compression in UK RMBS
spreads is significant. For example, Nationwide Building Society sold 5-
year GBP bonds at 3mL+160bp in 2012 before the launch of FLS. And in
February 2018 sold 5-year notes 123bp tighter at 37bp. Clydesdale Bank
cut a similar margin of its bonds between 2012 and now – slicing 121bp
to price at 42bp from 163bp almost six years ago.
The tightening has led to several smaller, or challenger banks, launching
securitisations too, but these smaller firms have also been proportionally
the heavier users of TFS too and are therefore facing the biggest hit in net
interest margin compressions (see graph – source Moody’s).
And already some have returned to RMBS. West Bromwich Building
Society priced its first deal for five years, OneSavings Bank said it will re-
enter the RMBS market and on April 9 2018 Paragon announced its first
buy-to-let deal since November 2015 having relied on TFS and retail
deposits in the interim period
Some GBP158bn had been drawn from the FLS and TFS ahead of their
closing, but there is a month gap between the schemes ending so it’s
entirely possible that participants could have drawn TFS funds to repay
FLS at the end of January.
If this is the case it would exaggerate the estimated impact, Moody’s
says. The agency already expects a fall of about 4% in pre-provision
income, but being spread over four years means it will be felt gradually.
And of course, banks could hike their own lending rates to recoup some
of the higher interest charges they will incur, making borrowing costlier
for consumers.
Please see previous IGM comment on UK RMBS supply
“Preparing For Life After TFS: UK RMBS Issuers Boost Volumes”
https://www.informagm.com/stories/1360310
Back to Index Page

Title
12
The Context
How Long Can the Cad Remain Q2's Best Performer?
By Tony Nyman, Head G10 FX & Andy Dowdell, Technical Analyst
The CAD the best performing G10 so far in April (upper graph).
Worth remembering though, the Loonie is only in comebackmode, as following a less than hawkish BOC hike in Jan it wasactually the worst performer in Q1 (lower graph).
Despite a rate hike in January, the Loonie was a broad loser on:
• Trump and NAFTA worries.
• The widening in Usd LIBOR/OIS and higher funding costs..
• Underwhelming local data.
Some of these concerns have eased and MS have turnednoticeably bullish on the Cad and suggest the recent BOCBusiness Outlook Survey (investment trends remained strong,inflationary pressures continue to build) highlighted Canadiangrowth and inflation data tracking broadly in line with the CB'soutlook, which could (even) form a case for a rate hike at theApril meeting.
Continued p13

Title
13
The Context
How Long Can the Cad Remain Q2's Best Performer? … Cont’d
Back to Index Page
Sharp reversal from the Mar 1.3125 high retraced just over 61.8% of therally from 1.2251 (31 Jan) before stabilising off 1.2545 (11 Apr).
Short-term oversold readings may trigger a correction, but the widerstructure remains heavy, with fresh sellers expected ahead of 1.2819.
Below 1.2545 resumes course lower for 1.2457/51 next, and potentially, areturn to 1.2251 in due course.
USD/CAD is back below the 200-dma (1.2625/30) for the first timesince mid-Jun and 1.2500 and below looks under threat.
We suspect 1.2500 could go and we suggest keeping an eye onthe funders. If the Chf and Yen continue to eke out further losses theCad will benefit. If there's a safe haven grab, on the other hand, asglobal tensions escalate then, the Loonie could well have seen its bestlevels near-term.
This week, it's the BoC. Three of 19 respondents to a Bbg poll see a0.25% rate hike to 1.5% Wednesday. Decision wise, we cannot see anysurprises. As ever, tone will be key. Can Poloz and co sound a littlemore hawkish in this climate? We think there are just too manyexternal uncertainties for the BoC to indicate another move isimminent. We expect Q2 to be defined by a wait-and-see approachand for the BoC to think again in H2.

Title
14
The Context
Q1 APAC Usd Bond Issuance Curtailed By VolatilityBy, Haikal Razak, Market Analyst
• APAC USD issuance for 1Q2018 saw an 11.31% y/y decline toUSD108.356bn despite strong issuance volumes in January. Chineseissuers unsurprisingly produced the bulk of issuance with 45.31%.Japanese names were a distant second with 16.15% while Australiatook third spot with 11.21%.
• Valuations of notable APAC USD bond issuance over Q1 also sawgeneral underperformance across the board, reflecting the broadrisk-off sentiment perpetuated by tariff proposals brought about byboth sides amidst the US China trade war rhetoric. The recent sell-off in equities led by the tech sector did not help matters.
• Widening credit spreads/increasing yields generally affected bondsfrom all countries and sectors, with underperformance by corporateIG Senior and HY new issues led by Chinese issuers of which namelythe 37 Chinese high yield bonds sold in 1Q2018 saw yields rise amedian of 44.20bp. Financials also underperformed led byJapanese, Chinese and Australian names alongside Indian,Indonesian and Filipino SSAs as well as Chinese SOEs.
• We expect volatility and general risk aversion to continue into2Q2018 with rhetoric surrounding escalating trade tensionsbetween the US and a handful of its trade partners, China inparticular, to keep participants on their toes.
• The situation looks notably more challenging for higher beta names,especially those that are deemed to be of junk status amid a risk-offenvironment which has seen investors become increasinglyselective.
• What is clear for all asset classes though, is that any issuer that mayhave a pressing need for funding will likely have to offer sufficientlyeye-catching new issue concessions to offset any potentialexecution risk should their strategy be to hit the market soonerrather than later.
The following charts show the breakdown of 1Q2018 APAC USDissuance by country and format (weekly). Source: IGM
Back to Index Page

Title
15
The Context
Indonesia In Focus After Moody’s Upgrade
By Freda Yeo, Emerging Market Analyst
Moody's upgraded Indonesia's sovereign rating to Baa2 (Stable) on April13th, which is the next step up from lowest investment grade, andmatches Fitch's upgrade from December 2017.
• The country has been under 'positive' watch previously.
• The upgrade brings the country in line with other countries in theregion like Philippines and India.
There were kudos all around for the BI as well as the currentadministration:
• Moody's comments that the BI "has established a track record ofprioritizing macroeconomic stability over promoting short-termgrowth. Inflation targets have been met for the past threeconsecutive years and inflation expectations have proved to beanchored at moderate levels”.
• The government's "strict adherence to the 3.0% budget deficit cap"is seen to "keep the debt burden low and, combined with a longtenor of funding Moody's expects the focus on fiscal prudence toremain in place and contribute to macroeconomic stability.”
The risks highlighted include "downside risks from political challenges tothe implementation of further broad economic, fiscal and regulatoryreforms" as further delays or reversals beyond what is expected couldhappen ahead of elections among other issues.
Immediate Caveats:• The economy has had a bad run of late, caught amidst worry of fall-
out from trade tensions between China and US, and with China'sfocus on reform, OBR, and trimming of excess capacity.
• The trade balance has seen 3 back-to-back deficits and couldcontinue.
• Equity outflow has been constant while bond flow has also turnedoutward strongly for a time.
• In addition, the outcome of upcoming local elections at the end ofJune and the general elections next year is increasingly at risk dueto growing religious and ethnic divide and extremism, as well asfactionalisation within the ruling party itself.
• Fed tightening will limit policy room for the central bank even ifinflation remains muted.
• A continuation of the fuel subsidy is expected to reduce fundsavailable for the administration's infrastructure push, especially asoil prices continue to firm.
• S&P which just raised its ratings by a notch to the lowestinvestment grade, may not follow suit immediately due to whatthey see as a step back in reform in fuel subsidy reversion.
The bottom line: The upgrade is bound to draw renewed attention tothe market in any case, though the effect may be more muted than theone seen late last year from Fitch.
Continued p16

Title
16
The Context
Indonesia In Focus After Moody’s Upgrade … Cont’dUSD/IDR: The pair only started reacting to Fitch's upgrade onDecember 21st 2017 over a week later, possibly due to the holidays,with the IDR eventually gaining by 2%. This could be the case again, asinvestors are likely to be cautious in the current environment.
EPFR APAC Regional Bond Fund Allocation
CREDIT: Indonesian sovereign and state papers are expected to remaina favored credit amongst EM funds, especially as a means ofdiversification in the Emerging Asian space versus China.
Back to Index Page

Title
17
The Context
Asian Bond Funds Eying Further Inflows Post BoaoBy Tim Cheung Head of China & Riki Zhang EM Analyst
EM Asian bond funds per EPFR enjoyed inflows for the second straightweek in the 7-days to April 11, of USD 385m. Further details showedthat the net inflows were driven by mixed EM Asia ex-Japan bond fundsand to a lesser extend, sovereign EM Asia bond funds. In contrastCorporate Asia ex-Japan bond funds experienced net outflows for thesixth consecutive week.
Chart 1 shows that JACI (aggregate), which is a widely recognized/usedEM Asia bond index, continued to rebound on the back of a flowimprovement.
Focus of the week was on the speech delivered by China's president Xiand PBoC's Governor Yi at the Boao Forum on their commitment tofurther opening up the Chinese markets.
Immediately after Yi delivered his speech, China's State Administrationof Foreign Exchange (SAFE) announced that the government willsteadily promote the implementation of the Qualified DomesticInstitutional Investor (QDII) Scheme in order to further open upfinancial markets, to diversify investment channels for Chinese residentsand to support financial institutions to expand their overseasoperations. SAFE's statement increases the potential for an imminentresumption of QDII quota granting.
According to various news reports, the Chinese regulator is mulling anew quota mechanism, in which the qualified domestic institutionalinvestors potentially are allowed to invest offshore no more than 8% oftheir AUM other than that in money market funds. As of the end ofMarch, the size of the mutual funds ex-money market funds in Chinawas Usd667bn. Based on the number of 8%, the new quota can be upto Usd40bn in size on top of the existing Usd13bn.
With the Stock Connect system already existing, domestic investorsnowadays no longer need QDII quota for investing in offshore listedequities. As such, we believe any increase in QDII quota will be largelyinvested in offshore bonds. A new quota of Usd40bn currentlyrepresents 30% of the net bond supply out of Asia in 2017.
Despite headwinds from the US-China trade conflict, Fed tightening andexpensive valuations; sentiment towards Asia bonds remainssupported. In our view, a resumption of QDII quota granting will createan additional buying force, which would act as a buffer against themarket shocks arising from the above-said negatives.
Back to Index Page

Title
18
The Context
NZD/JPY – Advances From Strong Base Over 75.68/54 LowsTechnical Analysis by Andy Dowdell
Back to Index Page
• The market has been locked within a broadsideways range since late 2016.
• Current rally off the Mar 75.54 low (near theApr 2017 low at 75.68) has left a strong multi-year base in place.
• Weekly Stochastics have crossed higher fromoversold levels.
• Focus is now turning to the Jan 81.57 high,above which will re-open the 2017 (27 Jul)peak at 83.91.
• Just beyond there lies the 61.8% retrace of the2015-2016 fall at 84.61 (not shown).
• Bears need to breach support at 77.18 to stallthe advance, risking back to 75.54, possibly72.66/22
IFI Research’s global team of Technical Analysts constantly look for interesting patterns in prevailing price action of a broad range of currency pairs,
fixed income and commodity products. We will highlight the most compelling on these pages. For information on the full spectrum covered, please
contact your Account Manager.
STRATEGY SUMMARY
Further gains are anticipated, targeting 84.61.Below 77.18 threatens further congestion/driftlower.
Resistance Levels
R5 84.61 61.8% of the 2015-2016 (94.05-69.33) fall (not shown) R4 83.91 27 July 2018 high R3 82.76 21 September 2017 high R2 81.57 23 January 2018 high R1 80.59 7 February 2018 high
Support Levels
S1 77.18 28 March 2018 high S2 75.54 23 March 2018 low, near the 12 April 2017 low at 75.68 S3 73.70 9 November 2016 low S4 72.66 26 September 2016 low, near the 3 August 2016 low at 72.22 S5 69.33 24 June 2016 low

Title
19
The Context
UK 5Yr Breakeven – Awaits Completion Of A Key Higher Base Over 2.820
Technical Analysis by Ed Blake
Back to Index Page
• Built within the near 12-month 2.820-3.087consolidation to test a 10½ month fallingtrendline at 3.031.
• Bullish studies suggest an eventual clearance of3.031 and the 12-month range cap at 3.087.
• A sustained break of 3.087 would confirm amajor higher base over 2.820 and expose3.148, perhaps 3.224.
• Only a sustained failure to clear the3.031/3.087 barrier would avert and signalextended consolidation
IFI Research’s global team of Technical Analysts constantly look for interesting patterns in prevailing price action of a broad range of currency pairs,
fixed income and commodity products. We will highlight the most compelling on these pages. For information on the full spectrum covered, please
contact your Account Manager.
STRATEGY SUMMARY
Buy into near term corrective easing towards2.953 as we await an eventual clearance of the3.031/3.087 barrier targeting 3.148. Place a stopunder 2.871.
Resistance Levels
R5 3.349 2017 peak – 13 April, near the implied target from the potential 2.820-3.087 base at 3.353 R4 3.224 76.4% retrace of 3.349/2.820 fall R3 3.148 24 April 2017 high, near 61.8% retrace of 3.349/2.820 fall (3.147) R2 3.087 25 May 2017 high, near 50% of 3.349/2.820 fall (3.084) &15 September 2017 high (3.065) R1 3.031 2018 high – 5 April, nr a 10½mth falling trendline and just over 38.2% of 3.349/2.820 fall
Support Levels
S1 2.953 26 March 2018 minor higher low S2 2.871 20 March 2018 low S3 2.820 2017 low – 15 December, near 2018 low – 2 March (2.831) S4 2.776 1 September 2016 former high S5 2.659 30 September 2016 low

Title
London+44 20 7017 5402
New York+1 212 907 5802
Tokyo+81 3 6273 4273
Hong Kong+852 2234 2000
Singapore+65 6411 7788
Shanghai+8621 2326 3766
Informa Financial Intelligence (IFI), a unit of Informa plc (LSE: INF), provides fund flows, asset allocation, FX, credit issuance and banking data, quantitative products, research and analysis to financial institutions – both public and private -- around the world. Our market moving data services include daily, weekly, and monthly equity and fixed income fund flows and monthly fund allocations by country, sector and industry.
IFI encompasses products providing data, analysis and solutions to the mutual fund, banking, wealth management, investment advisory and public sectors: EPFR Global, Informa Global Markets (IGM), Informa Investment Solutions (IIS), iMoneyNet, TrimTabs, WealthManagement.com, PlacementTracker, Informa Research Services, eBenchmarkers, Mapa Research and BankTrends.
To find out more, please visit: https://financialintelligence.informa.com
To contact us, please email: [email protected]
This material is provided by Financial Intelligence for the use of the recipient only and is not to be copied or distributed to any other person. No representation, warranty or undertaking (express or implied) is given and no responsibility is accepted by Financial Intelligence or any of its affiliates or by any of their respective partners, officers, employees, advisers or agents for the completeness or accuracy of any information contained in, or of any omissions from, this material or any supplementary information and any liability in respect of such information or omissions is hereby expressly disclaimed. This material is not a comprehensive evaluation of the industry, the companies or the securities mentioned, and does not constitute an offer or a solicitation of an offer or a recommendation to buy or sell securities. All expressions of opinion are subject to change without notice.
© Informa Business Intelligence, Inc (2018). All rights reserved.
IFI: who we are and how to contact us
New York+1 212 907 5802
London+44 20 7017 5402
Tokyo+81 3 6273 4273
Hong Kong+852 2234 2000
Singapore+65 6411 7788
Shanghai+8621 2326 3766


