Page 1
PROBLEMY EKOROZWOJU – PROBLEMS OF SUSTAINABLE DEVELOPMENT
2021, 16(1), 219-229
DOI: 10.35784/pe.2021.1.24
The Contributions of Demographic Factors to Economic Growth
Wpływ czynników demograficznych
na rozwój ekonomiczny
Mykola Pasichnyi*, Anton Nepytaliuk**
*Faculty of Finance and Accounting, Department of Finance,
Kyiv National University of Trade and Economics, Ukraine
E-mail: [email protected] , ORCID: 0000-0001-7663-776X
**Faculty of Economics, Department of Management and Behavioral Economics,
Vasyl’ Stus Donetsk National University, Ukraine,
E-mail: [email protected] , ORCID: 0000-0002-7890-3889
Abstract In this paper, an updated approach to evaluate the contribution of demographic factors to economic development
is proposed. The forecasted shifts in public production were considered with respect to the institutional framework.
The relationship between the main demographic variables and the economic growth for the sample of 45 advanced
and emerging market economies from 1990 to 2018 was examined, applying the unbalanced panel data method.
Over the period, in the sample, an essential increase in life expectancy adversely affected the real GDP per capita
growth rate. The empirical investigation pointed out that the above demographic variable was strongly linked to
nominal GDP per capita. In advanced economies, the examined demographic indicator was considerably higher
than in emerging ones. We found out that an increase in the working-aged stratum substantially reduced the real
GDP dynamics, but that interconnection was not robust. In the long-run, the institutional framework should be
taken into account to achieve favorable public performance. Demographic variables should be forecasted and cal-
ibrated, regarding the endogenous economic triggers. Both public and private investments matter.
Key words: demographic dividend, population, human capital, demographic sustainability, economic growth
Streszczenie
W artykule zaproponowano zaktualizowane podejście do oceny wkładu czynników demograficznych w rozwój
gospodarczy. Prognozowane zmiany w produkcji publicznej rozpatrzono w kontekście ram instytucjonalnych.
Zbadano zależność między głównymi zmiennymi demograficznymi a wzrostem gospodarczym dla próby 45 roz-
winiętych i wschodzących gospodarek rynkowych w latach 1990-2018, stosując metodę niezrównoważonych da-
nych panelowych. W badanym okresie istotny wzrost średniej długości życia niekorzystnie wpłynął na dynamikę
realnego PKB na mieszkańca. Badanie empiryczne wykazało, że powyższa zmienna demograficzna była silnie
powiązana z nominalnym PKB na mieszkańca. W gospodarkach rozwiniętych badany wskaźnik demograficzny
był znacznie wyższy niż w gospodarkach wschodzących. Okazało się, że wzrost liczby osób w wieku produkcyj-
nym znacznie zmniejszył dynamikę realnego PKB, ale połączenie to nie było silne. W perspektywie długotermi-
nowej należy wziąć pod uwagę ramy instytucjonalne, aby osiągnąć korzystne wyniki publiczne. Należy progno-
zować i kalibrować zmienne demograficzne z uwzględnieniem endogenicznych czynników ekonomicznych. Liczą
się zarówno inwestycje publiczne, jak i prywatne.
Słowa kluczowe: populacja, kapitał ludzki, zrównoważoność demograficzna, rozwój ekonomiczny
Page 2
Pasichnyi et al./Problemy Ekorozwoju/Problems of Sustainable Development 1/2021, 219-229
220
Introduction
There are reasons to investigate the population’s im-
pact on economic development – with its inherent
social and demographic characteristics – regarding
the growth theories. Firstly, the actual level of public
welfare is described only through human conscious-
ness. Secondly, a particular person with its desires
and needs forms the tasks for public production. So,
the population plays the roles of the aggregated pro-
ducer and consumer of goods and services simulta-
neously. The agent’s economic behavior causes and,
at the same time, is caused by the upper interests,
which are represented by the social groups (e. g., na-
tions, economic classes, strata). The crucial changes
in the population’s number, density, and age struc-
ture affect public production. Passed through the
centuries of slow and uneven growth, the world pop-
ulation reached 1.0 billion nearly two hundred years
ago. Before the first so-called demographic transi-
tion, expected human life was critically short, both
births and deaths were countless, while the popula-
tion was generally young. After the transition men-
tioned above, mortality and eventually fertility se-
verely declined; the population growth rates acceler-
ated and then – considerably unequal for advanced
and emerging countries – lowed again, matching low
fertility, extended life span, and an aged population.
In the second half of the past century, the total pop-
ulation growth rate accelerated. The global demo-
graphic changes have brought decisive transfor-
mations, reshaped both the economic and demo-
graphic life-cycles of the individuals and restruc-
tured communities. The current world population ex-
ceeds 7.7 billion, and its expansion is predicted to be
persistent at least for several upcoming decades.
The above situation proposed a plethora of eco-
nomic, social, and ecological issues (e. g., the socie-
tal costs of the elderly, the generations’ responsibil-
ity redistribution, the lack of material provision, the
global pollution, etc.). The population’s characteris-
tics were significant economic growth determinants.
So, their composite effect on the development is ev-
erlasting and should be adequately examined. The is-
sues related to the key economic growth factors have
been at the center of economics since its origin. Five
centuries of profound investigations produced sev-
eral sustainable development theories, but the uncer-
tainty still remained. In the vast majority of those
theories, the main demographic variables are re-
garded as endogenous determinants. In the majority
of those theories, the demographic variables are re-
garded as endogenous determinants. Firstly, each
and every individual possesses a unique combination
of productive capacities that should be considered as
a part of human capital. Secondly, the population is
jointly characterized by enormous economic poten-
tial, eventually resulted in GDP. Thus, modern de-
mography and economics merged to produce some
methodological and practical statements on produc-
tion improvement. Even though demographic issues
are commonly associated with the rates of fertility
and mortality, in this article, we exposed the demo-
graphic variables in a broad sense, including the ag-
gregated knowledge, the purposeful skills of the
workforce, the educational, and the public health po-
tentials, etc. Some of the aforementioned character-
istics are overlapped, so there is a crucial need to
identify and to separate their impact on the develop-
ment processes.
The everlasting shifts into the demographic structure
have enabled the economies to convert the consider-
able part of the benefits from factor accumulation
and technological changes into real income per cap-
ita growth. The labor productivity and the develop-
ment processes were generally enhanced via three
main channels. Firstly, the downtrend in population
growth has simultaneously limited the stock dilution
and increased the number of resources per capita.
Secondly, the lowered fertility sanctioned the re-
sources reallocation from the number toward the
quality of children, intensifying both the human cap-
ital formation and total labor productivity. Finally,
the essential fertility rates’ reduction modified the
population’s age distribution. Thus, if the labor force
fraction in the population was temporarily increased,
the productivity per capita had been raised mechani-
cally.
The comprehensive influence of the population
change on economic development and performance
is somewhat ambiguous. The population growth
could be supportive, restrictive, or neutral to eco-
nomic growth. The population numbers and den-
sity’s variation are commonly interconnected with
considerable shifts into the respective community’s
age structure (described as the population’s distribu-
tion across different age groups). The agents’ behav-
ior (e. g., economic) enormously varies depending
on the stages of the individual’s life. Hence, the na-
tions with a high proportion of children are supposed
to devote most of their inherent resources to the
childcare programs. That fact depresses the eco-
nomic growth in the short-run, but could be intercon-
nected with intensified human capital acceleration in
the strategic perspective. Contrastingly, if most of a
nation’s population belongs to the working-age stra-
tum, the expanded productivity of the above group is
able to produce the so-called demographic dividend.
If the nation’s population consists of the elderly, the
effects can be reversed. In a particular situation, the
result can be similar to the case of an extremely
young population, when a significant share of re-
sources is generally consumed by a relatively unpro-
ductive stratum, inhibiting economic development.
The elderly population, due to the plurality of factors
(e. g., effective public health care, etc.) can maintain
productive capacity and demonstrate significant la-
bor efficiency.
Page 3
Pasichnyi et al./Problemy Ekorozwoju/Problems of Sustainable Development 1/2021, 219-229
221
A demographic dividend should be appropriately as-
sessed regarding both productivity and consumption.
In contemporary scientific discourse, the above, as
mentioned earlier, exists in two different forms. Its
first form is caused by an increase in the share of the
nations’ working-age population. The economic
agents form the crucial factor responsible for the de-
velopment. So-called second dividend is much diffi-
cult for the examination. A rapid growth in the el-
derly population stratum presumably strains the fi-
nancial and health care systems. That fact led to ra-
ther pessimistic forecasts concerning future eco-
nomic performance. However, the nation’s aging can
be a source for the second dividend rather than an
economic decline. While the productive population
stratum is declining, the vital challenge for both the
aging and the aged societies is to provide the most
preferred framework for the specific old-age con-
sumption and to achieve the desirable welfare.
Demographic dividends are indirect growth factors;
their scale is primarily dependent on the public insti-
tutions’ quality. The predictable weaknesses of the
pension programs (e. g., the unsustainable enlarge-
ment in public pension benefits or unfavorable tax
evasion) could offset plenty of the anticipated demo-
graphic dividends. If the major part of the expansion
in labor supply is mostly concentrated in the non-for-
mal sector, which does not contribute to social secu-
rity, it can induce considerable imbalances and the
decline in public welfare. The most significant for
the sustainable growth demographic variables are
represented by the qualitative and quantitative pa-
rameters of the working-age stratum. But the age de-
pendency ratio does not represent the only character-
istic that vitally matters. Both the fertility and mor-
tality fluctuations affect the average life expectancy
and determine the age distribution between the
groups of the population. Although extended life ex-
pectancy is mutually interconnected with life qual-
ity, it often reshapes public finances and potentially
induces the tax burden. The human capital’s quality
critically depends on the aggregate public and pri-
vate productive spending. So, the model for sustain-
able economic growth should combine the elements
related to human and physical capital creation.
Development trends in both advanced and emerging
market economies are incomparable. Regarding a
range of factors, amid the groups under study, a sub-
group of commodity economies should be specified.
Even though all the economies are dependent on
similar endogenous development triggers, the scale
and the proportion of the mentioned determinants
significantly vary. We examine advanced and some
emerging economies over the periods of institutional
transformation and sustainable growth. We high-
lighted the widespread impact of the expansion in the
working-aged stratum and the extended life expec-
tancy on economic development.
Literature review
Reconsidering the Romer’s conceptual model of en-
dogenous technical change (1990), Malm-
berg (1994) suggested to combine it with human
capital and the life-cycle of savings theories and ar-
gued that the population’s age structure vitally mat-
tered. Due to the analysis of the changes in the
agents’ financial behavior and human capital accu-
mulation over the life-cycle, a theory of the eco-
nomic growth effects’ age pattern was generally dis-
closed. Bloom, Canning and Sevilla (2001, 2003) in-
vestigated the population change’s impact on eco-
nomic growth considering the possible positions that
population growth restricted, promoted, or appeared
to be neutral to the development trends. Not only the
population’s number and growth rate impacts on the
economic performance were identified, but the age
structural effects as well. The agents’ behavior was
described as tremendously dependent on the above-
mentioned structure. On the theoretical concept of a
demographic dividend, the general conclusion that
the effect of an optimal working-age population
combined with proper health care, educational, fi-
nancial, and human capital policies could initiate vir-
tuous cycles of wealth creation was made. Taking an
enormous range of empirical cases into account, the
evidence on the age structure shifts relevance for
sustainable growth was emphasized. The demo-
graphic dividend concept was developed by Bloom,
Canning, Fink and Finlay (2007, 2009). The age
structure was regarded as the crucial economic
growth’s determinant and the main forecast objec-
tive. Boucekkine, de la Croix and Licandro (2002)
identified and investigated the fact that endogenous
growth was prompted by the generation-specific hu-
man capital accumulation. While advantageous
shifts in the survival probabilities induced extended
schooling period and relatively late retirement, their
overall effect on economic growth was ambiguous.
Generally, the observed demographic variables had
significant medium-term economic effects, but the
numerical interdependencies over the strategic per-
spective appeared to be not robust.
Lee (2001, 2003) outlined the main evidence of the
demographic transition and the corresponding issues
over the last three centuries. Regarding the data on
the interrelations between population shifts and fis-
cal policy performance, the possible demographic
changes, and their economic consequences for dif-
ferent types of economies were sketched. Consider-
ing the human capital theory, numerous articles were
dedicated to the essential social and demographic de-
terminants of both economic and population growth.
Gador (2012) studied the main demographic theo-
ries’ empirical validity and their relevance for the
sound understanding of the transition from the stag-
nation phase to sustainable growth. A noteworthy in-
crease in the aggregated demand for human capital
in the development process was suggested to be the
Page 4
Pasichnyi et al./Problemy Ekorozwoju/Problems of Sustainable Development 1/2021, 219-229
222
main trigger for fertility reduction as well as the tran-
sition to the actual growth rates. Acemoglu and
Johnson (2007); Hansen and Lønstrup (2015) ex-
plained that an increase in the life expectancy over
the second part of the XXth century simultaneously
reduced the real GDP per capita growth rate and fos-
tered population growth. That binary conclusion was
based on the fact that – due to the medical break-
throughs – lots of advanced countries have experi-
enced high growth rates in life expectancy and pop-
ulation size combined with relatively low growth
rates in per capita GDP. Considering the empirical
evidence from the Western economies during the
past century, Fernihough (2017) argued the demo-
graphic transition’s importance as a supporting
mechanism for the expansion in human capital. The
education’s impact on fertility rates and human cap-
ital accumulation was examined as well.
Lucas Jr. (2015) explored an aggregate innovative
potential of the nation as a result of knowledge crea-
tion, based on consistent schooling and skills im-
provement. The actual knowledge management’s
role was dependent on the initial level of the coun-
try’s economic development and the institutional
framework’s quality. Barro and Lee (2013) pointed
out how the output was related to the stock of human
capital, determined by the total years of schooling
and by the composition of the workers’ educational
attainment. Schooling had a significantly positive ef-
fect on the GDP dynamics, while it mainly optimized
the endogenous interrelations between the main
components of the growth processes.
Considering human capital production and accumu-
lation, some significant conclusions were made. Us-
ing the panel data method, Pelinescu (2015) substan-
tiated the value of a good education and a flexible
training system for sustainable economic growth.
Knowledge diffusion in manufacturing goods and
services, creative industries and rather explicit ef-
forts to establish a research-intensive economy were
identified as the main triggers for strategic develop-
ment. Hanushek (2015) examined the possibilities
for tertiary education based improvement in public
production. No robust interdependencies between
the mentioned indicators were obtained. Neverthe-
less, the reasonable effects of schooling were ob-
served. Ahsan and Haque (2017) refuted the hypoth-
esis that the number of completed years of education
was unrelated to the growth dynamics. According to
their empirical study, a decisive influence of school-
ing could be discerned after exceeding a threshold
development level by a particular economy.
Using a growth model with integrated variables from
the supply and demand side, Teixeira and Queirós
(2016) evaluated both the direct and implicit human
capital effects on output growth, tacking the interac-
tion of human capital with the country’s industrial
specialization into account. The above factors were
identified as the main economic growth determi-
nants. Development was strongly affected by the
composite effect of human capital applications and
structural change in the high knowledge-intensive
industries. The sign of the observed effect was ge-
netically dependent on the type of economic model
and the period under investigation. Over the 1960-
2011 period, for the OECD countries, the cumulative
impact of the interaction between human capital and
structural change in the respective economy was
positive. Nagarajan, Teixeira and Silva (2016) exam-
ined the literature regarding aging and its tremen-
dous impact on economic growth. They pointed out
the profound mechanisms by which aging acceler-
ated development. Applying the proper mathemati-
cal methods, Uddin, Alam and Gow (2016) exam-
ined the population’s saving behavior regarding the
age structure, dependency ratio, savings rate, real
GDP, etc. The negative effect of the aging for the
developed economies was statistically validated.
McGrath (2016) stated that the indicators of GDP,
capital stock and human capital were co-integrated.
While the causalities from GDP to capital stock as
well as from capital stock to human capital were bi-
directional, the causality from GDP to human capital
appeared to be unidirectional, but not vice versa. As
a result, the hypothesis that growth was prompted by
human capital has been generally refuted.
Focusing on the divergence in the mortality rate for
comparative investigation, Cervellati and Sunde
(2015) argued the unified development theory – cov-
ering both demographic and economic issues – and
studied the respective transition’s mechanics. The
obtained results highlighted a significant part of the
differences in economic development (e. g., the tim-
ing of the takeoff) across the states under study and
the worldwide density distribution of the main vari-
ables. Acemoglu and Restrepo (2017) questioned the
negative impacts of the aging society on economic
growth. The principal theoretical statements on the
aging population’s adverse effects on the growth
were empirically investigated. Both the lower labor
force participation and the production decrease of
the older employees were considered. The hypothe-
sis that aging had a negative influence on the sav-
ings-to-investment ratio and led to secular stagnation
was refuted. It should be noted that the authors ap-
plied the unique methodology: all the population
older than 50 years were identified as aged, irrespec-
tively its productive activity and behavior. Cooley,
Henriksen and Nusbaum (2019) pointed out the per-
sistent deceleration in the economic growth rates of
the four largest advanced economies in Europe im-
pacted by a shift in the age-cohort distribution. De-
fining the composite demographic impact-factors on
the economic growth, some interdependencies be-
tween the aggregated factor productivity, capital ac-
cumulation, labor force supply, and population
growth rates were disclosed. It was proved empiri-
cally that the effects of the aging population on eco-
nomic growth were a distortion to the individual fac-
tor-supply choices, regarding the pension systems.
Page 5
Pasichnyi et al./Problemy Ekorozwoju/Problems of Sustainable Development 1/2021, 219-229
223
Ahmad and Khan (2019) investigated whether the
above transition and the dynamics of human capital
mattered for the growth of the developing world. The
economically active population and the labor force
participation rate produced a positive lagged contri-
bution to economic growth.
Regarding the shift in developed countries from in-
dustrial to knowledge economies, Faggian, Partridge
and Malecki (2017) studied the underlying causes of
the immanent economic development. The precondi-
tions for the growth were referred to the intensified
creativity, the sound entrepreneurship environment,
and expanded human capital, etc.; those factors were
interconnected with the nation’s demographic pa-
rameters. While the relation between intellectual
capital – measured by the educational attainment –
and the entrepreneurship environment (characterized
by the intensity of small and medium-sized compa-
nies) appeared to be statistically interconnected with
subsequent development, the other determinants
(e. g., the share of creative class workers, the share
of advanced technology industries) were labeled as
insignificant. Cuaresma, Doppelhofer, Huber, and
Piribauer (2018) assessed the potential contribution
of the distant schooling attainment to economic de-
velopment and the national income convergence. It
was proposed that the income dynamics and human
capital acted as the important drivers for the real in-
come growth.
Methods and data
Even though sustainable economic growth is de-
pendent on the dynamic interrelation between eco-
nomic and demographic factors, their comprehen-
sive effect could be described by a production func-
tion (1):
( ) ,,...,,21 xxxfY n
=
(1)
where Y – the national production capacity or annual
economic growth;
x1, x2, …, xn – the most essential economic and de-
mographic factors.
The above determinants are considerably intercon-
nected with the category of human capital. All the
vital components of the above category are insepara-
ble and critically overlapped. In this investigation,
we considered that the production of public goods
and services is defined by the general Cobb–Doug-
las function (2).
,KLAY ijijijij
=
(2)
where Yij – the real GDP of the country j in the year i;
Aij – the total factor productivity coefficient of the
country j in the year i;
Lij – the labor input of the country j in the year i;
Kij – the capital input of the country j in the year i;
α, β – the output elasticities of labor and capital, re-
spectively, while α + β = 1.
From the strategic perspective, economic growth is
hugely dependent on the compositional structure of
the recourses actual application, aimed to encourage
the agents’ voluntary activity. The demographic de-
pendent expanses generally affect economic activity,
determining its scale and shape. Even though the in-
vestigated recourses theoretically could be described
as the general substitutes, the evidence that the sys-
tem’s added potential emerges from the combination
of its components occurred. In another way, the sys-
tem’s potential could be described by the system (3),
where the emergent potential significantly matters:
+=
==
=
m
jj
n
ii
n
ii
bb
b
BP
BP
11
1
'][
;][
(3)
where P[B] – the total potential of the examined sys-
tem;
bi – the potential of the economic systems’ i-th ele-
ment;
b’j – the emergent potential of the j-th interconnec-
tion between the systems’ components.
In the relevant conditions, all the production factors
should be considered as the imperfect complements,
and public welfare could be identified by the real an-
nual GDP per capita growth rate. The latter is enor-
mously dependent on the fundamental productive
factors, e. g. physical and human capital. If the real
GDP per capita growth rates are decomposed into
several conditionally independent variables, the mul-
tiplicative function 2 and considering the system (3)
can be transformed into the additive one (4): ,
3210_ ++++= contrсaphumdemogrgrowt ijijijij
(4)
where growthij – the real GDP per capita growth rate
of the country j in the year i;
demogrij – the demographic variables of the coun-
try j in the year i;
hum_capij – the other human capital variables (indi-
rectly related to demographic ones) of the country j
in the year i;
contrij – the economic controls (related to the physi-
cal capital) of the country j in the year i.
Traditionally, all the demographic variables are in-
terconnected with the fertility and mortality rates.
The population’s dynamics is not dependent only on
the natural factors, but on the mechanical / unpre-
dictable (e. g., migration) ones as well. We believe
that the overall demographic impact on economic
growth is represented by the changes in the working-
age stratum and expected life span dynamics. Thus,
the demographic variables in this study consist of the
working-age population growth rate (WAPopgr) and
the average life expectancy growth rate (LifeExpgr).
The composite public and private expenses represent
the other essential economic growth determinant on
research and development activities (RD%GDP), con-
sidered as a percentage of GDP.
Page 6
Pasichnyi et al./Problemy Ekorozwoju/Problems of Sustainable Development 1/2021, 219-229
224
We impose two controls: public expenditures (Pu-
bExp%GDP) and total investment (TInv%GDP) as the
percentages of GDP. Public spending generally char-
acterizes the scale of the GDP redistribution and the
government’s role in welfare creation. The above
variable supposedly aggregates both the productive
expenses (related to the human capital formation)
and the other spending with an ambiguous impact on
economic growth (considered as unproductive). Ag-
gregating public and private financial activity simul-
taneously, the total investment indicator is related to
the physical capital production of the Cobb–Douglas
model (2).
We used a panel data analysis, which covered 45 ad-
vanced and transitional economies over the 1990-
2018 period. The sample included 36 significantly
different economies of the OECD states and Arme-
nia, Belarus, Bulgaria, Croatia, Georgia, Kazakh-
stan, Romania, Russian Federation, and Ukraine. Re-
garding the critical lack of information on several
emerging markets over the early 1990s, the panel
data appeared unbalanced. Regarding the fact that
the majority of the investigated emerging economies
had successfully conducted institutional and struc-
tural reforms before joining the EU (its formation
generally ended around 2004-2005), we examined
two periods of 1990-2004 and 2005-2018 separately.
The sources of the empirical data were represented
by the World Bank’s and the IMF’s bases. Some es-
sential data were drawn from the OECD and the Eu-
ropean Commission’s bases. Summary statistics data
for the sample regarding three time periods are rep-
resented in Table 1.
Over the 1990-2018 period, the analyzed indicators
varied critically. While the volatility of the public
expenditures-to-GDP ratio was slightly reduced, the
volatility of the other examined characteristics es-
sentially increased. The highest standard deviation
indicated the aforementioned ratio, which was
equaled 9.53 %. That fact was due to the extraordi-
nary differences in the sampled states’ institutional
framework, fiscal policy and economic model.
Results
In the long-run, sustainable growth is generally de-
scribed as the economic policy’s ultimate and upper
objective. Different demographic variables are inte-
grated into the development of national programs
and strategies as their significant indices. Yet, the ac-
tual role of the above characteristics as the growth
triggers remained undisclosed. Set by the respective
authorities due to their electoral obligations in case
of mutual interconnection between political and
business cycles, some declarative goals in the dis-
tinct fields (e. g., demographics, public finances,
etc.) can contradict each other and deteriorate the an-
alyzed system’s effect. Given the above, a complex
investigation of both demographic and the other fac-
tors’ contribution to economic growth was carried
out.
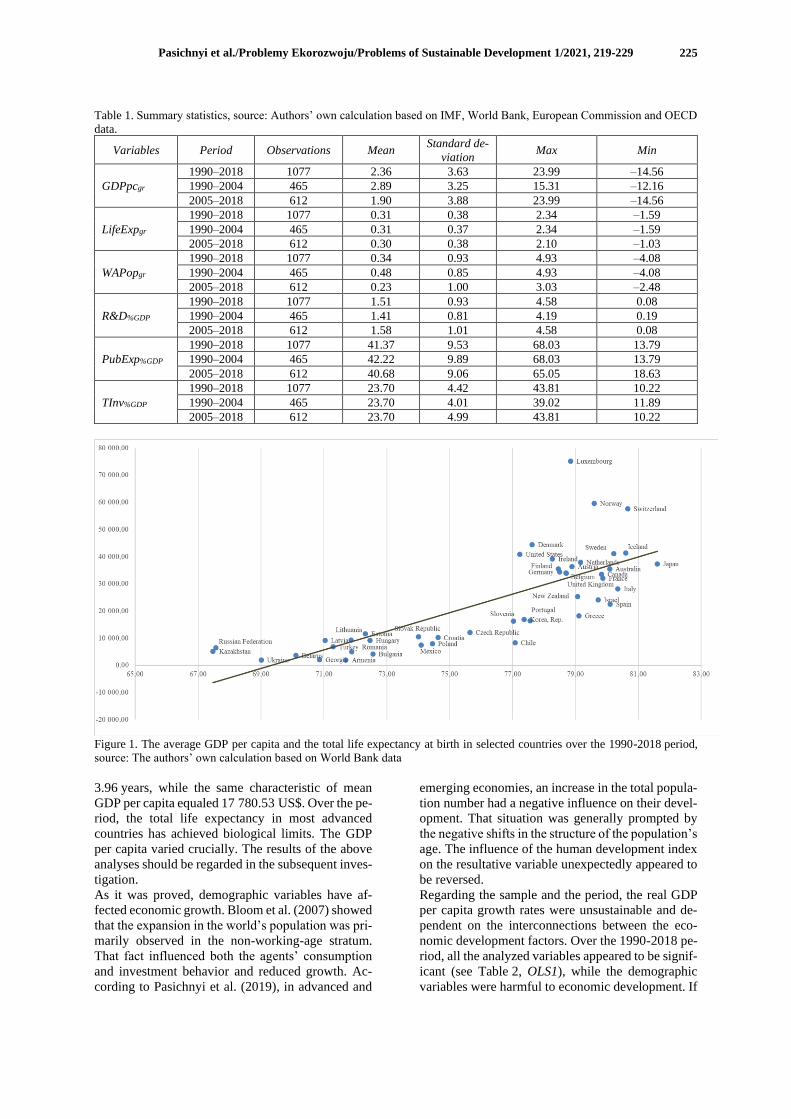
Sanchez-Romero, Lee and Prskawetz (2018) pro-
claimed that the differences in life expectancy could
be observed not only between the different countries
but between the high and low socioeconomic groups.
That hypothesis is profound when societies with sig-
nificant inequality are analyzed. In our investigation,
both life expectancy and economic development in-
dicators were regarded as the universal characteris-
tics of a particular population. Figure 1 represents
the interrelation between the mean GDP per capita
(in the current US$) and the total life expectancy at
birth (in years) in the mentioned sample over the
1990-2018 period. The observed interdependency
appeared to be significant and robust (R2 = 0.59).
Considering the data on the mean GDP per capita,
the sample was divided into three sub-samples. The
1st sub-sample included the states with the mean
GDP per capita lower than 12 500.00 US$, the 2nd
sub-sample – the countries with the mean GDP per
capita from 12 500.01 US$ to 37 500.00 US$, and
the 3rd sub-sample – the countries with the mean
GDP per capita higher than 37 500.01 US$.
The majority of the post-Soviet stats belonged to the
1st sub-sample due to their endogenous social and
economic conditions in the early 1990s. The 1st sub-
sample included Chile, Mexico, and Turkey as well.
Over the entire period, Slovenia appeared to be the
only post-Soviet-influenced country with a high av-
erage GDP per capita (equaled to 16 350.55 US$).
Regarding the sample, the countries of the 1st sub-
sample were characterized by the lowest average life
expectancy: the indicator changed from 67.47 years
in Kazakhstan to 75.74 years in the Czech Republic.
The average life expectancy in Slovenia
(77.05 years) was lower than the same indicator in
Chile (77.09 years). In the 2nd and the 3rd sub-sam-
ples, the interconnection was generally identical, but
its statistical density appeared to be weak. The high-
est average life expectancy was observed in Japan
(81.60 years). Australia, Italy and Spain (from the
2nd sub-sample) as well as Iceland, Sweden, and
Switzerland (from the 3rd sub-sample) formed a
group of countries with the average life expectancy
that exceeded 80.00 years. Kazakhstan, Russian
Federation, and Ukraine formed the group of states
with the lowest average life expectancy that did not
exceed 70.00 years. The last group was also marked
by the lowest GDP per capita.
In the sample, Luxembourg was marked by an enor-
mously high mean GDP per capita (equaled to
75 790.35 US$). The indicator rose from
34 645.14 US$ in 1990 to 116 639.89 US$ in 2018.
The life expectancy varied from 75.01 years to
82.74 years, respectively. We did not exclude the
data on Luxembourg from the sample, but that case
has been considered as essential for the analysis. It
should be mentioned that the standard deviation of
the average life expectancy at birth was equal to
Page 7
Pasichnyi et al./Problemy Ekorozwoju/Problems of Sustainable Development 1/2021, 219-229
225
aTable 1. Summary statistics, source: Authors’ own calculation based on IMF, World Bank, European Commission and OECD
data.
Variables Period Observations Mean Standard de-
viation Max Min
GDPpcgr
1990–2018 1077 2.36 3.63 23.99 –14.56
1990–2004 465 2.89 3.25 15.31 –12.16
2005–2018 612 1.90 3.88 23.99 –14.56
LifeExpgr
1990–2018 1077 0.31 0.38 2.34 –1.59
1990–2004 465 0.31 0.37 2.34 –1.59
2005–2018 612 0.30 0.38 2.10 –1.03
WAPopgr
1990–2018 1077 0.34 0.93 4.93 –4.08
1990–2004 465 0.48 0.85 4.93 –4.08
2005–2018 612 0.23 1.00 3.03 –2.48
R&D%GDP
1990–2018 1077 1.51 0.93 4.58 0.08
1990–2004 465 1.41 0.81 4.19 0.19
2005–2018 612 1.58 1.01 4.58 0.08
PubExp%GDP
1990–2018 1077 41.37 9.53 68.03 13.79
1990–2004 465 42.22 9.89 68.03 13.79
2005–2018 612 40.68 9.06 65.05 18.63
TInv%GDP
1990–2018 1077 23.70 4.42 43.81 10.22
1990–2004 465 23.70 4.01 39.02 11.89
2005–2018 612 23.70 4.99 43.81 10.22
Figure 1. The average GDP per capita and the total life expectancy at birth in selected countries over the 1990-2018 period,
source: The authors’ own calculation based on World Bank data
3.96 years, while the same characteristic of mean
GDP per capita equaled 17 780.53 US$. Over the pe-
riod, the total life expectancy in most advanced
countries has achieved biological limits. The GDP
per capita varied crucially. The results of the above
analyses should be regarded in the subsequent inves-
tigation.
As it was proved, demographic variables have af-
fected economic growth. Bloom et al. (2007) showed
that the expansion in the world’s population was pri-
marily observed in the non-working-age stratum.
That fact influenced both the agents’ consumption
and investment behavior and reduced growth. Ac-
cording to Pasichnyi et al. (2019), in advanced and
emerging economies, an increase in the total popula-
tion number had a negative influence on their devel-
opment. That situation was generally prompted by
the negative shifts in the structure of the population’s
age. The influence of the human development index
on the resultative variable unexpectedly appeared to
be reversed.
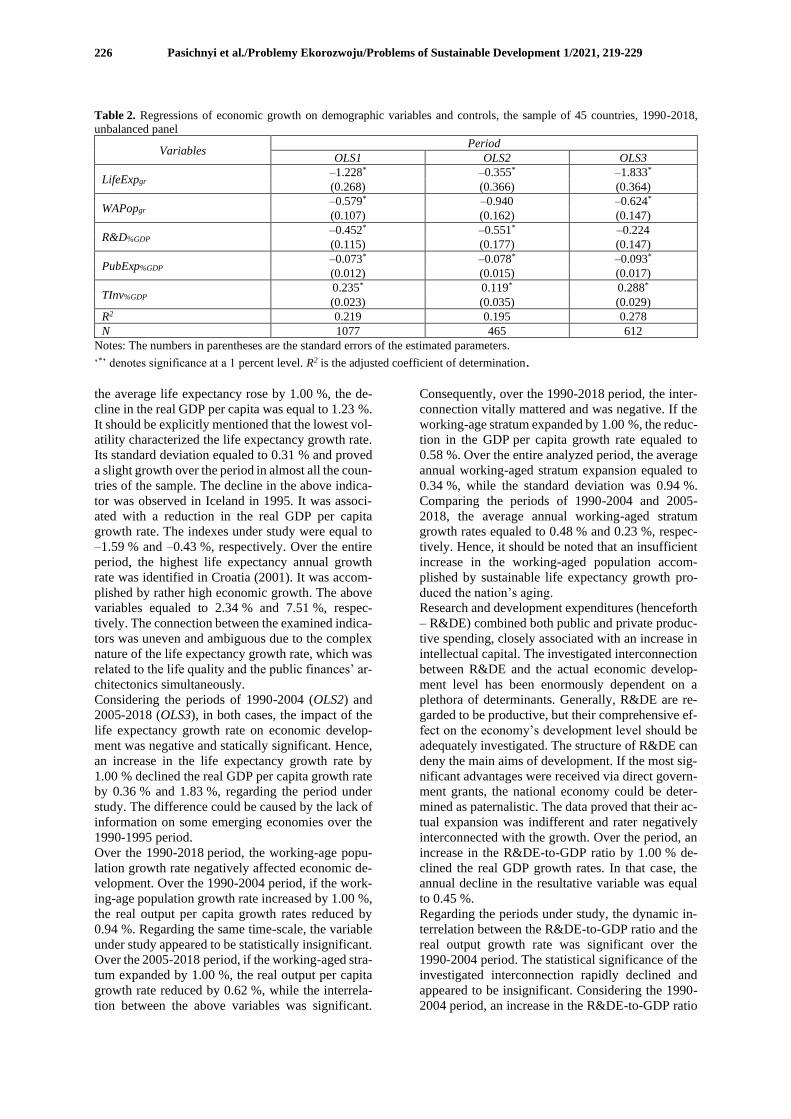
Regarding the sample and the period, the real GDP
per capita growth rates were unsustainable and de-
pendent on the interconnections between the eco-
nomic development factors. Over the 1990-2018 pe-
riod, all the analyzed variables appeared to be signif-
icant (see Table 2, OLS1), while the demographic
variables were harmful to economic development. If
Page 8
Pasichnyi et al./Problemy Ekorozwoju/Problems of Sustainable Development 1/2021, 219-229
226
aTable 2. Regressions of economic growth on demographic variables and controls, the sample of 45 countries, 1990-2018,
unbalanced panel
Variables Period
OLS1 OLS2 OLS3
LifeExpgr –1.228* –0.355* –1.833*
(0.268) (0.366) (0.364)
WAPopgr –0.579* –0.940 –0.624*
(0.107) (0.162) (0.147)
R&D%GDP –0.452* –0.551* –0.224
(0.115) (0.177) (0.147)
PubExp%GDP –0.073* –0.078* –0.093*
(0.012) (0.015) (0.017)
TInv%GDP 0.235* 0.119* 0.288*
(0.023) (0.035) (0.029)
R2 0.219 0.195 0.278
N 1077 465 612
Notes: The numbers in parentheses are the standard errors of the estimated parameters.
‘*’ denotes significance at a 1 percent level. R2 is the adjusted coefficient of determination.
the average life expectancy rose by 1.00 %, the de-
cline in the real GDP per capita was equal to 1.23 %.
It should be explicitly mentioned that the lowest vol-
atility characterized the life expectancy growth rate.
Its standard deviation equaled to 0.31 % and proved
a slight growth over the period in almost all the coun-
tries of the sample. The decline in the above indica-
tor was observed in Iceland in 1995. It was associ-
ated with a reduction in the real GDP per capita
growth rate. The indexes under study were equal to
–1.59 % and –0.43 %, respectively. Over the entire
period, the highest life expectancy annual growth
rate was identified in Croatia (2001). It was accom-
plished by rather high economic growth. The above
variables equaled to 2.34 % and 7.51 %, respec-
tively. The connection between the examined indica-
tors was uneven and ambiguous due to the complex
nature of the life expectancy growth rate, which was
related to the life quality and the public finances’ ar-
chitectonics simultaneously.
Considering the periods of 1990-2004 (OLS2) and
2005-2018 (OLS3), in both cases, the impact of the
life expectancy growth rate on economic develop-
ment was negative and statically significant. Hence,
an increase in the life expectancy growth rate by
1.00 % declined the real GDP per capita growth rate
by 0.36 % and 1.83 %, regarding the period under
study. The difference could be caused by the lack of
information on some emerging economies over the
1990-1995 period.
Over the 1990-2018 period, the working-age popu-
lation growth rate negatively affected economic de-
velopment. Over the 1990-2004 period, if the work-
ing-age population growth rate increased by 1.00 %,
the real output per capita growth rates reduced by
0.94 %. Regarding the same time-scale, the variable
under study appeared to be statistically insignificant.
Over the 2005-2018 period, if the working-aged stra-
tum expanded by 1.00 %, the real output per capita
growth rate reduced by 0.62 %, while the interrela-
tion between the above variables was significant.
Consequently, over the 1990-2018 period, the inter-
connection vitally mattered and was negative. If the
working-age stratum expanded by 1.00 %, the reduc-
tion in the GDP per capita growth rate equaled to
0.58 %. Over the entire analyzed period, the average
annual working-aged stratum expansion equaled to
0.34 %, while the standard deviation was 0.94 %.
Comparing the periods of 1990-2004 and 2005-
2018, the average annual working-aged stratum
growth rates equaled to 0.48 % and 0.23 %, respec-
tively. Hence, it should be noted that an insufficient
increase in the working-aged population accom-
plished by sustainable life expectancy growth pro-
duced the nation’s aging.
Research and development expenditures (henceforth
– R&DE) combined both public and private produc-
tive spending, closely associated with an increase in
intellectual capital. The investigated interconnection
between R&DE and the actual economic develop-
ment level has been enormously dependent on a
plethora of determinants. Generally, R&DE are re-
garded to be productive, but their comprehensive ef-
fect on the economy’s development level should be
adequately investigated. The structure of R&DE can
deny the main aims of development. If the most sig-
nificant advantages were received via direct govern-
ment grants, the national economy could be deter-
mined as paternalistic. The data proved that their ac-
tual expansion was indifferent and rater negatively
interconnected with the growth. Over the period, an
increase in the R&DE-to-GDP ratio by 1.00 % de-
clined the real GDP growth rates. In that case, the
annual decline in the resultative variable was equal
to 0.45 %.
Regarding the periods under study, the dynamic in-
terrelation between the R&DE-to-GDP ratio and the
real output growth rate was significant over the
1990-2004 period. The statistical significance of the
investigated interconnection rapidly declined and
appeared to be insignificant. Considering the 1990-
2004 period, an increase in the R&DE-to-GDP ratio
Page 9
Pasichnyi et al./Problemy Ekorozwoju/Problems of Sustainable Development 1/2021, 219-229
227
by 1.00 % was accomplished by the reduction in the
GDP per capita growth rate, which was equaled to
0.55 %. Over the 2005-2018 period, regarding the
numerical investigation, the observed interrelation
between the R&DE-to-GDP ratio and the real eco-
nomic development rate was insignificant.
In line with Barro and Sala-i-Martin (2003), public
expenditures could be and should be split into two
separate groups, considering their overall impact on
the production dynamics: the productive and the op-
posite. According to the data, the non-productive
public spending causes a crucial decline in the real
output. The above ratio was detrimental to economic
development, considering the time-scales. The ad-
verse impact of the investigated variable was ob-
served, considering both advanced and emerging
economies. The variable under investigation was
enormously dependent on the national economy’s
model and the institutional framework’s quality. Re-
garding an extended period and the sample’s quality,
the public spending-to-GDP ratio extremely varied.
Its standard deviation changed from 9.89 % (1990-
2004) to 9.06 % (2005-2018).
The R&DE are vitally dependent on their structure.
If the aforementioned structure was rigid, it could be
characterized as an inherent of the public spending
policy. In the emerging market economies over the
early 1990s, the latter was interconnected with the
paternalistic public finances’ doctrine. In that case,
public spending was often determined by the politi-
cal cycle than by the economic one. The electoral
promises affected the economic performance and
quite often deteriorated it.
The total investment indicator – represented by the
composite public and private financial efforts – pos-
itively affected the growth processes. Over the 1990-
2018 period, an increase equaled to 1.00 % in the to-
tal investment-to-GDP ratio was accomplished by an
increase in the real GDP per capita growth rate that
was equal to 0.24 %. The overall effect of invest-
ment over the 1990-2004 period (coefficient equaled
to 0.12 %) was less essential compared with the
2005-2018 period (coefficient equaled 0.29 %). That
fact proved that the composition of the investment
really mattered. Considering the entire period, in the
model, the total investment-to-GDP ratio was the
only variable that showed a sustainable positive in-
fluence on production.
Discussion
Taking the empirical data into account, over the past
three decades, economic development was ex-
tremely dependent on different demographic deter-
minants. The examined social and demographic in-
dicators – the working-age stratum and the average
life expectancy growth rates – harmed the real out-
put. In the case of the negative interrelation between
the working-age stratum and the real GDP growth
rates, the possible explanation can be derived from
the labor force quality. In our investigation, the
working-aged stratum of the population was defined
according to the ILO methodology. Moreover, the
people aged from 15 to 64 objectively possess the
incomparable working abilities and competencies.
The observed expansions in the aforementioned stra-
tum could be caused by an increase in the low-skilled
and unskilled sub-strata. The latter was generally de-
scribed by relatively weak productive capacities and
an insignificant contribution to public production.
Further investigations should cover the structural pe-
culiarities of the working-aged stratum and related
issues. The general adverse influence of an extended
life expectancy can be explained due to the same
changes in the population’s distribution through the
age strata. In advanced and emerging economies,
longevity is directly connected to the tax burden: an
increased life expectancy induces actual social con-
tributions. Seriously aged population increases the
share of medical and recreation spending – both pub-
lic and private – in GDP significantly. Furthermore,
investment and consumption behavior are crucially
dependent on the population’s age structure. Lon-
gevity was described as the natural and direct conse-
quence of the high economic development.
In this paper, the indirect human-capital-related eco-
nomic growth determinant was represented by the
R&DE share in GDP. In actual economic discourse,
R&DE are traditionally defined as productive. How-
ever, in our investigation, an increase in R&DE was
associated with the downtrend in public production.
The possible explanation was interconnected with
the inherent structure of R&DE. In a number of
countries, R&DE were primarily financed through
public funds. If the structure of government spending
was inaccurate, the public expenditures’ efficiency
significantly declined. Thus, the possible solution
was closely interconnected with R&D activities and
private business convergence. If the scientific pro-
grammers were connected to the business programs,
their comprehensive effect was generally high. If
R&D activities were unconnected to the public
needs, real output has been crucially reduced.
Conclusion
Public production can be described as a complicated
multidimensional process substantially dependent
on a set of social, demographic, and economic fac-
tors. Being a producer and a consumer of goods and
services simultaneously, a person enormously influ-
ences the economic dynamics. The demographic de-
terminants contribute to economic development,
while the nature of their influence should be investi-
gated accurately. We studied 45 advanced and
emerging market economies over the 1990-2018 pe-
riod. In this article, we considered that there were
three main groups of the impact factors on economic
growth. The 1st group was represented by demo-
graphic determinants, directly related to human cap-
Page 10
Pasichnyi et al./Problemy Ekorozwoju/Problems of Sustainable Development 1/2021, 219-229
228
ital quality. That group included the working-age
stratum and the average life expectancy growth rates.
The 2nd group of the impact factors was connected to
human capital and knowledge management closely
but indirectly. The investigated variable referred to
the R&DE-to-GDP ratio. The 3rd group was repre-
sented by the economic controls primarily related to
physical capital: the public spending-to-GDP and to-
tal investment-to-GDP ratios. The entire period un-
der study was divided into two separate periods re-
ferred to 1990-2004 and 2005-2018, respectively.
The general sample was divided into three sub-sam-
ples, considering the average GDP per capita and the
mean life expectancy. We pointed out that the afore-
mentioned economic and demographic characteris-
tics were directly interconnected: the highest life ex-
pectancy was observed in the most developed cour-
tiers. Moreover, that connection was bilateral: sig-
nificantly high real GDP per capita prompted life ex-
pectancy. We identified three sub-samples, regard-
ing low, medium and high average GDP per capita.
It was shown that the states with the lowest average
life expectancy were simultaneously characterized
by relatively low real GDP per capita. High life ex-
pectancy was regarded as the logical and natural con-
sequence of an effective public production structure.
Over the periods under investigation, regarding the
sample of 45 advanced and emerging economies, the
general interdependency – represented by the model
4 – appeared to be statistically significant and quite
robust, while the impact of the leading indicators
critically varied. The vast majority of the highlighted
variables had a significant adverse impact on the
scale of public production. An increase in the life ex-
pectancy growth rate by 1.00 % reduced the real out-
put growth rate by 1.23 %. If the working-age stra-
tum grew by 1.00 %, GDP was reduced by 0.58 %.
Surprisingly, an increase in the R&DE-to-GDP ratio
by 1.00 % slowed down the real GDP per capita
growth rate by 0.45 %. An increase in the public
spending-to-GDP ratio by 1.00 % declined the out-
put dynamics by 0.07 %. The total investment-to-
GDP ratio was the only independent variable that
had a robust positive influence on public production:
if the mentioned ratio increased by 1.00 %, the out-
put expanded by 0.24 %.
Taking the selected time scales into account, the in-
dependent variables had, in general, a similar impact
on the output dynamics. Over the 1990-2004 period,
the impact of the working-age stratum growth rate
on economic development happened to be statisti-
cally insignificant. The same results were obtained
when the entire sample was divided into two sub-
samples, considering the actual development of the
examined economies. The empirical investigation
proved a robust adverse interconnection between the
observed variables. Henceforth, the actual impact of
demographic determinants should be investigated
profoundly.
References
1. ACEMOGLU D., JOHNSON S., 2007, Disease and
development: the effect of life expectancy on eco-
nomic growth, in: Journal of political Economy,
115(6), p. 925-985, DOI: 10.1086/529000.
2. ACEMOGLU D., RESTREPO P., 2017, Secular
stagnation? The effect of aging on economic growth
in the age of automation, in: American Economic Re-
view, 107(5), p. 174-179, DOI:10.1257/aer.p201711
01.
3. AHMAD M., KHAN R. E. A., 2019, Does demo-
graphic transition with human capital dynamics mat-
ter for economic growth?, A dynamic panel data ap-
proach to GMM, in: Social Indicators Research,
142(2), p. 753-772, DOI: 10.1007/s11205-018-1928-
x.
4. AHSAN H., HAQUE M. E., 2017, Threshold effects
of human capital: Schooling and economic growth,
in: Economics Letters, 156, p. 48-52, DOI:
10.1016/j.econlet.2017.04.014.
5. BARRO R. J., LEE J. W., 2013, A new data set of ed-
ucational attainment in the world, 1950-2010, in:
Journal of development economics, 104, p. 184-198,
DOI: 10.1016/j.jdeveco.2012.10.001.
6. BARRO R. J., SALA-I-MATIN X., 2003, Economic
growth (2nd ed.), MIT Press, Massachusetts.
7. BLOOM D. E., CANNING D., SEVILLA J., 2001,
Economic growth and the demographic transition,
(No. w8685), National Bureau of Economic Re-
search, DOI: 10.3386/w8685.
8. BLOOM D. E., CANNING D., SEVILLA J., 2003,
The demographic dividend: A new perspective on the
economic consequences of population change, Rand
Corporation.
9. BLOOM D. E., CANNING D., FINK G., FIN-
LAY J. E., 2007, Does age structure forecast eco-
nomic growth?, in: International Journal of Fore-
casting, 23(4), p. 569-585, DOI: 10.1016/j.ijfore-
cast.2007.07.001.
10. BLOOM D. E., CANNING D., FINK G., FIN-
LAY J. E., 2009, Fertility, female labor force partici-
pation, and the demographic dividend, in: Journal of
Economic growth, 14(2), p. 79-101, DOI: 10.1007/
s10887-009-9039-9.
11. BOUCEKKINE R., DE LA CROIX D.,
LICANDRO O., 2002, Vintage human capital, demo-
graphic trends, and endogenous growth, in: Journal
of Economic Theory, 104(2), p. 340-375, DOI:
10.1006/jeth.2001.2854.
12. CERVELLATI M., SUNDE U., 2015, The economic
and demographic transition, mortality, and compara-
tive development, in: American Economic Journal:
Macroeconomics, 7(3), p. 189-225, DOI:
10.1257/mac.20130170.
13. COOLEY T. F., HENRIKSEN E., NUSBAUM C.,
2019, The Growth-Cost of Demographic Change in
Europe, preliminary publication in: Review of Eco-
nomic Dynamics, 352, p. 1-30, https://economic dy-
namics.org/meetpapers/2019/paper_1352.pdf.
14. CUARESMA J. C., DOPPLELHOFER G., HU-
BER F., PIRIBAUER P., 2018, Human capital accu-
mulation and long-term income growth projections
for European regions, in: Journal of Regional Sci-
ence, 58(1), p. 81-99, DOI: 10.1111/jors.12339.
Page 11
Pasichnyi et al./Problemy Ekorozwoju/Problems of Sustainable Development 1/2021, 219-229
229
15. FAGGIAN A., PARTRIDGE M., MALECKI E. J.,
2017, Creating an environment for economic growth:
creativity, entrepreneurship or human capital?, in: In-
ternational Journal of Urban and Regional Research,
41(6), p. 997-1009, DOI: 10.1111/1468-2427.12555.
16. FERNIHOUGH A., 2017, Human capital and the
quantity–quality trade-off during the demographic
transition, Journal of Economic Growth, 22(1), p. 35-
65, DOI: 10.1007/s10887-016-9138-3.
17. GALOR O., 2012, The demographic transition:
causes and consequences, in: Cliometrica, 6(1), p. 1-
28, DOI: 10.1007/s11698-011-0062-7.
18. HANSEN C. W., LONSTRUP L., 2015, The rise in
life expectancy and economic growth in the 20th cen-
tury, in: The Economic Journal, 125(584), p. 838-
852, DOI: doi.org/10.1111/ecoj.12261/
19. HANUSHEK E. A., 2016, Will more higher educa-
tion improve economic growth?, Oxford Review of
Economic Policy, 32(4), p. 538-552, DOI: 10.1093/
oxrep/grw025.
20. LEE R. D., 2001, Demographic change and fiscal
policy, Cambridge University Press.
21. LEE R. D., 2003, The demographic transition: three
centuries of fundamental change, in: Journal of eco-
nomic perspectives, 17(4), p. 167-190, DOI: 10.1257/
089533003772034943.
22. LOCAS JR. R. E., 2015, Human capital and growth,
in: American Economic Review, 105(5), p. 85-88,
DOI: 10.1257/aer.p20151065.
23. MALMBERG B., 1994, Age structure effects on eco-
nomic growth – Swedish evidence, in: Scandinavian
Economic History Review, 42(3), p. 279-295, DOI:
10.1080/03585522.1994.10415889.
24. MCGRATH P., 2016, The Relationship between Hu-
man Capital and Economic Growth in Ireland, SSRN
2872739, DOI: 10.2139/ssrn.2872739.
25. NAGARAJAN N. R., TEIXEIRA A. A., SILVA
S.T., 2016, The impact of an ageing population on
economic growth: an exploratory review of the main
mechanisms, in: Análise Social, 218, p. 4-35,
https://www.jstor.org/stable/43755167 (1.10.2019).
26. PASICHNYI M., KANEVA T., RUBAN M.,
NEPYTALIUK A., 2019, The impact of fiscal decen-
tralization on economic development, in: Investment
Management and Financial Innovations, 16(3),
p. 29-39. DOI: 10.21511/imfi.16(3).2019.04.
27. PELINESCU E., 2015, The impact of human capital
on economic growth, in: Procedia Economics and Fi-
nance, 22, p. 184-190. DOI: 10.1016/S2212-5671
(15)00258-0.
28. ROMER P. M., 1990, Endogenous technological
change, in: Journal of political Economy, 98 (5,
Part 2), p. S71-S102, DOI: 10.1086/261725.
29. SANCHEZ-ROMERO M., LEE R. D., PRSKAWE-
TZ A., 2018, Redistributive effects of different pen-
sion structures when longevity varies by socioeco-
nomic status in a general equilibrium setting, Popu-
lation Association of America, p. 1-56,
https://www.econstor.eu/handle/10419/203628
(1.10.2019).
30. TEIXERA A. A., QUEIROS A. S., 2016, Economic
growth, human capital and structural change: A dy-
namic panel data analysis, in: Research policy, 45(8),
p. 1636-1648, DOI: 10.1016/j.respol.2016.04.006.
31. The European Commission Database, 2019,
https://ec.europa.eu/eurostat/data/database
(21.11.2019).
32. The International Monetary Fund Database, 2019,
https://www.imf.org/en/Data (21.11.2019).
33. The OECD Data, 2019, https://stats.oecd.org/
(21.11.2019).
34. The World Bank Open Data, 2019, https://data.
worldbank.org/ (21.11.2019).
35. UDDIN G. A., ALAM K., GOW J., 2016, Population
age structure and savings rate impacts on economic
growth: Evidence from Australia, in: Economic Anal-
ysis and Policy, 52, p. 23-33, DOI: 10.1016/
j.eap.2016.08.002.
Page 12
Pasichnyi et al./Problemy Ekorozwoju/Problems of Sustainable Development 1/2021, 219-229
230