Finance Faculty Research and Publications Finance, Department of
4-1-2011
The Corporate Choice between Public Debt, BankLoans, Traditional Private Debt Placements, and144A Debt IssuesMatteo ArenaMarquette University, [email protected]
The main purpose of this study is to examine the determinants of the corporate choice between different forms of debt financing. By analyzing the most comprehensive sample of U.S. corporate debt issues to date, I find that firms that issue 144A debt have significantly lower credit quality and higher information asymmetry than firms that issue traditional non-bank private debt. Further, the study shows that traditional private placements, rather than bank loans, are the favorite private debt source for firms with good credit quality. I also show that the firm characteristics of traditional private debt issuers have significantly changed after 1990 through to 2003. My results suggest the following pecking order of debt choices which is conditional on credit quality. High credit quality firms prefer public bond offerings and small firms, with good credit quality, are more likely to issue traditional private debt. A large group of firms characterized by moderate credit quality make extensive use of bank loans and poor credit quality firms preferentially issue 144A debt.
JEL Classifications: G32; G21
Keywords: Public debt; Private debt; Bank loans; 144A debt; Capital structure I would like to thank the editor (Cheng-Few Lee), two anonymous referees, Paul Brockman, Stephen Ferris, John Howe, Brandon Julio, Mahendrarajah Nimalendran, Sarah Peck, Emre Unlu, Christopher Wikle, and seminar participants at University of Missouri and Marquette University for helpful comments and suggestions.
The Corporate Choice between Public Debt, Bank Loans, Traditional Private Debt
Placements, and 144A Debt Issues
1. Introduction
Debt is the major source of capital for U.S. firms. In 2003 the aggregate amount of
equity issued by U.S. firms was $106 billion while the aggregate amount of debt issued was $1.6
trillion, about fifteen times larger. Even after removing debt issues used to refinance old debt by
assuming a new issue growth rate of five percent as suggested by Henderson et al. (2006), the
amount of new debt issued in 2003 was approximately $460 billion.1
Moreover, in contrast to the equity market, the private debt market dominates the public
debt market in size. Of the $106 billion of equity issued in 2003, only $19 billion was private
(18%). Alternatively, of the $1.6 trillion of corporate debt issued in the same year, $1.1 trillion
was private (69%). Within the private debt market firms can choose among different
alternatives, such as bank loans, traditional private placements, and 144A issues.2
This study presents a thorough examination of the determinants of the firm choice
between all these different types of private debt and public debt by making use of the most
comprehensive sample of U.S. corporate debt issues to date. Throughout this analysis I present
novel evidence that challenges the conventional view of non-bank traditional private placements
as the source of funds for poor credit quality firms (e.g., Denis and Mihov (2003)).
Before the introduction of 144A debt in 1990, firms often placed high-yield private debt
securities to a limited group of institutional investors, usually insurance companies, with an
1 Results presented in previous studies confirm the predominance of debt over equity as source of capital for U.S. firms. For instance, Bhojraj and Sengupta (2003) report that the aggregate value of public debt issues in U.S. was $651 billion in 1996 and $1 trillion in 1998 while the value of new equity issues was $122 billion in 1996 and $126 billion in 1998. 2 This study refers to Rule 506 and regulation D private placements as traditional private placements. I report a description of non-bank private debt characteristics in Section 2.1.
1
agreement to register the securities promptly and make them tradable (Johnson (1991)).
However, the beginning of the 1990s experienced a drastic reduction of below-investment-grade
private issues. This contraction in the availability of credit in the private debt market was due to
a growing reluctance of insurance companies to invest in high-risk debt securities in a period
when low-asset quality, a change in regulatory requirements, and runs on a few insurers raised
concerns about the solvency of insurance companies (Carey et al. (1993)). Since the 144A debt
market can be easily used to issue speculative-grade debt that can be subsequently registered
(Fenn (2000)), 144A bonds might have replaced traditional private placements of low-quality,
high-risk debt.
The results of this study show that firms which preferentially issue 144A debt are
significantly different from firms that privately place debt securities without using the 144A rule.
Firms that issue 144A debt are characterized by lower credit quality and higher information
asymmetry than firms that issue traditional non-bank private debt. In addition, I show that firms
issuing traditional private placements after the introduction of the 144A rule (i.e., after 1990)
have significantly higher credit quality than firms issuing traditional private placements before
the introduction of the 144A rule. Overall, the results of this study provide suggestive evidence
that 144A debt might have replaced traditional private placements of high-risk debt after the
credit crunch in the traditional private debt market for speculative-grade debt at the beginning of
the 1990s.
Another main finding of the paper is that bank loans are not the preferred private debt
source for good credit quality firms. I find that firms with good credit quality that do not access
the public market mainly because of flotation costs and information asymmetry are more likely
to use traditional private placements rather than bank loans. This finding is consistent with the
hypothesis that traditional private debt investors might be willing to commit their capital only to
2
high credit quality firms with low risk of default since they cannot freely trade the debt securities
for at least one year from the purchasing date, and in many cases they lend personal funds to the
borrowing firm. An additional explanation for the difference in credit quality between bank
borrowers and non-bank traditional private debt issuers is related to the ability of bank debt to
potentially mitigate costs of information asymmetry better than traditional private debt. Banks
tend to maintain long-term relationships with borrowing firms and accumulate soft information
about these firms (Fama (1985), Diamond (1991)). Banks are also able to quickly renegotiate
loans and therefore could have superior ability to contain financial losses in case of borrowers’
financial distress than non-bank traditional private lenders.
Overall, the results of this study suggest the existence of a pecking order of debt choices
conditional on credit quality which presents important differences from the one reported by
Denis and Mihov (2003) who find that high credit quality firms are more likely to issue public
debt along with 144A debt). High credit quality firms prefer public bond offerings, good credit
quality firms that are not large enough to overcome the barrier created by flotation costs are more
likely to raise capital through traditional private debt offerings, a large group of firms
characterized by moderate credit quality make extensive use of bank loans, and poor credit
quality firms preferentially issue 144A debt.
As in Denis and Mihov (2003), I analyze the incremental debt issue decision. This
approach has several advantages. First, the incremental approach links the borrowing decision of
the firm with variables measured just prior to the borrowing decision allowing the analysis of the
effect of time-variation in firm characteristics on the debt choice. Second, the logistic analysis
that derives from this approach mimics the incremental managerial decisional process in the
context of capital structure decisions allowing a better assessment of the factors that influence
the corporate debt choice. Finally, the analysis of incremental debt offerings does not require the
3
assumption that the firm is observed at its optimal debt mix at all times, and it provides
meaningful results even when the incremental debt decision represents a deviation from the
optimal mix of debt claims. On the other hand, this method is not the most appropriate for
testing theories that analyze the optimal debt mix in relation to the asset mix of the firm, and
should be regarded as a complement to studies on the optimal mix of debt claims which examine
leverage instead of incremental debt choices.
This paper is organized as follows. Section 2 presents the hypotheses and describes the
institutional characteristics of non-bank private placements. Section 3 describes the variables of
interest and the sample construction process. Section 4 provides descriptive statistics and
univariate tests. Section 5 examines the firm’s choice between different types of debt in a
multivariate setting. Section 6 presents additional tests including a robustness check. Section 7
concludes with a summary and a discussion of the results.
2. The choice between private and public debt
2.1 Characteristics of non-bank private placements and the evolution of the private debt
placement market
Traditional private placements of debt securities are conducted pursuant to Section 4(2) of
the 1933 Securities Act or to Rule 506 of regulation D. Under these rules, firms can issue an
unlimited amount of securities to an unlimited number of accredited investors and up to 35
sophisticated investors.3 Firms typically place debt privately with high net worth individual
investors, private investment firms, insurance companies, and banks. Even though insurance
companies are important players in the traditional private placement market, they are not as
3 Accredited investors are investors with net worth of at least $2,500,000 or income of at least $250,000. Sophisticated investors are investors whom a company reasonably believes have adequate knowledge and experience in financial and business matters to evaluate the securities offered for sale.
4
dominant as they were before the private debt market credit crunch that took place at the
beginning of the 1990s (Carey et al. (1993)). The broker who brings issuer and investors
together is the placement agent. Placement agents are usually underwriting arms of universal
banks or private investment firms. Private offerings are conducted on a best efforts, rather than
on a firm commitment basis. The investors receive restricted securities, which cannot be sold for
at least a year.4
Another form of private debt available to firms is 144A debt. The SEC introduced Rule
144A in 1990 to promote greater foreign participation in the U.S. debt market (Chaplinsky and
Ramchand (2004)). In contrast to traditional private placements, 144A placements can be freely
traded among qualified institutional buyers (QIBs) without any holding period.5 The SEC lifted
resale restrictions with the belief that QIBs are able to independently obtain and process
information about 144A securities. Another unique characteristic of the 144A market is that
144A debt can be registered after 60 days from the issuance to be publicly traded among
individual investors. As indicated by Fenn (2000), this rule unexpectedly encouraged U.S. high-
yield issuers to participate in the private debt market. Since 144A placements can be
subsequently registered, firms that issue this kind of debt can combine the rapid issuance of
private debt with the eventual liquidity of public debt. The ability to issue debt quickly through
the Rule 144A market has eased issuance procedures for junk-rated firms. Most speculative-
rated firms do not meet the SEC requirements for shelf registration. The 144A rule provides
similar benefits to the shelf registration 415 rule without its strict requirements. High-yield
4 The holding period was two years until February 1997. 5 The following institutions qualify as QIBs. Institutions such as insurance firms or pension plans that own or invest at least $100 million in securities of nonaffiliates; banks or savings and loan (S&L) associations that have audited net worth of at least $25 million; brokers or dealers registered under the Exchange Act, acting for their own account or for that of QIBs that own and invest at least $10 million in securities of nonaffiliates; and entities whose equity holders are all QIBs.
issuers make use of the 144A rule to avoid lengthy registration requirements and subsequently
register the issue making it similar to a public security.
2.2 Debt choice determinants and empirical questions
Firms that issue public debt face significant fixed costs which consist of registration,
legal, trustee’s and accountants’ fees. Thus, small debt offerings are less likely to be public than
large offerings. Small firms, which issue smaller quantity of debt, are less likely to issue public
debt than large firms (Blackwell and Kidwell (1988), and Carey et al. (1993)).
Information asymmetry also affects a firm’s debt choice. Creditors who cannot fully
monitor the firm’s activities require a higher yield to compensate for the risk associated with the
moral hazard of asset substitution (Leland and Pyle (1977)). Firms with lower information
asymmetry are less likely to substitute at bondholders’ expense, and thus benefit from a lower
cost of debt. Firms with higher information asymmetry can partially reduce the cost of debt by
issuing debt privately (Krishnaswami et al. (1999)).
Problems associated with adverse selection are relevant for firms with high growth
opportunities since these firms can more easily substitute low–risk projects with riskier ones
(Myers (1977)). The monitoring provided by lending financial institutions reduces these
problems. Firms that have proprietary, firm-specific information (usually positive private
information on future cash flows) are characterized by higher information asymmetry and prefer
to issue private debt so as to minimize the cost associated with adverse selection (Yosha (1995),
and Hadlock and James (2002)). Firms with more growth options in their investment
opportunity set are more likely to issue private debt (Krishnaswami et al. (1999)).
6
There is evidence that the firm’s life cycle and credit quality also affect the corporate
debt choice. The close monitoring and the covenants associated with bank debt and non-bank
traditional private debt reduce the cost of debt for small firms that are early in their life cycle and
have not had the opportunity to build a reputation about their credit quality yet (Berger and Udell
(1998)). Firms in the early stages of their life cycle create credit reputation through bank loans;
this reputation is later used to access the public debt market (Diamond (1991)). Indeed firm’s
age is positively related to the probability of issuing public instead of private debt (Johnson
(1997)). Firms with high credit quality prefer public debt, firms with average credit quality tend
to borrow from banks, and firms with poor credit quality rely mostly on non-bank private debt
(Denis and Mihov (2003)).6
While controlling for all these factors, this study mainly focuses on two empirical
questions. The first empirical question is related to the introduction of 144A debt in 1990 and
the role that 144A debt has played among different corporate debt choices for US firms after its
introduction. Firms issue 144A debt without contractual obligations such as covenants or
collateral. Moreover, contrary to traditional private debt placements, 144A debt is usually
subordinated and monitoring by investors is practically non-existent. The main benefits of 144A
debt are speed of issuance due to the absence of an initial registration requirement, and high
liquidity due to the possibility to essentially convert the issue into a public bond at a later date
Fenn (2000)). Before the introduction of 144A issues in 1990, in many cases traditional private
debt securities were sold to a limited group of institutional investors, usually insurance
6 Event studies and long-term performance studies following debt placements provide complementary evidence to debt choice studies. Dichev and Piotroski (1999) report non-significant long-term returns following public straight debt issues but positive long-term returns following private debt issues. Chandra and Nayar (2008) further investigate this issue and find positive returns at the time of the announcement of private debt, but a negative long-term performance following issuance of private debt. Chang et al. (2007) show that low-quality firms can improve debt announcement returns by issuing secured debt.
7
companies, with an agreement to register the securities promptly (Johnson (1991)). Since 144A
securities work essentially in the same way, they might have replaced traditional private
placements of high-risk debt after the credit crunch in the traditional private debt market for
speculative-grade debt at the beginning of the 1990s.
According to this hypothesis, firms that preferentially issue 144A debt should be
significantly different not only from bank borrowers but also from firms that privately place debt
securities without using the 144A rule. Firms that issue 144A debt should be characterized by
lower credit quality and higher information asymmetry than firms that issue traditional non-bank
private debt.
The second empirical question concerns the quality of traditional private debt issuers in
comparison to bank borrowers. Banks are able to reduce the risk of their lending arrangements
through diversification (Diamond (1984)). Since banks entertain relationships with many
borrowing firms, even when some borrowers default, banks regularly receive enough cash from
the remaining borrowers to secure payment to lenders. In contrast, the accredited and
sophisticated investors that participate in the traditional private debt market cannot freely trade
the debt securities for at least one year from the purchasing date, and unlike banks they often
lend personal funds to the borrowing firm. As a consequence, traditional private debt investors
might be willing to commit their capital only to high credit quality firms with low risk of default.
The credit quality of bank borrowers and traditional private debt issuers might differ for
additional reasons. Bank debt potentially mitigates costs of information asymmetry better than
traditional private debt because banks tend to maintain long-term relationships with borrowing
firms and accumulate soft information about these firms (Fama (1985), Diamond (1991)). In
addition, banks are able to quickly renegotiate loans and therefore could have superior ability to
8
contain financial losses in case of borrowers’ financial distress than non-bank traditional private
lenders. Finally, most publicly-traded firms make large use of syndicated loans.7 As each bank
in the syndicate holds only a portion of the loan, the borrowing firm’s credit risk is shared among
the syndicate members. Consistent with this argument, Angbazo et al. (1998) find that leveraged
syndicated loans have lower yield spreads than other leveraged borrowing arrangements. As a
consequence, firms with lower credit quality might more easily borrow through syndicated loans
than traditional non-bank private debt.
According to this hypothesis bank loans should not be the preferred private debt source
for good credit quality firms. Smaller firms with good credit quality that prefer not to access the
public market because of high flotation costs and information asymmetry should be more likely
to use traditional private placements rather than bank loans. Section 4 and 5 present the
univariate and multivariate tests of these hypotheses.
3. Sample and variables
3.1 Sample selection and formation
I collect issue characteristics from SDC Global Issues, stock information from CRSP, and
accounting data from Compustat. Since the SDC coverage of bank loans is not complete before
1995, I only consider debt issues by non-financial U.S. firms from 1995 to 2003. The total
number of debt issues by non-financial U.S. firms during this period is 33,663. Private issues
represent 71% of the sample. Among private issues, bank loans represent the largest portion.
Out of 24,022 private issues by U.S. firms between 1995 and 2003, 14,000 (58%) are bank loans.
I then eliminate short-term debt (debt with maturity less or equal to one year), issues by
firms that are not covered by CRSP or Compustat, and issues of financial subsidiaries of 7 The majority of loans in the sample of this study consists of syndicated loans.
9
manufacturing firms (e.g., GE Mortgage Services, and GMAC). After these screenings the
sample consists of 17,499 issues and 3,532 unique firms.
Since firms often borrow from banks using multiple tranches the same day, I aggregate
all tranches into a single issue by adding up the principals of the tranches as in Gomes and
Phillips (2007). Moreover, since firms place debt securities with the same characteristics within
a limited period (Denis and Mihov (2003)), I aggregate debt issues of the same type by firm by
quarter. In related studies, Gomes and Phillips (2007) aggregate debt issues by type within each
month, Denis and Mihov (2003) aggregate within each year, and Arena and Howe (2009)
aggregate within each quarter. Aggregating by quarter reduces statistical dependency without
significantly losing statistical power.8
The principal of the aggregated debt is the sum of the principals of the single debt issues,
while the maturity and yield of the aggregated debt is the weighted average of maturities and
yields of the single issues. After this sample selection procedure, the sample consists of 2,170
firms and a total of 9,478 debt issues. I present the distribution of debt issues after 3-month
aggregation by year and type in Table 1. Private issues represent the majority of the debt issues
in the sample (78.58%). Among private issues, bank loans contribute 56.71 percent of the
sample, 144A private placements 14.60 percent, and traditional private placements 7.27 percent.
The year with the smallest amount of debt issues is 2000. Aside from 1995, 144A placements
are more numerous than traditional private placements.
To my knowledge, this sample is the largest to date among multivariate studies which
aggregate debt. By way of comparison, Denis and Mihov (2003) analyze 1,560 issues during
1995 and 1996. The sample of this study has 2,017 issues for the years 1995 and 1996. Even
after aggregating debt financings within one year as Denis and Mihov (2003), the sample 8 The main results of this study do not change if debt is aggregated by year or by month.
10
consists of 1,817 issues for 1995-1996. Moreover, the sample of this study is not only larger in
the cross-section but also across time, spanning over nine years, from 1995 to 2003.9
In addition to the main sample, in section 6 I also consider a longer time-series sample of
traditional private debt issuers from 1981 to 2003 to investigate in a univariate setting the
change in firm characteristics of traditional private debt issuers before and after the introduction
of the 144A rule. This sample consists of a total of 6,080 firm-issues, 3,220 before 1990 and
2,860 after 1990.10
3.2 Variables
Appendix A describes the variables and their sources. I use firm size and issue size as
proxies for flotation costs. I use both the firm’s market capitalization (Marketcap) and the total
assets (Assets) calculated at the end of the fiscal year preceding the issue as proxies for firm size.
I calculate the size of the issue as the principal of the debt issue (Principal) obtained by adding
the principals of the issues aggregated every quarter, as described in Section 3.1.
I calculate firm age (Age) as the number of years between the CRSP listing date and the
issue date. I use age both to test Diamond’s (1991) life cycle theory and to control for
unobservable credit risk as in Johnson (1997). 11
I use Q and capital expenditures (Capexp_ta) as proxies for growth opportunities. As in
Smith and Watts (1992), I calculate Q as the ratio of the market value of equity minus the book
9 The sample of this study is also about 12% larger than the Gomes and Phillips (2007) debt sample. The difference in size would be even larger if in this study debt were aggregated within one month as in Gomes and Phillips (2007) instead of three months. Eckbo et al. (2007) report descriptive statistics on a longitudinally larger sample. 10 This sample starts in 1981 because SDC starts full coverage of U.S. traditional private placements in that year. 11 For the t-tests and multivariate analysis I use the natural logarithm of firm size, issue size, and firm age.
11
value of equity plus the book value of assets to the book value of assets. I calculate Capexp_ta
as capital expenditures (item 128 on Compustat) divided by assets.
As in Denis and Mihov (2003) I use credit rating as a proxy for credit quality. This study
considers both the rating of the issuer and the rating of each issue since rating agencies not only
rate issuers but also single debt obligations. Issuer credit ratings are opinions on a firm’s
capacity to meet its overall financial obligations. Issue credit ratings are instead opinions of the
creditworthiness of a firm with respect to a specific financial obligation and take into account the
terms and conditions of the obligation as well as the creditworthiness of guarantors, insurers, and
the presence of other forms of credit enhancement.12 I convert ratings into numbers using the
numeric transformation of Klock et al. (2005) as reported in Appendix B. I create the issue
rating variable by converting Moody’s and S&P issue ratings reported on SDC – Global Issues
into numbers and then averaging them. In the event that only one of the two rating agencies
covers a specific issue, I use the corresponding number. To construct the issuer rating variable I
follow a similar method with the only difference that I merge the S&P ratings provided by SDC
and Compustat to augment the sample size. Overall I have 4,959 out of 9,478 issues with ratings
(52.3%), and 7,634 out of 9,478 issues with issuer ratings (80.5%).
As in Faulkender and Petersen (2006), I create an indicator variable equal to one when
neither S&P or Moody’s rate the issuing firm (Missing_rating). This indicator controls for the
firm’s access to public debt. While the other variables in this study are possible determinants of
the corporate choice among different types of debt (demand side), the Missing_rating variable
serves as a proxy for the constraints on a firm’s ability to issue public rather than private debt
(supply side).
12 Bank loans were not rated before 1995. As indicated by Yi and Mullineaux (2006), in 1995 rating agencies started rating syndicated loans.
12
As shown by Kaplan and Urwitz (1979) and Ziebart and Reiter (1992), accounting and
financial information can predict about two-thirds of the variability of credit ratings. Private
insider information that rating agencies receive from firms that solicit ratings are partly
responsible for the unexplained one-third of credit rating variability (Fairchild et al. (2009)).
Following previous studies on the explanatory power of credit ratings I consider variables that
are related to credit ratings and that proxy for interest coverage, capital structure, profitability,
size, debt subordination status, and stability.13
The interest coverage variable, Int_cov, is equal to operating income before depreciation
divided by interest expense. I calculate Leverage as total debt divided by total assets. As a
measure of profitability I calculate return on assets (ROA). I measure ROA as net income before
extraordinary items divided by total assets. As an alternative proxy of profitability, I construct
an indicator equal to one if the net income before extraordinary items is negative in the fiscal
year prior to the issue, and zero otherwise (Loss). As a measure of the subordination status of
debt, I create an indicator variable equal to one when the firm has subordinated debt outstanding,
and zero otherwise (Subord). I use fixed assets (Fixed_assets) and idiosyncratic volatility (Ivol)
as measures of stability. I calculate Fixed_assets as gross PPE divided by total assets. Ivol is the
monthly percentage idiosyncratic volatility of the firm, calculated as the standard deviation of the
residuals of the Fama and French (1993) model obtained by regressing daily returns from month
-15 to month -3 before the issue, and multiplied by the square root of 22.14 Idiosyncratic
volatility is a measure of stability of cash flows since it is strictly related to the volatility of
future expected cash flows. I use Ivol also as a proxy for information asymmetry about firm-
13 Butera and Faff (2006) provide an overview on how banks use firm characteristics to estimate credit ratings. 14 When I estimate Ivol using the market model my results do not significantly change.
13
specific information as in Krishnaswami et al. (1999). If investors and managers are equally
informed about market-wide risk, then residual volatility captures information asymmetry.
Another measure of credit quality based on accounting ratios is Altman (1977) Z. I
calculate Altman’s Z as 1.2 (Working Capital/Total Assets) + 1.4 (Retained Earnings/Total
Assets) + 3.3 (Earnings Before Interest and Taxes/Total Assets) + 0.6 (Market Value of
Equity/Book Value of Long-Term Debt) + (Net Sales/Total Assets). I create an indicator
variable equal to one when Altman’s Z is smaller than 1.81 (Altman), that is when the firm is at
risk of bankruptcy.
In addition to issue size, I consider two other issue characteristics: years to maturity and
yield spread to maturity. I calculate years to maturity of the three-month aggregated debt as the
duration weighted maturity of all the aggregated issues (Years_m). Yield spread to maturity
(Yield_m) is the offer yield spread to maturity of the 3-month aggregated debt over the Treasury
security of similar maturity.
4. Univariate analysis
4.1 Issuer and issue characteristics
Table 2 presents the means and medians of issue and firm characteristics for firms that
issue public securities, bank loans, 144A securities, and traditional private debt securities. The
mean (median) total assets of public issuers are $15,086 million ($6,434 million), while the mean
(median) market capitalization is $15,925 million ($5,185 million). Consistent with previous
studies on the corporate choice between private and public debt, the sample firms that issue
public bonds are on average larger and older than firms that issue private debt. The mean
(median) total assets of private issuers are $4,989 million ($1,063 million), while the mean
14
(median) market capitalization is $4,426 million ($731 million). Among private issuers, bank
borrowers are the smallest (mean total assets of $ 4,038 million, and mean market capitalization
of $ 3,944 million).
Public issues have an average size of $557 million, average maturity of 12.4 years, and
average yield spread to maturity of 4.8 percent. Consistent with previous studies, private issues
are smaller, have shorter maturity, and offer a greater yield. Private issues have an average size
of $377 million, average maturity of 6.1 years, and average yield spread to maturity of 6.5
percent. The average credit rating of public debt issuers and issues corresponds to BBB+ (Baa1),
while the average credit rating of private issuers and issues correspond to BB+ (Ba1) and BB
(Ba2) respectively.
Among private issuers, firms that issue 144A debt have the largest leverage, the lowest Q,
the lowest return on assets, are more likely to have posted a net loss the year preceding the issue,
have the lowest interest coverage, are the most likely to have subordinated debt outstanding and
Altman’s Z below 1.81, and are those with the lowest issuer credit ratings. These results suggest
that 144A issuers are on average lower-quality and higher-risk firms compared to other private
issuers.
4.2 Differences between issuers of different debt claims
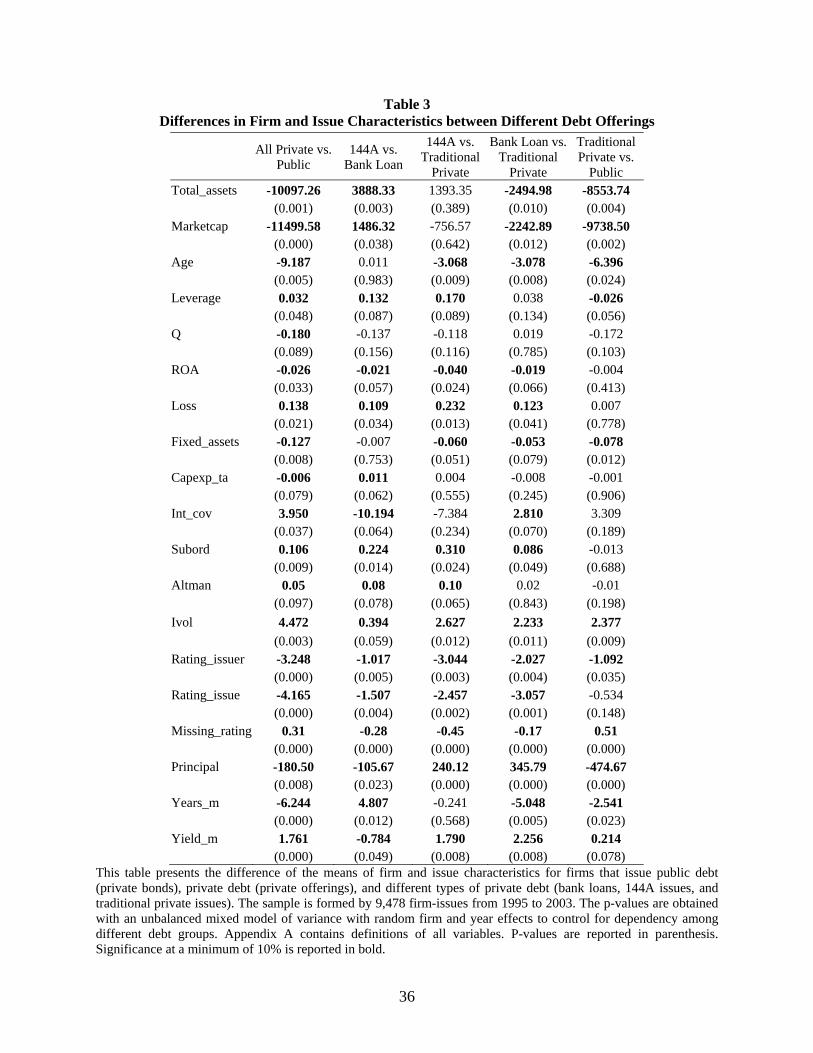
Table 3 presents a series of two sample tests between the different types of debt financing.
Since the same firm can issue different types of debt at different times, this analysis is affected
by dependency among different debt groups. To control for this dependency I calculate the p-
values of the difference of the means by way of an unbalanced mixed model of variance with
random firm and year effects.
15
Private issuers are significantly smaller, younger, have a larger proportion of debt in their
capital structure, are significantly less profitable, are more likely to have posted a net loss the
year before the placement, are more likely to have subordinated debt outstanding, are more likely
to have an Altman’s Z below 1.81, are characterized by larger information asymmetry, and have
a significant lower issuer credit rating. These results are consistent with the view that private
issuers are characterized by lower credit quality than public issuers. The two-sample tests of
issue characteristics show that private issues are significantly smaller, have shorter maturity, and
offer higher yields than public issues.
The growth opportunities measure, Q (market-to-book), is significantly larger for public
issuers. Even though this result appears to be inconsistent with Yosha (1995), it might be driven
by firms in financial distress. The market value of equity of firms in financial distress is usually
close to their book value, and therefore their Q is close to one. This result is thus consistent with
private issuers having lower quality than public issuers and corroborates the result presented in
Table 2: 144A issuers, usually high-yield issuers, are the ones with the lowest Q. An alternative
explanation for this result is related to the agency problem of free-cash flows (Jensen (1986)).
High investment firms (firms with larger Q) are not as affected by free-cash flow problems and
are less dependent on the disciplinary role of debt (Jensen (1986)). These firms will be in less
need to subject themselves to the monitoring of banks or traditional private investors to reduce
debt financing costs. Consistent with this argument, Chen and Zhao (2006) find that firms with
higher market-to-book ratios (more growth opportunities) face significantly lower public debt
costs (lower spreads), ceteris paribus.
The central column of Table 3 shows that 144A issues are significantly different from
traditional non-bank private placements across many characteristics. Firms that issue 144A debt
16
are significantly younger, with more leverage, and a lower proportion of fixed assets. More
importantly, 144A issuers have significantly lower credit quality and higher information
asymmetry than firms that issue traditional non-bank private debt. Specifically, firms that issue
144A debt are significantly more likely to have posted a net loss the year prior to the placement,
are significantly more likely to have subordinated debt outstanding, are more likely to have an
Altman’s Z below 1.81, are characterized by a significantly higher firm-specific risk (i.e.,
idiosyncratic volatility), and have a significant lower credit rating. Firms that issue 144A debt
are also more likely to have a Moody’s or S&P credit rating than traditional private debt issuers.
This result suggests that while many firms issue traditional private debt because they do not have
access to the public market, most 144A issuers intentionally choose 144A debt over public debt.
Overall, the significant differences in credit ratings and other proxies for credit quality,
such as the presence of subordinated debt and the likelihood to have posted a negative income in
the year preceding the issue, suggest the following pecking order of debt financing source by
issuer quality: (1) public bond offerings, (2) traditional private offerings, (3) bank loans, and (4)
144A placements. Issuers of traditional private placements have better credit quality than other
private issuers. Their credit quality, however, is not as good as that of public issuers. Firms that
issue traditional private debt might choose not to issue debt publicly both because of credit
quality and information asymmetry considerations and the barrier constituted by flotation costs.
Traditional private issuers are indeed on average $8,554 million smaller than public issuers and
place on average $475 million less than public issuers.
This pecking order is different from the one reported by Denis and Mihov (2003) who find
that firms that issue non-bank private placements have lower credit quality than bank borrowers.
Denis and Mihov (2003) group 144A debt and traditional private placement together. Since, as
17
shown in Table 1, 144A debt issues are more numerous than traditional private placements, it is
possible that Denis and Mihov’s result is driven by the low credit quality of 144A issuers. I
investigate this possibility in section 6.
The results of Table 3 suggest that after the credit crunch in the private placement market
(Carey et al. (1993)) and the introduction of 144A issues at the beginning of the 1990s, 144A
debt replaced traditional private debt placements for low credit quality firms. The results of
Table 3 also show that traditional private debt issuers have better credit quality than firms that
make use of bank loans. As argued by Diamond (1984), banks reduce the risk of their lending
arrangements through diversification. Alternatively, the accredited and sophisticated investors
that participate in the traditional private debt market cannot trade the debt securities for at least
one year from the purchasing date, and unlike banks they sometimes lend personal funds to the
borrowing firm. Consistent with this difference between banks and traditional private debt
lenders, the results presented in Table 3 show that traditional private debt investors are willing to
commit their capital only to high credit quality firms with low risk of default.
4.3 Credit ratings
While issuer credit ratings depend on the firm’s capacity to meet its overall financial
obligations, issue credit ratings depend also on the terms and conditions and other forms of credit
enhancement of that specific debt obligation. I analyze both types of ratings to provide
descriptive information on what form of debt firms can issue to enhance creditor protection so as
to benefit from a lower yield.
In order to compare issue ratings with issuer ratings, in this section I consider only the
4,662 debt issues for which I have information about both ratings. The average bond issuer has a
18
credit rating of 14.88 that corresponds to Moody’s Baa1, while bond issues on average have a
rating of 15.10 (Baa1). The average bank borrower has a rating of 11.38 that corresponds to
Moody’s Ba2. Bank loans have on average a rating of 11.51 (Ba2). The average 144A issuer
has a rating of 10.83 that corresponds to Moody’s Ba2, while 144A issues on average have a
rating of 10.01 (Ba3). The average private placement issuer has a rating of 14.20 that
corresponds to Moody’s Baa2, while private placements on average have a rating of 14.55
(Baa1).
Table 4 presents the pair t-tests for issue and issuer ratings by type of debt financing. The
ratings of public bonds and bank loans are significantly higher than the ratings of their issuers,
while the ratings of 144A issues are significantly lower than the ratings of their issuers. Bank
covenants and bank monitoring improve creditor protection and therefore increase the bank loan
credit rating compared to the credit rating of the borrowing firm. Conversely, firms make use of
the 144A market to rapidly issue speculative-grade bonds (Fenn (2000)). The result presented in
Table 4 is a direct consequence of the contractual differences between 144A debt and other
forms of corporate debt. As stated by Fenn (2000), in contrast to other types of private
placements and public bonds, 144A debt securities lack specific contractual terms and conditions
that firms usually put in place to decrease the probability of default and the cost of debt.
5. Multivariate analysis
5.1 Choice among different forms of debt financing
I analyze the firm characteristics that influence the firm’s choice between different forms of
debt by means of a two-stage multinomial logistic regression with year and firm random effects
to control for the longitudinal nature of my sample. As shown by Kaplan and Urwitz (1979) and
19
Ziebart and Reiter (1992), credit ratings are related to several firm characteristics that are also
important determinants of the corporate decision on the type of debt to be issued. Therefore
regressing credit ratings along with other firm characteristics would generate multicollinearity
and erroneously affect the significance of the regression coefficients. To avoid multicollinearity
I implement a two-step procedure. In the first step I regress issuer credit ratings on variables that
have been found to be related to ratings to calculate the residuals. The residual variable created
this way is highly correlated with the issuer credit rating variable, but is orthogonal to the other
explanatory variables. In the second step I estimate a random-effect multinomial logistic
regression with four dependent outcomes (public, bank, traditional private, and 144A) and the
residuals of the first regression and several firm and issue characteristics as independent
variables. The orthogonality between the rating residual variable and the other independent
variables assures a correct estimation of the coefficients in the multinomial logistic regression.15
In the second step I estimate the debt choice regression using firm and year random effects.
Firm random effects allow to control for unobserved firm cross-sectional differences while year
random effects allow to control for the longitudinal structure of the sample. The random effects
estimation uses both within and between firm variation of firm characteristics but does not treat
observations for a given firm as independent. Standard errors are adjusted to reflect the cross-
correlation between observations due to common firm components. The random effect approach
is also supported by the Hausman test which does not reject the null hypothesis that random
effects are efficient and consistent.16 To avoid dropping observations with missing ratings I
apply a method often used to avoid losing observations with missing Compustat variables (e.g.,
15 Altman’s Z is another variable that is potentially correlated to other financial accounting variables used in the regression. However, the variance inflation factor (VIF) of Altman’s Z is less than 2, revealing that there is no multicollinearity between Altman’s Z and the other independent variables. 16 The result of Hausman test suggests that the firm and year effects are uncorrelated with the independent variables, confirming that random effects is the appropriate approach.
20
Palia (2001) and Fama and French (2002)). This method consists of setting the missing ratings
to zero and introducing an indicator variable (Missing_rating) that is set to unity for the missing
observations. The variable Missing_rating also controls for the firm’s access to public markets
as in Faulkender and Petersen (2006).
Panel A of Table 5 presents the result of the OLS regression used to calculate the rating
residuals. All firm characteristics but interest coverage are significantly related to issuer credit
rating. As shown by the large value of the adjusted R-squared (0.70), variables related to firm
size, age, profitability, and stability explain a great portion of the credit rating variability. This
result is consistent with previous studies on the relation between accounting and financial
measures and credit ratings (e.g., Kaplan and Urwitz (1979)).17
Panel B of Table 5 presents the results of the multinomial logistic regressions with random
effects. Consistent with previous studies, firms that issue public debt are larger and issue a larger
amount of debt than firms that issue private debt of any type. Public issuers are also
characterized by lower information asymmetry. Consistent with Denis and Mihov (2003) public
issuers have better credit ratings than private issuers even after controlling for other firm
characteristics. Firms with larger Q are more likely to issue public debt. This result might be
driven by firms in financial distress that preferentially issue 144A debt. Another possible reason
for this result is that high investment firms (firms with larger Q) are less affected by the Jensen
(1986) free cash flow agency problem and do not need to submit to the monitoring of banks and
traditional private investors to contain debt financing costs.
Most firm characteristics related to credit quality that are significantly different between
public issuers and 144A issuers or bank borrowers (i.e., probability of bankruptcy, net loss the
17 The first-step of this analysis is an OLS regression instead of an ordinal logit because logit regressions do not provide residuals. It is important to notice that when an ordered logit is estimated instead of an OLS regression, the magnitude, sign, and significance of the coefficients are very similar to those presented in panel A of Table 6.
21
year before the issue, outstanding subordinated debt, and leverage) are not significantly different
between public issuers and firms that place traditional private debt. The lack of access to the
debt public market (measured by Missing_rating) is instead a significant determinant of the
probability of issuing traditional private debt. These results support the view that firms that
place traditional private debt securities are characterized by good credit quality and do not issue
public debt mainly because of the constraints imposed by flotation costs and information
asymmetry.
The difference between traditional private placements and 144A placements is evident in
the column that presents the coefficients of the regression that has as dependent variable the log-
odds ratio of the probability of issuing traditional private debt versus 144A debt. Firms that
place traditional private debt securities to accredited and sophisticated investors are significantly
larger but place significantly less debt. They have lower information asymmetry, are less likely
to post a net loss the year before the placement, have a significantly lower probability of
bankruptcy, have a larger percentage of fixed assets to total assets, smaller leverage, and are less
likely to have subordinated debt outstanding. Even though the two groups do not significantly
differ in the unexplained portion of credit rating, the significant coefficients suggest that these
two types of placements are significantly different and better quality firms are more likely to
issue traditional private placements.18
In unreported multinomial logit regressions I add three macroeconomic variables as
suggested by Blackwell and Kidwell (1988) and Cantillo and Wright (2000): standard deviations
18 As shown in Table 2, only 46% of the firms that issue traditional private placements are rated by either Moody’s or S&P. The lack of significance of the difference in credit rating between private issuers and 144A issuers might be caused by the absence of credit ratings for many companies that issue traditional private placements. However, missing ratings do not decrease the sample size. I avoid dropping observations with missing ratings by setting the missing ratings to zero and introducing an indicator variable (Missing_rating) that is set to unity for the missing observations (a similar approach for missing data is used by Fama and French (2002) and Palia (2001)).
22
of the daily 10-year constant maturity treasury bond rate over the 20 days prior to the issue,
aggregate intermediary earnings, and the risk-free rate. These variables are not significant while
the other variables do not change in significance when compared to the reported results.19
Table 6 presents the change in the implied probability of issuing a particular form of debt
when the value of each variable of the multinomial logistic regressions presented in Table 5
increases from the 25th to the 75th percentile (or from zero to one for indicator variables) while all
the other variables retain their median values. Firm size, measured as logarithm of total assets, is
the variable with the greatest economic significance. When firm size increases from the 25th to
the 75th percentile, the probability of issuing public debt increases by 20.6 percent while the
probability of issuing bank loans decreases by 34.3 percent. Proxies of financial distress, such as
Altman and Subord, are characterized by large implied probabilities of opposite sign for public
debt and 144A issues. The unexplained portion of credit ratings is large and positive for public
bonds and large and negative for 144A issues. An increase of the credit rating residual variable
equal to its interquartile range increases the probability of issuing public debt by 6.8 percent,
while decreases the probability of issuing 144A debt by 5.6 percent. The probability of issuing
bank loans or traditional private placements is only marginally influenced by credit rating
residuals (-0.8% and -0.4%). These results are consistent with the pecking order among different
debt claims: low-risk firms are more likely to issue public debt while high-risk firms are more
likely to participate in the 144A market.
Another economically significant variable is idiosyncratic volatility (Ivol). An increase in
idiosyncratic volatility equal to its interquartile range decreases the probability of issuing public
debt by 12.0 percent, while it increases the probability of issuing bank loans by 7.0 percent and
19 These regressions are available upon request from the author.
23
the probability of issuing 144A debt by 5.3 percent. Leverage (measured before the debt issue)
has a large influence on the probability of borrowing from banks. An increase of leverage equal
to its interquartile range, decreases the probability of issuing bank loans by 10.2 percent, while
increases the probability of issuing 144A debt by 6.9 percent. Even though Q is statistically
significant in three out of the six specifications presented in Panel B of Table 5, it has little
economic significance.
Table 6 also shows how, aside from firm size and the absence of credit rating
(Missing_rating), no issuer characteristic has economic significance on the probability to choose
traditional private placements. The low values of these implied probability changes and the large
and opposite values for public debt and 144A debt suggest that traditional private placements lie
in between public debt and other sources of private debt. This result is consistent with the
evidence presented in previous tables.
6. Additional tests and robustness check
6.1. Are the Denis and Mihov (2003) results on non-bank private debt driven by 144A issues?
The results presented in Section 5 show that traditional private debt issuers differ
significantly from 144A debt issuers. Denis and Mihov (2003) merge traditional private debt
issuers and 144A debt issuers together and show that these firms have lower credit quality than
bank borrowers. In order to verify that firms that issue 144A debt drive their result, I repeat the
regression presented in Panel B of Table 5 merging 144A and traditional private debt issuers into
the same group. The results of these multinomial regressions are presented in Table 7. The sign
and significance of the coefficients of the credit quality variables clearly show that the non-bank
private issuers (144A and traditional private debt issuers together) have lower credit quality than
24
bank borrowers consistent with Denis and Mihov (2003). The results of Table 5 and Table 7,
when interpreted jointly, show that 144A debt issuers are the main cause of the non-bank private
issuers result in Denis and Mihov (2003) and provide evidence of the different role played by
144A debt in debt markets in comparison to traditional private debt.
6.2 Suggestive evidence on the evolution in the traditional private debt market at the
beginning of the 1990s
As shown in section 5, firms that issue traditional private debt are characterized by better
credit quality than 144A debt issuers. As observed in the introduction, the implementation of
144A debt in 1990 might have created a new outlet for low credit quality firms raising debt
capital. In this section I provide suggestive evidence of this conjecture by comparing firm
characteristics of traditional private placement issuers before and after 1990 in a univariate
setting. Table 8 presents the results. With the exception of ROA, all the firm characteristics
related to credit quality of traditional private debt issuers are significantly different before and
after 1990. Firms that issued traditional private debt after 1990 have lower leverage, are less
likely to have Altman’s Z lower than 1.81, are less likely to have posted a loss in the previous
year, and are less likely to have subordinated debt outstanding than firms that issued traditional
private debt before 1990.
The results on credit ratings are a further confirmation of the change in the characteristics
of traditional private debt issuers in the wake of the 144A debt introduction. After 1990 the
average traditional private debt issuer has a credit rating of A- (15.98), compared to a credit
rating between BBB and BBB+ (14.42) before 1990. Moreover, before 1990 the majority of
rated private debt issuers are speculative grade (rated BB+ or lower) while after 1990 the
majority of rated traditional private debt issuers are investment grade. The decrease in the
25
average numbers of issues per year after 1990 offers additional support to the view that the good
credit quality of traditional private debt issuers in recent years might be due to the use of the
144A market by private debt issuers in junk status. Chandra and Nayar (2008) find that negative
long-term stock performance following the issuance of traditional private debt. The results of
this study are consistent with theirs. Their sample starts in 1981 and ends in 1999. More than
half of the debt issues in their sample predate the introduction of 144A debt in 1990.
6.3 Multinomial debt choice regressions without rating residual regression step
As described in the previous section, Panel B of Table 5 presents the results of multinomial
logit regressions that include a rating residual variable obtained by a first-step rating regression.
Denis and Mihov (2003) do not use a two-step procedure, but rather control for credit quality by
simply using a credit rating indicator variable equal to one for investment grade firms and zero
otherwise. For sake of comparability, Table 9 presents the results of multinomial logit
regressions in which the rating residual variable is substituted by the investment-grade rating
dummy. The sign and significance of the coefficients are consistent with those presented in
Table 5. The only exception is the Rating_dummy variable being positive and significant for
traditional private debt versus 144A debt. This result is consistent with the sign and significance
of the other credit quality variables both in Table 5 and Table 9.
7. Conclusions
The results of this study reexamine the conventional view of non-bank private placements
as a source of funds for poor credit quality firms. Even though the conventional view might have
26
been valid for private debt issues until the beginning of the 1990s, I show that for the sample
period considered in this study (1995-2003) the pecking order of debt choices conditional on
credit quality is different from previous studies. I found that high credit quality firms generally
prefer public bond offerings. In addition, good credit quality firms, which are not large enough to
overcome the barrier constituted by flotation costs and information asymmetry, are more likely
to raise capital through traditional private offerings. A large group of firms characterized by
moderate credit quality make extensive use of bank loans, and poor credit quality, high-risk firms
preferentially issue 144A debt.
Traditional private placements are issued on average by firms characterized by better
credit quality than bank borrowers. The introduction of the 144A debt market in 1990 has
created an outlet for speculative-grade issuers at practically the same time in which these firms
saw their traditional investors (i.e., insurance companies) shy away due to the worsening of
insurance companies’ financial conditions. A possible explanation for the evidence presented in
this study is that the credit crunch in the speculative-grade private placement market might have
shifted the traditional private placement market towards better credit quality firms with limited
access to the public debt market.
Bhojraj and Sengupta (2003; Yi and Mullineaux (2006)
27
References
Altman E (1977) The Z-Score Bankruptcy Model: Past, Present, and Future. Wiley, New York
Angbazo LA, Mei J, Saunders A (1998) Credit spreads in the market for highly leveraged transaction loans. J Bank Finance 22:1249 -1282
Arena MP, Howe JS (2009) Takeover exposure, agency, and the choice between private and public debt. J Financ Res 32:199-230
Berger AN, Udell GF (1998) The economics of small business finance: The roles of private equity and debt markets in the financial growth cycle. J Bank Finance 22:613-673
Bhojraj S, Sengupta P (2003) Effect of corporate governance on bond ratings and yields: The role of institutional investors and outside directors. J Bus 76:455-475
Blackwell DW, Kidwell DS (1988) An investigation of cost differences between public sales and private placements of debt. J Financ Econ 22:253-278
Butera G, Faff R (2006) An integrated multi-model credit rating system for private firms. Rev Quant Finance Account 27:311-340
Cantillo M, Wright J (2000) How do firms choose their lenders? Rev Financ Stud 13:155-189
Carey MS, Prowse SD, Rea JD, Udell GF (1993) The economics of the private placement market. Financ Mark Inst Instrum 2:1-66
Chandra U, Nayar NN (2008) The information content of private debt placements. J Bus Finance Account 35:1164-1195
Chang S-C, Chen S-S, Hsing A, Huang CW (2007) Investment opportunities, free cash flow, and stock valuation effects of secured debt offerings. Rev Quant Finance Account 28:123-145
Chaplinsky S, Ramchand L (2004) The impact of SEC rule 144A on corporate debt issuance by international firms. J Bus 77:1073-1097
Chen L, Zhao S (2006) On the relation between the market-to-book ratio, growth opportunity, and leverage ratio Finance Research Letters 3:253-266
Denis DJ, Mihov VT (2003) The choice among bank debt, non-bank private debt and public debt: evidence from new corporate borrowings. J Financ Econ 70:3-28
— (1991) Monitoring and Reputation: The Choice between Bank Loans and Directly Placed Debt. J Polit Econ 99:689-721
28
Dichev ID, Piotroski JD (1999) The performance of long-run stock returns following issues of public and private debt. J Bus Finance Account 26:1103-1132
Eckbo BE, Masulis RW, Norli Ø (2007) Security Offerings. in B. E. Eckbo, ed., Handbook of Corporate Finance, Elsevier
Fairchild LM, Flaherty SM, Shin YS (2009) Analysis of unsolicited credit ratings in Japan: New evidence from Moody's. Review of Pacific Basin Financial Markets and Policies 1:103-123
Fama EF (1985) What's different about banks. J Monet Econ 15:29-39
Fama EF, French KR (1993) Common risk factors in the returns on stocks and bonds. J Financ Econ 33:3-56
— (2002) Testing trade-off and pecking order predictions about dividends and debt. Rev Financ Stud 15:1-33
Faulkender M, Petersen MA (2006) Does the source of capital affect capital structure? Rev Financ Stud 19:45-79
Fenn GW (2000) Speed of issuance and the adequacy of disclosure in the 144A high-yield debt market. J Financ Econ 56:383-405
Gomes A, Phillips G (2007) Why do public firms issue private and public securities? Working Paper
Hadlock CJ, James CM (2002) Do banks provide financial slack? J Finance 57:1383-1419
Henderson BJ, Jegadeesh N, Weisbach MS (2006) World markets for raising new capital. J Financ Econ 82:63-101
Jensen MC (1986) Agency costs of free cash flow, corporate finance, and takeovers. American Economic Review 76:323-329
Johnson CJ (1991) Corporate Finance and the Securities Law. Prentice-Hall Law & Business Press, Englewood Cliffs, NJ
Johnson SA (1997) An empirical analysis of the determinants of corporate debt ownership structure. J Financ Quant Anal 32:47-69
Kaplan RS, Urwitz G (1979) Statistical models of bond ratings: A methodological inquiry. J Bus 52:231-262
Klock M, Mansi S, Maxwell W (2005) Does corporate governance matter to bondholders? J Financ Quant Anal 40:693-719
Krishnaswami S, Spindt PA, Subramaniam V (1999) Information asymmetry, monitoring, and the placement structure of corporate debt. J Financ Econ 51:407-434
Palia D (2001) The endogeneity of managerial compensation in firm valuation: a solution. Rev Financ Stud 14:735-764
Smith CW, Watts R (1992) The investment opportunity set and corporate financing dividend and compensation policies. J Financ Econ 32:263-292
Yi H-C, Mullineaux DJ (2006) The informational content of bank loan ratings. J Financ Res 29:481-501
Yosha O (1995) Information disclosure costs and the choice of financing source. J Financ Intermed 4:3-20
Ziebart DA, Reiter SA (1992) Bonds ratings, bond yields and financial information. Contemp Account Res 9:252-282
30
Appendix A: Variable definitions and sources This table lists and describes the variables ordered by source. All firm characteristics are measured for the fiscal year preceding the debt issue.
Variable Definition Source
Altman Indicator variable equal to one when Altman’s (1977) Z is smaller than 1.81. Altman's Z is calculated as 1.2 (Working Capital/Total Assets) + 1.4 (Retained Earnings/Total Assets) + 3.3 (Earnings Before Interest and Taxes/Total Assets) + 0.6 (Market Value of Equity/Book Value of Long-Term Debt) + (Net Sales/Total Assets)
Compustat
Assets Total assets of the firm expressed in millions of dollars Compustat
Capexp_ta Capital expenditures divided by total assets Compustat
Fixed_assets Fraction of fixed assets calculated as gross PPE divided by total assets Compustat
Int_cov Interest coverage calculated as earnings before interest, taxes, amortization and depreciation divided by interest expense Compustat
Leverage Total debt divided by total assets before the dent issue Compustat Lnassets Natural logarithm of Assets Compustat
Loss Indicator variable equal to one if the net income before extraordinary item is negative, and zero otherwise Compustat
Q Ratio of the market value of equity minus the book value of equity plus the book value of assets to the book value of assets Compustat
Rating_dummy Indicator variable equal to one when the firm is rated investment grade, and zero otherwise Compustat
Rating_issuer Numerical conversion (see Appendix B) of S&P and Moody’s issuer credit ratings Compustat
Rating_res See Table 6 and Table 7 headers Compustat
Missing_rating Indicator variable equal to one when the firm is not rated by S&P or Moody’s, and zero otherwise Compustat and SDC
ROA Net income before extraordinary items divided by total assets Compustat
Subord Indicator variable equal to one when the firm has subordinated debt, and zero otherwise Compustat
Age Number of years from the CRSP listing date to the offering date CRSP
31
Appendix A - Continued Variable Definition Source
Ivol Monthly percent idiosyncratic volatility three months before the issue calculated as the standard deviation of the residuals of the Fama and French (1993) model obtained by regressing daily returns from month -15 to month -3 before the issue
CRSP
Marketcap Market capitalization of the firm three months before the debt issue
CRSP
Years_m Years to final maturity of the debt issue SDC
Yield_m Yield spread to maturity of the debt issue over the Treasury security of similar maturity SDC
Principal Size of the debt offering expressed in millions of dollars SDC Public Indicator equal to 1 when the debt issue is a public bond SDC Bank Indicator equal to 1 when the debt issue is a bank loan SDC
144A Indicator equal to 1 when the debt issue is a 144A debt placement SDC
Traditional private Indicator equal to 1 when the debt issue is a traditional private placement SDC
32
Appendix B: Credit rating numerical conversions This table presents the conversion numbers of Moody’s and S&P ratings used in this study for both univariate and multivariate analyses.
Conversion Number
Moody's Ratings
S&P Ratings
22 Aaa AAA 21 Aa1 AA+ 20 Aa2 AA 19 Aa3 AA- 18 A1 A+ 17 A2 A 16 A3 A- 15 Baa1 BBB+ 14 Baa2 BBB 13 Baa3 BBB- 12 Ba1 BB+ 11 Ba2 BB 10 Ba3 BB- 9 B1 B+ 8 B2 B 7 B3 B- 6 Caa1 CCC+ 5 Caa2 CCC 4 Caa3 CCC- 3 Ca CC 2 C C 1 D D
This table reports long-term debt issues from 1995 to 2003 for U.S. non-financial firms covered by both CRSP and Compustat. I aggregate offerings of the same type every three months. “Traditional Private” consists of traditional private placements to accredited and sophisticated investors.
34
Table 2
Descriptive Statistics – Firm and Issue Characteristics
This table presents the means (medians) of firm and issue characteristics of firms that issue public debt (public bonds), private debt (private offerings), and different types of private debt (bank loans, 144A issues, and traditional private issues). The sample is formed by 9,478 firm-issues from 1995 to 2003. Appendix A contains definitions of all variables.
35
Table 3 Differences in Firm and Issue Characteristics between Different Debt Offerings
This table presents the difference of the means of firm and issue characteristics for firms that issue public debt (private bonds), private debt (private offerings), and different types of private debt (bank loans, 144A issues, and traditional private issues). The sample is formed by 9,478 firm-issues from 1995 to 2003. The p-values are obtained with an unbalanced mixed model of variance with random firm and year effects to control for dependency among different debt groups. Appendix A contains definitions of all variables. P-values are reported in parenthesis. Significance at a minimum of 10% is reported in bold.
36
Table 4 Difference between issue and issuer ratings – Univariate analysis
Security Mean St Dev t-stat p-value N Public 0.22 1.98 4.73 <0.001 1836 Loan 0.16 1.33 4.50 <0.001 1429 144A -0.95 2.30 -12.95 <0.001 1313 Traditional Private 0.24 1.73 1.26 0.212 84
This table presents pair t-tests between issue and issuer ratings by issue type (public bonds, bank loans, 144A debt placements, and traditional private placements). I obtain the numerical rating by using the conversion scheme presented in Appendix B and averaging Moody’s and S&P ratings for companies covered by both rating agencies. Significance at a minimum of 10% is reported in bold.
37
Table 5
Two-Step Multinomial Logistic Regressions of Sources of Debt
Panel A: OLS regression to calculate rating residuals (Rating_res)
Panel A presents the results of an OLS regression in which the dependent variable is Rating_issuer, the numerical credit rating obtained by using the conversion scheme presented in Appendix B and averaging issuer ratings offered by Moody’s and S&P. Panel B presents the results of six multinomial logistic regressions with firm and year random effects in which the dependent variables are the log-odds ratio of the probability of issuing (1) public bonds versus 144A issues, (2) bank loans versus 144A issues, (3) traditional private debt versus 144A issues, (4) public bonds versus bank loans, (5) traditional private debt versus banks loans, and (6) public bonds versus traditional private placements. Rating_res are the residuals of the OLS presented in Panel A. Appendix A contains definitions of all other variables. P-values are reported in parenthesis. Significance at a minimum of 10% is reported in bold.
39
Table 6 Economic Significance of the Multinomial Logit Coefficients
This table presents changes in probability of issuing public bonds, bank loans, 144A issues, and traditional private debt implied by the multinomial logit presented in Panel B of Table 5. The change in probability is calculated by assuming that the value of each variable increases from the 25th to the 75th percentile (or from zero to one for indicator variables) while all the other variables retain their median values. Rating_res are the residuals of the OLS regression presented in Panel A of Table 5. Appendix A contains definitions of all other variables. P-values are reported in parenthesis.
40
Table 7
Multinomial Logistic Regressions of Sources of Debt when 144A Debt Issuers and Traditional Private Issuers are Considered Jointly
This table presents the results of three multinomial logistic regressions with firm and year random effects in which the dependent variables are the log-odds ratio of the probability of issuing (1) public bonds versus non-bank private debt issues, (2) bank loans versus non-bank private debt issues, and (3) public bonds versus bank loans. Rating_res are the residuals of the OLS presented in Panel A of Table 5. Appendix A contains definitions of all other variables. P-values are reported in parenthesis. Significance at a minimum of 10% is reported in bold.
41
Table 8 Characteristics of traditional private issuers before and after 1990
This table presents two samples t-tests and a chi-square test for firm characteristics related to credit quality of firms which issued traditional private debt before and after 1990. Appendix A contains definitions of all the variables.
42
43
Table 9
Multinomial Logistic Regressions of Sources of Debt with Investment-Grade Rating Indicator Variable
This table presents the results of six multinomial logistic regressions with firm and year random effects in which the dependent variables are the log-odds ratio of the probability of issuing (1) public bonds versus 144A issues, (2) bank loans versus 144A issues, (3) traditional private debt versus 144A issues, (4) public bonds versus bank loans, (5) traditional private debt versus banks loans, and (6) public bonds versus traditional private placements. Appendix A contains definitions of all other variables. P-values are reported in parenthesis. Significance at a minimum of 10% is reported in bold.