1 The Corporate Social Responsibility of Chinese Corporations Ye Cai, Carrie Pan, and Meir Statman Leavey School of Business Santa Clara University November 1, 2012 Abstract Why are levels of CSR among Chinese companies so low relative to levels in both developed and developing countries? We answer this question in an exploration of factors associated with CSR, including levels of economic development, institutions, and culture. We find that low CSR is generally associated with low income-per-capita, high corruption, low civil liberties and political rights, low harmony, low egalitarianism, low autonomy, low individualism, and high power distance. China’s level of economic development, institutions, and culture dispose it toward low CSR. We thanks MSCI, and especially Sebastian Brinkmann, for the MSCI data
Transcript
1
The Corporate Social Responsibility of Chinese Corporations
Ye Cai, Carrie Pan, and Meir Statman Leavey School of Business
Santa Clara University
November 1, 2012
Abstract
Why are levels of CSR among Chinese companies so low relative to levels in both
developed and developing countries? We answer this question in an exploration of factors
associated with CSR, including levels of economic development, institutions, and culture. We
find that low CSR is generally associated with low income-per-capita, high corruption, low civil
liberties and political rights, low harmony, low egalitarianism, low autonomy, low individualism,
and high power distance. China’s level of economic development, institutions, and culture
dispose it toward low CSR.
We thanks MSCI, and especially Sebastian Brinkmann, for the MSCI data
2
3
1. Introduction
We know much about corporate social responsibility (CSR) in the United States and most
other developed countries, but we know little about CSR in developing countries, such as China.
Yet payoffs from improving CSR in China might well exceed payoffs from improving CSR in
developed countries.
China has enjoyed a rapid economic growth over the last thirty years, surpassing Japan to
become the second largest economy in the world. China’s GDP, adjusted for inflation, had risen
from RMB 362 billion in 1978, at the start of the reform period, to RMB 40 trillion in 2010. Yet
China’s economic development is often accompanied by images of poor business practices. The
growing number of business scandals, such as overworked and underpaid employees, worker
suicides, faulty consumer products, toxic emissions and water pollution, highlight the urgency of
promoting corporate social responsibility beyond financial bottom lines.
We compare CSR levels of Chinese companies to CSR levels of companies from both
developed countries, such as the U.S., U.K., and Japan, and developing economies in East Asia,
such as South Korea, Hong Kong, and Taiwan. We find that Chinese companies exhibit lower
levels of CSR than those from both developed and developing economies. We explore the
determinants of CSR levels and the possible reasons for the relatively low levels of CSR among
Chinese companies.
Income is relatively low in China and we find that low income is associated with low
CSR. Corruption is relatively high in China and we find that high corruption is associated with
low CSR. Culture is also associated with CSR. Harmony, egalitarianism, autonomy, and
individualism are four dimensions of culture and their levels in China are relatively low. We find
that low levels of harmony, egalitarianism, autonomy, and individualism are associated with low
4
levels of CSR. Power distance is another dimension of culture, and its level in China is relatively
high. We find that high levels of power distance are associated with low levels of CSR. Levels of
civil liberties and political rights are relatively low in China and we find that low levels of civil
liberties and political rights are associated with low levels of CSR.
Campbell (2007) points out that “socially responsible corporate behavior may mean
different things in different places to different people and at different times.” Recent empirical
evidence supports this view. For example, Maignan and Ralston (2002) report systematic
differences in perceptions of CSR in France, Netherlands, UK, and US. Xu and Yang (2010)
draw similar conclusions from their survey of CEOs of Chinese companies. They report that
while perceptions of the importance of some CSR features, such as economic responsibility,
legal responsibility, environmental protection, customer orientation, employee relations, and
charitable donations, are similar among Chinese CEOs and CEOs in the western world,
perceptions of the importance of other features, such as national employment rate, ethics, and
social stability, are higher among Chinese CEOs than among CEOs in the western world.
Moreover, some CSR features that are important in the western world, such as shareholders’
rights, are not considered important by Chinese CEOs.
Variations in country-specific economic development, culture, and institutions likely
contribute to such differences. Campbell (2007) argues that institutional factors play an
important role in corporate social behavior. These factors include public and private regulation,
the presence of nongovernmental and other independent organizations that monitor corporate
behavior, institutionalized norms of appropriate corporate behavior, associations among
corporations, and organized dialogues among corporations and their stakeholders. Ioannou and
5
Serafeim (2012) observe that companies’ corporate social performance is related to the political,
labor, education, and cultural systems of their countries.
Culture is expressed in behavior, including economic behavior. For example, Guiso,
Sapienza, and Zingales (2008) found that people are more likely to invest in the stock market in
countries where trust is high than in countries where it is low. Culture can promote socially
responsible corporate behavior or hinder it. Confucian principles, deeply embedded in Chinese
culture, contain aspects of modern CSR. Wang and Juslin (2009) note that Chinese prescriptions
for responsible business behavior are longstanding, tracing them back to Confucius’ time, in 500
B.C. Confucian values, such as righteousness, sincerity, morality, fairness, and benevolence, are
respected in China, even if such values might have been sacrificed for profits during the recent
decades.
Furthermore, Lin (2010) notes that the 1994 Chinese company law, drafted before
discussions about CSR were prominent in the western world, reflects emphasis on the interests of
workers, as workers have always had a strong representation in the national and local people’s
congress under the Chinese socialist model. Indeed, the Constitution of the People’s Republic of
China recognizes the importance of workers. The 1994 Company Law requires companies to
include employee representatives on the board, to consult with trade unions and employees when
making decisions concerning employees’ interests, and to protect the legal rights of employees
(Lin 2010).
The 2006 Chinese Company Law explicitly requires companies to “undertake social
responsibility” while conducting business (Lin 2010). Environmental disclosure has drawn
special attention from the Chinese government. In 2008, the State Environmental Protection
Administration (SEPA), the main national regulatory agency of environmental issues,
6
promulgated a substantial number of environmental regulations and standards. In the same year
China also launched the Ministry of Environmental Protection, which takes the responsibility for
environmental governance from SEPA. The two Chinese stock exchanges have also released
guidelines on social responsibility for listed companies since 2006. Similar changes also took
place at the provincial level.
Campbell (2007) argues that “corporations will be more likely to act in socially
responsible ways if there are strong and well-enforced state regulations in place to ensure such
behavior.” Regulations have been closely linked to changes in corporate behavior in the U.S. and
Europe and regulatory changes are likely to improve CSR in China. Regulations need not reduce
competitive advantage. Campbell points out that Finland, Sweden, and Denmark are among the
most competitive economies in the world, yet they all operate under strong state regulation, self-
regulation, and corporatist bargaining that promote socially responsible behavior.
Communications between companies and community members such as investors,
consumers, NGOs, and other community organizations can also affect corporate behavior
(Campbell 2007). While current CSR in China is in flux and largely discretionary (Yin and
Zhang 2012), CSR draws the attention of Chinese consumers. Ramasamy and Yeung (2008)
found in surveys conducted in Shanghai and Hong Kong that Chinese consumers support CSR
more than consumers in Europe and the United States. Ramasamy and Yeung did not investigate,
however, whether Chinese investors consider CSR in their investment decisions. Incorporation
of CSR in the investment decisions of Chinese investors is likely to increase in the future, as
socially responsible investing (SRI) emerges in China. The first SRI index was launched by the
Shenzhen Securities Information Company and Tianjin Teda Company in early 2008, followed
by the “Responsibility Index” launched a year later by the Shanghai Stock exchange (Lin 2010).
7
2. Hypotheses Development
2.1 Economic development and CSR: Companies in countries with relatively low levels of
income-per-capita display relatively low levels of CSR
Countries vary greatly in economic development. Monaco was the richest country in
2010, with a per capita income of $197,460, while Burundi’s per capita income was only $160.
CSR is often expensive and higher profits generated by higher levels of CSR do not always cover
its costs (Kim and Statman 2012). For example, while it is possible to replace coal-burning
power plants with wind-powered turbines, such replacement is expensive and more likely to
reduce the profits of power-generating utilities rather than increase them, especially in the short-
run. Clean air and human rights might well be luxuries in countries that lack food and other basic
necessities. Therefore, we hypothesize that companies in countries with relatively low levels of
economic development display relatively low levels of CSR.
2.2 Corruption and CSR: Companies in countries with relatively high levels of corruption
display relatively low levels of CSR
Companies interact with governments in complying with regulations, lobbying, and
negotiating business practices, such as CSR. Companies are tempted to engage in illegal or
unethical behavior as it often reduces costs and enhances profits. Deterrence from such behavior
is weak in countries with rampant corruption, as punishment is light. Therefore, we hypothesize
that companies in countries with relatively high levels of corruption display relatively low levels
of CSR.
2.3 Cultural Values and CSR
8
Harmony: Companies in countries with relatively low levels of harmony display relatively low
levels of CSR
Schwartz (1999) identifies Harmony as a cultural dimension that relates people to the
natural and social world. According to Schwartz, Harmony is “a cultural emphasis on fitting
harmoniously into the environment (unity with nature, protecting the environment, world of
beauty).” People in harmonious societies try to appreciate and fit into the world rather than to
change or exploit it. Mastery, at the opposite end from Harmony, encourages active self-assertion
in order to master, direct, and change the natural and social environment to attain group or
personal goals (Schwartz 1999). We hypothesize that companies in more harmonious countries
exhibit higher levels of CSR, especially the environmental aspect of CSR.
Egalitarianism: Companies in countries with relatively low levels of egalitarianism display
relatively low levels of CSR
Egalitarianism is another culture dimension reflecting the way societies promote
responsible behavior. Egalitarian cultures “induce societal members to recognize one another as
moral equals who share basic interests as human beings. People are socialized to internalize a
commitment to cooperate and to feel concern for everyone's welfare. People are expected to act
for the benefit of others as a matter of choice” (Schwartz 1999). Hierarchy is at the opposite end
from Egalitarianism. Schwartz writes that hierarchy cultures “rely on hierarchical systems of
ascribed roles to insure responsible, productive behavior. They define the unequal distribution of
power, roles, and resources as legitimate and even desirable. People are socialized to take the
hierarchical distribution of roles for granted, to comply with the obligations and rules attached to
their roles, to show deference to superiors and expect deference from subordinates.” People in
egalitarian cultures are more likely to demand that companies demonstrate CSR, treating their
9
employees well and, more generally, promoting and protecting human rights. Therefore, we
hypothesize that companies in countries with relatively low levels of egalitarianism display
relatively low levels of CSR.
Autonomy: Companies in countries with relatively low levels of autonomy display relatively
low levels of CSR
Our third cultural dimension concerns the nature of the relation between individual and
the group. Autonomy is at one end of this dimension. Schwartz (1999) writes that “In autonomy
cultures, people are viewed as autonomous, bounded entities. They are encouraged to cultivate
and express their own preferences, feelings, ideas, and abilities, and to find meaning in their own
uniqueness.” He distinguishes two types of autonomy: intellectual autonomy which “encourages
individuals to pursue their own ideas and intellectual directions independently,” and affective
autonomy, which “encourages individuals to pursue affectively positive experience for
themselves.” Embeddedness is at the other end of this dimension. Schwartz writes: “In
embeddedness cultures, people are viewed as entities embedded in the collectivity. Meaning in
life is expected to come largely through social relationships, through identifying with the group,
participating in its shared way of life, and striving toward its shared goals. Embedded cultures
emphasize maintaining the status quo and restraining actions that might disrupt in-group
solidarity or the traditional order.” CSR is more likely to flourish in autonomous cultures where
people are willing to speak up and demand their rights, even when such demands disturb the
status-quo and disrupt social order. Therefore, we hypothesize that companies in countries with
relatively low levels of autonomy display relatively low levels of CSR.
Individualism: Companies in countries with relatively low levels of individualism display
relatively low levels of CSR
10
The fourth cultural dimension we consider is Individualism. Hofstede (1980) defines
Individualism as “a preference for a loosely-knit social framework in which individuals are
expected to take care of themselves and their immediate families only.” At the opposite end is
Collectivism which, in Hofstede’s words, “represents a preference for a tightly-knit framework in
society in which individuals can expect their relatives or members of a particular in-group to
look after them in exchange for unquestioning loyalty.” Individualism is related to Autonomy in
that they both capture the relation between an individual with others in the society. They differ in
the definition of the others. Individualism measures the way individuals treat their families and
in-groups differently from the way they treat the rest of the society, whereas Autonomy does not
differentiate family and in-groups from the rest of society.
Individualism positively correlates with income-per-capita, but the causality is unclear.
De Waal’s (1996) description of the “floating pyramid” is consistent with individualism fostered
by income-per-capita. The pyramid has the self on top, family and clan below it, followed by
community, tribe or nation, all of humanity, and all life forms, such as animals. Resources,
reflected in income, affect the pyramid’s buoyancy. When income is low, loyalty to family and
clan dominates concerns about community, tribe or nation, all of humanity, and all life forms.
Higher income expands “moral inclusion” to community, tribe or nation, all of humanity, and all
life forms. Nepotism is more rampant in collectivistic cultures, as people direct their resources
toward family and clan, caring little about the larger community. Nepotism is relatively rare in
individualist cultures where people care about the larger community almost as much as they care
about their family and clan.
We expect people in individualistic cultures to be more likely to press for CSR than
people in collectivistic countries. Consider the global warming, as one example. People in
11
individualistic cultures are likely to care about the harm global warming might do to them and
their families, but they are also likely to care about the harm global warming might do to
humanity. Therefore, they are likely to engage in activities that mitigate global-warming, even if
the activities that benefit humanity are costly to themselves and their families, such as driving
hybrid cars, paying for carbon offsets, and pressing companies to mitigate global warming.
People in collectivistic culture are less likely to engage in such activities. Similarly, people in
individualistic countries are more likely to press for human rights, even in distant nations, than
people in collectivistic countries. Therefore, we hypothesize that companies in countries with
relatively low levels of individualism display relatively low levels of CSR.
Ioannou and Serafeim (2012) also hypothesize a positive relation between Hofestede’s
individualism and CSR, but we argue that they misidentify Hofstede’s measure of individualism.
They write that “societies characterized by high levels of individualism typically allow for a
larger margin of individual initiative and are more willing to tolerate unilateral decision-making.
In countries with low levels of individualism, the members of society form expectations that
decision-making processes will be broader, more participatory and more consultative.” This
description of individualism resembles Schwartz’s description of the cultural dimension of
autonomy, where people are “encouraged to cultivate and express their own preferences, feelings,
ideas, and abilities, and to find meaning in their own uniqueness.” Earlier, we have hypothesized
that companies in countries with relatively low levels of autonomy display relatively low levels
of CSR.
Power distance: Companies in countries with relatively high levels of power distance display
relatively low levels of CSR
12
Our fifth cultural dimension is Power Distance, also identified by Hofstede (1980).
Power distance, according to Hofstede, “expresses the degree to which the less powerful
members of a society accept and expect that power is distributed unequally. The fundamental
issue here is how a society handles inequalities among people. People in societies exhibiting a
large degree of power distance accept a hierarchical order in which everybody has a place and
which needs no further justification. In societies with low power distance, people strive to
equalize the distribution of power and demand justification for inequalities of power.”
High power distance can guide corporate executives toward high CSR as they recognize
their obligation to stakeholders and society more broadly; high power distance may also guide
corporate executives away from CSR as it allows them to pursue their own interests with no
regard to stakeholders and society more broadly. Ioannou and Serafeim (2012) find a
significantly negative relation between power distance and CSR. High power distance is also
associated with high corruption (Getz and Volkema 2001; Davis and Ruhe 2003), suggesting that
corporate executives are more likely to exploit stakeholders and society more broadly than to
support them. Therefore, we hypothesize that companies in countries with relatively high power
distance display relatively low CSR.
2.4 Civil liberties and political rights: Companies in countries with relatively low levels of
civil liberties and political rights display relatively low levels of CSR
People in countries with strong civil liberties and political rights are free to express their
CSR concerns, such as environmental degradation, and press for their CSR rights, such as
employee rights. People in countries with weak civil liberties and political rights are not as free
to express their concerns and press for their rights. Marquis and Toffel (2012) find that
companies in societies with weak civil liberties and political rights are more likely to engage in
13
selective disclosure of environmental impacts to mask their CSR shortcomings. Strong civil
liberties and political rights empower people to voice their CSR concerns. Therefore, we
hypothesize that companies in countries with relatively weak civil liberties and political rights
display relatively low levels of CSR.
3. Sample and Data Description
We employ data on the CSR attributes of environmental, social, and governance (ESG)
scores of companies from the MSCI ESG Intangible Value Assessment (IVA) database. It
measures companies’ risks and opportunities arising from ESG attributes. MSCI identifies five
ESG key issues of each industry, defined as “an environmental and/or social externality that has
the potential to become internalized by the industry or the company.” Each key issue is then
assigned a weight, determined by its importance in the industry. Companies’ information on
these key issues is collected, primarily from public sources, and evaluated. Each company is
assigned a score for each of the key issues based on its risk exposure and its performance in
managing its exposures relative to the best practice in the industry. The final score is determined
by the weighted average of the key issue scores, and normalized within its corresponding
industry. A higher score in the rating indicates better industry-adjusted performance. Each
company also receives a letter rating, based on its final score, ranging from the best (AAA) to the
worst (CCC). We collect both the overall IVA rating as well as the sub-ratings on environmental
and social attributes. In the later analyses, we convert these ratings into numerical scores where 1
corresponds to a CCC rating and 7 corresponds to an AAA rating.
Our version of the MSCI IVA database includes more than 1,800 global companies
during 2007-2011, representing approximately 96% of the market cap of the MSCI World Index.
14
To verify that our results are not due to countries with extremely small number of companies, we
include only countries with at least five companies in the MSCI IVA database. Our final sample
consists of 2,807 companies from 36 countries.1 Table 1 reports the number of companies and
the number of company-year observations for each country in our sample. The U.S. has the
largest number of companies (807) in our sample, followed by Japan (367) and the U.K. (347). A
substantial number of companies are from Europe, Australia, Canada, and Hong Kong. This
large cross-section of countries allows us to explore the impact of economic development,
culture, and institutional factors on CSR. To address the difference in coverage across countries,
we compute the median values of CSR across all firms for each country, and use these country
medians in our regression analysis.
[Insert Table 1 here]
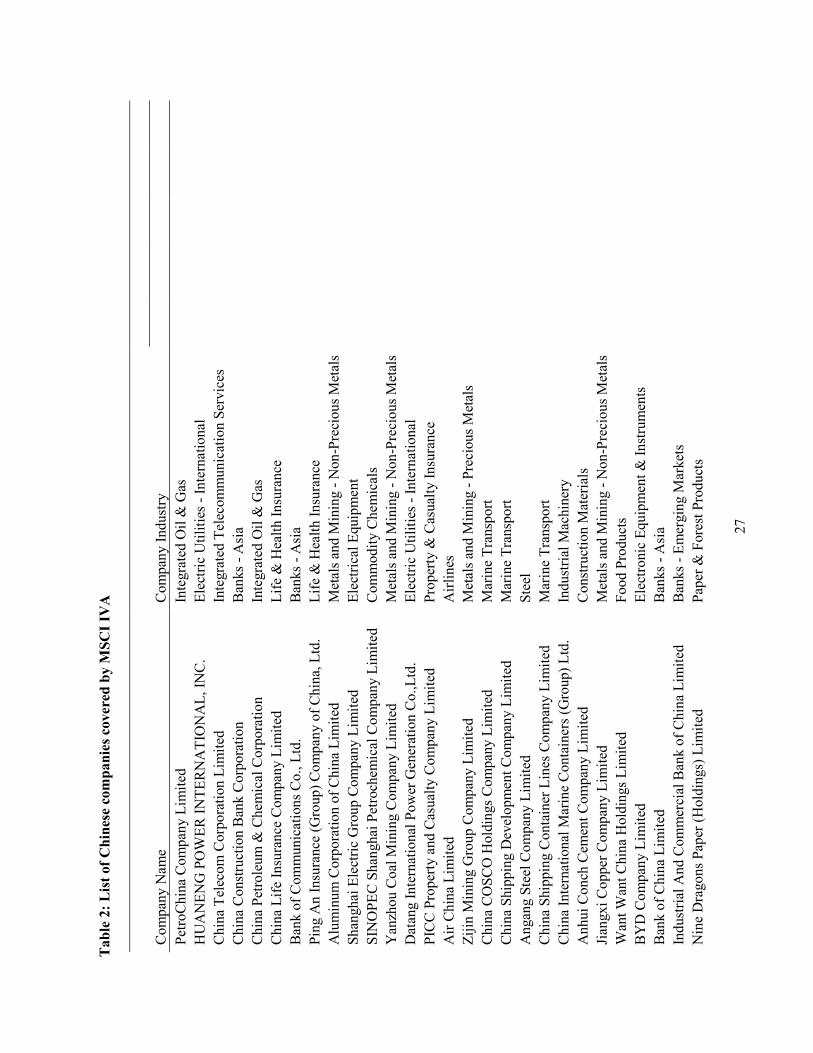
Our sample includes 38 Chinese companies. The coverage of Chinese companies is
typical to the coverage of companies in other countries in the MSCI IVA database – twenty of
the 36 countries in our sample have fewer companies than China. Our sample of Chinese
companies includes the largest companies, mostly in the banking and insurance, construction,
transportation, and mining industries. Table 2 presents these companies and their corresponding
industries.
[Insert Table 2 here]
We employ country-level data from several sources. For each country, we obtain income-
per-capita for the year 2010 from the World Bank as a proxy for country wealth and economic
development. We measure the corruption level and law enforcement of a country by the
1 Our baseline results are robust if we use a minimum ten firm cutoff benchmark instead of five.
15
Corruption perception index from Transparency International. 2 We include the scores of
Harmony, Egalitarianism, Intellectual Autonomy, and Affective Autonomy from Schwartz (1999),
as well as the scores of Power distance and Individualism from Hofstede (1980). Higher scores
indicate that the culture values are more oriented towards harmony, egalitarianism, autonomy,
high power distance, and individualism. We obtain ratings of civil liberties and political rights
from the Freedom in the World 2010 report (Freedom House 2010).3 Our measure of Civil
liberties political rights is the average of civil liberties ratings and political rights ratings.
Table 3 shows that the IVA ratings are significantly correlated with all the country-level
variables. Companies display higher CSR in countries that are wealthier, exhibit lower
corruption, greater civil liberties and political rights, and have cultures of harmony,
individualism, and egalitarianism. We also study two components of the IVA rating – the
Environmental rating, which is based on key factors related to protecting the environment, such
as carbon emissions or biodiversity and land use, and the Social rating, which is based on key
factors related to social issues, such as labor management or privacy and data security.
Interestingly, we find that these two distinct components are highly correlated with a coefficient
of 0.94, suggesting that companies addressing environmental issues well also behave more
responsibly on social issues.
[Insert Table 3 here]
Country-level variables are correlated with each other. The level of economic
development, measured by the natural logarithm of income-per-capita, is highly correlated with
all institutional and cultural dimensions except Harmony. The correlation coefficients range from
2 Every year, Transparency International ranks countries on a scale from zero (highly corrupt) to ten (highly clean). Higher values of Corruption perception index are associated with less corruption. 3 Based on annual surveys of the state of global freedom as experienced by individuals, each country is assigned a numerical rating on a scale of 1 to 7, where a rating of 1 indicates the highest degree of freedom and 7 the lowest level of freedom. Higher values of Civil liberties political rights are associated with less freedom.
16
-0.61 between income and Civil liberties and political rights, and 0.83 between income and the
Corruption perception index. Correlations among cultural dimension and institutional features
are also high. For example, the correlation between Individualism and Power distance is -0.68
and the correlation between Egalitarianism and Harmony is 0.64. This makes it difficult to
distinguish relations from one another.
4. Empirical Results
4.1 CSR levels of Chinese companies
We compare CSR levels in Chinese companies to CSR levels of companies in other
countries. We use two groups of companies as benchmarks: companies from three developed
countries, the U.S., the U.K., and Japan; and companies from three developing countries in East
Asia, South Korea, Hong Kong, and Taiwan. Table 4 reports significantly lower CSR levels
among Chinese companies relative to companies in both benchmark groups. The average overall
IVA rating of Chinese companies is 1.77 (somewhere between a CCC and CC rating),
significantly lower than U.S.’s 3.47, U.K.’s 4.54, and Japan’s 4.10. CSR levels in Chinese
companies are also significantly lower than levels in the three East Asian developing countries.
Both environmental ratings and social ratings contribute to the poor overall CSR levels in
Chinese companies. The pattern is the same in eight subcategories – strategic governance, human
environmental management capacity, and environmental opportunity factors.
[Insert Table 4 here]
4.2 Determinants of CSR levels
17
Why are CSR levels in Chinese companies so low relative to levels in other countries?
We find some answers in tests of the hypotheses presented in Section 3.
Economic development and CSR
We hypothesize that levels of CSR are relatively low in developing countries. We
measure the level of economic development in a country by its income-per-capita. Table 5
Column 1 shows that, consistent with our hypothesis, CSR levels are relatively high in countries
with incomes are relatively high. Variation of income explains as much as 28.5 percent of
variation in CSR levels. China is still a relatively poor country today, despite its rapid economic
growth in the last few decades. China ranked 121 in the world in 2010, with an income-per-
capita of $4,260. China’s low income contributes to the relatively low CSR levels in Chinese
companies.
[Insert Table 5 here]
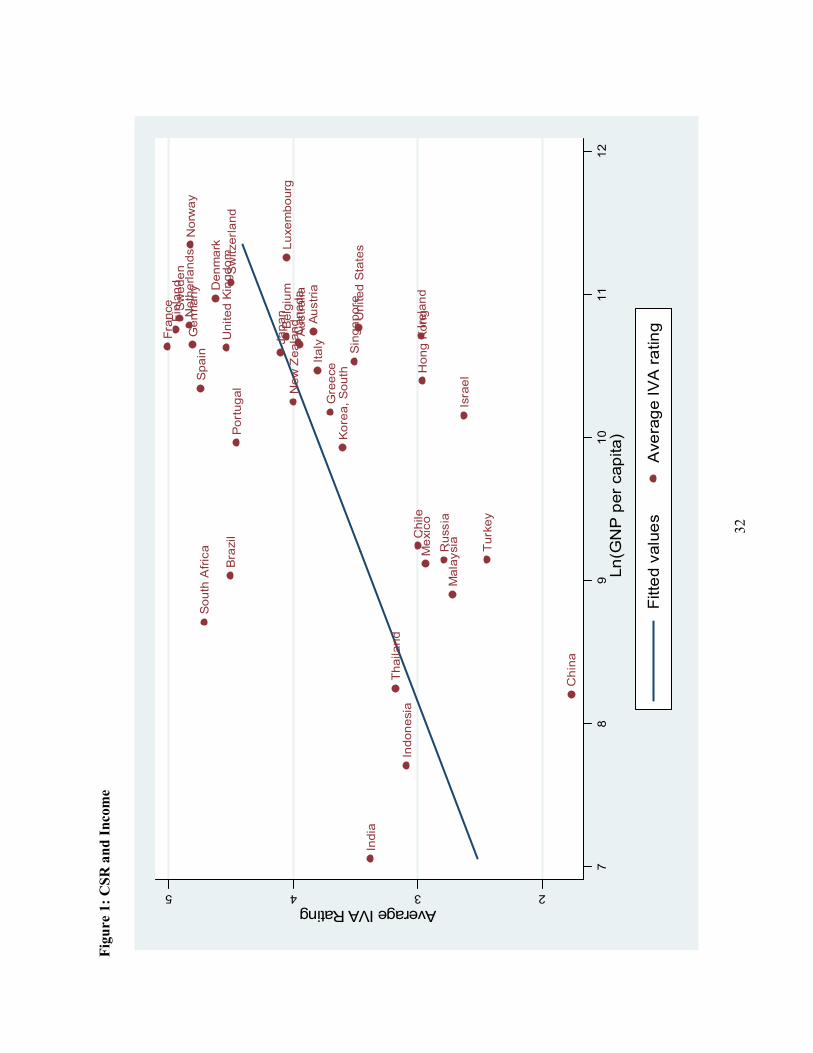
Moreover, CSR levels of Chinese companies are lower than CSR levels of companies in
other countries even when we adjust for differences in income. Figure 1 presents CSR levels in
countries and their income. The line represents the predicted level of CSR for a given level of
income. Income is a good predictor of CSR levels in Japan, Belgium, and Thailand. Income,
however, is not a good predictor of CSR levels in China, France, Sweden, and the U.S.,
suggesting that factors other than income play important roles as well. CSR levels in France and
Sweden are higher than predicted by their incomes, whereas CSR levels in the U.S. and
especially in China are lower than predicted by their incomes.
[Insert Figure 1 here]
Corruption and CSR
18
We hypothesize that levels of CSR are relatively low in countries with relatively high
levels of corruption, as companies find it cheaper to skirt CSR rather than embrace it. Consistent
with this hypothesis, we find that relatively high levels of corruption are associated with
relatively low levels of CSR (Table 3).
Corruption perception scores are highly correlated with income, indicating that
corruption is relatively high in countries where income is relatively low. This high correlation
makes it difficult to distinguish the relation between CSR and income from the relation between
CSR and corruption. Indeed, statistical significance disappears when both income and corruption
are placed as independent variable in a regression where CSR is the dependent variable (Table 5
Column 2).
The level of corruption in China is relatively high. The corruption perception score of
China in 2010 was 3.5, compared with an average of 6.5 in all sample countries. Corruption in
China is much higher than in the U.S. (7.1), U.K. (7.6), Japan (7.8) and Taiwan (5.8). Only four
of our 36 sample countries are perceived as more corrupt than China.
Harmony and CSR
We hypothesize that levels of CSR are relatively low in countries with relatively low
levels of harmony, and this is what we find. The correlation coefficient between the two is 0.50
(Table 3). The coefficients of both Income and Harmony are statistically significant when we
include both in a regression where CSR is the dependent variable, indicating that Income and
Harmony have independent explanatory power (Table 5 Column 3).
China’s harmony score is 3.78, lower than the 4.06 average of all countries in our sample.
China’s harmony score is lower than Japan’s 4.21, Taiwan’s 4.12 and U.K.’s 3.91, but China’s
harmony score is higher than the U.S.’s 3.46. The relatively low harmony scores of China and
19
the U.S. may explain their relatively low CSR levels when adjusted for income (Figure 1).
Countries with high harmony scores, such as Germany, Spain, and Sweden, have higher income-
adjusted CSR scores.
Egalitarianism and CSR
We hypothesize that levels of CSR are relatively low in countries with relatively low
levels of egalitarianism, and this is what we find. The correlation between the two is 0.61(Table
3). The coefficient of Egalitarianism remains statistically significant when we include both
egalitarianism and income in a regression where CSR is the dependent variable, but the
coefficient of income is no longer statistically significant (Table 5 Column 4).
China’s egalitarianism score is 4.23, lower than the 4.78 average of countries in our
sample. Indeed, China’s score is the lowest in our sample. Taiwan’s egalitarianism score is 4.31,
U.S.’s 4.68, and Italy’s 5.27. Many European countries rank relatively high in egalitarianism,
and they also rank high in income-adjusted CSR.
Autonomy and CSR
We hypothesize that levels of CSR are relatively low in countries with relatively low
levels of autonomy, and this is what we find. The correlation between CSR and intellectual
autonomy is 0.59, and the correlation between CSR and affective autonomy is 0.62 (Table 3).
The coefficients of Intellectual Autonomy and Affective Autonomy are positive and statistically
significant when we include both autonomy and income as independent variables in a regression
where CSR is the dependent variable (Table 5 Column 5 and 6).
Chinese culture is oriented towards embeddedness rather than autonomy. The intellectual
autonomy score of China is 4.18, lower than the 4.51 average of countries in our sample. China’s
intellectual autonomy score is lower than Taiwan’s 4.36, Japan’s 4.78, and U.K.’s 4.62, but it is
20
approximately equal to the U.S.’s 4.19. The affective autonomy score of China is 3.30, lower
than the 3.72 average of countries in our sample. China’s affective autonomy score is lower than
Japan’s 3.76, U.K.’s 4.26, and U.S.’s 3.87, but it is approximately equal to Taiwan’s 3.27.
Autonomy scores are relatively high in European countries. France, Sweden, and Switzerland
rank relatively high on autonomy and have relatively high income-adjusted CSR levels.
Individualism and CSR
We hypothesize that levels of CSR are relatively low in countries with relatively low
levels of individualism, and this is what we find. The correlation between the two is 0.62 (Table
3). The coefficients of both Income and Individualism are statistically significant when we
include both in a regression where CSR is the dependent variable, indicating that Income and
Individualism have independent explanatory power (Table 5 Column 7).
China’s individualism score is 20, much lower than our 52.1 sample average. Only three
countries including Taiwan (17) have individualism scores lower than China’s. Japan’s score is
46. Western countries tend to have relatively high individualism scores. For example, the
individualism scores of the U.S. and the U.K. are 91, the highest in our sample.
Power distance and CSR
We hypothesize that CSR is relatively low in countries with relatively high levels of
power distance, and this is what we find. The correlation between the two is -0.46. Nevertheless,
the coefficient of Power distance is no longer statistically significant when we include both
Income and Power distance as independent variables in a regression where CSR is the dependent
variable. The coefficient of Income remains statistically significant (Table 5 Column 8).
China’s power distance score is 80, higher than our 52.2 sample average. China’s score is
higher than Japan’s 54, Taiwan’s 58, U.K.’s 35, and U.S.’s 40.
21
Civil liberties, political rights, and CSR
We hypothesize that levels of CSR are relatively low in countries with relatively weak
civil liberties and political rights, and this is what we find. The correlation between the two is -
0.68. The coefficient of Income is not statistically significant in a regression where both income
and civil liberties and political rights are the independent variables and CSR is the dependent
variable, but the coefficient of Civil liberties political rights remains statistically significant
(Table 5 Column 9).
China’s civil liberties and political rights score is 6.5, higher than our 1.9 sample average,
where higher scores indicate lower civil liberties and political rights. Indeed, China’s score is the
highest among our sample countries. Japan’s score is 1.5, U.S.’s 1 and U.K.’s 1.
Accounting for differences in levels of CSR
Levels of economic development, measured by income-per-capita, are associated with
levels of CSR. Dimensions of culture, such as individualism, harmony, and egalitarianism, and
features of institutions, including levels of corruption, civil liberties, and political rights, are also
associated with levels of CSR. Yet, the variables are highly correlated, making it difficult to
discern the distinct effect of each; levels of corruption are low in countries where levels of
income are high, and levels of harmony are high in countries where levels of egalitarianism are
high. Still, we can find how much of differences in levels of CSR among countries we can
account for by employing all the variables.
We place all the country-level variables as independent variables in a regression where
CSR is the dependent variable (last column of Table 5). While multicollinearity removes
statistical significance from most coefficients, the coefficients of Civil liberties political rights,
22
Harmony, and Affective Autonomy retain statistical significance. Variations in country-level
variables account for 55.2% of the variation in country CSR.
5. Conclusion
Levels of CSR among Chinese companies are low relative to levels among companies in
both developed countries, such as the United States and Japan, and developing countries, such as
South Korea and Taiwan. Yet payoffs from increased CSR in China might well exceed payoffs
from increased CSR in developed countries. We attribute the relatively low levels of CSR in
China to relatively low income-per-capita and to adverse cultural and institutional dimensions
including relatively low levels of harmony and individualism, relatively high levels of corruption,
and relatively low levels of civil liberties and political rights.
Levels of CSR in China are likely to increase in the future. Chinese income-per-capita is
rising, and higher incomes are associated with higher levels of CSR. The need for food is most
pressing when income is very low, but the need for clean water and air becomes increasingly
pressing as income increases. The recent protests in Qidong against a pipeline project that would
have dumped wastewater from a Japanese-owned paper mill into the sea are one example.
Thousands joined in the protests and the Chinese government chose to cancel the project soon
after (Wall Street Journal, 2012a).
Higher incomes also bring demands for greater civil liberties and political rights. In turn,
higher civil liberties and political rights are associated with higher CSR levels. Protests against a
plan for a metal plant in Shifang, a small city in Sichuan province, led to violent clashes between
protestors with the police. Eventually, local officials abandoned the plan. The Shifang
demonstrations have drawn great attention on Weibo (Chinese Twitter), revealing deep
23
environmental, social, and political concerns in the Chinese public. Young people were
prominent among the outraged protestors, indicating that, contrary to earlier perceptions, the
young in China are not indifferent to environmental, social, and political concerns (Wall Street
Journal, 2012b).
Cultures are persistent but not immutable. People in poor countries are compelled to
resort to collectivism, as help from family and friends forms their safety net. Moreover,
institutions, such as banks, are underdeveloped in poor countries, making it necessary for people
to borrow from family and friends rather than from banks, as they do in developed countries. The
need for safety nets of family and friends and the collectivism it fosters decline as incomes
increase and institutions such as banks facilitate individualism. In turn, individualism promotes
CSR.
Increasing globalization is also likely to increase levels of CSR in China in two ways.
First, buyers of Chinese exports will continue to resist products such as toys containing lead and
governments outside China would continue to enforce regulations against poor working
conditions and high corruption, promoting CSR. Second, Chinese traveling abroad are likely to
bring back cultural norms fostering CSR from countries they visit, such as lower tolerance for
power distance and corruption, and greater desire for egalitarianism and autonomy.
24
Reference:
Campbell, John, 2007, “Why Would Corporations Behave in Socially Responsible Ways? An Institutional Theory of Corporate Social Responsibility,” Academy of Management Review 32, 946-967.
Davis, James, and John Ruhe, 2003, “Perceptions of Country Corruption: Antecedents of
Outcomes,” Journal of Business Ethics 43, 275-288.
De Waal, Frans, 1996, “Good Natured: The Origins of Right and Wrong in Humans and Other Animals,” Harvard University Press. ISBN 0-674-35660-8.
Freedom House, 2010, “Freedom in the World 2010 Survey”, http://www.freedomhouse.org/report/freedom-world/freedom-world-2010
Getz, Kathleen, and Roger Volkema, 2001, “Culture, Perceived Corruption, and Economics: A Model of Predictors and Outcomes,” Business and Society 40, 7-30.
Guiso, Luigi, Paola Sapienza, and Luigi Zingales, 2008, “Trusting the Stock Market,” Journal of Finance 63, 2557-2600.
Hofstede, Geert, 1980, “Culture's Consequences: International Differences in Work-related Values.” Beverly Hills, CA: Sage.
Ioannou, Ioannis, and George Serafeim, 2012, “What Drives Corporate Social Performance? The Role of Nation-Level Institutions,” Journal of International Business Studies, forthcoming.
Kim, Yongtae, and Meir Statman, 2012, “Do Corporations Invest Enough in Environmental
Responsibility?” Journal of Business Ethics 105, 115-129. Lin, Li-Wen, 2010, “Corporate Social Responsibility in China: Window Dressing or Structural
Change?” Berkeley Journal of International Law 28, 64-100. Marquis, Christopher, and Michael Toffel, 2012, “When Do Companies Greenwash? Corporate
Visibility, Civil Society Scrutiny, and Environmental Disclosure”, Working Paper, Harvard Business School.
Maignan, Isabelle, and David Ralston, 2002, “Corporate Social Responsibility in Europe and the
U.S.: Insights from Businesses' Self-presentations”, Journal of International Business Studies, 33, 497-514.
Ramasamy, Bala, and Mathew Yeung, 2009, “Chinese Consumers’ Perception of Corporate
Social Responsibility (CSR),” Journal of Business Ethics 88, 119-132. Wall Street Journal, 2012a, “China Move Reflects Sensitivity on Pollution”,
Wall Street Journal, 2012b, “Planned China Metals Plant Scrapped”,
http://online.wsj.com/article/SB10001424052702304211804577504101311079594.html Wang, Lei, and Heikki Juslin, 2009, “The Impact of Chinese Culture on Corporate Social
Responsibility: The Harmony Approach,” Journal of Business Ethics 88, 433-452. Xu, Shangkun, and Rudai Yang, 2010, “Indigenous Characteristics of Chinese Corporate Social
Responsibility Conceptual Paradigm,” Journal of Business Ethics 93, 321-222. Yin, Juelin, and Yuli Zhang, 2012, “Institutional Dynamics and Corporate Social Responsibility
(CSR) in an Emerging Country Context: Evidence from China,” Journal of Business Ethics, forthcoming.
Schwartz, S.H., 1999, “Cultural Value Differences: Some Implications for Work,” Applied
Psychology: An International Review 48, 23-47. White, Halbert, 1980, “A Heteroskedasticity-Consistent Covariance Matrix Estimator and a
Direct Test for Heteroskedasticity,” Econometrica 48, 817-838.
26
Table 1: List of countries covered by MSCI IVA
Country No. of companies No. of firm-year observations Australia 266 905 Austria 14 38 Belgium 18 50 Brazil 34 61 Canada 146 355 Chile 9 17 China 38 65 Denmark 21 54 Finland 26 71 France 90 270 Germany 61 172 Greece 13 40 Hong Kong 53 147 India 28 50 Indonesia 8 11 Ireland 22 36 Israel 14 19 Italy 54 129 Japan 367 1,062 Korea, South 30 58 Malaysia 14 25 Mexico 19 33 Netherlands 41 92 New Zealand 14 22 Norway 18 41 Portugal 12 35 Russia 17 38 Singapore 29 82 South Africa 18 39 Spain 47 121 Sweden 43 116 Switzerland 53 134 Thailand 7 11 Turkey 7 9 United Kingdom 347 902 United States 809 2,192 Total 2,807 7,502


![[Shiseido’s Corporate Social Responsibility] · Shiseido's Corporate Social Responsibility Back Issues 2010 [Shiseido’s Corporate Social Responsibility] "Beautiful Society, Bright](https://static.documents.pub/doc/80x56/5f170ccfbe73e76f437bb14c/shiseidoas-corporate-social-responsibility-shiseidos-corporate-social-responsibility.jpg)