Lahiri S, et al - Cost-effectiveness of Preventing Occupational Back Pain This is a preprint of an article accepted for publication in the American Journal of Industrial Medicine
1Department of Economics, University of Massachusetts Lowell, Falmouth Hall 302D, One University Avenue, Lowell, MA 01854. 2Department of Work Environment, University of Massachusetts, Lowell, Massachusetts Background Occupational back pain exacts a toll on society with concomitant economic losses; it is imperative to evaluate the cost-effectiveness of interventions to reduce the relevant ergonomic stressors at work. This study estimates and evaluates the average and incremental cost-effectiveness ratios (CERs) of specific interventions for the prevention of occupationally induced back pain for the World Health Organization (WHO) defined subregions of the world. Methods. Four back-pain interventions were selected from the literature: training (T), engineering controls (EC), engineering controls and training (EC&T) and a comprehensive full ergonomics program (EP) for evaluation. A simulation model for a 100-year time horizon, developed by the WHO CHOICE initiative project was used to estimate the effectiveness of the interventions in healthy year equivalents. The intervention costs were adjusted for all WHO subregions. Results In all of the subregions, training was the most cost-effective with CERs varying from $74 per healthy life years gained in the subregion comprising of Egypt, Iraq, Morocco, Yemen (EMROD) to approximately $567 in the subregion covering Canada and the United States (AMROA). Training is considered to be very cost-effective and would be the first choice option where resources are scarce. However, the overall effectiveness of training is low. Although other interventions such as engineering controls and total ergonomic interventions are relatively more expensive, the addition to health outcome through these interventions is much higher. The difference in the CERs for training and other engineering controls and full ergonomic interventions is relatively small for most of the industrialized regions of the world. It is clear from the ranked CERs and incremental CERs over the different subregions that in most of the industrialized regions of the world additional resources, if they become available, should go straight to the full ergonomics program. Conclusions The model results based on CERs show that worker training is a low cost, feasible first step toward reducing back pain/injury incidence. However, all of the average CERs for the different interventions, for each of the regions, fall well within their GDP per capita estimates [World Bank, 2001]. According to the WHO Commission on Macroeconomics and Health any intervention that costs less than three times GDP per capita for saving a healthy year equivalent should be considered worthwhile and good value for money [WHO, 2002]. Given this criterion, the engineering controls interventions as well as the full ergonomics
program look very cost effective for all of the WHO subregions. Keywords: cost of interventions; back pain; economic evaluation of occupational interventions, cost-effectiveness.
INTRODUCTION
The problem of back pain caused by ergonomic stressors at work is both widespread in highly industrialized and developing countries. In the developed countries, it is one of the most common reasons for filing a workers’ compensation claim, hence, one of the most costly health disorders to society [Shinozaki et al., 2001; Maniadakis and Gray, 2000; Marras, 2000; Goossens et al., 1998; Guo et al., 1999; Hutubessy et al., 1999; Snook & Webster 1999; Hashemi et al., 1997]. Punnet et al in a companion paper in this issue show that occupational risk factors account for 37% of back pain world wide. Despite the prevalence of this disease and the toll that it exacts from workers and their families with the concomitant economic losses, cost-effective interventions are available.
For this paper, we review the literature concerning interventions to prevent occupational back pain in order to extract data on the relative effectiveness of alternative interventions and to develop estimates of their cost. We then employ techniques used by the World Health Organization [Murray et al., 2000, Lauer et al., 2003] to estimate the cost-effectiveness of selected interventions to prevent occupational back pain.
We estimate and evaluate the average and incremental Cost effectiveness ratios (CERs) of specific interventions for the prevention of occupationally induced back pain for the seventeen WHO defined subregions of the world.1
Address all correspondence to: Dr Supriya Lahiri, Department of Economics, University of Massachusetts Lowell, Falmouth Hall 302D, One University Avenue, Lowell, MA 01854. Tel.: 978.934.2789; Fax. 978.934.3071; E-mail. [email protected]
Lahiri S, et al - Cost-effectiveness of Preventing Occupational Back Pain This is a preprint of an article accepted for publication in the American Journal of Industrial Medicine
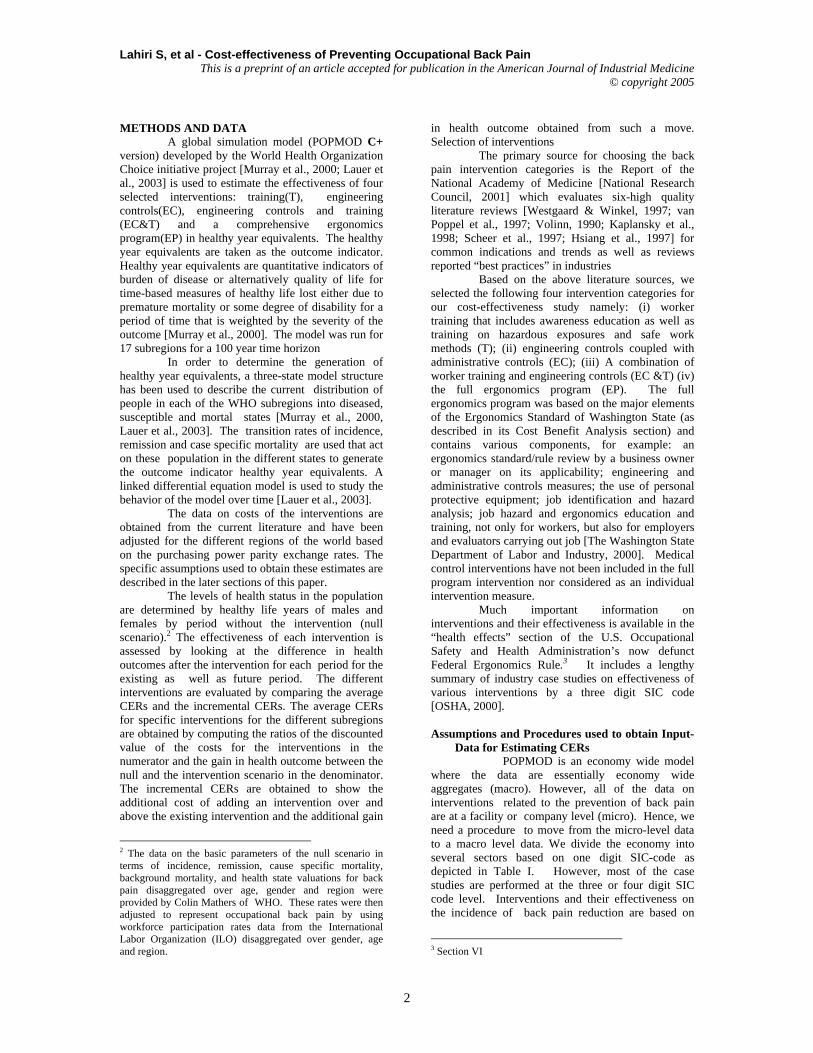
METHODS AND DATA A global simulation model (POPMOD C+
version) developed by the World Health Organization Choice initiative project [Murray et al., 2000; Lauer et al., 2003] is used to estimate the effectiveness of four selected interventions: training(T), engineering controls(EC), engineering controls and training (EC&T) and a comprehensive ergonomics program(EP) in healthy year equivalents. The healthy year equivalents are taken as the outcome indicator. Healthy year equivalents are quantitative indicators of burden of disease or alternatively quality of life for time-based measures of healthy life lost either due to premature mortality or some degree of disability for a period of time that is weighted by the severity of the outcome [Murray et al., 2000]. The model was run for 17 subregions for a 100 year time horizon
In order to determine the generation of healthy year equivalents, a three-state model structure has been used to describe the current distribution of people in each of the WHO subregions into diseased, susceptible and mortal states [Murray et al., 2000, Lauer et al., 2003]. The transition rates of incidence, remission and case specific mortality are used that act on these population in the different states to generate the outcome indicator healthy year equivalents. A linked differential equation model is used to study the behavior of the model over time [Lauer et al., 2003].
The data on costs of the interventions are obtained from the current literature and have been adjusted for the different regions of the world based on the purchasing power parity exchange rates. The specific assumptions used to obtain these estimates are described in the later sections of this paper. The levels of health status in the population are determined by healthy life years of males and females by period without the intervention (null scenario).2 The effectiveness of each intervention is assessed by looking at the difference in health outcomes after the intervention for each period for the existing as well as future period. The different interventions are evaluated by comparing the average CERs and the incremental CERs. The average CERs for specific interventions for the different subregions are obtained by computing the ratios of the discounted value of the costs for the interventions in the numerator and the gain in health outcome between the null and the intervention scenario in the denominator. The incremental CERs are obtained to show the additional cost of adding an intervention over and above the existing intervention and the additional gain
2 The data on the basic parameters of the null scenario in terms of incidence, remission, cause specific mortality, background mortality, and health state valuations for back pain disaggregated over age, gender and region were provided by Colin Mathers of WHO. These rates were then adjusted to represent occupational back pain by using workforce participation rates data from the International Labor Organization (ILO) disaggregated over gender, age and region.
in health outcome obtained from such a move. Selection of interventions
The primary source for choosing the back pain intervention categories is the Report of the National Academy of Medicine [National Research Council, 2001] which evaluates six-high quality literature reviews [Westgaard & Winkel, 1997; van Poppel et al., 1997; Volinn, 1990; Kaplansky et al., 1998; Scheer et al., 1997; Hsiang et al., 1997] for common indications and trends as well as reviews reported “best practices” in industries Based on the above literature sources, we selected the following four intervention categories for our cost-effectiveness study namely: (i) worker training that includes awareness education as well as training on hazardous exposures and safe work methods (T); (ii) engineering controls coupled with administrative controls (EC); (iii) A combination of worker training and engineering controls (EC &T) (iv) the full ergonomics program (EP). The full ergonomics program was based on the major elements of the Ergonomics Standard of Washington State (as described in its Cost Benefit Analysis section) and contains various components, for example: an ergonomics standard/rule review by a business owner or manager on its applicability; engineering and administrative controls measures; the use of personal protective equipment; job identification and hazard analysis; job hazard and ergonomics education and training, not only for workers, but also for employers and evaluators carrying out job [The Washington State Department of Labor and Industry, 2000]. Medical control interventions have not been included in the full program intervention nor considered as an individual intervention measure. Much important information on interventions and their effectiveness is available in the “health effects” section of the U.S. Occupational Safety and Health Administration’s now defunct Federal Ergonomics Rule.3 It includes a lengthy summary of industry case studies on effectiveness of various interventions by a three digit SIC code [OSHA, 2000]. Assumptions and Procedures used to obtain Input-
Data for Estimating CERs POPMOD is an economy wide model
where the data are essentially economy wide aggregates (macro). However, all of the data on interventions related to the prevention of back pain are at a facility or company level (micro). Hence, we need a procedure to move from the micro-level data to a macro level data. We divide the economy into several sectors based on one digit SIC-code as depicted in Table I. However, most of the case studies are performed at the three or four digit SIC code level. Interventions and their effectiveness on the incidence of back pain reduction are based on
3 Section VI
2
Lahiri S, et al - Cost-effectiveness of Preventing Occupational Back Pain This is a preprint of an article accepted for publication in the American Journal of Industrial Medicine
specific case studies at the three digit level. Data on interventions and their values of incidence reduction are used as representative for the one digit sector as a whole. We arrive at an aggregate rate on the incidence reduction for each intervention for the economy as a whole by taking the weighted average of the disaggregated incidence reduction for each of the one digit SIC-code sectors by using employment as the relevant weights.
Table I summarizes the evidence of reduction in the incidence of back pain/injury for selected interventions as identified in the literature. The literature referred primarily to engineering/administrative controls and full ergonomics programs; only two studies referred to training [Brisson et al., 1999; OSHA, 2000].
We used the assumptions described below to arrive at the incidence reduction values for engineering and administrative controls intervention represented in Table II. For agriculture (SIC 0), we reviewed data from the National Institute of Occupational Safety and Health (NIOSH) publication, Simple Solutions: Ergonomics For Farm Workers [NIOSH, 2001]. Data on interventions for the construction and the mining sector (SIC 1) are obtained from case studies presented in the 1997 Ergonomics Conference in Chicago [NIOSH, 2001].
For agriculture and forestry, we choose an incidence reduction estimate of 50 percent for the combined engineering/administrative controls, as demonstrated by NIOSH for one vegetable farm [NIOSH, 2001]. Specific engineering control measure for the agricultural sector such as lifting tool for carrying plant containers, weeding stands, specialized harvest carts, more ergonomically designed rakes, power cutters, and so forth were described [NIOSH, 2001]. A Finnish study on forestry tractor drivers demonstrated that almost 50 percent of the drivers found a lumbar support beneficial; in addition, the seat spring tension and inclination of tractors were adjusted [Perkiö-Mäkelä & Riihimäki, 1997]. For mining and construction (SIC 1), we identified only one incidence reduction range of 13-15 percent [NIOSH, 1997] – that had occurred in a coal mine; in our judgment, this incidence reduction rate was slightly conservative to be used as a proxy for engineering/administrative control interventions for the entire mining and construction sectors. Thus, a higher injury reduction rate of 20 percent was assumed (Table II). Engineering control measures for mining sector included reducing object weights, lifting devices and hoist mechanisms: in particular handling the material electrically or using material handling vehicles; vehicle seating improvements; lighter aluminum shovels; and improved carrying handles [NIOSH, 1997]. As for manufacturing industries (SIC 3), many studies point out the incidence of back pain reduction after the introduction of interventions which varies within the range from 27 to 100 percent as
reported in Table I. The report prepared by the US Department of Labor [OSHA, 2000] for example, reports back pain incidence reduction: office furniture as 50% (installing scissor lifts and modifying workstations to eliminate twisting and bending during lifting); pharmaceutical 87 percent (replacing nonadjustable steal seats with adjustable, cushioned chairs and worker training); household products 50 percent (adjustable workstations, improved grips of hand tools, and improved parts organization and work flow); vehicle 27 percent (ergonomics training program, adjustments of seat and work station heights); hardware 90 percent (a lift-table/transporter to lift and move materials for each worker); and silver 71 percent (manual handling lifts, installing a chute to eliminate the need for employees to carry heavy bags, and an inclined adjustable support to reduce awkward neck and shoulder postures). Complete elimination of back related disorders were reported in the manufacturing sector with the following engineering /administrative control interventions: automobile parts (modified plywood sheets to reduce their weight and permit them to slide more easily in the grooves); lamps manufacturing (added a vacuum hoist, reduced equipment height, reduced box size and weight and awareness program for employees); and metal works (adding gates at each end of the crates and installing scissor lifts to lift crates so that workers can keep their arms close to the body while unpacking). For finance, insurance, and real estate sector (SIC 6) job tasks are assumed to comprise of a great deal of data entry, computer use, and general office deskwork. Upper extremity disorders are more prevalent than back pain in this type of work. Nonetheless, all manual materials handlers of this sector (storage workers, mail carriers, etc) need to be taken into account. For the General Service Sector (SIC 7), a study by the Washington State indicated that back pain had been reduced to 38 percent through administrative and engineering control interventions. We assumed a 40% incidence reduction for this sector for engineering controls (Table II).
In the professional services sector (SIC 8), the greatest reduction of 94 percent due to engineering/ administrative controls occurred among hospital workers. Interventions in health and nursing care facilities resulted in reductions varying from 73 percent to 25 percent [OSHA, 2000; Collins & Owen, 1996]. Patient lifts and other patient handling equipment are the main components of the crucial engineering control interventions. Based on the literature findings on incidence reductions at micro levels (individual workplaces), we estimated their incidence reduction estimates at macro or sectoral levels (each one-digit SIC sectors) and presented them in Table II.4 As mentioned earlier the aggregate rates in Table II for each of the
4 Incidence reduction refers to reduction in new cases of back pain.
3
Lahiri S, et al - Cost-effectiveness of Preventing Occupational Back Pain This is a preprint of an article accepted for publication in the American Journal of Industrial Medicine
interventions were computed by taking the weighted average of the disaggregated incidence reduction values for each one-digit SIC sectors of Table I, using employment as the relevant weight.
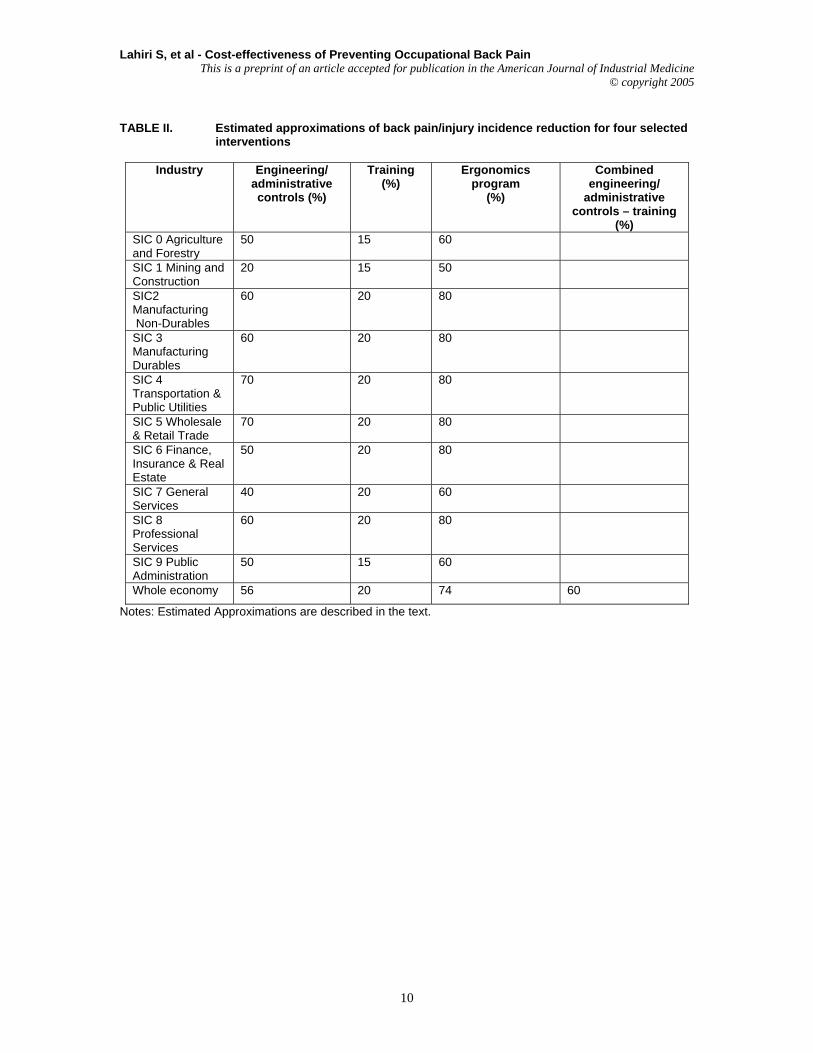
Although there is a considerable scientific uncertainty about the exact level of effectiveness of the above interventions, estimates were obtained from several demonstrational observational studies as depicted in Table I. Based on these estimates, the largest improvement in population health was estimated from the full ergonomics program, offering a 74 percent reduction in back-pain incidence. The other interventions offer lower benefits at the population level: engineering controls reduce incidence by 56 percent, engineering controls and training reduce it by 60 percent and training alone reduces incidence by only 20 percent (Table II).
A significant limitation of this study is that the estimates on interventions are available only for highly industrial countries and for a limited number of facilities for each of the sectors. Also, very little data are available on the effectiveness of interventions for developing countries.
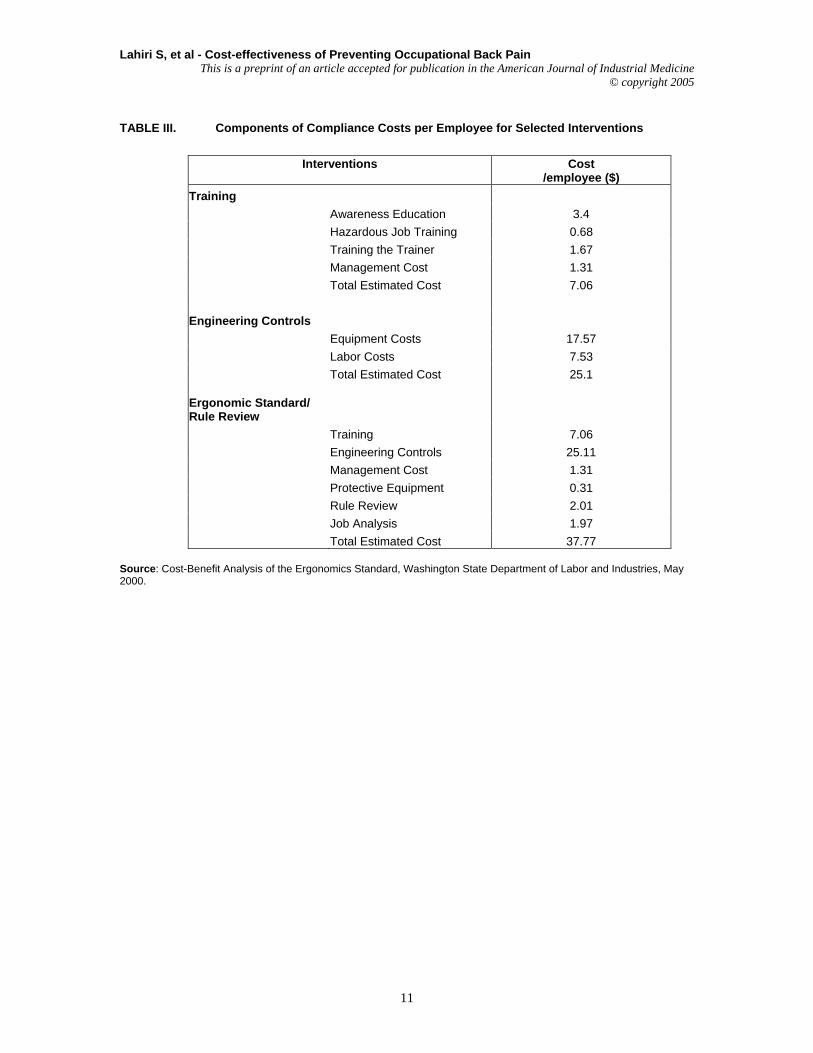
Furthermore, aggregation errors come along when estimating macro level injury reduction values -- for the whole economic sectors -- that have been based on micro level studies. For instance, in Table I, it may appear confusing that full ergonomics program which consists of engineering/administrative controls as well as training programs in each of the above sectors have a lower incidence reduction value compared to engineering controls alone. For example, in the manufacturing non-durables good sector (SIC 2) application of engineering/administrative controls result in an incidence reduction of 50-87% (Table I). On the other hand, results reported for the full ergonomics program which presumably includes all engineering control measures as well additional measures results in an incidence reduction of only 40-79 percent. The reason for this discrepancy is that the results of the case studies that have been cited in Table II refer to different types of industries and workplace settings that nevertheless belong to the same sector. Estimated costs of the interventions The Department of Labor & Industries, the State of Washington has reported the compliance costs for each of the selected interventions for each SIC code industry mentioned above for the year 2000. They estimated the annualized present value compliance costs by using a five (5) percent discount rate and explained assumptions behind these cost estimates [Washington State Department of Labor and Industry, 2000]. Table III gives a detailed breakdown
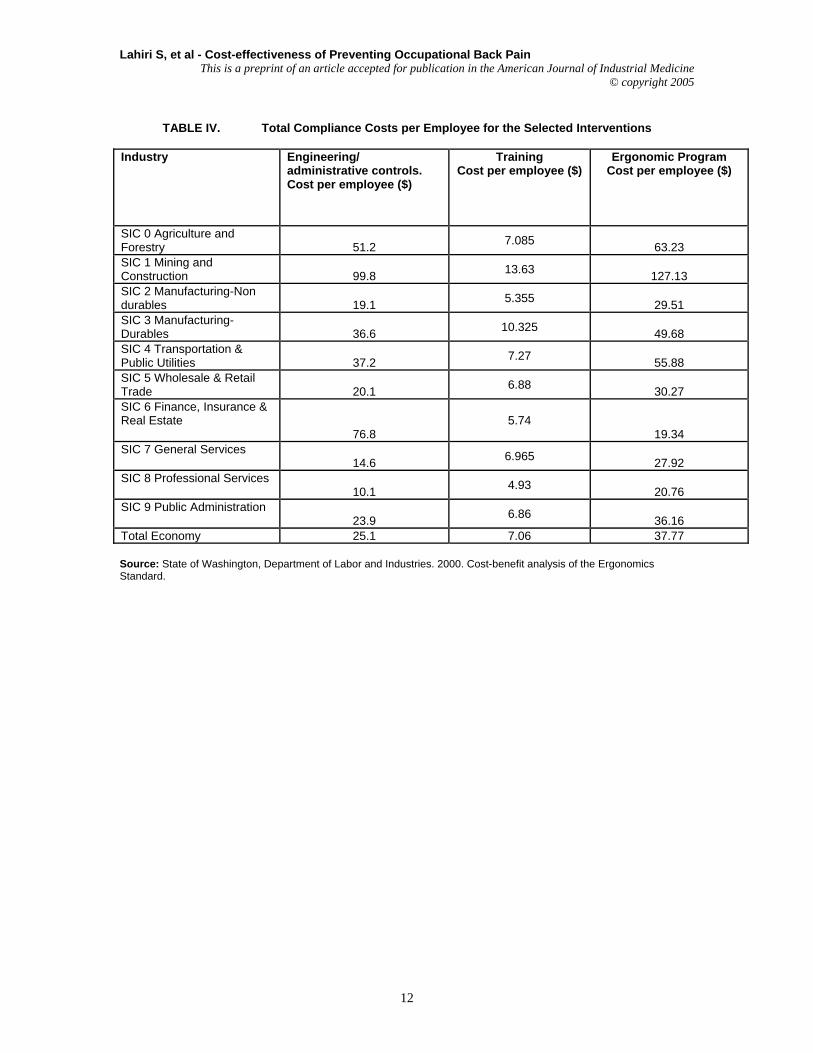
of compliance costs per employee for the selected interventions as cited in the Washington State Study. Table IV provides the total compliance costs per employee for the selected interventions by each SIC sectors based on the information provided in the Washington State cost-benefit study [The Washington State Department of Labor and Industry, 2000]. The cost for the combined EC and T intervention was taken as the sum of each of the two individual costs of T and EC. The relevant cost figures that are used in the model are the cost for the working population in the economy as a whole that is represented in the last row of Table IV. These aggregate costs are a weighted average of the different sectoral costs of interventions where the weights used are the employment in each sector. The costs presented in the last row of Table IV are used as a proxy for the AMROA subregion. Cost for all other regions were estimated through relevant adjustments based on the purchasing power parity of exchange rates.. The assumptions made in these adjustments are explained in the following section. The above intervention costs presented in Table IV presumably would vary from region to region, depending on the labor component of these interventions. We assumed that the costs of capital would be the same through out all regions of the world. These capital costs consist mainly of equipment costs such as, dollies, conveyor belts etc. The following assumptions are made about the difference between labor and capital (equipment) costs: for training all costs are labor costs; for engineering control/administrative controls, the labor capital split up is 30 –70; for ergonomics, the split is 50 –50. 5 The adjusted wage cost estimates for the different WHO subregions are reflected in Table VI. Our assumptions described in Table VI are based on data from the Key Indicators of the Labor Market that presented hourly compensation costs [The International Labour Organization (ILO), 2001] for the different regions of the world and data files prepared by GPE/EQC/CEA (Master Price List) World Heath Organization. These assumptions were used to construct the adjusted intervention cost estimates for each of the WHO subregions.
We also assumed that each intervention would be used for a period of the initial ten years of the model. The total cost of each intervention for the first ten years which is used as the numerator in the CERs are obtained by taking the discounted sum over the first ten years of the per employee compliance cost multiplied by the number of employees in the total workforce for each of the WHO subregions.6 A
5 Based on conversation with a representative of the Washington State Department of Labor and Industries (L&I). 6 The entire economically active population has been used both in the numerator to estimate costs of interventions and in the denominator, where the effectiveness of the interventions are measured (through POPMOD) in terms of healthy life years gained to obtain the appropriate CERs.
4
Lahiri S, et al - Cost-effectiveness of Preventing Occupational Back Pain This is a preprint of an article accepted for publication in the American Journal of Industrial Medicine
As discussed in the previous sections, we have assumed that effective preventive interventions of training (T), engineering controls (EC), engineering controls and training (EC&T) and a full ergonomics program (EP) will reduce the incidence rate of chronic back pain for the economy as a whole by 20 percent, 56 percent, 60 percent, and 74 percent (Table II) for the first ten years of the 100 year time horizon in the model. This incidence reduction is used as an input in the simulation model for the entire working population that may be susceptible to back pain through ergo stressors in their work environment.
RESULTS Cost-effectiveness of interventions – international comparisons
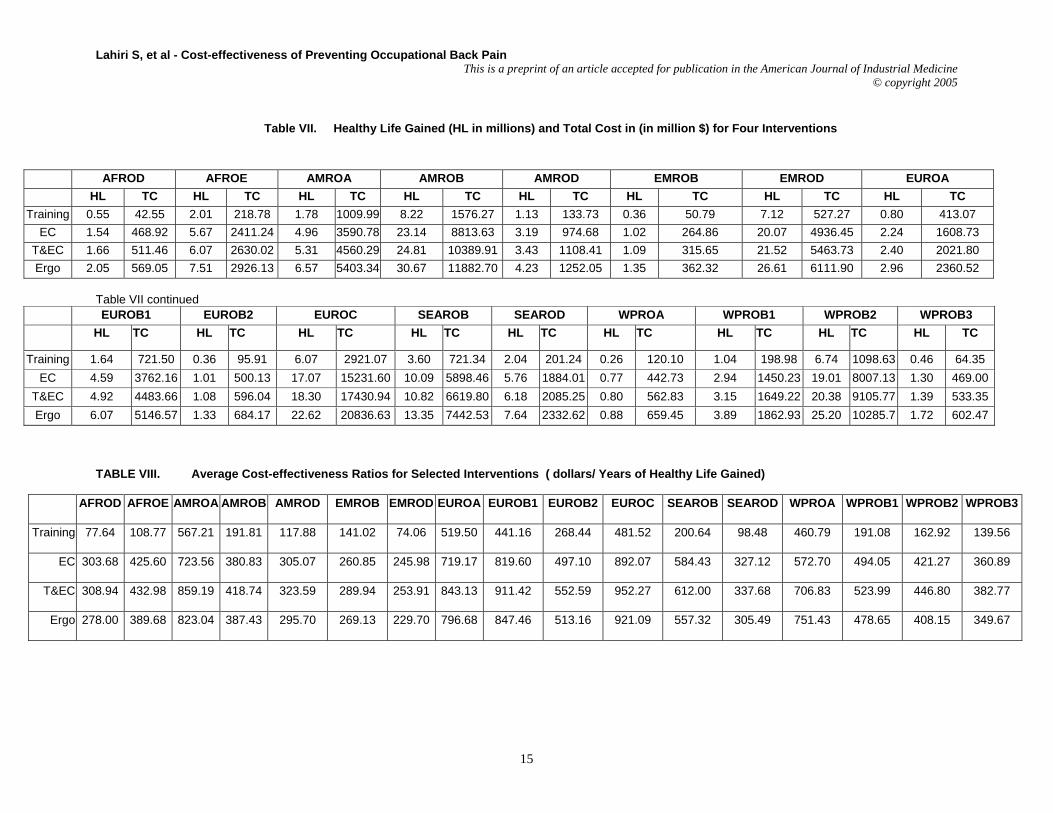
The differences in the total health outcomes for the aggregate male and female population for each of the seventeen regions between the null scenario and each of the intervention scenarios are represented in Table VII. For example, the model results suggest that in the AFROD region, with a total cost of $42.55 million on training intervention for the first ten years of the modeling time horizon, the region can add 0.55 million healthy life years to its health outcome. However, if it invests $468.92 million on engineering control interventions for the same period it can gain 1.54 million healthy life years. We find that the difference in health outcomes is largest for the full ergonomic intervention followed by engineering Controls and training. The effectiveness of training intervention in terms of healthy life years gained for the entire working population is rather small. However, it ranks high in terms of CERs because the total costs of training are significantly lower than those of the other interventions e.g. full ergonomics program. Nonetheless, one needs to keep in mind that these interventions are indivisible in nature and not additive. In other words, if one uses the training program for the AFROD region, one would be able to increase health outcome by 0.55 million years and no more. However, if instead one introduced engineering control interventions, one would be able to add 1.54 million healthy life years to its health outcome (Table VII). Hence, if resources are available, engineering controls rather than training would be a very desirable intervention to improve the quality of life.
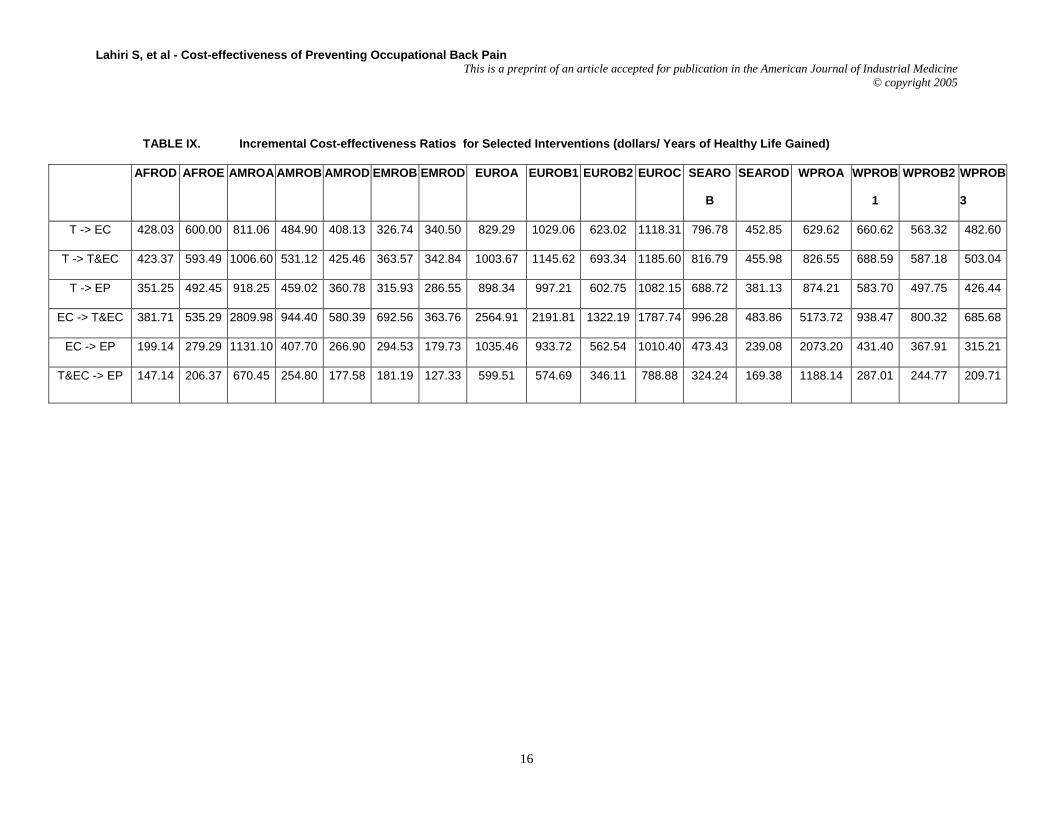
Tables VIII and IX depict the average cost-effectiveness ratios and the incremental ratios for
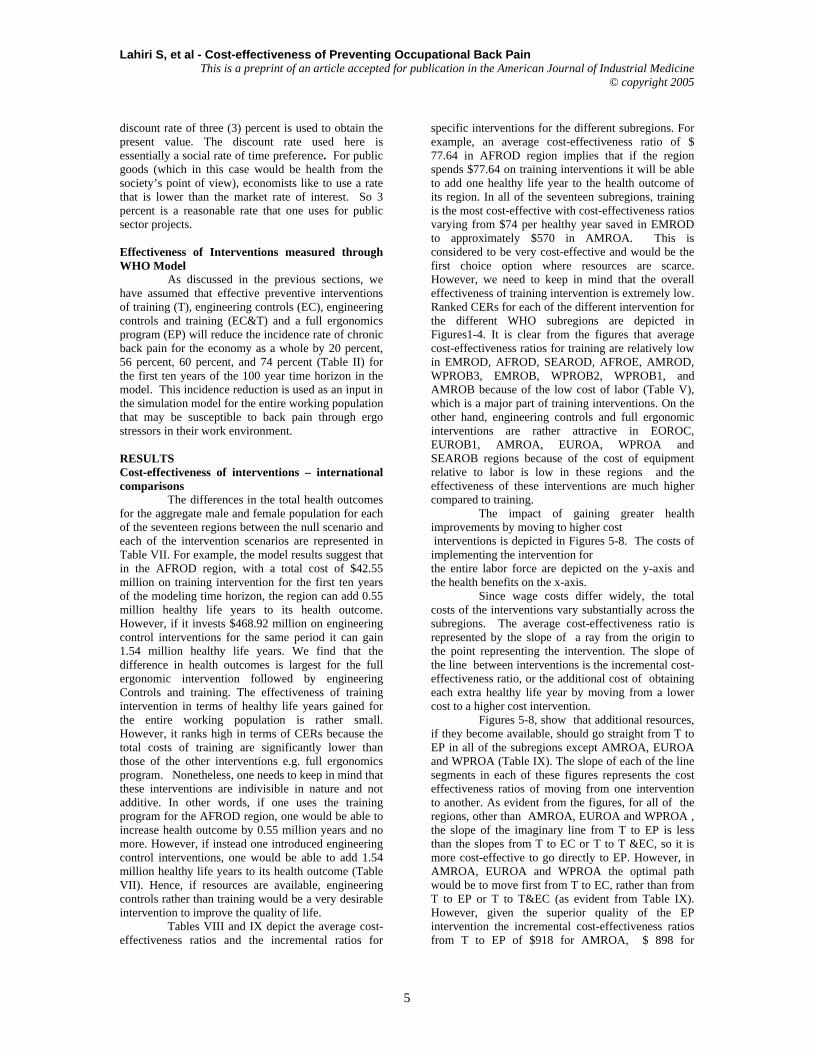
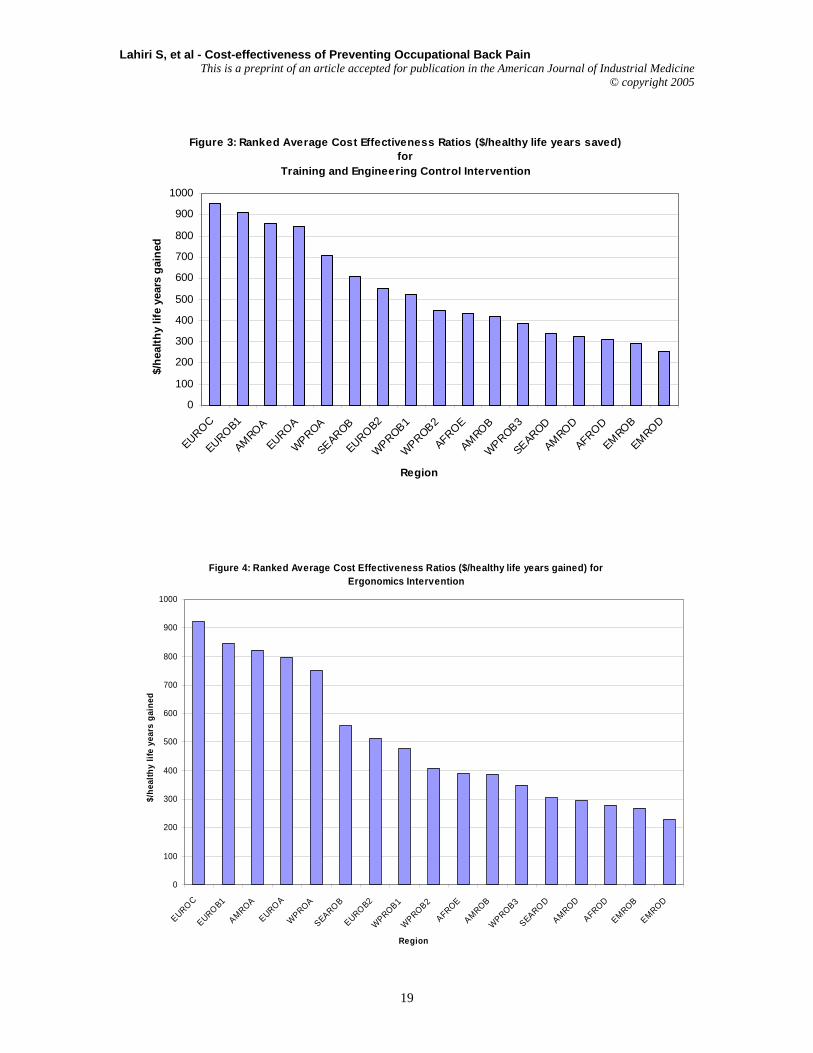
specific interventions for the different subregions. For example, an average cost-effectiveness ratio of $ 77.64 in AFROD region implies that if the region spends $77.64 on training interventions it will be able to add one healthy life year to the health outcome of its region. In all of the seventeen subregions, training is the most cost-effective with cost-effectiveness ratios varying from $74 per healthy year saved in EMROD to approximately $570 in AMROA. This is considered to be very cost-effective and would be the first choice option where resources are scarce. However, we need to keep in mind that the overall effectiveness of training intervention is extremely low. Ranked CERs for each of the different intervention for the different WHO subregions are depicted in Figures1-4. It is clear from the figures that average cost-effectiveness ratios for training are relatively low in EMROD, AFROD, SEAROD, AFROE, AMROD, WPROB3, EMROB, WPROB2, WPROB1, and AMROB because of the low cost of labor (Table V), which is a major part of training interventions. On the other hand, engineering controls and full ergonomic interventions are rather attractive in EOROC, EUROB1, AMROA, EUROA, WPROA and SEAROB regions because of the cost of equipment relative to labor is low in these regions and the effectiveness of these interventions are much higher compared to training.
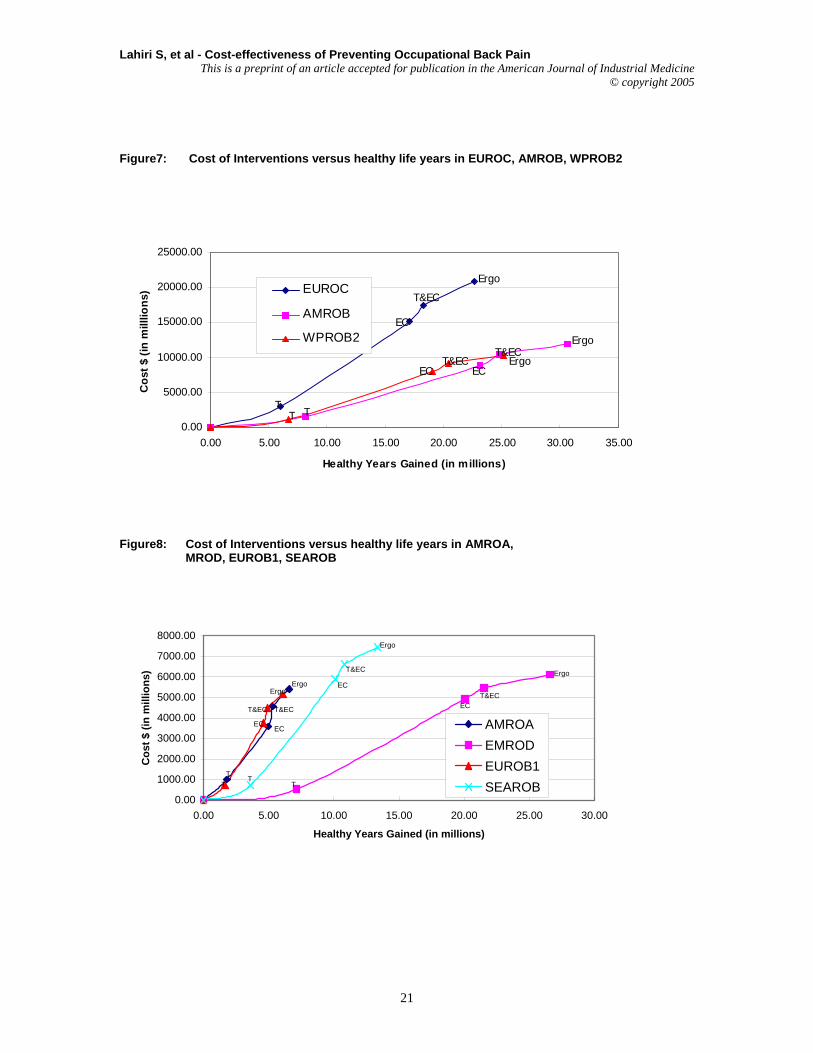
The impact of gaining greater health improvements by moving to higher cost interventions is depicted in Figures 5-8. The costs of implementing the intervention for the entire labor force are depicted on the y-axis and the health benefits on the x-axis.
Since wage costs differ widely, the total costs of the interventions vary substantially across the subregions. The average cost-effectiveness ratio is represented by the slope of a ray from the origin to the point representing the intervention. The slope of the line between interventions is the incremental cost-effectiveness ratio, or the additional cost of obtaining each extra healthy life year by moving from a lower cost to a higher cost intervention.
Figures 5-8, show that additional resources, if they become available, should go straight from T to EP in all of the subregions except AMROA, EUROA and WPROA (Table IX). The slope of each of the line segments in each of these figures represents the cost effectiveness ratios of moving from one intervention to another. As evident from the figures, for all of the regions, other than AMROA, EUROA and WPROA , the slope of the imaginary line from T to EP is less than the slopes from T to EC or T to T &EC, so it is more cost-effective to go directly to EP. However, in AMROA, EUROA and WPROA the optimal path would be to move first from T to EC, rather than from T to EP or T to T&EC (as evident from Table IX). However, given the superior quality of the EP intervention the incremental cost-effectiveness ratios from T to EP of $918 for AMROA, $ 898 for
5
Lahiri S, et al - Cost-effectiveness of Preventing Occupational Back Pain This is a preprint of an article accepted for publication in the American Journal of Industrial Medicine
We may also note that all of the average CERs for the different interventions, for each of the regions, fall well within their GDP per capita estimates [World Bank, 2001]. According to the WHO Commission on Macroeconomics and Health any intervention that costs less than three times GDP per capita for saving a healthy year equivalent should be considered worthwhile and good value for money [WHO, 2002]. Given this criterion, the engineering controls interventions as well as the full ergonomics program look very cost effective for all of the WHO subregions.
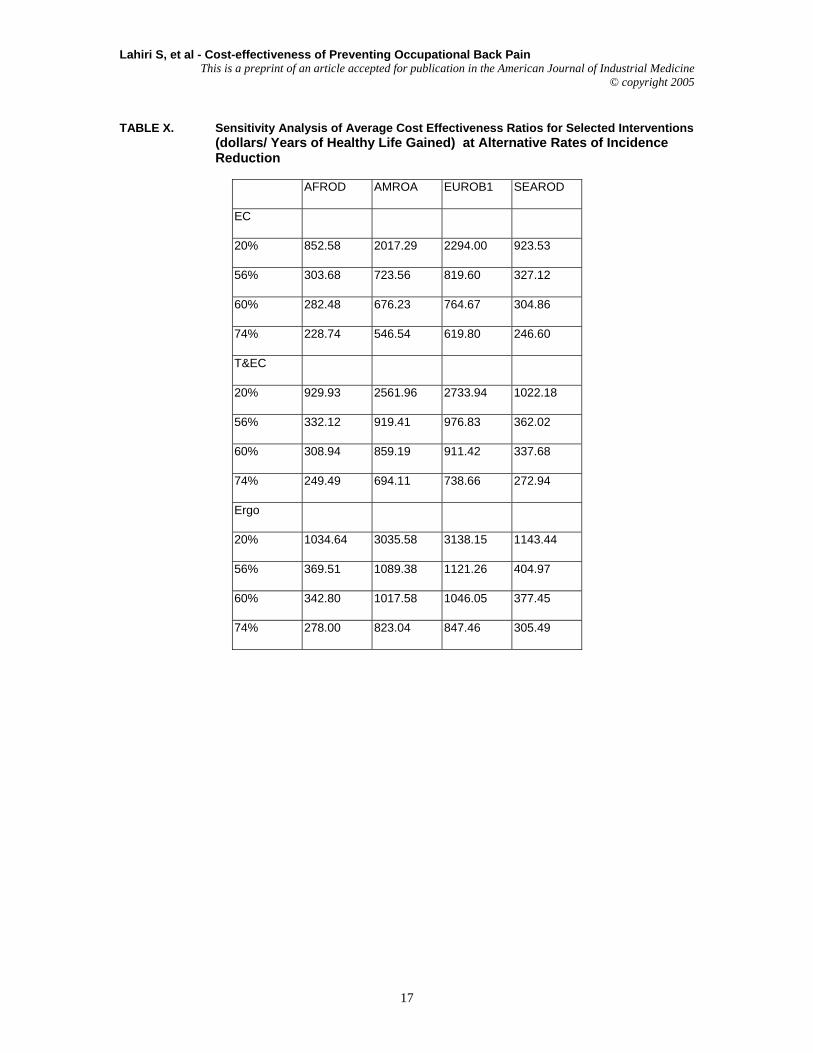
Since we made a number of assumptions to arrive at the data inputs both in terms of effectiveness of the interventions and the costs of interventions, we performed sensitivity analysis on the results of the model with respect to two parameters 1) the reduction in incidence rate (taking into account the ranges that were obtained from the literature) with respect to each of the interventions, 2) and the costs of the interventions. We perturbed the above two parameters (one at a time), and arrived at alternative average CERs for each of the interventions.
Although the sensitivity analysis of health outcome with respect to the incidence rate was carried out for all seventeen regions, the results of the average CERs for four representative subregions are reported in Table X. These sensitivity analyses results show that although the magnitudes of the CERs increase when the effectiveness of the interventions are reduced, they still satisy the criterion of the WHO Commission cited earlier that any intervention that costs less than three times GDP per capita for saving a healthy year equivalent should be considered worthwhile and good value for money vary. We also obtained similar results when we performed sensitivity analysis by doubling the costs of interventions from the base case.
DISCUSSION
Our study of interventions to prevent occupational back pain rests on a substantial number of studies in industrially developed countries. Our effort has been to estimate macroeconomic effects from micro studies. This has involved some heroic assumptions, but has produced economy-wide estimates, which we think are useful and instructive.
First, we note that training appears to be the most cost-effective, however, the impact of training on
total health outcome is rather limited (Table VII). Engineering and full ergonomic interventions have a far greater relative impact on total health outcome (Table VII) through reduction in the incidence of back pain than any of the other approaches
Second, we suspect that our understanding of back pain as disease and of “remission” is limited. We believe that there need to be prospective studies of the recurrence of back pain. Further, we believe that studies of “working hurt” – that is, workers with back pain who neither seek medical attention nor report their condition to employers or compensation agencies – could contribute to our knowledge. We are concerned that even in industrial countries, immigrant, minority and low-wage workers are frequently excluded from research studies. Thus, extrapolating from our current knowledge to developing countries where the “informal sector” is quite large may be problematic. Although limited amount of data are available for the prevalence of back pain by gender and age, there are no data sources that measure the impact of an intervention by gender and age. Therefore, in our cost-effectiveness analysis, we will treat the impact of interventions on gender to be equivalent.
Third, another significant limitation of this study is that we have based our estimates on interventions in highly developed industrial countries. There are very little data available on the effectiveness of interventions for developing countries. However, there is no reason to believe that the interventions will not be effective in developing countries.
Furthermore, a large component of the costs of interventions is also in the form of labor costs. The lower cost of labor in developing nations generated a substantial dampening effect on our cost estimates for the different interventions in those regions. In addition, we expect that the level of effective and useful “engineering” interventions in developing countries will be quite simple – for instance, introducing dollies with wheels for baggage porters – and therefore quite inexpensive. These limitations suggest that research is needed in developing countries on the cost-effectiveness of the range of potential interventions in order to improve our estimates.
Nevertheless, we believe that worker training is a low cost feasible first step toward the reduction of work-related back pain in developing countries and should be encouraged through public policy and regulation. Further, the introduction of technological innovations appropriate to the level of development could be effective in developing countries and is likely to have beneficial impact on productivity and, therefore, should be encouraged by international development agencies, as well as governments. Unquestionably, full ergonomics programs should be encouraged in highly developed countries for both health and productivity effects.
We would also like to add that we were commissioned by WHO to conduct this study (and
6
Lahiri S, et al - Cost-effectiveness of Preventing Occupational Back Pain This is a preprint of an article accepted for publication in the American Journal of Industrial Medicine
Hashemi L, Webster BS, Clancy EA, Volinn E. 1997. Length of disability and cost of workers’ compensation low back pain claims. J Occ Env Med 39(10): 937-945. Hsiang SM, Brogmus GE, Courtney TK. 1997. Low Back Pain (LBP) and Lifting Technique: A Review. Int J Ind Ergonomics 19:59-74. Hutubessy RCW, van Tulder MW, Vondeling H, Bouter LM. 1999. Indirect costs of back pain in the Netherlands: a comparison of the human capital method with the friction cost method. Pain 80: 201- 207.
International Labor Organization. 2001. Key Indicators of the Labor Market (KILM): KILM 17. Hourly compensation costs. http://www.ilo.org/public/english/employment/strat/kilm/kilm17.htm Kaplansky BD, Wei FY, Reecers MV. 1998. Prevention Strategies for Occupational Low Back Pain. Occ Med 13:33-45 Lauer JA, Röhrich K, Wirth H, Charette C, Gribble S, Murray CJL. 2003. PopMod: A longitudinal population model with two interacting disease states. Cost-effectiveness and Resource Allocation, 1 (6):1-15. Maniadakis N, Gray A. 2000. The economic burden of back pain in the UK. Pain 84: 95-103. Marras WS. 2000. Occupational low back disorder causation and control. Ergonomics 43(7): 880-902. Murphy PL, Courtney TK. 2001. Low back pain disability: relative costs by antecedent and industry group. Am J Ind Med 37: 558-571.
Murray CJL. 2000. Development of WHO guidelines on generalized cost-effectiveness analysis. Health Econ 9(3): 235-235. National Research Council. 2001. Musculoskeletal disorders and the workplace: low back and upper extremities. Panel on Musculoskeletal Disorders and the Workplace. Commission on Behavioral and Social Sciences and Education. The National Academy Press.
NIOSH. 2001. Look at data from the Bureau of Labor statistics worker health by industry and occupation: musculoskeletal disorders, anxiety, disorders, dermatitis, hernia. US Department of Health and Human Services, the Center for Disease Control and Prevention. Available at http://www.cdc.gov/niosh/pdfs/2001-120.pdf NIOSH. 2001. Simple solutions: ergonomics for farm workers. Available at http://www.cdc.gov/niosh/pdfs/01-111.pdf NIOSH. 1997. NIOSH transcripts of the Conference of Ergonomics: Effective Workplace Practices and Programs, Chicago. Available at http://www.cdc.gov/niosh/ec3const.html and http://www.cdc.gov/niosh/ec3mine.html OSHA. US Department of Labor. 2000. Final Rule, 29 CFR Part 1910: Federal Register, Ergonomics Program.http://www.osha.gov/FedReg_osha_pdf/FED20001114.pdf
Lahiri S, et al - Cost-effectiveness of Preventing Occupational Back Pain This is a preprint of an article accepted for publication in the American Journal of Industrial Medicine
http://www.lni.wa.gov/Safety/Topics/HazardInfo/Ergonomics/History/Documents/cba.asp van Poppel MN, Koes BW, Smid T, Bouter LM. 1997. A Systematic Review of Controlled Clinical Trials on the Prevention of Back Pain in Industry. Occ Env Med 54(12): 841-847. Volinn E. 1999. Do Workplace Interventions Prevent Low Back Disorders? If so, why? A Methodologic Commentary. Ergonomics 42: 258-272. Westgaard RH, Winkel J. 1997. Ergonomic Intervention Research for Improved Musculoskeletal Health: A Critical Review. Intl J Ind Erg 20: 463-500. World Bank. 2001. World Development Report 2002. Building institutions for markets. The International Bank for Reconstruction and Development. Oxford University Press. World Health Organization (WHO). 2002. The World Health Report 2002. Reducing risks, promoting healthy life.
Lahiri S, et al - Cost-effectiveness of Preventing Occupational Back Pain This is a preprint of an article accepted for publication in the American Journal of Industrial Medicine
38 OSHA, 2000; Shi, 1993 (cited in Washington State Standard)
SIC 8 Professional Services
25-94 23-80 OSHA, 2000; Collins & Owen 1996
SIC 9 Public Administration
15 12 Brisson et. al. 1999; OSHA, 2000
9
Lahiri S, et al - Cost-effectiveness of Preventing Occupational Back Pain This is a preprint of an article accepted for publication in the American Journal of Industrial Medicine
Notes: Estimated Approximations are described in the text.
10
Lahiri S, et al - Cost-effectiveness of Preventing Occupational Back Pain This is a preprint of an article accepted for publication in the American Journal of Industrial Medicine
/employee ($) Training Awareness Education 3.4 Hazardous Job Training 0.68 Training the Trainer 1.67 Management Cost 1.31 Total Estimated Cost 7.06 Engineering Controls Equipment Costs 17.57 Labor Costs 7.53 Total Estimated Cost 25.1 Ergonomic Standard/ Rule Review Training 7.06 Engineering Controls 25.11 Management Cost 1.31 Protective Equipment 0.31 Rule Review 2.01 Job Analysis 1.97 Total Estimated Cost 37.77
Source: Cost-Benefit Analysis of the Ergonomics Standard, Washington State Department of Labor and Industries, May 2000.
11
Lahiri S, et al - Cost-effectiveness of Preventing Occupational Back Pain This is a preprint of an article accepted for publication in the American Journal of Industrial Medicine
TABLE IV. Total Compliance Costs per Employee for the Selected Interventions
Industry Engineering/ administrative controls. Cost per employee ($)
Training Cost per employee ($)
Ergonomic Program Cost per employee ($)
SIC 0 Agriculture and Forestry
51.2 7.085
63.23 SIC 1 Mining and Construction
99.8 13.63
127.13 SIC 2 Manufacturing-Non durables
19.1 5.355
29.51 SIC 3 Manufacturing-Durables
36.6 10.325
49.68 SIC 4 Transportation & Public Utilities
37.2 7.27
55.88 SIC 5 Wholesale & Retail Trade
20.1 6.88
30.27 SIC 6 Finance, Insurance & Real Estate
76.8 5.74
19.34 SIC 7 General Services
14.6 6.965 27.92
SIC 8 Professional Services 10.1 4.93
20.76 SIC 9 Public Administration
23.9 6.86 36.16
Total Economy 25.1 7.06 37.77 Source: State of Washington, Department of Labor and Industries. 2000. Cost-benefit analysis of the Ergonomics Standard.
12
Lahiri S, et al - Cost-effectiveness of Preventing Occupational Back Pain This is a preprint of an article accepted for publication in the American Journal of Industrial Medicine
2. AFROE Botswana, Burundi, Central African Republic, Congo, Cote d'Ivoire, Dem. Republic of the Congo, Eritrea, Ethiopia, Kenya, Lesotho, Malawi, Mozambique, Namibia, Rwanda, South Africa,Swaziland, Uganda, United Rep. of Tanzania, Zambia, Zimbabwe
3. AMROA Canada, United States of America
4. AMROB
Antigua and Barbuda, Argentina, Bahamas, Barbados, Belize, Brazil, Chile, Colombia, CostaRica, Cuba, Dominica, Dominican Republic, El Salvador, Grenada, Guyana, Honduras, Jamaica,Mexico, Panama, Paraguay, Saint Kitts and Nevis, Saint Lucia, Saint Vincent and Grenadines,Suriname, Trinidad and Tobago, Uruguay, Venezuela
5. AMROD Bolivia, Ecuador, Guatemala, Haiti, Nicaragua, Peru
6. EMROB Bahrain, Cyprus, Iran (Islamic Republic of), Jordan, Kuwait, Lebanon, Libyan Arab Jamahiriya,Oman, Qatar, Saudi Arabia, Syrian Arab Republic, Tunisia, United Arab Emirates
7. EMROD Egypt, Iraq, Morocco, Yemen
8. EURO A Andorra, Austria, Belgium, Croatia, Czech Republic, Denmark, Finland, France, Germany,Greece, Iceland, Ireland, Israel, Italy, Luxembourg, Malta, Monaco, Netherlands, Norway, Portugal, San Marino, Slovenia, Spain, Sweden, Switzerland, United Kingdom
9. EURO B1 Albania, Bosnia and Herzegovina, Bulgaria, Georgia, Poland, Romania, Slovakia, TFYRMacedonia, Turkey, Yugoslavia
Lahiri S, et al - Cost-effectiveness of Preventing Occupational Back Pain This is a preprint of an article accepted for publication in the American Journal of Industrial Medicine
TABLE VI Price of Labor in the Different subregions as a Ratio of Price of Labor in AMROA
Source: Our assumptions were based on data from (i) The Key Indicators Key Indicators of the Labour Market (KILM): KILM 17. Hourly compensation costs; The International Labour Organization (ILO); http://www.ilo.org/public/english/employment/strat/kilm/kilm17.htm
(ii) data files prepared by GPE/EQC/CEA (Master Price List) World Heath Organization (iii) our own judgment to reconcile the differences.
Lahiri S, et al - Cost-effectiveness of Preventing Occupational Back Pain This is a preprint of an article accepted for publication in the American Journal of Industrial Medicine
ahiri S, et al - Cost-effectiveness of Preventing Occupational Back Pain This is a preprint of an article accepted for publication in the American Journal of Industrial Medicine
Lahiri S, et al - Cost-effectiveness of Preventing Occupational Back Pain This is a preprint of an article accepted for publication in the American Journal of Industrial Medicine
(dollars/ Years of Healthy Life Gained) at Alternative Rates of Incidence Reduction
AFROD AMROA EUROB1 SEAROD
EC
20% 852.58 2017.29 2294.00 923.53
56% 303.68 723.56 819.60 327.12
60% 282.48 676.23 764.67 304.86
74% 228.74 546.54 619.80 246.60
T&EC
20% 929.93 2561.96 2733.94 1022.18
56% 332.12 919.41 976.83 362.02
60% 308.94 859.19 911.42 337.68
74% 249.49 694.11 738.66 272.94
Ergo
20% 1034.64 3035.58 3138.15 1143.44
56% 369.51 1089.38 1121.26 404.97
60% 342.80 1017.58 1046.05 377.45
74% 278.00 823.04 847.46 305.49
17
Lahiri S, et al - Cost-effectiveness of Preventing Occupational Back Pain This is a preprint of an article accepted for publication in the American Journal of Industrial Medicine
Figure1: Ranked Average Cost Effectiveness Ratios ($/healthy life years gained) for Training Intervention
0
100
200
300
400
500
600
AMROA
EUROA
EUROC
WPROA
EUROB1
EUROB2
SEAROB
AMROB
WPROB1
WPROB2
EMROB
WPROB3
AMROD
AFROE
SEAROD
AFROD
EMROD
Region
$/h
ealth
y lif
e ye
ars
gain
ed
Figure2: Ranked Average Cost Effectiveness Ratios ($/healthy life years gained) for Engineering Control Intervention
0100200300400500600700800900
1000
EUROC
EUROB1
AMROA
EUROA
SEAROB
WPROA
EUROB2
WPROB1
AFROE
WPROB2
AMROB
WPROB3
SEAROD
AMROD
AFROD
EMROB
EMROD
Region
$/he
alth
y lif
e ye
ars
gain
ed
18
Lahiri S, et al - Cost-effectiveness of Preventing Occupational Back Pain This is a preprint of an article accepted for publication in the American Journal of Industrial Medicine
Figure 3: Ranked Average Cost Effectiveness Ratios ($/healthy life years saved) for
Training and Engineering Control Intervention
0
100
200
300
400
500
600
700
800
900
1000
EUROC
EUROB1
AMROA
EUROA
WPROA
SEAROB
EUROB2
WPROB1
WPROB2
AFROE
AMROB
WPROB3
SEAROD
AMROD
AFROD
EMROB
EMROD
Region
$/he
alth
y lif
e ye
ars
gain
ed
Figure 4: Ranked Average Cost Effectiveness Ratios ($/healthy life years gained) for Ergonomics Intervention
0
100
200
300
400
500
600
700
800
900
1000
EUROC
EUROB1
AMROA
EUROA
WPROA
SEAROB
EUROB2
WPROB1
WPROB2
AFROE
AMROB
WPROB3
SEAROD
AMROD
AFROD
EMROB
EMROD
Region
$/he
alth
y lif
e ye
ars
gain
ed
19
Lahiri S, et al - Cost-effectiveness of Preventing Occupational Back Pain This is a preprint of an article accepted for publication in the American Journal of Industrial Medicine
Notes: Training (T); Engineering Control (EC); Training and Engineering Control(T&EC); Full Ergonomic Program (Ergo) Figure6: Cost of Interventions versus healthy life years in AFROE, WPROB1,SEAROD,EUROA,AMROD
0.00
500.00
1000.00
1500.00
2000.00
2500.00
3000.00
3500.00
0.00 1.00 2.00 3.00 4.00 5.00 6.00 7.00 8.00 9.00
Healthy Years Gained (in millions)
Cos
t $ (i
n m
illio
ns)
AFROEWPROB1SEARODEUROAAMROD
T&EC
T&EC
T&EC
T&EC
T&EC
Ergo
Ergo
Ergo
Ergo
Ergo
TT
T T
ECEC
EC
EC
20
Lahiri S, et al - Cost-effectiveness of Preventing Occupational Back Pain This is a preprint of an article accepted for publication in the American Journal of Industrial Medicine