Summary Alternative jet fuels (AJFs) are among the few available in-sector approaches to reduce aviation sector emissions. Although the aviation sector has not played a prominent role in fuels policy to date, policy-makers are increasingly incorporat-ing aviation fuels into long-term strategies as the road sector is electrified. This report reviews the existing literature on the economics of AJF production and assesses the costs of production for a selection of AJF conversion technologies, incor-porating life-cycle greenhouse gas (GHG) emissions accounting into the economic analysis of AJF production and identifying the AJF production pathways that offer the most cost-effective carbon reductions.
We find that different AJF tech-no log ies have w ide ly va ry ing levlized production costs and carbon abatement potential. AJF production costs can vary substantially, ranging from around €0.88 per liter for hydro-processed fuels made from waste fats and oils [i.e., hydroprocessed esters and fatty acids (HEFA)] to €3.44 per liter for the direct conversion of sugar to jet fuel; these prices are two to eight times the price of petroleum jet fuel. We estimate that the most cost-effective fuel for carbon abatement in the near term is used cooking
oil–derived HEFA at approximately €200 per tonne of CO2 equivalents (CO2e) reduced; however, waste fats and oils are already widely used by the road sector and therefore their supply may be limited. The next most effective options are the gasification of municipal solid waste and lignocel-lulosic feedstocks, which have a cost of approximately €400 to €500 per tonne of CO2e reduced. We find that it is important for policies to incentivize AJFs on the basis of GHG reduction performance rather than volumes of fuel supplied.
Prioritizing aviation fuels within fuels policies can create perverse incentives. For example, the recast European Union Renewable Energy Directive (RED II) applies a multiplier level of 1.2 for AJFs counting toward the target for renewable energy in transport. Because most AJF pathways involve producing a mixed slate of road and aviation fuels, policies such as multipliers that credit one sector at a higher rate than others can prove to be ineffective or even counterproductive. We find that a policy multiplier of around 1.3 would most likely induce existing producers to operate less efficiently in order to produce additional AJF, while this level would not be sufficient to drive investment in new facilities. Multipliers that prioritize the aviation
sector can thus dilute the effective-ness of fuels policies while increasing their costs.
Supplementary policies are necessary to mitigate the risk and uncertainty associated with AJFs produced using advanced, capital-intensive conversion technologies. Although the lowest-carbon fuels generally have low feedstock costs, this benefit is offset by high upfront capital expenses that pose a much larger risk to potential investors than tech-nologies with relatively low capital costs, such as HEFA fuels. Even with valuable production incentives, first-of-a-kind projects based on either gasification or alcohol-to-jet processes may require direct financial support, such as grants or contracts-for-difference to mitigate investors’ perception of risk and bring those projects to the market.
IntroductionAviation is one of the fastest-growing sources of greenhouse gas (GHG) emissions globally, averaging more than 4% annual growth in emissions as people worldwide travel more often. Electrification is commonly seen as a promising strategy for decarbon-izing the road sector. There are more limited opportunities to electrify aircraft, however, so the aviation sector will likely remain reliant on
WORKING PAPER 2019-05
The cost of supporting alternative jet fuels in the European UnionAuthor: Nikita Pavlenko, Stephanie Searle, and Adam Christensen
Acknowledgments: This work was generously supported by the European Climate Foundation. Thanks to Mark Staples of MIT’s Lab for Aviation and the Environment and Andrew Murphy and Jori Silvonen, both of Transport & Environment, for reviews and helpful input.
THE COST OF SUPPORTING ALTERNATIVE JET FUELS IN THE EUROPEAN UNION
2 INTERNATIONAL COUNCIL ON CLEAN TRANSPORTATION WORKING PAPER 2019-05
liquid fuels largely through 2050, particularly for long-haul flights (Hall et al., 2018). Steeper GHG reductions would thus require carbon intensity reductions in the liquid fuel used in aviation through switching to alterna-tive fuels.
Total worldwide offtake agreements for alternative jet fuels (AJFs) have been slow, falling far short of 1% of global aviation fuel consumption (U.S. Department of Agriculture, 2018; U.S. Department of Energy, 2017). The slow commercialization of AJF production is primarily attributable to two connected factors: high costs and lack of policy support. AJFs require separate, more complex processing relative to conventional, first-gener-ation biofuels in order to be used as “drop-in” fuels that meet the same operational specifications as conven-tional jet fuels. The additional cost and complexity of these advanced conversion processes can bring the overall price of production for AJFs to several times that of conventional jet fuel, making it impossible for AJFs to compete in the market without strong policy support.
A number of policies are beginning to incentivize lower-carbon fuels in aviation. The International Civil Av iat ion Organ izat ion ( ICAO) recent ly unve i l ed the Carbon Offsetting and Reduction Scheme for International Aviation (CORSIA), which targets carbon-neutral growth in the aviation sector beyond 2020 through a variety of market-based measures for airl ines, including carbon of fsets (such as Clean Development Mechanism credits), improved airplane efficiency, and switching to lower-carbon fuels. AJFs are eligible within the United States’ Renewable Fuel Standard (RFS), and California and the United Kingdom have recent ly moved to a l low crediting of low-carbon jet fuel in the Low Carbon Fuel Standard (LCFS) and the Renewable Transport Fuel Obligation (RTFO), respectively. The European Union (EU) has historically
not supported AJFs, excluding the aviation sector from the 2020 targets for the Renewable Energy Directive (RED). However, the EU has recently moved to include AJFs in its recast Renewable Energy Directive for the 2021–2030 period (RED II), including a 1.2 multiplier for AJFs and marine fuels relative to fuels used in the road and rail sectors. This directive, including the support for AJFs, must be implemented by member states with national legislation.
It is unlikely that technology improve-ments alone can result in cost parity for AJFs; however, policy support can help to bridge the gap between them and conventional fuels. The imple-mentation of RED II for 2030, along with the introduction of CORSIA, may together create a framework where individual member states can develop their own tailored aviation fuels policies. As countries begin to update their own, national-level fuels policies, it is critical that they learn from the mistakes made in the road biofuels sector, where more than a decade of policy support has greatly expanded the use of food-based feedstocks yet fostered minimal growth in very-low-carbon advanced biofuels. If the international aviation sector intends to achieve its decar-bonization goals by 2050, policies should instead focus on supporting fuels with deep carbon savings.
Although our understanding of the costs of production of AJFs has grown substantially in recent years, the relationship between the levelized production costs of emerging AJF conversion pathways and the environmental performance of those pathways has thus far played a minor role in informing policy design for aviation fuels. Here, we explore the cost-effectiveness of fuel switching for a variety of AJF conversion pathways from a climate perspective and highlight the policy conditions necessary for AJF deployment to generate meaningful emissions reductions.
We use capital expenditure (CAPEX) estimates from the literature, in con-junction with data on the operating costs and input and output prices from specific production processes, to better understand how different factors influence the final costs of production for a selection of AJF pathways. We then discuss how policy can be designed to address the cost chal lenges specif ic to AJF pathways with greater climate m i t igat ion potent ia l . We a l so estimate the cost-effectiveness of climate mitigation for various AJF pathways and assess the quantity of financial support necessary to overcome the economic barriers for the best-performing AJF pathways.
Literature ReviewAs a first step, we review applicable literature on the primary alternative fuel types and the analytical tools that have been used to assess their costs and cost-effectiveness. This study assesses five pathways for AJF production already certified as drop-in fuels by ASTM International, meaning that they can be used for commercial aviation if they meet the criteria specified in the ASTM standard. ASTM D7566 specifies the necessary characteristics for each of the five fuels and their maximum allowable blending rates with con-ventional jet fuel; if they meet those specifications, the final blended fuels can be used interchangeably with conventional jet fuel (ASTM International, n.d.).1 We evaluate the following fuel conversion pathways:
• Hydroprocessed esters and fatty acids (HEFA or HEFA-SPK): The HEFA pathway uses fatty feedstocks such a vegetable oils or waste fats, which first
1 The specifications laid out in D7566 limit drop-in fuels to certain blend rates, from 10% to 50%, depending on chemical composition. In this study, we evaluate the production costs and life-cycle emissions only for the drop-in fuels rather than the final blended fuels.
THE COST OF SUPPORTING ALTERNATIVE JET FUELS IN THE EUROPEAN UNION
WORKING PAPER 2019-05 INTERNATIONAL COUNCIL ON CLEAN TRANSPORTATION 3
u n d e rg o a d e oxyg e n a t i o n reaction followed by the addition of hydrogen in order to break down the fatty compounds into hydrocarbons, which can then be further refined into a mix of various liquid fuels. Can be blended up to 50%.2
• Synthesis gas Fischer-Tropsch synthesized paraffinic kerosene (FT-SPK): This fuel conversion pathway includes the gasification of feedstocks into synthesis gas (i.e., syn-gas), a mix of CO and H2. The syn-gas is then combined with a catalyst in a reactor to generate a mix of hydrocar-bons, which can then be refined into various liquid fuels. Can be blended up to 50%.
• Power - to- l iqu ids F i scher -Tropsch synthesized paraffinic kerosene (PtL or FT-SPK): Similar to FT-SPK from bio-feed-stocks, synthesis gas can also be generated from the electrolysis of water (using renewable electric-ity) and combined with captured carbon to generate a suitable feedstock for FT synthesis. Can be blended up to 50%.
• Alcohol-to-jet synthesized paraffinic kerosene (ATJ-SPK): This fuel conversion pathway uses fermentation to convert sugars, starches, or hydrolyzed cellulose into an intermediate alcohol, either isobutanol or ethanol, which is then further processed and upgraded into a mix of hydrocarbons. Can be blended up to 50%.
• Synthesized isoparaffins (SIP): Also called direct sugars-to-hydrocarbons (DSHC), this fuel conversion pathway converts sugary feedstocks through fer-mentation into farnesene (C15H24),
2 HEFA+ or high–freeze point HEFA (HFP-HEFA) is currently undergoing testing for ASTM certification. This variant of HEFA has a higher freeze point than standard HEFA fuel and would only be allowed to be blended up to 10% (Pavlenko & Kharina, 2018).
a molecule with a carbon chain length closer to distillate hydro-carbons than traditional alcohol fermentation products, followed by upgrading into farnesane (C15H32), which can be used as a drop-in fuel. Can be blended up to 10%.
This study’s assessment of production costs for the above fuel pathways draws upon a wide body of existing techno-economic analyses for AJF production, the majority of which use process modeling to estimate CAPEX values and material flows. Two studies (Bann et al., 2017; de Jong, 2018) developed harmonized assessments of the cost of production for a variety of fuel conversion pathways. Other published techno-economic analyses focus on specific production systems, estimating the cost of production for a specific fuel conversion pathway or feedstock.
B e c a u s e o f s c a rce d a t a f ro m co m m e rc i a l o p e ra t i o n s , m o st bottom-up CAPEX cost estimates must be estimated from process modeling and simulations rather than from actual facility data [Albrecht et al . , 2017; (S&T)2 Consultants, 2018]. Process modeling of a hypo-thetical advanced fuel facility uses existing data on the chemistry and efficiency of conversion processes at pilot scales to create a bottom-up estimate of a system’s operating conditions (e.g., yield, temperature), production stages, and equipment needs at larger scales. Reliance on process modeling can lead to wide uncertainty on the cost of production for advanced pathways, particu-larly capital-intensive pathways far away from commercialization; these pathways tend to have low levels of available reference data on their equipment and installation costs (Albrecht et al., 2017). A poor under-standing of the shape of learning curves for these pathways, which reflect the reduction of future costs as experience with the technology in question accumulates, may add
further uncertainty to the future CAPEX of advanced fuel production.
The AJF production process closest to full-scale commercial production is the HEFA pathway, in which fats and oils are converted into synthetic hydrocarbons [Pavlenko & Kharina, 2018; (S&T)2 Consultants, 2018]. This fuel conversion pathway is similar to that of renewable diesel [also called hydrotreated vegetable oil (HVO) or hydrogenation-derived renewable diesel (HDRD)], with the addition of further hydrocracking to produce hydrocarbons within the jet fuel range. The renewable diesel production process itself generally produces some jet fuel–range hydro-carbons as a co-product (generally around 25% of the total fuel product yield). It may be possible to optimize a renewable diesel facility to produce a greater share of HEFA, but this would likely raise overall operating costs (Pearlson et al., 2013). We can infer many of the production costs for HEFA from existing renewable diesel projects, particularly where both types of fuel are produced as co-products. It is also possible to reduce upfront costs through repurposing existing facilities (i.e., brownfield development), as demonstrated by AltAir, a HEFA producer that uses a redeveloped asphalt refinery (Kharina & Pavlenko, 2017; Pearlson et al., 2013).
The expected capital costs for new renewable diesel and HEFA production facilities are expected to be in the range of several hundred million euros [(S&T)2 Consultants, 2018]. For a facility using the Neste process with an output of 1,000 tonnes per day (approximately 450 mill ion liters per year), de Jong (2018) estimated a total cost of installation (inclusive of equipment purchase, planning, and installation) of between €207 and €670 million. Likewise, the EU Sub Group on Advanced Biofuels (Maniatis et al., 2017) estimated that the capital costs for a facility producing 625 million
THE COST OF SUPPORTING ALTERNATIVE JET FUELS IN THE EUROPEAN UNION
4 INTERNATIONAL COUNCIL ON CLEAN TRANSPORTATION WORKING PAPER 2019-05
liters per year would range from €250 million to €750 million. Pearlson (2011) estimated that a renewable diesel/HEFA facility with a capacity of approximately 220 million liters per year would bear capital costs of approximately €100 million, with a range of possible values depending on the exact nameplate capacity (i.e., the maximum production capacity) of the project. Available actual cost data on existing renewable diesel facilities is generally in sync with these assess-ments. Neste’s renewable diesel conversion facility in Singapore, with a capacity of nearly 1 billion liters per year, cost approximately €600 million to construct (€ 2018). Estimates from the Shell Company of Australia suggest that a hydroprocessing facility with an annual capacity of 450 to 1400 million liters would require between €389 million and €839 million to construct (Qantas, 2013). Diamond Green Diesel recently spent approximately €165 million to expand its U.S. production of renewable diesel by more than 400 million liters per year, noting a 50% cost reduction by using an existing brownfield site (Darling Ingredients, 2016).
Overall, estimates of capital spending on renewable diesel/HEFA facilities ra n g e f ro m a ro u n d € 0 . 4 0 to €1.50 per liter of annual capacity, averaging around €0.60 per liter, with larger facilities generally having lower per-liter capital costs due to economies of scale. De Jong (2018) estimated that the potential for future improvements in capital costs from technological improvements for renewable diesel/HEFA are likely to be minimal. Operating costs for HEFA production are dominated by feedstock acquisition, the largest single contributor to the overall cost of fuel production (Pearlson et al., 2013). Maximizing jet fuel yields increases the operating expenses through the use of additional hydrogen for more extensive hydrocracking, while reducing the overall yield of liquid fuel products (Pearlson et al., 2013). Another option for increasing the jet
fuel yield from a renewable diesel facility is the opportunity to produce HEFA+, which is currently undergoing testing for ASTM certification; this variant would have physical properties closer to those of conventional renewable diesel but would be limited to only a 10% blend rate in jet fuel (Pavlenko & Kharina, 2018).
Whereas renewable diesel and HEFA fuels are largely already produced at commercial scales, the costs and operating specifications of other fuel conversion pathways that are much further from commercialization are much more uncertain. The gasification and Fischer-Tropsch (gasification-FT) route of fuel production can be used to convert a range of low-cost agricultural residues, energy crops, and municipal solid waste (MSW) into a slate of liquid fuels, including renewable diesel , jet fuel , and gasoline. Relative to several other fuel conversion pathways, gasification-FT is particularly capital-intensive; although the technology is anticipated to improve over time, even Nth-of-a-kind projects are anticipated to have very high capital costs in the near term. Estimates for the capital expen-diture on gasification vary widely; according to the process character-ization developed by de Jong (2018), the potential total cost of investment for a project with a capacity of approximately 220 million liters per year ranges between €339 million and €1,230 million—one of the greatest variances among fuel conversion pathways in that analysis. Techno-economic analyses from several U.S. national laboratories suggest that the capital costs for integrated gasifica-tion–fuel production facilities could range from €390 million to €610 million for capacities between 90 and 150 million liters per year, depending on configuration (Swanson et al., 2010; Zhu et al., 2011). On average, gasification-FT capital costs are estimated to range from €4 to €6 per liter of annual production capacity. Interviews conducted by Peters et al. (2015) suggest that a first-of-a-kind or
pioneer project with a capacity of 120 million liters per year could cost more than €500 million to construct, but subsequent process improvements on the gasification stage could reduce overall capital costs by as much as 30% for Nth-of-a-kind projects.
FT synthesis can also be used to convert hydrogen produced via renewable e lectr ic i ty–powered hydrolysis into drop-in aviation fuels [i.e., power-to-liquids (PtL)], although this conversion pathway is likely to have highly variable costs associated with the cost of renewable electricity in the EU, particularly in the short term (Searle & Christensen, 2018). Techno-economic analysis of PtL suggests that capital expendi-tures and input electricity costs can be substantial, with capital costs for a project with a capacity of around 120 million liters per year of €300 million to €700 million for PtL production via FT synthesis—a range of €2.5 to €7 per liter of annual capacity, depending on configuration (Schmidt et al., 2016).
Converting sugars, starches, and cellulosic feedstocks into jet fuel is possible through several methods collectively called “alcohol-to-jet” (ATJ). These processes generally produce either ethanol or isobutanol through fermentation as an interme-diate molecule prior to dehydration and oligomerization into a synthetic hydrocarbon. Whereas first-gener-ation ethanol production from food feedstocks is already relatively com-mercialized, with well-documented costs, the additional expense of dehydration and oligomerization is less certain. Maniatis et al. (2017) est imated a range of € 1 .00 to €1.40 per liter for the conversion of sugars to aviation fuels. The authors estimated that the cost of producing cellulosic ethanol alone is €0.84 to €1.50 per liter, and that an added finishing step to produce drop-in jet fuels would likely increase the cost to beyond €1.40/liter. Tao et al. (2017) estimated that the capital cost for
THE COST OF SUPPORTING ALTERNATIVE JET FUELS IN THE EUROPEAN UNION
WORKING PAPER 2019-05 INTERNATIONAL COUNCIL ON CLEAN TRANSPORTATION 5
a hydrocracking system to upgrade corn ethanol would add €78 million to that of a corn ethanol facility with a production capacity of 230 million liters per year; the total installed cost would exceed €350 million. Cellulosic ATJ facilities would have substantially higher capital costs as a result of the additional pretreatment and cellulosic conversion prior to fermentation.
Tao et al. (2017) estimated that a corn stover conversion ATJ facility would cost approximately 1.5 times the CAPEX of a corn grain ATJ facility. Similarly, Yao et al. (2017) estimated that a switchgrass ATJ faci l i ty producing 230 million liters per year would cost more than €650 million—twice the cost of a comparable corn ethanol ATJ facility. The authors assumed that the feedstocks would be converted into ethanol as an inter-mediate molecule, prior to upgrading into a hydrocarbon product slate (i.e., ethanol-to-jet). Using a mix of literature data and Aspen Plus simu-lations, they estimated the capital costs and their distribution across the fermentation, dehydration, and oligo-merization steps. Such a production scale—230 million liters per year of ethanol (around 140 million liters diesel equivalent)—is on the upper end of projected cellulosic ethanol facilities in the literature and is much larger than that of any existing cellulosic ethanol facility. Overall, Yao et al. found that the CAPEX for cellulosic ATJ would be approximately 60% higher than for conventional ATJ at a similar production scale (Tao et al., 2017).
It is also possible to directly convert sugars into jet fuel without the intermediate step of producing alcohol. This may facilitate the use of cheaper feedstocks such as corn grain and sugarcane in lieu of more expensive vegetable oils. Because this technology is relatively far from com-mercialization for fuel production, the most extensive analysis available in the literature is from Klein-Marcuschamer et al. (2013), which assessed the
economics of SIP production from a variety of feedstocks using simulated process modeling from SuperPro Designer. In that analysis, the authors evaluated the economics of a smaller facility with a nameplate capacity of 61 million liters per year, estimating capital expenditures of approxi-mately €250 million for the sugarcane conversion process. The authors used Aspen Plus simulations in con-junction with scientific literature, model validation, and vendor quotes to estimate the cost of equipment purchase and installation. Of the €250 million CAPEX, the authors estimated that nearly 90% of the total would be attributable to the finishing stage, where the farnesene is hydrogenated to form farnesane, with the remaining 10% of the costs coming from com-paratively simple processes for sugar fermentation and separation. An existing producer of SIP fuels, Amyris, found that fuel production provided relatively little value compared to the cost of sugar, and pivoted to producing biochemicals in lieu of fuels (Bullis, 2012; Lane, 2018).
Cost assessment methodologyThis study uses a discounted cash f low rate-of- return (DCFROR) model to assess the incentive cost necessary to support the production of a selection of advanced AJFs using various feedstocks. The DCFROR model incorporates the capital costs, operating costs, and feedstock price for each fuel, paired with technical data on each conversion pathway’s operating parameters and product yields. We then use the DCFROR model to estimate the minimum viable jet fuel selling price (i.e., minimum viable price) to break even on an investment for each fuel conversion pathway, after accounting for a 15% rate of return.
This study uses the calculated min imum viable pr ices for the selection of fuel conversion pathways and feedstocks to evaluate the
impacts of policy support on costs of production. We also incorpo-rate life-cycle assessment (LCA) data for several representative fuel pathways in order to compare the normalized cost of carbon reduction for fuel switching relative to baseline petroleum jet fuel. We then identify the fuel pathways that offer the most cost-effective routes to aviation decarbonization.
DISCOUNTED CASH FLOW RATE-OF-RETURN MODELING
The DCFROR method we use to estimate the cost of production for each AJF pathway is consistent with the prevailing methodology for techno-economic assessments of next-generation fuel pathways. The DCFROR analysis estimates the present-day net value of a project by forecasting future cash flows and applying a discount rate to them, thereby accounting for the time value of money. The cost modeling for this analysis is informed by a literature review to identi fy the relevant data inputs, using the most recent EU-specific data when available. All results are in 2018 euros. The DCFROR analysis uses the following formula to estimate the present-day value of a given project’s future cash flows:
DCF = CF1
(1+r)1 +
CF2
(1+r)2 + ... +
CFn
(1+r)n
Equation 1. Discounted cash flow calculation.
where
• CFX refers to the net cash flow in year x, including fuel sales, employee salaries, facility depre-ciation, and maintenance
• r is the discount rate for the value of future cash flows [here, we use a weighted average cost of capital (WACC) of 7%]
• n is the lifetime of the project
We use the discounted cash flow estimate to estimate the future net earnings from a project relative to the
THE COST OF SUPPORTING ALTERNATIVE JET FUELS IN THE EUROPEAN UNION
6 INTERNATIONAL COUNCIL ON CLEAN TRANSPORTATION WORKING PAPER 2019-05
upfront investment in that project’s capital expenses (i.e., CAPEX). The net present value of a given project is estimated using the following formula:
NPV = Σt=1
T
DCFt
(1+r)t – C0
Equation 2. Net present value calculation.
where
• T is the lifetime of the project
• t is the time period
• r is the discount rate (here, we use the desired rate of return for the project of 15%)
• DCF is the discounted cash flow of the project, equal to DCF in Equation 1
• C0 is cash flow in year 0 (i.e., the CAPEX of the project)
For each pro ject , we est imate the minimum viable price for AJF necessary for the net present value to equal zero in Equation 2 while the project generates an internal rate of return (IRR) of 15%. The key parameters for the calculation are provided in Table 1, which contains the values and assumptions used for the discounted cash flow calcula-tion, as well as the background and citations for each parameter.
For fuel conversion pathways that generate both diesel and jet fuel, we solve for a common minimum viable price for both fuels. This assumption is examined in more detail in the discussion below.
COSTS OF PRODUCTION
We estimate the levelized cost of production for alternative fuels by first assessing the upfront CAPEX for each fuel conversion pathway. CAPEX values are drawn from the literature, using representative values from a selection of studies, as shown in Table 2. For each technology, the CAPEX value used reflects the total cost of installation, including equipment purchase, installation, and planning. CAPEX values, particularly
for non-HEFA conversion pathways, are highly uncertain and could vary by as much as 50% in either direction, particularly in the long term [(S&T)2 Consultants, 2018].
HEFA CAPEX values are informed primarily by Pearlson (2011) and Pearlson et al. (2013), which estimate the cost for three different facility sizes for soy oil hydroprocessing facilities producing a range of hydro-carbons. Here, we use the middle-range value of approximately €137 million for a project with a capacity of more than 230 million liters of liquid products per year (reflecting an assumption of roughly €0.6 per liter of production capacity). At around €0.50 per liter of capacity, the CAPEX value from these two studies falls within the range of values for typical HEFA and renewable diesel facil it ies suggested by de Jong (2018) and Maniatis et al. (2017). The capacity is within the middle range
of sizes of existing HEFA facilities, between the smaller, 150-million-liter AltAir facility and Neste’s larger, 1-billion-liter biorefineries.
Re lat ive to the HEFA process , gasification-FT has a wider range of possible CAPEX values, largely due to uncertainty about the equipment and installation costs for large-scale gasifiers. For this analysis, we use a value developed from data from investment analysis for advanced biofuel production conducted by Peters et al. (2015). On the basis of this estimate, we use a standardized scaling factor to adjust the capacity of the facility to match the HEFA and ATJ facilities at approximately 230 million liters per year; we thus estimate a CAPEX of approximately €585 million. Pioneer gasification facilities are expected to have a large contingency in their capital expenses due to uncertainty over the costs for some process stages, suggesting that
Table 1. Key parameters for DCFROR analysis.
Parameter Value Reference/background
Weighted average cost of capital
7%
Estimated from the weighted average cost of capital (WACC) from the NREL Annual Technology Baseline Dataset (National Renewable Energy Laboratory, n.d.).
Project lifetime 20 years
The typical project lifetime ranges from 20 to 30 years across the technical literature. A 20-year value was chosen to align with the harmonized analysis developed by Bann et al. (2017).
Construction time 3 years
This value was selected as a middle-range estimate in line with the harmonized techno-economic assessment conducted by Bann et al. (2017) and the HEFA-specific assessment developed by Pearlson (2011).
Depreciation schedule Straight line
Straight-line depreciation reflects the lack of a pattern to the way in which a project is run over its lifetime. This default assumption is used throughout the techno-economic analyses cited and is used by the harmonized analysis developed by de Jong (2018) and Bann et al. (2017).
Depreciation period 10 years
This assumption reflects the standard accounting practices for new biofuel facilities used in both of the harmonized techno-economic assessments developed by de Jong (2018) and the HEFA-specific analysis developed by Pearlson (2011).
Ramp-up time
3 years; 25% of capacity in year 1
of operation, 50% in year 2, 75% in year 3
This is ICCT’s assumption based on documented delays in reaching full-scale production at existing commercial, second-generation biofuel facilities using lignocellulosic feedstocks (Pavlenko, 2018).
Inflation rate 1% 2013–2018 average (Eurostat, 2018b).
THE COST OF SUPPORTING ALTERNATIVE JET FUELS IN THE EUROPEAN UNION
WORKING PAPER 2019-05 INTERNATIONAL COUNCIL ON CLEAN TRANSPORTATION 7
as experience improves over time, the CAPEX value could decrease.
The level ized costs for PtL are estimated using data from Searle and Christensen (2018), which estimates the cost curves for PtL deployment across the EU from 2020 to 2050. That study uses a separate DCFROR analysis with a similar set of assump-tions to estimate the necessary incentive values to stimulate PtL production in each EU country. We extract the data for PtL middle distil-lates manufactured in France from solar electricity in conjunction with CO2 captured from industrial point sources to estimate the minimum viable price for PtL AJF.
The CAPEX values for the ATJ convers ion process are drawn primarily from Tao et al. (2017) and Yao et al. (2017), which estimate the costs of production for ATJ from both conventional, crop-based feedstocks (i..e, sugars and starches) and corn stover, a cellulosic agricul-tural residue.
The CAPEX value for SIP production from sugarcane is drawn from Klein-Marcuschamer et al. (2013), which assesses the cost of production for direct conversion of the sugars in molasses to jet fuel. The study estimates a CAPEX of €250 million for a facility producing 61 million liters per year, including capital expenses for sugar fermentation, separation, and hydrogenation. As data on this conversion pathway is relatively limited, we did not assume a scale-up factor for this estimate.
Next, we estimate the operating costs for each conversion technology us ing process data and y ie lds from the literature where possible. Operating costs are broken out into several components: process inputs (i.e., direct conversion cost); the product slate (i.e., sales of the fuels and co-products from the conversion process); and direct, nonvariable costs such as for staff and insurance.
The costs of general process inputs (i.e., electricity, feedstocks, natural gas) and sales of the product slate are estimated using the prices shown in the Appendix. Direct, nonvariable costs for each conversion pathway are taken from each study along with the CAPEX values and are adjusted for inflation and the production capacity for each project.
The quantities of each material f lowing into or out of each fuel production system are informed by the literature for that specific process. The direct, nonvariable expenses for each process are taken directly from the literature, as described below. Yield assumptions, which have a substantial influence on the final cost of production for each pathway, are summarized in Table 3.
Process assumptions for renewable diesel and HEFA production are drawn pr imar i ly f rom Pear lson (2011) and Pearlson et al. (2013),
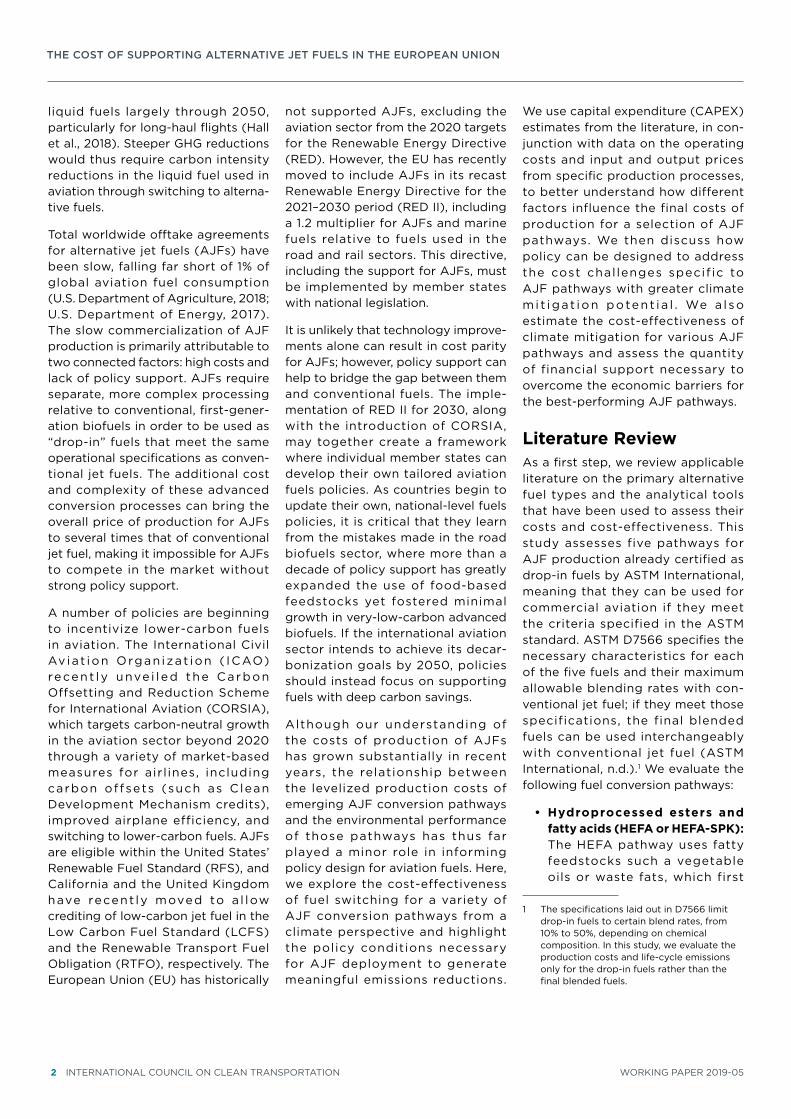
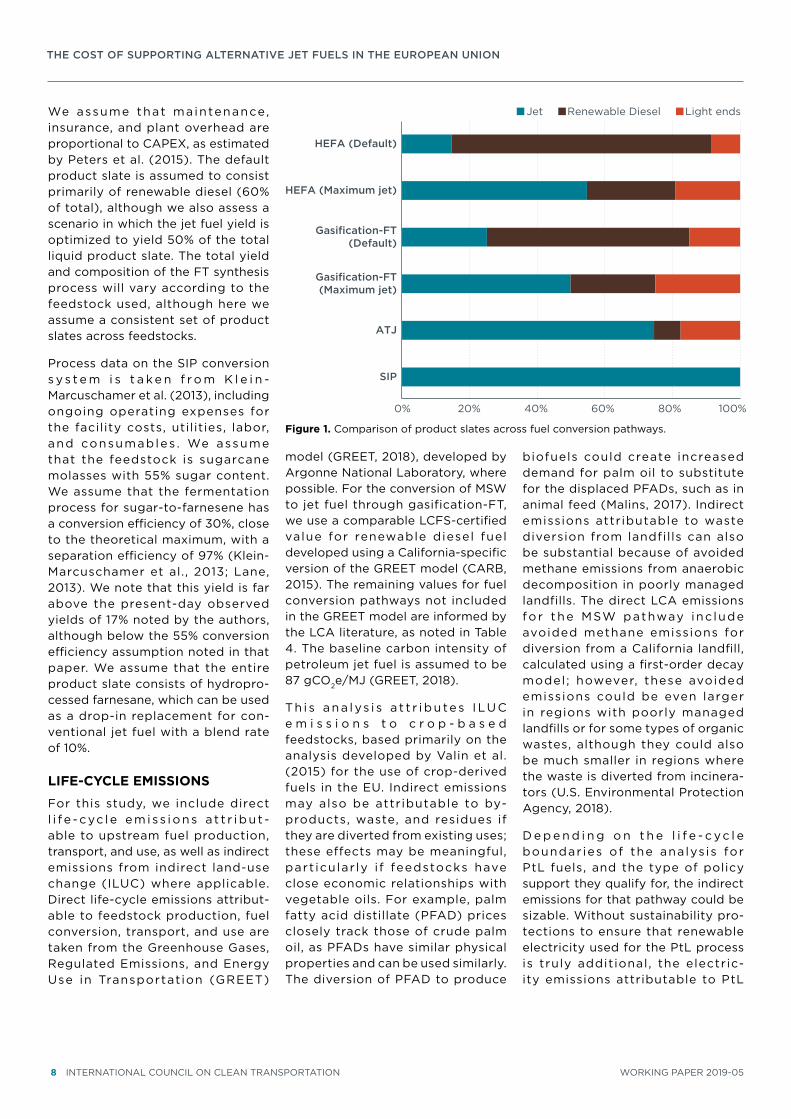
which both estimate the vegetable oil and hydrogen inputs necessary to produce a mix of light ends (e.g., propane), renewable diesel, and jet fuel. We also estimate the costs of production for the HEFA production process in which the yield of jet fuel is maximized. The overall product y ie ld for var ious feedstocks is relatively similar, although the option of maximizing jet fuel yields a higher fraction of light ends relative to liquid fuels. The relative product slate for the HEFA process is compared to the other fuel conversion technologies in Figure 1.
Process assumptions for the gas-if ication-FT conversion process are developed from Peters et al. (2015) in conjunction with more granular est imates of var iable costs developed by Swanson et al. (2010). For project yield, we assume a typical yield for an Nth-of-a-kind facility, as informed by the interviews conducted by Peters et al. (2015).
Table 2. CAPEX values for fuel production by pathway.
ParameterValue
(€ 2018, million)Assumed facility size
(million liters per year) Reference
HEFA 137 230 Pearlson, 2011; Pearlson et al., 2013
Gasification-FT 585 230 Peters et al., 2015
ATJ (sugars and starches) 355 230 Tao et al., 2017
ATJ (cellulosic) 548 230 Tao et al., 2017; Yao et al., 2017
SIP 250 61Klein-Marcuschamer et al., 2013
Table 3. Process yields for fuel conversion.
Conversion process and feedstock
Yield (tonnes total fuel production/tonne feedstock) Reference
HEFA 0.90 GREET, 2018; Pearlson et al., 2013
Gasification-FT 0.12 Peters et al., 2015
ATJ (corn-to-ethanol) 0.35 GREET, 2018
ATJ (sugar-to-ethanol) 0.47 GREET, 2018
ATJ (cellulosic) 0.26 Peters et al., 2015
ATJ (ethanol-to-jet) 0.95 Tao et al., 2017
SIP (sugarcane-to-farnesane) 0.30 (theoretical maximum) Klein-Marcuschamer et al.,
2013; Lane, 2018
THE COST OF SUPPORTING ALTERNATIVE JET FUELS IN THE EUROPEAN UNION
8 INTERNATIONAL COUNCIL ON CLEAN TRANSPORTATION WORKING PAPER 2019-05
We assume that maintenance, insurance, and plant overhead are proportional to CAPEX, as estimated by Peters et al. (2015). The default product slate is assumed to consist primarily of renewable diesel (60% of total), although we also assess a scenario in which the jet fuel yield is optimized to yield 50% of the total liquid product slate. The total yield and composition of the FT synthesis process will vary according to the feedstock used, although here we assume a consistent set of product slates across feedstocks.
Process data on the SIP conversion s y s t e m i s t a k e n f r o m K l e i n -Marcuschamer et al. (2013), including ongoing operating expenses for the facility costs, utilities, labor, and consumables . We assume that the feedstock is sugarcane molasses with 55% sugar content. We assume that the fermentation process for sugar-to-farnesene has a conversion efficiency of 30%, close to the theoretical maximum, with a separation efficiency of 97% (Klein-Marcuschamer et al., 2013; Lane, 2013). We note that this yield is far above the present-day observed yields of 17% noted by the authors, although below the 55% conversion efficiency assumption noted in that paper. We assume that the entire product slate consists of hydropro-cessed farnesane, which can be used as a drop-in replacement for con-ventional jet fuel with a blend rate of 10%.
LIFE-CYCLE EMISSIONS
For this study, we include direct l i f e -cyc le em i ss ions a t t r ibu t -able to upstream fuel production, transport, and use, as well as indirect emissions from indirect land-use change (ILUC) where applicable. Direct life-cycle emissions attribut-able to feedstock production, fuel conversion, transport, and use are taken from the Greenhouse Gases, Regulated Emissions, and Energy Use in Transportat ion (GREET)
model (GREET, 2018), developed by Argonne National Laboratory, where possible. For the conversion of MSW to jet fuel through gasification-FT, we use a comparable LCFS-certified value for renewable diesel fuel developed using a California-specific version of the GREET model (CARB, 2015). The remaining values for fuel conversion pathways not included in the GREET model are informed by the LCA literature, as noted in Table 4. The baseline carbon intensity of petroleum jet fuel is assumed to be 87 gCO2e/MJ (GREET, 2018).
Th i s a n a l ys i s a t t r i b u te s I LU C e m i s s i o n s t o c r o p - b a s e d feedstocks, based primarily on the analysis developed by Valin et al. (2015) for the use of crop-derived fuels in the EU. Indirect emissions may also be attributable to by-products, waste, and residues if they are diverted from existing uses; these effects may be meaningful, part icular ly i f feedstocks have close economic relationships with vegetable oils. For example, palm fatty acid distillate (PFAD) prices closely track those of crude palm oil, as PFADs have similar physical properties and can be used similarly. The diversion of PFAD to produce
biofuels could create increased demand for palm oil to substitute for the displaced PFADs, such as in animal feed (Malins, 2017). Indirect emissions attributable to waste diversion from landfills can also be substantial because of avoided methane emissions from anaerobic decomposition in poorly managed landfills. The direct LCA emissions fo r the MSW pathway inc lude avoided methane emissions for diversion from a California landfill, calculated using a first-order decay model ; however, these avoided emissions could be even larger in regions with poorly managed landfills or for some types of organic wastes, although they could also be much smaller in regions where the waste is diverted from incinera-tors (U.S. Environmental Protection Agency, 2018).
D e p e n d i n g o n t h e l i f e - c yc l e boundar ies of the analys is for PtL fuels, and the type of policy support they qualify for, the indirect emissions for that pathway could be sizable. Without sustainability pro-tections to ensure that renewable electricity used for the PtL process is truly additional, the electric-ity emissions attributable to PtL
0% 20% 40% 60% 80% 100%
SIP
ATJ
Gasification-FT(Maximum jet)
Gasification-FT(Default)
HEFA (Maximum jet)
HEFA (Default)
Jet Renewable Diesel Light ends
Figure 1. Comparison of product slates across fuel conversion pathways.
THE COST OF SUPPORTING ALTERNATIVE JET FUELS IN THE EUROPEAN UNION
WORKING PAPER 2019-05 INTERNATIONAL COUNCIL ON CLEAN TRANSPORTATION 9
would be similar to the marginal additional electricity for the grid, which will include both fossil and renewable sources. This analysis assumes that the electricity for PtL production comes from additional renewable electricity generation and uses a value of 13 gCO2e/MJ. This value attributes emissions for both the PtL production process and the upstream infrastructure necessary for additional renewable electricity generation (Searle & Christensen, 2018).
After factoring in ILUC emissions and indirect emissions for AJFs, there is a wide range of carbon intensities for various AJFs across the feedstocks and conversion pathway combina-tions, from near-zero for some of the gasification-FT pathways to well above the fossil fuel baseline for palm oil–derived HEFA fuel. Generally, HEFA fuels are on the higher end of the spectrum, largely as a result of the ILUC emissions attributable
to vegetable oils. Generally, the gasification-FT pathway has low direct emissions due to its use of by-products and wastes with minimal upstream or indirect emissions, as well as the export of electricity attributable to the system. There is substantial variation within the ATJ pathway, depending on feedstock, with crop-derived ATJ fuels having higher direct emissions than ligno-cellulosic feedstock–derived fuels.
ResultsCOSTS OF PRODUCTION
The minimum viable price calculated in this study reflects the fuel price necessary for an investment in a given fuel conversion technology to reach its targeted rate of return; in other words, the minimum viable price equals the levelized cost of production for that fuel technology. Figure 2 illustrates the levelized cost of production across conversion
pathways, relative to the wholesale cost of petroleum-derived jet fuel indicated by the dashed black line. The shading for each column provides a breakdown of the contri-butions of capital costs, operating costs, and feedstock price to the levelized cost of the production process. Across all of the AJF fuel conversion pathways in the figure, the minimum viable levelized cost exceeds the baseline fossi l fuel price, indicating that all AJFs will require policy support to compete with fossil jet fuel, although the level of necessary policy support can vary substantially depending on the feedstock and conversion process.
Generally, we find that the HEFA pathway is the cheapest source of AJF on a per-liter basis, with a levelized cost of around €0.88 to €1.09 per liter, depending on feedstock. Because of the relatively low CAPEX of the HEFA conversion process, most of its cost comes from
Table 4. Key parameters for discounted cash flow rate-of-return analysis.
Fuel
Direct emissions
(gCO2e/MJ)
ILUC emissions
(gCO2e/MJ)
Carbon intensity
(gCO2e/MJ)GHG savings
(%) Reference
Soy oil HEFA 27.9 to 34.9 150.0 177.8 to 184.9 N/A GREET, 2018; Valin et al., 2015
Palm oil HEFA 30.8 to 36.5 231.0 216.8 to 267.5 N/A GREET, 2018; Valin et al., 2015
Energy crop alcohol-to-jet (ATJ-SPK) 20.3 — 20.3 77% GREET, 2018; Valin et al., 2015
Molasses synthesized isoparaffins (SIP) 47.0 — 47.0 47% de Jong et al., 2017; Valin et al.,
2015
1 We assume an indirect emissions value of 213 gCO2e/MJ associated with PFAD use, due to PFADs’ close association with palm oil markets (Malins, 2017).2 Indirect emissions attributable to PtL include the consequential emissions for new renewable electricity generation infrastructure attributable to the
PtL project.
THE COST OF SUPPORTING ALTERNATIVE JET FUELS IN THE EUROPEAN UNION
10 INTERNATIONAL COUNCIL ON CLEAN TRANSPORTATION WORKING PAPER 2019-05
the feedstocks, which are among the most expensive in this analysis. At approximately €400 to €650 per tonne, the feedstock alone accounts for approximately half of the levelized production costs for the HEFA fuels. Yields for this pathway are also relatively high, with approximately 90% of the feedstock converted into the final product slate. Barring sub-stantial shifts in vegetable oil prices, it is thus likely that the future price of these fuels is unlikely to decline substantially, even with technologi-cal improvements, because of the expense of feedstock acquisition.
The gasif ication-FT conversion pathway is the next cheapest, par-ticularly for MSW-derived fuels, with a range of €1.34 to €1.87 per liter. The primary costs attributable to the conversion process come from upfront capital expenses, with more uncertainty than the HEFA process because a wide range of CAPEX values and yields is possible. However, operating and input costs are low as a result of relatively
low facility overhead, feedstock costs, and operating expenses. On a per-liter basis, CAPEX accounts for approximately 81% of the cost of gasification-FT fuels made from MSW and approximately 60% of the cost of gasification-FT fuels made from agricultural residues.
Th e P t L p ro ce ss , w h i c h u s e s relatively commercial ized tech-nologies for electrolysis and FT synthesis, incurs high costs due to the price of renewable electric-ity in the EU (Searle & Christensen, 2018). In the example here, based on a solar-powered PtL project in France, Searle and Christensen (2018) estimated that renewable electricity would constitute roughly 70% of the levelized costs. However, it is possible that PtL fuel could be cheaper to produce outside of the EU in other regions with abundant, low-cost sources of renewable electricity, such as North Africa (Perner et al., 2018).
The cost results for ATJ pathways i l l u s t ra te tha t l i gnoce l l u los i c
feedstocks a re approx imate ly 40% more expensive to convert into fuel. For corn and sugarcane, the upgrading process represents around 50% of the minimum viable price, whereas for lignocellulosic ATJ conversion, it only accounts for around 80% of the minimum viable price. A substantial portion of the ATJ production cost for food crop–derived fuels is attributable to ongoing feedstock and energy costs, whereas the largest expense for lig-nocellulosic ATJ pathways is attrib-utable to the upfront CAPEX costs, which account for approximately 40% of the levelized cost.
The expense of SIP production is largely driven by the economics of sugar conversion, in which large amounts of a relatively expensive feedstock a re conver ted i n to farnesene at low yields. Even at a relatively optimistic rate of 0.3 tonnes of farnesene per tonne of sugar, at a molasses price of €167/tonne and sugar content of approximately 55%, more than €1,000 worth of molasses
€0.00
€0.50
€1.00
€1.50
€2.00
€2.50
€3.00
€3.50
€4.00
€4.50
So
y o
il
Pal
m o
il
PF
AD
Use
d c
oo
king
oil
MS
W
Ag
ricu
ltur
alre
sid
ues
Ene
rgy
cro
ps
Ren
ewab
leel
ectr
icit
y
Co
rn g
rain
Sug
ar c
ane
Ag
ricu
ltur
alre
sid
ues
Ene
rgy
cro
ps
Sug
ar c
ane
mo
lass
es
HEFA Gasification-FT Power-to-liquids
ATJ SIP
Leve
lized
co
st o
f p
rod
ucti
on
(€/l
iter
)
CAPEX Feedstock Other Baseline fossil jet price
Figure 2. Comparison of levelized costs of production for alternative jet fuel across fuel conversion pathways.
THE COST OF SUPPORTING ALTERNATIVE JET FUELS IN THE EUROPEAN UNION
WORKING PAPER 2019-05 INTERNATIONAL COUNCIL ON CLEAN TRANSPORTATION 11
is required to produce 1 tonne of jet fuel, which has a substantially lower value. In contrast, sugarcane ATJ (with ethanol as an intermediate product) has yields of approximately 0.45 tonnes per tonne of sugar, using much cheaper technology. Even before factoring in CAPEX and operating costs for the facility, the SIP process can be cost-prohibitive. Although Klein-Marcuschamer et al. (2013) estimated a minimum viable price of approximately €1.75/liter, that analysis used yields of 55% for the farnesene conversion process, which may be unrealistic and likely accounts for the d i f ference in minimum viable price between that study and this analysis.
Apart from SIP, the levelized costs estimated here largely align with previous findings and trends from the literature. A stochastic analysis conducted by Bann et al. (2017) estimated an average baseline value of €0.87/liter for the HEFA pathway, €0.95/l i ter for gas i f icat ion-FT from MSW, and €1.38 to €2.08 for various ATJ feedstocks. Likewise, a harmonized analysis conducted by de Jong (2018) estimated a levelized cost of around €1/liter for used cooking oil (UCO) HEFA, €1.80/liter for gasification-FT of wheat straw, and €2.50/liter for ATJ from wheat straw, all on greenfield, Nth-of-a-kind facilities. Overall, much of the variation between the analyses can be attributed to differences in assumptions in the DCFROR analysis, particularly feedstock price, tax rates, yield, and ramp-up times.
SENSITIVITY ANALYSIS
To assess the impact of the assump-tions in the DCFROR analysis on this study’s estimated cost of production, we developed a sensitivity analysis. We varied CAPEX, yield, and start-up times and determined the impact on the levelized cost of production for each pathway. For HEFA, gasifi-cation-FT, and ATJ, the sensitivity
analys is is informed by (S&T)2 Consultants (2018), which developed a series of technical datasheets containing an uncertainty range for several parameters for advanced fuel pathways for 2020 and 2050. For example, the ATJ pathway has an uncertainty range of ±20% for yield, so we estimated the levelized cost for both conditions, relative to our default assumptions of 0.25 to 0.47 tonnes of feedstock per tonne of ethanol. For the SIP pathway, we used the cellulosic ethanol uncer-tainty ranges for CAPEX from (S&T)2 Consultants (2018), along with a yield assumption of 17% that reflects the real-world farnesane conversion rate noted by Klein-Marcuschamer et al. (2013), as well as that study’s estimate of 55% efficiency.
Ramp-up times can have a substan-tial impact on the levelized cost of a given fuel, as the reduced production in the critical early stages of the project reduces the cash flow for that project in a period where the present value of cash flow is more valuable. Disruptions or delays in the early stages of a project can have a large impact on its viability, contrib-uting to investors’ perception of risk associated with next-generation fuel technologies. This study’s default assumption is of a 3-year ramp-up period, with production increasing from 25% in year 1 to 100% in year 4. For the sensitivity analysis, we examined the impact of ramp-up times on the various fuel pathways, testing a “slow” scenario where production lags at 25% through years 1 and 2 and at 50% in year 3, as well as a “fast” scenario where production ramps up to 100% in year 2. The “fast” scenario may align more with previous techno-economic assessments, whereas the “slow” scenario may better reflect real-world delays and bottlenecks that have plagued the advanced fuels industry (European Parliament, 2017; Voegele, 2017).
The sensitivity analysis, illustrated for a selection of feedstocks and pathways, is shown in Figure 3. This figure shows the shift in levelized cost for both optimistic and pessimistic shifts to the underlying assump-tions (described on the y axis). The analysis shows that some conversion pathways are more sensitive to this study’s assumptions than others. Notably, the UCO HEFA pathway’s levelized cost is relatively inflexible relative to assumptions, as yields are anticipated to remain stable, and even a 50% CAPEX reduction causes only a minor shift in levelized cost, as the pathway costs primarily come from feedstock acquisition. In contrast, the levelized cost of gasifi-cation-FT declines by approximately €0.70/liter in response to a 50% decline in CAPEX. Other CAPEX-heavy pathways such as ATJ and SIP also show a strong response to more optimistic CAPEX assumptions. The largest variability in the sensitivity analysis occurs for the SIP pathway, as the high levelized cost for the pathway is tied to the low baseline yields for farnesene conversion relative to the high cost of sugar. The sensitivity analysis doesn’t neces-sarily change our conclusions on the cost profiles of various technologies, except for MSW gasification-FT, which may fall within the price range of HEFA fuels at the lowest range of its possible CAPEX costs.
Policy Support for AJF ProductionIt is evident from the results of the cost assessment that even the cheapest AJFs are far more expensive than conventional jet fuel, requiring some form of policy support in order to reach cost parity with conventional fuels. In this section, we evaluate the impact of several policy support mechanisms for AJFs, assessing the per-liter policy incentive necessary to reach break-even costs as well as the impact of some complemen-tary policies on the levelized costs
THE COST OF SUPPORTING ALTERNATIVE JET FUELS IN THE EUROPEAN UNION
12 INTERNATIONAL COUNCIL ON CLEAN TRANSPORTATION WORKING PAPER 2019-05
of fuels. To identify both the most effective policy support mechanisms and the best-performing fuels, we use life-cycle GHG emission factors to estimate the costs of carbon abatement for each fuel.
“OPT-IN” AND “MULTIPLIER” PROVISIONS
We estimate the necessary incentive amount as the difference between our calculated levelized cost of each pathway and the wholesale cost of petroleum jet fuel. The policy support necessary for each pathway ranges from €0.49/liter (UCO HEFA) to €3.40/liter (molasses SIP). We compare this to the incentive level for these pathways in the U.K. RTFO. This program includes a subtarget for “development fuels” that must be waste-based and drop-in for aviation, marine, or road use. There is a buyout price for the develop-ment fuels target (i.e., a price that ob l igated part ies can pay the
government not to comply with the target) of €1.82/liter (£1.60). We find that the RTFO incentive would be sufficient to support UCO HEFA and all three gasification-FT fuels, where these fuels are considered to receive development fuel crediting (U.K. Department for Transport, 2017). Soy oil, palm oil, and PFADs would be ineligible for the development fuel credits, as they are not considered wastes or residues within the RTFO, whereas the remaining conversion pathways wou ld rema in more expensive than the buyout price.
RED II provides a small incentive for aviation fuels from non-food sources through the implementation of a 1.2 multiplier for aviation fuels from non-food sources to meet transport-sector targets (European Council, 2018). In practice, this means that member states should incentivize non–food-based AJF more than similar fuels in the road sector by a factor of 1.2. Although this measure
is intended to bring addit ional production of fuel online for a more challenging sector, a multiplier may instead incentivize producers to shift their product slate to produce a greater share of jet fuel, at the expense of overall liquid fuel yield.
Given this trade-off, we evaluate whether the 1.2 multiplier is sufficient to incent iv ize a shi ft ing in the product slate by solving for the NPV of a representative HEFA system and gasification-FT system when the jet fuel yield is maximized. For both fuel conversion systems, the NPV of the project declines by about 6 to 7% when jet fuel production is maximized, requiring higher levelized costs for both renewable diesel and jet fuel in order for the project to stay solvent. Keeping the levelized cost of renewable diesel constant, we find that the break-even point for the multiplier (i.e., the level of the multiplier at which a producer would choose to shift the product slate in
0 1 2 3 4 5 6
Petroleum jet
CAPEX (-50%, 0, +50%)
Yield (55%, 17%)
Ramp-up time (Fast, Slow)
CAPEX (-50%, 0, +50%)
Yield (+20%, -20%)
Ramp-up time (Fast, Slow)
CAPEX (-50%, +50%)
Yield (+10%, -10%)
Ramp-up time (Fast, Slow)
CAPEX (-50%, 0)
Yield (+1%, -1%)
Ramp-up time (Fast, Slow)
Levelized cost of production (€/liter)
Decrease Increase
Sug
ar c
ane
mo
lass
es S
IPC
orn
gra
inA
TJ
MSW
gas
ifica
tio
n-F
TU
sed
co
oki
ngo
il H
EF
A
Figure 3. Sensitivity of levelized cost of production to CAPEX, yield, and ramp-up time parameters in the DCFROR analysis.
THE COST OF SUPPORTING ALTERNATIVE JET FUELS IN THE EUROPEAN UNION
WORKING PAPER 2019-05 INTERNATIONAL COUNCIL ON CLEAN TRANSPORTATION 13
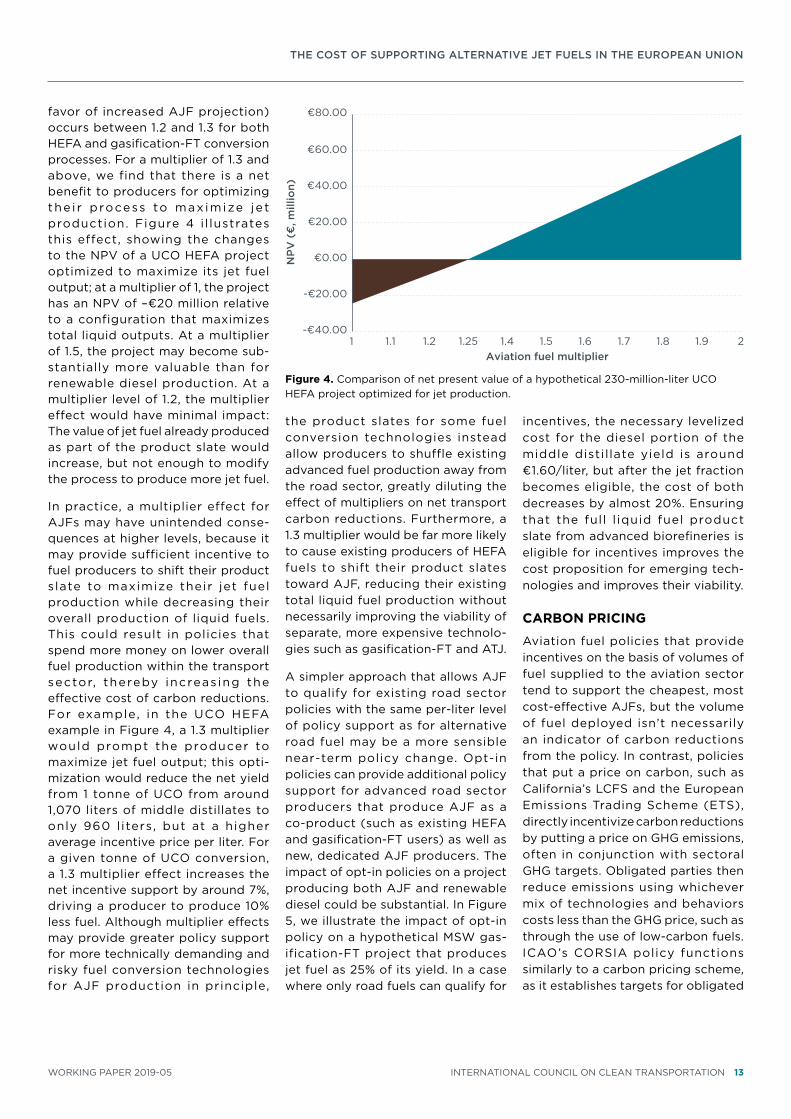
favor of increased AJF projection) occurs between 1.2 and 1.3 for both HEFA and gasification-FT conversion processes. For a multiplier of 1.3 and above, we find that there is a net benefit to producers for optimizing the i r process to max imize je t production. Figure 4 i l lustrates this effect, showing the changes to the NPV of a UCO HEFA project optimized to maximize its jet fuel output; at a multiplier of 1, the project has an NPV of –€20 million relative to a configuration that maximizes total liquid outputs. At a multiplier of 1.5, the project may become sub-stantially more valuable than for renewable diesel production. At a multiplier level of 1.2, the multiplier effect would have minimal impact: The value of jet fuel already produced as part of the product slate would increase, but not enough to modify the process to produce more jet fuel.
In practice, a multiplier effect for AJFs may have unintended conse-quences at higher levels, because it may provide sufficient incentive to fuel producers to shift their product slate to maximize their jet fuel production while decreasing their overall production of liquid fuels. This could result in policies that spend more money on lower overall fuel production within the transport sector, thereby increas ing the effective cost of carbon reductions. For example, in the UCO HEFA example in Figure 4, a 1.3 multiplier would prompt the producer to maximize jet fuel output; this opti-mization would reduce the net yield from 1 tonne of UCO from around 1,070 liters of middle distillates to only 960 l iters, but at a higher average incentive price per liter. For a given tonne of UCO conversion, a 1.3 multiplier effect increases the net incentive support by around 7%, driving a producer to produce 10% less fuel. Although multiplier effects may provide greater policy support for more technically demanding and risky fuel conversion technologies for AJF production in principle,
the product slates for some fuel conversion technologies instead allow producers to shuffle existing advanced fuel production away from the road sector, greatly diluting the effect of multipliers on net transport carbon reductions. Furthermore, a 1.3 multiplier would be far more likely to cause existing producers of HEFA fuels to shift their product slates toward AJF, reducing their existing total liquid fuel production without necessarily improving the viability of separate, more expensive technolo-gies such as gasification-FT and ATJ.
A simpler approach that allows AJF to qualify for existing road sector policies with the same per-liter level of policy support as for alternative road fuel may be a more sensible near-term policy change. Opt-in policies can provide additional policy support for advanced road sector producers that produce AJF as a co-product (such as existing HEFA and gasification-FT users) as well as new, dedicated AJF producers. The impact of opt-in policies on a project producing both AJF and renewable diesel could be substantial. In Figure 5, we illustrate the impact of opt-in policy on a hypothetical MSW gas-ification-FT project that produces jet fuel as 25% of its yield. In a case where only road fuels can qualify for
incentives, the necessary levelized cost for the diesel portion of the middle distil late yield is around €1.60/liter, but after the jet fraction becomes eligible, the cost of both decreases by almost 20%. Ensuring that the full l iquid fuel product slate from advanced biorefineries is eligible for incentives improves the cost proposition for emerging tech-nologies and improves their viability.
CARBON PRICING
Aviation fuel policies that provide incentives on the basis of volumes of fuel supplied to the aviation sector tend to support the cheapest, most cost-effective AJFs, but the volume of fuel deployed isn’t necessarily an indicator of carbon reductions from the policy. In contrast, policies that put a price on carbon, such as California’s LCFS and the European Emissions Trading Scheme (ETS), directly incentivize carbon reductions by putting a price on GHG emissions, often in conjunction with sectoral GHG targets. Obligated parties then reduce emissions using whichever mix of technologies and behaviors costs less than the GHG price, such as through the use of low-carbon fuels. ICAO’s CORSIA policy functions similarly to a carbon pricing scheme, as it establishes targets for obligated
-€40.00
-€20.00
€0.00
€20.00
€40.00
€60.00
€80.00
1 1.1 1.2 1.25 1.4 1.5 1.6 1.7 1.8 1.9 2
NP
V (
€, m
illio
n)
Aviation fuel multiplier
Figure 4. Comparison of net present value of a hypothetical 230-million-liter UCO HEFA project optimized for jet production.
THE COST OF SUPPORTING ALTERNATIVE JET FUELS IN THE EUROPEAN UNION
14 INTERNATIONAL COUNCIL ON CLEAN TRANSPORTATION WORKING PAPER 2019-05
parties’ emissions and allows them to meet those targets using a selection of methods, including carbon offsets and AJFs.
In order to identify the necessary carbon price to spur AJF deployment, we estimate the carbon abatement cost associated with the various AJF technologies described in this paper. Figure 6 illustrates the cost of carbon reductions for those AJFs, calculated by taking the difference between the levelized cost for that fuel and baseline fossil kerosene and dividing the carbon reductions for a liter of that fuel. Indirect emissions can substantially increase the cost of carbon abatement (or eliminate carbon abatement potential entirely) for AJF produced from food and feed feedstocks and for wastes and residues diverted from existing uses. Soy oil, palm oil, and PFAD AJF are not shown in this graph because they do not offer net GHG reductions relative to the fossil baseline; any added cost to support these pathways will not achieve carbon reductions at all. The range in costs of carbon reductions for the remaining pathways varies substantially, from €217/tonne CO2e for UCO HEFA to more than €4,000/tonne CO2e for corn grain ATJ. For comparison, even the most rigorous carbon offset credits are available for less than €5/tonne CO2e (Hamrick & Gallant, 2017).
Generally, food-based fuels tend to have higher costs of carbon abatement than those produced from by-products, wastes, and residues. The pathways with the best climate performance are UCO HEFA, MSW gasification-FT, and all four fuels made from energy crops and agri-cultural residues. Only UCO HEFA and MSW gasification-FT have costs of carbon abatement below €500/tonne CO2e. Notably, although the ATJ pathways for corn and sugarcane are competitive with gasification-FT on a levelized cost basis, the high direct conversion emissions for those fuels raise their cost of carbon abatement
substantially. For example, corn grain ATJ has direct conversion emissions alone of 65 gCO2e/MJ, approximately 75% of those from conventional petroleum jet fuel.
After factoring in the GHG reduction potential for various fuels into a cost analysis, it is evident that either sustainability safeguards (e.g., a minimum GHG reduction threshold for policy support) or carbon pricing is necessary to ensure that only the best-performing feedstocks are supported by fuels policies. To avoid unintended consequences, eligibil-ity must be determined through LCA accounting of both direct and indirect emissions attributable to fuel production. RED II includes a cap on food-based feedstocks used to meet the policy target through 2030, along with a more stringent cap on fuels with high-ILUC risk (European Council, 2018). This policy, however, leaves open the opportunity for the use of vegetable oil–derived HEFA fuels, particularly during the initial years of RED II. Although UCO HEFA is the cheapest of the fuels assessed, it is already largely being used for biofuel production for the road
sector, and it is difficult to collect additional UCO to fuel the aviation sector (Greenea, 2016). In practice, heavy incentives for UCO-derived AJFs would likely shift consump-tion from the road sector to aviation with minimal net climate benefits (Pavlenko & Kharina, 2018).
Incorporating carbon pricing into the value of aviation fuel incentives could help to directly incentivize the best-performing AJFs proportionally to their carbon reductions, thereby ensuring that poor-performing AJFs with a low levelized cost don’t use up the bulk of policy support. Although ICAO’s CORSIA policy incorporates some elements of a carbon price, it puts AJFs at a disadvantage by treating their emissions reductions as equivalent to carbon offsets. Without strong, national-level incentives, it is unlikely that airlines would opt for fuel switching in lieu of carbon offsets, which are often at least an order of magnitude cheaper. The price of GHG reductions from fuel switching, even for the most effective fuels, is substantially higher than the cost of carbon offsets, which can be available in large volumes at less than €5/
€0.00
€0.20
€0.40
€0.60
€0.80
€1.00
€1.20
€1.40
€1.60
€1.80
Road-only Opt-in
Leve
lized
co
st (
€/l
iter
)
Diesel Jet
Figure 5. Comparison of levelized cost for an MSW gasification-FT project with policy support for the road fuel fraction only versus with opt-in policy support for AJF as well as road fuel.
THE COST OF SUPPORTING ALTERNATIVE JET FUELS IN THE EUROPEAN UNION
WORKING PAPER 2019-05 INTERNATIONAL COUNCIL ON CLEAN TRANSPORTATION 15
tonne CO2e. A more effective policy would pair a high carbon price for transportation-sector emissions with full, life-cycle accounting for AJFs. This approach would provide a more cost-effective method of supporting the AJF pathways, steering obligated parties toward the fuels that offer the steepest GHG reductions more effectively than a mandate or a flat, per-liter incentive.
COMPLEMENTARY SUPPORT MECHANISMS
Many of the barriers to commer-cializing the best-performing AJF pathways are the same as those faced by fuel conversion technologies in the road sector; in some cases, the technologies are identical. Although most AJF pathways face technical barriers, particularly for pretreat-ment, the largest obstacles to com-mercialization come from political and economic uncertainty (Baldino et
al., in press; Pavlenko et al., 2016). The perception of risk can strongly deter investors. For the purposes of getting a loan or equity investment for an advanced biorefinery, even strong policy support can be discounted heavily by investors who are uncertain whether this support will exist for the duration of the project’s lifetime, which can range from 15 to 25 years. Consequently, the nominal value of a policy incentive can be substantially reduced by an investor assessing the viability of a project proposal.
Loan guarantees or grants can make a substantial difference for the viability of advanced fuel projects, particularly capital-intensive efforts. Loan guarantees reduce the costs associated with taking on debt for a project, decreasing the levelized cost, whereas grants directly reduce the CAPEX associated with a project. Figure 7 illustrates the decrease in leve l i zed cost for d i f fe rent
technologies at varying levels of grant funding, relative to the baseline cost of petroleum jet fuel. The blue bars in the figure show the shift in levelized cost from each fuel pathway’s initial price with the benefit of a €10 million, €50 million, and €100 million grant. For HEFA, gasification-FT, and ATJ, the grants shift the levelized cost by €0.02 to €0.30 per liter, depending on grant size. The SIP pathway shows substantial sensitivity to grant funding, as the CAPEX of the project is particularly high relative to the volume of fuel production. The closest an AJF pathway gets to cost parity is with a €100 million grant for the HEFA pathway, and even in this scenario there remains a meaningful gap between the levelized cost of HEFA and the baseline cost of petroleum jet fuel.
Although grants alone cannot support the wide-scale deployment of AJFs, they can be a valuable supplementary
€0
€1,000
€2,000
€3,000
€4,000
€5,000
€6,000
Usedcooking
oil
MSW Energycrops
Agriculturalresidues
Renewableelectricity
Agriculturalresidues
Energycrops
Sugarcane
Corngrain
Sugarcane
molasses
Gasification-FTHEFA Power-to-liquids
ATJ SIP
Co
st o
f ca
rbo
n ab
atem
ent
(€/t
onn
e C
O2e
)
Figure 6. Comparison of costs of GHG mitigation for fuel switching across AJF fuel conversion pathways.
THE COST OF SUPPORTING ALTERNATIVE JET FUELS IN THE EUROPEAN UNION
16 INTERNATIONAL COUNCIL ON CLEAN TRANSPORTATION WORKING PAPER 2019-05
method of policy support to mitigate risk and assist pioneer and first-of-a-kind facilities in reaching the market. Beyond the direct effect on levelized cost illustrated in Figure 7, grants and loan guarantees may also have a valuable indirect benefit to the viability of advanced conversion pathways. In cases where a pathway is relatively cost-effective in terms of carbon abatement but has a high upfront CAPEX, such as MSW gasification-FT, the uncertainty and risk associated with that project may dissuade investors. In contrast, a technology such as HEFA conversion, where the bulk of the cost is driven by feedstock acquisition, may be perceived as less risky by investors despite more limited long-term carbon abatement potential. Grant funding, at least for pioneer and first-of-a-kind facilities, may be necessary to support other types of ongoing policy support in order to assist capital-intensive
conversion technologies at their earliest stages of deployment.
Another policy that more directly mitigates risk for emerging AJF pathways is a contract-for-difference (CfD) program, which is a contract between a prospective fuel producer and a government agency. This policy can act as a strong complement to other AJF incentives. Participants bid in an auction for a minimum price floor, and then the government guarantees that producers will be able to sell their fuel for that minimum price floor. A CfD program ensures that whenever the market value of a fuel (i.e., wholesale value plus other incentives) falls below that price floor, the government will “top up” that producer up to the value of the price floor for the duration of the contract, which can be for extended time periods (e.g., 10 years) to improve policy certainty. A CfD provides cost certainty for a fuel producer, ensuring that even as
market values of fuels or credit values for other incentives fluctuate, there will be a steady stream of income for a given project. In a sense, a CfD acts as an insurance policy against political or economic downside risk. The primary benefit of this policy would be to mitigate the effect of “discounting” by investors and increase the perceived value of incentives for potential new fuel projects. The United Kingdom has already implemented this policy as a primary financing mechanism for renewable electricity, while California i s developing a p i lot f inanc ia l mechanism based on the CfD concept to act as a complementary policy for dairy biogas production (CARB, 2018; Pavlenko et al., 2016).
In this analysis, the projects that could benefit the most from CfDs are tech-nologies such as gasification-FT and ATJ, which have high upfront capital expenses and uncertain ramp-up times. Relative to technologies such
0.00 0.50 1.00 1.50 2.00 2.50 3.00 3.50 4.00 4.50
Petroleum jet
€100 million
€50 million
€10 million
€100 million
€50 million
€10 million
€100 million
€50 million
€10 million
€100 million
€50 million
€10 million
Sug
ar c
ane
mo
lass
es S
IPC
orn
gra
in A
TJ
MSW
gas
ifica
tio
n-F
TU
sed
co
oki
ngo
il H
EF
A
Levelized cost of production (€/liter)
Decrease
Figure 7. Impact of grant funding on levelized cost of selected AJF pathways.
THE COST OF SUPPORTING ALTERNATIVE JET FUELS IN THE EUROPEAN UNION
WORKING PAPER 2019-05 INTERNATIONAL COUNCIL ON CLEAN TRANSPORTATION 17
as HEFA that are closer to com-mercialization, they are much more reliant on external policy support and economic stability. Even with high production incentives for low-carbon AJFs from wastes and residues, the high upfront costs and an uncertain revenue stream from a potential gasification project may dissuade potential investors. In cases like these, a CfD could substantially alleviate the downside risk for potential investors and allow those projects to begin construction. CfDs could be a more cost-effective method of support than capital grants, as they would only pay producers per unit of fuel produced, ensuring that government spending would only go toward fuel production.
ConclusionThis analysis evaluates the cost of alternative jet fuel (AJF) production across a variety of fuel conversion pathways and feedstocks, estimating the cost of carbon abatement generated through the use of a selection of AJFs. The results of this cost assessment align broadly with previous techno-economic assess-ments for AJFs, with levelized costs estimated in a range from €0.88 to €3.44 per liter—from two to eight times the baseline price of petroleum jet fuel. Incorporating life-cycle carbon intensities into the analysis illustrates that some conversion pathways offer much more cost-effective routes to aviation decarbonization than others. It is thus important that policies incorporate GHG accounting to ensure that policies steer incentives toward the fuels that offer the greatest carbon reductions.
This study’s cost analysis suggests that the cheapest sources of AJFs are not likely to provide a pathway for long-term aviation decarboniza-tion. The cheapest set of fuels in the analysis are HEFA fuels made by hydroprocessing vegetable oils or waste fats; this is the closest pathway to commercialization and by far the most common. These fuels cost, on average, €1/liter to produce—substantially less than
other AJF pathways. However, HEFA production costs are unlikely to decline further in the future, because they are dominated by the high cost of feedstock for vegetable and waste oils. Moreover, the feedstocks used for HEFA production either have substantial indirect emissions, in the case of vegetable oils, or are already largely being used for fuel production, as in the case of UCO. In terms of investment, HEFA fuels may be a dead end; supporting their production in the near term will do little to facilitate a transition to better-performing, lignocellulosic feedstock–derived fuels in the longer term. Locking in policy support for HEFA fuels, which are already commercially viable, is an expensive and ineffective mode of aviation decarbonization.
Beyond HEFA fuels made from UCO, which are severely availability-constrained, we find that the most cost-effective sources of carbon reductions in this analysis come from the fuels produced via gasification using low-carbon feedstocks, such as MSW, energy crops, and agricul-tural residues. The levelized costs of these fuels range from €1.34 to €1.87 per liter, and their cost of carbon reductions ranges from €400 to €500 per tonne of carbon. Relative to the carbon costs of fuel switching from other pathways, which either have negligible carbon savings or even higher levelized costs, these pathways provide the most cost-effective carbon reductions among those assessed here.
Prioritizing aviation fuels at the expense of other sectors can increase the costs of fuels policies at the expense of overall carbon reduction goals. Multiplier crediting that treats AJFs as more valuable than fuels for the road sector can often be ineffec-tive or even counterproductive. We find that the 1.2 multiplier for AJF in the EU’s recast Renewable Energy Directive (RED II) is too small to drive any major changes in AJF production on its own. However, at higher multiplier levels, fuel policies run the risk of increasing overall spending
on a given project while potentially decreasing the volume of transport fuels produced. For example, a 1.3 multiplier could incentivize HEFA producers to maximize their jet fuel output, increasing production costs by 7% but supporting the production of 10% less fuel. Opt-in policies that incentivize AJFs equally with road fuels can improve the viability of advanced fuel projects that produce a slate of various fuels by ensuring that all of their products receive crediting, without distorting their product slate.
Although direct incent ives are necessary for advanced fuel tech-nologies to reach cost parity, comple-mentary policies are also necessary to mitigate risk and assist fledgling technologies. AJF pathways such as gasification-FT and ATJ from MSW and agricultural residues offer some of the most cost-effective methods of carbon reductions for fuel switching but suffer from high upfront capital costs that can discourage investment. For second-generation fuel conversion technologies with high upfront costs, this analysis suggests that direct capital grants can more meaningfully reduce their levelized costs than a per-liter subsidy. Although this type of policy support may be prohibitive for the industry as a whole, incentives that mitigate investment risk, such as grant funding or CfD, could help emerging technologies to scale up production and transition beyond the pioneer plant phase.
We recommend a sector-agnostic approach of supporting advanced fuels with the most cost-effective GHG reductions, rather than prioritiz-ing the deployment of AJFs with the lowest production costs. Although there remains substantial uncertainty on the costs of production for AJFs, there is already ample evidence of the failure of existing policies in the road sector to support advanced fuels. By addressing the mistakes of the past decade of road sector fuels policy, policymakers can support the technologies and feedstock supply chains necessary to facilitate longer-term aviation decarbonization.
THE COST OF SUPPORTING ALTERNATIVE JET FUELS IN THE EUROPEAN UNION
18 INTERNATIONAL COUNCIL ON CLEAN TRANSPORTATION WORKING PAPER 2019-05
ReferencesAlbrecht, F. G., König, D. H., Baucks, N., & Dietrich, R.-U. (2017).
A standardized methodology for the techno-economic evaluation of alternative fuels—A case study. Fuel, 194, 511–526; doi:10.1016/j.fuel.2016.12.003.
ASTM International (n.d.). Standard Specification for Aviation Turbine Fuel Containing Synthesized Hydrocarbons; www.astm.org/Standards/D7566.htm.
Baldino, C., Berg, R., Pavlenko, N., & Searle, S. (In Preparation). Technology Overview and Status of Advanced Alternative Fuel Pathways. International Council on Clean Transportation.
Bann, S., Malina, R., Staples, M. D., Suresh, P., Pearlson, M., Tyner, W. E., Hileman, J. I., & Barrett, S. (2017). The costs of production of alternative jet fuel: A harmonized stochastic assessment. Bioresource Technology, 227, 179–187; doi:10.1016/j.biortech.2016.12.032.
Bullis, K. (2012, February 10). “Amyris Gives Up Making Biofuels: Update.” MIT Technology Review; www.technologyreview.com/s/426866/amyris-gives-up-making-biofuels-update/.
California Air Resources Board (CARB) (2015). Life Cycle GHG Emissions for Fulcrum Sierra Biofuels, LLC’s MSW-to-Fischer Tropsch Fuel Production Process; www.arb.ca.gov/fuels/lcfs/2a2b/apps/ful-ftd-rpt-123015.pdf.
California Air Resources Board (CARB) (2018, January 5). CARB SB 1383 Efforts. Presentation at the Dairy and Livestock Greenhouse Gas Reduction Working Group Meeting; https://arb.ca.gov/cc/dairy/documents/01-05-18/arb_presenta-tion_01-05-18.pdf.
Darling Ingredients Inc. (2016). “Diamond Green Diesel to be Expanded to 275 Million Gallons Annually.” PR Newswire; www.prnewswire.com/news-releases/diamond-green-diesel-to-be-expanded-to-275-million-gallons-annually-300248085.html.
de Jong, S. (2018). Green Horizons: On the Production Costs, Climate Impact and Future Supply of Renewable Jet Fuels (master’s thesis, Utrecht University); http://skynrg.com/wp-content/uploads/2018/06/dJong.pdf.
de Jong, S., Antonissen, K., Hoefnagels, R., Lonza, L., Wang, M., Faaij, A., & Junginger, M. (2017). Life-cycle analysis of greenhouse gas emissions from renewable jet production. Biotechnology for Biofuels, 10, 64; doi:10.1186/s13068-017-0739-7.
European Council (2018). Proposal for a Directive of the European Parliament and of the Council on the Promotion of the Use of Energy from Renewable Sources—Analysis of the Final Compromise Text with a View to Agreement; www.consilium.europa.eu/register/en/content/out?&typ=ENTRY&i=LD&DOC_ID=ST-10308-2018-INIT.
European Parliament (2017). Advanced Biofuels: Technologies and EU Policy. European Parliamentary Research Service; www.europarl.europa.eu/RegData/etudes/BRIE/2017/603972/EPRS_BRI(2017)603972_EN.pdf.
Eurostat (2018a). Electricity Prices for Non-Household Consumers; http://appsso.eurostat.ec.europa.eu/nui/show.do?dataset=nrg_pc_205&lang=en
Eurostat (2018b). Inflation in the Euro Area; http://appsso.eurostat.ec.europa.eu/nui/show.do?dataset=prc_hicp_manr&lang=en
Eurostat (2018c). Natural Gas Prices for Non-Household Consumers; http://appsso.eurostat.ec.europa.eu/nui/show.do?dataset=nrg_pc_203&lang=en
Greenea (2016). Analysis of the Current Development of Household UCO Collection Systems in the EU. International Council on Clean Transportation; www.theicct.org/sites/default/files/publications/Greenea%20Report%20Household%20UCO%20Collection%20in%20the%20EU_ICCT_20160629.pdf.
Greenhouse Gases, Regulated Emissions, and Energy Use in Transportation (GREET) Model (2018). GREET 2018. Argonne National Laboratory; https://greet.es.anl.gov/.
Hall, D., Pavlenko, N., & Lutsey, N. (2018). Beyond Road Vehicles: Survey of Zero-Emission Technology Options Across the Transport Sector. International Council on Clean Transportation; www.theicct.org/publications/zero-emission-beyond-road-vehicles.
Hamrick, K., & Gallant, M. (2017). Unlocking Potential: State of the Voluntary Carbon Markets 2017. Forest Trends Ecosystem Marketplace; www.forest-trends.org/wp-content/uploads/2017/07/doc_5591.pdf.
Kharina, A., & Pavlenko, N. (2017). Alternative Jet Fuels: Case Study of Commercial-Scale Deployment. International Council on Clean Transportation; www.theicct.org/sites/default/files/publications/United-LAX-Case-Study_ICCT-Working-Paper_23102017_vF.pdf.
Klein-Marcuschamer, D., Turner, C., Allen, M., Gray, P., Diezten, R. G., Gresshoff, P. M., Hankamer, B., Heimann, K., Scott, P. T., Stephens, E., Speight, R., & Nielsen, L. K. (2013). Technoeconomic analysis of renewable aviation fuel from microalgae, Pongamia pinnata, and sugarcane. Biofuels Bioproducts & Biorefining, 7, 416–428; doi.org/10.1002/bbb.1404.
Lane, J. (2013, June 27). “Amyris: Can Their Renewable Jet Fuel Ever Be Affordable?” Biofuels Digest; www.biofuelsdigest.com/bdigest/2013/06/27/amyris-can-their-renewable-jet-fuel-ever-be-affordable/.
Lane, J. (2018, July 11). “Amyris: Same as It Never Was.” Biofuels Digest; www.biofuelsdigest.com/bdigest/2018/07/11/amyris-same-as-it-never-was/.
Malins, C. (2017). Waste Not Want Not: Understanding the Greenhouse Gas Implications of Diverting Waste and Residual Materials to Biofuel Production. Cerulogy; www.theicct.org/sites/default/files/publications/Waste-not-want-not_Cerulogy-Consultant-Report_August2017_vF.pdf.
Maniatis, K., Landälv, I., Waldheim, L., van den Heuvel, E., & Kalligeros, S. (2017). Building Up the Future (Final Report, Sub Group on Advanced Biofuels, Sustainable Transport Forum). Directorate-General for Transport, European Commission; http://ec.europa.eu/transparency/regexpert/index.cfm?do=groupDetail.groupDetailDoc&id=33288&no=1.
National Renewable Energy Laboratory (n.d.). Annual Technology Baseline (ATB) Data; https://atb.nrel.gov/elec-tricity/data.html.
Pavlenko, N. (2018). “Failure to Launch: Why Advanced Biorefineries Are So Slow to Ramp Up Production.” International Council on Clean Transportation; www.theicct.org/blog/staff/failure-to-launch-biorefineries-slow-ramp-up.
THE COST OF SUPPORTING ALTERNATIVE JET FUELS IN THE EUROPEAN UNION
WORKING PAPER 2019-05 INTERNATIONAL COUNCIL ON CLEAN TRANSPORTATION 19
Pavlenko, N., & Kharina, A. (2018). Policy and Environmental Applications of Using HEFA+ for Aviation. International Council on Clean Transportation; www.theicct.org/sites/default/files/publications/Green-Diesel-Aviation_ICCT-Working-Paper_20180321_vF.pdf.
Pavlenko, N., Searle, S., Malins, C., & El Takriti, S. (2016). Development and Analysis of a Durable Low-Carbon Fuel Investment Policy for California. International Council on Clean Transportation; www.theicct.org/sites/default/files/publications/California%20Contracts%20for%20Difference_white-paper_ICCT_102016.pdf.
Pearlson, M. (2011). A Techno-Economic and Environmental Assessment of Hydroprocessed Renewable Distillate Fuels (doctoral dissertation, Massachusetts Institute of Technology); https://dspace.mit.edu/handle/1721.1/65508.
Pearlson, M., Wollersheim, C., & Hileman, J. (2013). A techno-economic review of hydroprocessed renewable esters and fatty acids for jet fuel production. Biofuels Bioproducts & Biorefining, 7, 89–96; doi:10.1002/bbb.1378.
Perner, J., Unteutsch, M., & Lövenich, A. (2018). The Future Cost of Electricity-Based Synthetic Fuels. Agora Energiewende; www.agora-energiewende.de/fileadmin2/Projekte/2017/SynKost_2050/Agora_SynKost_Study_EN_WEB.pdf.
Peters, D., Alberici, S., Passmore, J., & Malins, C. (2015). How to Advance Cellulosic Biofuels: Assessment of Costs, Investment Options and Policy Support. Ecofys; www.theicct.org/sites/default/files/publications/Ecofys-Passmore%20Group_How-to-advance-cellulosic-biofuels_rev201602.pdf.
Qantas (2013). Feasibility Study of Australian Feedstock and Production Capacity to Produce Sustainable Aviation Fuel; www.qantas.com.au/infodetail/about/environment/aviation-biofuel-report.pdf.
Ruiz, P., Sgobbi, A., Nijs, W., Thiel, C., Dalla Longa, F., Kober, T., Elbersen, B., & Hengeveld, G. (2015). The JRC-EU-TIMES Model. Bioenergy Potentials for EU and Neighboring Countries. Joint Research Centre, European Commission; https://setis.ec.europa.eu/sites/default/files/reports/biomass_potentials_in_europe.pdf.
(S&T)2 Consultants Inc. (2018). Description and Data Collection on Biofuel Technologies. Prepared for the Danish Energy Agency.
Schmidt, P., Weindorf, W., Roth, A., Batteiger, V., & Riegel, F. (2016). Power-to-Liquids: Potentials and Perspectives for the Future Supply of Renewable Aviation Fuel. German Environment Agency; www.umweltbundesamt.de/sites/default/files/medien/377/publikationen/161005_uba_hinter-grund_ptl_barrierrefrei.pdf.
Searle, S., & Christensen, A. (2018). Decarbonization Potential of Electrofuels in the European Union. International Council on Clean Transportation; www.theicct.org/sites/default/files/publications/Electrofuels_Decarbonization_EU_20180920.pdf.
Seber, G., Malina, R., Pearlson, M. N., Olcay, H., Hileman, J. I., & Barrett, S. R. H. (2014). Environmental and economic assessment of producing hydroprocessed jet and diesel fuel from waste oils and tallow. Biomass & Bioenergy, 67, 108–118; doi: 10.1016/j.biombioe.2014.04.024.
Staples, M. D., Malina, R., Olcay, H., Pearlson, M. N., Hileman, J. I., Boies, A. M., & Barrett, S. R. H. (2014). Lifecycle greenhouse gas footprint and minimum selling price of renewable diesel and jet fuel from fermentation and advanced fermenta-tion production technologies. Energy and Environmental Science, 7, 1545–1554; doi:10.1039/c3ee43655a.
Swanson, R. M., Satrio, J. A., Brown, R. C., Platon, A., & Hsu, D. D. (2010). Techno-Economic Analysis of Biofuels Production Based on Gasification. National Renewable Energy Laboratory; www.nrel.gov/docs/fy11osti/46587.pdf.
Tao, L., Markham, J. N., Haq, Z., & Biddy, M. J. (2017). Techno-economic analysis for upgrading the biomass-derived ethanol-to-jet blendstocks. Green Chemistry, 19, 1082–1101; doi: 10.1039/C6GC02800D.
U.K. Department for Transport (2017). Cost Benefit Analysis: Amendments to the Renewable Transport Fuel Obligations Order; www.legislation.gov.uk/uksi/2018/374/pdfs/uksiod_20180374_en.pdf.
U.S. Department of Agriculture (2018). EU Biofuels Annual 2018 (Global Agricultural Information Network report). USDA Foreign Agricultural Service; https://gain.fas.usda.gov/Recent%20GAIN%20Publications/Biofuels%20Annual_The%20Hague_EU-28_7-3-2018.pdf.
U.S. Department of Energy (2017). Alternative Aviation Fuels: Overview of Challenges, Opportunities, and Next Steps; www.energy.gov/sites/prod/files/2017/03/f34/alterna-tive_aviation_fuels_report.pdf.
U.S. Energy Information Administration (2018). Refiner Petroleum Product Prices by Sales Type; www.eia.gov/dnav/pet/pet_pri_refoth_dcu_nus_m.htm.
U.S. Environmental Protection Agency (2018). Documentation for Greenhouse Gas Emission and Energy Factors Used in the Waste Reduction Model (WARM): Management Practices Chapters. Office of Resource Conservation and Recovery; https://www.epa.gov/sites/production/files/2016-03/documents/warm_v14_management_practices.pdf
Valin, H., Peters, D., van den Berg, M., Frank, S., Havlik, P., Forsell, N., & Hamelinck, C. (2015). The Land Use Change Impact of Biofuels Consumed in the EU: Quantification of Area and Greenhouse Gas Impacts. European Commission; https://ec.europa.eu/energy/sites/ener/files/documents/Final%20Report_GLOBIOM_publication.pdf.
Voegele, E. (2017, October 24). “Project Liberty overcomes preprocessing bottlenecks.” Ethanol Producer Magazine; www.ethanolproducer.com/articles/14762/project-liberty-overcomes-preprocessing-bottlenecks.
Yao, G., Staples, M. D., Malina, R., & Tyner, W. E. (2017). Stochastic techno-economic analysis of alcohol-to-jet fuel production. Biotechnology for Biofuels, 10, 18; doi: 10.1186/s13068-017-0702-7.
Zhu, Y., Tjokro Rahardjo, S. A., Valkenburg, C., Snowden-Swan, L. J., Jones, S. B., & Machinal, M. A. (2011). Techno-economic Analysis for the Thermochemical Conversion of Biomass to Liquid Fuels. Pacific Northwest National Laboratory; www.pnnl.gov/main/publications/external/technical_reports/PNNL-19009.pdf.