29
The Credit Performance of Private Equity-Backed Companies in the 'Great Recession' of 2008–2009 Jason M. Thomas • March 2010

The Credit Performance of Private Equity-Backed Companies in the 'Great Recession' of 2008–2009Jason M. Thomas • March 2010
Private Equity Council • March 2010 ii
The Credit Performance of Private Equity-Backed Companies in the 'Great Recession' of 2008–2009
Summary
The Credit Performance of Private Equity-Backed Companies in the 'Great recession' of 2008–2009
The paper addresses the important policy and business question of whether companies acquired through leveraged buyouts and similar transactions are more likely to default on their obligations than other non-investment grade firms. This topic has understandably and appropriately received renewed attention in recent years due to the increase in private equity transaction volume and related debt issuance from 2005 to 2007.
Key conclusions of the study are:
• analyzing a dataset of more than 3,200 private equity-backed companies acquired in a buyout or simi-lar transaction between 2000 and 2009 and held through 2008-2009, the paper finds that during the “Great recession” of 2008-2009 private equity-backed businesses defaulted at less than one-half the rate of comparable companies: 2.84% versus 6.17%.
• This finding is at odds with the suggestions of critics who argue that “overleveraged” portfolio compa-nies have or will default at rates that are several times higher than those of similar businesses.
• Both moody’s Investors Service and Standard and Poor’s (S&P) produced studies that inflated private equity default rates by developing new and expansive definitions of what constitutes a default or by artificially broadening the universe of firms deemed to qualify as private equity-owned.
• a widely-cited 2008 paper by Boston Consulting Group (BCG) forecasting that nearly half of the world’s private equity-backed companies would default appears to have significantly overstated the problem. Data show that cumulative defaults are running at a rate that is approximately 30 percentage points below that predicted by BCG.
While additional defaults are likely to occur and refinancing challenges will remain, the data to-date support the contention that the changes introduced by private equity investors reduce the incidence of default. Claims to the contrary either rely on misleading data, or involve speculation about future default rates without historical basis.

Private Equity Council • March 2010 1
The Credit Performance of Private Equity-Backed Companies in the 'Great Recession' of 2008–2009
1
InTroDuCTIon
What is the default rate of companies acquired by private equity investors relative to comparable busi-nesses? This topic has been debated for decades and has received renewed attention in recent years due to the increase in private equity transaction volume and related debt issuance from 2005 to 2007. Com-panies targeted by private equity investors are often underperforming and tend to be more highly lever-aged than peers after acquisition. However, private equity sponsors introduce changes in organizational structure and strategy that increase productivity and the cash flow necessary to meet financial obligations (World Economic Forum, 2009). What is the net effect of these countervailing factors?
This paper attempts to answer that question using a dataset of more than 4,700 private equity-backed companies acquired in a buyout or similar transaction between 2000 and 2009. The data reveal that dur-ing the “Great recession” of 2008-2009 private equity-backed businesses defaulted at less than one-half the rate of comparable companies: 2.84% versus 6.17%. This finding is largely consistent with the default rates estimated in the existing academic literature and strongly rebuts the contentions of critics who argue that “overleveraged” portfolio companies have or will default at rates that are several times higher than those of similar businesses.
The results of this study may surprise those who have seen recent reports released by moody’s Investor Service and Standard and Poor’s (S&P). Both agencies have suggested that the default rate for private equity-sponsored businesses is substantially higher than is supported by the data. In the case of moody’s, the definition of “default” is expanded so as to capture voluntary transactions to deleverage companies. S&P has broadened the definition of “private equity-backed company” to include any defaulted business that has had any dealing with a “private equity” firm, however minor, or however long ago. In addition, S&P includes holding companies in its definition of “private equity” firm.
The paper also compares realized default rates to those estimated by the Boston Consulting Group (BCG) in an oft-cited December 2008 paper that predicted the demise of much of the private equity industry. The BCG arrived at its estimate by using the credit spreads (borrowing rates in excess of Treasury notes) on private equity-backed companies’ loans and bonds in the midst of the worst financial crisis in 70 years. It should be no surprise sponsored company spreads were at record levels; so too were the spreads of all noninvestment grade issuers. The spread reflected elevated risk premiums rather than expected losses. The paper demonstrates that cumulative defaults are running at a rate that is approximately 30 percentage points below that predicted by BCG.
The paper proceeds as follows: section one provides background on private equity acquisitions; section two summarizes the paper’s data and methodology; section three provides the results of this study and compares them with the existing academic literature; section four examines the recent commentaries on portfolio company credit performance from moody’s, S&P, and BCG. Section five concludes.

Private Equity Council • March 2010 2
The Credit Performance of Private Equity-Backed Companies in the 'Great Recession' of 2008–2009
2
1. BaCKGrounD on PrIvaTE EquITy TranSaCTIonS
Private equity partnerships acquire businesses for six years, on average, during which time the general partner (GP), or private equity firm, monitors management, appoints officers to serve on the board of directors, and contributes significantly to all strategic decisions. The acquired “portfolio companies” are financed with equity capital provided by the private equity investors (including the GP) and third-party debt capital provided by banks, bond holders, or other external creditors. The ratio of debt to equity on an acquired company’s balance sheet depends on a number of factors, including the expected value and volatility of the company’s operating earnings and overall credit conditions.
a business’ capital structure determines how its expected operating earnings are divided between credi-tors and equity holders. Creditors’ claims on operating earnings are fixed and senior to those of the private equity investors. a company defaults when its operating earnings are insufficient to meet these fixed obligations. When operating earnings fall below expectations due to macroeconomic contraction or commercial challenges, the probability of default rises. many analysts expressed concern about the ability of private equity-backed companies to deal with the acute macroeconomic stress of the “Great recession” of 2008-2009. During the fourth quarter of 2008, pretax corporate earnings fell by 25%. This was in addition to the 25% decline in earnings that occurred over the two years ending in the third quarter of 2008 (Bureau of Economic analysis, 2009). The combination of the historic contraction in economic activity during 2008-2009 and the presump-tion of too great a use of leverage led many to express concern about potential default rates. (For a full discussion of credit market conditions and leverage ratios during the period covered in this study, see appendix a).
Chart 1: Pretax Corporate Earnings
Source: Bureau of Economic Analysis
2003 2004 2005 2006 2007 2008 2009
$1,400
$1,300
$1,200
$1,100
$1,000
$900
$800
$700
U.S.
$ in
bill
ions
Private Equity Council • March 2010 3
The Credit Performance of Private Equity-Backed Companies in the 'Great Recession' of 2008–2009
3
2. DaTa anD mETHoDoloGy
To estimate the default rate, this paper relies on a dataset accessed through the PitchBook private equity database of more than 9,400 companies in the united States backed by private equity investors. This paper first reduces this total to a subset of roughly 4,700 u.S. companies acquired in a buyout or similar transaction between 2000 and 2009.1 The remaining companies have been excluded because the private equity investment either had no impact on the companies’ subsequent credit performance or that impact was too difficult to isolate. Typical investments excluded on this basis were privately-placed equity in-vestments in public companies, rescue or debtor-in-possession financing, and other types of mezzanine finance. a number of non-controlling investments are included in the study that entailed nontrivial rep-resentation on the Board of Directors and significant strategic input (See appendix B for a more detailed discussion of the sample and a robustness check).
The paper then eliminates investments that had been “substantially” exited through an initial public offering (IPo), trade sale, or some other realization. While the private equity investors may retain some ownership interest in these companies, their ability to monitor management and influence strategic deci-sions has waned considerably. as a result, it would be inappropriate to include them in this study.
It is difficult to measure precisely when the realization is of a sufficient magnitude to exclude the company from the study. This paper matches specific investments with IPo data and then uses historical exit rates provided by the CapitalIq database to estimate the number of companies that substantially remained in private equity portfolios as of year-end 2007, 2008, and 2009. over the three years, the average number of companies still in portfolio was 3,269. This is the figure used as the denominator in the calculation of the cumulative default rate so as to account for the compa-nies acquired during 2008 and 2009 net of exits. appendix B also provides a data matrix that breaks down the companies included in the study by year of acquisition.
For the purposes of this paper, “default” is defined as a missed payment or bankruptcy filing. This is the definition used by the International Swaps and Derivatives association (ISDa) to determine whether a default has occurred for the purpose of a credit default swap (CDS) contract.2 other proposed “triggers” like debt repurchases or tender offers rely on subjective interpretations about whether something akin to default occurred. Since most repurchases are voluntary, labeling them as defaults could invite “gaming” if the seller also purchased credit protection. moreover, the motivation of sellers is difficult to observe. The sale of a loan or bond at a price below par to raise cash in the face of a margin call or funding difficulties could be erroneously labeled as a default.3
1 Specifically, the transactions covered in this study were buyouts (including management buyouts), management buy-ins, growth/expansion investments, secondary transactions, public to private transactions, and carveouts. These categories are not mutually exclusive. Private investment in public equity (PIPE), venture capital, bankruptcy financing, and subordi-nated lending were excluded.
2 ISDa documentation provides that a restructuring credit event must bind all holders. as a result, debt repurchases or ex-change offers that only apply to creditors that accept the terms were not likely to be counted as defaults. However, in april 2009 “distressed exchanges” were formally removed as a default trigger in the u.S.
3 Coval and Stafford (2007) describe how fund outflows can drive sales decisions in an equity market context.

Private Equity Council • March 2010 4
The Credit Performance of Private Equity-Backed Companies in the 'Great Recession' of 2008–2009
4
To determine which of the companies covered in the study defaulted, the paper relies on data provided by Thomson reuters and Dow Jones.4 The two lists of defaulted companies were combined, duplicates were removed, and a small number of companies were excluded because they were not part of the origi-nal sample (typically mezzanine borrowers, recipients of debtor-in-possession financing, businesses with no physical presence in the u.S., or companies owned by a conglomerate or holding company instead of a private equity fund). This list was then supplemented with additional defaulted companies identified through PitchBook and the Private Equity Council’s proprietary data. The final list of defaulted compa-nies is substantially larger than that of any other data source.
The final list contained 183 defaulted companies out of the average of 3,269 companies substantially backed by private equity investors during 2008-2009. This translates to a 5.6% cumulative default rate or a 2.84% annual default rate, which is more commonly used so as to allow for comparisons over different time periods (Table 1; see appendix C).
Table 1: Defaults
2008 2009 Total
Thomson Reuters 49 73 122
Dow Jones 62 86 148
Private Equity Council 79 104 183
Portfolio Companies 3,269
Years 2
Cumulative 5.60%
Default Rate 2.84%
one of the interesting findings from the list is that a large number of the transactions that ultimately defaulted involved little to no leverage. Some defaulted investments were all equity investments into risky companies, some of which were acquired out of a previous bankruptcy. The defaults also tended to correlate to overall economic activity, as media companies struggling with declining ad revenue and new competition and auto parts suppliers devastated by the decline in u.S. automotive sales were overrepre-sented. The full list is available in appendix E.
3. Summary oF ExISTInG rESEarCH
Prior to this study, there were two large sample investigations into the credit performance of private equity-backed companies. The first was released in mid-2008 by the Bank for International Settlements (BIS), the international association of central banks. The BIS took a sample of 650 private equity-sponsored businesses that were acquired over five different periods: 1982-86, 1987-91, 1992-96, 1997-01, and 2002-06. Each private equity-backed company was then matched to a proxy sample of no more than five public
4 These lists have been made public by PE Hub (Thomson reuters) and lBo Wire (Dow Jones), respectively.

Private Equity Council • March 2010 5
The Credit Performance of Private Equity-Backed Companies in the 'Great Recession' of 2008–2009
5
firms in the same industry and of roughly the same size. The BIS found that despite higher leverage, on average, portfolio company default rates “have not been consistently higher than those of similar publicly traded firms.” In fact, the default rates of sponsored companies were lower than the sample of proxy pub-lic firms in three of the five time periods surveyed. Interestingly, the highest default rate observed (3.84% in 1997-2001) was actually less than the default rate for the matched sample of public comparables over that period (4.03%).
Kaplan and Stromberg (2009) authored the other large sample study of private equity credit perfor-mance, which appeared in the Journal of Economic Perspectives. Their sample is far and away the largest reviewed to-date. It consists of 17,171 worldwide private equity acquisitions announced between 1970 and July 2007. of this total, only 6% “ended in bankruptcy or reorganization.” The incidence of default increases to 7% if one excludes recent buyouts for which insufficient performance data were available. This translates to an annual default rate of 1.2%, which is “lower than the average default rate of 1.6% that moody’s reports for all u.S. corporate bond issuers from 1980–2002.” The results in Kaplan and Stromberg enjoy a strong presumption of validity given the size of their sample, which endeavors to cover every buyout transaction since 1970. moreover, Kaplan and Stromberg’s default rate is entirely consistent with this study’s estimate given the severe economic contraction of 2008-2009. as the economy returns to trend growth, the 2010 portfolio company default rate may return to its long-run mean of 1.2%.
Table 2: Estimates of Portfolio Company Default rates
Study Period Default Rate
Kaplan & Stein, 1993 1980-’84 0.41%
Kaplan & Stromberg, 2009 1970-’02 1.20%
BIS, 2008 1982-’86 2.13%
BIS, 2008 1992-’96 2.63%
Chapman & Klein, 2009 1984-’06 2.66%
Private Equity Council 2008-’09 2.84%
Guo, Hotchkiss, & Song, 2010 1990-’06 3.14%
BIS, 2008 1987-’91 3.14%
BIS, 2008 1997-’01 3.84%
Kaplan & Stein, 1993 1985-’89 5.17%
Non-PE
S&P Overall Default Rate 4.19%
Moody's Default Rate (Speculative) 4.32%
a number of studies examine the performance of much smaller samples of private equity investments. In a forthcoming paper for the Journal of Finance, Guo, Hotchkiss, and Song (2010) analyze a sample of 192 businesses acquired by private equity investors from 1990 to 2006. of these acquisitions, 23 ended in default. This translates to a default rate of 3.14% based on the average holding period of companies in the sample. Fourteen of these defaults were bankruptcy filings and two were voluntary
Private Equity Council • March 2010 6
The Credit Performance of Private Equity-Backed Companies in the 'Great Recession' of 2008–2009
6
restructurings. It is unclear what portion of the remaining seven defaults were missed payments or voluntary restructurings.
Guo et. al. find that the cost of distress to the business is low; most defaults are “prepackaged” bankrupt-cies where private equity investors generally lose all of their investment and senior creditors take control of the firm without disruption. This supports the findings in Kaplan and andrade (1998), which seeks to isolate the effects of financial, rather than economic distress. although there are certainly examples of portfolio company defaults resulting in layoffs, closed facilities, and even liquidation, these papers find the average default results in low resolution costs with minimal disruption to company operations. a company that defaults from an unsustainable capital structure tends to have a greater probability of emerging from bankruptcy in healthy condition than a company that defaults due to economic distress like increased competition, technological upheaval, or an antiquated business model (Jensen, 1991).
another small sample study was conducted by Chapman and Klein (2009). They focus on a sample of 288 mid-market buyouts. These smaller transactions — the average deal in the sample is $78.3 million, with a largest transaction of $4 billion — had similar equity contributions (34.5%) as the typical buyout completed during the 1984 to 2006 period covered in their paper. a total of 35 companies in their sample defaulted, which equates to a default rate of 2.66%. again, the difference from other research is relatively small, but extrapolating this study’s results to the broader universe is even more difficult given the small sample and selection effects.
Finally, Kaplan and Stein (1993) look at a small sample of deals over two time periods and find dra-matically different default rates. During the first period (1980-84), only one transaction out of 41 defaulted (a 0.41% rate). During the second period (1985-89) 22 of 83 companies defaulted (equal to a 5.17% rate). While this study suffers from the same small sample issues as others, it is generally recognized that the default rate on acquisitions completed during the second half of the 1980s was the highest of any period on record. Premiums paid to market values increased, debt comprised a grow-ing portion of the acquisition price, and transaction volume reached a record 2.5% of total u.S. stock market value (Stromberg, 2008).
Some commentators have pointed to the late 1980s default rate as the most likely forecast for what is to come of transactions completed in 2005-2007. However, the similarities between these transactions are stylistic, coming as they did during periods classified by some observers as “buyout booms.” The con-trast between the average acquisitions completed during these periods is stark: equity accounted for only 12.7% of the capital of private equity-backed companies acquired during 1987-1990 compared to 32.8% of the capital of companies acquired from 2005-2007. In addition to the larger equity cushion, cash flows were also much larger relative to interest payments than in the late 1980s. as discussed in Kaplan and Stromberg, higher interest coverage ratios mean the 2005-2007 “deals are less fragile” or prone to default.

Private Equity Council • March 2010 7
The Credit Performance of Private Equity-Backed Companies in the 'Great Recession' of 2008–2009
7
Chart 2: average Equity Contribution to Private Equity acquisitions
4. SurvEy oF rECEnT analySES
Boston Consulting Group
although this study’s default rate is generally in the middle of the range of estimates contained in the literature (Table 2), it may seem low to readers who have been exposed to predictions of mass defaults. In December 2008, the Boston Consulting Group (BCG) released “Get ready for the Private-Equity Shakeout,” which predicted that nearly half of the world’s private equity-backed companies would default within three years. BCG found that 60% of a sample of 328 private equity-backed companies’ debt was trading at “distressed” levels as of november 2008. BCG used these distressed spreads to “back out” the 49% default forecast using an upwardly biased formula (See appendix D for technical details).
Chart 3: average Spread on all noninvestment Grade Debt
60%
50%
40%
30%
20%
10%
0%
Source: S&P Leveraged Commentary & Data
12.7%
1987
1988
1989
1990
1992
1993
1994
1995
1996
1997
1998
1999
2000
2001
2002
2003
2004
2005
2006
2007
2008
2009
32.8%
20
18
16
14
12
10
8
6
4
2
Source: Merrill Lynch
1/1/
1985
12/1
/198
5
11/1
/198
6
10/1
/198
7
9/1/
1988
8/1/
1989
7/1/
1990
6/1/
1991
5/1/
1992
4/1/
1993
3/1/
1994
2/1/
1995
1/1/
1996
12/1
/199
6
11/1
/199
7
10/1
/199
8
9/1/
1999
8/1/
2000
7/1/
2001
6/1/
2002
5/1/
2003
4/1/
2004
3/1/
2005
2/1/
2006
1/1/
2007
12/1
/200
7
11/1
/200
8
Time of BCG forecast
Spre
ad o
ver T
reas
urie
s (P
erce
ntag
e Po
ints
)
Private Equity Council • March 2010 8
The Credit Performance of Private Equity-Backed Companies in the 'Great Recession' of 2008–2009
8
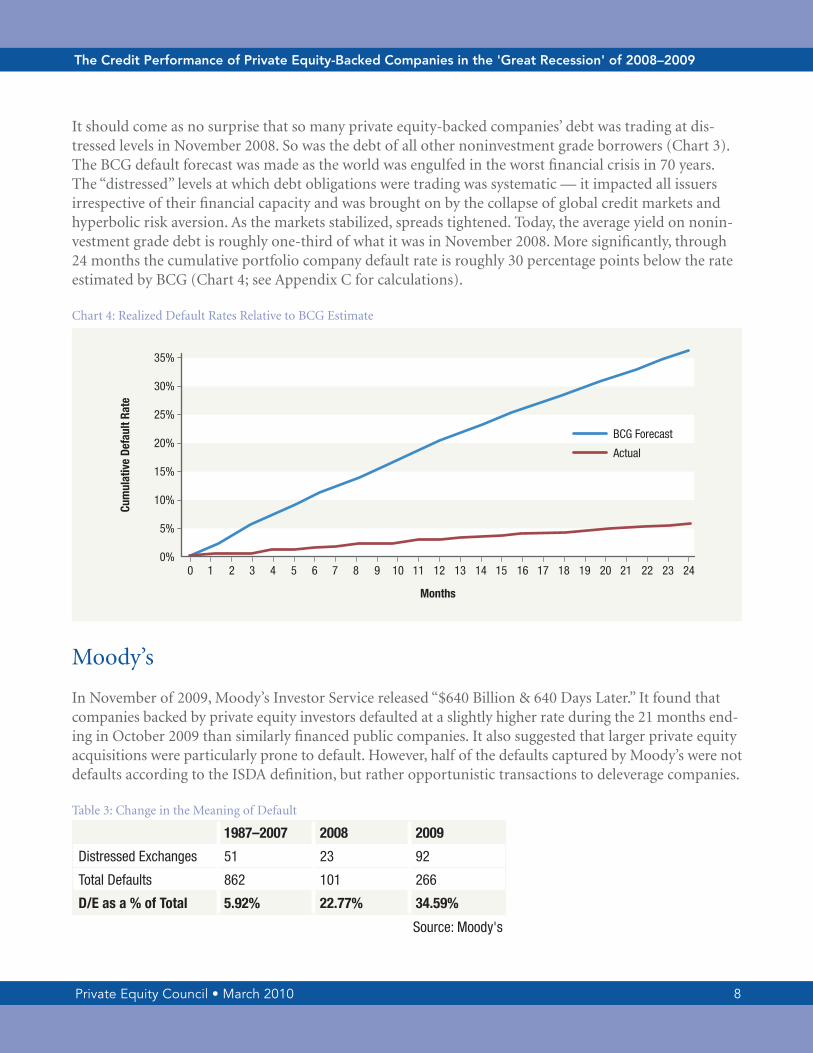
It should come as no surprise that so many private equity-backed companies’ debt was trading at dis-tressed levels in november 2008. So was the debt of all other noninvestment grade borrowers (Chart 3). The BCG default forecast was made as the world was engulfed in the worst financial crisis in 70 years. The “distressed” levels at which debt obligations were trading was systematic — it impacted all issuers irrespective of their financial capacity and was brought on by the collapse of global credit markets and hyperbolic risk aversion. as the markets stabilized, spreads tightened. Today, the average yield on nonin-vestment grade debt is roughly one-third of what it was in november 2008. more significantly, through 24 months the cumulative portfolio company default rate is roughly 30 percentage points below the rate estimated by BCG (Chart 4; see appendix C for calculations).
Chart 4: realized Default rates relative to BCG Estimate
moody’s
In november of 2009, moody’s Investor Service released “$640 Billion & 640 Days later.” It found that companies backed by private equity investors defaulted at a slightly higher rate during the 21 months end-ing in october 2009 than similarly financed public companies. It also suggested that larger private equity acquisitions were particularly prone to default. However, half of the defaults captured by moody’s were not defaults according to the ISDa definition, but rather opportunistic transactions to deleverage companies.
Table 3: Change in the meaning of Default
1987–2007 2008 2009
Distressed Exchanges 51 23 92
Total Defaults 862 101 266
D/E as a % of Total 5.92% 22.77% 34.59%
Source: Moody's
0 1 2 3 4 5 6 7 8 9 10 11 12 13 14 15 16 17 18 19 20 21 22 23 24
35%
30%
25%
20%
15%
10%
5%
0%
Cum
ulat
ive
Defa
ult R
ate
Months
BCG Forecast
Actual

Private Equity Council • March 2010 9
The Credit Performance of Private Equity-Backed Companies in the 'Great Recession' of 2008–2009
9
In addition to missed payments and bankruptcy, moody’s (and other rating agencies) have a third cat-egory of default known as a “distressed exchange” where a company pays off creditors in a transaction that the rating agency believes is tantamount to default. While default in the first two cases is unambigu-ous, the third category provides a great deal of discretion to the rating agency. until recently, the question about the proper classification of a “distressed exchange” was largely academic. For the 20 year period from 1987 to 2007, distressed exchanges accounted for less than 6% of defaults. This changed dramatical-ly in 2008. “Distressed exchanges” accounted for about 23% of total 2008 defaults and well over one-third of total 2009 defaults (Table 3). This did not occur by chance. In march 2009, moody’s explained that its definition of “distressed exchange” had been updated to include “open market and bilateral negotiated purchases of debt” (moody’s, 2009b). Prior to this update, the presumption was that a distressed exchange required an element of coercion. now voluntary transactions could be classified as a “distressed exchange” if the issuer had a noninvestment grade rating and the transaction occurred at a discount to par.
Conditioning the default classification on the issuer’s credit rating is significant because moody’s initial rating of two companies directly influences how it treats identical transactions by those companies in subsequent periods. For example, when GE Capital repurchased $1.46 billion of its bonds in 2009, the transaction was not classified as default because GE was a highly rated corporate credit. This even though the bonds’ prices averaged 90 cents on the dollar and varied between 50 cents and 99.75 cents, according to marketaxess.5 Had a private equity-backed company engaged in the very same transaction, it would have likely been classified as a default because of the presumption that a debt repurchase by a noninvest-ment grade issuer is done to avoid bankruptcy.
using a transaction’s discount to par as a criterion also caused moody’s to significantly overstate non-investment grade default rates. as prices and yields move in opposite directions, the record high yields of late 2008 and early 2009 translated to record low prices. Following lehman Brothers’ default in September of 2008, the average bid price for loans collapsed from near 90% of par to 60% by the end of the year. If one is seeking to isolate which debt repurchase is opportunistic and which is to avoid bankruptcy, it makes little sense to use the prices of credit market obligations in the midst of the worst financial crisis in 70 years as a covariate. Financial panics, by definition, result in indiscriminate declines in prices that reflect hyperbolic risk aversion and illiquidity rather than sober analysis of credit quality. moody’s definitional shift punishes private equity sponsors and portfolio companies for having the financial wherewithal to rationally repurchase debt at such low prices.
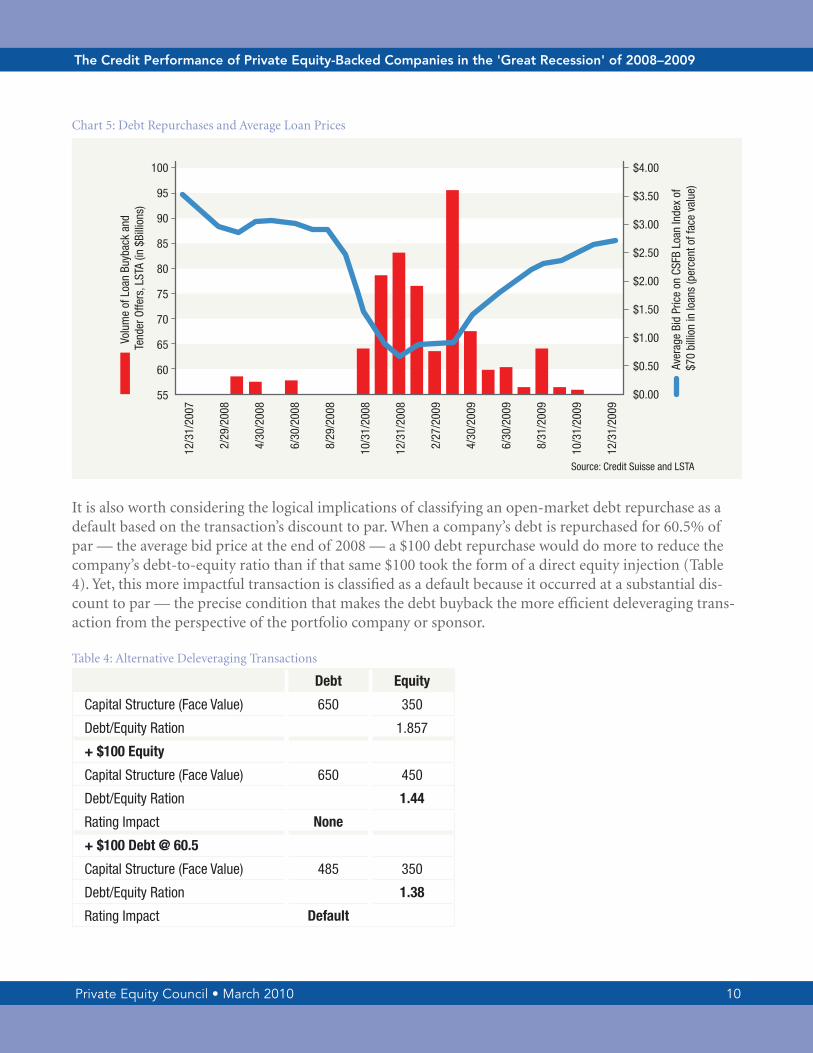
If these transactions were a collection of idiosyncratically motivated efforts to avert bankruptcy, as is implied by the “distressed exchange” classification, one would not expect a strong negative correlation between market-wide prices and repurchase volume (Chart 5). yet that is precisely what occurred: as the average secondary market price collapsed, debt buybacks and tenders spiked, nearly reaching $13 billion from october 2008 to april 2009. as the financial markets stabilized and prices rose, debt repurchases came to a halt. This fact pattern is consistent with systematic movements in prices causing rational inves-tors to enter the market.
5 See reuters: http://www.reuters.com/article/iduSn0639477320090306.
Private Equity Council • March 2010 10
The Credit Performance of Private Equity-Backed Companies in the 'Great Recession' of 2008–2009
10
Chart 5: Debt repurchases and average loan Prices
It is also worth considering the logical implications of classifying an open-market debt repurchase as a default based on the transaction’s discount to par. When a company’s debt is repurchased for 60.5% of par — the average bid price at the end of 2008 — a $100 debt repurchase would do more to reduce the company’s debt-to-equity ratio than if that same $100 took the form of a direct equity injection (Table 4). yet, this more impactful transaction is classified as a default because it occurred at a substantial dis-count to par — the precise condition that makes the debt buyback the more efficient deleveraging trans-action from the perspective of the portfolio company or sponsor.
Table 4: alternative Deleveraging Transactions
Debt Equity
Capital Structure (Face Value) 650 350
Debt/Equity Ration 1.857
+ $100 Equity
Capital Structure (Face Value) 650 450
Debt/Equity Ration 1.44
Rating Impact None
+ $100 Debt @ 60.5
Capital Structure (Face Value) 485 350
Debt/Equity Ration 1.38
Rating Impact Default
100
95
90
85
80
75
70
65
60
55
$4.00
$3.50
$3.00
$2.50
$2.00
$1.50
$1.00
$0.50
$0.00
Source: Credit Suisse and LSTA
Volu
me
of L
oan
Buyb
ack
and
Tend
er O
ffers
, LST
A (in
$Bi
llion
s)
Aver
age
Bid
Pric
e on
CSF
B Lo
an In
dex
of
$70
billi
on in
loan
s (p
erce
nt o
f fac
e va
lue)
12/3
1/20
07
2/29
/200
8
4/30
/200
8
6/30
/200
8
8/29
/200
8
10/3
1/20
08
12/3
1/20
08
2/27
/200
9
4/30
/200
9
6/30
/200
9
8/31
/200
9
10/3
1/20
09
12/3
1/20
09
Private Equity Council • March 2010 11
The Credit Performance of Private Equity-Backed Companies in the 'Great Recession' of 2008–2009
11
S&P
Finally, in a series of commentaries that began in September 2008, S&P has attempted to broaden the definition of “private equity” so as to blame a disproportionate number of overall defaults on these inves-tors. Specifically, S&P aggregates all defaulted companies that “were involved in transactions involving private equity at one point or another” into a single list and then measures its size relative to the total number of rated company defaults. under this standard, a private equity firm that provides a bankrupt public company with debtor-in-possession financing to avoid liquidation is placed in the same category as a company recently acquired in a buyout. Beyond rescue financing, “involvement with private equity” also includes any company that received a mezzanine loan, private investments in publicly traded stock, and companies that were exited long ago. as explained previously, more than 9,400 u.S. companies have been “involved” with private equity “at some point” in the past decade. The default rate measures the number of defaulted companies relative to the total number of companies in a given category at the start of the year. If S&P wishes to include all 9,400 companies in the denominator, the portfolio company de-fault rate would be much lower than estimated by this study.
moreover, S&P is indiscriminant when it comes to the types of investors it labels as “private equity.” a 2008 report classified a holding company for “gaming assets” like greyhound racing and video lottery terminals as private equity, for example. In other cases, the list of defaulted companies is increased by adding subsidiaries of parents. To make matters worse, S&P does little to explain its indiscriminate use of “private equity-related” to readers. Private equity’s estimated share of defaults is blamed on “the explo-sion of buy-out [sic] activity in recent years” even as buyouts make a small percentage of the defaults S&P wishes to attribute to private equity investors.
5. ConCluSIon anD ouTlooK
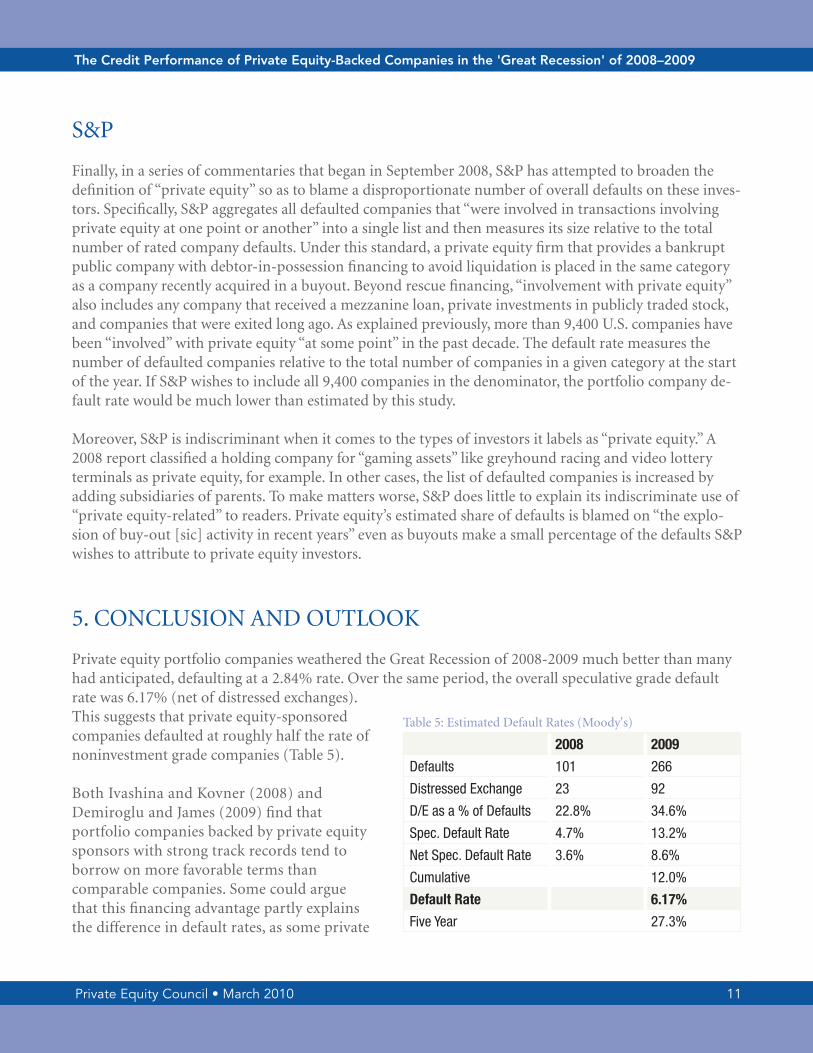
Private equity portfolio companies weathered the Great recession of 2008-2009 much better than many had anticipated, defaulting at a 2.84% rate. over the same period, the overall speculative grade default rate was 6.17% (net of distressed exchanges). This suggests that private equity-sponsored companies defaulted at roughly half the rate of noninvestment grade companies (Table 5).
Both Ivashina and Kovner (2008) and Demiroglu and James (2009) find that portfolio companies backed by private equity sponsors with strong track records tend to borrow on more favorable terms than comparable companies. Some could argue that this financing advantage partly explains the difference in default rates, as some private
Table 5: Estimated Default rates (moody's)
2008 2009
Defaults 101 266
Distressed Exchange 23 92
D/E as a % of Defaults 22.8% 34.6%
Spec. Default Rate 4.7% 13.2%
Net Spec. Default Rate 3.6% 8.6%
Cumulative 12.0%
Default Rate 6.17%
Five Year 27.3%

Private Equity Council • March 2010 12
The Credit Performance of Private Equity-Backed Companies in the 'Great Recession' of 2008–2009
12
equity-backed companies may have avoided default thanks, in part, to their loans’ bond-like covenant structures (so-called “covenant-lite” loans). However, this is unlikely to explain the results for two reasons. First, the variation in loan terms between private equity-backed borrowers is just as great as between portfolio companies and public comparables. S&P estimates that 167 “cov-lite” loans were originated between 2005-2008 (S&P, 2009b). Even if one were to assume that all of these were used to finance buyouts, they would still account for just one of every 20 borrowers in the sample of 3,269 companies. other acquisitions were financed on the same terms available to non-private equity businesses. Secondly, less onerous loan terms directly impacted this subset of sponsored companies’ capital structure decisions. one could not assume a higher default rate in the presence of maintenance requirements and other traditional covenants because the imposition of such terms would have resulted in capital structures much less likely to exceed these triggers.
Today, the overall default rate is retreating from the peak reached in november 2009 (moody’s 2010a). By the end of 2010, moody’s expects the speculative grade default rate will fall below its long-run average. Such a precipitous decline is consistent with past experience, as default rates tend to “peak rather than plateau” (Chart 3). Given that portfolio companies’ default rates generally cluster in a manner that tracks those of the broader economy (BIS, 2008), the moody’s forecast suggests that they should decline in 2010 as well. While challenges remain and future defaults are inevitable, it is highly unlikely that the cumula-tive default rate of private equity acquisitions will approach anything close to the highs feared by critics.
While the most likely scenario is a gradual decline in the default rate to the long-run average of 1.2% estimated by Kaplan and Stromberg, serious challenges remain. First, the precipitous decline in operating earnings has meant that many sponsored companies have been unable to pay down as much debt as they had planned. over the course of private equity ownership, debt levels decline by over 50% on average, as free cash flow is used to amortize previous borrowing (achleitner, lichtner & Diller, 2009).
Chart 6: Global Corporate Default rate
0.16
0.14
0.12
0.10
0.08
0.06
0.04
0.02
0
Source: Moody’s Investor Service
1920
1924
1928
1932
1936
1940
1944
1948
1952
1956
1960
1964
1968
1972
1976
1980
1984
1988
1992
1996
2000
2004
2008
Perc
enta
ge o
f Spe
cula
tive
Grad
e Is
suer
s

Private Equity Council • March 2010 13
The Credit Performance of Private Equity-Backed Companies in the 'Great Recession' of 2008–2009
13
Companies acquired in recent years may have a difficult time matching this record. Secondly, there is some risk that the financial system will have some difficulty absorbing the estimated $550 billion in noninvestment grade credit obligations maturing in 2013-2014 (moody’s, 2010). With the depth of the recession compromising amortization schedules, financial market frictions could make it difficult for is-suers to roll-over such a large volume of obligations in such a short window. Finally, there is some ques-tion about the durability of the economic recovery that seemed to begin in the third quarter of 2009. although GDP growth turned positive, credit conditions remain uneven as net loans and leases at the na-tion’s depository institutions declined by $640 billion, or 8.3%, during the course of 2009 (FDIC, 2010). Continued economic weakness could keep default rates elevated.
These risks are offset by some encouraging signs. First, during 2009, 19 private equity-backed companies sold their shares to the public through an IPo. many of these transactions were structured to provide liquidity for private equity investors and reduce the company’s debt levels at the same time. Cao and lerner (2007) review nearly 500 private equity-backed IPos and find that almost half (48.7%) used the proceeds to reduce debt levels. Interestingly, they find that the stock of the companies that used IPo pro-ceeds to reduce outstanding debt outperformed the overall stock market by about 20 percentage points over the subsequent five years. Secondly, the improved condition of the credit markets allowed for large amounts of outstanding obligations to be refinanced during the second half of 2009. moody’s estimates that 78% of the $200 billion in speculative grade debt issued in 2009 was used to refinance existing debt or extend maturities. Finally, only $21 billion of speculative grade credit matures in 2010 (moody’s 2010b). low refunding needs should provide flexibility to issue new debt in 2010 to replace some of the obligations set to mature in 2013-2014.
While the credit performance of private equity-backed companies deserves ongoing scrutiny, the data to-date support the contention that the changes in organizational structure and strategy introduced by private equity investors reduce the incidence of default. Claims to the contrary either rely on misleading data, or involve speculation about future default rates that have no historical analogue.

Private Equity Council • March 2010 14
The Credit Performance of Private Equity-Backed Companies in the 'Great Recession' of 2008–2009
14
rEFErEnCES
achleitner, ann-Kristin, Katharina lichtner and Christian Diller, 2009. “value Creation in Private Equity, Center for Entrepreneurial and Financial Studes.
altman, Edward, and Brenda Karlin. 2009. “The re-emergence of Distressed Exchanges in Corporate restructurings.” Journal of Credit Risk.
axelson, ulf, Tim Jenkinson, Per Stromberg, and michael Weisbach. 2008. “leverage and Pricing in Buy-outs: an Empirical analysis.” http://www.sifr.org/PDFs/aJSWaugust242007.pdf.
axelson, ulf, Per Stromberg, and michael Weisbach. 2009. “Why are Buyouts leveraged? The Financial Structure of Private Equity Funds.” Journal of Finance.
Bank for International Settlements. 2008. “Private Equity and leveraged Finance markets,” Committee on the Global Financial System, Publication no. 30. http://www.bis.org/publ/cgfs30.htm.
Boston Consulting Group. 2008. “Get ready for the Private-Equity Shakeout.” Heino meerkatt (BCG) and Heinrich liechtenstein (IESE).
Bureau of Economic analysis, 2009. national Economic accounts: Corporate Profits. Table 6.16D: Cor-porate Profits by Industry. Domestic industries.
Cao, Jerry x., and Josh lerner. 2007. “The Performance of reverse leveraged Buyouts.” http://www.people.hbs.edu/jlerner/rlBoPerformance.pdf
Chapman, John l. and Peter G. Klein. 2009. “value Creation in middle-market Buyouts: a Transaction-level analysis,” university of missouri, CorI Working Paper no. 2009-01.
Collin-Dufresne, P., Goldstein, r. and Hugonnier, J., 2004. a General Formula for Pricing Defaultable Claims. Econometrica, 72(5): 1377-1407.
Coval, Joshua and Erik Stafford, 2007. “asset fire sales (and purchases) in equity markets,” Journal of Financial Economics, vol.86, 2, november 2007.
Demiroglu, Cem and Christopher m., James, 2009. “lender Control and the role of Private Equity Group reputation in Buyout Financing,” march 15, 2009.
Dow Jones Financial Information Services, Private Equity: lBo Wire, 2010.
Elton, E.J., Gruber, m. agrawal, D., and mann, C. 2001. Explaining the rate Spread on Corporate Bonds. The Journal of Finance, 56(1): 247-277.
Private Equity Council • March 2010 15
The Credit Performance of Private Equity-Backed Companies in the 'Great Recession' of 2008–2009
15
FDIC. 2010. Quarterly Banking Profile, February 25, 2010.
Groh, alexander Peter and oliver Gottschalg. 2008. “The opportunity Cost of Capital of u.S. Buyouts,” national Bureau of Economic research, Working Paper 14148, 2008.
Guo, Shouron, Edith Hotchkiss, and Weihong Song. Forthcoming. “Do Buyouts (Still) Create value?” Journal of Finance, 2010.
Holmstrom, Bengt and Jean Tirole. 1997. “Financial Intermediation, loanable Funds, and the real Sec-tor,” The Quarterly Journal of Economics, vol. 112, no. 3 (aug., 1997), pp. 663-691.
ISDa research note 3, 2009: http://www.isda.org/researchnotes/pdf/ISDa-research-notes3.pdf
Ivashina, victoria and anna Kovner. 2008. “The Private Equity advantage: leveraged Buyout Firms and relationship Banking,” EFa 2008 athens meetings Paper, october 2008.
Jensen, michael C. 1991. “Corporate Control and the Politics of Finance,” Journal of Applied Corporate Finance, Summer 1991, vol. 4, no. 2, pp. 13-33.
Kaplan, Steven n., and Jeremy Stein. 1993. “The Evolution of Buyout Pricing and Financial Structure in the 1980s.” Quarterly Journal of Economics, 108(2): 313–57.
Kaplan, Steven n. and Gregor andrade, 1998. “How Costly Is Financial (not Economic) Distress? Evi-dence from Highly leveraged Transactions That Became Distressed,” The Journal of Finance, vol. 53, no. 5 (oct., 1998), pp. 1443-1493.
Kaplan, Steven n. and Per Stromberg. 2009. “leveraged Buyouts and Private Equity,” Journal of Economic Perspectives,volume 23, number 1—Winter 2009—Pages 121–146.
Kiyotaki, nobuhiro and John moore. 1997. “Credit Cycles,” Journal of Political Economy, 105, 211-248, 1997.
moody’s, 2009a. “$640 Billion & 640 Days later,” Global Corporate Finance, november 2009.
moody’s, 2009b. “moody's approach to Evaluating Distressed Exchanges,” Global Credit research, march 23, 2009.
moody’s, 2010a. “Global Default update,” Global Credit research, January 11, 2010.
moody’s. 2010b. “refunding risk and needs for u.S. Speculative Grade Issuers, 2010-2014,” Global Cor-porate Finance, February 2010.
PitchBook Private Equity Database, 2010.

Private Equity Council • March 2010 16
The Credit Performance of Private Equity-Backed Companies in the 'Great Recession' of 2008–2009
16
Standard & Poor’s. 2008. “Default Scene Bares Private Equity Fingerprints,” Global Fixed Income re-search, September 2008.
Standard & Poor’s. 2008. “Private Equity Swirling In The Eye of The Storm,” Global Fixed Income re-search, november 2008.
Standard & Poor’s. 2009. “Exposure to Deteriorating assets Increases risks To Private Equity,” Global Fixed Income research, may 2009.
Standard and Poor’s. 2009a. leveraged lending review 3q09. http://www.lcdcomps.com/pg/ research/us_research.html.
Standard & Poor's. 2009b. 4q08 leveraged lending review.
Stromberg, Per. 2008. “The new Demography of Private Equity.” World Economic Forum, The Global Economic Impact of Private Equity report 2008.
Thomson reuters, Thomson one Banker database, 2010.
World Economic Forum. 2009. “Private Equity, Jobs and Productivity,” Davis, Steven, Josh lerner, John Haltiwanger, Javier miranda, and ron Jarmin. The Global Economic Impact of Private Equity report 2009.
Private Equity Council • March 2010 17
The Credit Performance of Private Equity-Backed Companies in the 'Great Recession' of 2008–2009
17
aPPEnDIx a
unlike the cost of equity capital, which tends to remain constant for private equity partnerships due to their long-term investment horizon (Groh & Gottschalg, 2008), the cost of debt finance fluctuates over the “credit cycle” (Kiyotaki & moore, 1997). There are times when credit is relatively inexpensive and other periods when it is strictly rationed (Holmstrom & Tirole, 1997). Private equity investors complete transactions at all phases of the cycle, with the proportion of debt in a sponsored company’s capital structure varying inversely with its cost (axelson, Jenkinson, Stromberg, & Weisbach, 2008).
acquisitions covered in this study took place over an entire credit cycle. From 2000 to 2002, interest rates were high and credit for speculative borrowers was largely unavailable as banks rebuilt balance sheets following losses on technology and telecommunication-related loans. During 2001-2003, the Federal reserve sequentially lowered short-term interest rates until the Fed Funds target reached a low of 1% in June 2003. The lower short-term funding costs allowed banks to generate substantial net interest income. This increased lending capacity and eventually caused spreads on speculative grade corporate borrowing to tighten relative to Treasury notes. as lending picked up, the Federal reserve began to increase short rates in June 2004 until they reached 5.25% in June 2006.
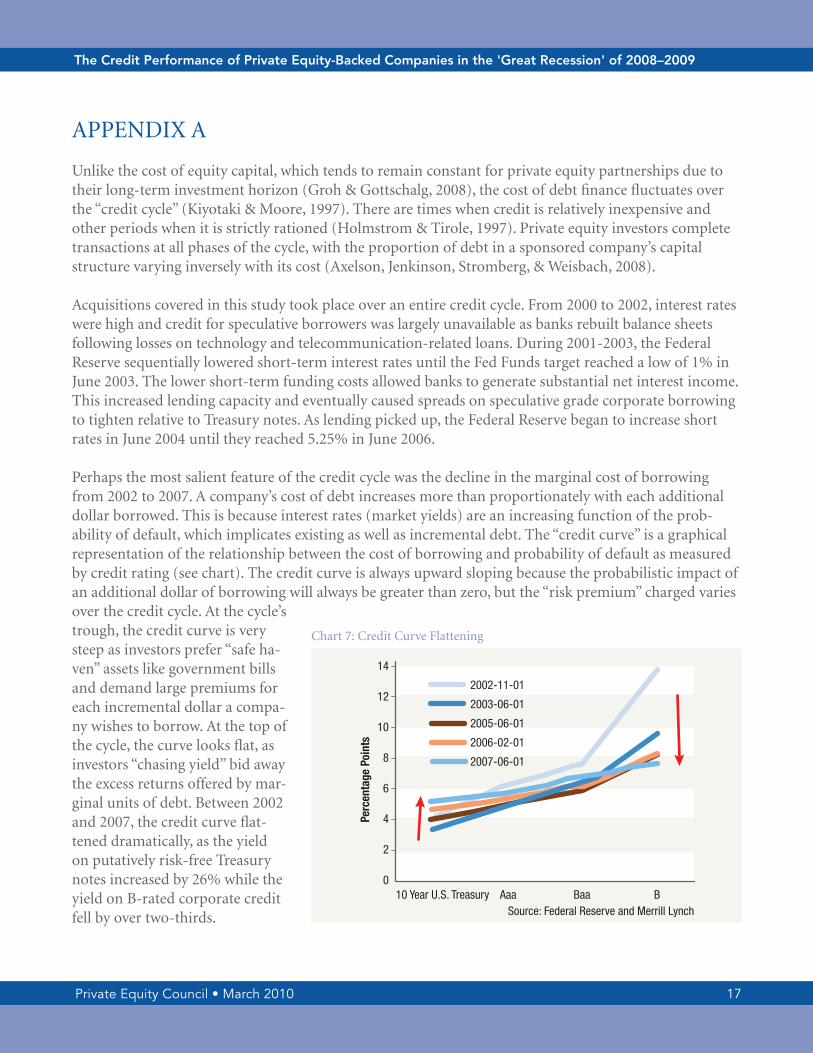
Perhaps the most salient feature of the credit cycle was the decline in the marginal cost of borrowing from 2002 to 2007. a company’s cost of debt increases more than proportionately with each additional dollar borrowed. This is because interest rates (market yields) are an increasing function of the prob-ability of default, which implicates existing as well as incremental debt. The “credit curve” is a graphical representation of the relationship between the cost of borrowing and probability of default as measured by credit rating (see chart). The credit curve is always upward sloping because the probabilistic impact of an additional dollar of borrowing will always be greater than zero, but the “risk premium” charged varies over the credit cycle. at the cycle’s trough, the credit curve is very steep as investors prefer “safe ha-ven” assets like government bills and demand large premiums for each incremental dollar a compa-ny wishes to borrow. at the top of the cycle, the curve looks flat, as investors “chasing yield” bid away the excess returns offered by mar-ginal units of debt. Between 2002 and 2007, the credit curve flat-tened dramatically, as the yield on putatively risk-free Treasury notes increased by 26% while the yield on B-rated corporate credit fell by over two-thirds.
10 Year U.S. Treasury Aaa Baa B
14
12
10
8
6
4
2
0
Perc
enta
ge P
oint
s
Source: Federal Reserve and Merrill Lynch
2002-11-01
2003-06-01
2005-06-01
2006-02-01
2007-06-01
Chart 7: Credit Curve Flattening
Private Equity Council • March 2010 18
The Credit Performance of Private Equity-Backed Companies in the 'Great Recession' of 2008–2009
18
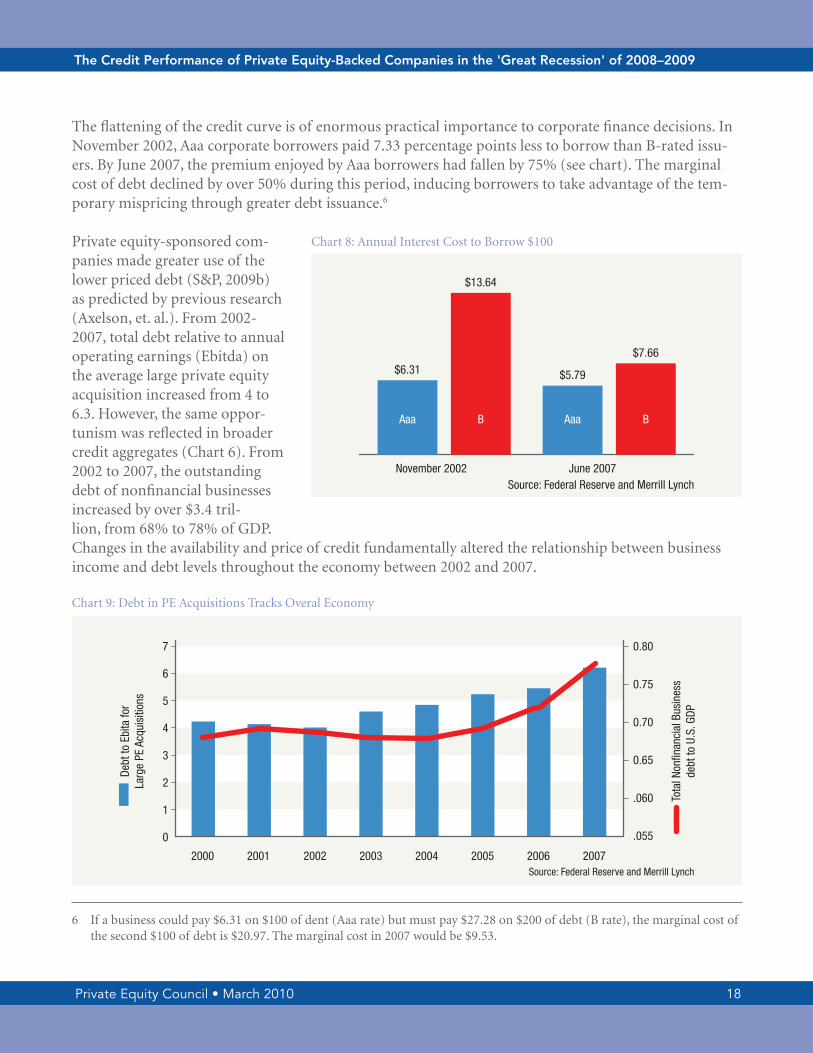
The flattening of the credit curve is of enormous practical importance to corporate finance decisions. In november 2002, aaa corporate borrowers paid 7.33 percentage points less to borrow than B-rated issu-ers. By June 2007, the premium enjoyed by aaa borrowers had fallen by 75% (see chart). The marginal cost of debt declined by over 50% during this period, inducing borrowers to take advantage of the tem-porary mispricing through greater debt issuance.6
Private equity-sponsored com-panies made greater use of the lower priced debt (S&P, 2009b) as predicted by previous research (axelson, et. al.). From 2002-2007, total debt relative to annual operating earnings (Ebitda) on the average large private equity acquisition increased from 4 to 6.3. However, the same oppor-tunism was reflected in broader credit aggregates (Chart 6). From 2002 to 2007, the outstanding debt of nonfinancial businesses increased by over $3.4 tril-lion, from 68% to 78% of GDP. Changes in the availability and price of credit fundamentally altered the relationship between business income and debt levels throughout the economy between 2002 and 2007.
Chart 9: Debt in PE acquisitions Tracks overal Economy
6 If a business could pay $6.31 on $100 of dent (aaa rate) but must pay $27.28 on $200 of debt (B rate), the marginal cost of the second $100 of debt is $20.97. The marginal cost in 2007 would be $9.53.
November 2002 June 2007Source: Federal Reserve and Merrill Lynch
$6.31
$13.64
$5.79
$7.66
Aaa B Aaa B
Chart 8: annual Interest Cost to Borrow $100
7
6
5
4
3
2
1
0
0.80
0.75
0.70
0.65
.060
.055
Source: Federal Reserve and Merrill Lynch
Debt
to E
bita
for
Larg
e PE
Acq
uisi
tions
Tota
l Non
finan
cial
Bus
ines
sde
bt to
U.S
. GDP
2000 2001 2002 2003 2004 2005 2006 2007
Private Equity Council • March 2010 19
The Credit Performance of Private Equity-Backed Companies in the 'Great Recession' of 2008–2009
19
aPPEnDIx B: Summary oF InvESTmEnTS anD roBuSTnESS CHECK
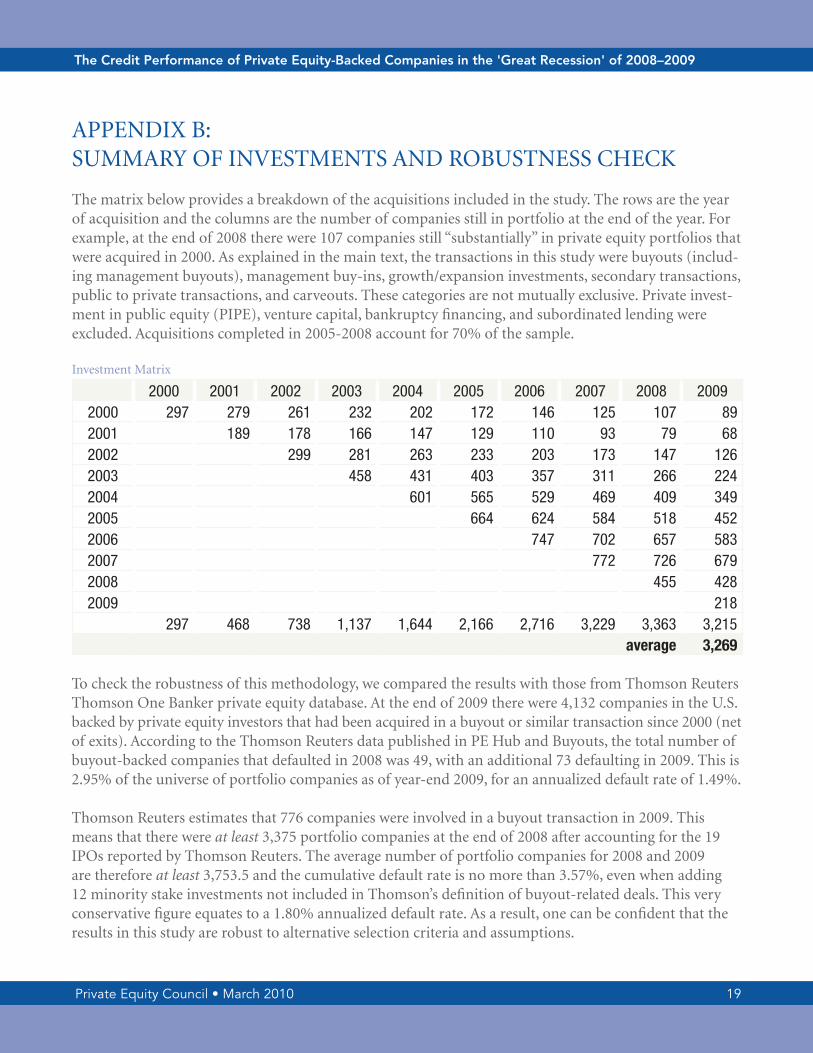
The matrix below provides a breakdown of the acquisitions included in the study. The rows are the year of acquisition and the columns are the number of companies still in portfolio at the end of the year. For example, at the end of 2008 there were 107 companies still “substantially” in private equity portfolios that were acquired in 2000. as explained in the main text, the transactions in this study were buyouts (includ-ing management buyouts), management buy-ins, growth/expansion investments, secondary transactions, public to private transactions, and carveouts. These categories are not mutually exclusive. Private invest-ment in public equity (PIPE), venture capital, bankruptcy financing, and subordinated lending were excluded. acquisitions completed in 2005-2008 account for 70% of the sample.
Investment matrix
2000 2001 2002 2003 2004 2005 2006 2007 2008 20092000 297 279 261 232 202 172 146 125 107 892001 189 178 166 147 129 110 93 79 682002 299 281 263 233 203 173 147 1262003 458 431 403 357 311 266 2242004 601 565 529 469 409 3492005 664 624 584 518 4522006 747 702 657 5832007 772 726 6792008 455 4282009 218
297 468 738 1,137 1,644 2,166 2,716 3,229 3,363 3,215average 3,269
To check the robustness of this methodology, we compared the results with those from Thomson reuters Thomson one Banker private equity database. at the end of 2009 there were 4,132 companies in the u.S. backed by private equity investors that had been acquired in a buyout or similar transaction since 2000 (net of exits). according to the Thomson reuters data published in PE Hub and Buyouts, the total number of buyout-backed companies that defaulted in 2008 was 49, with an additional 73 defaulting in 2009. This is 2.95% of the universe of portfolio companies as of year-end 2009, for an annualized default rate of 1.49%.
Thomson reuters estimates that 776 companies were involved in a buyout transaction in 2009. This means that there were at least 3,375 portfolio companies at the end of 2008 after accounting for the 19 IPos reported by Thomson reuters. The average number of portfolio companies for 2008 and 2009 are therefore at least 3,753.5 and the cumulative default rate is no more than 3.57%, even when adding 12 minority stake investments not included in Thomson’s definition of buyout-related deals. This very conservative figure equates to a 1.80% annualized default rate. as a result, one can be confident that the results in this study are robust to alternative selection criteria and assumptions.

Private Equity Council • March 2010 20
The Credit Performance of Private Equity-Backed Companies in the 'Great Recession' of 2008–2009
20
aPPEnDIx C: CalCulaTIon oF annualIzED DEFaulT raTES
The cumulative default rate (CDF) in this paper is calculated as:
The annual default rate (aDF) is then calculated as the annually compounded rate necessary to satisfy the following equation:
So that:
This is the same method used to calculate the twenty-four month equivalent to the Boston Consulting Group’s 49% three-year CDF estimate. The CDF is first converted into a monthly default rate (mDF) and then multiplied over two years for comparison with the actual results reported in this paper:
21
To check the robustness of this methodology, we compared the results with those from Thomson Reuters Thomson One Banker private equity database. At the end of 2009 there were 4,132 companies in the United States backed by private equity investors that had been acquired in a buyout or similar transaction since 2000 (net of exits). According to the Thomson Reuters data published in PE Hub and Buyouts, the total number of buyout-backed companies that defaulted in 2008 was 49, with an additional 73 defaulting in 2009. This is 2.95% of the universe of portfolio companies as of year-end 2009, for an annualized default rate of 1.49%. Thomson Reuters estimates that 776 companies were involved in a buyout transaction in 2009. This means that there were at least 3,375 portfolio companies at the end of 2008 after accounting for the 19 IPOs reported by Thomson Reuters. The average number of portfolio companies for 2008 and 2009 are therefore at least 3,753.5 and the cumulative default rate is no more than 3.57%, even when adding 12 minority stake investments not included in Thomson’s de�nition of buyout-related deals. This very conservative figure equates to a 1.80% annualized default rate. As a result, one can be confident that the results in this study are robust to alternative selection criteria and assumptions.
Appendix C – Calculation of Annualized Default Rates
The cumulative default rate (CDF) in this paper is calculated as:
The annual default rate (ADF) is then calculated as the annually compounded rate necessary to satisfy the following equation
So that:
This is the same method used to calculate the twenty-four month equivalent to the Boston Consulting Group’s 49% three-year CDF estimate. The CDF is first converted into a monthly
22
default rate (MDF) and then multiplied over two years for comparison with the actual results reported in this paper:
Appendix D – Relationship Between Credit Spreads and Implied Default Rates Default risk is priced by credit markets through a premium, usually expressed as a “spread” that measures in basis points the defaultable claim’s yield-to-maturity ( ) in excess of that of a United States Treasury note or some other putatively risk-free rate ( ). By assuming a fixed recovery rate (ω) that re�ects the percentage of face value the investor receives in the event of default, the spread can be used to estimate an annual default rate ( ):
This is the equation BCG uses to estimate the default rate. It can be converted into an unconditional cumulative default probability by multiplying the survival rate ( ) by the desired number of years, which was three in the case of BCG. As many researchers have observed (Collin-Dufresne, Goldstein, & Martin, 2001; Elton, Grubert Agrawal, & Mann, 2001), realized annual default rates are considerably less than those estimated in (1). According to Moody’s (2009), 3.1% of Baa rated bonds default after 5 years, which means . Plugging this in for in equation (1) and using BCG’s recovery rate of 40%, the spread on a Baa bond should be 0.38% per year (38 basis points). Instead, the spread on Baa bonds has averaged 2.2%, or 220 basis points (Federal Reserve). If equation (1) were an unbiased predictor of default rates, Baa bonds should default at a rate that’s roughly six times greater than historical experience. Why do investors systematically overestimate the losses on these bonds? The disparity is explained by the fact that the spread ( ) is measured relative to the risk-free rate of interest, which means that the “expected loss” is implicitly discounted at the risk-free rate. The default rate calculated in (1) is, therefore, the “risk-neutral” default probability and fails to
Private Equity Council • March 2010 21
The Credit Performance of Private Equity-Backed Companies in the 'Great Recession' of 2008–2009
21
aPPEnDIx D: rElaTIonSHIP BETWEEn CrEDIT SPrEaDS anD ImPlIED DEFaulT raTES
Default risk is priced by credit markets through a premium, usually expressed as a “spread” that measures in basis points the defaultable claim’s yield-to-maturity (Rt) in excess of that of a united States Treasury note or some other putatively risk-free rate (rt). By assuming a fixed recovery rate (ω) that reflects the percentage of face value the investor receives in the event of default, the spread can be used to estimate an annual default rate (dt):
This is the equation BCG uses to estimate the default rate. It can be converted into an unconditional cu-mulative default probability by multiplying the survival rate (1−d) by the desired number of years, which was three in the case of BCG. as many researchers have observed (Collin-Dufresne, Goldstein, & martin, 2001; Elton, Grubert, agraw-al, & mann, 2001), realized annual default rates are considerably less than those estimated in (1). accord-ing to moody’s (2009), 3.1% of Baa rated bonds default after 5 years, which means d=0.63%. Plugging this in for d in equation (1) and using BCG’s recovery rate (ω) of 40%, the spread on a Baa bond should be 0.38% per year (38 basis points). Instead, the spread on Baa bonds has averaged 2.2%, or 220 basis points (Federal reserve). If equation (1) were an unbiased predictor of default rates, Baa bonds should default at a rate that’s roughly six times greater than historical experience. Why do investors systemati-cally overestimate the losses on these bonds?
The disparity is explained by the fact that the spread (Rt−r) is measured relative to the risk-free rate of in-terest, which means that the “expected loss” is implicitly discounted at the risk-free rate. The default rate calculated in (1) is, therefore, the “risk-neutral” default probability and fails to account for the premium investors demand for bearing the risk of an uncertain outcome. This means d is an upwardly biased esti-mator because it fails to account for this risk premium.
It is also important to recognize that spreads often rise due to illiquid secondary markets, changes in investor preferences, or systemic increases in risk aversion. The only channel through which such changes can impact spreads in equation (1) is through an increase in the default probability. as a result, d is not only upwardly biased, but also not economically interpretable.
22
default rate (MDF) and then multiplied over two years for comparison with the actual results reported in this paper:
Appendix D – Relationship Between Credit Spreads and Implied Default Rates Default risk is priced by credit markets through a premium, usually expressed as a “spread” that measures in basis points the defaultable claim’s yield-to-maturity ( ) in excess of that of a United States Treasury note or some other putatively risk-free rate ( ). By assuming a fixed recovery rate (ω) that re�ects the percentage of face value the investor receives in the event of default, the spread can be used to estimate an annual default rate ( ):
This is the equation BCG uses to estimate the default rate. It can be converted into an unconditional cumulative default probability by multiplying the survival rate ( ) by the desired number of years, which was three in the case of BCG. As many researchers have observed (Collin-Dufresne, Goldstein, & Martin, 2001; Elton, Grubert Agrawal, & Mann, 2001), realized annual default rates are considerably less than those estimated in (1). According to Moody’s (2009), 3.1% of Baa rated bonds default after 5 years, which means . Plugging this in for in equation (1) and using BCG’s recovery rate of 40%, the spread on a Baa bond should be 0.38% per year (38 basis points). Instead, the spread on Baa bonds has averaged 2.2%, or 220 basis points (Federal Reserve). If equation (1) were an unbiased predictor of default rates, Baa bonds should default at a rate that’s roughly six times greater than historical experience. Why do investors systematically overestimate the losses on these bonds? The disparity is explained by the fact that the spread ( ) is measured relative to the risk-free rate of interest, which means that the “expected loss” is implicitly discounted at the risk-free rate. The default rate calculated in (1) is, therefore, the “risk-neutral” default probability and fails to

Private Equity Council • March 2010 22
The Credit Performance of Private Equity-Backed Companies in the 'Great Recession' of 2008–2009
22
aPPEnDIx E
Date Company1/7/2008 Heartland automotive Holdings Inc.1/11/2008 Financial Guarantee Insurance Corporation1/18/2008 Performance Transportation Services Inc.1/18/2008 Propex Inc.1/18/2008 Domain Inc.1/23/2008 Buffets Inc.1/23/2008 PrC llC1/30/2008 Global motorsport Group2/4/2008 Wickes Holdings llC2/5/2008 Silver State Helicopters2/5/2008 american laFrance llC2/5/2008 Sirva2/11/2008 Holley Performance Products Inc.2/13/2008 Blue Water automotive Systems2/14/2008 Wornick Co.2/15/2008 victor Plastics Inc.2/19/2008 Sharper Image Corp.2/20/2008 lillian vernon Corp3/5/2008 ziff Davis media3/10/2008 leiner Health Products Inc.3/17/2008 Powermate Corp (aka Coleman Powermate)3/24/2008 aloha airgroup4/1/2008 Diamond Glass Inc.4/3/2008 vicorp restaurants4/3/2008 aTa airlines4/10/2008 u.S. units of CFm Corp.4/10/2008 north Carolina Power Holdings llC4/26/2008 Eos airlines Inc.4/28/2008 Home Interiors & Gifts5/2/2008 linens 'n Things5/5/2008 Challenger Powerboats Inc.5/6/2008 Solar Cosmetic labs Inc.5/6/2008 Hilex Poly Co.5/8/2008 Excello Engineered Systems5/20/2008 Jevic Holding Corp5/21/2008 BHm Technologies Holdings Inc.6/4/2008 Distributed Energy Systems6/9/2008 Goody's Family Clothing Inc.6/11/2008 JHT Holdings Inc.

Private Equity Council • March 2010 23
The Credit Performance of Private Equity-Backed Companies in the 'Great Recession' of 2008–2009
23
6/20/2008 Gemini air Cargo inc.6/20/2008 Progressive moulded Products ltd.6/23/2008 Whitehall Jewelers7/9/2008 Steve & Barry's llC7/14/2008 Western nonwoven Inc.7/15/2008 Pierre Foods Inc.7/15/2008 vertis Inc. (and american Color Graphics Inc.)7/21/2008 Dynamerica manufacturing llC7/22/2008 SemGroup7/24/2008 Floors-2-Go ltd.7/29/2008 mervyn's8/7/2008 ContinentalaFa Dispensing Co.8/24/2008 mrs. Fields Famous Brands8/29/2008 Portola Packaging8/31/2008 Cadence Innovation llC9/9/2008 rehrig-united9/15/2008 motor Coach Industries International9/24/2008 american Fibers and yarns 9/24/2008 Hospital Partners of america9/30/2008 Ciena Capital10/3/2008 Comfort Co. (Sleep Innovations)10/6/2008 archway & mother's Cookie Company10/20/2008 Greatwide logistics Services Inc.10/22/2008 3 Day Blinds10/24/2008 Fitness Holdings International (aka Busy Body Home Fitness)11/3/2008 BTWW retail lP11/6/2008 american Furniture Co.11/7/2008 Hoboken Wood Flooring llC11/26/2008 Innovision Health media12/1/2008 nWl Holdings Inc.12/1/2008 Hawaiian Telcom Communications12/10/2008 Ez lube12/15/2008 Precision Parts International12/15/2008 CDx Gas llC12/15/2008 Key Plastics llC12/15/2008 Special Devices Inc. 12/18/2008 Polaroid Corp12/24/2008 new Creative Enterprises (aka Decorative Concepts)12/30/2008 DESa llC12/31/2008 recycled Paper Greetings 1/5/2009 Interlake material Handling Inc. (united Fixtures)1/6/2009 Blue Tulip Corporation

Private Equity Council • March 2010 24
The Credit Performance of Private Equity-Backed Companies in the 'Great Recession' of 2008–2009
24
1/9/2009 merisant Worldwide Inc.1/15/2009 american restaurant Group (Black angus Steakhouse Chain)1/15/2009 Wyndansea Hotel Inc.1/15/2009 Star Tribune Company1/16/2009 Specialty motors Group Holding Corp. (von Weise Gear Corp.)1/19/2009 Wall Homes Inc.1/27/2009 TallyGenicom2/2/2009 Edscha aG2/3/2009 right Start acquisition Co.2/5/2009 Fortunoff Fine Jewelry2/5/2009 Bruno Supermarkets llC2/6/2009 Fluid routing Solutions2/10/2009 muzak2/12/2009 Pliant Corporation2/12/2009 aleris International Inc.2/17/2009 nailite International 2/17/2009 Forward Foods llC2/19/2009 Foamex International Inc.2/25/2009 Everything But Water llC3/2/2009 regal Jets3/6/2009 robbins Bros3/9/2009 Joe's Sports & outdoors (fka G. I. Joe's)3/12/2009 milacron3/17/2009 Connecticut School of Broadcasting3/17/2009 masonite International3/19/2009 Drug Fair Group3/24/2009 morton metalcraft (morton Industrial Group)3/24/2009 Indalex Holdings Finance Inc.3/24/2009 Bi-lo llC3/24/2009 Sportsman's Warehouse3/30/2009 Charter Communications4/1/2009 F.T. Silfies4/2/2009 united Subcontractors4/2/2009 Big 10 Tires4/4/2009 Stila Corporation4/7/2009 Tri Palm International (zohar Waterworks)4/7/2009 Signature aluminum Inc. 4/9/2009 ultra Stores4/10/2009 aventine renewable Energy Holdings4/10/2009 Jane & Company4/21/2009 Dayton Superior4/23/2009 EuroFresh4/27/2009 Source Interlink Co.

Private Equity Council • March 2010 25
The Credit Performance of Private Equity-Backed Companies in the 'Great Recession' of 2008–2009
25
4/28/2009 victor oolitic Stone4/30/2009 Chrysler5/4/2009 mark Iv Industries5/4/2009 u.S. Shipping Partners5/4/2009 accredited Home lenders5/7/2009 Crunch Fitness (aGT Crunch acquisition)5/7/2009 Bachrach menswear5/12/2009 White Energy5/13/2009 Spring air Company (Consolidated Bedding Inc.) (merged companies)5/20/2009 J.G. Wentworth5/28/2009 anchor Blue retail Group5/28/2009 metaldyne (owned by asahi Tec Corp)5/30/2009 Hawaii Superferry6/1/2009 Genmar Holdings6/3/2009 nukote International Inc.6/9/2009 Berean Christian Stores6/12/2009 magnaChip Semiconductor6/15/2009 Extended Stay Hotels7/8/2009 The oceanaire Inc.7/8/2009 Kainos Partners (Dunkin Donuts franchiser)7/9/2009 Global Safety Textiles7/9/2009 Chronic Care Solutions (CCS medical)7/14/2009 rathGibson7/14/2009 J.l. French7/20/2009 alpha media Group (maxim magazine)7/20/2009 Wilton Holdings7/21/2009 The lang Companies7/29/2009 Station Casinos7/30/2009 Stant Corp.8/4/2009 Cooper-Standard automotive8/7/2009 Cygnus Business media8/12/2009 SkyPower8/17/2009 reader's Digest association8/31/2009 FormTech Industries9/2/2009 Freedom Communications (owner of oC register)9/3/2009 Samsonite Corp (u.S. retail ops)9/9/2009 Bluewater Broadcasting9/24/2009 velocity Express Corp.9/25/2009 Simmons Company9/30/2009 Panolam Industries International Inc.10/6/2009 questex media Group10/8/2009 accuride Corp.10/9/2009 True Temper Sports Inc.

Private Equity Council • March 2010 26
The Credit Performance of Private Equity-Backed Companies in the 'Great Recession' of 2008–2009
26
10/19/2009 Stallion oilfield Services ltd.10/23/2009 nTK Holdings, Inc./nortek, Inc.10/26/2009 Capmark Financial Group10/30/2009 GPx International Tire11/9/2009 lazydays rv SuperCenter11/16/2009 Premium Protein Products11/20/2009 Taylor-Wharton International llC11/25/2009 arch aluminum & Glass Company12/8/2009 Generation Brands12/10/2009 W new york — union Square12/17/2009 Jones Stephens Corp. PlumBest12/17/2009 ames Taping Tools (new axia Holdings)12/20/2009 Citadel Broadcasting12/22/2009 Heartland Publications12/22/2009 nextmedia Group Inc.12/23/2009 latham International

Private Equity Council • March 2010 27
The Credit Performance of Private Equity-Backed Companies in the 'Great Recession' of 2008–2009
27
aBouT THE auTHor
Jason M. Thomas, CFAJason Thomas serves as vice President of research at the Private Equity Council. Before joining the PEC, Thomas served on the White House staff as Special assistant to the President for Economic Policy and Director for Policy Development at the national Economic Council. In those capacities, Thomas acted as the nEC’s chief economic analyst and the primary adviser to the President for public finance and served as White House liaison to the President’s Working Group on Financial markets.
Prior to working at the White House, Thomas spent nearly four years on the staff of Senator Jon Kyl of arizona, where he was the economic policy analyst for the Senate republican Policy Committee. Thomas earned his bachelor’s degree in economics and government from Claremont mcKenna College, his mas-ter of Science degree from George Washington university, and is a currently a doctoral fellow at George Washington’s Finance Department. Thomas is a CFa charterholder.


