THE CYCLIZATION OF HEXADECANE DICARBOXYLIC ACID TO CYCLOPENTADECANONE ON BASIC HETEROGENEOUS CATALYSTS Von der Fakultät für Mathematik, Informatik und Naturwissenschaften der RWTH Aachen University zur Erlangung des akademischen Grades eines Doktors der Naturwissenschaften genehmigte Dissertation vorgelegt von Diplom-Chemiker Axel Boeke aus Aachen Berichter: Universitätsprofessor Dr. Wolfgang F. Hölderich Universitätsprofessor Dr. Carsten Bolm Tag der mündlichen Prüfung: 28.10.2010 Diese Dissertation ist auf den Internetseiten der Hochschulbibliothek online verfügbar
Transcript
THE CYCLIZATION OF HEXADECANE DICARBOXYLIC ACID TO CYCLOPENTADECANONE ON BASIC HETEROGENEOUS CATALYSTS
Von der Fakultät für Mathematik, Informatik und Naturwissenschaften der RWTH Aachen University zur Erlangung des akademischen Grades eines Doktors der Naturwissenschaften
genehmigte Dissertation
vorgelegt von
Diplom-Chemiker Axel Boeke
aus Aachen
Berichter: Universitätsprofessor Dr. Wolfgang F. Hölderich
Universitätsprofessor Dr. Carsten Bolm
Tag der mündlichen Prüfung: 28.10.2010
Diese Dissertation ist auf den Internetseiten der Hochschulbibliothek online verfügbar
This work was carried out between January 2006 and May 2008 at the Institute for
Fuel Chemistry and Physical - Chemical Process Engineering at the Department of
Chemical Technology and Heterogeneous Catalysis of the Technical University
RWTH, Aachen, Germany
I would like to thank Professor Dr. rer. nat. Wolfgang F. Hölderich for suggesting this
interesting topic, the outstanding working conditions, and his advice and inspiration.
I thank Prof. Dr. Carsten Bolm for accepting to be the second examiner of this work.
This work was carried out as an industrial research project. I am grateful to Mitsubishi
Chemical Corporation for the funding of this work.
Special thanks go to Dr. rer. nat. M. Valkenberg for helpful discussions, Ms.
H. Fickers-Boltz and Ms. M. Nägler for analysing the GC samples, Ms. E. Biener and
Ms. H. Bergstein for the ICP-AES analysis and Mr. K. Vaeßen for measuring all the
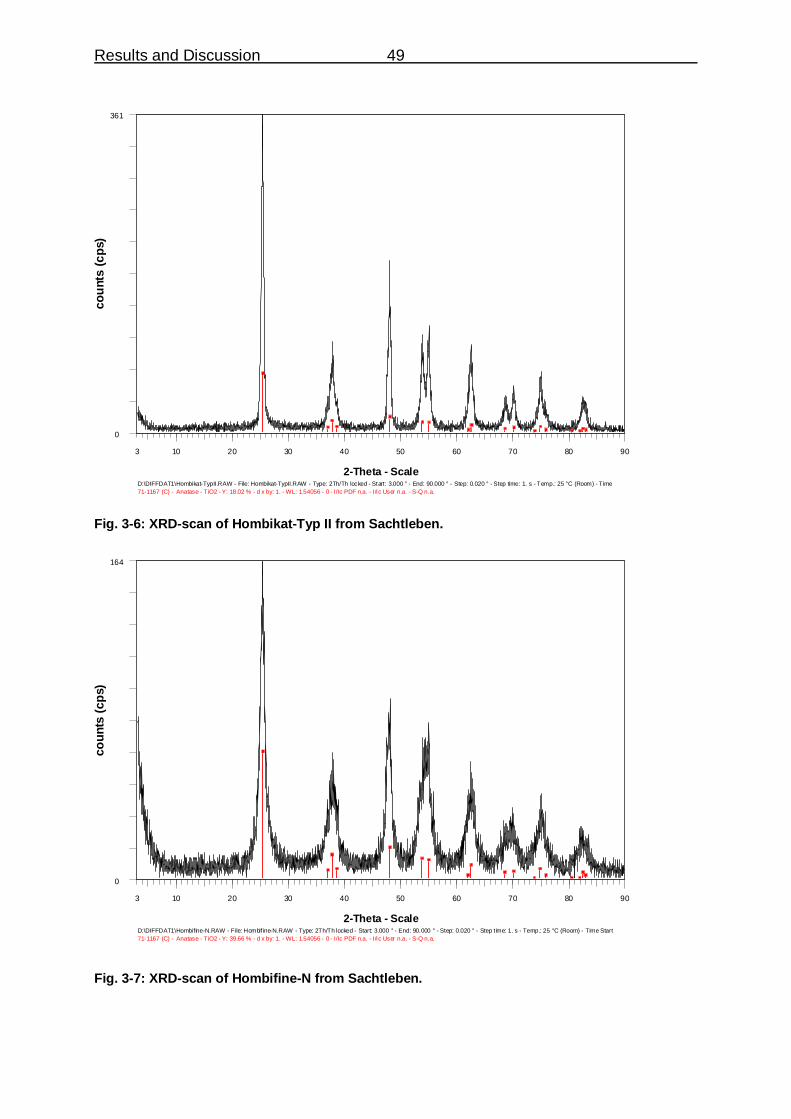
XRD, BET, TPD and TG samples.
I also like to thank Dr. rer. nat. E. Modrogan and Ph. D. A. Charmot with whom I
shared the laboratory, for the interesting discussions and their help.
Finally, I thank all those who contributed to the success of this work, especially all the
people at the institute who made it a pleasure to work there.
THE CYCLIZATION OF HEXADECANE DICARBOXYLIC ACID
TO CYCLOPENTADECANONE ON BASIC HETEROGENEOUS CATALYSTS
3.4 Reaction thermodynamics 54 3.5 Catalytic experiments 58 3.6 Analysis of by-products 100 3.7 Examination of used catalyst materials 101
4 Conclusions and outlook 103
Content II
5 Experimental 108 5.1 Remarks to the analytics 108
5.1.1 Instrument and detection technique 108
5.2 Remarks on the preparative work 113 5.2.1 Chemicals: 113
5.2.2 Preparation of catalysts by the incipient wetness method 113
5.2.3 Experimental set-ups and execution of the tests 120
6 Annex 125
Abbreviations III
Abbreviations
Apart from chemical symbols and SI units the following abbreviations were used in
the text.
A Ampere Å Angstrom AHTN 6-Acetyl-1,1,2,4,4,7-hexamethyltetralin AIBN azobisisobutyronitrile BET surface area measurement to Brunauer, Emmett und Teller BJT distribution of desorption volume c thermal capacity °C degree Celsius C [%] conversion in % cat. catalyst cc cubic centimetre CN coordination number ∆G Gibbs-enthalpy ∆H enthalpy ∆S entropy e.g. exempli gratia (lat.) EDX energy-dispersive X-ray spectroscopy et al. et alii (lat.) Fig. figure FTIR Fourier-transformed infraredspectroscopy g gramme GC gas chromatography h hour HDA hexadecane dicarboxylic acid
i.e. Id est (lat.) ICP-AES inductively coupled plasma atomic emission spectroscopy J Joule K Kelvin kg kilogramme lat. latin m mass MeOH methanol min minute ml millilitre MS massspectroscopy NBS N-bromsuccinimide p pressure p.a. per annum (lat.) PID-controller proportional, integral, differential controller
Abbreviations IV
ppm parts per million R rectus S sinister S [%] selectivity in % SEM scanning electron microscope T temperature T time TG thermo gravimetry THF tetrahydrofurane TOF turnover frequency TON turnover number TPD temperature programmed desorption V voltage wg% weight percent WHSV weight hour space velocity XRD X-ray diffraction Y [%] yield in %
Introduction and Aims 1
1 Introduction and Aims
1.1 Introduction
A fragrance or perfume is a chemical substance which stimulates the sense of smell.
Animals use them for the identification of food, members of the same species and
enemies. They play an important function in social behaviour (e.g. identifying the
sexual maturity of females) or in orientation and communication (scent marks).
The ability to smell is based on interactions of molecules with cells of the nose lining.
Molecules of a fragrance interact with a receptor and are recognized as a stimulus.
The combination of stimuli and the intensity of receptors' stimulation is thereby
essential. Humans are most sensitive to smells resulting from rotten food. The main
metabolic products of bacteria induced decomposition are dimethyl sulfide, methyl
mercaptane and ammonia, compounds toxic for human beings.
Humans use fragrances as an expression of individual personality or (like other
animals) for sexual advertisement. In addition many products used in our modern
daily life are enhanced by fragrances. Among the numerous fragrance classes,
macrocyclic ketones play a prominent role.
From among the three different classes of musky fragrances1-3 – nitroaromatics4,
polycyclic aromates4, macrocyclic ketones and lactones4-7 – the last group has been
used for the longest time.
Production processes for synthesizing macrocyclic ketones like muscone (1),
exaltone (2)1 or civetone (3) are eminently important for the perfume and fragrance
industry. While low-molecular aliphatic dicarboxylic acids can successfully be
converted to cyclic ketones, this synthetic route is not practicable for the formation of
macrocyclic ketones. Their industrial synthesis is still highly labour and cost intensive.
1 Registered Trade Mark of Firmenich & Cie, Succrs, de Chuit, Naef & Cie, Geneva
Introduction and Aims 2
1.2 Aims
The aim of this project was the use of cheap, easily available dicarboxylic acids
(hexadecane dicarboxylic acid (4) and octadecane dicarboxylic acid (5)) as starting
materials for synthesizing macrocyclic ketones like exaltone (2)
(cyclopentadecanone).
To perform this kind of cyclizations, several Na2O loaded titanium dioxide and
zirconium dioxide materials had to be tested. One objective was the preparation of
basic and bifunctional (basic-acidic) catalysts supported on very high BET-area
materials. In the context of this project catalysts with different basic materials and
different amount of loading had been prepared, characterised and tested for their
suitability.
An essential goal was the development of an appropriate analytical method. The
results in the present case are based on a GC-method without internal standard.
Another important objective was the optimization of reaction conditions, e.g.
temperature, type and amount of catalyst, flow rate of carrier gas (and therefore
residence time) or catalyst loading. Also, reactor design and configuration was
improved in several stages.
General Part 3
2 General Part
The history of perfumery goes back more than 4000 years. In ancient civilizations
fragrances served originally as sacrificial offerings for gods. However, people used
them as well for body and hair care.8 Perfumes (lat.: per = via und lat. fumum = fume)
as we know today, have been developed towards the end of 19th century and the
beginning of 20th century by Parisian perfumers. From the last quarter of the 19th
century on, the range of products has been expanded with a continually rising
number of synthetic fragrances. After the development of cumarin (1868),
vanillin (1874), ionone and synthetic musk followed. The main advantage of synthetic
fragrances is their constant quality.9
The production costs in the so called functional perfumery (soaps, detergents and
house wares) are kept as low as possible. Fragrance components consist mainly of
synthetic materials in a price range from 10 to 100 US$/kg. Only 10 percent of them
cost between 100 and 250 US$/kg and just a few are beyond that range. Natural raw
materials are usually more expensive.9 Because of the high production costs for
macrocyclics, their share in the world market of musky fragrances was less than
25 % in 1998.3 The share of polycyclic musk fragrances and nitroaromatics will
increase until 2008 up to 60-65 %.
2.1 Scents of animal origin
Raw materials of animal origin, such as musk (from the male musk deer) civet (from
civet cat) or ambra (from pot whale) and castoreum (from beaver,) etc., are used to
be essential ingredients for perfume production (Fig. �2-1). Today, due to ecological
and economical constraints, basic notes of modern fragrances have to be products of
the chemical synthesis.
General Part 4
OO
*
17
O
exal tone (2)muscone (1) civetone (3)
15 15
Fig. �2-1: Cyclic ketones – natural fragrances.
2.1.1 Natural musk odorous substances
Musk is the substance obtained from the odour gland of the male musk deer, an
animal living in the Himalayan highlands (Moschus moschiferus) (Fig. �2-2). Its
extremely strong smelling secretion acts as a marker of territory especially in the
rutting season and as a long range attractant of the female deer. The “breathtaking
stinking smell” of the pure secretion becomes a very pleasing odour at proper
dilution. Hunting, which could not yet be completely prevented, has drastically
reduced the population. In 1978 the gland was worth the triple of its weight in gold: it
costs 20 US$/g, i.e. a hunter earned more than 500 US$ for shooting one animal.10
Today Asia is the only market for the natural product because it still believed to be an
aphrodisiac. Desperate customers are willing to pay (almost) every price.
In 1906 the German chemist H. Wahlbaum isolated the main component (0,5 to
2,0 %) of the fragrance in the form of white crystals11 and named this compound
muscone (1). Later it was found that this material was the R(-)-sterioisomer (1a).12
The (R)-isomer (1a) has a diffuse musk odour (threshold value: 3 ppm) whereas the
(S)-isomer (1b) has a poor and weak musk odour (threshold value: 10 ppm). The
(R)-isomer (1a) has an odour three times stronger than that of the (S)-isomer (1b).
Beside muscone (1), cholesterol, androstenone, dehydro epiandrostenone and other
macrocyclics were identified as odoriferous components.13 Nowadays synthetic R(-)-
muscone (1a) identical with the natural product, as well as the optically active
General Part 5
(S)-form (1b) and the racemic form (1) are marketed. Their synthesis and application
in cosmetics are referred to in patents14 and literature15-38.
Fig. �2-2: Musk gland und Moschus moschiferus .39, 40
Some plants also produce lactones which exhibit a musky odour. The roots of
Angelica archangelica, a plant growing in Central Europe, or the seed pods of the
tropical plant Hibiscus abelmoschus are cultivated for fragrance production.41
2.1.2 Synthetic musk fragrances
Due to the great demand and the huge price of muscone (1), synthetic musk odorous
substances have been produced early on (Fig. �2-3). Three main classes can be
distinguished: polycyclics, macrocyclics and nitroaromatics. Polycyclics are nitro-free
compounds of mainly natural origin. The molecular structure of muscone (1) was first
established by L. Ruži�ka42, 43 (ETH Zürich, Nobel Prize 1939) in 1926.44 He
demonstrated the macrocyclic structure of this compound by showing that the same
dicarboxylic acid HO2C-(CH2)15-CO2H was obtained by oxidizing dihydrocivetone and
by the oxidation of the unsaturated Wolff-Kizhner reaction product of civetone (3) with
KMnO4 or ozone. Ruži�ka's discovery invalidated the theory of A. Baeyer who
believed in 1885 that rings with more than eight carbons were not stabile.45 Ruži�ka
suggested that the macrocyclic ketones might be formed in vivo from
α,ω-dicarboxylic acids by Claisen-type condensation which is followed by
decarboxylation.44,46
General Part 6
Seventy years after the exploration of the muscone (1) structure there is still no
economically feasible synthetic method available. Instead, other compounds which
satisfy the demand have been marketed. In 1888 A. Baur synthesised the first musk-
like synthetic compound, the tert-butyl-derivative of 2,4,6-trinitrotoluene (TNT). He
has patented his discovery as Musk Baur. 47 The inventor of nylon, W.H. Carothers48
later found out that some polyesters decompose by heating to a colourless oil which
smells of muscone (1). This synthetic muskoil is still in use today and is significantly
cheaper than the original.
Macrocyclics like ketones, lactones, dilactones and carbonates are of particular
interest. Their smell is less intensive than the synthetic nitro-, polycyclic indan- or
tetralin-like musk odours.
CH3
CH3
CH3
CH3
CH3H3C
CH3
NO2
H3C
O2N
munsk mosken
O
H3C
CH3
galaxolid
H3C CH3
H3C CH3
H3C CH3
CH3
O
H3C
CH3
H3C
CH3
tonalid
Fig. �2-3: Synthetic musk odorous substances
Macrocyclic ketones have been characterised by K.A. Bauer.49 In the first forty years
the common strategy used for synthesizing the macrocyclic scents muscone (1),
exaltone (2) and exaltolide was based on the cyclization of aliphatic precursors with
functional groups at both ends of their chain. A real breakthrough in exaltone (2)
synthesis was achieved by a method based on acyloin condensation. For the
synthesis of exaltolide the depolymerisation method and for muscone (1) the
cyclization reaction was applied.9 Large amounts of nitro musk, musk ketone and
musk xylene are being used in perfumery even today (see Fig. �2-3). The world
production of the two most important representatives of the group, galaxolide (HHCB)
and tonalide (AHTN) amounts to over 5000 tons p.a.. For this reason, these
substances are now virtually ubiquitous in samples of human tissue and
environmental material.50 They are much easier to synthesise than the macrocyclics.
General Part 7
Because of its photosensitising effect ambrett musk has been taken out of market in
all applications involving skin contact. Versalide ([1-(3-ethyl-5,6,7,8-tetrahydro-
5,5,8,8-tetramethyl-2-naphthalenyl)ethanone]) has also been removed from product
lists because nerve discolourations after feeding tests of mice were observed. As
other nitroaromatics have poor biodegradability and cause ecotoxicologic problems
as well, unobjectionable musk fragrances are increasingly in the focus of academic
and industrial research.51-56
Nitro musk and other polycyclic musk compounds accumulate in fish, human fat and
milk.52-54 The international umbrella organisation of fragrance industry the
“International Fragrance Association" (IFRA) implemented a self-regulation code in
1975, which controls fragrance application in consumption products. Currently there
are application recommendations for over 100 fragrances. They go from compliance
of purity criteria over application limits to total banning.
Over 10.000 tons of synthetic musk flavours are produced annually. These
inexpensive copies of the natural fragrance are marketed under the trade names
Galaxolide, Tonalide and Traseolide.
2.2 Heterogeneous catalysts
Chemical reactions carried out by means of catalysts (e.g. the enzymatic
fermentation of sugar to alcohol) have been known since antiquity. The Swedish
chemist J. Berzelius (1779-1848) introduced the term catalysis (Greek �������) for
the first time in 1836.59 He observed that many chemical reactions take place only in
the presence of certain substances which are not consumed in the process. Later on,
a deeper understanding of the thermodynamic background of catalytic reactions was
achieved. A catalyst is described by W. Ostwald as follows:
„A catalyst is a substance which accelerates a chemical reaction, without been spent
and without shifting the position of thermodynamic equilibrium of the reaction.“57
General Part 8
For his work in catalysis Wilhelm Ostwald was awarded the Nobel Prize for
Chemistry in 1909.
The effect of a catalyst consists in altering the reaction mechanism. The catalysed
reaction has a lower activation energy than the uncatalysed one. Thereby the
number of molecules posessing the necessary activation energy rises and the
reaction rate is increased.58
One must differentiate between bio-, homogeneous and heterogeneous catalysis. In
the last one (also known as contact or surface catalysis), the catalyst is a solid
surface on which reactants are coordinated and activated by chemosorption and
physisorption. In homogeneous processes the catalyst has to be separated after
reaction from the product for ecological and economical reasons (catalyst recycling).
Heterogeneous catalysts have the advantage of simple separation from the reaction
mixture.
Today, the fact that more than 90 % of all industrial chemical processes run over
catalytic synthesis routes, proves the prominent significance of catalysis.59 Stringent
environmental requirements will increase the demand of energy saving and
environmentally friendly catalytic processes in the chemical industry. This trend is
further promoted by a change in the raw material base, “away from crude oil based
resources, towards synthesis gas chemistry”.61 The rising demand of special
chemicals with defined adjusted characteristics is requested by new applications.
Selectivity, activity and lifetime are important parameters in catalysis. The extent to
which a catalyst increases the reaction rate at any given temperature is the activity of
the catalyst. A suitable catalytic process requires a high turnover number (TON),
defined as number of moles product per mole catalyst, and a high turnover frequency
(TOF), defined as TON per second or hour.
The extent to which a catalyst preferentially accelerates just one reaction out of
different competitive reactions (the formation of a certain product) is defined as
selectivity. One must differentiate between enantiomeric selectivity and group
selectivity, respectively.60 In the present work the performance of the catalyst in
cyclization was assessed by the fraction of exaltone (2) in reaction mixture.
General Part 9
Selectivity is of eminent importance for industrial chemistry because it is the key to
low production costs (purity, avoidance of by-products), product- and process safety
and the growing importance of environmental compatibility standards.61
Catalysts prepared by incipient wetness or impregnation consist of a catalytically
active component dispersed on the support material. This support offers a high
specific surface to the dispersed, active component. Support materials can be inert
but can also be a part of an active surface. The catalytically active component can be
present in three different forms:
• The support acts just as substrate, the catalytically active component
remains chemically unmodified.
• A mixed phase is formed in which the active component generates a
chemical compound.
• A close composition is formed and the active component is dissolved in
the support.
2.2.1 Acidic and basic centres
Many chemical reactions can be described as an acid-base interaction between feed
material and catalyst. Therefore methods for characterisation of active centres have
been developed and published.62 Many acidic catalysts have been investigated and
published in the literature. Prominent among their uses is the catalytic cracking of
heavy hydrocarbons in the petrochemical industry.62 Acidic catalysts are also used in
alkylation and isomerization reactions.63, 76
Basic catalysts, however, are less common. Pines and Pillai have been the first who
applied ammonia modified aluminium oxide as basic heterogeneous catalyst in the
dehydratisation of alcohols in the early sixties of the last century.64 A further early
example of basic catalysis is the use of dispersed sodium metal on alumina acting as
an effective catalyst for the double bond isomerization of alkenes, by Pines et al..65 In
the early seventies the catalytic activity of basic zeolites was reported.66 Since then,
General Part 10
heterogeneous basic catalysis was established as field of research in its own right.
Tanabe classified solid bases according to their strength.67 Different types of
heterogeneous basic catalysts can be specified:
1. Single component metal oxides:
• Alkaline earth oxides
• Alkali metal oxides
• Rare earth oxides
• ThO2, ZrO2, ZnO, TiO2
2. Zeolites
• Alkali ion-exchanged zeolites
• Alkali ion-added zeolites
3. Supported alkali metal ions
• Alkali metal ions on alumina
• Alkali metal ions on silica
• Alkali metal on alkaline earth oxide
• Alkali metals and alkali metal hydroxides on alumina
4. Clay minerals
• Hydrotalcite
• Chrysotile
• Sepiolite
5. Non-oxide
• KF supported on alumina
• Lanthanide imide and nitride on zeolite
Types of catalysts mainly used in industrial processes are ion-exchange resins,
phosphates, sulfates, carbonates, immobilized enzymes and sulfonated
polysiloxanes. Most of the heterogeneously catalyzed industrial processes require
zeolites, oxides, complex oxides, ion-exchange resins and phosphates. Zeolites
contribute with about 41 % of all acid-base catalysts applied. Clays, immobilized
enzymes, sulfates plus carbonates and sulfonated polysiloxanes are of less
importance in industrial processes.76
The acidic (or basic) effect of a solid depends on the characteristics on the surface.
The HSAB-concept („principle of hard and soft acids and bases“) of Pearson assigns
General Part 11
the terms 'hard' or 'soft', and 'acid' or 'base' to chemical species i.e. donor-acceptor-
interactions. 'Hard' applies to species which are small, have high charge states (the
charge criterion applies mainly to acids, to a lesser extent to bases), and are weakly
polarizable. 'Soft' applies to species which are big, have low charge states and are
strongly polarizable.58 The adsorption behaviour of metal cations can be interpreted
in terms of this principle. Coordinative unsaturated oxygen anions constitute the basic
Lewis-centres, while Brönsted acidic centres are surface hydroxylic groups which can
be deprotonated by basic molecules. Not every hydroxylic group present on the
surface can be deprotonated. Acidic and basic sites are never isolated but come forth
as acid-base couple. A catalyst is called basic if the number of basic sites prevails
over the number of acidic centres. The catalytic activity usually involves both forms of
centres together.
The preparation method affects the catalyst characteristics. Water, carbon dioxide,
oxygen and nitrogen cover the active sites on the surface at room temperature. By
this blocking of active centres the activity of the catalyst is reduced. In order to
develop full catalytic activity these compounds have to be desorbed by thermal
treatment in form of activation or calcination before reaction. Molecules anchored by
weaker surface interactions can desorb even at lower temperatures, since the
desorption energy depends on the strength of active centre-molecule bond. Centres
occupied by molecules desorbing at higher temperatures are "strong". The nature of
basic sites varies with the severity of the pretreatment conditions for most
heterogeneous basic catalysts.
Different methods for the characterisation of acidic or basic centres are available.
The amount of basic or acidic centres can be measured by adsorption methods like
temperature programmed desorption (TPD), titration in the presence of Hammett-
indicators68-70 test reactions15, 71 and spectroscopic methods like IR of pyridine,
pyrrole or carbon dioxide, XPS (x-ray PES), UV adsorption and luminescence. The
theoretical background of two of these methods used in the present work is
presented below.
General Part 12
Temperature programmed desorption (TPD)
Adsorption and spectroscopic methods utilize the adsorption interactions between
small molecules with acidic (or basic) properties and the basic (or acidic) solid
surface. By Temperature Programmed Desorption (TPD), the amount and the
strength of active centres can be determined simultaneously. Probe molecules are
chemisorbed on the surface before heating with a preset heating rate. Consequently
these probe molecules desorb at a defined temperature. For basic samples probe
molecules such as pyrrole, CO2 and H2 are used, as well as CH-acid compounds like
acetylene, benzene or even CH4, SO2, H2S, NO, CO and phenol. For acid samples
strong bases like ammonia or pyridine are used. To minimize the effect of adsorbed
base on the distribution of acid sites of different strengths, weaker bases are
sometimes used as probe molecules.72 Sometimes it is assumed that the peak
temperature, i.e. the temperature of probe molecule desorption, is an indicator of
strength of the particular centre. The amount of active sites correlates with the
detected peak area. The nature of active centre can not be analysed by TPD alone.
Further methods like IR-spectroscopy (see below) are needed for identification. To
get an overview of the amount and strength of active centres different compounds
have been measured and compared under similar conditions.62,72 The strength of
different earth alkali metal oxides measured by CO2-TPD increases as follows: MgO
< CaO < SrO < BaO. The amount of centres increases in almost reverse order: BaO
< SrO < MgO < CaO.62 The analysis of surfaces by Aramendía et al. with 2,6-
dimethylpyridine (DMPY), pyridine (PY) etc. at ZrO2.71 DMPY showed selective
adsorption to Brønsted-acid centres. For steric reasons Lewis-acid centres were not
covered. Pyridine (PY) adsorbs to both Brønsted-acid and Lewis-acid centres. The
direct influence of calcination temperature on the amount of acid centres was subject
of Aramendías research.
General Part 13
IR-spectroscopy
Additional to TPD-measurements, IR-spectroscopy generates information about
adsorbent structure. Also in this case CO2 is used as probe molecule because its
small size has a low steric hindrance. Due to its acidic electrophilic character CO2
interacts with basic centres of surfaces containing metal oxide. Basic oxygen atoms
give rise to different carbonate structures.73. These carbonates show different
absorption bands in IR-spectra and the basicity of the surface can thus be assessed.
Unidentate carbonate is formed on strong basic centres, bidentate carbonate is
formed on basic centres of medium strength and bicarbonate is formed on weakly
basic ones.73 Depending on the covering ratio different carbonate forms can result.
Fukuda and Tanabe have shown that bidentate carbonate is formed if low amounts
of CO2 are adsorbed to MgO-surfaces.74 If the amount of adsorbed CO2 increases,
unidentate carbonate becomes dominant. CaO surfaces exhibit only unidentate
carbonate at room temperature. If the adsorption temperature is high, bidentate
carbonate is formed.
IR-spectroscopic analysis of basic centres can be carried out with pyrrole and CH-
acide compounds such as acetylene, propyne, trichloromethane, etc.75 The location
of the stretch oscillation band (3520 - 3650 cm-1) of acidic OH-groups gives
information of their strength. The position of this band is controlled by the bond angle
and external factors like temperature etc. Brønsted-acid centres can also be
assessed with pyridine, CO and N2. Brønsted-acid centres e.g. in zeolites are
detected by the ring deformation oscillation at 1632 cm-1 or 1540 cm-1 using
pyridine.72,75 Lewis acid centres can also be identified with NH3, pyridine, acetonitrile
or CO. Lewis-acid centres have bands in the range of 1620 cm-1 with NH3 and near
1440 – 1551 cm-1 with pyridine. Interactions of CO with acidic hydroxyl groups lead to
the formation of H-bonds. The shift of the original oscillation band of the hydroxyl
group is a measure of acidity.
The incentive for the development of new catalysts is the optimisation of production
processes for manufacturing cheap, safe and ecologically friendly products. The main
focus of the present thesis concentrates on the effect of basic catalysts on the
General Part 14
cyclization of dicarboxylic acids. This reaction will be examined in more detail in the
next chapters.
2.2.2 Metal oxides in catalysis
Catalytic activity can be exhibited by a wide variety of materials. Metal and metal
oxides with semiconducting properties contain free electrons available for chemical
bonding and can therefore facilitate redox reactions like dehydrogenations,
oxidations or hydrogenations. Other materials with basic or acidic properties catalyse
such reactions as esterifications, alkylations or hydrations which occur via an acid-
base-mechanism. Bifunctional catalysts like platinum on acidic aluminium oxide show
redox- and acid-basis-properties as well.
Among heterogeneous catalysts metal oxides constitute a large group. Since the
beginning of the last century, metal oxides have been used in catalytic processes.
The catalytic ammonia synthesis developed by Fritz Haber in 1909 for reacting H2
with N2 on a reduced iron oxide catalyst (Fe3O4, magnetite) ranks among the most
significant discoveries.59 Numerous other catalytic applications of metal oxides have
been developed since.76 Many aspects have been clarified by modern analytical
techniques, including spectroscopy, so that an in-depth characterisation of properties
like surface texture, chemical composition and catalyst structure is now possible.
The strength of catalytically active sites correlates with the coordination number of
the metal atoms on the catalyst surface. However, the relationship between
coordination sphere and catalytic activity has not yet been completely elucidated.
Surface metal atoms having a low coordination number are very reactive and strongly
adsorb CO2 molecules.
A metal oxide consists of a metal cation (Mn+) and an oxygen anion (O2-). The metal
cation constitutes the Lewis-acidic centre and the oxygen anion the basic site. Due to
this charge difference the heterolytic chemisorption of organic molecules on metal
oxides is possible. Favoured adsorption sites are e.g. the coordinative unsaturated
centres on catalytic surfaces of transition metals. These peculiar centres are for
instance generated by thermal treatment of metal oxides. Water molecules linked to
General Part 15
the surface or resulting from hydroxylic groups on the surface are desorbed by
calcination. By dehydroxylation metal cations lose their direct neighbours and
become coordinative unsaturated. They are Lewis-acidic centres. The acid strength
depends on their size and the oxidation level, hence from the polarisation of the
metal cation.
General Part 16
Alkali earth metal oxides
The catalytic properties of alkali earth metal oxides (MgO, CaO, SrO and BaO) have
been thoroughly investigated. They possess strong basic centres rising in following
order: MgO < BaO < SrO < CaO. Their catalytic activity is influenced by impurities in
the vicinity of the reaction centre, as adsorbed CO2 and H2O deactivate the surface.
Alkali earth metal oxides have a high affinity to proton abstraction in the allyl position.
For example they are used in isomerization reactions like 1-butene to 2-butene and
the amiation of conjugated dienes.62
Rare earth metal oxides
Rare earth metal oxides in oxidation level +1 to +3 have basic centres and are used
e.g. for isomerization reactions. Moreover they are relevant in hydrogenation of
olefins and the dehydration of alcohols. Oxides with oxidation levels higher than +3,
e.g. CeO2, Tb4O7, Pr6O11 have weak basic centres and catalyse the aldol
condensation of ketones.62, 77
Zirconium oxide
Zirconium oxide shows a bifunctional behaviour. Both acidic and basic centres are
located on its surface. These centres are weak and these materials constitute
efficient catalysts. Because of the low strength the active centres are not deactivated
by CO2 and H2O. The detailed structure of these bifunctional centres is still
discussed.78 On industrial scale ZrO2 is used for dehydratisation of 1-cyclohexanol to
vinylcyclohexane and reduction of aromatic carboxylic acids with H2 to
aldehydes.62,79, 80
Aluminium oxide
Aluminium oxides exhibit a highly complex surface structure. Like ZrO2, Al2O3 in
γ-modification can have both acidic and basic sites. Models of Peri81 and Knözinger /
Ratnasamy82 describe the different types of coordinated hydroxyl groups
respectively. The complex surface structure of Aluminium oxide has the ability to
General Part 17
catalyse different reactions where various active centres are needed. Pines and Pillai
used ammonia modified Aluminium oxide for the dehydration of alcohols in the early
60´s of last century.83
On industrial scale Al2O3 is used e.g. by Mobil to convert methanol to dimethyl
ether.76 Stabilized γ-Al2O3/Pd catalysts are used for crack reactions in refinery
processes in huge scale. Amorphous SiO2-Al2O3 and zeolites are used for
hydrocracking and Fluid Catalytic Cracking (FCC) of heavy oil distillates.84.
Solid superbase catalysts, as developed by researches of Sumitomo Chemicals are a
further industrial application of alumina.85 These catalysts consist of alkali metal
hydroxide/alkali metal on γ-alumina (MOH)x/My/γ-Al2O3, wherein M, x, y are described
as M = Li; Na;K; Rb; Cs; x = 5-15 wt:% on γ-Al2O3 and y = 3–8 wt:% on γ-Al2O3. They
have an extremely high basicity, sometimes higher than H0 > 37. Such super bases
do not catalyze cracking reactions, do not deactivate due to strong adsorption of
compounds containing basic N or O groups and have a long service time. However
they are sensitive to moisture and CO2 and therefore have to be handled carefully.
Nevertheless, they are already applied as highly active and effective catalysts for
double bond isomerization and side-chain alkylation of alkylbenzenes such as the
Sumitomo-process for the production of 5-ethylidene-bicyclo[2.2.1]hepta-2-ene from
5-vinyl-bicyclco[2.2.1]hepta-2-ene via isomerization over the superbase Na/NaOH/γ-
Al2O3 and the Sumitomo-process for the production of t-amyl-benzene by side-chain
alkylation of cumene with ethylene over K/KOH/γ-Al2O3.76, 86 The superbase catalyst
NaOH/Na/γ-Al2O3 can also successfully be employed for the isomerization of safrol
(1-allyl-3,4-(methylene-dioxy)-benzene) to iso-safrol (3,4-(methylenedioxy-
1-propenyl)-benzene) as well as for the isomerization of 2,3-dimethylbutene-1 to
2,3-dimethyl-butene-2, a valuable intermediate for the production of pyrethroids.87
Recently such super base catalysts can be used for transesterification of
dimethylterephthalates with ethylene glycol to form bis-hydroxyethylthrephthalate
(BHET).88, 86
General Part 18
2.3 The manufacture of cyclic ketones
Due to the ever increasing ecological awareness and also for safety reasons,
considerable efforts have been directed toward the development of fragrances
identical or similar to the natural substances. Unlike many other synthetic musk
compounds, macrocyclic ketones, esters and lactones identical or similar to the
corresponding natural products are ecologically harmless and constitute the object of
industrial research.89 Over the years various synthetic processes found industrial
application. To date, the huge number of reaction steps, poor yields and high
production costs pose considerable problems. Furthermore, in the case of substituted
chiral macrocyclics a pure optical isomer has to be available as precursor (e.g. (+)- or
(-)-3-methyl-glutaric acid for muscone (1).). Along ring-enlargement reactions, ring-
closing reactions are the key steps in the synthesis of macrocyclic musk.90, 91 Most of
these reactions are carried out without any catalyst.
2.3.1 Ring enlargement reactions
Since cyclododecanone (6) is easily available, this compound is predestinated as
feedstock for ring enlarging reactions.92 The synthesis proceeds over the
trimerisation of 1,3-butadiene, followed by hydrogenation and oxidation. This
component is enlarged over bicyclic intermediates by three carbon atoms (Fig. �2-4).
General Part 19
Stobbe condensation93 of cyclododecanone (6) with diethyl succinate forms
β-carbethoxβ-cyclododecylidenepropionic acid with is cycled to a bicyclic vinylogous
β-keto ester by zinc chloride94 in acetic acid or preferably which polyphosphoric
acid.46 Followed by an acid hydrolysis bicyclo[10.3.0]-∆1(12)-pentadecene-13-one (7)
can be smoothly obtained. The hydrogenation of the bicyclic ketone (7) to the
homologue alcohole requires the presence of Raney-nickel and 1 wg.% NaOH. A
subsequent dehydratisation of the alcohol by benzene sulfonic acid in boiling toluene,
generates bicyclo[10.3.0]-∆1(12)-pentadecene (8). This compound reacts by
ozonisation and following catalytically hydrogenation to the diketone 5-
oxocyclopentadecanone (9). The process ends with the quantitative partial catalytic
hydrogenation of the olefinic double bond of 10 in the presence of Raney-nickel to
cyclopentadecanone (11).95
H2C
O
COOEt
COOEt
H2C
O
H2C
O
CH2 O
CH2 OO
H2C
O3, CH2Cl2
8 8 8
1011
10
Raney-Ni, H2,MeOH, NaOH
Raney-Ni, H2Raney-Ni, H2
6 7 8
91011
1. t -BuOK,2. ZnCl2, H3PO4
Fig. �2-4: Ring enlargement of cyclododecanone over bicyclic intermediates to Ohloff. 95
General Part 20
Another synthetic route involves the epoxidation of the α,β-unsaturated carbonyl
compound (7) (Fig. �2-5). The ring enlargement step implies the fragmentation of the
α,β-epoxyketone (12) and the corresponding p-tosylhydrazone (13) to the respective
alkinone (14). The stumbling block in this sequence is the low yield of the
epoxidation. The consecutive catalytic hydration over Pd/charcoal or a Lindlar-
catalyst results in the cyclopentadecanone (11) or the cyclopentadec4-en-1-one (10),
respectively.96
H2C
O
R
H2C
N
R
NHTs
H2C
R
O
H2C
O
O R
CH2
R
O
8 8
8
10
11
H2O2 / HO-
1. CH2Cl2 / AcOH 1 : 12. p-TsNHNH2
p-TsNHNH2 / EtOH
ROH / Acetone / NBS
H2, Pd / C, EtOH
7 12
13
11
14
Fig. �2-5: Ring enlargement by fragmentation of a bicyclic compound. 96
Later this tosylhydrazone route was complemented by structural variants97 such as
the fragmentation of α,β-epoxyketonoximes with hydroxylamine-O-sulfonacid in
alkaline solution98 as well as the fragmentation of hydrazones from
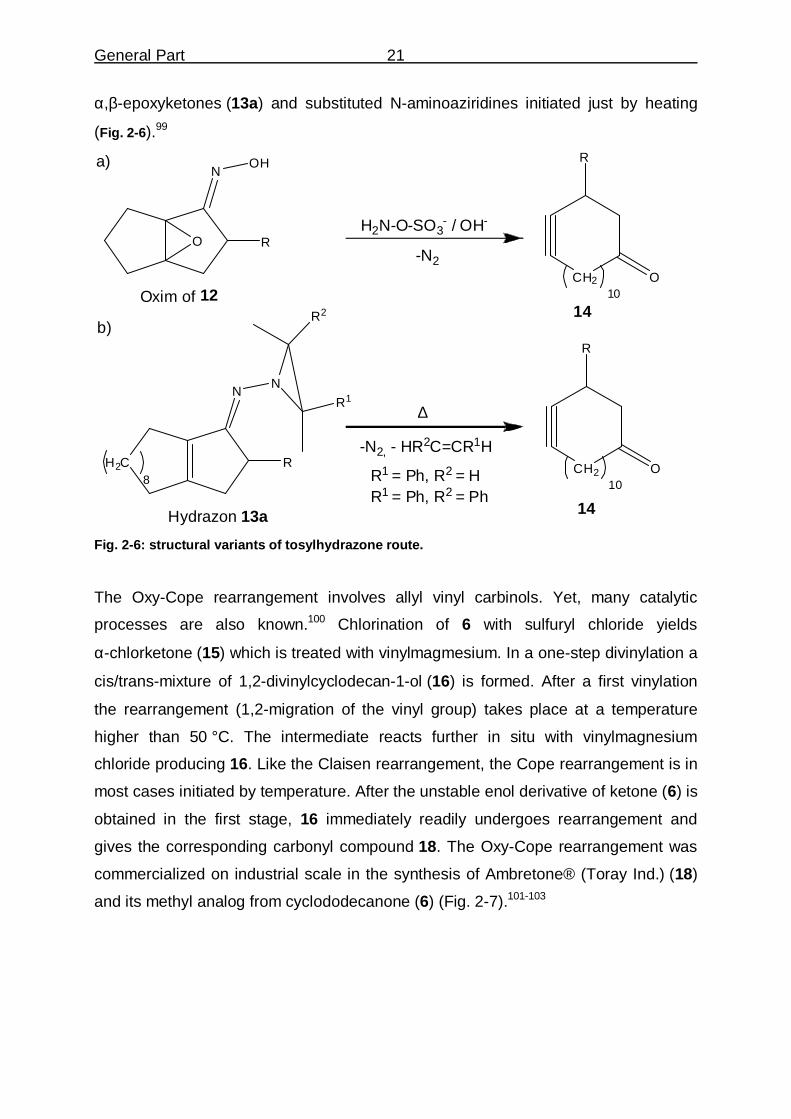
General Part 21
α,β-epoxyketones (13a) and substituted N-aminoaziridines initiated just by heating
(Fig. �2-6).99
H2N-O-SO3- / OH-
N
O R
OH
CH2
R
O10
14
-N2
Oxim of 12
a)
b)
H2C
N
R
N
8
R2
R1
-N2, - HR2C=CR1HCH2
R
O10
14
∆
R1 = Ph, R2 = HR1 = Ph, R2 = Ph
Hydrazon 13a Fig. �2-6: structural variants of tosylhydrazone route.
The Oxy-Cope rearrangement involves allyl vinyl carbinols. Yet, many catalytic
processes are also known.100 Chlorination of 6 with sulfuryl chloride yields
α-chlorketone (15) which is treated with vinylmagmesium. In a one-step divinylation a
cis/trans-mixture of 1,2-divinylcyclodecan-1-ol (16) is formed. After a first vinylation
the rearrangement (1,2-migration of the vinyl group) takes place at a temperature
higher than 50 °C. The intermediate reacts further in situ with vinylmagnesium
chloride producing 16. Like the Claisen rearrangement, the Cope rearrangement is in
most cases initiated by temperature. After the unstable enol derivative of ketone (6) is
obtained in the first stage, 16 immediately readily undergoes rearrangement and
gives the corresponding carbonyl compound 18. The Oxy-Cope rearrangement was
commercialized on industrial scale in the synthesis of Ambretone® (Toray Ind.) (18)
and its methyl analog from cyclododecanone (6) (Fig. �2-7).101-103
General Part 22
H2C
O
CHClH2C
O
2 CH2=CHMgCl
H2C
OH
H2C
OH
CH2H2C
O
8 8 10
3
8
6
18
15
1716
Fig. �2-7: Industrially applied synthesis of cyclohexadec-5-en-1-one (18) from
cyclododecanone (6). 89
A ring expansion via a photochemical cleavage of a bicyclic ketone yielding
exaltone (2) has already been reported in 1967.104 Another C3 ring enlargement
strategy depends on a radical-initiated addition of HBr and subsequent
regeioselective Baeyer-Villiger reaction of substituted cyclododecanone (19) to
bromo lactone (20) by a peroxy acid (Fig. �2-8). The reaction of 20 (containing 1,2-
dibromoethane as initiator) with Mg or Li in THF creates an organometallic
species (21). Through this intermolecular Grignard or lithium-supported reaction
yields over 75 % have been attained. An intramolecular nucleophilic attack on the
carboxylic group by 21 or by a stabilised carbanion (23) generates a
C15-macrocycle (25) via a six-membered cyclic transition state (22).105 The formation
of the pyran-like intermediate (22) and the preparation in extreme dilution prevent a
nucleophilic attack on the carboxylic group of the hydroxyketone. Similarly successful
are the cyclizations of the anion (23) derived from sulfone and the subsequent
removal of the sulfonyl group.106-108 By a radical-initiated addition of thiophenol to
2-allylcyclododecanone (19) a thioether is formed. Without any purification the
oxidation to the sulfone is caused by an excess of peracetic acid. In the presence of
BF3-etherate at 50 °C for several days a regeioselective Baeyer-Villiger reaction
affords a sulfonyl lactone (23´). The ring is closed under basic conditions generating
the sulfonyl ketone (24) which is selectively reduced to the hydroxyl ketone (25) by
Al(Hg).
General Part 23
CH2
CH2
O
OR
SO2Ph
O
OR
X
CH2
CH2
R
O
OH
SO2Ph
CH2
O
OR
M
R
O
CH2
CH2
R
O
OH
O R
OH
10
1010
10
1010
10
A:1. HBr, hν2. CH3CO3H,
BF3 x Et2O,Cl3CCH3
Li, Br(CH2)2Br, THF/30 °C
1. CH3CO3H, BF3 x Et2O,2. LDA, THF,3. Al (Hg), THF
B:1. PhSH, AIBN2. CH3CO3H, Cl3CCH33.CH3CO3H, BF3 x Et2O,
Cl3CCH3
19
20
21
23
25
22
24
Fig. �2-8: Ring enlargement by intramolecular Grignard - et.al. nucleophilic reactions. 105
Another example of a ring enlargement is presented by Sugimone et. al..109 Cyclic
ketones are transformed into bicyclic alcohols by a three carbon annelation followed
by a regioselective radical cleavage of their fused bond. Key step is the
transformation of an iodide into a single bicycle[10.3.0]pentadecan-1-ol by a Grignard
reagent or butyl lithium in THF.
Another pathway developed by Firmenich for producing racemic muscone (1) passes
two key steps: 1.) the intramolecular En-reaction catalyzed by Lewis-acid (26�27)
and 2.) the β-cleavage of bicyclic alkoxides (27) to macrocyclic Enone (28) (Fig.
�2-9).110
O
OH
H
OMe2AlCl1,2-Dichloroethane / Hexane
KH, HMPA
26 27 28
Fig. �2-9: Ring enlargement by an intramolecular En-reaction. 110
General Part 24
An additional procedure of macrocyclic ketone formation is the two-carbon ring
expansion by thermo-isomerization. In two repetitive cycles exaltone (2) can be
prepared from cycloundecanone.111
General Part 25
2.3.2 Ring-closing reactions
The first synthesis of a macrocyclic musk compound was published by Ruži�ka in
1926 (Fig. �2-10).44 He successfully generated exaltone (2) in yield of 2 % by pyrolysis
of thorium salts of hexadecane dicarboxylic acid (4).
COOH
COOH
O
151) NaOH
2) ThCl3, ∆
4 2
Fig. �2-10: The first exaltone (2) synthesis by Ruži�ka.
Even though this preparation was optimised up to yields of 60-70 %, this method was
not used for industrial production because of the high dilutions necessary to favour
the intramolecular reaction over oligomerisation and polymerisation. Other high
dilution macrocyclizations relying on Ziegler´s work were reported: Hunsdiecker112, 113
proposed an intramolecular condensation and Blomquist114 a ketene dimerization
approach.
To avoid this problem V. Prelog and M. Stoll independently developed a method
based on the acyloin condensation to muscone (1).115; 116 Since the reductive
coupling occurs on the sodium surface high dilutions were no longer necessary and
very practical conditions of around 1 M solutions are possible (Rüggli-Ziegler dilution
principle).
General Part 26
X
CH2
X
X
CH2
X
X
CH2
X
H2C11
O
H3C
CH3
12
CH3OO
9
CH3O
10
cyclisation:1. X = COOR2. X = COCl3. X = CN
cyclisation:1. X = COORacyloincondensation
29
1
3130
Fig. �2-11: Alternate routes to rac -moscone (1) from derivatives of 3-methyl-hexadecanediacid (29). 117
From an industrial point of view, high dilution reactions are not economical, as the
reactor volume is taken up by solvent rather than the value added product. The first
industrial synthesis was developed using an intramolecular acyloin condensation118
(Fig. �2-11). According to the method of M. Stoll and A. Commarmont, muscone (1)
and the isomeric 4-methyl-cyclopentadecanone can be obtained by ester
condensation of the diethyl ester (30) of 3-methyl-5-oxo-hexadecane-
α,ω-diacid (29).119-121 The reduction of the methyl-substituted keto diester (29) is
followed by ester condensation while making use of the dilution principle, and
subsequent removal of the carbethoxy group to afford 1.
Applying the same method the ketal-protected ketone of the diester can be cyclized,
deoxidised to the ketal diol (31) which is converted to the unsaturated ketone. This
ketone is hydrogenated and deprotected to give muscone (1).15 The hydroxylic group
of the acyloin in α-position can either be dehydrated over alumina to the
α,β-unsaturated ketone or reduced with zinc dust in acid media to provide
muscone (1) 122 An alternative reduction with HI is also possible.
General Part 27
In addition to acyloin condensation ring-closing reactions can also be carried out by
intramolecular ester condensation of the e.g. alkyl substituted diester (Dieckmann-
condensation).123 followed by cleavage of the ethoxy carbonyl group, obtaining the
cycloalkanone.124 The Dieckmann-condensation is actually an intramolecular
Claisen-condensation (in which esters having α-hydrogen are condensed in the
presence of a strong base to form a α,β-ketoester). In the Dieckmann-condensation
the two esters groups involved in the reaction are present in the same molecule and
an α-alkoxycarbonylated macrocyclic ketone is formed. The α-alkoxycarbonylated
macrocyclic ketone can be converted into the macrocyclic ketone by hydrolysis and
decarboxylation according to the known method.125 In general, Dieckmann-
condensation is advantageous for the formation of 5-, 6-, or 7-membered rings. Also
civetone (3) has been produced by this intramolecular condensation in the presence
of titanium tetrachloride or zirconium tetrachloride and a trialkylamine.126 By ring-
closing reactions of the diester, the diacid chloride127 or the diacid nitrile128, 129 of 3-
methyl-5-oxo-hexadecan-α,ω-diacid (29), racemic D,L-muskone (1) can be
generated.
The first synthesis of optically pure stereoisomers of muscone (1) was successfully
performed by S. Ställberg-Stenhagen in 1951.130 It involved the cyclisation of the
dichloride of (+)- or (-)-3-methyl-hexadecane diacid. (+)- or (-)-3-methyl-glutaric acid
were used as enantiomerically pure intermediates for the preparation of the
dicarboxylic acid. Afterwards, the necessary optically active esters of ketodicarboxylic
acids were made by homogeneous asymmetric hydrogenation of the unsaturated
ketodiester or ketals.131, 132
Further approaches based on intramolecular Wittig reaction133 and intramolecular
acylation17 of ω-trimethylsilylethynylalkanoyl chlorides on AlCl3 have been reported.
Even superior and without dilution conditions is the intramolecular alkylation of a
cabanion generated from protected cyanohydrins by sodium hexamethyl-
disilazane.134 Furthermore an intramolecular aldol condensation reaction116 is
suitable to form cyclic structures. So 3-methyl-2-cyclopentadecen-1-one can be
generated from 1,15-hexadecandione via the Mg115, Al, Ti135 and Zn enolates. After
preparing the cyclic enone according to the Tsuij136,137 method by organoaluminium,
General Part 28
the (E)- and (Z)-isomeres were separated and applied to a p-tolyl-BINAP-Ru
catalysed asymmetric hydrogenation by T. Yamamoto.138
Along Diekmann- acyloin- and aldol condensation the intramolecular
metathesis139, 140 is another possibility to build rings (Fig. �2-12). By this method e.g.
civetone (3) (cis-9-cycloheptadecene-1-one) was prepared in a three step synthesis
from methyl-cis-9-octadecanoate (32) via intramolecular metathesis under high
dilution on a heterogeneous Re2O7/SiO2×Al2O3 catalyst.141, 142 Metathesis is best
described as a reaction between two alkenes in which an intercharge of alkylidene
groups takes place. The yield of 12 % lies in same range as the in preparation of
civetone (3) via Diekmann condensation.143
H3C CH2
CH2 CH2
CH2 CH3
O
67 7
6
CH2
CH2
O
7
7H3C CH2
CH2
66
CH3+
3 33
32
Fig. �2-12: Ring closing via intramolecular metathesis. 142
A. Fürstner144 reported stereoselective homogeneously catalysed alkine metathesis
affording civetone (3). The cyclizations were carried out by using catalytic amounts of
a Schrock-alkine complex (t-BuO)3W�CCMe3 or via an in situ generated catalyst
consisting of Mo(CO)6 and p-trifluoromethyl phenol.145,146
General Part 29
O
34
3 steps
O
Ru
Ph
PCy3
PCy3
Cl
Cl
O O
78% yield
H2, 10% PdC
CH3OH, 3h,98% yield
1a35 36
Fig. �2-13: Synthesis of (R)-(-)-muscone (1a) from (+)-citronellal (34) by ring-closing metathesis
In the same year the synthesis of (R)-(-)-muscone (1a) by a macrocyclization based
on ring-closing olefin metathesis (RCM) as the key step was published. Commercially
available (R)-(+)-citronellal (34) was employed as a precursor in preparing the acyclic
diolefinic substrate (35), which in turn was contacted with bis(tricyclohexyl-
phosphine)benzylidene ruthenium dichloride catalyst (Grubbs I)147 to afford the cyclic
RCM reaction product in 78% yield. Catalytic hydrogenation of (36) gave
enantiomerically pure (R)-(-)-muscone (1a).148,149,150 Further syntheses using a
metathesis reaction step to generate this product are mentioned in literature.151-153
Shorter aliphatic acids have successfully been converted by intramolecular
decarboxylation-dehydratisation reactions to suitable cyclic ketones. In these
commercialyzed processes the aliphatic acids react in liquid phase at 250 °C in
presence of certain metals or their compounds (B, Al, Ga, In, Th, Sn, Sb, Bi, Mo, Rb,
Cr, or V) to the ketone.154 Also well known is the preparation of small cyclic ketones
from aliphatic acids on TiO2 catalysts impregnated with Na2O and K2O as filed in the
patent of W. Hölderich et al..155 Over such a catalyst methyl isopropyl ketone was
prepared from mixtures of acetic and isobutyric acid. Other catalysts such as ZrO2 or
ThO2 on Al2O3 were less successful.156 The best results were achieved by Na2O- and
K2O-impregnated anatase supports.157; 158, 155 A similar method could be applied for
the intramolecular decarboxylation/dehydratisation reaction.
Recently BASF AG159 published the possibility of synthesizing macrocyclic ketones
like exaltone (2) from the diesters of the corresponding acids by using the same TiO2
catalyst impregnated with Na2O and K2O.160 These findings constitute the starting
point of this thesis.
General Part 30
2.4 Support materials
2.4.1 Production processes for TiO 2-support materials
The main industrial methods used in the production of titanium dioxide for pigments
are the chloride and the sulfate process.
The sulfate process for titanium dioxide production was developed in Norway by
F. Farup and G. Jebsen in 1915 and industrially applied since 1919 (Fig. �2-14). This
process still retained its prominent position. The chemical digestion of the finely
ground and enriched titania ore ilmenite is carried out with sulfuric acid. The iron
oxide in the ore reacts to iron sulfate and the titanium oxide to titanium sulfate. The
large amounts of sulfur dioxide generated in this process are neutralised by sodium
hydroxide solution so that just small amounts of sulfur dioxide are emitted in the
environment today. Titanium sulfate settles and the iron sulfate solution is separated
and then crystallised to green iron(II)-sulfate heptahydrate. Titanium sulfate is easily
hydrolised with boiling water to titanium oxide hydrate which is then calcinated at 800
to 1000 °C in a rotating oven to pure white titanium dioxide after an extensive
washing process.161
Titanium dioxide production by the chloride process starts from enriched ilmenite or
rutile. The ore is mixed with coke and reacted with chlorine gas in fluidized bed at
approximately 1000 °C in special chlorine resistant reactors to gaseous titanium
tetrachloride and carbon dioxide. Low-volatile impurities resulting after chlorination,
e.g. FeCl2, are separated, then dissolved in water and crystallised. Chlorine gas also
reacts with the residual wetness in the slag forming hydrochloric acid which is
washed out and sold as a by-product. Afterwards the gaseous titanium tetrachloride
is condensed and purified by distillation. Pure titanium dioxide is generated by
burning the titanium chloride in oxygen; titanium chloride is oxidised to titanium
dioxide and pure chlorine gas is released and recycled to the reaction process.
General Part 31
Fig. �2-14: Production process of TiO 2-support materials 162
General Part 32
Materials resulting from both processes show essential differences in catalytic
application. Higher specific surfaces can be obtained by the sulfate method but the
material includes small amounts of sulfate.163, 164 This fact has an important effect on
application in catalysts because sulfate-containing materials possess increased
Brönsted-acidity.
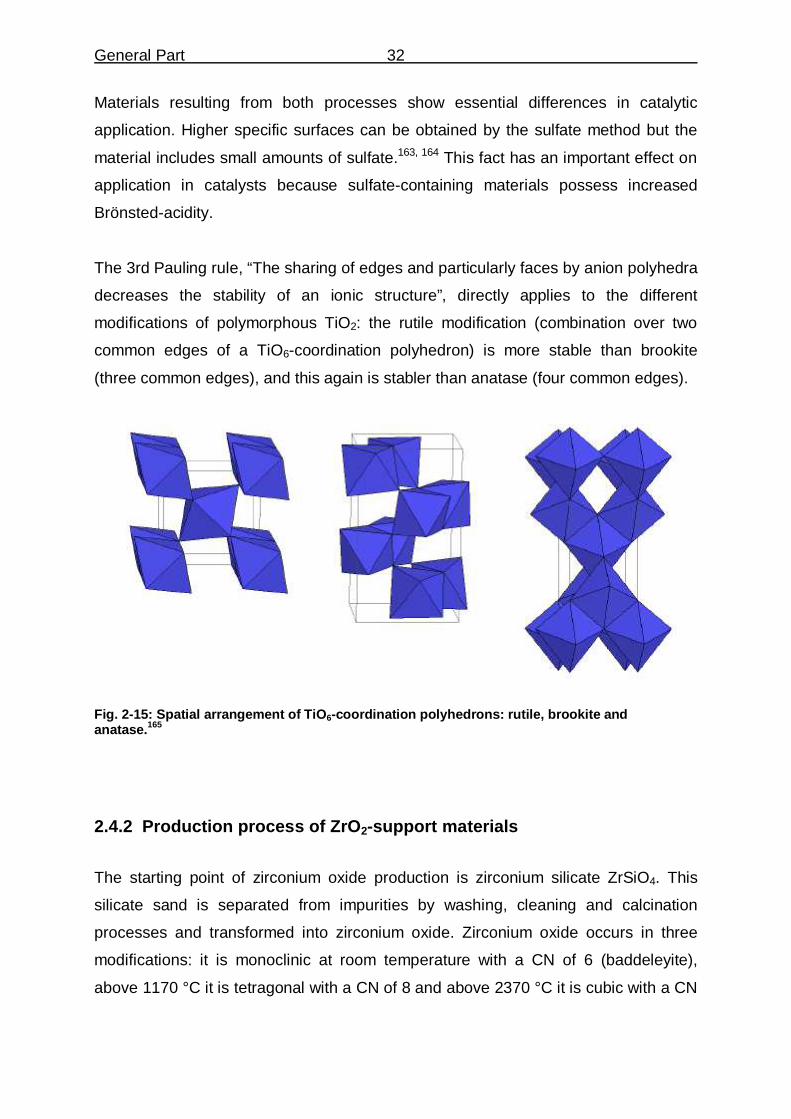
The 3rd Pauling rule, “The sharing of edges and particularly faces by anion polyhedra
decreases the stability of an ionic structure”, directly applies to the different
modifications of polymorphous TiO2: the rutile modification (combination over two
common edges of a TiO6-coordination polyhedron) is more stable than brookite
(three common edges), and this again is stabler than anatase (four common edges).
Fig. �2-15: Spatial arrangement of TiO 6-coordination polyhedrons: rutile, brookite and anatase. 165
2.4.2 Production process of ZrO 2-support materials
The starting point of zirconium oxide production is zirconium silicate ZrSiO4. This
silicate sand is separated from impurities by washing, cleaning and calcination
processes and transformed into zirconium oxide. Zirconium oxide occurs in three
modifications: it is monoclinic at room temperature with a CN of 6 (baddeleyite),
above 1170 °C it is tetragonal with a CN of 8 and above 2370 °C it is cubic with a CN
General Part 33
of 8 (fluorite-type). The structures are commonly described as cubic centred lattice of
O2—ions with filled gaps.
monoklin kubischtetragonal
Fig. �2-16: Three modifications of ZrO 2: monocline, tetragonal und cubic.
2.4.3 Alternatives of immobilisation
Catalytic active components can be immobilised on different ways. Some examples
of the most important immobilisation methods are summarily presented below.166, 167
• Impregnation. The active component is added as a solution. The excess
solvent is decanted or concentrated in vacuum. By drying the active substance
remains deposited on the support.
• Incipient Wetness. Only as much of a solution of catalytic active substance is
added as the support can absorb. The wet powder is then dried.
• Adsorption. Unlike Incipient Wetness this technique does not necessitate any
solvent since the active substance itself is a liquid. The support material is
treated with just the amount of liquid active component to keep the catalyst in
powder form.
General Part 34
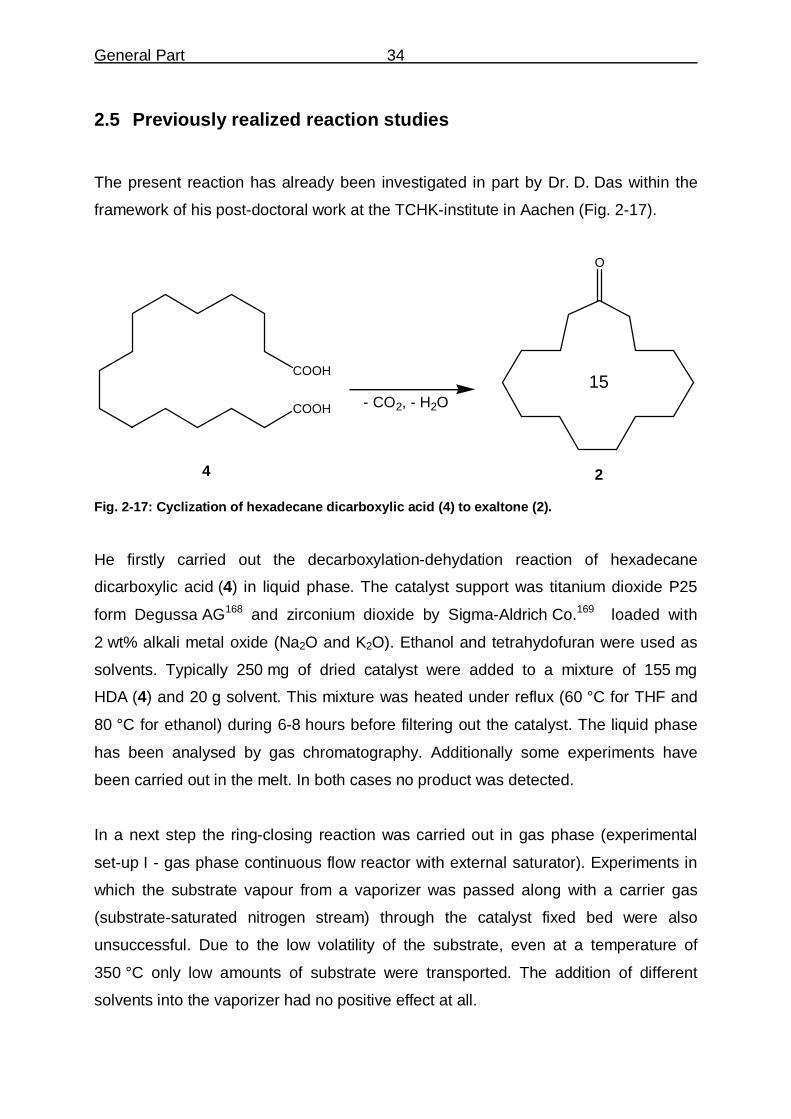
2.5 Previously realized reaction studies
The present reaction has already been investigated in part by Dr. D. Das within the
framework of his post-doctoral work at the TCHK-institute in Aachen (Fig. �2-17).
COOH
COOH
O
15- CO2, - H2O
4 2
Fig. �2-17: Cyclization of hexadecane dicarboxylic acid (4) to exaltone (2).
He firstly carried out the decarboxylation-dehydation reaction of hexadecane
dicarboxylic acid (4) in liquid phase. The catalyst support was titanium dioxide P25
form Degussa AG168 and zirconium dioxide by Sigma-Aldrich Co.169 loaded with
2 wt% alkali metal oxide (Na2O and K2O). Ethanol and tetrahydofuran were used as
solvents. Typically 250 mg of dried catalyst were added to a mixture of 155 mg
HDA (4) and 20 g solvent. This mixture was heated under reflux (60 °C for THF and
80 °C for ethanol) during 6-8 hours before filtering out the catalyst. The liquid phase
has been analysed by gas chromatography. Additionally some experiments have
been carried out in the melt. In both cases no product was detected.
In a next step the ring-closing reaction was carried out in gas phase (experimental
set-up I - gas phase continuous flow reactor with external saturator). Experiments in
which the substrate vapour from a vaporizer was passed along with a carrier gas
(substrate-saturated nitrogen stream) through the catalyst fixed bed were also
unsuccessful. Due to the low volatility of the substrate, even at a temperature of
350 °C only low amounts of substrate were transported. The addition of different
solvents into the vaporizer had no positive effect at all.
General Part 35
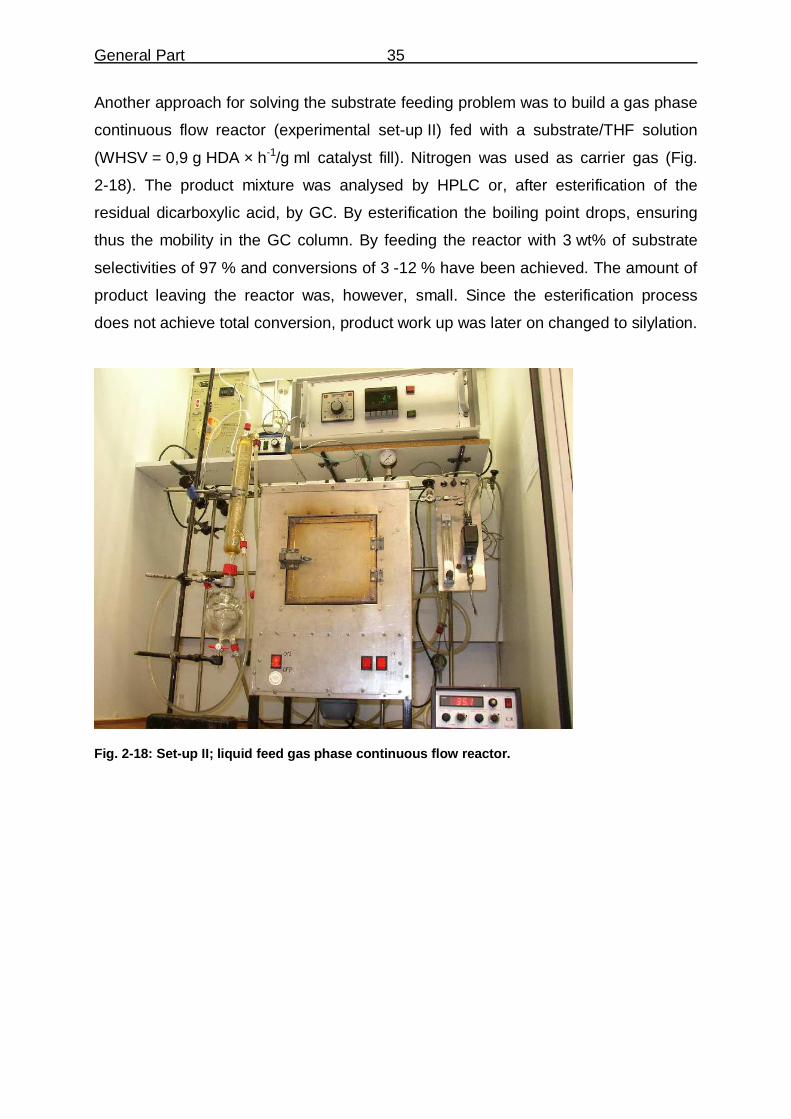
Another approach for solving the substrate feeding problem was to build a gas phase
continuous flow reactor (experimental set-up II) fed with a substrate/THF solution
(WHSV = 0,9 g HDA × h-1/g ml catalyst fill). Nitrogen was used as carrier gas (Fig.
�2-18). The product mixture was analysed by HPLC or, after esterification of the
residual dicarboxylic acid, by GC. By esterification the boiling point drops, ensuring
thus the mobility in the GC column. By feeding the reactor with 3 wt% of substrate
selectivities of 97 % and conversions of 3 -12 % have been achieved. The amount of
product leaving the reactor was, however, small. Since the esterification process
does not achieve total conversion, product work up was later on changed to silylation.
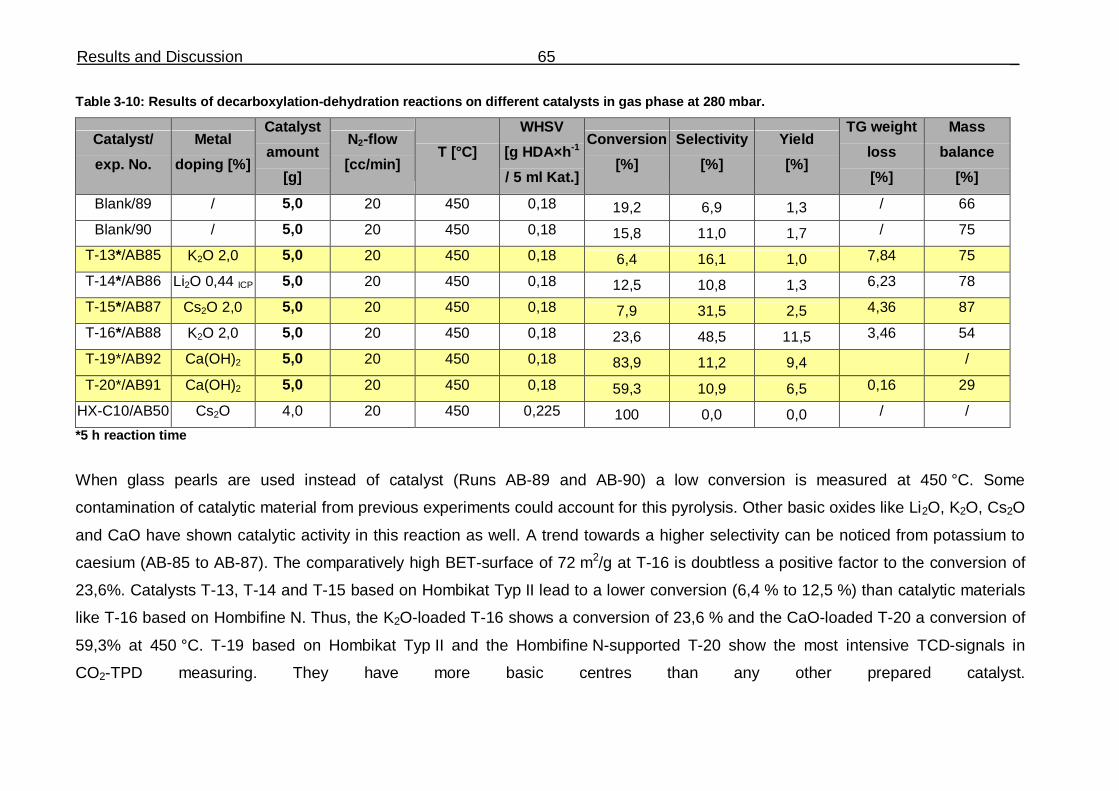
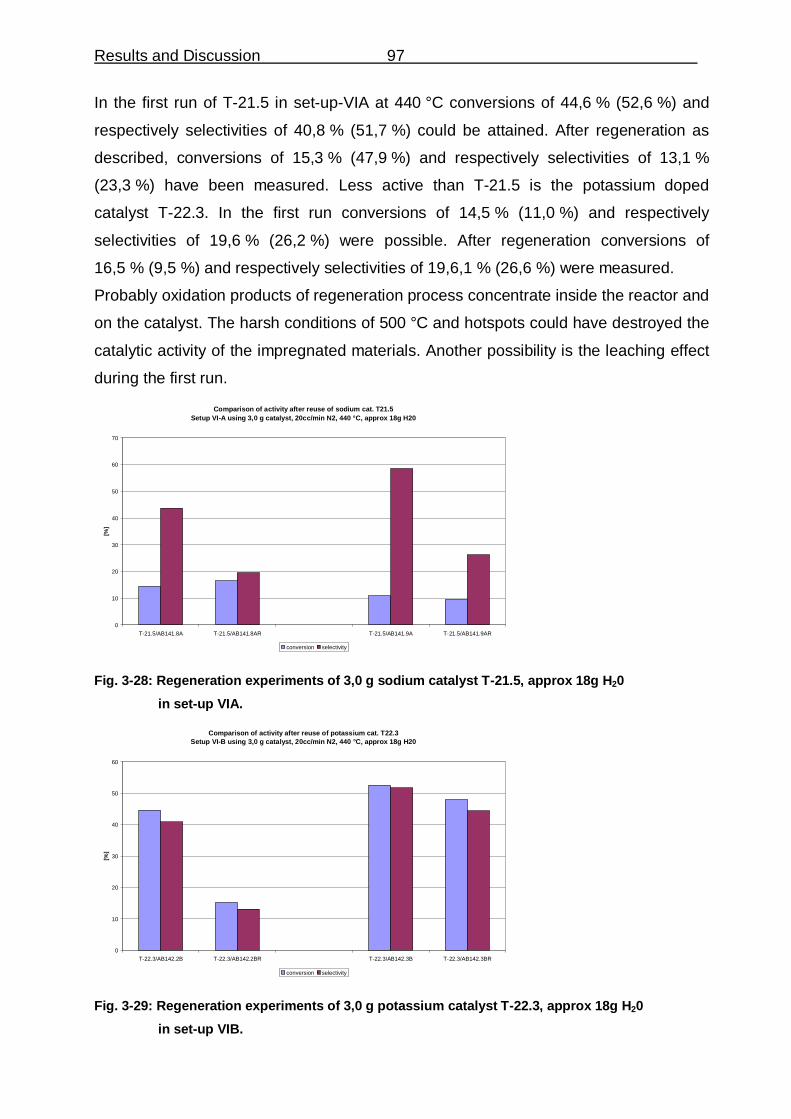
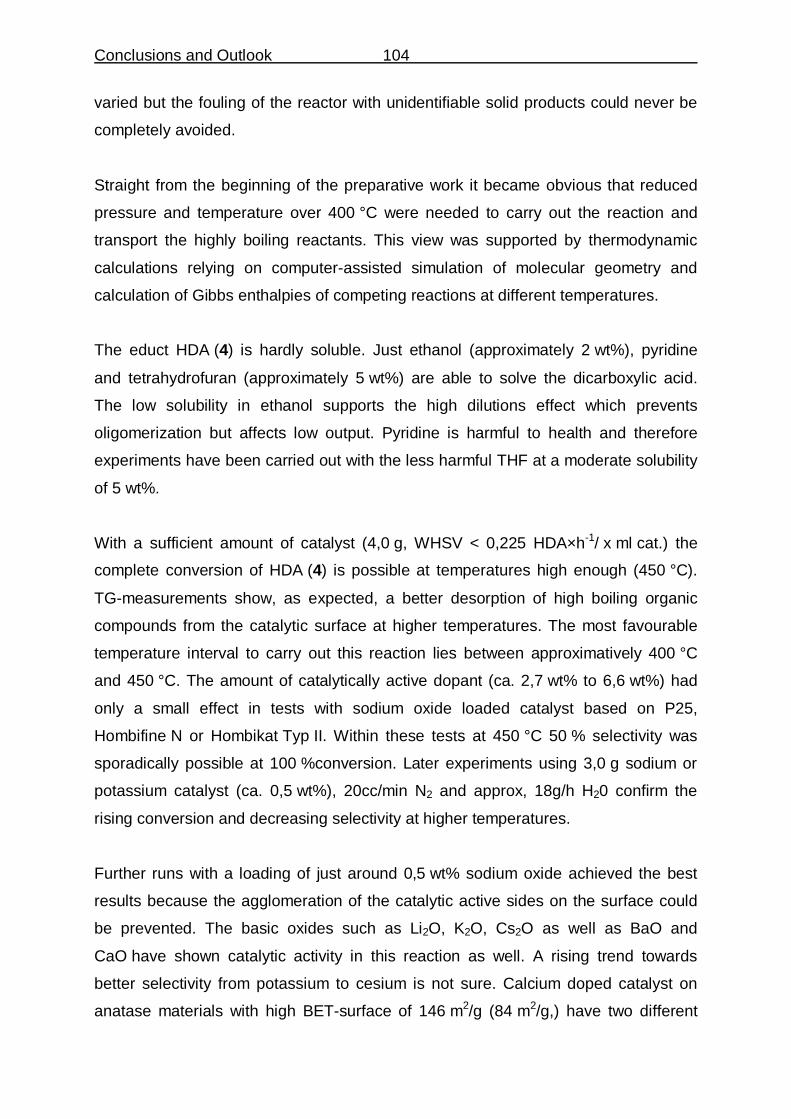
*5 h reaction time The effect of the amount of catalytic active material was investigated with catalysts T-10 and T-10B on Hombifine N support, catalysts
T-11 and T-11B on P 25 support and catalysts T-12 and T-12B on Hombikat Typ II. With catalysts T-10 and T-10B no clear effect of
catalyst loading was noticeable. As shown in Table �3-7 conversions of 100 % and selectivities up to 50 % are possible. With a stabler
mass balance these results could probably be improved and become more reproducible. Developing the process the mass balance has
not bee measured in the early experiments. The verified mass lies in the range of 40 to 90% (see Table �3-8). Although runs AB-81 and
AB-82 vary in the assessed mass balance, the results of conversion, selectivity and yield are on a comparable level. The positive
influence of a higher amount of catalyst is shown again in runs AB-61 and AB-81 but also challenged in Exp. AB-47 and AB-77. The
inscrutable results in experiment AB 47 and AB77 are the result of unsteady pressure conditions as well as small variations in fixed bed
charge, reactor geometry, output of the pump and work-up. By scaling up the experimental Set-up dimension blockades and
Results and Discussion 62 _
inhomogenities can be reduced probably. The results of TG-experiments usually show a better desorption of higher boiling point organic
compounds from the catalytic surface at higher temperatures. There are several examples in Table �3-6 to Table �3-9 showing higher
weight loss at lower temperatures of 300 °C and 400 °C than at higher temperatures (450 °C or 500 °C). The lowest conversion of
20,5 % was found at a temperature of just 400 °C (Exp. AB44). As observed before, a temperature of 500 °C results at a conversion of
100 %. In the course of this work the experiments were carried out at least twice in order to check the results later on. The maximum of
selectivity of 50 % was measured at a temperature of 450 °C (Exp. AB47). No influence of the Na2O loading was noticed here or in the
following results presented in Table �3-8 and Table �3-9. Furthermore, higher doped materials show a lower BET-surface because of
blockage of pores by alkali and agglomeration of doping material.
Table �3-8: Results of decarboxylation-dehydratisation reactions on T-11 and T-11B catalysts in gas phase at 280 mbar.
1 P. Kraft; J. A. Bajgrowicz, C. Denis, G. Fráter, Angew. Chem., Int. Engl. Ed. 2000, 39,
2980. 2 G. Fráter, J.A. Bajgrowicz, P. Kraft, Tetrahedron 1998, 54, 7633. 3 M. Gautschi, J.A. Bajgrowicz, P. Kraft, Chimia 2001, 55, 379. 4 T.F. Wood, Fragrance Chemistry: The Science of the Sense of Smell; Theimer, E. T.,
Ed.;Academic Press: New York 1982, 495. 5 B.D. Mookherjee, R.A. Wilson, Fragrance Chemistry: The Science of the Sense of
Smell;E.T. Theimer, Ed.; Academic Press: New York 1982, 434. 6 P.R. Story, P. Busch, Advances in Organic Chemistry: Methods and Results; E.C. Taylor
,Ed.; Wiley-Interscience: Princeton, New Jersey, Vol. 8. 1972. 7 A.S. Williams, Synthesis 1999, 1707. 8 Ohloff, G., Riechstoffe und Geruchssinn, Springer Verlag, Berlin, Heidelberg, New York
1990. 9 H.J. Borschberg, B. Brauckmann, Der Struktur von Düften und Aromen auf der Spur,
ETH-Zürich, http://e-collection.ethbib.ethz.ch/ecol-pool/bericht/bericht_181_html.html 10 http://www.birr-partner.de/?TASK=GLAESER_SHOW_SENSORIKSEMINAR_6 11 H. Walbaum, J. Prakt. Chem. [2] 1906, 73, 488. 12 W. Klyne, J. Buckingham, Atlas of Stereochemistry, Chapman a. Hall London 1974, 36. 13 D.A. van Dorp, R. Klok, D.H. Nugteren, Recueil 1972, 92, 915. 14 Y. Kenichi, Y. Misao, EP1820842A1, 34, 2007. 15 V.R. Mamdapur, P.P. Pai, K.K. Chakravarti, U.G. Nayak, S.C. Bhattacharyya,
Tetrahedron 1964, 20, 2601. 16 Q. Branca, A. Fischli Helv. Chim. Acta 1977, 60, 925. 17 K. Utimoto, M. Tanaka, M. Kitai, H. Nosaki Tetrahedron Letters 1978, 26, 2301. 18 K.A. Nelson, E.A. Mash J. Org. Chem. 1986, 51, 2721. 19 D. Terunuma, M. Motegi, M. Tsuda, T. Sawada, H. Nozawa, H. Nohira J. Org. Chem.
1987, 52, 1630. 20 Z.F. Xie, H. Suemune, K. Sakai J. Chem. Soc. Chem. Commun. 1988, 1638. 21 N.A. Porter, B. Lacher, V.H.T. Chang, D.R. Magnin J. Am. Chem. Soc. 1989, 111, 8309. 22 Z.F. Xie, K.J. Sakai J. Org. Chem. 1990, 55, 820. 23 K. Tanaka, H. Ushio, H. Suzuki J. Chem. Soc., Chem. Commun. 1990, 795. 24 K. Tanaka, H. Suzuki J. Chem. Soc., Chem. Commun. 1991, 101. 25 K. Tanaka, J. Matsui, Y. Kawabata, H. Suzuki, A. Watanabe J. Chem. Soc.,
Chem. Commun. 1991, 1632. 26 P. Dowd, S.C. Choi Tetrahedron Lett. 1991, 32, 565. 27 T. Ogawa, C.L. Fang, H. Suemune, K. Sakai J. Chem. Soc. Chem. Commun. 1991, 1438. 28 W. Oppolzer, R.N. Radinov J. Am. Chem. Soc. 1993, 115, 1593. 29 K. Tanaka, J. Matsui, K. Somemiya, H. Suzuki Synlett 1994, 351. 30 M. Yamaguchi, T. Shiraishi, M. Hirama J. Org. Chem. 1996, 61, 3520.
reference list 147
31 Y. Matsumura, H. Fukawa, Y. Terao Chem. Pharm. Bull. 1998, 46, 1484. 32 A. Alexakis, C. Benhaim, X. Fournioux, A. Heuvel, J.M. Leveque, S. March, S. Roset
Synlett 1999, 1811. 33 Y. Tanabe, N. Matsumoto, T. Higashi, T. Misaki, T. Itoth, M. Yamamoto, K. Mitarai,
Y. Nishii Tetrahedron 2002, 58, 8269. 34 Y.H. Choi, J.Y. Choi, H.Y. Yang, Y.H. Kim Tetrahedron: Asymmetry 2002, 13, 801. 35 P. Scafato, S. Labano, G. Consolo, C. Rosini Tetrahedron: Asymmetry 2003, 14, 3873. 36 C. Fehr, J. Galindo, I. Farris, A. Cuenca Helv. Chim. Acta 2004, 87, 1737. 37 T. Misaki, R. Nagase, K. Matsumoto, Y. Tanabe J. Am. Chem. Soc. 2005, 127, 2854. 38 M. Morita, N. Mase, H. Yoda, K. Takabe Tetrahedron: Asymmetry 2005, 16, 3176. 39 http://www.uni-bayreuth.de/departments/didaktikchemie/umat/duefte/duefte7-9.htm 40 G. Ohloff, Riechstoffe und Geruchssinn, Springer Verlag, Berlin, Heidelberg, New York
1990, 196. 41 M. Kerschbaum, Ber. 1927, 60B, 902. 42 L.F. Trueb, Lavoslav Ruži�ka (1887 - 1976) Zum 100. Geburtstag Leopold Ruži�kas
Neue Züricher Zeitung, Ebmatingen-Zürich 11.09.1987
www.nobelprize.org/chemistry/laureates/1939/press.html . 44 L. Ruži�ka, Helv. 1926, 9, 230, 715, 1008. 45 A. Baeyer, Ber. Dtsch. Chem Ges. 1885, 18, 2269. 46 K. Biemann, G.Büchi, B.H. Walker J.Amer.chem.Soc. 1957, 79, 5558. 47 A. Bauer, Ber. Dtsch. Chem Ges. 1891, 24, 2832. 48 www.chemheritage.org/classroom/chemach/plastics/carothers.html . 49 K.A. Bauer, A.K. Körber, Influence of molekular structure upon the musk odor
characteristics of macrocyclic ketones, Fragrance and flavor substances 1980, 155. 50 J. Müller, W. Böhmer, Fraunhofer-Institut für Molekularbiologie und Angewandte Oeko
logie (IME); annual report 2001, 2001, 34. 51 U. Schwegler, Untersuchung zu Moschusverbindungen in der Muttermilch, Bayerisches
Landesamt für Gesundheit und Lebensmittelsicherheit 2005,
bindungen.htm . 52 G.G. Rimkus, R. Gatermann, H. Huhnerfuss, Toxicol. Lett. 1999, 111, 510. 53 G.G. Rimkus, Toxicol. Lett. 1999, 111, 37. 54 H.D. Eschke, J. Traud, H.J.Z. Dibowski Umweltchem. Ökotox. 1994, 6, 183. 55 H.D. Eschke, H.J.Z. Dibowski, J. Traud Umweltchem. Ökotox. 1995, 7, 131. 56 B. Liebl, S. Ehrenstorfer, Chemosphere 1993, 27, 2253. 57 W. Ostwald, Z. Physik. Chem. 1894. 15, 706. 58 A.F. Hollemann, E. Wieberg, Lehrbuch der Anorganischen Chemie,
reference list 148
Walter de Gruyter, Berlin/New York 1985. 59 J.M. Thomas, W.J. Thomas, Principles and Practice of Heterogeneous Catalysis, VCH,
Weinheim 1996, 145. 60 U. Onken, A. Behr Chemische Prozeßkunde, Georg Thime Verlag, Stuttgart 1996. 61 E. Drent, Pure and Appl. Chem. 1990, 62, 661. 62 Hattori, H., Heterogenous Basic Catalysis. Chem. Rev. 1995, 537. 63 Lauron-Pernot, H., Luck, F., Popa, J. M., Appl. Catal. 1991, 78, 213. 64 Pines, H., Pillai, C. N., J. Am. Chem. Soc. 1960, 82, 2401. 65 H. Pines, J.A. Veseley, V.N. Ipatieff J. Am Chem. Soc. 1955, 77, 6314. 66 T. Jashima, K. Sato, T. Hayasska, N. Hara J. Catal. 1972, 26, 303. 67 K. Tanabe in: B. Imelik, C. Nacceche, G. Condurier, Y. BenTaari, J.C. Vedrine (Eds.)
Catalysis by Acids and Bases, Elsevier, Amsterdam 1985, 1. 68 H.H. Kung, Stud. Surf. Sci. Catal., 45, Kodansha Tokyo 1989. 69 Hammett, L. P., Deyrup, A. J., J. Am. Chem. Soc. 1932, 54, 2721. 70 H. Gorzawski, W.F. Hoelderich J. Mol. Catal. A: Chem. 1999, 144, 181. 71 Aramendía, M. A., Boráu, V., García, I. M., Jiménez, C., Marinas, A., Marinas, J. M.,
Porras,A., Orbano, F. J., Appl. Catal. A 1999, 184, 115. 72 Karge, H. G. Stud. Surf. Sci. Catal. 1991, 65, 133. 73 Di Cosimo, J. I., Diez, V. K., Xu, M., Iglesia, E., Apesteguia, C. R., J.Catal. 1998, 178,
499. 74 Fukuda, Y., Tanabe, K., Bull. Chem. Soc. Jpn. 1973, 46, 1616. 75 Knötzinger, H., Huber, S., J. Chem. Soc., Faraday Trans. 1998, 94, 2047. 76 K. Tanabe, W.F. Holderich, Applied Catalysis 1999, 181, 399. 77 H. Hattori, H. Kumai, K. Tanaka, G. Zhang, K. Tanabe Proc. 8th National Symposium on
Catalysis Sindri, India 1987 243. 78 K. Tanabe, M. Misono, Y. Ono, H. Hattori, New Solid Acids and Bases,
Sud. Surf. Sci. Catal., 51, Kadansha Tokyo 1989. 79 T. Yokoyama, T. Setoyama, M. Nakajiama, N. Fujita, T. Maki, K. Fukii Appl. Catal. A
1992, 88, 149. 80 T. Tanabe, Proceedings of the 8th International Congress on Catalysis, Calgary, Canada
1988, 5, 85. 81 J.B. Peri J. Phys. Chem. 1965, 69 (1), 220. 82 H. Knözinger, P. Ratnasamy, Catal. Rev.-Sci. Eng. 1978, 17 (1), 31. 83 H. Pines, C.N. Pillai, J. Am. Chem. Soc. 1960, 82, 2401. 84 W.F. Hölderich, New reactions in various fields and production of specialty chemicals,
Proceedings of the 10th International Congress on Catalysis, Stud. Surf. Sci. Catal. 1993,
75, 127±163. 85 G. Suzukamo, M. Fukao, T. Hibi, K. Tanaka, K. Chikaishi, in: K. Tanabe, H. Hattori,
T. Yamaguchi, T. Tanaka (Eds.), Acid-Base Catalysis, Proceedings of the Symposium
Acid-Base Catalysis, Sapporo, Japan 1988, Kodansha 1989, 405.
reference list 149
86 W.F. Hoelderich, Catalysis Today 2000, 62, 115. 87 W.F. Hölderich, Stud. Surf. Sci. Catal. 1993, 75 127. 88 H. Gorzawski, W.F. Hölderich, Appl. Catal. A. General 1999, 179 131. 89 K.A. Bauer, A.K. Körber, Old and new macrocyclic musk, second international Haarmann
& Reimer symposium on fragrance and flavor substances, Washington State University
New York 1982 433. 91 P.A. Wender, D.A. Holt, S.M. Sieburt, J. Am. Chem. Soc. 1983, 105, 3348. 92 G. Wilke, Angew. Chem. 1957, 69, 397; 1963, 75, 10. 93 W.S. Johnson, G.H. Daub Org. Reactions 1951, 6, 1. 94 P.A. Plattner, G. Büchi Helv. Chem. Acta 1946, 29, 1068. 95 G. Ohloff, J. Becker, K. Schulte-Elte, Helv. 1967, 50, 705. 96 C. Fehr, G. Ohloff, Helv. Chim. Acta 1979, 62, 2655. 97 D. Felix, J. Schreiber, G. Ohloff, A. Eschenmoser, Helv. Chim. Acta 1971, 54, 2895. 98 P.Wieland, H. Kaufmann, A. Eschenmoser, Helv. 1967, 50, 2108. 99 D. Felix, J. Schreiber, K. Piers, U. Horn, A. Eschenmoser, Helv. 1968, 51, 1461;
R.K. Müller, D. Felix, J. Schreiber, A. Eschenmoser, Helv. 1970, 53, 1479. 100 R.P. Lutz, Chem. Rev. 1984, 84, 205. 101 M.Nishino, H. Kondo, A. Miyake, Chem. Letters 1973, 667. 102 N. Bluthe, N. Malacria, V. Gore Tetrahedron Letters 1983, 24, 1157. 103 J. Nowicki, Molecules 2000, 5, 1033. 104 H. Nosaki, T. Mori, R. Noyori Tetrahedron Letters 1967, 9, 779. 105 C. Fehr, Helv. Chem. Acta 1983, 66, 2512. 106 E.J. Corey,M. Chaykovsky, J. Am.Chem. Soc. 1964, 86,1639. 107 D.A. Chass, D. Buddhasukh, P.D. Magnus, J.Org.Chem. 1978, 43, 1750. 108 M. Julia, D. Uguen, Bull. Soc. Chim. Fr. 1976, 513. 109 H. Suginome, S. Yamada Tetrahedron Letters 1987, 28, 3963. 110 V. Rautenstrauch, R.L. Snowden, S.M. Linder Helv. Chim. Acta 1990, 73, 896. 111 M. Nagel, H.J. Hansen, G. Fra´ter Synlett 2002, 2, 275. 112 H. Hundiecker Ber. 1942, 75, 1190. 113 H. Hundiecker Ber. 1942, 75, 1197. 114 A.T. Blomquist, R.D. Spencer J. Am. Chem. Soc. 1949, 70, 30. 115 M. Stoll, A. Rouve, Helv. Chim. Acta 1947, 30, 1815. 116 M. Stoll, A. Rouve, Helv. Chim. Acta 1947, 30, 1822. 117 D.J. Hagena, K.A. Bauer, Readily accessible internediates of macrocyclic musks,
second international Haarmann & Reimer symposium on fragrance and flavor
substances, Washington State University 1980, 145. 118 A. Makita, JP 05155802 1993, Nitsuko Kyoseki Kk, Japan. 119 V. Prelog, L. Frenkiel, M. Kobelt, P. Barmann, Helv. Chim. Acta 1947, 30, 1741.
reference list 150
120 L.V. Hansley, J. Am. Chem. Soc. 1935, 57, 2303, U.S. Pat.2228268 1941. 121 M. Stoll, A. Commarmont, Helv. Chim. Acta 1948, 31, 1082 und 1435. 122 V.R. Mamdapur, P.P. Pai, K.K. Chakravarti, U.G. Nayak, S.C. Bhattacharyya,
Tetrahedron 1964, 20, 2601. 123 A. Wartini, K. Ebel, G. Hieber, H. Weigel, WO 2004/009524 A1 2004, BASF, Germany;
DE 102 32 750 A1 2004, BASF, Germany. 124 N.J. Leonard, C.W. Schimmelpfennig jr. 1958, 23, 1708. 125 C. Yuen et al. J. Am. Oil Chem. Soc 1994, 71 (8), 911. 126 Y. Tanabe, A. Makita, EP 1270538 B1 2005, Japan Energy Corporation; WO 074752
2001. 127 A.T. Blomquist, R.D.Spencer, J. Am. Cem. Soc. 1948, 70, 30. 128 K.H. Ziegler, H. Eberle, H. Ohnlinger Ann. Chemie 1933, 504, 94. 129 K.H. Ziegler, R. Aurnhammer Ann. Chemie 1934, 513, 43. 130 S. Ställberg-Stenhagen, Ark. Kemi 1951, 3, 517. 131 D.Jr. Valentine, J.W. Scott, Synthesis 1978, 5, 329. 132 S. Fujimoto, K. Yoshikawa, M. Itoh, T. Kitahara Biosci. Biotechnol. Biochem. 2002, 66,
1389. 133 K.C. Nicolaou, S.P. Seitz, M.R. Pavia, N.A. Petasis J. Org. Chem. 1979, 44, 4011. 134 T. Takahashi, T. Nagashima, J. Tsuji Tetrahedron Letters 1981, 22, 1360. 135 Y. Tanabe, N. Matsumoto, T. Higashi, T. Misaki, T. Itoh, M. Yamamoto, K. Mitarai,
Y. Nishi Tetrahedron 2002, 58, 8269. 136 J. Tsuji, T. Yamada, M. Kaito, T. Mandai Tetrahedron Letters 1979, 22, 2257. 137 J. Tsuji, T. Yamada, M. Kaito, T. Mandai Bull. Chem. Soc. Jpn 1980, 53, 1417. 138 T. Yamamoto, M. Ogura, T. Kanisawa Tetrahedron 2002, 58, 9209. 139 K.J. Ivin, Olefin Metathesis, Academic Press, London 1983. 140 a) J.C. Mol, J.A. Moulijn, Catalytic Metathesis of Alkenes, Catalysis: Science and
Technology; b) J.R. Anderson, M. Boudart, Springer Verlag: Berlin, Heidelberg 1987, 8,
69. 141 M. Siberijn, J.C. Mol, Appl. Catal. 1991, 67, 276. 142 M.F.C. Plugge, J.C. Mol, Synlett Lett. 1991, 507. 143 J. Tsuji, S. Hashiguchi, J. Organomet. Lett. 1981, 218, 69. 144 A. Fürstner, Synlett 1999, 1523. 145 A. Fürstner, G. Seidel, J. Organomet. Chem. 2000, 606, 75. 146 M.E. Maier Angew. Chem. 2000, 112, 2153. 147 R.H. Grubbs Handbook of Metathesis, Wiley-VCH, Germany, 2003. 148 V.P. Kamat, H. Hagiwara, T. Suzuki, M. Ando J. Chem. Soc., Perkin Trans. 1, 1998,
2253. 149 V.P. Kamat, H. Hagiwara, T. Katsumi, T. Hoshi, T. Suzuki, M. Ando Tetrahedron 2000
56, 4397. 150 E.J. Lenardao, G.V. Botteselle, F. de Azambuja, G. Perin, R.G. Jacob Tetrahedron 2007,
reference list 151
63, 6677.
151 Y. Yoshida, N. Matsumoto, R. Hamasaki, Y. Tanabe Tetrahedron Letters 1999, 40, 4227. 152 J. Louie, C.W. Bielawski, R.H. Grubbs J. Am. Chem. Soc. 2001, 123, 11312. 153 Tanabe et al., US Patent 7268258 B2 2007. 154 M. Alas, M. Crochemore, EP 626363 Appl. 1994, Rhone-Poulenc Chimie SA. France. 155 C. Schommer, K. Ebel, T. Dockner, M. Irgang, W. Hölderich, H. Rast, US Patent
49507663 1990, BASF, Germany; EP 0 352 674 B1 1993, BASF, Germany, DE 3920280
A1 1991, BASF, Germany. 156 L. Schuster, L. Arnold. DE-21 11 722A 1972, BASF, Germany. 157 H. Froehlich, M. Schneider, W.Himmele, M. Strohmeyer, G. Sandrock, K. Baer,
DE--27 58 113 A1 1979. 158 C. Schommer, K. Ebel, T. Dockner, M. Irgang, W. Hölderich, H. Rast, DE 3825873 A1
1990, BASF, Germany. 159 www.corporate.basf.com . 160 A. Wartini, K. Ebel, G. Hieber, H. Weigel, DE 10232750 2004, BASF, Germany. 161 www.seilnacht.com. 162 www.kronostio2.com. 163 Y.D. Dolmatov, A.I. Sheinkman, Zhurnal Prikladnoi Khimii 1970, 43, 249. 164 D. Heinz, W.F. Hoelderich, S. Krill, W. Boeck, K. Huthmacher, J. Catal. 2000, 192, 1. 165 M. Scheller, Dissertation, Deutsche Nationalbibliothek idn:961704055, 2001, 14. 166 J. Clark, D. Macquarrie, Chem. Soc. Rev. 1996, 303. 167 R.J. Farrauto, C.H. Bartholomew, Fundamentals of Industrial Caralytic Processes,
Blackie Academic & Prof., London 1997. 168 www.degussa.com/en/home.html. 169 www.sigmaaldrich.com. 170 D. Das, internal report, Nov. 2004. 171 www.sachtleben.com. 172 D. Das, internal report, Feb. 2005. 173 P. Kripylo, K.-P. Wendlandt, F. Vogt, Heterogene Katalyse in der Chemischen Technik,
VEB Deutscher Verlag für Grundstoffindustrie, Leipzig 1993. 174 C. Morterra, G. Cerrato Langmuir 1990, 6, 1810. 175 C. Morterra, G. Cerrato Catal. Lett. 1991, 10, 357. 176 Anatoli� Aleksandrovich Davydov, N. Sheppard, Molecular spectroscopy
of oxide catalyst surfaces, Wiley 2003. (ISBN-13: 978-0471987314) 177 J.M. Thomas, W.J. Thomas, Principles and Practice of Heterogeneous Catalysis
VCH Verlagsgesellschaft Weinheim 1997. 178 W. Yang C. Lee and R.G. Parr Physical Review B 1988, 37, 785. 179 Gaussian Basis Set Order Form; URL http://www.emsl.pnl.gov/forms/basisform.html;