AARHUS UNIVERSITY DCE – DANISH CENTRE FOR ENVIRONMENT AND ENERGY AU Scientific Report from DCE – Danish Centre for Environment and Energy No. 201 2016 THE DANISH AIR QUALITY MONITORING PROGRAMME Annual Summary for 2015
Transcript
AARHUS UNIVERSITYDCE – DANISH CENTRE FOR ENVIRONMENT AND ENERGY
AU
Scientifi c Report from DCE – Danish Centre for Environment and Energy No. 201 2016
THE DANISH AIR QUALITY MONITORING PROGRAMMEAnnual Summary for 2015
[Blank page]
AARHUS UNIVERSITYDCE – DANISH CENTRE FOR ENVIRONMENT AND ENERGY
AU
2016
THE DANISH AIR QUALITY MONITORING PROGRAMMEAnnual Summary for 2015
Scientifi c Report from DCE – Danish Centre for Environment and Energy
Please cite as: Ellermann, T., Nygaard, J., Nøjgaard, J.K., Nordstrøm, C., Brandt, J., Christensen, J., Ketzel, M., Massling, A. & Jensen, S.S. 2016. The Danish Air Quality Monitoring Programme. Annual Summary for 2015. Aarhus University, DCE – Danish Centre for Environment and Energy, 65 pp. Scientific Report from DCE – Danish Centre for Environment and Energy No. 201. http://dce2.au.dk/pub/SR201.pdf
Reproduction permitted provided the source is explicitly acknowledged
Abstract: The air quality in Danish cities has been monitored continuously since 1981 within the Danish Air Quality Monitoring network. The aim is to follow the concentration levels of toxic pollutants in the urban atmosphere and to provide the necessary knowledge to assess the trends, to perform source apportionment, and to understand the governing processes that determine the level of air pollution in Denmark. In 2015 the air quality was measured in four Danish cities and at two background sites. In addition model calculations were carried out to supplement the measurements. At one street station (H.C. Andersens Boulevard) in Copenhagen NO2 was found in concentrations above the EU limit value for the annual average, while NO2 levels in Odense, Aarhus and Aalborg were below the limit value. Model calculations indicate exceedances of the NO2 limit value at several streets in Copenhagen. Annual averages of PM10 and PM2.5 were below limit values at all stations and the average exposure indicator (PM2.5 in urban background) has decreased with about 20% since 2010. The concentrations for most pollutants have been decreasing during the last decades.
Keywords: Atmospheric pollution, urban pollution, nitrogen compounds, ozone, sulphur compounds, heavy metals, volatile organic pollutants, dispersion models and measurements.
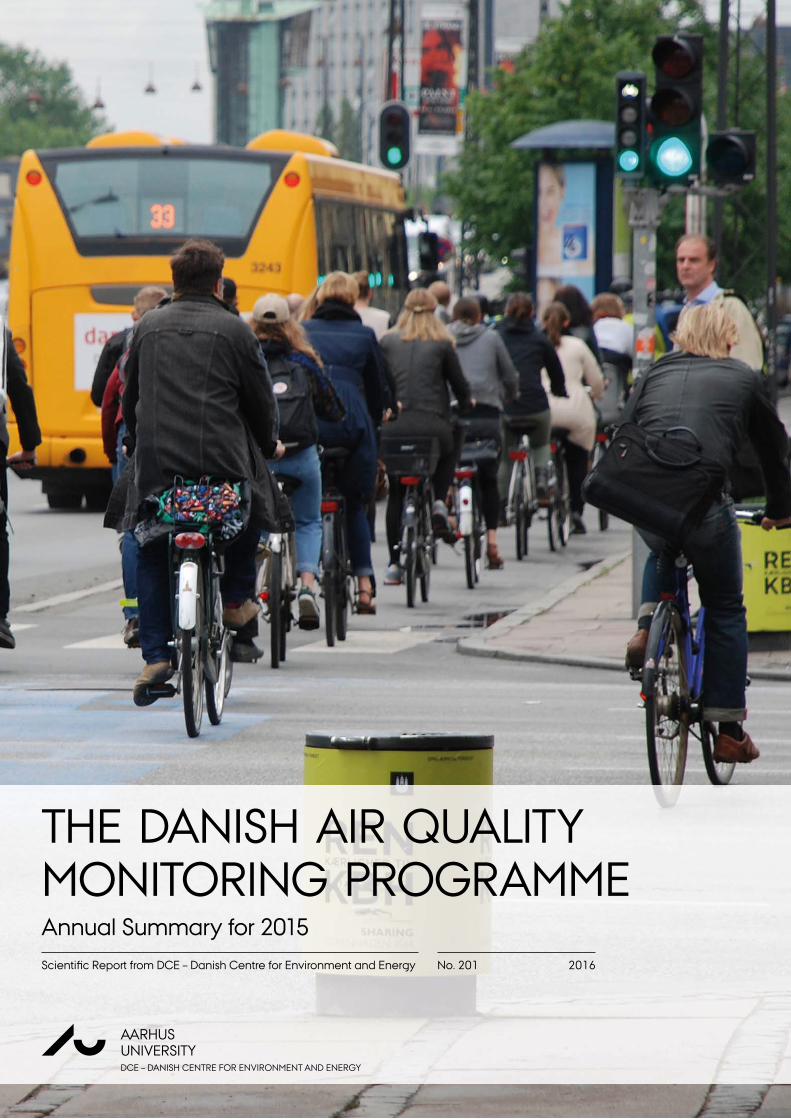
Layout: Majbritt Pedersen-Ulrich Front page photo: Thomas Ellermann
bons (PAHs) and a number of heavy metals including lead (Pb), arsenic (As),
cadmium (Cd), mercury (Hg) nickel (Ni), and a number of volatile organic
compounds (VOCs) that are precursors for formation of ozone. The meas-
urements and model calculations are used to evaluate the Danish air quality
in relation to limit values as well as to follow trends. Further, the program
serves as basis for determination of sources of the air pollutants, basis for
evaluation of the impact of regulations of emissions and as basis for various
research projects related to air quality.
The permitted number of exceedances in a year of the diurnal limit value of
50 µg/m3 for PM10 was not exceeded at any station in the measuring net-
work. Likewise, there were no exceedances of the annual limit values for
PM10 (40 µg/m3) and PM2.5 (25 µg/m3 from 2015). The average exposure in-
dicator (AEI) has decreased with 25% since 2010.
The number of particles in ambient air was about 14,000 particles per cm3 as
annual average at the street station H.C. Andersens Boulevard. This is
roughly a factor of 3 and 5 higher than in urban and rural background, re-
spectively. A significant reduction in particle number has been observed
since 2002.
The sodium content in PM10 on street stations was about 1.6 µg/m3 corre-
sponding to an estimated annual salt content (NaCl) of about 4.0 µg/m3.
High diurnal values of salt were observed during periods with winter salt-
ing of roads.
The annual limit value for NO2 (40 µg/m3) was exceeded at one street sta-
tion in Copenhagen (H.C. Andersens Boulevard), whereas no exceedances
were observed in Odense, Aalborg and Aarhus. The NO2 concentrations
have decreased from 2014 to 2015 for most of the stations. At H.C. Ander-
sens Boulevard (HCAB/1103) there were still elevated concentrations of
NO2 compared to the situation before 2010 due to a permanent change in the
traffic lanes at the street segment in front of the measurement station. Addi-
tionally, there has been a gradually decrease in the concentrations during the
last years in parallel to the decrease observed at Jagtvej.
6
Model calculations at selected streets in Copenhagen and Aalborg indicate
that the limit value was exceeded at 9 out of 98 calculated streets in Copen-
hagen but not at any streets in Aalborg in 2015. The number of street seg-
ments with model calculated exceedances has decreased to one third of the
value in 2010.
The ozone levels in 2015 were on the same level as in 2014. No clear trend is
observed for the average ozone concentration. The information threshold of
180 µg/m3 was not exceeded in 2015. The target value for the maximum daily
8 hours mean ozone concentration of 120 µg/m3 was not exceeded, but the
long-term objective for this parameter was exceeded at all Danish stations. The
læong term objective has not entered into force.
Measurements of volatile organic compounds (VOCs) at the urban back-
ground in Copenhagen showed concentration levels between 0.01 µg/m3
and 0.75 µg/m3 for the selected 17 different compounds. VOCs can act as
ozone precursors, and the aim of these measurements is to improve the gen-
eral understanding of the ozone formation on a European level. The for-
mation of ozone in Denmark is in general small due to moderate solar radia-
tion The ozone pollution in Denmark is to a large extent the result of long
distance transport of pollutants from other European countries south of
Denmark.
The levels of SO2 and heavy metals have decreased for more than two dec-
ades and are now far below the limit values. The limit values for benzene
and CO are not exceeded and the levels have decreased for the last decade.
Measurements of concentrations of particle bound PAH were performed at
H.C. Andersens Boulevard, Copenhagen and at the suburban measurement station at Hvidovre. The average concentration of benzo[a]pyrene was 0.29 ng/m3 and 0.25 ng/m3 at H.C. Andersens Boulevard and Hvidovre, respec-
tively. The target value for benzo[a] pyrene (1 ng/m3) was not exceeded in 2015.
Measurements of the chemical content in PM2.5 showed that the annual av-
erage concentrations of NH4+, Na+, K+, Mg2+, Cl-, NO3
-, SO42- are very similar
at the street station at H.C. Andersens Boulevard and at the rural station at
Risø. The main difference between the two stations are for elemental carbon
(EC), organic matter (OM) and Ca2+ where the concentrations are higher at
the street station compared to the rural background station. This is mainly
due to emissions of these compounds from the traffic in Copenhagen.
Actual data, annual and multi-annual summaries are available at the website
of DCE (http://dce.au.dk/en/authorities/air/), in Danish
(Ni)) og polyaromatiske kulbrinter (PAH’er) samt udvalgte flygtige kulbrin-
ter (VOC’er), der kan føre til dannelse af ozon. Målingerne og modelbereg-
ningerne anvendes til at vurdere om EU’s grænseværdier for luftkvalitet er
overholdt. Rapporten beskriver endvidere udviklingen i koncentrationerne.
Samtidigt tjener måleprogrammets resultater som grundlag for vurdering af
kilderne til luftforureningen, vurdering af effekt af reduktionstiltag og som
grundlag for en række videnskabelige undersøgelser, fx vurdering af små
partiklers effekt på sundheden.
Der er fastsat grænse- og målværdier for flere af de målte stoffer. Grænse-
værdierne skal være overholdt fra 2005, 2010 eller 2015 alt efter, hvilke stof-
fer det drejer sig om. En detaljeret beskrivelse af gældende mål- og grænse-
værdier og deres gennemførelse findes i en bekendtgørelse fra Miljøministe-
riet (Miljøministeriet 2010). Bekendtgørelsen er baseret på det 4. datterdirek-
tiv om tungmetaller og PAH’er (EC 2005) samt EU’s luftkvalitetsdirektiv fra
2008 (EC 2008). En af de væsentligste ændringer i direktivet fra 2008 i for-
hold til de tre første datterdirektiver (1999, 2000 og 2002) er, at der stilles
krav om målinger af de fine partikler (PM2.5), og at der er indført en grænse-
værdi for PM2.5, som skal være overholdt i 2015.
De væsentligste konklusioner fra overvågningsprogrammet i 2015 er følgende:
I 2015 blev grænseværdien for NO2 som årsmiddelværdi overskredet på
én (H.C. Andersens Boulevard) af de to gademålestationer i København. I
Odense, Aarhus og Aalborg var der ingen overskridelser. Koncentratio-
nerne af NO2 i 2015 var for hovedparten af målestationerne stort set på
niveau med koncentrationerne målt i 2014. På H. C. Andersens Boule-
vard blev der i 2010 indført en permanent ændring af vejbanerne ud for
målestationen, hvilket førte til en forøgelse i koncentrationerne på om-
kring 8 µg/m3 set i forhold til tidligere. Denne forøgelse i koncentratio-
nerne ses fortsat om end koncentrationerne på H.C. Andersens Boule-
vard i gennem de seneste år er faldet parallelt med det generelle fald i
koncentrationerne f.eks. som observeret på Jagtvej.
Modelberegninger indikerer, at grænseværdien i 2015 var overskredet på
9 ud af 98 beregnede gadestrækninger i København, men ikke på ud-
valgte gadestrækninger i Aalborg. Siden 2010 er antallet af gadestræk-
8
ninger med beregnede overskridelser af grænseværdien blevet reduceret
til en tredjedel.
Der var ingen målestationer i måleprogrammet, hvor det tilladte antal af
overskridelser af den daglige middelværdi for PM10 (50 µg/m3 må ikke
overskrides mere end 35 gange årligt) blev overskredet.
Indholdet af partikler mindre end 2,5 µm (PM2.5) overholdt ikke grænse-
værdien på 25 µg/m3 som årsmiddelværdi, der skal være overholdt fra
2015. AEI-værdien (average exposure indikator) er faldet med omkring
25% siden 2010.
Antallet af partikler mellem 6 og 700 nm var omkring 12.300 partikler per
cm3 på gademålestationen H.C. Andersens Boulevard, mens det var be-
tydeligt mindre i by- og landbaggrund samt i forstadskvarter. Antallet af
partikler på H. C. Andersens Boulevard faldt ca. 10% fra 2014 til 2015 og
følger dermed det overordnede billede, hvor antallet af partikler er faldet
med ca. 50% siden 2002.
Indholdet af natrium i PM10 på gademålestationerne var omkring 1,5
µg/m3 svarende til et estimeret saltindhold (NaCl) på omkring 3,7
µg/m3.
Ozonkoncentrationerne i 2015 var på niveau med 2014. Der er ikke fastsat
egentlige grænseværdier for ozon (O3), men kun "målværdier" og ”lang-
sigtede mål” (hensigtsværdier). Der var i 2015 ingen overskridelser af
målværdierne for beskyttelse af sundhed, mens de langsigtede mål (120
µg/m3) blev overskredet på alle bybaggrunds- og landstationerne. Den
langsigtede målsætning er ikke trådt i kraft endnu. Tærsklen for informa-
tion af befolkningen om høje ozonniveauer (timemiddel 180 µg/m3) blev
heller ikke overskredet i 2015.
De øvrige målte stoffer findes i koncentrationer under grænseværdierne,
og for flere stoffer (fx svovldioxid og bly) er koncentrationerne faldet
meget markant siden målingernes start i 1981.
Målinger af partikelbundet PAH blev fortaget på H.C. Andersens Boule-
vard i København. Middelværdien for benz[a]pyren var 0,29 ng/m3 og
0,25 ng/m3 på henholdsvis H.C. Andersens Boulevard og ved målestati-
onen i Hvidovre. Målværdien på 1 ng/m3 var således ikke overskredet i
2015.
Målinger af 17 udvalgte flygtige organiske kulbrinter (VOC’er) i bybag-
grund i København viser koncentrationsniveauer, som spænder fra 0,01
µg/m3 til 0,75 µg/m3 i 2015. Disse VOC’er bidrager til den kemiske dan-
nelse af ozon på europæisk plan, og målingerne skal først og fremmest
understøtte den generelle forståelse af ozondannelsen i Europa. I Dan-
mark skyldes størstedelen af ozon langtransport af luftforurening fra cen-
trale og sydlige dele af Europa.
Målinger af det kemiske indhold i PM2.5 ved gademålestationen ved H. C.
Andersens Boulevard og ved landbaggrundsmålestationen på Risø viser
ligesom i 2011-2014 , at de årlige gennemsnitskoncentrationer for NH4+,
Na+, K+, Mg2+, Cl-, NO3- og SO4
2- er stort set ens på de to stationer. Dette
skyldes, at stofferne for en stor del stammer fra partikler transporteret til
målestationer langvejs fra. De væsentligste forskelle mellem de to måle-
stationer ses for elementært carbon (EC), organiske forbindelser (OM) og
Ca2+, hvor koncentrationerne er højere på gadestationen som følge af ud-
ledninger relateret til trafikken i København.
9
1 Introduction
The Danish Air Quality Monitoring Program (LMP) originates back to 1981.
Today the programme is part of the National Monitoring Programme for the
aquatic and terrestrial environment (NOVANA). The program consists of an
urban monitoring network with stations in the four largest Danish cities and
two background stations in rural areas (figure 2.1) which is supplemented
by model calculations. The results are used for assessment of the air pollu-
tion in Denmark with special focus on Danish urban areas. The programme
is carried out in co-operation between the DCE - Danish Centre for Envi-
ronment and Energy (DCE), the Danish Environmental Protection Agency,
and the Municipalities of Copenhagen, Aarhus, Aalborg and Odense. DCE is
responsible for operating and maintaining the programme. Statistical pa-
rameters and actual data are accessible at the website:
http://dce.au.dk/en/authorities/air/, (in Danish
http://dce.au.dk/myndigheder/luft/). Selected near real-time data are also
available at tele-text, Danish National Television. In addition, this report
presents results from model calculations of air quality in Denmark carried
out as supplement to the measurements.
The monitoring programme is carried out in accordance with the Danish
Statutory Order No. 851 of 30 June 2010 from the Ministry of Environment
(Miljøministeriet 2010) that implements the EU directives on air quality in
Denmark (EC, 2005; EC, 2008).
One of the main objectives for the monitoring programme is to assess the air
quality in relation to various air quality criteria (i.e. limit values, margin of
tolerance, target values, long term objectives and alert thresholds) of which
the limit values are the legally most important. The Danish air quality crite-
ria are identical to those laid down in the EU directives described above.
The program was last revised in 2010 and the main changes due to this revi-
sion have been described in a previous report (Ellermann et al., 2013). Since
2012 there has only been minor changes were the most important are:
Starting in August 2012 low volume samplers (LVS) for gravimetric de-termination of particle mass based on the reference method were intro-duced into the regular measuring programme and gradually installed at the PM-stations in the network to replace some of the older SM200 in-struments that needed to be renewed. See introduction to Chapter 7 for an overview.
A non-permanent measurement station at a suburban area in Hvidovre was started in the beginning of 2013 with measurements of PAHs in re-lation to use of wood burning as house hold warming. In June 2015 the measurement program in Hvidovre was supplemented with measure-ments of PM2.5 by LVS, particle number and nitrogenoxides (NO and NO2).
The urban background measurement station in Aarhus was in January 2015 moved to another position (Chapter 2.1).
The street station in Aalborg had to be temporarily closed down from September 2014 and onwards due to nearby construction work (Chapter 2.1).
At the street station in Albanigade in Odense there was a large decrease in daily traffic intensity starting from late June 2014 and the street was closed down for traffic in spring 2015. This change was due to major changes in the traffic patterns in Odense (section 2.1).
In the following chapters the results from measurements and model calcula-
tions for 2015 are presented and compared to limit and threshold values.
Please refer to the EU Directives (EC, 2005; EC, 2008) for a detailed descrip-
tion of the exact definitions of the limit values, margin of tolerance, target
values and alert thresholds.
11
2 Measurements and model calculations
2.1 Measurements
The core of measurement stations in the Danish air quality monitoring net-
work originates back to the 1980s and the stations have therefore been posi-
tioned before the development of the EU directives on air quality. Despite
this, the network still gives a comprehensive fulfilment of the requirements
laid down in the directives.
Originally, the Danish measuring strategy was in short to place one or more
pairs of stations in each of the four largest Danish cities. In each city one of
the stations is located close to a street lane with a high traffic density. The
other is located within a few hundred meters from the street station, and is
placed so that it is representative for the urban background pollution; mean-
ing that it is placed so that it is not influenced by pollutants from a single or
a few streets or other nearby sources. In most cases the background stations
are placed on rooftops. The short distance between street station and urban
background station makes it possible to determine directly the traffic contri-
bution as the difference between the two stations. In addition, two rural sta-
tions measure the pollution outside city areas. Further information about the
program and results is found at the website: http://dce.au.dk/en/-
authorities/air/, in Danish (http://dce.au.dk/myndigheder/luft/). Alt-
hough this strategy is still valid, it has been necessary to relax the criteria on
the distance between the street station and urban background station, since
it has not been possible to fulfil these criteria when new sites had to be
found for example in Aarhus.
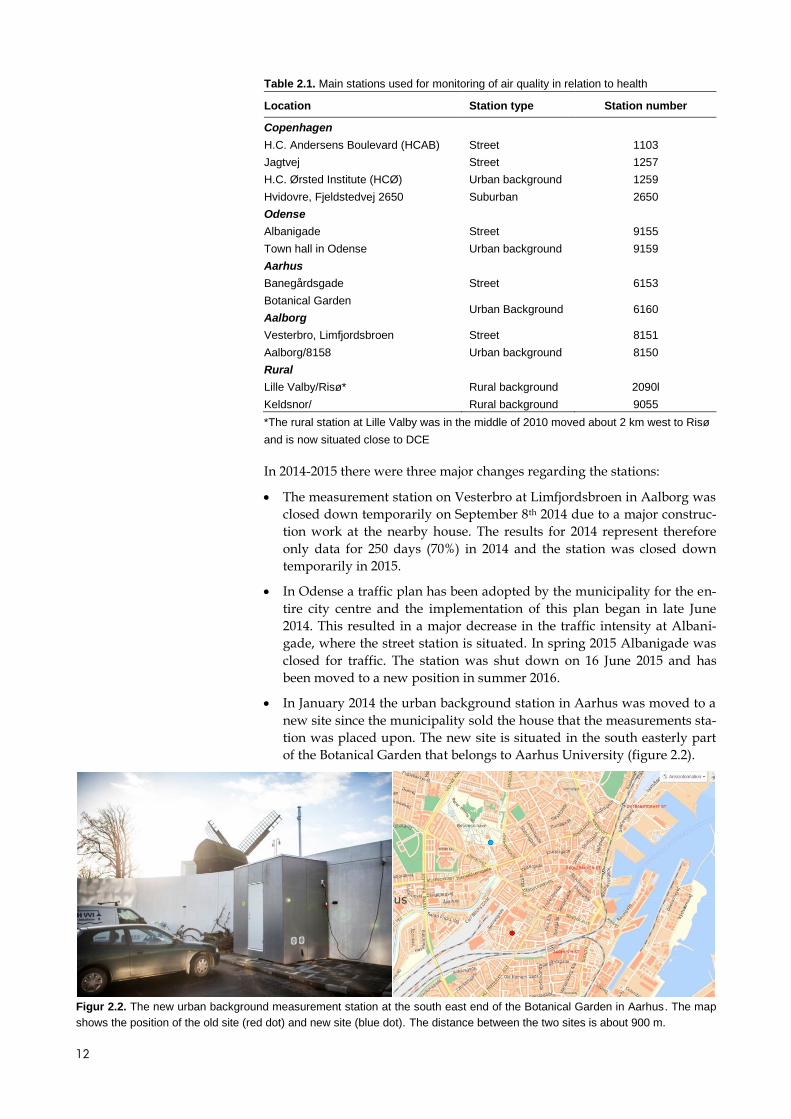
Figure 2.1. Main stations used for monitoring of air quality in relation to health.
Table 2.1. Main stations used for monitoring of air quality in relation to health
Location Station type Station number
Copenhagen
H.C. Andersens Boulevard (HCAB) Street 1103
Jagtvej Street 1257
H.C. Ørsted Institute (HCØ) Urban background 1259
Hvidovre, Fjeldstedvej 2650
Odense
Suburban
2650
Albanigade Street 9155
Town hall in Odense Urban background 9159
Aarhus
Banegårdsgade Street 6153
Botanical Garden
Aalborg Urban Background 6160
Vesterbro, Limfjordsbroen Street 8151
Aalborg/8158 Urban background 8150
Rural
Lille Valby/Risø* Rural background 2090l
Keldsnor/ Rural background 9055
*The rural station at Lille Valby was in the middle of 2010 moved about 2 km west to Risø
and is now situated close to DCE
In 2014-2015 there were three major changes regarding the stations:
The measurement station on Vesterbro at Limfjordsbroen in Aalborg was
closed down temporarily on September 8th 2014 due to a major construc-
tion work at the nearby house. The results for 2014 represent therefore
only data for 250 days (70%) in 2014 and the station was closed down
temporarily in 2015.
In Odense a traffic plan has been adopted by the municipality for the en-
tire city centre and the implementation of this plan began in late June
2014. This resulted in a major decrease in the traffic intensity at Albani-
gade, where the street station is situated. In spring 2015 Albanigade was
closed for traffic. The station was shut down on 16 June 2015 and has
been moved to a new position in summer 2016.
In January 2014 the urban background station in Aarhus was moved to a
new site since the municipality sold the house that the measurements sta-
tion was placed upon. The new site is situated in the south easterly part
of the Botanical Garden that belongs to Aarhus University (figure 2.2).
Figur 2.2. The new urban background measurement station at the south east end of the Botanical Garden in Aarhus. The map
shows the position of the old site (red dot) and new site (blue dot). The distance between the two sites is about 900 m.
13
The following compounds were measured in 2015:
Nitrogen oxides (NO, NO2 and NOx (= NO + NO2)) were measured at all stations.
Particle mass (PM10 and/or PM2.5) were measured as 24 hour averages at all stations. At the following stations PM was measured throughout the year using low volume samplers (LVS) for gravimetric determination of particle mass based on the reference method (EN 12341: 2014): HCAB (PM10 and PM2.5); HCØ (PM10 and PM2.5); Jagtvej (PM10 and PM2.5); Risø (PM10 and PM2.5); Aarhus/street (PM10 and PM2.5); Aarhus/urban back-ground (PM2.5); Aalborg/urban background (PM2.5). At Aalborg/street (PM2.5) no data were measured in 2015 due to relocation of the measur-ing station and problems finding a new site. At the remaining two sta-tions (Keldsnor (PM10) and Odense/street (PM10)) PM was determined solely by using SM200 β-gauges measurements
Elements (heavy metals) in PM10 were measured at Copenhagen/street (HCAB), Copenhagen/urban background, Aarhus/street, Oden-se/street and the rural site Risø.
Additionally, PM10 and PM2.5 were measured at both Copenhagen/street (HCAB) and Risø by means of TEOM that measures on a half hourly ba-sis making it possible to resolve the diurnal variation. Part of these measurements was carried out in a research project funded separately by the Danish EPA.
Particle number was measured at Copenhagen/street (HCAB), Copen-hagen/urban background and Risø in cooperation with a particle re-search project funded separately by the Danish EPA. Additionally, measurements were started at a suburban site in Hvidovre in autumn 2015.
Ozone (O3) was measured at all urban background and rural stations, and at the street stations Copenhagen/street (HCAB).
Carbon monoxide (CO) was measured at all street stations except Jagtvej as well as at the urban background station, Copenhagen/urban back-ground and the rural site Risø.
Benzene and Toluene were measured at Copenhagen/street (HCAB) and Copenhagen/urban background using passive sampling on a week-ly basis.
PAHs were measured at Copenhagen/street (HCAB) and at the subur-ban site in Hvidovre.
SO2 was measured at Copenhagen/street (HCAB). The main purpose was to monitor episodic high concentrations.
Elemental carbon (EC) and organic carbon (OC) were measured at Co-penhagen/street (HCAB) and the rural site Risø.
The meteorological parameters – air temperature, wind speed and direc-
tion, relative humidity and global radiation - were measured in Copen-
hagen, Odense, Aarhus and Aalborg at the urban background stations or
at a location, which is representative for the meteorology at the urban
background station.
The pollutants are described in more detail in Appendix 1.
14
Measurements of gasses (NO, NOx, NO2, O3, CO, SO2) and particle number
were recorded as ½-hour averages. Particle mass (PM10 and PM2.5) were
measured both as 24 hour averages using beta measurements and low vol-
ume sampling (gravimetric method) and at ½-hour averages using TEOM
(only part of particle mass). Elements in the particles as well as PAH were
measured as 24 hour averages. EC and OC were measured as 24 hour aver-
ages. Benzene and toluene were measured weekly by passive sampling.
Furthermore, volatile organic compounds were sampled as 24 hour avera-
ges.
2.2 Model calculations
In the monitoring programme the measurements at the permanent
measuring stations are supplemented with model calculations using the
THOR modelling system. In the present report model results are presented
for NO2 in streets and for ozone at a national level.
The THOR system is an integrated model system, capable of performing
model calculations at regional scale to urban background scale and further
down to individual street canyons in cities – on both sides of the streets. The
system is driven by global meteorological analysed data from National
Centres for Environmental Prediction, United States, which is used as input
to the meteorological model MM5v7 (Grell et al., 1995).
The meteorological data for 2015 from MM5v7 is subsequently used to drive
the air pollution models, including the Danish Eulerian Hemispheric Model,
DEHM (Christensen, 1997; Brandt et al., 2012), the Urban Background
Model, UBM (Berkowicz, 2000b; Brandt et al., 2001) and the Operational
Street Pollution Model, OSPM® (Berkowicz 2000a; Ketzel et al., 2012). DEHM
is providing air pollution input data for UBM which again is providing air
pollution input data to OSPM. Further details about the integrated THOR
system can be found in Brandt et al. (2000; 2001 and 2003 or under
http://www.au.dk/thor).
Model calculations of air quality on national scale is carried out using
DEHM (version 5.0), which is an Eulerian model where emissions,
atmospheric transport, chemical reactions, and dry and wet depositions of
air pollutants are calculated in a 3D grid covering the northern hemisphere
with a resolution of 150 km x 150 km. The model includes a two-way nesting
capability, which makes it possible to obtain higher resolution over limited
areas. Three nested domains are used in the model runs under NOVANA,
where the first domain is covering Europe with a resolution of 50 km x 50
km. The second domain is covering Northern Europe with a resolution of
16.7 km x 16.7 km. The calculations of air quality in Denmark are carried out
in a third domain with a horizontal resolution of 5.6 km x 5.6 km. In the
vertical direction the model is divided into 29 layers covering the lowest 15
km of the atmosphere. Of these the lowest layers are relatively thin (20 m)
while the upper layers are relatively thick (2000 m). The model includes a
comprehensive chemical scheme designed for calculation of the chemical
reactions in the lower part of the atmosphere. The emission inventories used
in DEHM have a geographical resolution of 1 km x 1 km for Denmark
transformed into the 5.6 km x 5.6 km resolution domain and 16.7 km x 16.7
km for the remaining part of Europe. The emissions are based on Danish
national emission inventories for the year 2014 compiled by DCE
(http://envs.au.dk/en/knowledge/air/emissions/) and international
* 49 µg/m3 is measured at the measuring station at HCAB, but because of a change in street layout traffic has moved closer to the measuring station. Based on parallel meas-urements this rearrangement is estimated to have led to a jump of about 8 µg/m3. Without the change in street layout, about 41 µg/m3 is expected. OSPM calculations are more representative of the measurements without the jump as OSPM calculations reflect concentration levels in front of the building facade.
2.2.2 Further development of the model
The detailed investigation on the impact of the changes in road lanes layout
on HCAB (Ellermann et al., 2014) showed that the current OSPM version has
some shortcomings in reproducing measurements at the location/re-location
of the measuring station. The setting at HCAB is complex with multiple road
lanes, inhomogeneous distribution of emissions and a measurement point
right next to the nearest road lane, and at the same time a relatively long
distance to the façade of the buildings. There is a need for further
development of OSPM in order to describe the complex distribution of
emissions in streets, definition of location of calculation point etc. A recently
finished PhD study (Ottosen et al., 2015) has implemented the capability to
handle inhomogeneous distribution of emissions in OSPM describing
emissions according to each lane of the street layout. These improvements
together with future supporting developments are expected to improve
model calculations for complex street layouts, e.g. for HCAB, and will result
in a new version of the model in years to come.
18
3 Nitrogen oxides
The nitrogen oxides (NO, NO2, NOx) are measured at eleven monitoring
sites using gas monitors based on chemiluminescence. The concentrations
are measured continuously throughout the year with a time resolution on
minute scale that is aggregated to hourly averages for this reporting.
3.1 Annual statistics
The annual statistics for 2015 for nitrogen dioxide and nitrogen oxides are
shown in table 3.1 and 3.2. There was only exceedance of the annual limit
value for NO2 of 40 µg/m3 (EC, 2008) at H.C. Andersens Boulevard (Copen-
hagen/1103). There were no exceedances of the hourly limit value for NO2
of 200 µg/m3. This value must not be exceeded more than 18 times in a cal-
endar year (see 19th highest hourly concentration in table 3.1). In 2015 there
was no information to the public triggered by exceedance of the information
threshold for NO2 (three hours average must not exceed 400 µg/m3).
Table 3.1. Nitrogen dioxide (NO2) in 2015. All parameters are based on hourly averages.
Unit: µg/m3 Number Average Median 98. percentile 19. highest
Street:
Copenhagen/1257 8105 33 28 83 108
Copenhagen/1103 8202 49* 47 108 135
Aarhus/6153 7930 31 27 80 103
Odense/9155 §§ 3718 16 12 55 73
Aalborg/8151 § 0 - - - -
Urban Background:
Copenhagen/1259 7965 16 12 48 68
Aarhus/6160 7965 13 10 46 69
Odense/9159 8067 11 9 36 55
Aalborg/8159 8023 12 8 45 71
Suburban:
Hvidovre/2650 4287 12 9 43 58
Rural:
Risø 8075 8 5 32 52
Keldsnor/9055 7227 7 5 27 39
Limit value 2010 >7467** 40 200
*) Limit value exceeded.
**) 90% data capture of number of hourly measurements in relation to total number of hourly measurements in 2015 excluding
hours used for calibration.
§) Aalborg/8151 (street) there is no data since the station has been shut down due to construction work at the site. It has not
yet been possible to reinitiate the measurements in Aalborg (traffic).
§§) The site in Odense/9155 (Albanigade) was affected by a major permanent rearrangement of the roads in Odense. The
station changed from a traffic site with relatively high traffic intensity to a site with much reduced traffic intensity. This change
took place on 28 June 2014. The station was shut down on 16 June 2015 and has been moved to a new position in summer
2016.
19
Table 3.2. Nitrogen oxides (NOx=NO+NO2) in 2015. All parameters are based on hourly averages.
Unit: µg/m3 (as NO2) Number Average Median 98. percentile 19. highest
Street:
Copenhagen/1257 8105 70 51 248 429
Copenhagen/1103 8202 122 102 377 590
Aarhus/6153 7930 66 48 238 450
Odense/9155 3718 26 16 143 205
Aalborg/8151 0 - - - -
Urban Background:
Copenhagen/1259 7965 19 14 68 118
Aarhus/6160 7965 17 12 71 195
Odense/9159 8067 14 10 52 120
Aalborg/8159 8023 16 10 72 218
Suburban:
Hvidovre/2650 4287 17 10 92 208
Rural:
Risø 8075 9 6 41 81
Keldsnor/9055 7227 9 6 32 50
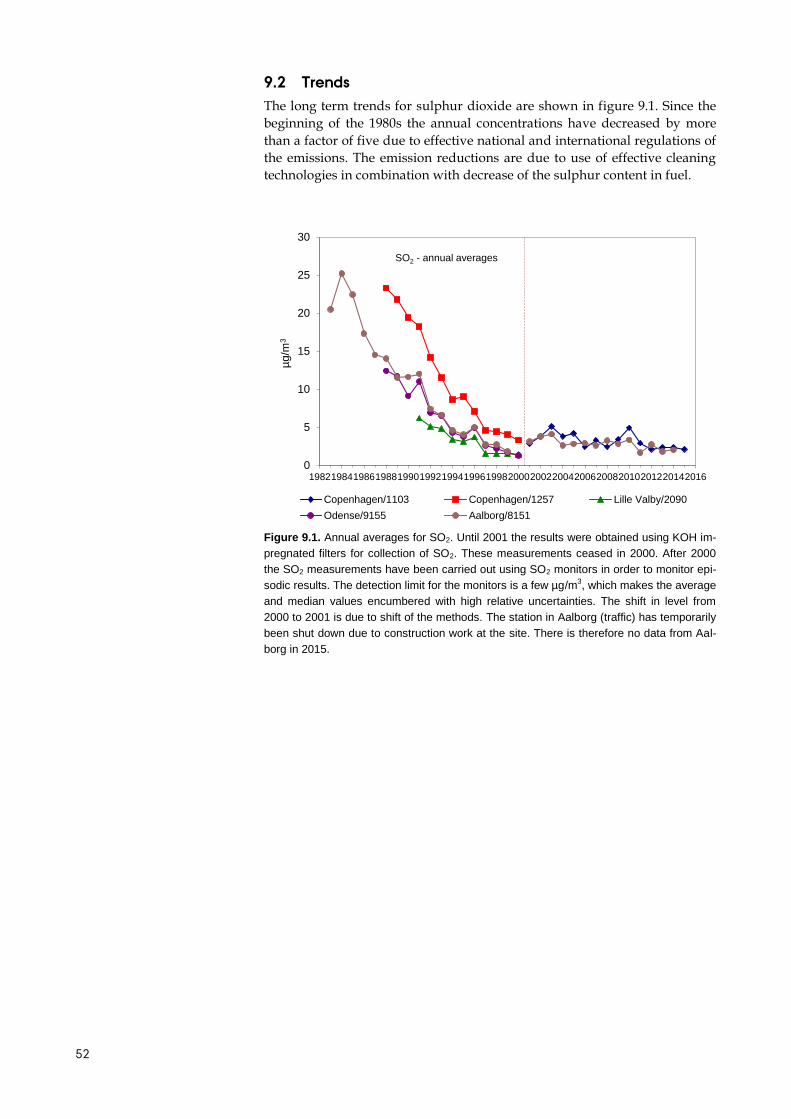
3.2 Trends
The long term trends for NO2 and NOx are shown in figure 3.1. For NOx
there are clear downward trends at all stations. The decreases in the concen-
trations of nitrogen oxides are due to the national and international regula-
tions of the emissions. The large emission reductions in the cities are
achieved by improvement of the vehicles, for example mandatory use of cat-
alytic converters.
For many years the long term trend for nitrogen dioxide has decreased
much slower than observed for NOx. However, since around 2006 NO2 has
decreased with about the same rate as NOx. The slow decrease before 2006
was mainly due to an increase in the share of diesel cars and increase in
share of diesel cars with oxidative catalysts where up to about half of the
emissions of NOx consist of NO2 (called direct NO2) . This increase of the di-
rect emissions of NO2 counteracted the decrease in the traffic emissions from
vehicles. The amount of directly emitted NO2 reached a maximum in around
2009-2011 and has slightly decreased after this. This change in the amount of
directly emitted NO2 is believed to be one of the main reasons why NO2 now
decreases at a similar pace as NOx. At Odense street station and Aarhus ur-
ban background station there have been large decreases since 2013.
In Odense there was a major permanent rearrangement of the roads in
Odense Centre that changed the traffic at the street station in Albanigade in
two steps from a street with relatively high traffic intensity to a street with
much reduced traffic intensity. Finally, the street was closed for traffic in
2015. These changes began on 28 June 2014. This is the reason for the large
decrease of the NO2 and NOx values for Odense/9155 in 2014 and 2015. The
station was shut down on 16 June 2015 and was relocated to another posi-
tion in summer 2016. The large change at Aarhus/background from 2013 to
2014 is due to the relocation of the measurement site in January 2014 (Chap-
ter 2.1).
20
Figure 3.1. The graphs show the time series for the annual average values of NO2 and
NOx. The dashed line on the upper graph shows the limit value that entered into force in
2010. Results from the previous (6159) and the new background station (6160) in Aarhus
are shown on the same curve.
0
10
20
30
40
50
60
70
80
1982 1986 1990 1994 1998 2002 2006 2010 2014
µg/m
3
Copenhagen/1103 Copenhagen/1257
Aarhus/6153 Odense/9155
Aalborg/8151 Copenhagen/1259
Aarhus/6160 Odense/9159
Ålborg/8159 Hvidovre/2450
Lille Valby - Risø Keldsnor/9055
NO2 - annual averages
0
50
100
150
200
250
300
1982 1986 1990 1994 1998 2002 2006 2010 2014
µg
/m3
Copenhagen/1103 Copenhagen/1257
Aarhus/6153 Odense/9155
Aalborg/8151 Copenhagen/1259
Aarhus/6160 Odense/9159
Ålborg/8159 Hvidovre/2450
Lille Valby - Risø Keldsnor/9055
NOx - annual averages
21
In 2010 the driving lanes were changed at the section of H.C. Andersens
Boulevard where the measurement station (Copenhagen/1103) is sited. This
change moved the traffic closer to the measurement station and resulted in
an increase of the annual average concentrations of NO2 of about 8 µg/m3 in
comparison to the levels measured before the introduction of the new driv-
ing lanes. This increase in the concentrations of NO2 is still measured, alt-
hough there has been a general reduction of concentrations in line with the
observations at other stations e.g. at Jagtvej.
3.3 Results from model calculations
Model calculations of NO2 have been performed for selected streets in
Copenhagen (capital) and Aalborg (fourth largest city).
The selected streets represent busy streets and are mainly so-called street
canyons. Concentrations are elevated in this type of streets due to the high
emissions and restricted dispersion conditions. 98 streets were selected in
Copenhagen and 31 in Aalborg.
ADT (Average Daily Traffic) was between 5,400 and 67,600 vehicles/day in
Copenhagen and between 2,700 and 28,300 vehicles/day in Aalborg.
Model calculations have been carried out in order to determine the annual
concentrations of NO2 for comparison with the limit values. The air quality
limit value for the annual mean is 40 µg/m3. The number of streets with ex-
ceedances is one of the parameters discussed in the next section. An exceed-
ance is registered if the calculated concentration is higher than 40.5 µg/m3
since the limit value is given as an integer.
3.3.1 NO2 model calculations for Copenhagen
The annual mean concentrations of NO2 for streets in Copenhagen in 2015
are shown in figure 3.2 (bar chart) and figure 3.3 (map).
The average of NO2 concentrations at all 98 streets has decreased by 3% from
2014 to 2015 corresponding to 1 µg/m3. The general decrease is a result of a
combination of changes in traffic, emission factors, urban background and
meteorology. Modelled urban background concentrations decreased 4% or
about 0.7 µg/m3 which accounts for more than half of the reduction in street
concentrations. Vehicle emission factors show a decrease due to the general
replacement of the car fleet and leads to a decrease in modelled concentra-
tions. There has been marginal changes in traffic as ADT increased 0.2%,
heavy-duty share decreased 0.7% and travel speeds are assumed to be the
same as in 2014. In 2015 the limit value for the annual mean concentration
was exceeded in 9 out of the 98 selected streets in Copenhagen according to
the model results (figure 3.2). This is slightly less than in 2014 where the
number of streets exceeding the limit value was 11 out of 98. The number of
streets exceeding the limit value is very sensitive to small changes in concen-
trations and uncertainties in the assumptions as can be seen from figure 3.2
where a number of streets are close to the limit value.
22
Figure 3.2. Annual mean concentrations of NO2 in 2015 for 98 streets in Copenhagen according to model calculations.
The contribution from traffic in the street canyons is based on the street canyon model OSPM® (blue colour). The urban
background (reddish colour) is obtained from calculations with the urban background model UBM with input from the
regional scale model DEHM (green colour). The value for a street segment is for the side of the street with the highest
annual mean concentration of the two sides. However, for streets with a measuring station it is the side where the station
is located. The names of the streets can be seen in table 3.3. Arrows indicate street segments with a measuring station.
The streets where the limit value were exceeded all have average daily traf-
fic in the range of 12,800 to 67,600 vehicles per day. However, it is not only
the traffic intensity which determines the concentration of NO2. Also the
travel speed, vehicle distribution, and street geometry like the width of the
streets, the height of the surrounding buildings, openings in the building fa-
çade, orientation of the street and background concentrations and meteorol-
ogy have impacts on the concentration of NO2 in a street.
The names of the 98 streets are given in table 3.3 and the locations of the
streets together with the annual NO2 concentration levels are shown in fig-
ure 3.3. It is seen that the exceedances are concentrated in the central part of
the city and at the main arterial roads from H.C. Andersens Boulevard to
Ågade, and also Stormgade and Øster Søgade.
There have been minor changes in the ranking of streets according to NO2
concentrations from 2014 to 2015 due to mainly small changes in traffic in-
puts. The highest modelled NO2 concentration in 2015 is at H.C. Andersens
Boulevard (2) (47 µg/m3). The second highest (46 µg/m3) is where the meas-
uring station is located (H.C. Andersens Boulevard (1)). Observed concentra-
tions are 49/41 µg/m3 (explanation in table 2.2). This location was ranked
number one in 2014.
23
Table 3.3. Number and names for the street segments that are shown in figure 3.2 and 3.3. The streets are numbered (1-98)
according to NO2 levels in 2015 (1 = highest, 98 = lowest). The numbers in parentheses refer to different segments of the
same street that has more than one model calculation. An asterisk (*) indicates a street segment with a measurement station.
Note that Vester Voldgade is not included, as the road segment, where the calculation point is, has been closed due to con-
For Aalborg the modelled street concentrations show an average decrease of
10% for NO2 compared to 2014 when considering all 31 street segments, cor-
responding to a decrease of about 2 µg/m3. The general decrease is a result
of a combination of several factors. The contribution from regional and ur-
ban background is almost entirely responsible for the modelled decrease. On
average ADT increased about 0.6% whereas the heavy-duty share of vehicles
was unchanged, and travel speeds were assumed to be unchanged. This
would - all other things equal - slightly increase concentrations due to these
changes in traffic inputs. Reduced emissions due to replacement of the car
fleet should lead to lower concentrations.
According to the model calculations the limit value for the annual mean
concentration in 2015 was not exceeded at any of the 31 selected streets
which was also the case in 2014 (figure 3.4 and figure 3.5). The order of some
of the streets has changed slightly due to changes in traffic data.
Figure 3.4. Modelled annual mean concentrations of NO2 in 2015 for 31 streets in Aalborg. The contribution from traffic in
the street canyons is based on the street canyon model OSPM® (blue colour). The urban background (dark red colour) is
obtained from calculations with the urban background model UBM (reddish colour) with input from the regional scale mod-
el DEHM (green colour). The value for a street segment is for the side of the street with the highest annual mean concen-
tration of the two sides. However, for streets with a measurement station it is the side where the station is located. Vester-
bro 1 is the street segment where the measurement station is located. However, the station was not operational during
2015 due to nearby building construction works. An asterisk (*) at the end of the street name indicates that calculations
were based on travel speed data from SpeedMap, whereas an average of these travel speeds were used for the rest of
the streets.
26
Figure 3.5. Map showing the location of the selected streets in Aalborg and the annual mean con-centrations of NO2 for 2015. The contribution from traffic in the street canyons is based on the street canyon model OSPM®. The urban background is obtained from calculations with the urban background model UBM with input from the regional scale model DEHM. The value for a street segment is for the side of the street with the highest annual mean concentration of the two sides. However, for streets with a measurement station it is the side where the station is located. Vesterbro 1 is the street segment with the measurement station, however, not operating in 2015 due to nearby building construction work. Map can be viewed at a webGIS service, see http://arcg.is/1RvRuzS
In Figure 3.6 modelled trends in exceedances of annual mean of NO2 are
shown for Copenhagen and Aalborg. The limit value of 40 µg/m3 for annual
mean of NO2 had to be met in 2010 and in previous years the limit value
plus a margin of tolerance depending on the year in question had to be met.
For Copenhagen the number of exceedances has decreased from 58 in 2008
to 9 in 2015.
The main reason for the increase in number of exceedance in Copenhagen
from 32 in 2007 to 58 in 2008 is the following. The limit value plus margin of
tolerance for the annual mean concentration of NO2 decreased from 46
μg/m3 in 2007 to 44 μg/m3 in 2008 (EC, 2008). This decrease naturally lead
to a higher number of streets exceeding the limit value plus margin of toler-
ance in 2008 compared to 2007. If the limit value plus margin of tolerance
had been 44 μg/m3 in 2007, then the number of streets exceeding the limit
value plus margin of tolerance would have been 53. Roughly the same level
as in 2008.
In Copenhagen the analysis includes 138 streets during 2007 to 2010 and 98-
99 the following years. The reduction of included streets from 2011 and on-
wards was implemented to better match locations of selected streets with lo-
cations with manual traffic counts.
For Aalborg 3-4 exceedances were modelled in 2007-2009 and none since
2010. Here the analysis includes 32 streets from 2007 to 2010, and 31 streets
from 2011 to 2015.
Figure 3.6. Trends in modelled exceedances of annual mean of NO2 in Co-
penhagen and Aalborg.
28
4 Ozone
Ozone is measured at seven monitoring sites using gas monitors based on
ultraviolet photometry. The concentrations are measured continuously
throughout the year with a time resolution on minute scale that is aggregat-
ed to hourly averages for the present reporting.
4.1 Annual statistics
The annual statistics for 2015 for ozone are shown in table 4.1. The maxi-
mum 8 hours daily mean value must not exceed 120 µg/m3 more than 25
days per calendar year averaged over three years (EC, 2008). This target val-
ue was not exceeded for 2013-2015 at any of the stations. The long term ob-
jective (maximum 8 hours daily mean value must not exceed 120 µg/m3; ta-
ble 4.1 column 5) was exceeded at six of the stations. However, the long term
objective has not entered into force.
In 2015 there was no exceedance of the information threshold (hourly aver-
age 180 µg/m3) and no exceedance of the alert threshold (hourly average 240
µg/m3) for ozone.
Table 4.1. Ozone (O3) in 2015. All parameters are based on one-hour average values. The 8 hour values are calculat-ed as a moving average based on hourly measurements. Days above target value is the number of days that the max-imum running 8 hour average exceeds 120 µg/m3 averaged over 2013-2015.
Unit: µg/m3 Number of
results Average Median
Max Days above target value
Max
8 hours 8 hours 1 hour
Urban Background:
Copenhagen/1259 7603 59 61 138 4 153
Aarhus/6160 7233 56 59 145 1
162
Odense/9159 7735 57 59 129 4 146
Aalborg/8158 7124 58 61 126 1 147
Rural
Risø/2090 7941 61 63 146 7 167
Keldsnor/9055 7698 60 62 131 3 155
Traffic
Copenhagen/1103 7728 36 37 94 0 114
Target value1 - - - - 25 -
Long term objective - - - 120 - -
Information threshold - - - - - 180
Data capture* >7154 - - - - -
1 As average over 3 years. *) 90% data capture of number of hourly measurements in relation to total number of hourly measurements in 2015
excluding hours used for calibration.
29
4.2 Trends
The long term trends of ozone are shown in figure 4.1. The annual averages
of ozone have been nearly constant since 1992. The Danish and European
reductions of the precursors to ozone formation (NOx, volatile organic com-
pounds) have therefore not been sufficient to reduce the ozone concentra-
tion. However, the reductions of the precursors have decreased the maxi-
mum concentrations of ozone. This is illustrated by the decrease in the max-
imum eight hour average concentrations.
Figure 4.1. Annual average values and the max. 8 hour average value. The latter is calcu-
lated as 8 hourly running averages according to the provisions in the EU Directive (EC,
2008). Results from the previous (6159) and the new background station (6160) in Aarhus
This section merges previous years sections on Ozone Precursors and Benzene
and Toluene, all of which are Volatile Organic Compounds (VOC).
Benzene, toluene, ethylbenzene and xylenes are monitored on two kerbside
stations in Copenhagen with weekly resolution, i.e. Jagtvej/1257 and H.C.
Andersen’s Boulevard/1103. These anthropogenic VOCs are collected using
passive sampling, and subsequently extracted and analysed by Gas Cho-
matography MS (GC-MS).
In addition to this benzene and toluene is also measured at the urban back-
ground station (Copenhagen/1259). Here a comprehensive set of 18 poten-
tial ozone precursor VOCs is measured with diurnal time resolution. The fo-
cus is VOCs of anthropogenic origin, though also isoprene is monitored,
which is typically from deciduous trees. Atmospheric samples are precon-
centrated on the adsorbent Carbopack X using active sampling, and ana-
lysed using Thermal Desorption Gas Chromatography Mass Spectrometry
(TD-GC-MS).
6.1 Annual statistics and trends
Annual averages of benzene and toluene for 2015 are listed in Table 6.1 and
6.2. Benzene is well below the EU-limit value of 5 µg/m3 (EC, 2008), averag-
ing 0.79 µg/m3 and 0.37 µg/m3 at the kerbside stations and urban back-
ground, respectively. The local input of benzene from traffic amounts to 54%
of the ambient kerbside concentration. For toluene, the local input is as high
as 64%, which indicates that other sources contribute to ambient benzene be-
sides traffic. One source is residential wood combustion, and for this reason
the summer concentrations of benzene are lower even at kerbside stations,
which are highly influenced by traffic. Both kerbside stations in Copenhagen
show similar concentrations of anthropogenic aromatic compounds, includ-
ing toluene and benzene (Table 6.1), in spite of their differences with respect
to traffic load and buildings close to the street. These VOCs decreased dra-
matically at the kerbside stations during 2004-2008 (Figure 6.1) and has con-
tinued to decrease, though at a slower yet comparable rate in the urban en-
vironment. In fact, benzene has decreased 36% and 39% at the kerbside sta-
tion and urban background, respectively, from 2010 to 2015. With respect to
toluene, the corresponding decays are 31% and 50%, respectively. Of the
monitored VOCs at kerbside, toluene is by far the most abundant. Other ar-
omatic compounds are comparable in abundance to benzene (Table 6.1).
36
Table 6.1. Annual statistics for benzene, toluene, ethylbenzene and xylenes in 2015
based on weekly average concentrations (µg/m3) at kerbside stations Jagtvej (1257) and
H.C.Andersens Boulevard (1103) at 1 atm., 293 K. The limit value for benzene is 5 µg/m3
(EU Directive 2008/50/EC).
Concentration µg/m3 Copenhagen/1103 Copenhagen /1257 Number of results
Benzene 0.83 0.79 52, 52
Toluene 2.12 2.07 52, 52
Ethylbenzene 0.53 0.52 52, 52
m/p-Xylene 1.36 1.35 52, 52
o-Xylene 0.55 0.55 52, 52
Benzene is not measured directly in Aarhus and Odense. However an objec-
tive estimate of the concentrations can be used to determine the concentra-
tion levels, since the concentrations are below the lower assessment thresh-
old limit.
The objective estimate for benzene is based on the correlations between the
average concentrations of benzene and CO. Ellermann et al. (2011) docu-
mented that the benzene concentrations can be estimated based on the sim-
ple empirical model:
Benzene = 0.0044·CO - 0.37
where benzene and CO are in units of µg/m3.
Based on this and the concentrations of CO (table 5.1) the annual average
concentrations of benzene is estimated to about 0.7 µg/m3 for all the three
street stations in Aarhus, Odense and Aalborg in 2015.
Figure 6.1. Trend in benzene and toluene (annual averages) on the kerbside station Jagt-
vej, Copenhagen/1257.
The main reasons for the significant decrease of benzene and toluene up to
2008 are reductions of the emissions from gasoline-fueled traffic due to in-
creased use of catalysts and higher ratio of diesel cars.
0
5
10
15
20
0
1
2
3
4
5
2001 2003 2005 2007 2009 2011 2013 2015
Tolu
ene,
ug m
-3
Benzene,
ug m
-3
Benzene
Toluene
37
Table 6.2. Annual statistics for VOCs in urban background in Copenhagen (1259) based on daily average concentrations (1 atm., 293 K).
Concentration µg/m3 Average
concentration
Annual trend
2010-2015
Number
of results
1-Pentene 0.03 -0.3% 319
n-Pentane 0.44 +2% 323
Trans-2-pentene 0.01 -0.2% 324
Isoprene 0.04 -0.2% 322
2-Methylpentane 0.22 -2% 313
n-Hexane 0.11 -1% 280
Benzene 0.37 -4% 324
n-Heptane 0.14 -0.5% 324
2,2,2-Trimethylpentane 0.06 -0.3% 292
Toluene 0.75 -14% 325
n-Octane 0.04 -0.2% 325
Ethylbenzene 0.13 -2% 325
m,p-Xylene 0.40 -6% 325
o-Xylene 0.16 -2% 325
1,3,5-Trimethylbenzene 0.04 -0.3% 96
1,2,4-Trimethylbenzene 0.16 -1% 280
1,2,3-Trimethylbenzene 0.04 -0.3% 324
Sum of VOC’s 3.14
Measurements of mainly anthropogenic volatile organic compounds in ur-
ban background, which may act as ozone precursors, were initiated in 2010
in the urban background. The major ozone precursors are the aromatic
compounds: benzene, toluene, ethylbenzene, xylenes and trimethylbenzenes
(TMB), which are also measured at the kerbside stations in Copenhagen
(1103 and 1257), and the C5-C7 alkanes: pentane, 2-methylpentane hexane
and heptane. The more reactive unsaturated compounds are less abundant
(Table 6.2).
0
1
2
3
4
2010 2011 2012 2013 2014 2015
mg
/m3
isoprene (HCØ) benzene (HCØ)
toluene (HCØ) benzene (Jagtvej)
toluene (Jagtvej)
Figure 6.2. Annual average concentrations of benzene, toluene and isoprene at the
kerbside station, Copenhagen/1257, and at urban background, Copenhagen 1259.
0
1
2
3
4
2010 2011 2012 2013 2014 2015
mg/m
3
isoprene (HCØ) benzene (HCØ)
toluene (HCØ) benzene (Jagtvej)
toluene (Jagtvej)
38
In contrast to the anthropogenic VOC’s (Figure 6.2), the annual average con-
centration of isoprene has stayed constant throughout the monitoring period
(Table 6.2). Isoprene origins mainly from terrestrial vegetation and peaks in
the warmer summer months June, July and August with low concentrations
in the winter months. Except for n-pentane, all anthropogenic VOC’s either
stayed constant during 2010-2015 or decreased (Table 6.2). Toluene has de-
creased 14% annually. A number of other VOCs has decreased more than 1%
annually, i.e. 2-methylpentane, n-hexene, benzene, ethylbenzene, the iso-
mers of xylene, and 1,2,4-trimethylbenzene.
The urban background ratio between toluene and benzene is somewhat
smaller at both kerbside stations sites, i.e. 2.0 versus 2.6. This indicates dif-
ferent sources to benzene and toluene and faster atmospheric decomposition
of toluene.
39
7 Particles (TSP, PM10, PM2.5 and particle number)
As part of an overall maintenance plan for the measuring programme it has
been decided to substitute the old SM200 samplers with measurements of
PM that follows the reference method for the determination of PM10 and
PM2.5 (EN 12341: 2014, into which the previous standards for PM10, EN
12341: 1998, and for PM2.5, EN 14907:2005, have been merged). The basic
measuring principle of the reference method uses Low Volume Sampling
(LVS) i.e. a flow of 2,3 m3/hr with gravimetric determination of the sampled
mass in the laboratory. Results from comparison of LVS gravimetric deter-
mination and the SM200 β-method for PM measurements have not docu-
mented any systematic deviation between the two measuring methods ex-
cept for an improved reproducibility and data capture using the LVS in-
struments.
The SM200 sampler manufactured by OPSIS, Sweden, has been used in
Denmark to measure PM10 in accordance with the EU Directive (EC, 2008).
Measurements with this instrument have from 2007 been extended to also
include PM2.5. The sampler provides the possibility for online diurnal meas-
urements of PM in combination with sampling of PM on filters. The filters
can later be used for chemical analysis. The online measurements of PM are
obtained immediately after the diurnal sampling period by means of absorp-
tion of β-rays in the particles sampled on the filters. This option provides the
possibility of presenting “on-line” results via the internet.
Results indicate that the β-ray results from the SM200 sampler comply better
with the reference method for PM10 given in the EU Directive, than the re-
sults from weighing of the filters using the SM200 as a filter sampler for
PM10 (Harrison, 2006). For this reason we have decided from 2006 and on-
wards to report results from the β-method. Previously, only results from
weighing of the filters collected by the SM200 were reported. The results
from the two methods differ slightly. From 2002 to 2005, where comprehen-
sive data sets are available, it is shown that the β-method in average yields
results that are 1.08 times the weighing for the yearly average and 1.09 times
the weighing for the 36th highest concentration.
Since August 2012 measurements of PM10 and PM2.5 based on the LVS refer-
ence method (EN 12341: 2014) were introduced into the regular measuring
programme to replace some of the older SM200 instruments that needed to
be renewed and LVS is now installed at most of the stations in the network.
Data series from stations where a single measurement method (i.e. either
SM200 or LVS) does not cover a full calendar year consists of a combination
of SM200 and LVS measurements.
40
Initiation of LVS measurements:
2012
HCAB PM10 (Copenhagen street): 5 September 2012
HCAB PM2.5 (Copenhagen street): 12 September 2012
Jagtvej PM10 (Copenhagen street): 28 August 2012
HCØ PM2.5 (Copenhagen urban background): 2 August 2012
Risø PM2.5 (Rural): 29 August 2012
2013
HCØ PM10 (Copenhagen urban background): 26 June 2013
Jagtvej PM2.5 (Copenhagen traffic): 16 November 2013
2014
Risø PM10 (Rural): 4 January 2014
Aarhus PM10 (street): 10 September 2014
Aarhus PM2.5 (street): 10 September 2014
Aarhus PM2.5 (urban background): 1 January 2014
Aalborg PM2.5 (street): 9 April 2014
Aalborg PM2.5 (urban background): 9 April 2014
2015
Hvidovre PM2.5 (Copenhagen. suburban): 17 June 2015
Measurements of particle numbers have been carried out since 2002 in coop-
eration between the monitoring programme and research projects financed
by the Danish Environmental Protection Agency. The measurements have
been carried out using a Differential Mobility Particle Sizer (DMPS) that
counts particles with mobility diameter between 6 and 700 nm. In 2015 addi-
tional measurements were started at the non-permanent measurement sta-
tion in Hvidovre using a Scanning Mobility Particle Sizer (SMPS) with mo-
bility diameter between 11 and 478 nm.
7.1 Annual statistics
At all the PM10- and/or PM2.5 stations particulate material was collected con-
tinuously on filters on a diurnal basis for subsequent mass detection either
by gravimetric determination (LVS) or by β-absorption measurement using
SM200-monitors depending on the method used on the particular station
(table 7.1 and 7.2). Subsequently the particle samples were analysed in the
laboratory. Additionally, PM is measured at the stations in the Copenhagen
area using a TEOM (Tapered-Element Oscillating Microbalance) instrument.
The TEOM measurements have a time resolution of 30 minutes (table 7.3).
During sampling the collected particles are heated to 50°C. At that tempera-
ture some of the volatile compounds evaporate (mainly secondary aerosols).
The loss will depend of the actual composition of the aerosols. The European
Commission has accepted that TEOM measurements for PM can be used in
relation to EU limit values if the measured values are multiplied with a fac-
tor 1.3. However, the correction factor depends e.g. on the specific meas-
urement site and seasonality and correction of TEOM measurements of PM
using a correction factor of 1.3 do therefore have considerable uncertainty.
41
In 2015 the permitted number of exceedances in a year of the diurnal limit
value of 50 µg/m3 for PM10 was not exceeded at any stations in the measur-
ing network, even at stations where exceedances previously have occurred
(the two traffic stations in Copenhagen (HACB/1103 and Jagtvej/1257)).
Likewise, there were no exceedances of the annual limit value for PM10 (of 40
µg/m3) and PM2.5 (of 25 µg/m3) at any measuring station.
The EU-directive on air quality (EC, 2008) prescribes that the national aver-
age exposure indicator (AEI) has to be determined based on three years av-
erage of the average urban background concentration of PM2.5. For the years
2013-2015 the AEI is determined to 11 µg/m3. In Denmark the average expo-
sure indicator is measured in urban background at Copenhagen/1259, Aar-
hus/6159 and Aalborg/8158.
In 2015 the number of particles in ambient air was about 12.300 particles per
cm3 at the street station H.C. Andersens Boulevard (table 7.5). This is a factor
of roughly about 3 and 4 higher than in urban and rural background, respec-
tively.
Table 7.1. Annual statistics for PM10 in 2015. All parameters are given as diurnal averages at ambient temperature and pres-sure.
Unit µg/m3 Number of
results Average (µg/m3)
Median Days above 50 µg/m3
90 percentile Max. day
Street
Copenhagen/11031 358 29 26 26 43 75
Copenhagen/12571 360 23 21 13 38 76
Aarhus/61531 347 21 18 7 31 70
Odense/91552 § 166 21 19 3 34 66
Urban background
Copenhagen/12591 354 18 16 4 30 64
Rural
Risø1 363 17 14 3 27 61
Keldsnor/90552 321 20 18 7 35 62
Limit value (2005) 40 35***
90% data capture >328**
1 Measurements based on low volume sampling with gravimetric determination of particle mass
2 Measurements based on SM200 beta gauge determination of particle mass
* Combination of low volume sampling and SM200 beta gauge determination of particle mass
** 90% data capture of number of diurnal measurements in relation to number of days in 2015
*** Permitted number of exceedances in a year of the diurnal limit value of 50 µg/m3
§ The site in Odense/9155 (Albanigade) was from 28 June 2014 affected by a major permanent rearrangement of the roads in Odense, and the site changed from a traffic site with relatively high traffic intensity to a site with much reduced traffic. On 15 June 2015 the measurements had to be stopped. The PM10 measurements from Odense/9155 (Albanigade) for 2015 thus do not represent a traffic site but rather have character of an urban background site.
42
Table 7.2. Annual statistics for PM2.5 in 2015. All parameters are given as diurnal averages at ambient temperature and pres-sure.
Unit µg/m3 Number of
results Average (µg/m3)
Median 90 percentile Max. day
Street
Copenhagen/1103 338 16 13 27 59
Copenhagen/1257 359 14 12 26 59
Aarhus/6153 357 12 9 23 57
Aalborg/8151*
Suburban
Hvidovre/2650 192 11 8 19 57
Urban background
Copenhagen/1259 338 12 9 22 54
Aarhus/6159 361 10 7 18 56
Ålborg/8158 348 9 8 17 52
Rural
Risø1 356 11 8 21 54
Limit value (2015) (parenthesis gives proposed value for 2020)
25(20)
90% data capture >328*
Measurements at all stations in 2015 were based on low volume sampling (LVS) with gravimetric determination of particle mass
* No data from Aalborg/8151 (traffic site) in 2015 because the station is closed temporarily due to construction work.
** 90% data capture of number of diurnal measurements in relation to number of days in 2015
Table 7.3. Annual statistics for PM10 measured in 2015 using TEOM. The values are
based on ½-hourly averages. Total annual number of ½-hours is 17520.
Unit: µg/m3 Number of results Average Average x 1.3
Street
Copenhagen/1103 16294 29 38
Rural
Risø 13841 14 18
Limit value 40
Table 7.4. Annual statistics for PM2.5 measured in 2015 using TEOM. The values are
based on ½-hourly averages. Total annual number of ½-hours is 17520.
Unit: µg/m3 Number of results Average Average x 1.3
Street
Copenhagen/1103 15067 11 15
Rural
Risø 16469 8 11
Limit value (2015) (parenthesis gives proposed value for 2020)
25(20)
43
Table 7.5. Annual statistics for particle number measured in 2015. All values are based on
½-hourly averages. Total annual number of ½-hours is 17520.
Unit: particles per cm3 Number of results Average
Street
Copenhagen/1103* 11388 12310
Urban Background
Copenhagen/1259* 11563 3990
Hvidovre/2650** 4030§ 3570
Rural
Risø* 12614 2960
* Measured with DMPS (6nm – 700 nm)
** Measured with SMPS (11nm – 478 nm) § SMPS measurements at Hvidovre began 1 October 2015.
DMPS and SMPS measure slightly different size ranges of particles. It is es-
timated that less than 10% of the particles are in the size range from 6nm –
10nm plus 479nm – 700nm. The underestimation of the SMPS measurements
due to the slightly narrower size range compared to the DMPS measure-
ments is therefore estimated to be less than 10%.
7.2 Trends
Up to the year 2000 the particulate matter was measured as Total Suspended
Particulate matter (TSP) corresponding to particles with a diameter up to
around 25 µm (figure 7.1). The exact cut-off depends strongly on the wind
velocity. From 2001 most of the measurements of particulate matter were
changed from TSP to PM10 according to the EU directive adopted in 1999
(EC, 1999) and PM10 measurements were started at all stations except Co-
penhagen/1103 where the TSP measurements were continued to the end of
2005. The TSP is on the average 30-80% higher than PM10 at the street sta-
tions, while the difference is less at urban background and rural sites.
The measurements show a tendency for a decrease in PM10 at all the meas-
urement stations since 2001, where the measurements began (figure 7.2).
Although the measurements at HCAB (Copenhagen/1103) began later, there
is also a decrease in PM10 at this station. However, this is mainly due to a
major reduction (7 µg/m3) in PM10 from 2008 to 2009. Detailed examination
of all the measurements at HCAB showed that the main reason for this de-
crease from 2008 to 2009 was new asphalt surface on the road laid out dur-
ing August and September 2008 (Ellermann et al., 2010) that significantly re-
duced dust generation from road abrasion.
The site in Odense/9155 (Albanigade) was affected by a major permanent
rearrangement of the roads in Odense. It changed from a traffic site with rel-
atively high traffic intensity to a site with much reduced traffic intensity.
This change took place on 28 June 2014. This has affected the measured PM10
levels in the second half of 2014 and this is the reason why there is un-
changed PM10 value for Odense/9155 in 2014 while all the other traffic sta-
tions display an increase in 2014 compared to 2013. In 2015 the road next to
the measuring station was closed for traffic. PM10 measurements from Oden-
se/9155 (Albanigade) for 2015 do not represent a traffic site but rather have
character of an urban background site.
The measurements of PM2.5 started in 2007 at Copenhagen/1103 and at the
other stations in 2008. Figure 7.3 presents all the results from diurnal meas-
44
urements of PM2.5 until now . There seems to be a tendency to a small reduc-
tion in PM2.5, although this tendency is uncertain due to the relatively short
period with measurements.
The AEI (the average exposure index for PM2.5) is determined as the average
PM2.5 measured at urban background in Copenhagen, Aarhus and Aalborg
averaged over a three year period. The trend for AEI is shown in figure 7.5
and as seen for PM2.5 itself, there is a small reduction in the AEI, although
this tendency is uncertain due to the relatively short period with measure-
ments and the large interannually variation in PM2.5 due to the natural varia-
tions in the meteorological conditions.
The measurements show a significant reduction of particle number concen-
tration in ambient air over the entire measuring period (figure 7.5). On
HCAB the number of particles has decreased about 50% during the period
2002-2015. At the urban background station (HCØ) particle numbers show a
similar decrease of about 50% for the same period. At the rural background
station (LVBY/Risø) over the period 2005-2015 a reduction in particle num-
bers was also observed, though the decrease is only about 30%.
Figure 7.1. Annual averages for TSP measured at street stations (s) and at rural back-
ground station (r).
0
20
40
60
80
100
120
19
82
19
84
19
86
19
88
19
90
19
92
19
94
19
96
19
98
20
00
20
02
20
04
20
06
20
08
20
10
µg
/m3
Copenhagen(s)/1103 Copenhagen(s)/1257
Odense(s)/9155 Aalborg(s)/8151
Lille Valby(r)/2090
TSP
45
Figure 7.2. Annual averages for PM10 measured at street stations (s), urban background stations (u) and at rural background
stations (r). The change from gravimetric determination using the SM200 as a filter sampler to the use of the same instrument
as a β-gauge from 2006 gives rise to a 5-10% increase due to the shift of method. The value for PM10 at Copenhagen/1103 in
2008 and 2009 is based on the measurements with SM200 in combination with an estimated value. Data are given at standard
temperature- and pressure conditions (0ºC and 1 atm.). PM given at ambient temperature and pressure conditions is on an
annual average approximately 3-4% lower than PM-results given at standard conditions. The site in Odense/9155 (Albanigade)
was from 28 June 2014 affected by a major permanent rearrangement of the roads in Odense, and the site changed from a
traffic site with relatively high traffic intensity to a site with much reduced traffic. In 2015 the street was closed for traffic. The
large change in PM10 since 2013 is due to this change in traffic.
Figure 7.3. Annual averages for PM2.5 measured at street stations (s), suburban (sub), urban background stations (u) and at
rural background station (r). Only annual averages covering more than 2/3 of the years are shown except for the newly estab-
lished suburban station at Hvidovre (began in 17 June 2015) and Aalborg(s) for 2014 (data covering the period 1/1 - 7/9). Data
are given at standard temperature- and pressure conditions (0ºC and 1 atm.). PM given at ambient temperature and pressure
conditions is on an annual average approximately 3-4% lower than PM-results given at standard conditions.
0
5
10
15
20
25
30
35
40
45
50
200
0
20
01
20
02
20
03
20
04
20
05
20
06
20
07
20
08
20
09
20
10
20
11
20
12
20
13
20
14
20
15
20
16
µg
/m3
Copenhagen(s)/1103 Copenhagen(u)/1259
Copenhagen(s)/1257 Odense(u)/9159
Odense(s)/9155 Aarhus(u)/6159
Aarhus(s)/6153 Aalborg(u)/8158
Aalborg(s)/8151 Lille Valby/Risø(r.)
Keldsnor(r)/9055
PM10
0
5
10
15
20
25
30
20
06
20
07
20
08
20
09
20
10
20
11
20
12
20
13
20
14
20
15
20
16
µg
/m3
Copenhagen(s)/1103 Copenhagen(s)/1257
Copenhagen(u)/1259 Aarhus(s)/6153
Aarhus(u)/6159 Aalborg(s)/8151
Aalborg(u)/8158 Lille Valby/Risø(r.)
Hvidovre(sub)/2650
PM2.5
46
Figure 7.5. Annual averages for particle number at street level (H. C. Andersens Boule-
Heavy metals in PM10 is measured by collection of PM10 on filters that are
analysed by ICP-MS (Inductively Coupled Plasma Mass Spectrometry) for
their content of elements. Results for 10 heavy metals are presented in table
8.1. Comparison between results from ICP-MS and the previously used
PIXE-method (Proton Induced X-ray Emission) showed only minor changes
in the annual averages, when the low concentration levels are taken in to ac-
count.
The table presents also results for analysis of heavy metals in total suspend-
ed particulate (TSP) at the measurement station Risø. The content of these
heavy metals in PM10 and TSP are approximately equal since these metals
are mainly found in the fine particle fraction.
The ICP-MS analysis provides the measurements of Arsenic (As), Chromium
(Cr) and Nickel (Ni) included in the EU Directive 2004/107/EC (EC, 2005)
and Lead (Pb) included in EU Directive 2008/50/EC (EC, 2008). According
to the directive (EC, 2005) also Mercury (Hg) has to be measured, however,
these measurements can be carried out in cooperation with neighboring
countries. As part of a bilateral agreement “Development of the mutual
partnership on air pollution” between Denmark and Sweden, it has been
agreed that the Swedish measurements at Röå (table 8.2) can fulfil the Dan-
ish obligations on measurements of Hg. This agreement is based on the fact
that the spatial variation of background Hg concentrations is small.
8.1 Annual statistics
The annual statistics for the selected heavy metals are shown in table 8.1 and
8.2. The concentrations are low for all of the heavy metals and there were no
exceedances of the target/limit values for the four metals (As, Cd, Ni, and
Pb) that are regulated by use of target/limit values (EC, 2005, 2008).
49
Table 8.1. Annual statistics for Vanadium (V), Chromium (Cr), Manganese (Mn), Nickel (Ni), Cupper (Cu), Zink (Zn), Arsenic (As),Selenium (Se), Cadmium (Cd) and Lead (Pb) measured in PM10 during 2015. For comparison the table includes also results for these heavy metals measured in total suspended particulate (TSP) at the rural background station Risø.
*) Target values for Ni, As and Cd are implemented through EU Council Directive 2004/107/EC (EC, 2005). The limit value
for Pb is found in EU Directive 2008/50/EC (EC, 2008).
**) The guidelines and life time risk for the carcinogenic metals are established by WHO (WHO, 2000). The lifetime risk lev-
el is defined as the concentration that through a lifelong exposure is estimated to give an excess risk of 1:105 for devel-
oping cancer.
***) The site in Odense/9155 (Albanigade) was from 28 June 2014 affected by a major permanent rearrangement of the
roads in Odense, and the site changed from a traffic site with relatively high traffic intensity to a site with much reduced
traffic. On 15 June 2015 the measurements had to be stopped.
Table 8.2. Annual statistics for Mercury 2015. Measured at Råö in southern Sweden by
the Swedish Environmental Research Institute.
8.2 Trends
The long term trends for six of the heavy metals are shown in figure 8.1. For
Pb, As, Ni and Manganese (Mn) there are clear reductions in the concentra-
tions due to national and international regulations of the emissions. Most
pronounced for Pb where removal of Pb from gasoline has resulted in large
reductions of the concentrations. For Mn the long term trend at HCAB devi-
ates from the other stations. This is believed to be due to high Mn concentra-
tions in the asphalt used at HCAB during the period from 1991 to 2008. The
concentration of Cu increases mainly due to increased use of Cupper (Cu) in
brakes.
Unit: ng/m3 Total Gas Hg
(ng/m3)
Total Particles Hg
(ng/m3)
Råö (SE00014) 1.4 0.003
50
Figure 8.1. Annual averages from selected stations for some heavy metals in particulate matter. Until 2000 in TSP
and later in PM10 – except for Copenhagen/1103 where PM10 replaced TSP from the beginning of 2006. The heavy
metals are usually found in fine particles, which make the TSP and the PM10 values comparable. Note that the scale
for Pb is logarithmic. The dashed line indicate that the analysis method has been changed from 2009 to 2010.
1
10
100
1000
1982
1984
1986
1988
1990
1992
1994
1996
1998
2000
2002
2004
2006
2008
2010
2012
2014
ng/m
3
HCAB
Jagtvej
Aarhus
Odense
Aalborg
HCØ
Lille Valby/Risø
Pb
0,0
0,2
0,4
0,6
0,8
1,0
1,2
1,4
1,6
1,8
2,0
2,2
2,4
2,6
1982
1984
1986
1988
1990
1992
1994
1996
1998
2000
2002
2004
2006
2008
2010
2012
2014
ng/m
3
HCAB
Jagtvej
Aarhus
Series7
Aalborg
Series6
Lille Valby/Risø
As
0,0
2,0
4,0
6,0
8,0
10,0
12,0
14,0
198
2
198
4
198
6
198
8
199
0
199
2
199
4
199
6
199
8
200
0
200
2
200
4
200
6
200
8
201
0
201
2
201
4
ng
/m3
HCAB
Jagtvej
Aarhus
Odense
Aalborg
HCØ
Lille Valby/Risø
Ni
0
20
40
60
80
100
120
140
198
2
198
4
198
6
198
8
199
0
199
2
199
4
199
6
199
8
200
0
200
2
200
4
200
6
200
8
201
0
201
2
201
4
ng
/m3
HCAB
Jagtvej
Aarhus
Odense
Aalborg
HCØ
Lille Valby/Risø
Cu
0
25
50
75
100
125
150
198
2
198
4
198
6
198
8
199
0
199
2
199
4
199
6
199
8
200
0
200
2
200
4
200
6
200
8
201
0
201
2
201
4
ng
/m3
HCAB Jagtvej
Aarhus Odense
Aalborg HCØ
Lille Valby/Risø
Mn
0
2
4
6
8
10
12
14
16
18
198
2
198
4
198
6
198
8
199
0
199
2
199
4
199
6
199
8
200
0
200
2
200
4
200
6
200
8
201
0
201
2
201
4
ng
/m3
HCAB
Jagtvej
Aarhus
Odense
Aalborg
HCØ
Lille Valby/Risø
Cr
51
9 Sulphur dioxide
The concentration of sulphur dioxide has reached very low levels in Den-
mark and it is therefore only necessary with a limited monitoring of the con-
centrations of sulphur dioxide; both with respect to the number of stations
and the quality of the measurements. Hence it is only measured at two traf-
fic stations (Copenhagen and Aalborg) with focus on episodes with high
concentrations of sulphur dioxide. It is measured using gas monitors based
on ultraviolet fluorescence. The concentrations of sulphur dioxide are often
below the detection limit of the instruments and hence the uncertainties of
the measurements are large. The concentrations are measured continuously
throughout the year with a time resolution on minute scale that is aggregat-
ed to hourly averages for this reporting.
9.1 Annual statistics
The annual statistics for 2014 for sulphur dioxide are shown in table 9.1.
None of the limit values (EU, 2008) were exceeded in 2015. In 2015 there was
no information to the public due to exceedance of the alert threshold for SO2
(one hour average 500 µg/m3).
Table 9.1. Annual statistics for SO2 in 2015. All parameters are calculated based on hourly average. The detection limit for the
monitors is a few µg/m3, which makes the average and median values encumbered with high relative uncertainties.
Unit: µg/m3 Number of
results Average year Average winter Median
98-percentile
Max. Hour
4th highest diurnal mean
Traffic:
Copenhagen/1103 8032 2.1 2.4 1.6 7.4 17.0 6.9
Aalborg/8151 § 0 - - - - - -
Limit values >7467* 20 20 350 125
*) 90% data capture of number of hourly measurements in relation to total number of hourly measurements in 2015 excluding hours used for calibration.
§) Aalborg/8151 (traffic) there is no data since the station has been shut down due to construction work at the site. It has not yet been possible to reinitiate the measurements at the street station in Aalborg.
52
9.2 Trends
The long term trends for sulphur dioxide are shown in figure 9.1. Since the
beginning of the 1980s the annual concentrations have decreased by more
than a factor of five due to effective national and international regulations of
the emissions. The emission reductions are due to use of effective cleaning
technologies in combination with decrease of the sulphur content in fuel.
Figure 9.1. Annual averages for SO2. Until 2001 the results were obtained using KOH im-
pregnated filters for collection of SO2. These measurements ceased in 2000. After 2000
the SO2 measurements have been carried out using SO2 monitors in order to monitor epi-
sodic results. The detection limit for the monitors is a few µg/m3, which makes the average
and median values encumbered with high relative uncertainties. The shift in level from
2000 to 2001 is due to shift of the methods. The station in Aalborg (traffic) has temporarily
been shut down due to construction work at the site. There is therefore no data from Aal-
Figure 11.1. Organic Carbon (OC), Elemental Carbon (EC) and the ratio of EC to total carbon
(EC/TC) at street (HCAB), semi-rural background (Risø), urban background (HCØ) and the
suburban site for residential wood combustion (Hvidovre).
0
1
2
3
4
5
2010 2011 2012 2013 2014 2015
OC
µg/
m3
Risø HCAB
0
1
2
3
4
5
2010 2011 2012 2013 2014 2015
EC µ
g/m
3
HCØ Hvidovre
Risø HCAB
0,0
0,2
0,4
0,6
2010 2011 2012 2013 2014 2015
EC/T
C
Risø HCAB
58
12 Chemical composition of PM2.5
In addition to the measurements of elemental and organic compounds, also
measurements of the main inorganic compounds in PM2.5 (NH4+, Na+, K+,
Ca2+, Mg2+, Cl-, NO3-, SO4
2-) have been conducted at H.C. Andersen’s Boule-
vard (HCAB, Copenhagen/1103) and Risø. These measurements are carried
out on the basis of the air quality directive from 2008 (EC, 2008). The method
is chemical analysis of the daily PM2.5 particle filters sampled using the
SM200 monitors.
Examples of the daily variations of the concentrations are shown in figure
12.1 together with the variation of PM2.5. For Na+ the annual average concen-
trations are similar at HCAB and Risø due to long range transport of sea salt.
For the winter months Na+ is higher at HCAB than Risø due to winter salt-
ing of the roads in Copenhagen. The variations of Cl- follow the variations of
Na+ because the main source is sea salt and winter salting. Mg2+ originates
only from sea salt and there are therefore similar concentrations at the two
stations throughout the year. SO42- and NH4
+ originate mainly from long
range transport and there are therefore only minor differences between the
two stations (figure 12.1). This is also the case for NO3- and K+. Ca2+ is in
general higher at HCAB than at Risø. This is due to road dust at HCAB since
asphalt contains large quantities of calcium.
The annual contributions to PM2.5 of the different compounds are shown in
figure 12.2. The annual average concentrations of NH4+, Na+, K+, Mg2+, Cl-,
NO3-, SO4
2- are very similar at the two stations, just as the daily variation.
The main variations between the two stations are for EC, OM (organic mat-
ter) and Ca2+ where the concentrations are higher at the street station com-
pared to the rural background station. This is mainly due to emissions of
these compounds from the traffic in Copenhagen. As in the previous year,
the unknown mass is higher at HCAB than at Risø. The mass of the un-
known is very uncertain because it is calculated from the difference between
PM2.5 and the sum of all the analysed constituents. The unknown mass is
water attached to the particles, dust (e.g. SiO2), heavy metals and other trace
constituents.
59
Figure 12.1. Daily variations of the concentrations of PM2.5, Na+, SO42-, NH4
+ and Ca2+ at
H.C. Andersens Boulevard (HCAB, Copenhagen/1103) and Risø in 2015. The large gap in
data for calcium on Risø is due to problems with filter material.
0,00
10,00
20,00
30,00
40,00
50,00
60,00
70,00
01
-01
-20
15
15
-01
-20
15
29
-01
-20
15
12
-02
-20
15
26
-02
-20
15
12
-03
-20
15
26
-03
-20
15
09
-04
-20
15
23
-04
-20
15
07
-05
-20
15
21
-05
-20
15
04
-06
-20
15
18
-06
-20
15
02
-07
-20
15
16
-07
-20
15
30
-07
-20
15
13
-08
-20
15
27
-08
-20
15
10
-09
-20
15
24
-09
-20
15
08
-10
-20
15
22
-10
-20
15
05
-11
-20
15
19
-11
-20
15
03
-12
-20
15
17
-12
-20
15
31
-12
-20
15
Co
nce
ntr
atio
n,
µg
/m3
Dato
HCAB
Risø PM2,5
0,00
0,50
1,00
1,50
2,00
2,50
3,00
01
-01
-20
15
15
-01
-20
15
29
-01
-20
15
12
-02
-20
15
26
-02
-20
15
12
-03
-20
15
26
-03
-20
15
09
-04
-20
15
23
-04
-20
15
07-0
5-2
015
21
-05
-20
15
04
-06
-20
15
18
-06
-20
15
02
-07
-20
15
16
-07
-20
15
30
-07
-20
15
13
-08
-20
15
27
-08
-20
15
10
-09
-20
15
24
-09
-20
15
08
-10
-20
15
22
-10
-20
15
05-1
1-2
015
19
-11
-20
15
03
-12
-20
15
17
-12
-20
15
31
-12
-20
15
Co
nce
ntr
atio
n,
µg
/m3
Dato
HCAB
RisøNa
0,00
1,00
2,00
3,00
4,00
5,00
6,00
01-0
1-2
015
15
-01
-20
15
29
-01
-20
15
12
-02
-20
15
26-0
2-2
015
12
-03
-20
15
26
-03
-20
15
09
-04
-20
15
23
-04
-20
15
07
-05
-20
15
21
-05
-20
15
04
-06
-20
15
18
-06
-20
15
02
-07
-20
15
16
-07
-20
15
30
-07
-20
15
13
-08
-20
15
27
-08
-20
15
10
-09
-20
15
24
-09
-20
15
08
-10
-20
15
22
-10
-20
15
05
-11
-20
15
19
-11
-20
15
03
-12
-20
15
17
-12
-20
15
31
-12
-20
15
Co
nce
ntr
atio
n,
µg
/m3
Dato
HCAB
Risø
SO4
0,00
1,00
2,00
3,00
4,00
5,00
6,00
01-0
1-2
015
15
-01
-20
15
29
-01
-20
15
12
-02
-20
15
26-0
2-2
015
12
-03
-20
15
26
-03
-20
15
09
-04
-20
15
23
-04
-20
15
07
-05
-20
15
21
-05
-20
15
04
-06
-20
15
18
-06
-20
15
02
-07
-20
15
16
-07
-20
15
30
-07
-20
15
13
-08
-20
15
27
-08
-20
15
10
-09
-20
15
24
-09
-20
15
08
-10
-20
15
22
-10
-20
15
05
-11
-20
15
19
-11
-20
15
03
-12
-20
15
17
-12
-20
15
31
-12
-20
15
Co
nce
ntr
atio
n,
µg
/m3
Dato
HCAB
RisøNH4
0,00
0,10
0,20
0,30
0,40
0,50
0,60
01-0
1-2
015
15-0
1-2
015
29-0
1-2
015
12-0
2-2
015
26-0
2-2
015
12-0
3-2
015
26-0
3-2
015
09-0
4-2
015
23-0
4-2
015
07-0
5-2
015
21-0
5-2
015
04-0
6-2
015
18-0
6-2
015
02-0
7-2
015
16-0
7-2
015
30-0
7-2
015
13-0
8-2
015
27-0
8-2
015
10-0
9-2
015
24-0
9-2
015
08-1
0-2
015
22-1
0-2
015
05-1
1-2
015
19-1
1-2
015
03-1
2-2
015
17-1
2-2
015
31-1
2-2
015
Concentr
ation,
µg/m
3
Dato
HCAB
Risø Ca
60
Figure 12.2. Annual average contributions to the chemical composition of PM2.5 at H.C.
Andersens Boulevard (HCAB, Copenhagen/1103) and Risø in 2015. Organic matter (OM)
has been estimated from the measured concentrations of OC (organic carbon) by multipli-
cation of OC with a factor of 1.5 for the fresh OM at HCAB and 2.1 for the aged OM at
HCAB and Risø, respectively (Turpin and Lim, 2001). This is in order to account for the
contribution of hydrogen, oxygen, nitrogen etc. to the mass of the organic compounds.
0
2
4
6
8
10
12
14
16
18
HCAB Risø
Co
nce
ntr
atio
n,
µg
/m3
Unknown mass
OM
EC
Ca
K
SO4
NO3
NH4
Mg
Cl
Na
61
13 References
Berkowicz, R., 2000a: OSPM - A parameterized street pollution model, Environmental Monitoring and Assessment 2000, 65, 323-331. doi: 10.1023/-A:1006448321977.
Berkowicz, R., 2000b: A simple model for urban background pollution, Environmental Monitoring and Assessment 2000, 65, 259-267. doi: 10.1023/-A:1006466025186.
Brandt, J., Christensen, J.H., Frohn, L.M., Berkowicz, R. & Palmgren, F. 2000: The DMU-ATMI THOR Air Pollution Forecast System: System De-scription, National Environmental Research Institute, Roskilde Denmark 60 pp. -NERI Technical Report No. 321.
Brandt, J., Christensen, J.H., Frohn, L.M. & Berkowicz, R., 2003: Air pol-lution forecasting from regional to urban street scale – implementation and validation for two cities in Denmark. Physics and Chemistry of the Earth, Vol. 28, pp. 335-344.
Brandt, J., Christensen, J.H. Frohn, L.M. Palmgren, F. Berkowicz R. & Zlatev, Z., 2001: Operational air pollution forecasts from European to lo-cal scale. Atmospheric Environment, Vol. 35, Sup. No. 1, pp. S91-S98.
Brandt, J., Silver, J.D., Frohn, L.M., Geels, C., Gross, A., Hansen, A.B., Hansen, K.M., Hedegaard, G.B., Skjøth, C.A., Villadsen, H., Zare, A. & Christensen, J.H., 2012: An integrated model study for Europe and North America using the Danish Eulerian Hemispheric Model with focus on in-tercontinental transport, Atmospheric Environment, Volume 53, June 2012, pp. 156-176, doi:10.1016/j.atmosenv.2012.01.011.
Christensen, J.H., 1997: The Danish Eulerian Hemispheric Model – a three-dimensional air pollution model used for the Arctic, Atm. Env., 31, 4169–4191.
EC, 1999: Directive 1999/30/EC of 22 April 1999 relating to limit values for sulphur dioxide, nitrogen dioxide and oxides of nitrogen, particulate matter and lead in ambient air. J. Europ. Commun. L163/41.
EC, 2005: Directive 2004/107/EC of the European Parliament and of the Council of 15 December 2004 relating to arsenic, cadmium, mercury, nickel and polycyclic aromatic hydrocarbons in ambient air. Official Journal of the European Union L23/3.
EC, 2008: Directive 2008/50/EC of the European Parliament and of the Council of 15 December 2004 on ambient air quality and cleaner air for Europe: Official Journal of the European Union L152/1.
Ellermann, T., Ketzel, M., Winther, M., & Nordstrøm, C., 2012: Foreløbi-ge resultater for NO2 i 2011 og vurdering af årsag til de høje koncentrati-oner på H.C. Andersens Boulevard. Thomas Ellermann, Notat til Miljø-styrelsen 31. januar 2012, 7 s. Available at: http://dce.au.dk/fileadmin/dmu.au.dk/Notat_NO2_2011.pdf
Ellermann, T., Wåhlin, P., Nordstrøm, C., & Ketzel, M. 2010: Vejbelæg-ningens indflydelse på partikelforureningen (PM10) på stærkt trafikerede gadestrækninger i Danmark. Paper presented at Trafikdage 2010, Uni-versity of Aalborg; Aalborg, Denmark. August 2010. Paper. Available at: http://www.trafikdage.dk/papers_2010/380_ThomasEllermann.pdf
Ellermann, T., Nøjgaard, J.K. & Bossi, R. 2011: Supplerende målinger til luftovervågning under NOVANA – benzen og PAH. Aarhus Universitet, DCE – Nationalt Center for Miljø og Energi. 42 s. – Teknisk rapport fra DCE – Nationalt Center for Miljø og Energi nr. 3
Ellermann, T., Nøjgaard, J.K., Nordstrøm, C., Brandt, J., Christensen, J., Ketzel, M., Jansen, S., Massling, A. & Jensen, S.S. 2013: The Danish Air Quality Monitoring Programme. Annual Summary for 2012. Aarhus University, DCE – Danish Centre for Environment and Energy. 59 pp. Scientific Report from DCE – Danish Centre for Environment and Ener-gy. No. 67.
Ellermann, T., Brandt, J., Jensen, S.S., Hertel, O., Løfstrøm, P., Ketzel, M., Olesen, H.R. & Winther, M. 2014: Undersøgelse af de forøgede koncen-trationer af NO2 på H.C. Andersens Boulevard. Aarhus Universitet, DCE – Nationalt Center for Miljø og Energi, 100 s. - Videnskabelig rapport fra DCE - Nationalt Center for Miljø og Energi nr. 111.
Ellermann, T., Nøjgaard, J.K., Nordstrøm, C., Brandt, J., Christensen, J., Ketzel, M. Jansen, S., Massling, A. & Jensen, S.S. 2015: The Danish Air Quality Monitoring Programme. Annual Summary for 2013. Aarhus University, DCE – Danish Centre for Environment and Energy, 72 pp. Scientific Report from DCE – Danish Centre for Environment and Energy No. 134
EN 12341-2014: Ambient air. Standard gravimetric measurement method for the determination of the PM10 or PM2,5 mass concentration of sus-pended particulate matter.
EN 12341-1998: Air quality - Determination of the PM 10 fraction of sus-pended particulate matter - Reference method and field test procedure to demonstrate reference equivalence of measurement methods.
EN 14907-2005: Ambient air quality. Standard gravimetric measurement method for the determination of the PM2,5 mass fraction of suspended particulate matter.
Grell, G.A., Dudhia, J. & Stauffer, D.R., 1995: A description of the fifth-generation Penn State/NCAR Mesoscale Model (MM5). Mesoscale and Mi-croscale Meteorology Division, National Centre for Atmospheric Research, Boulder, Colorado, USA. NCAR Technical Note, NCAR/TN-398+STR, pp. 114.
Harrison, D. 2006: UK Equivalence Programme for Monitoring of Partic-ulate Matter. Report BV/AQ/AD202209/DH/2396 Bureau Veritas Lon-don, England (for: Defra http://www.airquality.co.uk/archive/reports/cat05/0606130952_UKPMEquivalence.pdf)
Jensen, S.S., Berkowicz, R., Hansen, H. Sten. & Hertel, O. 2001: A Danish decision-support GIS tool for management of urban air quality and hu-man exposures. Transportation Research Part D: Transport and Envi-ronment, Volume 6, Issue 4, 2001, pp. 229-241.
Jensen, S.S., Ketzel, M., Nøjgaard, J.K. & Becker, T. 2011: Hvad er effek-ten af miljøzoner for luftkvaliteten? - Vurdering for København, Frede-riksberg, Aarhus, Odense, og Aalborg. Slutrapport. Danmarks Miljøun-dersøgelser, Aarhus Universitet 110 s. – Faglig rapport nr. 830. Available at: http://www.dmu.dk/Pub/FR830.pdf
Ketzel, M., Jensen, S.S, Brandt, J., Ellermann, T., Olesen, H.R., Berkowicz, R. & Hertel, O. 2013: Evaluation of the Street Pollution Model OSPM for Measurements at 12 Streets Stations Using a Newly Developed and Freely Available Evaluation Tool. J Civil Environ Eng, S1:004. doi:10.4172/2165-784X.S1-004
Miljøministeriet, 2010: Bekendtgørelse om vurdering og styring af luft-kvaliteten. Bekendtgørelse nr. 851 af 30.06.2010 (In Danish). Ministry of Environment; Copenhagen, Denmark.
Ottosen, T-B., Kakosimos, K. E., Johansson, C., Hertel, O., Brandt, J., Skov, H., Berkowicz, R., Ellermann, T., Jensen, S. S. & Ketzel, M. (2015): Analysis of the impact of inhomogeneous emissions in a semi-parameterized street canyon model. I : Geoscientific Model Development Discussions. 8, 3231–3245, 2015. cdoi:10.5194/gmd-8-3231-2015.
Plejdrup, M.S. & Gyldenkærne, S., 2011: Spatial distribution of emissions to air – the SPREAD model. National Environmental Research Institute, Aarhus University, Denmark. 72 pp. – NERI Technical Report no. FR823. Available at: http://www.dmu.dk/Pub/FR823.pdf
Turpin, B.J. & Lim, H.-J., 2001: Species Contributions to PM2.5 Mass Concentrations: Revisiting Common Assumptions for Estimating Organ-ic Mass, Aerosol Science and Technology, 35: 1, 602 — 610, First pub-lished on: 30 November 2010 (iFirst). DOI: 0.1080/02786820119445URL. Available at: http://dx.doi.org/10.1080/02786820119445
WHO, 2000: Air Quality Guidelines for Europe, Second Edition, WHO Regional Publications, European Series, No. 91, Copenhagen 2000. Availabel at: http://www.euro.who.int/air
NO and partly NO2 are formed by combustion at high temperatures. The
main sources are power plants and traffic. At the street stations the traffic is
the main source. The application of catalytic converter in the exhaust reduc-
es the emission considerably. NO is relatively harmless, but NO2 can cause
respiratory problems.
Most of the NO2 in the urban atmosphere is produced by oxidation of nitro-
gen monoxide (NO) by ozone (O3). The reaction will take place immediately,
if sufficient O3 is present. O3 is often the limiting component for a complete
oxidation in the street canyons, but practically all NO is oxidised at the ur-
ban background and rural stations. Within a few hours the NO2 is further
oxidised to nitrate and/or nitric acid, which may cause acid precipitation
and eutrophication. NO2 is a toxic gas, which may cause respiratory prob-
lems. There are limit values for the allowed concentration of NO2 in the at-
mosphere.
O3 is formed by photochemical reactions (i.e. by the influence of sunlight)
between nitrogen oxides and volatile organic compounds (VOC’s). The
VOC’s can be of natural and anthropogenic origin. The major part of the O3
measured in Denmark originates from sources outside the country. Usually
the highest concentrations are found at rural and urban background sites. O3
is removed by NO at street level. O3 is a toxic gas, which may cause respira-
tory problems and damage on crops and forests. There are so-called target
values for the concentration of O3 in the atmosphere.
The main source of CO in urban air is petrol-fuelled cars. The CO is formed
due to incomplete combustion. The application of catalytic converter in the
exhaust reduces the emission considerably. CO is only slowly removed from
the atmosphere. CO is a toxic gas that may prevent the uptake of oxygen in
the blood. There are limit values for the allowed concentration of CO in the
atmosphere.
Benzene is present in petrol. It may also be formed in engines due to incom-
plete combustion. Since 1994 the benzene content in petrol has been reduced
by up to a factor of 5. The concentration in the atmosphere has been reduced
correspondingly. Benzene is a carcinogenic gas. There is a limit value for the
average content in the atmosphere.
Many different VOC’s are present in the air. Several of these are emitted by
incomplete combustion in e.g. engines and wood burning stoves. Several of
the VOC’s are carcinogenic. A “target value” is implemented through an EU
Council Directive in 2004 for Benzo[a]-pyrene as indicator for PAH (Polycy-
clic Aromatic Hydrocarbones).
65
The main sources for PM10 and PM2.5 are combustion and resuspended dust.
PM are also produced by chemical reactions in the atmosphere e.g. oxidation
of nitrogen dioxide, sulphur dioxide and VOC. The submicron particles,
which are formed by combustion and chemical reactions in the atmosphere,
are suspected to be the most harmful for the health. There are still a lack of
knowledge about the connection between health effects and particle size.
Limit values for the PM10 concentration in the atmosphere are implemented
at present.
PM10 and PM2.5 is measured using three different methods in the monitori-
ong program:
The Beta method: The particles are collected on filters for 24 hours inter-
vals. The mass on the filters is automatic determined by measurements in
the instrument of β-absorption in the filter with sampled dust. This
method is considered to be equivalent to the reference method (EN
12341:1999 and EN14907:2005).
The LVS method: The particles are collected on filters for 24 hour inter-
vals by a low volume sampler (LVS). The mass on the filters is subse-
quently determined in the laboratory by gravimetric measurements of
the dust. This method is the current reference method for the determina-
tion of the PM10 or PM2.5 mass concentration of suspended particulate
matter in ambient air (EN 12341: 2014, into which the previous standards
for PM10, EN 12341: 1998, and for PM2.5, EN 14907:2005, have been
merged).
The TEOM method: The particles are continuously collected on a “ta-
pered oscillating microbalance” (TEOM) and heated to 50°C. During heat-
ing volatile compounds may evaporate. The loss will be most pro-
nounced for “secondary aerosols” containing ammonium nitrate. PM re-
sults are given with a time resolution as ½-hourly averages.
There are a number of different heavy metals (HM) in the atmosphere. They
are emitted from e.g. coal and oil fired power plants, waste incinerators and
industries. HM’s may also be emitted from traffic due to wear on engines,
tires and brake pads. Several HM’s are toxic even in low concentrations and
a few also carcinogenic. A limit value is implemented for lead. Target values
are values are implemented for arsenic, cadmium, nickel and mercury.
WHO has proposed guideline values for the toxic non-carcinogenic and es-
timated life time risks for the carcinogenic HM’s.
Sulphur dioxide (SO2) is formed by burning of fossil fuel and biomass. The
SO2 is oxidised in the atmosphere to particulate sulphuric acid and sulphate.
The conversion time depends strongly on the temperature and humidity in
the air. It is typically of the order of one day. Sulphuric acid contributes to
“acid rain” and the deposition of sulphate causes damage to sensitive eco-
systems. Since the beginning of the 1980’thies the reduction of sulphur in
fossil fuel and improved flue gas cleaning has reduced the concentration of
SO2 with one order of magnitude. SO2 may cause respiratory problems.
There are limit values for the allowed concentration of SO2 in the atmos-
phere.
THE DANISH AIR QUALITY MONITORING PROGRAMMEAnnual Summary for 2015
The air quality in Danish cities has been monitored conti-nuously since 1981 within the Danish Air Quality Monitoring network. The aim is to follow the concentration levels of toxic pollutants in the urban atmosphere and to provide the necessary knowledge to assess the trends, to perform source apportionment, and to understand the governing processes that determine the level of air pollution in Den-mark. In 2015 the air quality was measured in four Danish cities and at two background sites. In addition model calculations were carried out to supplement the measu-rements. At one street station (H.C. Andersens Boulevard) in Copenhagen NO2 was found in concentrations above the EU limit value while NO2 levels in Odense, Aarhus and Aalborg were below the limit value. Model calculations indicate exceedances of the NO2 limit value at several streets in Copenhagen. Annual averages of PM10 and PM2.5 were below limit values at all stations and the ave-rage exposure indicator (PM2.5 in urban background) has decreased with about 20% since 2010. The concentrations for most pollutants have been decreasing during the last decades.