35
Provenance and Uncertainty in Human Terrain Visual Analytics Kai Xu Middlesex University, UK
| Date post: | 14-Jul-2015 |
| Category: |
Technology |
| Upload: | kai-xu |
| View: | 467 times |
| Download: | 0 times |
Provenance and Uncertainty in Human Terrain Visual Analytics
Kai Xu
Middlesex University, UK
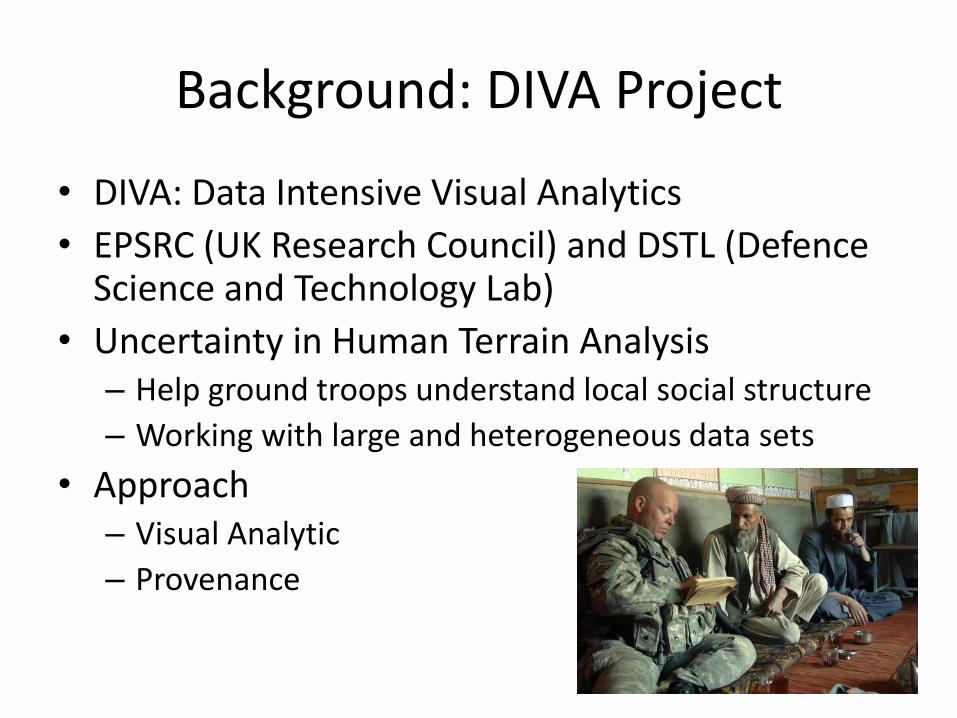
Background: DIVA Project
• DIVA: Data Intensive Visual Analytics
• EPSRC (UK Research Council) and DSTL (Defence Science and Technology Lab)
• Uncertainty in Human Terrain Analysis – Help ground troops understand local social structure
– Working with large and heterogeneous data sets
• Approach – Visual Analytic
– Provenance
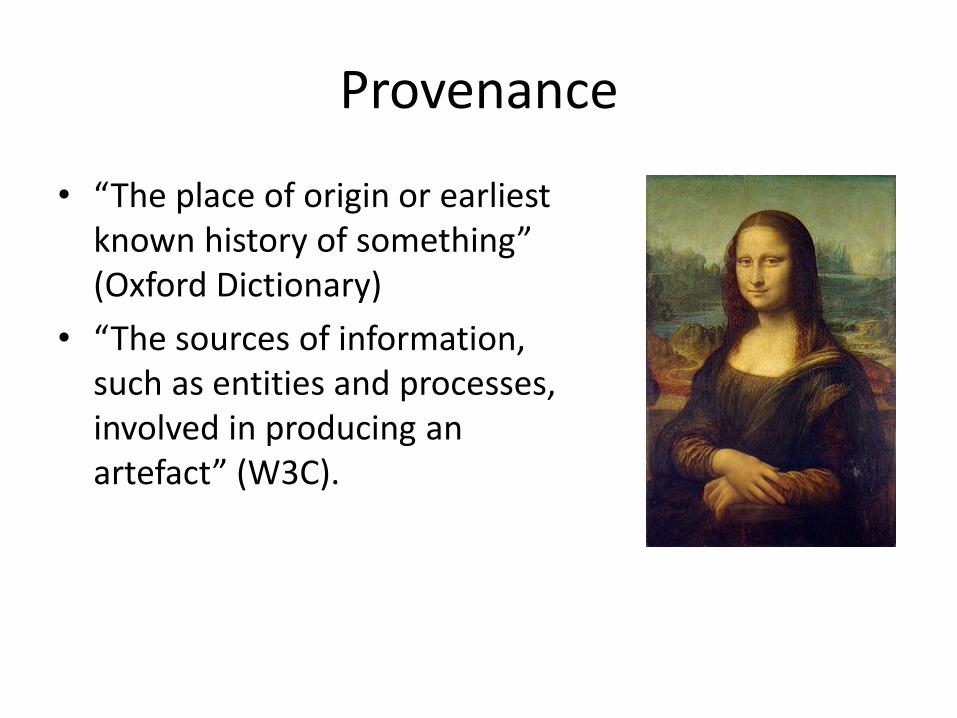
Provenance
• “The place of origin or earliest known history of something” (Oxford Dictionary)
• “The sources of information, such as entities and processes, involved in producing an artefact” (W3C).
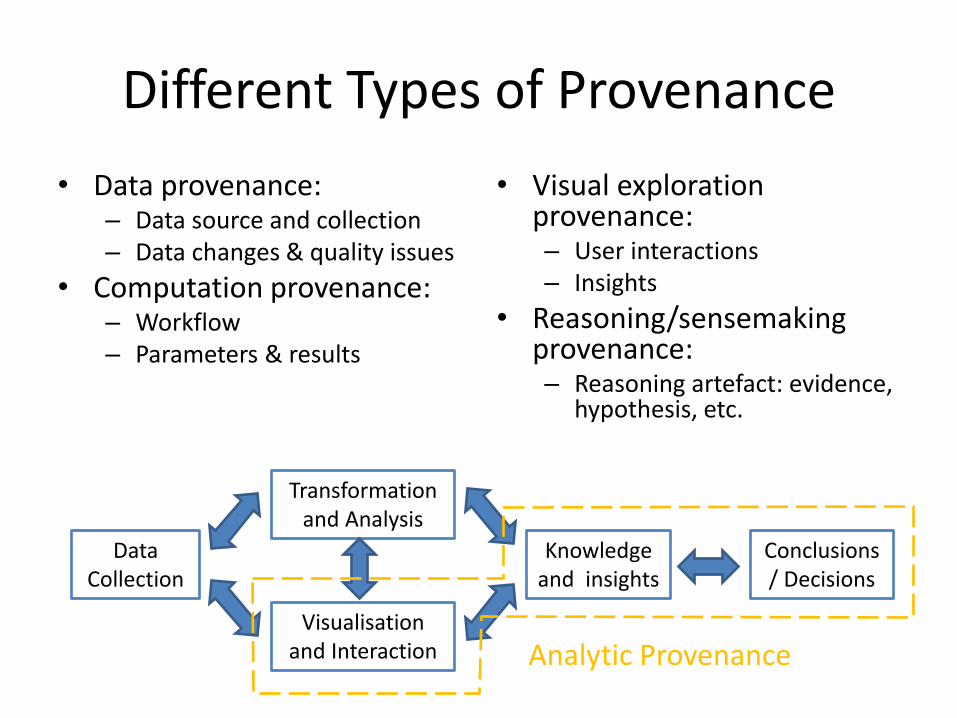
Different Types of Provenance
• Data provenance: – Data source and collection – Data changes & quality issues
• Computation provenance: – Workflow – Parameters & results
• Visual exploration provenance: – User interactions – Insights
• Reasoning/sensemaking provenance: – Reasoning artefact: evidence,
hypothesis, etc.
Data Collection
Transformation and Analysis
Visualisation and Interaction
Knowledge and insights
Conclusions / Decisions
Analytic Provenance
Why Provenance?
• Provide the ‘context’ of – Data and analysis – Reasoning and decision
• Reproducibility – Trace the source – Automatic update
• Help others understand the process – Collaboration – Reporting
• Data/analysis quality – Missing data, errors,
and uncertainty – Computational analysis
artefacts – Human reasoning bias
• Trust – Understanding of data,
analysis, and reasoning helps build the trust
DIVA Project - Details
• Process for this project (participatory design)
• Schema for data and provenance (ProveML)
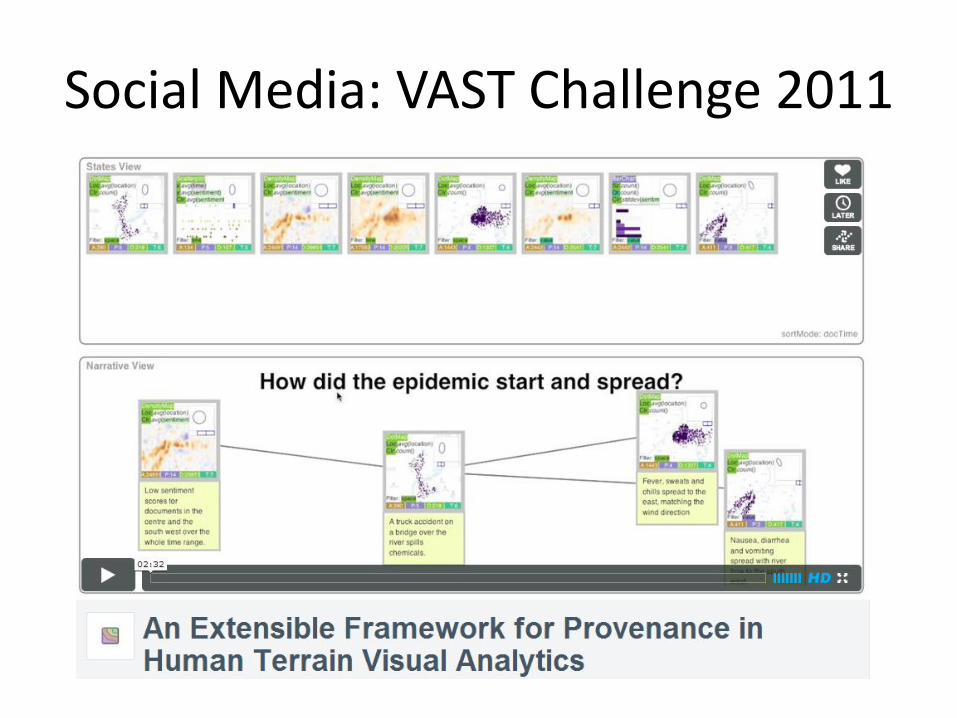
• Prototype system for HTVA
• Constructing narratives
• Demo/Video
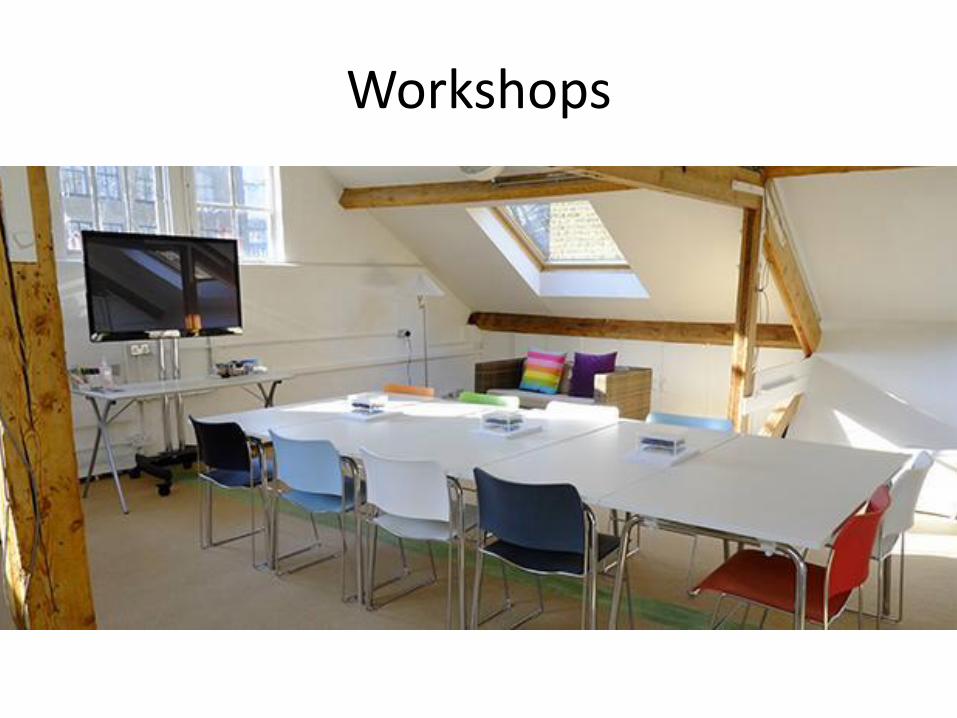
Workshops
Requirements: Data Characteristics
• Semi-structured
• Clear language
• Different perspectives
• Synthesized or derived data
Requirements: Uncertainty Types
• Source uncertainty
• Collection bias
• Spoofing or astroturfing
• Automated extraction of information

• Process for this project
• Schema for data and provenance
• Prototype system for HTVA
• Constructing narratives
• Demo/video
Place
Theme
Document
Write
Author Time
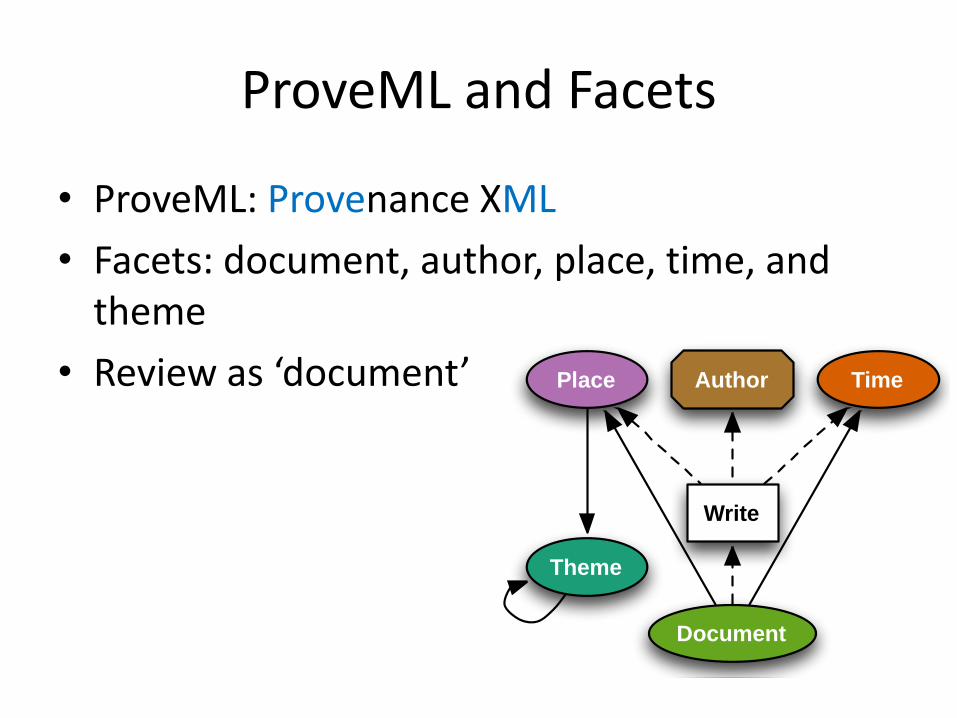
ProveML and Facets
• ProveML: Provenance XML
• Facets: document, author, place, time, and theme
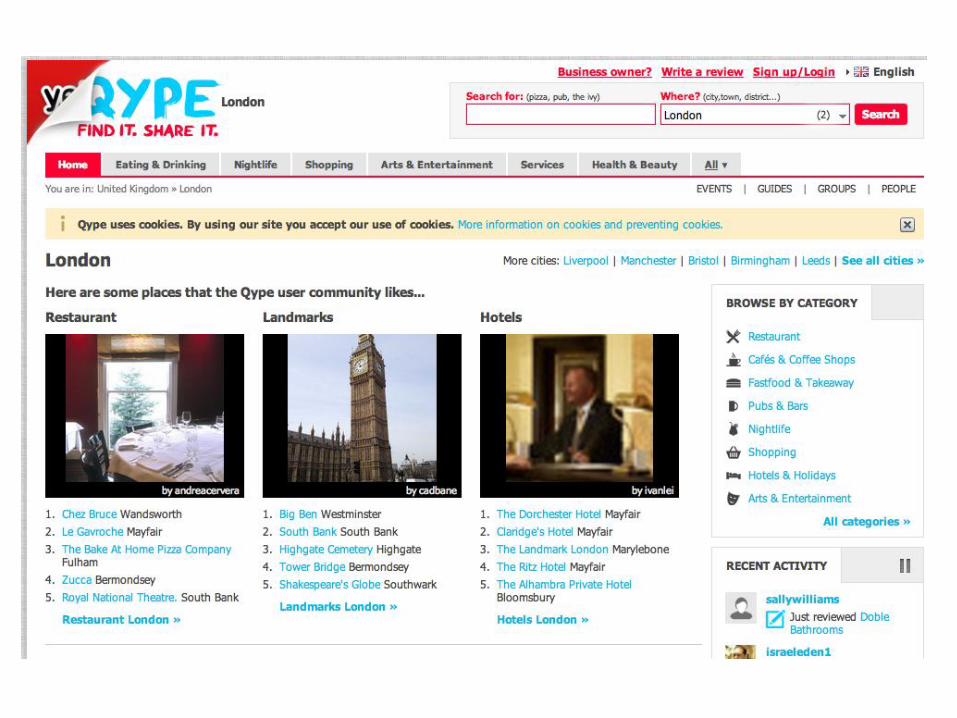
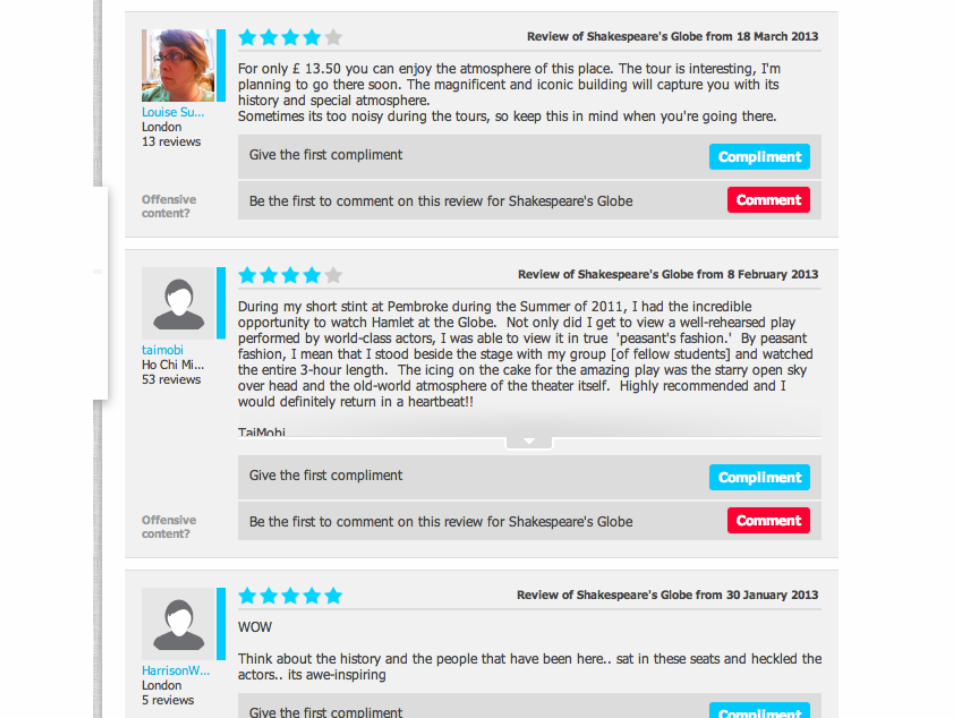
• Review as ‘document’

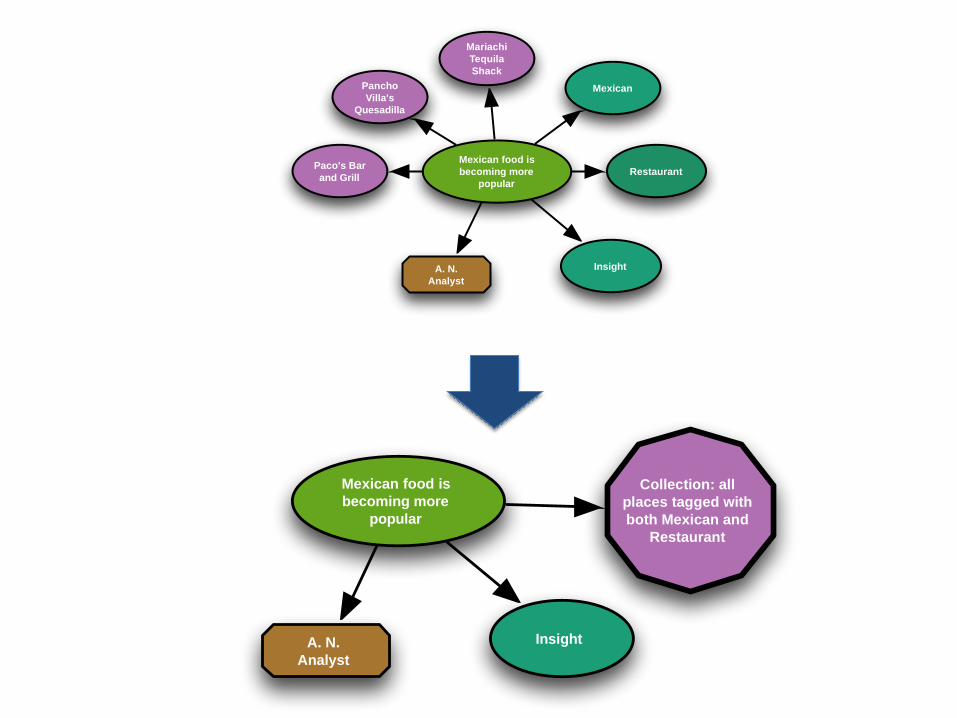
Insight as ‘Document’
Mexican food is
becoming more
popular
Mexican
Paco's Bar
and GrillRestaurant
Pancho
Villa's
Quesadilla
Mariachi
Tequila
Shack
A. N.
Analyst
Insight
Place
Theme
Document
Write
Author Time
Reviews & insights ↔ A ProveML graph
Mexican food is
becoming more
popular
A. N.
Analyst
Insight
Collection: all
places tagged with
both Mexican and
Restaurant
Mexican food is
becoming more
popular
Mexican
Paco's Bar
and GrillRestaurant
Pancho
Villa's
Quesadilla
Mariachi
Tequila
Shack
A. N.
Analyst
Insight
• Process for this project
• Schema for data and provenance
• Prototype system for HTVA
• Constructing narratives
• Demo/video
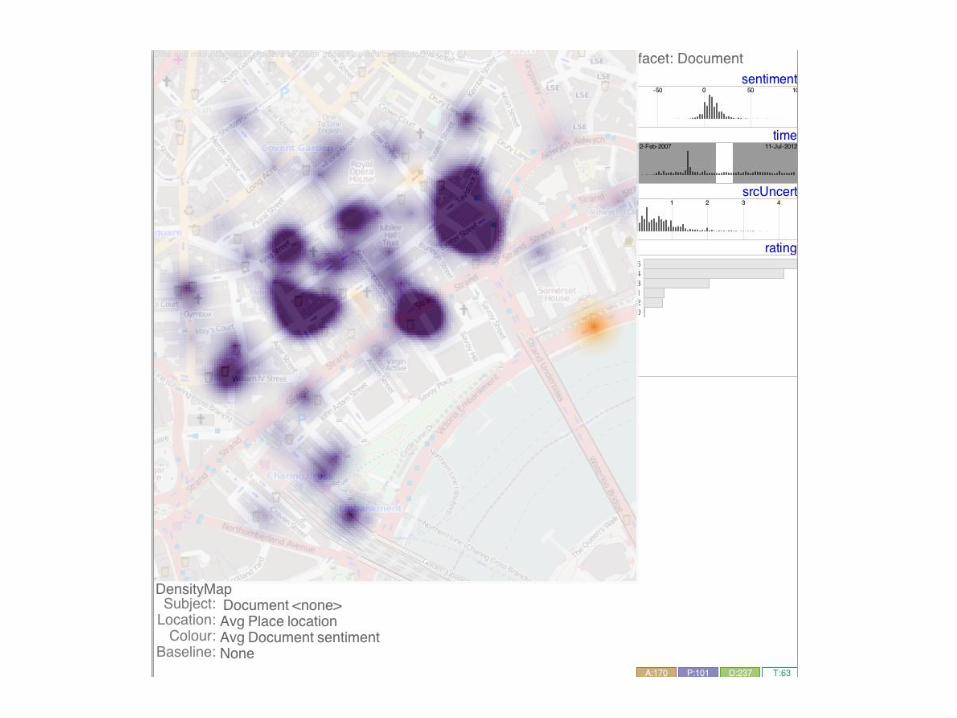
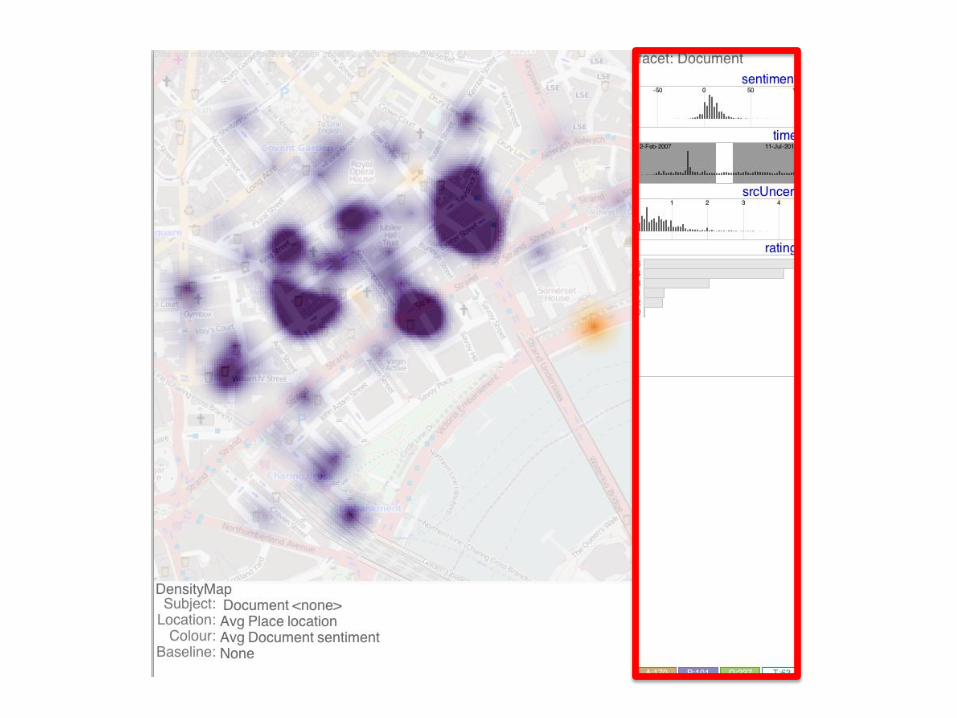
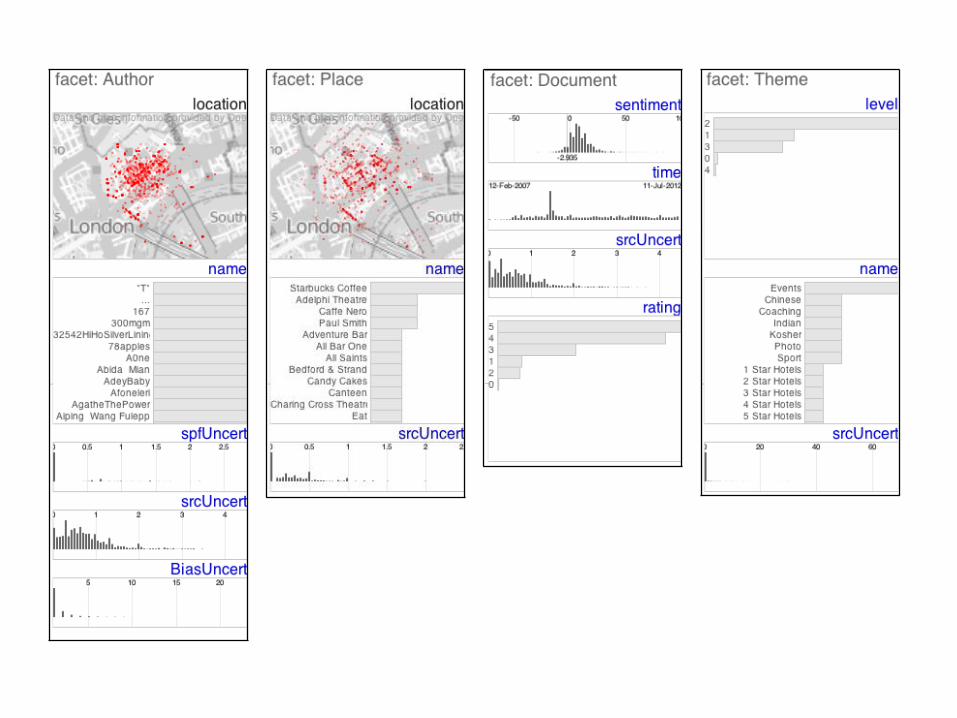
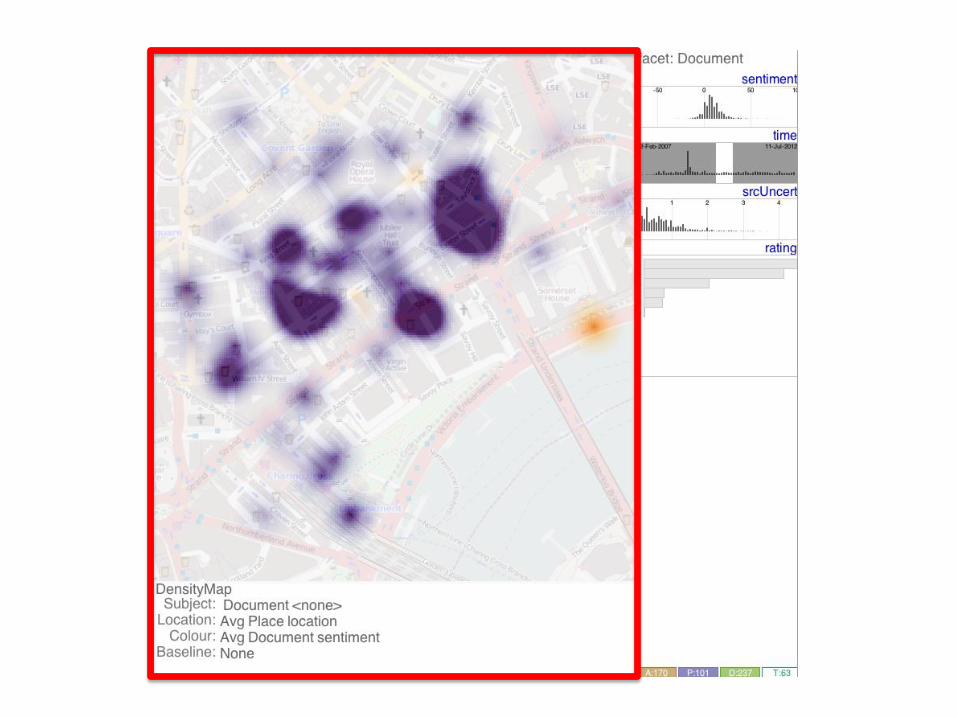
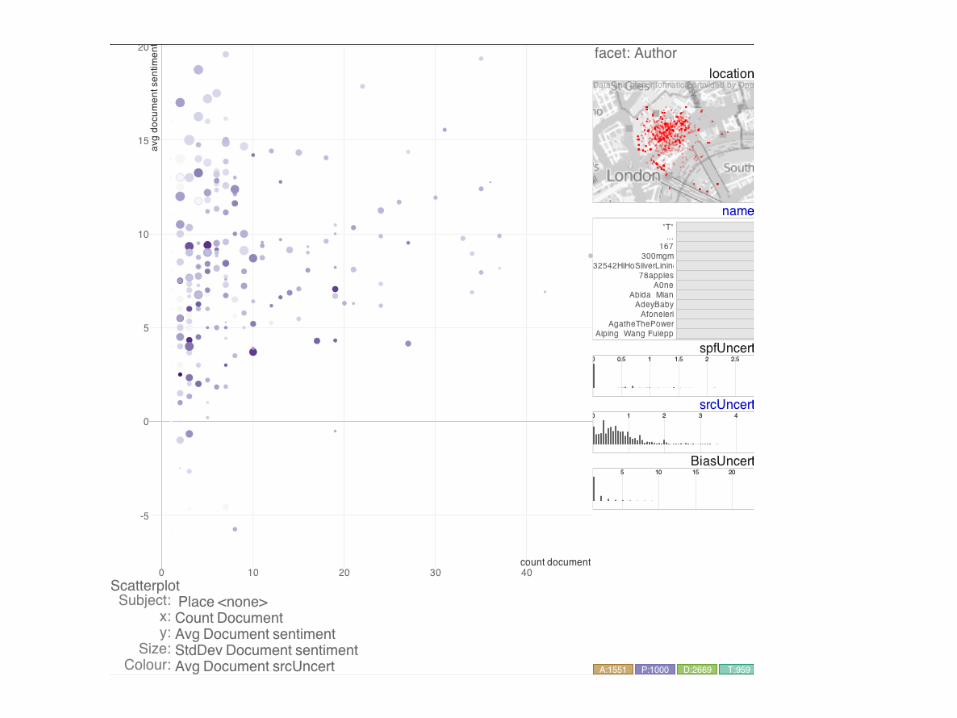
Fig. 3: Screenshots of the HTVA prototype with visual summaries of the attributes for a particular facet on the right and mappings betweenvisual variables and facet attributes at the bottom of each of the three screen shots. Left: scatterplot of places showing the relationship betweenvarious documents’ attributes (count: x, average sentiment: y, standard deviation of sentiment: size and average source uncertainty: colour).Middle: density map of document sentiment (purple=positive; orange=negative), constrained to a document time range; Right: Dot map ofplaces, coloured by their average document rating and sized by the standard deviation of this (a rudimentary indication of the degree to whichviews about a placeconflict).
Fig. 4: Summary graphics showing the distribution of values for eachattribute in each of the facets of (from left to right) of author, place,document and theme using dot maps for spatial data, bar charts ofcounts for categorical data and frequency histograms for continuousnumerical data, including time.
To help determine best practice, we also looked at what othershad done with similar data. OpinionSeer [50] uses a combination ofscatterplots and radial visualization to support the analysis of reviewdata from TripAdvisor.com. Wu et al. [50] use the same data sourceto demonstrate modelling of uncertainty propagation in an analysis.Chen et al. [5] usetext analysisand coordinated multipleviewsin theiranalysis of reviews of a book from amazon.com and Oelke et al. [33]extract discriminating features from reviews on amazon to generatesummary reviews and correlation plots.
6.1 Overview
Our design wasguided by theaspirationsand guiding principles iden-tified in therequirementsworkshop. Theideaof a ‘Digital Recce’ cou-pled with the ‘ rich graphical overviews’ demonstrated astrong interestin rich overviews that show the distribution and range of the data. The‘ rapid and dynamic filtering’ guiding principle showed the value DAsattached to exploratory techniques in which different aspects of datacan be rapidly and visually explored. ‘ Intuitive’ and ‘aesthetically-pleasing’ were also considered important characteristics.
The way in which we abstracted data into facets (section 5) alsoinformed the design. This abstraction allowed us to use the surrogatedataset in a way that directly maps onto the DAs’ data. In the sameway, basing our design around facets enabled the DAs to map the vi-sual analysis techniques to their context – an important way in whichwe ensure our work remains applicable. Each facet has attributes:name and location for author and place; text, rating and sentiment fordocument; and name and level for theme. We chose not to make ref-erence to the time facet in our HTVA prototype, instead making it anattributeof thedocument facet, but theapplication readsand writes thetime facet in ProveML accordingly, demonstrating the flexible way inwhich applications can be developed to use our faceted data.
In line with these requirements – and others from the workshop –the HTVA prototype allows graphics to be generated rapidly. Ana-lysts can select attributes from the various facets to be plotted using anumber of visualization types. Each visualization type uses one of thefacets as its subject and allows visual variables to be mapped as persection 6.3. For example, thescatterplot in Fig. 3 (left) hasplace as itssubject – here dots in this visualization type represent places. Facetedoverviews that show the distribution of attribute values for each facettype and allow them to befiltered are described in section 6.2.
6.2 Faceted overviews
Faceted overviews as shown on the right hand side of the screenshotsin Fig. 3 show the characteristics of facets. These are used to showglobal distributions of values for each attribute for the author, place,document and theme facet types in Fig 4. The summary graphic typefor each attribute depends on the attribute type: a map for location in-formation, a bar chart for categorical data and a frequency histogramfor continuous quantitative data, including time. Each of these sum-mary graphics iszoomable with databeing appropriately rebinned on-the-fly. In addition to their other attributes, each facet type has a mea-sureof sourceuncertainty, helping addressthelack of uncertainty visu-alization in existing systems identified in the requirements workshop.Thefacet overview isdisplayed on theright of thescreen in theHTVAprototype (Fig. 3) and the user can choose which of these to display.
6.3 Constructing a graphic
To facilitate the flexible and interactive construction of graphics [44],weallow theanalyst to map dataattributesfrom any of thefacetsto vi-sual variables. Thismechanism isbased on theconcept of configuringlayouts to address research questions as implemented in HiDE [42],but we extend this work by allowing attributes from different facetsto be used; for example, in Figure 3 (right), we size place facets by
• Process for this project
• Schema for data and provenance
• Prototype system for HTVA
• Constructing narratives
• Demo/Video
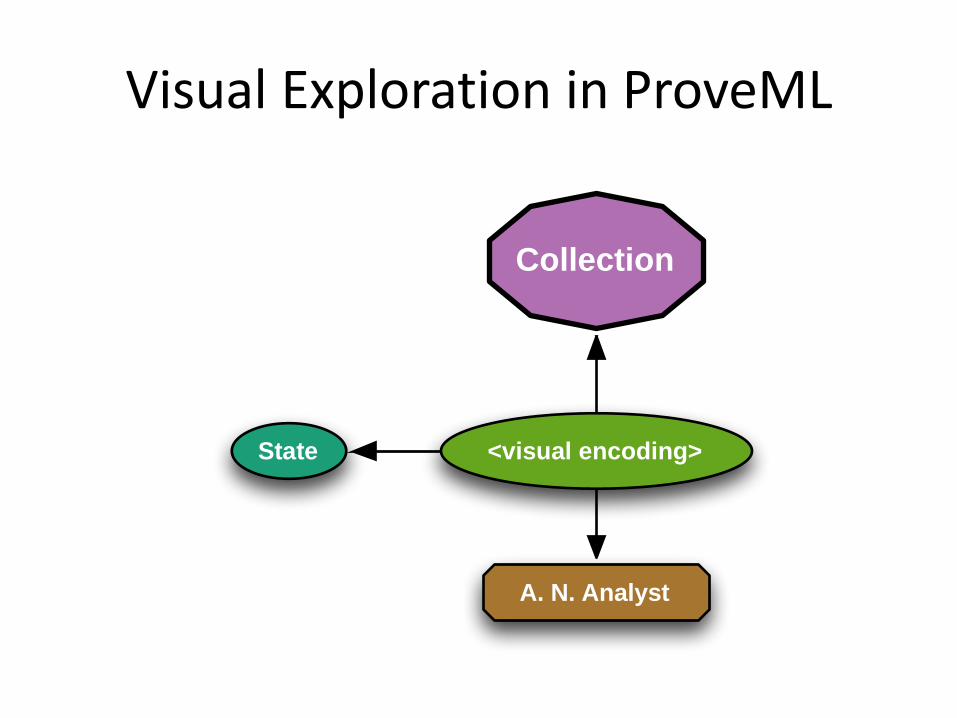
Collection
<visual encoding>
A. N. Analyst
State
Visual Exploration in ProveML
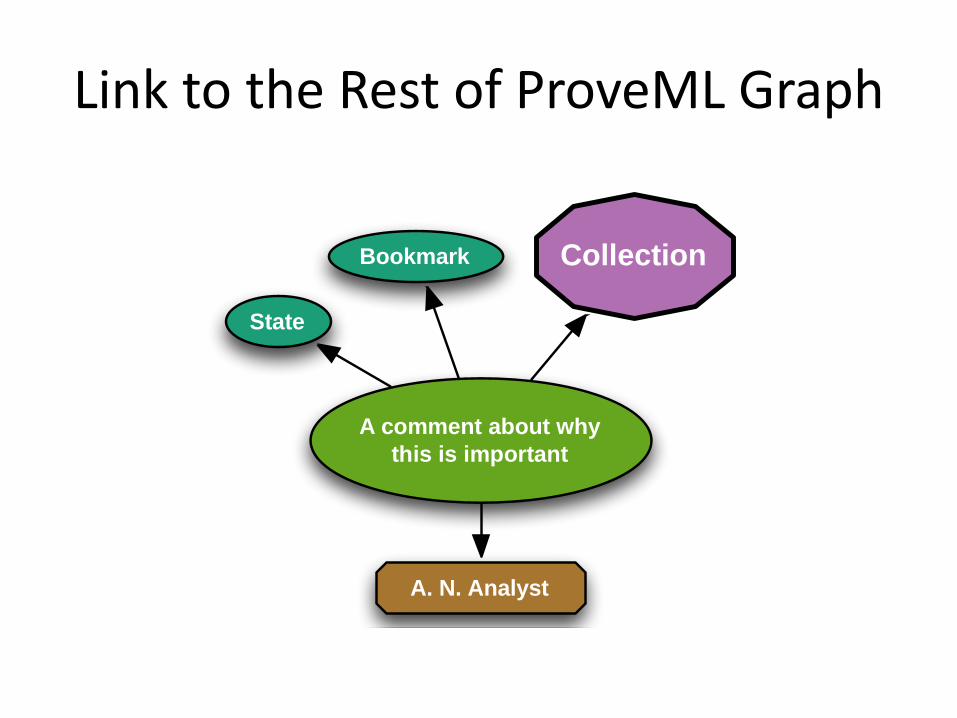
Collection
A comment about why
this is important
A. N. Analyst
Bookmark
State
Link to the Rest of ProveML Graph

Visual Summary of a State
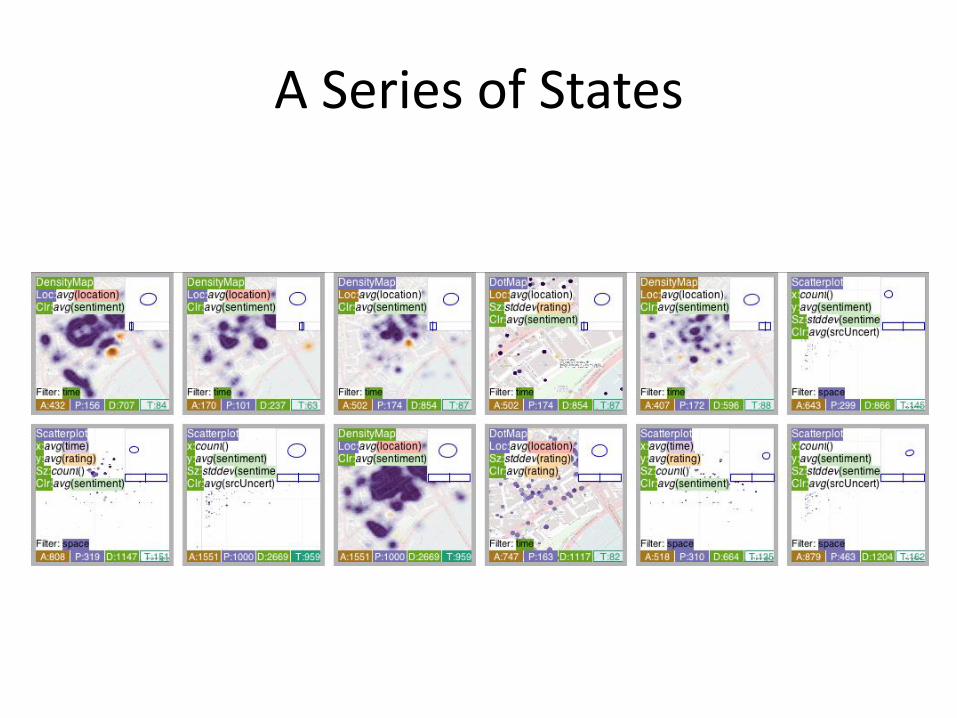
A Series of States
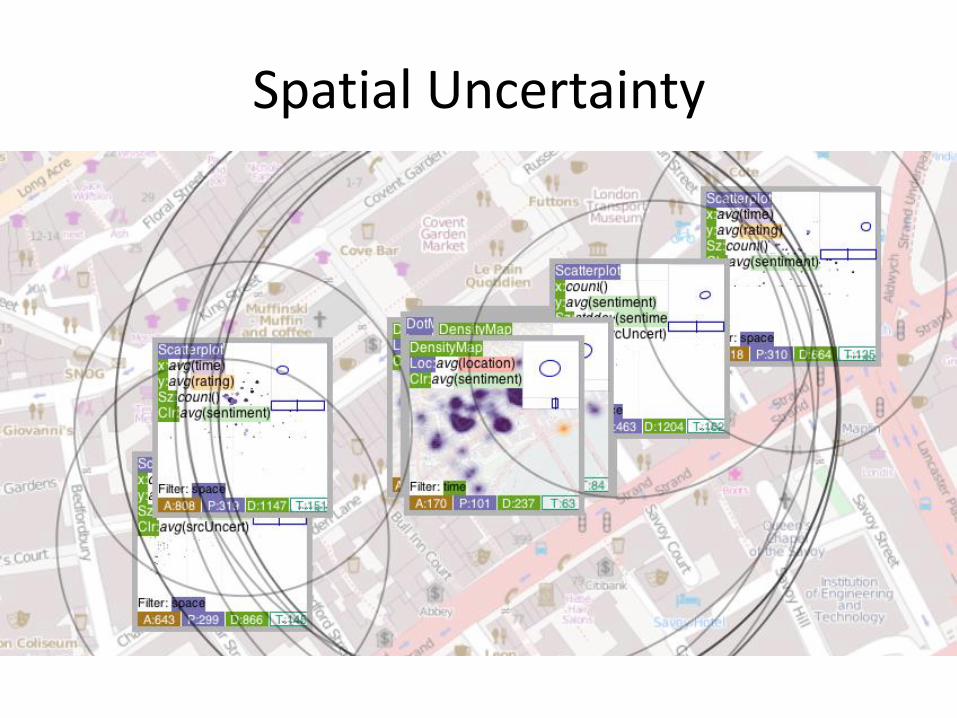
Spatial Uncertainty
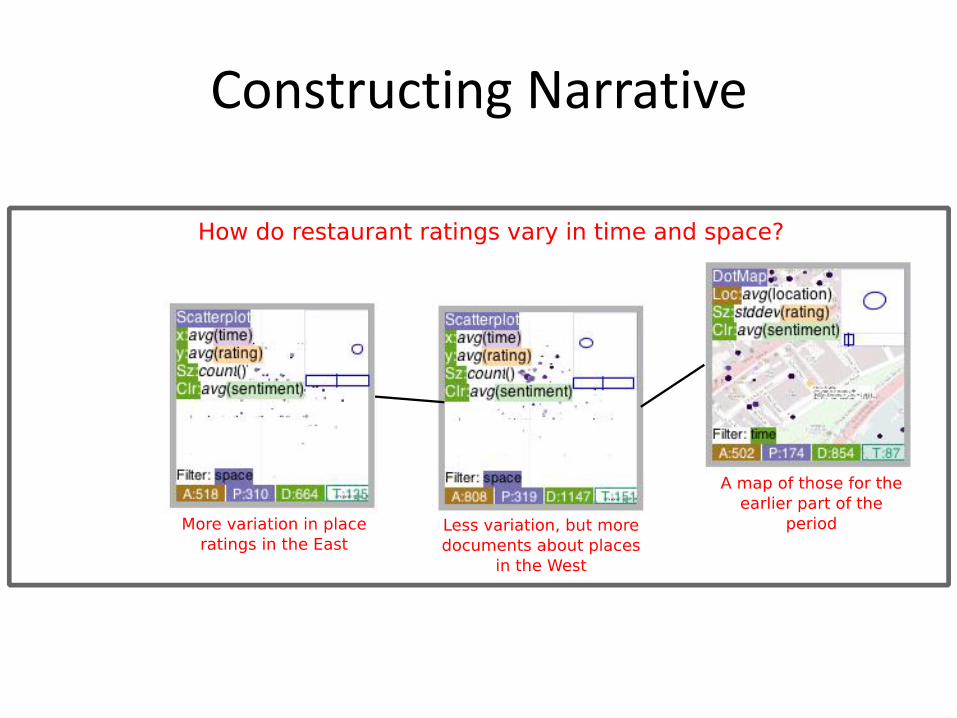
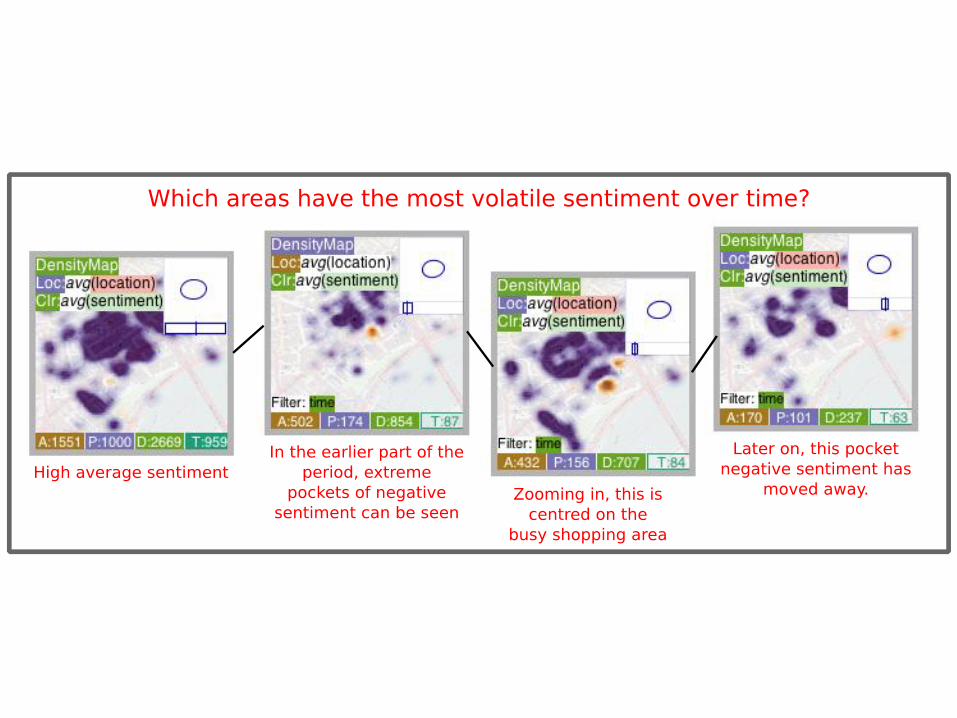
Constructing Narrative
• Process for this project
• Schema for data and provenance
• Prototype system for HTVA
• Constructing narratives
• Demo/Video
Conclusions and Future Work
• Framework for provenance and uncertainty in Human Terrain Analysis
• Some confidence that our work is relevant and directly related to Dstl requirements
• Try ProveML with other data sets
• Semantically-rich provenance in the future: infer analyst intent from actions
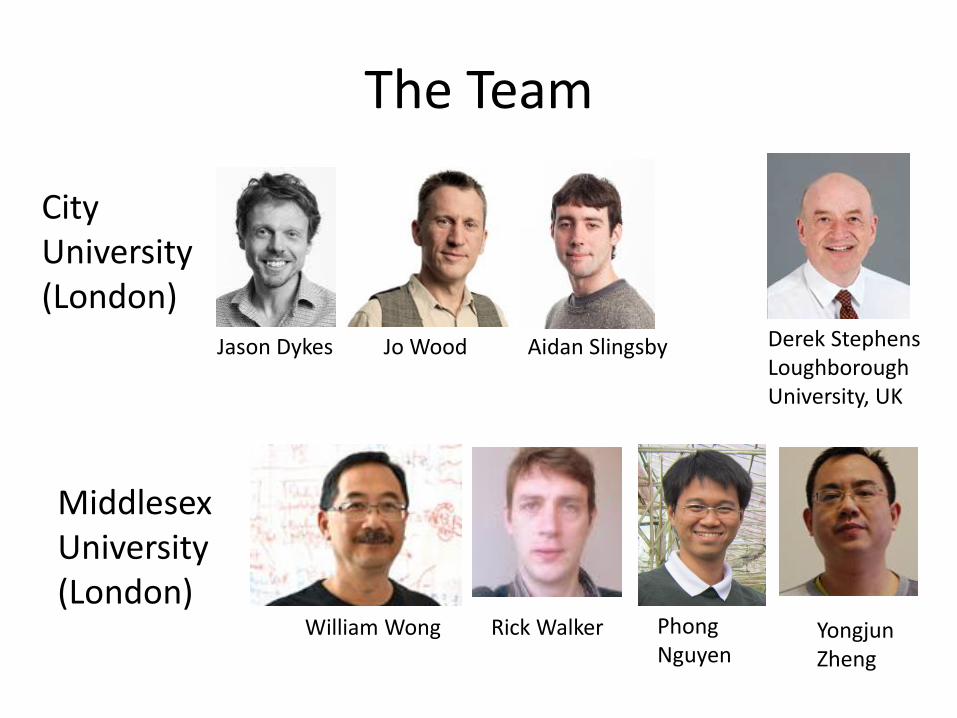
The Team
City University (London)
Jason Dykes Jo Wood Aidan Slingsby
Middlesex University (London)
William Wong Rick Walker Phong Nguyen
Yongjun Zheng
Derek Stephens Loughborough University, UK

Visit Us @ Middlesex University
• North West London: Google Map
• Interaction Design Centre
• Lots of Visual Analytics Research
– UK Visual Analytics Consortium: Oxford, Imperial, UCL, and Bangor
– Visual Analytics Summer School and MSc program
– MoD, EPSRC, and EU projects
• Always look for collaboration