The Davies Award Is: • Since 1994, the Nicholas E. Davies Award of Excellence is HIMSS highest global recognition of hospitals, ambulatory practices and clinics, community health organizations, and public health organizations that utilize electronic health records and information technology to improve clinical and financial outcomes. • The Davies Award is international and open to all healthcare delivery systems that meet the prerequisites. • The Davies Award is vendor-agnostic. The HIMSS Nicholas E. Davies Award of Excellence Awarding IT. Improving Healthcare.
Transcript
The Davies Award Is:
• Since 1994, the Nicholas E. Davies Award of Excellence is HIMSS highest global recognition of hospitals, ambulatory practices and clinics, community health organizations, and public health organizations that utilize electronic health records and information technology to improve clinical and financial outcomes.
• The Davies Award is international and open to all healthcare delivery systems that meet the prerequisites.
• The Davies Award is vendor-agnostic.
The HIMSS Nicholas E. Davies Award of Excellence
Awarding IT. Improving Healthcare.
-Speaker Bio(s)
The HIMSS Nicholas E. Davies Award of Excellence
Awarding IT. Improving Healthcare.
Taylor Hargrave, BSN, RN, CIC, Infection Prevention Supervisor
Amanda Logue, M.D., Chief Medical Information Officer
Taylor Hargrave, BSN, RN, CIC, Infection Prevention SupervisorAmanda Logue, M.D., Chief Medical Information Officer
Sepsis
2017 Nicholas E. Davies EnterpriseAward of Excellence
Lafayette General Health
Lafayette General Health
Who we are7 Inpatient facilities (incl. Academic)
43 Ambulatory sites: 18 specialties
1 Ambulatory surgery center
4,043 FTEs
68 Employed Physicians
1,700 Non-Employed Medical Staff
Our patients29,000 Admissions
180,000 ED visits
23,000 Surgical cases
335,000 Outpatient visits
Fiscal Year 2016 (Sept. 2015 - Sept.2016)
Acute HIMSS Level 6 (LGMC & UHC)
Top Service lines:
Cardiology
Neurology
Orthopedics
Information Systems automation journey
CPOE, Documentation, ED, Pharmacy, Revenue Cycle
2003
System re-install, Surgery, Cerner Patient
Accounting, Quality Alignment
2012
Remote Hosting
2014
Women’s Health, Care Management, Registries,
CommonWell, EPCS, HealthyLink clinics
2016
Radiology, PACS, Laboratory
2006
Ambulatory ASP, Oncology
2013
Integrated Ambulatory, Sepsis, PSI-15
process, New CDI software
2015
H o s p i t a l s a c q u i r e d :
EDW, HealthyLinkhospital system, Palm
Scanning, Patient Observer
2017
Local Problem
33.13% of overall mortality rates attributed to Sepsis
• Previous workflow:• Reviewed current symptoms vs. early detection• Identification only considered Temperature, HR, and Systolic BP
(Rules of 100s)• When patient's vital signs met criteria a sheet was automatically
printed on the ICU printer• The Rapid Response Team nurse went patient's unit and spoke
with the primary nurse, assisted with patient assessment if appropriate
• Contributing factors:• Unemployment rates increasing, patients losing health benefits1
• Patients tend to wait to seek treatment, sicker when in hospital
1Reference the appendix for Lafayette vs National unemployment rates
1SEPTICEMIA OR SEVERE SEPSIS W MV 96+ HOURS2SEPTICEMIA OR SEVERE SEPSIS W/O MV 96+ HOURS W MCC3SEPTICEMIA OR SEVERE SEPSIS W/O MV 96+ HOURS W/O MCC
Time period: June 2014 – May 2015
Sepsis Length of Stay
Diagnosis LOS: Days Monthly Average
Hospital Wide 4.5Overall Sepsis 9.35
Sepsis 8.61Severe Sepsis 7.25Septic Shock 12.21
Data Source: LGMC Cerner EHR database
Time period: Nov. 2014 – Nov. 2015
Sepsis Core Measure1
1Measure Set: Sepsis Set Measure ID #: SEP-1 Performance Measure Name: Early Management Bundle, Severe Sepsis/Septic Shock Description: This measure focuses on adults 18 years and older with a diagnosis of severe sepsis or septic shock. Consistent with Surviving Sepsis Campaign guidelines, it assesses measurement of lactate, obtaining blood cultures, administering broad spectrum antibiotics, fluid resuscitation, vasopressor administration, reassessment of volume status and tissue perfusion, and repeat lactate measurement. As reflected in the data elements and their definitions, the first three interventions should occur within 3 hours of presentation of severe sepsis, while the remaining interventions are expected to occur within 6 hours of presentation of septic shock. Rationale: The evidence cited for all components of this measure is directly related to decreases in organ failure, overall reductions in hospital mortality, length of stay, and costs of care.
The Joint Commission. (2016) Specifications Manual for National Hospital Inpatient Quality Measures v.5.2a (applicable 1/1/2017 - 12/31/2017). https://www.jointcommission.org/specifications_manual_for_national_hospital_inpatient_quality_measures.aspx
Data Source: LGMC Cerner eQualityCheck
LGMC pre-go live
compliance 2.44%
Time period: Oct. 2015 – Feb. 2016
LGMC baseline cost per case by DRG
DRG Cost per DRG8701 “Sickest” $27,669.248712 “Sicker” $11,902.188723 “Sick” $7,434.45
Data Source: Premier Quality Advisor
1SEPTICEMIA OR SEVERE SEPSIS W MV 96+ HOURS2SEPTICEMIA OR SEVERE SEPSIS W/O MV 96+ HOURS W MCC3SEPTICEMIA OR SEVERE SEPSIS W/O MV 96+ HOURS W/O MCC
• Goals/Anticipated outcome: • Increase early detection and prevention of Sepsis• Decrease mortality associated with Sepsis
Design and Build
• Project Timeline:• 14 months
• Algorithm monitoring and modification:• Alert initially built in “silent mode”• Project team audited and validated alert population and
frequency• Excluded:
• CV surgery for the initial 24 hours post-op• Active laboring population for 24 hours • Comfort measures only patients for duration of stay• NICU, Nursery, Pediatrics
Design & build
Training plan
Support plan Adoption
Design and Build, cont.
• Decisions:• Who to alert• Frequency of alert
• Every patient will only alert once Q24 hours. • Alerts are suppressed for extended time (72 hours) if a
sepsis order set is active or if a sepsis diagnosis is in place• When to call physician• Additional FTE added to Rapid Response Team (LGMC)
• Repeat lactate orders: • If any lactate result is > 2.0, then an automatic timed lactate is
ordered for 5 hours after the original lab was ordered
Design & build
Training plan
Support plan Adoption
Review of alerts prior to go-live
53%
47%
May 2015 Total Alerts SIRS and SepsisN = 172 alerts
Infectious Etiology*
Non-infectious Etiology**
*Infectious Etiology = Infection documented or developing at the time of alert**Non-Infectious Etiology = No infection documented or developing at time of alert
Review of alerts prior to go-live
3028
26
20
8
2 1
26.1%
50.4%
73.0%
90.4%97.4%
99.1% 100.0%
0%
20%
40%
60%
80%
100%
120%
0
5
10
15
20
25
30
35
Per
cent
of T
otal
Cou
nt o
f Ale
rts
Infectious Etiology
SIRS or Sepsis Alerts by Infectious EtiologyMay 2015
Count of Alerts Cumulative %
Review of alerts prior to go-live
16 15
108 7 6 6 5 5 5 4
1 1 117.8%
34.4%45.6%
54.4%62.2%
68.9%75.6%
81.1%86.7%
92.2% 96.7% 97.8% 98.9% 100.0%
0%
20%
40%
60%
80%
100%
120%
02468
1012141618
Per
cent
of T
otal
Cou
nt o
f Ale
rts
Non-Infectious Etiology
SIRS or Sepsis Alerts by Non-Infectious EtiologyMay 2015
Count of Alerts Cumulative %
Training
• 1 month prior to go-live: all nurses assigned module via Elsivier training on alert workflow
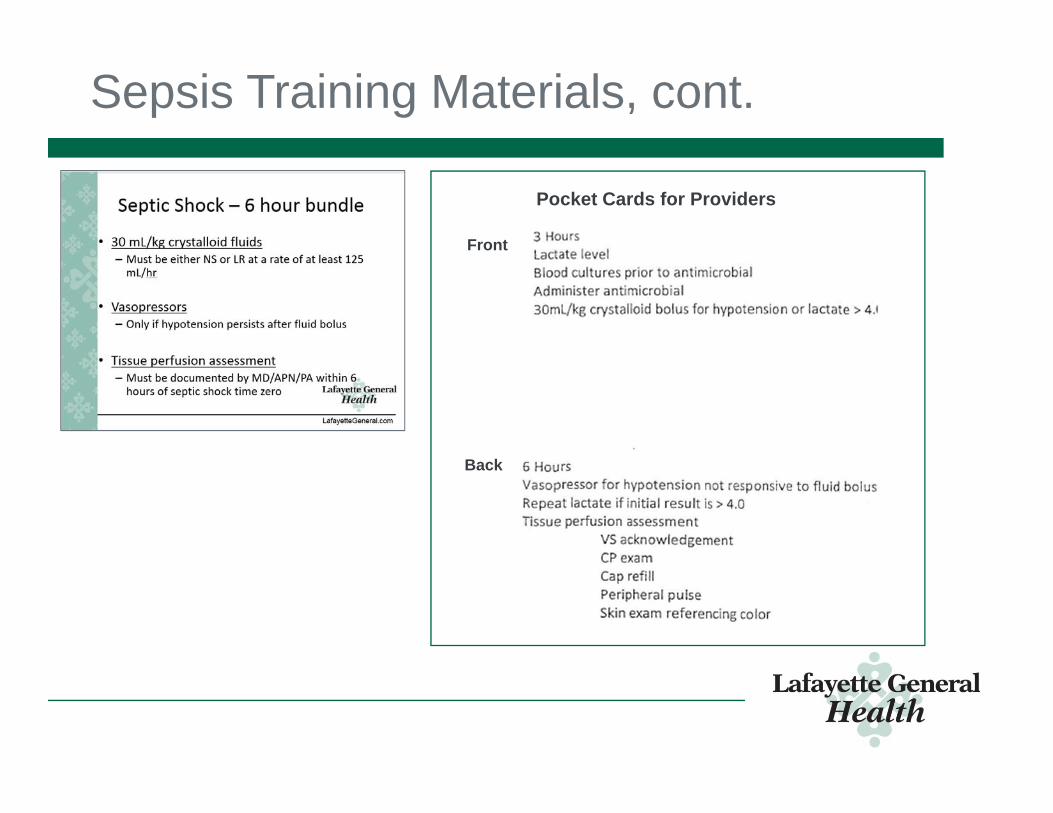
• Infection Prevention (IP) attended hospitalist meetings to explain the core measure• Quick reference laminated pocket cards were provided to
physicians
• Education provided to physician residents via LSU education platform
• IP attended Women's Services staff meetings to discuss core measures; information included in department newsletter
Design & build
Training plan
Support plan Adoption
See Sepsis Appendix for sample training materials
Support and Measure
• Infection Prevention quarterly review of all Sepsis patients• Synopsis of all core measure passes and misses sent to those
involved in care of patient at the time of event• Thank you card sent to physicians responsible for passes• Opportunity letter sent to physicians responsible for misses• Synopsis of passes and misses sent to each leader monthly
Opportunity and Thank You letters
How Health IT was Utilized
How Health IT was Utilized
• Cerner St. John Sepsis Agent:• Gathers and combines patient information and vital signs from
EHR• Fires alert in EHR when signs for SIRS or organ dysfunction
are detected
• Electronic alerts based on algorithm• Orders/tasks to drive action• Evidence-based electronic order sets
• Sepsis quality measure compliant• Improve antibiotic use identification
• Core measure reporting
St. John Sepsis Agent Algorithm
Sepsis Inpatient Workflow
Green boxes = Health IT utilization
Sepsis ED Workflow
Green boxes = Health IT utilization
SIRS Alert
• At least 3 SIRS criteria met
• Date and Time appear prior to the clinical event in the alert
• Includes a link to the patient’s chart in the message
Screenshot from Cerner EHR
Sepsis Alert
• At least 2 SIRS criteria and 1 organ dysfunction criteria
• Alert for the patient who meets criteria for the Sepsis Security Rule should display as shown
• Date and Time appear prior to the clinical event in the alert
• Includes a link to the patient’s chart in the message
Screenshot from Cerner EHR
Rapid Response Team Beeper
• Every Sepsis Alert sent to Rapid Response Team Beeper
Alert order placed on patient’s chart with nursing task
Patient Order Profile
Nurse Task List
Screenshot from Cerner EHR
ICU Decision Tree
• Used to determine if physician notification needed
Provider Notification Form
If deemed clinically necessary, nurse will contact provider and document communication in EHR
Screenshot from Cerner EHR
ED Tracking Board icon
Screenshot from Cerner EHR
Sepsis Order Sets
Screenshot from Cerner EHR
Key Orders in Sepsis Order Sets
• Sepsis Quality Measure Order• Sepsis Severity Identification Order
Screenshot from Cerner EHR
Sepsis Severity Identification Order
• Completed by physician to identify the type of sepsis being treated and suspected source of infection
• Drives electronic documentation for the Sepsis core measure and helps with the establishment of time zero
% of mortality attributed to sepsis 33.13% 31.2% -5.83%
Data Source: LGMC Cerner EHR database
Improved Sepsis Core Measure Compliance by 949.48%
2.46%
25.86%
0%5%
10%15%20%25%30%
Pre-go live compliance (Oct.2015 - Feb. 2016)
Post-go live compliance (March.2016 - Feb. 2017)
LGMC Sepsis Core Measure Compliance
Data Source: LGMC Cerner eQualityCheck
Increased Incident Count/Coding
Data Source: LGMC Cerner EHR database
5.42
38.08
9.83
23.67
12.25
50.08
12.42
22.83
0
10
20
30
40
50
60
SIRS Sepsis Severe Sepsis Septic Shock
Change in Incident Coding by Diagnosis Group
Baseline Monthly Average (Nov. 2014 - Nov. 2015)Outcome Monthly Average (Mar. 2016 - Feb. 2017)
Increased Incident Count/Coding
Data Source: LGMC Cerner EHR database
1SEPTICEMIA OR SEVERE SEPSIS W MV 96+ HOURS2SEPTICEMIA OR SEVERE SEPSIS W/O MV 96+ HOURS W MCC3SEPTICEMIA OR SEVERE SEPSIS W/O MV 96+ HOURS W/O MCC
3.36
26
7.732.42
35.33
13.83
05
10152025303540
870 “Sickest” 871 “Sicker” 872 “Sick”
Change in Incident Coding by DRG
Baseline Monthly Average (Jun. 2014 – May 2015)Outcome Monthly Average (Mar. 2016 – Feb. 2017)
Stable Sepsis Length of Stay
Data Source: LGMC Cerner EHR database
4.5
9.358.61
7.25
12.21
4.65
9.488.48
7.58
13
0
2
4
6
8
10
12
14
HospitalWide
OverallSepsis
Sepsis SevereSepsis
Septic Shock
Day
s
Change in LOS by Diagnosis Group
LOS – days Monthly Average (Nov. 2014 – Nov. 2015)LOS – days Monthly Average (Mar. 2016 – Feb. 2017)
Decreased Cost Per Case
• How decreased cost:• Diagnosing sooner impacts progression of disease• Coded more patients with sepsis diagnosis codes• Decreased mortality and improved outcomes• Improved efficiencies to care for patient – lowered cost to provider,