FRBNY ECONOMIC POLICY REVIEW /JULY 1995 27 The Decline of Traditional Banking: Implications for Financial Stability and Regulatory Policy Franklin R. Edwards and Frederic S. Mishkin 1 he traditional banking business has been to make long-term loans and fund them by issu- ing short-dated deposits, a process that is commonly described as “borrowing short and lending long.” In recent years, fundamental economic forces have undercut the traditional role of banks in finan- cial intermediation. As a source of funds for financial inter- mediaries, deposits have steadily diminished in importance. In addition, the profitability of traditional banking activi- ties such as business lending has diminished in recent years. As a result, banks have increasingly turned to new, nontraditional financial activities as a way of maintaining their position as financial intermediaries. 2 This article has two objectives: to examine the forces responsible for the declining role of traditional banking in the United States as well as in other countries, and to explore the implications of this decline and banks’ responses to it for financial stability and regulatory pol- icy. A key policy issue is whether the decline of banking threatens to make the financial system more fragile. If nothing else, the prospect of a mass exodus from the banking industry (possibly via increased failures) could cause instability in the financial system. Of greater con- cern is that declining profitability could tip the incen- tives of bank managers toward assuming greater risk in an effort to maintain former profit levels. For example, banks might make loans to less creditworthy borrowers or engage in nontraditional financial activities that promise higher returns but carry greater risk. A new activity that has generated particular concern recently is the expand- ing role of banks as dealers in derivatives products. There is a fear that in seeking new sources of revenue in deriva- tives, banks may be taking risks that could ultimately undermine their solvency and possibly the stability of the banking system. The challenge posed by the decline of traditional banking is twofold: we need to maintain the soundness of the banking system while restructuring the banking indus- try to achieve long-term financial stability. A sound regula- tory policy can encourage an orderly shrinkage of T The views expressed in this article are those of the authors and do not necessarily reflect the position of the Federal Reserve Bank of New York or the Federal Reserve System. The Federal Reserve Bank of New York provides no warranty, express or implied, as to the accuracy, timeliness, com- pleteness, merchantability, or fitness for any particular purpose of any information contained in documents produced and provided by the Federal Reserve Bank of New York in any form or manner whatsoever.
Transcript
FRBNY ECONOMIC POLICY REVIEW / JULY 1995 27
The Decline of TraditionalBanking: Implications for FinancialStability and Regulatory PolicyFranklin R. Edwards and Frederic S. Mishkin 1
he traditional banking business has been to
make long-term loans and fund them by issu-
ing short-dated deposits, a process that is
commonly described as “borrowing short and
lending long.” In recent years, fundamental economic
forces have undercut the traditional role of banks in finan-
cial intermediation. As a source of funds for financial inter-
mediaries, deposits have steadily diminished in importance.
In addition, the profitability of traditional banking activi-
ties such as business lending has diminished in recent
years. As a result, banks have increasingly turned to new,
nontraditional financial activities as a way of maintaining
their position as financial intermediaries.2
This article has two objectives: to examine the
forces responsible for the declining role of traditional
banking in the United States as well as in other countries,
and to explore the implications of this decline and banks’
responses to it for financial stability and regulatory pol-
icy. A key policy issue is whether the decline of banking
threatens to make the financial system more fragile. If
nothing else, the prospect of a mass exodus from the
banking industry (possibly via increased failures) could
cause instability in the financial system. Of greater con-
cern is that declining profitability could tip the incen-
tives of bank managers toward assuming greater risk in
an effort to maintain former profit levels. For example,
banks might make loans to less creditworthy borrowers or
engage in nontraditional financial activities that promise
higher returns but carry greater risk. A new activity that
has generated particular concern recently is the expand-
ing role of banks as dealers in derivatives products. There
is a fear that in seeking new sources of revenue in deriva-
tives, banks may be taking risks that could ultimately
undermine their solvency and possibly the stability of the
banking system.
The challenge posed by the decline of traditional
banking is twofold: we need to maintain the soundness of
the banking system while restructuring the banking indus-
try to achieve long-term financial stability. A sound regula-
tory policy can encourage an orderly shrinkage of
T
The views expressed in this article are those of the authors and do not necessarily reflect the position of the Federal
Reserve Bank of New York or the Federal Reserve System.
The Federal Reserve Bank of New York provides no warranty, express or implied, as to the accuracy, timeliness, com-
pleteness, merchantability, or fitness for any particular purpose of any information contained in documents produced
and provided by the Federal Reserve Bank of New York in any form or manner whatsoever.
28 FRBNY ECONOMIC POLICY REVIEW / JULY 1995
traditional banking while strengthening the competitive
position of banks, possibly by allowing them to expand
into more profitable, nontraditional activities. In the tran-
sitional period, of course, regulators would have to con-
tinue to guard against excessive risk taking that could
threaten financial stability.
The first part of our article documents the declin-
ing financial intermediation role of traditional banks in
the United States. We discuss the economic forces driving
this decline, in both the United States and foreign coun-tries, and describe how banks have responded to thesepressures. Included in this discussion is an examina-tion of banks’ activities in derivatives markets, a par-ticularly fast-growing area of their off-balance-sheetactivities. Finally, we examine the implications of thechanging nature of banking for financial fragility andregulatory policy.
THE DECLINE OF TRADITIONAL BANKING
IN THE UNITED STATES
In the United States, the importance of commercial banks
as a source of funds to nonfinancial borrowers has shrunk
dramatically. In l974 banks provided 35 percent of these
funds; today they provide around 22 percent (Chart 1).
Thrift institutions (savings and loans, mutual savings
banks, and credit unions), which can be viewed as special-
ized banking institutions, have also suffered a decline in
market share, from more than 20 percent in the late 1970s
to below 10 percent in the 1990s (Chart 2).
Another way of viewing the declining role of
banking in traditional financial intermediation is to look at
the size of banks’ balance-sheet assets relative to those of
other financial intermediaries (Table 1). Commercial banks’
share of total financial intermediary assets fell from around
the 40 percent range in the 1960-80 period to below
30 percent by the end of 1994. Similarly, the share of total
financial intermediary assets held by thrift institutions
In the United States, the importance of
commercial banks as a source of funds to
nonfinancial borrowers has shrunk
dramatically. In l974 banks provided
35 percent of these funds; today they
provide around 22 percent.
Chart 1
Percent
1960 65 70 75 80 9085 9420
25
30
35
40
Commercial Banks’ Share of Total Nonfinancial
Borrowing
1960-94
Source: Board of Governors of the Federal Reserve System, Flow of Funds Accounts.
Chart 2
Percent
Thrifts’ Share of Total Nonfinancial Borrowing
1960-94
1960 65 70 75 80 9085 945
10
15
20
25
Source: Board of Governors of the Federal Reserve System, Flow of Funds Accounts.
FRBNY ECONOMIC POLICY REVIEW / JULY 1995 29
declined from around 20 percent in the 1960-80 period to
below 10 percent by 1994.3
Boyd and Gertler (1994) and Kaufman and Mote
(1994) correctly point out that the decline in the share of
total financial intermediary assets held by banking institu-
tions does not necessarily indicate that the banking indus-
try is in decline. Because banks have been increasing their
off-balance-sheet activities (an issue we discuss below), we
may understate their role in financial markets if we look
solely at the on-balance-sheet activities. However, the
decline in traditional banking, which is reflected in the
decline in banks’ share of total financial intermediary
assets, raises important policy issues that are the focus of
this article.
There is also evidence of an erosion in traditional
banking profitability. Nevertheless, standard measures of
commercial bank profitability such as pretax rates of
return on assets and equity (shown in Chart 3) do not pro-
vide a clear picture of the trend in bank profitability.
Although banks’ before-tax rate of return on equity
declined from an average of 15 percent in the 1970-84
period to below 12 percent in the 1985-91 period, bank
profits improved sharply beginning in 1992, and 1994
was a record year for bank profits.
Overall bank profitability, however, is not a good
indicator of the profitability of traditional banking because
it includes the increasingly important nontraditional busi-
nesses of banks. As a share of total bank income, noninter-
est income derived from off-balance-sheet activities, such
as fee and trading income, averaged 19 percent in the
1960-80 period (Chart 4). By 1994, this source of income
had grown to about 35 percent of total bank income.
Although some of this growth in fee and trading income
may be attributable to an expansion of traditional fee activ-
ities, much of it is not.
A crude measure of the profitability of the tradi-
tional banking business is to exclude noninterest income
from total earnings, since much of this income comes from
nontraditional activities. By this measure, the pretax return
on equity fell from more than 10 percent in 1960 to levels
that approached negative 10 percent in the late 1980s and
early 1990s (Chart 5). This measure, however, does not
adjust for the expenses associated with generating nonin-
Source: Board of Governors of the Federal Reserve System, Flow of FundsAccounts.
Table 1RELATIVE SHARES OF TOTAL FINANCIAL INTERMEDIARYASSETS, 1960-94Percent
1960 1970 1980 1990 1994Insurance companies
Life insurance 19.6 15.3 11.5 12.5 13.0Property and casualty 4.4 3.8 4.5 4.9 4.6
Pension fundsPrivate 6.4 8.4 12.5 14.9 16.2Public (state and local government) 3.3 4.6 4.9 6.7 8.4
Finance companies 4.7 4.9 5.1 5.6 5.3Mutual funds
Stock and bond 2.9 3.6 1.7 5.9 10.8Money market 0.0 0.0 1.9 4.6 4.2
falling from 60 percent of bank liabilities in l960 to under
20 percent today.
The growing disadvantage of banks in raising
funds led to their supporting legislation in the 1980s to
eliminate Regulation Q ceilings on time deposits and to
allow checkable deposits that paid interest (NOW
accounts). Although the ensuing changes helped to make
banks more competitive in their quest for funds, the banks’
cost of funds rose substantially, reducing the cost advan-
tage they enjoyed.
DIMINISHED INCOME (OR LOAN) ADVANTAGES
Banks have also experienced a deterioration in the income
advantages they once enjoyed on the asset side of their bal-
ance sheets. The growth of the commercial paper and junk
bond markets and the increased securitization of assets
have undercut banks’ traditional advantage in providing
credit.
Improvements in information technology, which
have made it easier for households, corporations, and finan-
cial institutions to evaluate the quality of securities, have
made it easier for business firms to borrow directly from
the public by issuing securities. In particular, instead of
going to banks to finance short-term credit needs, many
business customers now borrow through the commercial
paper market. Total nonfinancial commercial paper out-
standing as a percentage of commercial and industrial bank
loans has risen from 5 percent in l970 to more than 20 per-
cent today.
The rise of money market mutual funds has also
indirectly undercut banks by supporting the expansion of
competing finance companies. The growth of assets in
money market mutual funds to more than $500 billion
created a ready market for commercial paper because
money market mutual funds must hold liquid, high-
quality, short-term assets. Further, the growth in the
commercial paper market has enabled finance companies,
which depend on issuing commercial paper for much of
their funding, to expand their lending at the expense of
banks. Finance companies provide credit to many of the
same businesses that banks have traditionally served. In
1980, finance company loans to businesses amounted to
about 30 percent of banks’ commercial and industrial
loans; today these loans constitute more than 60 percent of
banks’ commercial and industrial loans.
The junk bond market has also taken business away
from banks. In the past, only Fortune 500 companies were
able to raise funds by selling their bonds directly to the pub-
lic, bypassing banks. Now, even lower quality corporate bor-
rowers can readily raise funds through access to the junk
32 FRBNY ECONOMIC POLICY REVIEW / JULY 1995
bond market. Despite predictions of the demise of the junk
bond market after the Michael Milken embarrassment, it is
clear that the junk bond market is here to stay. Although
sales of new junk bonds slid to $2.9 billion by 1990, they
rebounded to $16.9 billion in 1991, $42 billion in 1992,
and $60 billion in 1993.
The ability to securitize assets has made nonbank
financial institutions even more formidable competitors for
banks. Advances in information and data processing tech-
nology have enabled nonbank competitors to originate
loans, transform these into marketable securities, and sell
them to obtain more funding with which to make more
loans. Computer technology has eroded the competitive
advantage of banks by lowering transactions costs and
enabling nonbank financial institutions to evaluate credit
risk efficiently through the use of statistical methods.
When credit risk can be evaluated using statistical tech-
niques, as in the case of consumer and mortgage lending,
banks no longer have an advantage in making loans.4 An
effort is being made in the United States to develop a mar-
ket for securitized small business loans as well.
U.S. banks have also been beset by increased for-
eign competition, particularly from Japanese and European
banks. The success of the Japanese economy and Japan’s
high savings rate gave Japanese banks access to cheaper
funds than were available to American banks. This cost
advantage permitted Japanese banks to seek out loan busi-
ness in the United States more aggressively, eroding U.S.
banks’ market share. In addition, banks from all major
countries followed their corporate customers to the United
States and often enjoyed a competitive advantage because
of less burdensome regulation in their own countries.
Before 1980, two U.S. banks, Citicorp and BankAmerica
Corporation, were the largest banks in the world. In the
1990s, neither of these banks ranks among the top twenty.
Although some of this loss in market share may be due to
the depreciation of the dollar, most of it is not.
Similar forces are working to undermine the tradi-
tional role of banks in other countries. The U.S. banks are
not alone in losing their monopoly power over depositors.
Financial innovation and deregulation are occurring world-
wide and have created attractive alternatives for both depos-
itors and borrowers. In Japan, for example, deregulation has
opened a wide array of new financial instruments to the
public, causing a disintermediation process similar to the
one that has taken place in the United States. In European
countries, innovations have steadily eroded the barriers that
have traditionally protected banks from competition.
In other countries, banks have also faced increased
competition from the expansion of securities markets.
Both financial deregulation and fundamental economic
forces abroad have improved the availability of information
in securities markets, making it easier and less costly for
business firms to finance their activities by issuing securi-
ties rather than going to banks. Further, even in countries
where securities markets have not grown, banks have still
lost loan business because their best corporate customers
have had increasing access to foreign and offshore capital
markets such as the Eurobond market. In smaller econo-
mies, such as Australia, which still do not have well-
developed corporate bond or commercial paper markets,
banks have lost loan business to international securities
markets. In addition, the same forces that drove the securi-
tization process in the United States are at work in other
countries and will undercut the profitability of traditional
banking there. Thus, although the decline of traditional
banking has occurred earlier in the United States than in
other countries, we can expect a diminished role for tradi-
tional banking in these countries as well.
HOW HAVE BANKS RESPONDED?In any industry, a decline in profitability usually results in
exit from the industry (often by widespread bankruptcies)
and a shrinkage of market share. This occurred in the
U.S. banks are not alone in losing their
monopoly power over depositors. Financial
innovation and deregulation are occurring
worldwide.
FRBNY ECONOMIC POLICY REVIEW / JULY 1995 33
banking industry in the United States during the l980s
through consolidations and bank failures. From 1960 to
1980, bank failures in the United States averaged less than
ten per year, but during the l980s, bank failures soared, ris-
ing to more than 200 a year in the late l980s (Chart 7).
To survive and maintain adequate profit levels,
many U.S. banks are facing two alternatives. First, they can
attempt to maintain their traditional lending activity by
expanding into new, riskier areas of lending. For example,
U.S. banks have increased their risk taking by placing a
greater percentage of their total funds in commercial real
estate loans, traditionally a riskier type of loan (Chart 8). In
addition, they have increased lending for corporate take-
overs and leveraged buyouts, which are highly leveraged
transactions. There is evidence that banks have in fact
increased their lending to less creditworthy borrowers.
During the l980s, banks’ loan loss provisions relative to
assets climbed substantially, reaching a peak of 1.25 per-
To survive and maintain adequate profit levels,
many U.S. banks are facing two alternatives.
First, they can attempt to maintain their
traditional lending activity by expanding into
new, riskier areas of lending. . . . [Second, they
can] pursue new, off-balance-sheet activities
that are more profitable.
Chart 7
Number
1960 65 70 75 80 9085 940
50
100
150
200
250
Bank Failures
1960-94
Sources: Federal Deposit Insurance Corporation, 1993 Annual Report and Quarterly Banking Profile.
Chart 8
Percent
Sources: Board of Governors of the Federal Reserve System, Federal Reserve Bulletin and Flow of Funds Accounts.
Commercial Real Estate Loans as a Percentage of Total
Commercial Bank Assets
1960-94
1960 65 70 75 80 9085 942
4
6
8
10
12
Chart 9
Percent
1960 65 70 75 80 9085 940
0.5
1.0
1.5
Loan Loss Provisions Relative to Assets
for Commercial Banks
1960-94
Sources: Federal Deposit Insurance Corporation, Statistics on Banking and Quarterly Banking Profile.
34 FRBNY ECONOMIC POLICY REVIEW / JULY 1995
cent in 1987. Only with the strong economy in 1994 have
loan loss provisions fallen to levels found in the worst years
of the 1970s (Chart 9). Recent evidence suggests that large
banks have taken even more risk than have smaller banks:
large banks have suffered the largest loan losses (Boyd and
Gertler 1993). Thus, banks appear to have maintained
their profitability (and their net interest margins—interest
income minus interest expense divided by total assets) by
taking greater risk (Chart 10).5 Using stock market mea-
sures of risk, Demsetz and Strahan (1995) also find that
before 1991 large bank holding companies took on more
systematic risk than smaller bank holding companies.
The second way banks have sought to maintain
former profit levels is to pursue new, off-balance-sheet
activities that are more profitable. As Chart 4 shows, U.S.
commercial banks did this during the early 1980s, dou-
bling the share of their income coming from off-balance-
sheet, noninterest-income activities.6 This strategy, how-
ever, has generated concerns about what activities are
proper for banks and whether nontraditional activities
might be riskier and result in banks’ taking excessive risk.
Although banks have increased fee-based activities, the
area of expanding activities in nontraditional banking that
has raised the greatest concern is banks’ derivatives activi-
ties. Great controversy surrounds the issue of whether
banks should be permitted to engage in unlimited deriva-
tives activities, including serving as off-exchange or over-
the-counter (OTC) derivatives dealers. Some feel that such
activities are riskier than traditional banking and could
threaten the stability of the entire banking system. (We
discuss this issue more fully later in the paper.)
The United States is not the only country to expe-
rience increased risk taking by banks. Large losses and
bank failures have occurred in other countries. Banks in
Norway, Sweden, and Finland responded to deregulation
by dramatically increasing their real estate lending, a move
followed by a boom and bust in real estate sectors that
resulted in the insolvency of many large banking institu-
tions. Indeed, banks’ loan losses in these countries as a frac-
tion of GNP exceeded losses in both the banking and the
savings and loans industries in the United States. The
International Monetary Fund (1993) reports that govern-
ment (or taxpayer) support to shore up the banking system
in Scandinavian countries is estimated to range from 2.8 to
4.0 percent of GDP. This support is comparable to the sav-
ings and loan bailout in the United States, which
amounted to 3.2 percent of GDP.
Japanese banks have also suffered large losses from
riskier lending, particularly to the real estate sector. The
collapse of real estate values in Japan left many banks with
huge losses. Ministry of Finance estimates in June 1995
indicated that Japanese banks were holding 40 trillion yen
($470 billion) of nonperforming loans—loans on which
interest payments had not been made for more than six
months—but many private analysts think that the actual
amount of nonperforming loans may be substantially
larger.
Much of the controversy surrounding banks’
efforts to diversify into off-balance-sheet
activities has centered on the increasing role
of banks in derivatives markets.
Chart 10
Percent
Sources: Federal Deposit Insurance Corporation, Statistics on Banking and Quarterly Banking Profile.
Net Interest Margins for Commercial Banks
1960-94
1960 65 70 75 80 9085 942.0
2.5
3.0
3.5
4.0
FRBNY ECONOMIC POLICY REVIEW / JULY 1995 35
French and British banks suffered from the
worldwide collapse of real estate prices and from major
failures of risky real estate projects funded by banks.
Olympia and York’s collapse is a prominent example. The
loan-loss provisions of British and French banks, like
those of U.S. banks, have risen in the l990s. One result
has been the massive bailout of Credit Lyonnais by the
French government in March 1995. Even in countries
with healthy banking systems, such as Switzerland and
Germany, some banks have run into trouble. Regional
banks in Switzerland failed, and Germany’s BfG Bank
suffered huge losses (DM 1.1 billion) in l992 and needed
a capital infusion from its parent company, Credit Lyon-
nais. Thus, fundamental forces not limited to the United
States have caused a decline in the profitability of tradi-
tional banking throughout the world and have created an
incentive for banks to expand into new activities and take
additional risks.
BANKS’ OFF-BALANCE-SHEET DERIVATIVES
ACTIVITIES
Much of the controversy surrounding banks’ efforts to
diversify into off-balance-sheet activities has centered on
the increasing role of banks in derivatives markets. Large
banks, in particular, have moved aggressively to become
worldwide dealers in off-exchange or OTC derivatives,
such as swaps.7 Their motivation, clearly, has been to
replace some of their lost “banking” revenue with the
attractive returns that can be earned in derivatives markets.
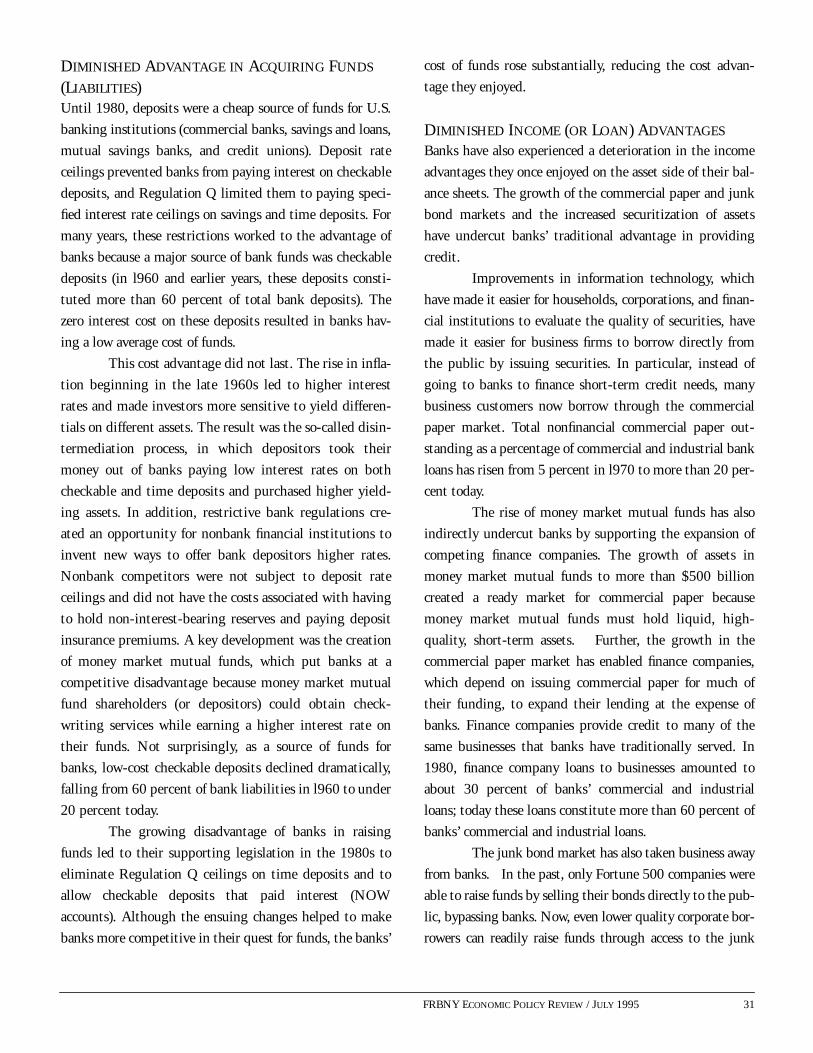
Banks have increased their participation in deriv-
atives markets dramatically in the last few years. In l994,
U.S. banks held derivatives contracts totaling more than
$16 trillion in notional value.8 Of these contracts, 63 per-
cent were interest rate derivatives, 35 percent were foreign
exchange derivatives, and the remainder were equity and
commodity derivatives.9 In addition, most of these deriv-
atives were held by large banks, and were held primarily
to facilitate the banks’ dealer and trading operations
(Table 2).10 In l994, the seven largest U.S.-bank deriva-
tives dealers accounted for more than 90 percent of the
notional value of all derivatives contracts held by U.S.
banks (Table 3).11 The profitability of derivatives activities
has clearly encouraged banks to step up their involvement:
in 1994, derivatives accounted for between 15 and 65 per-
cent of the total trading income of four of the largest bank
dealers (Table 4).12
The increased participation of banks in derivatives
markets has been a concern to both regulators and legisla-
tors because they fear that derivatives may enable banks to
take more risk than is prudent. There can be little doubt
that derivatives can be used to increase risk substantially,
Sources: Annual reports for 1994.
Table 3NOTIONAL/CONTRACT DERIVATIVES AMOUNTS OF FIFTEENMAJOR U.S. OVER-THE-COUNTER DERIVATIVES DEALERSMillions of Dollars
BanksChemical Banking Corporation 3,177,600Citicorp 2,664,600J.P. Morgan & Co., Inc. 2,472,500Bankers Trust New York Corporation 2,025,736BankAmerica Corporation 1,400,707The Chase Manhattan Corporation 1,360,000First Chicago Corporation 622,100
Securities firmsSalomon, Inc. 1,509,000Merrill Lynch & Co., Inc. 1,326,000Lehman Brothers, Inc. 1,143,091The Goldman Sachs Group, L.P. 995,275Morgan Stanley Group, Inc. 843,000
Insurance companiesAmerican International Group, Inc. 376,869General Re Corporation 306,159The Prudential Insurance Co. of America 102,102
Total 17,852,239Sources: Annual reports for 1994.a Totals, expressed in billions of dollars, appear in columns 1, 3, and 5. Averages,expressed as percentages, appear in columns 2 and 4.
and can potentially be quite dangerous.13 In the last year,
many banks sustained substantial losses on interest rate
derivatives instruments when interest rates continued to
rise. Because of the leverage that is possible, derivatives
enable banks to place sizable “bets” on interest rate and
currency movements, which—if wrong—can result in siz-
able losses. In addition, as dealers in OTC derivatives mar-
kets, banks may be exposed to substantial counterparty
credit risk. Unlike organized futures exchanges, the OTC
market offers no clearinghouse guarantee to mitigate the
credit risk involved in derivatives trading. Finally, because
derivatives are often complex instruments, sophisticated
risk-control systems may be necessary to measure and track
a bank’s potential exposure. Questions have been raised
about whether banks are currently capable of managing
these risks.
Concern about the growing participation of banks
in derivatives markets is exemplified by the remarks of
Representative Henry Gonzalez, Chairman of the Banking
Committee of the House of Representatives:
I have long believed that growing bankinvolvement in derivative products is, as I say andrepeat, like a tinderbox waiting to explode. In thecase of many market innovations, regulation lagsbehind until the crisis comes, as it has happenedin our case with S&L’s and banks. . . .
We must work to avoid a crisis related toderivative products before, once again, . . . the tax-payer is left holding the bag.14
In May 1994, Representative Gonzalez and Repre-
sentative Jim Leach introduced the Derivatives Safety and
Soundness Act of l994. This bill directs the federal bank-
ing agencies to establish common principles and standards
for capital, accounting, disclosure, and examination of
financial institutions using derivatives. In addition, the bill
requires the Federal Reserve and the U.S. Comptroller of
the Currency to work with other central banks to develop
comparable international supervisory standards for finan-
cial institutions using derivatives. In discussing the need
for derivatives legislation, Representative Leach said, “one
of the ironies of the development of [derivatives markets] is
that while [individual firm] risk can be reduced . . . sys-
tematic risk can be increased.” A second problem, Leach
noted, is that in many cases derivatives instruments “are
too sophisticated for financial managers.”15 A further indi-
cation of these concerns is the plethora of recent studies
that have examined the activities of financial institutions in
derivatives markets. Studies have been conducted by the
Bank for International Settlements (the “Promisel
Report”), the Bank of England, the Group of Thirty, the
Office of the U.S. Comptroller of the Currency, the Com-
modity Futures Trading Commission, and, most recently,
the U.S. Government Accounting Office (GAO).
The GAO released its report, “Financial Deriva-
tives: Actions Needed to Protect the Financial System,” in
May 1994. The report concluded that there is some reason
to believe that derivatives do pose a threat to financial sta-
bility. It raises the prospect that a default by a major OTC
derivatives dealer—and in particular by a major bank—
could result in spillover effects that could “close down”
OTC derivatives markets, with potentially serious ramifi-
cations for the entire financial system. The GAO recom-
mends that a number of measures be taken to strengthen
government regulation and supervision of all participants
in OTC derivatives markets, including banks.
The fear of a major bank failure because of OTC
derivatives activities appears to stem from two sources.
First, the sheer size of banks’ OTC derivatives activities
suggests that they may be exposed to substantial market
and credit risk because of their derivatives positions. In
particular, there is concern that as OTC derivatives deal-
Sources: Company annual reports.a Totals, expressed in millions of dollars, appear in columns 1 and 3. Averages,expressed as percentages, appear in columns 2 and 4.
Table 4CONTRIBUTION OF DERIVATIVES TRADING TO TOTALTRADING INCOME
ers, banks may be exposed to sizable counterparty credit
risk. This concern has been heightened in recent months
by the near-bankruptcy of Metallgesellschaft, Germany’s
fourteenth largest firm and a major end-user and counter-
party in the swap market. Second, many fear that regula-
tion, as well as managerial sophistication, has lagged
developments in the derivatives area, and as a conse-
quence, banks may be taking more risk than is prudent
(and more than they even realize).
HOW RISKY ARE BANKS’ OTC DERIVATIVES
ACTIVITIES?Much of the concern about banks’ activities in derivatives
markets has centered on their central position as major
dealers in the swap market. At year-end l994, the notional
value of all swap contracts outstanding was $7.1 trillion
(Table 5).16 Interest rate swaps represented 82 percent of
this amount, with currency swaps making up most of the
remaining contracts (Table 6). Although detailed informa-
tion about the nature of these swap agreements is not avail-
able, the bulk of them are probably “plain vanilla” swaps—
an exchange of fixed for floating rates. As such, these con-
tracts are similar to “strips” of forward or futures contracts
(for example, Eurodollar futures strips). Swaps are attrac-
tive to end-users because of their customized nature, low
cost, and longer maturities.
As major dealers in the swap market, banks have
extensive counterparty obligations and may be exposed to
Sources: Bank for International Settlements; U.S. Government Accounting Office; International Swaps and Derivatives Association; Federal Reserve Bank of New York.a Estimates for foreign exchange forward contracts are from U.S. Government Accounting Office 1994 (GAO report), Table IV.5. These also include an unknown amount ofover-the-counter foreign exchange options.b Does not include complete data on physical commodity derivatives and equity options on the common stock of individual companies. Table IV.2 of the GAO report showsthat seven of the databases contain equity and commodity derivatives that ranged from 1.1 to 3.4 percent of total derivatives’ notional/contract amounts.c Before including GAO estimates for foreign exchange forwards and over-the-counter options.
Table 5NOTIONAL/CONTRACT AMOUNTS FOR DERIVATIVES WORLDWIDE BY INDIVIDUAL PRODUCT TYPEAS OF THE END OF FISCAL YEARS 1990-93
Total swaps written 474 1,477 1,950 2,124 4,399Total swaps outstanding
(at year-end) 867 2,890 3,872 4,711 7,077
Properly measured, therefore, banks’ credit-risk
exposures associated with their OTC derivatives
activities do not seem out of proportion to their
other credit exposures, such as the exposure they
have to defaults on their loan portfolio.
FRBNY ECONOMIC POLICY REVIEW / JULY 1995 39
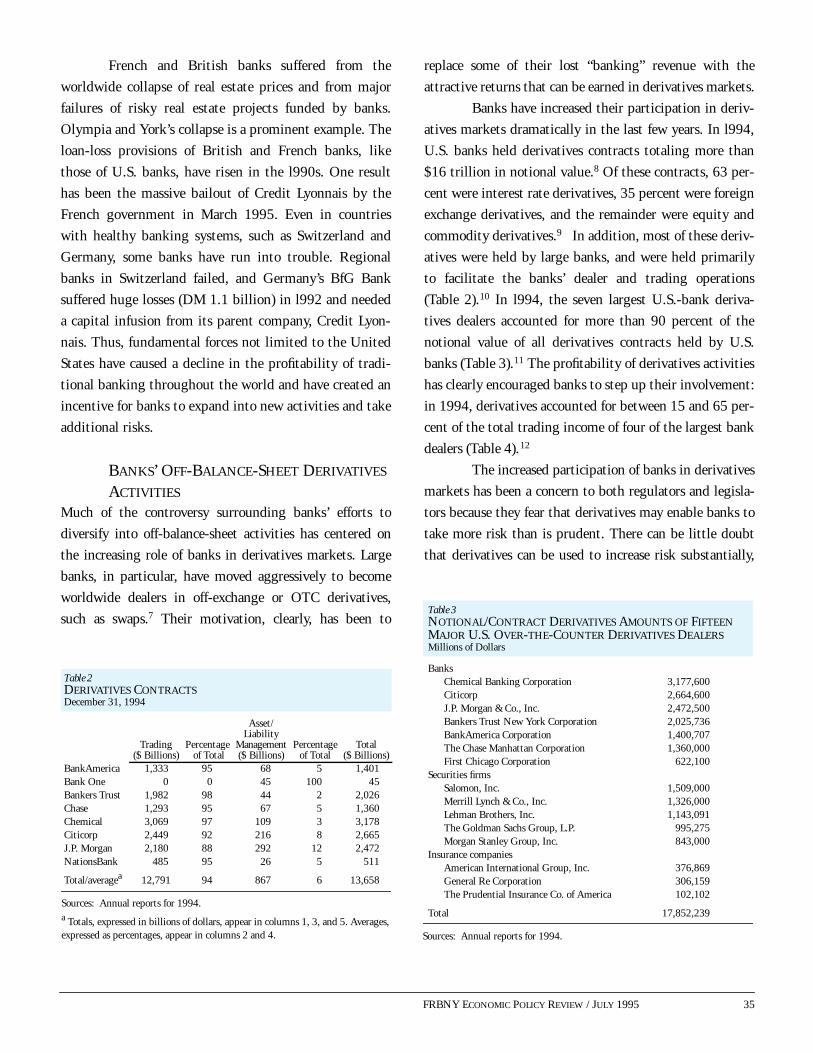
sures (Chart 11). Only Bankers Trust New York Corpora-
tion, which is probably the most active bank in derivatives
markets, and J.P. Morgan had a gross derivatives credit
exposure far in excess of their loan exposure. Although it is
true that banks’ credit exposure to derivatives is substan-
tial—it exceeds 100 percent of the equity of all of the sur-
veyed banks—a bank’s capital would be wiped out by
derivatives losses only if all counterparties were to default,
there were no offsetting netting agreements or other risk-
reduction mechanisms in force, and actual counterparty
losses were identical to total credit exposures. Such
assumptions are extreme, for loan defaults as well as for
derivatives-related exposures.
Properly measured, therefore, banks’ credit-risk
exposures associated with their OTC derivatives activities
do not seem out of proportion to their other credit expo-
sures, such as the exposure they have to defaults on their
loan portfolio. Banks also appear to be managing these
derivatives-related exposures reasonably well. Indeed, the
GAO reported that actual losses incurred by derivatives
dealers as a result of counterparty defaults have been quite
small: 0.2 percent of their combined gross credit exposure.21
Finally, derivatives activities can clearly be used by
banks to increase their exposure to changes in interest rates
and exchange rates—that is, to increase their market risk.
This kind of risk, however, is hardly new to banks. Banks
have always been exposed to such risks because of their
holdings of fixed-rate, long-term loans and securities, and
because of their foreign operations and foreign currency
positions. Derivatives can be used either to increase or
decrease these risks. Consequently, like all other transac-
tions that pose market risk, derivatives contracts must be
managed prudently.
REGULATION OF BANKS’ DERIVATIVES
ACTIVITIES
There has also been concern that banks may be taking
excessive risk in their derivatives activities.22 Indeed, the
GAO report suggests that there may be an intrinsic regu-
latory problem associated with banks’ dealing in OTC
derivatives:
The regulation of banks is essential, becausethey have deposit insurance and direct access tothe Federal Reserve’s discount window. At thesame time, however, this combination of depositinsurance and access also can result in potentialproblems because it may induce the banks andtheir customers to inappropriately rely on suchbacking. Therefore, banks may be willing to rungreater risks in their trading activities—in rela-tion to their capital—than otherwise would be thecase. In addition, market participants may preferusing banks for derivatives and related tradingactivities simply because banks are perceived to besafer counterparties. In the past, similar concernscaused us to recommend that nontraditional bank-ing activities, such as those associated with under-writing and dealing in corporate debt and equitysecurities, be conducted only by well-managedand well-capitalized banks in separate subsidiariesof the bank holding company. Whether deriva-tives should be placed in this category depends onregulators’ determinations on how they are beingused by individual banks.23
An important question, therefore, is whether
banks’ derivatives activities are so different from other
bank activities that they cannot be effectively regulated. Is
there something special about derivatives that makes pru-
Chart 11
Percent
Credit Exposures from Derivatives and Loans of Seven
U.S. Banks as a Percentage of Equity, 1994
0
200
400
600
800
1000
Chemical Citicorp J.P. Morgan
Bankers Trust
Chase Manhattan
Bank- America
First Chicago
DerivativesLoans
Sources: Bank annual reports for 1994.
40 FRBNY ECONOMIC POLICY REVIEW / JULY 1995
dential regulation to protect the federal deposit insurance
fund and taxpayers more difficult or even impossible? A
key issue is whether bank capital requirements, the central
component of prudential regulation, can be successfully
applied to banks’ derivatives activities. If not, there may be
an argument for either prohibiting derivatives activities (or
possibly dealer activities) or segregating them into sepa-
rately capitalized bank affiliates.24
Banks’ derivatives activities are already subject to
extensive prudential regulation. Both U.S. and Basle
Accord capital requirements apply to U.S. banks’ deriva-
tives activities. U.S. banks are required to comply with two
different types of capital requirements—a risk-based
requirement and a leverage ratio requirement. The risk-
based requirement applies to the credit risk associated with
derivatives contracts or activities. The leverage ratio
requires banks to hold capital as a cushion against losses
arising from other risks associated with derivatives posi-
tions, such as operations risk. Not surprisingly, there is
considerable controversy about whether these capital
requirements are too low or too high.
The more important question, however, is whether
any capital requirements on derivatives activities can suc-
cessfully control banks’ risk taking. Some argue that deriv-
atives are so complex and so nontransparent that it is
difficult for regulators to devise capital regulations to con-
trol banks’ risk taking (or, for that matter, for the market
to monitor banks’ derivatives activities).
We are skeptical about this view. Although some
derivatives instruments are undoubtedly complex, expo-
sure to derivatives risk does not seem much different from
exposure to many other bank activities, such as credit risk
in a loan portfolio or interest rate risk in a variety of fixed-
income securities. Banks can achieve high leverage in a
number of ways other than through derivatives and can
quickly change (or increase) their risk exposure in many
different ways. While it is not clear how much capital
should be required for a given derivatives risk exposure,
these implementation problems are not unique to deriva-
tives activities. All new bank activities are likely to present
similar problems.
Thus, banks’ recent push into derivatives activities
raises all of the questions commonly raised when banks
engage in new off-balance-sheet activities. Are these activi-
ties too risky for banks? Do banks have the managerial
capacity to engage in these activities in a safe way? Can
these activities be effectively regulated? The challenges
posed by these questions are no different for derivatives
than they are for other banking activities.
IMPLICATIONS FOR POLICY
The decline of traditional banking presents a challenge to
regulators and policymakers. On the one hand, banks may
respond to their shrinking intermediary role and dimin-
ished profitability by taking greater risk, which, if
unchecked, could undermine the stability of the banking
system. There is some evidence that banks have in fact
increased their risk taking, either by pursuing riskier strat-
egies in their traditional business lines or by seeking out
new and riskier activities. On the other hand, long-run
financial stability would benefit from a restructuring of the
banking industry that strengthens the competitive posi-
tion of banks. Achieving this goal may require eliminating
unnecessary (nonprudential) regulations and permitting
banks to enter new markets and to engage in new activities.
One approach to achieving these dual objectives is
to couple adequate capital requirements for banks with
early corrective action by regulators to prevent capital from
falling below specified levels.25 Requiring banks to hold
adequate capital promotes financial stability in two ways.
First, it provides a greater cushion with which banks can
absorb losses, lessening the likelihood of failure. Second,
with more capital at risk, banks have less incentive to take
excessive risk—they have more to lose if their bets go
wrong. To ensure that banks hold the requisite amount of
capital and do not engage in either excessively risky or ille-
gal activities, supervision and field examinations of banks
would continue to be necessary.26 Requiring early corrective
action by regulators to recapitalize a bank that has suffered
an erosion in its capital promotes stability in three ways.
First, it provides predictability for banks and bank share-
holders. Certain regulatory actions predictably follow cer-
tain economic events. Second, it prevents a bank’s capital
from falling to levels that threaten losses to the bank insur-
FRBNY ECONOMIC POLICY REVIEW / JULY 1995 41
ance fund. In addition, by requiring banks to maintain a
positive net worth, it mitigates the moral hazard prob-
lem—banks will have something to lose by taking excessive
risk. Lastly, early corrective action mitigates the regulatory
forbearance problem by preventing regulators from using
their discretion about whether or not to take action.27
A benefit of this regulatory strategy is that regu-
lation need no longer restrict banks’ activities. As long as
banks must hold sufficient capital against whatever activ-
ities they engage in, taxpayers will be protected and
banks will have an incentive to avoid excessive risk tak-
ing. Further, freedom to offer additional products and
services will better enable banks to compete with non-
bank competitors and with foreign banks, and will make
banks less susceptible to failure because they will be bet-
ter diversified. (An example of such diversification bene-
fits is casualty insurance, where losses are due principally
to acts of god and have a very low correlation with the
losses that banks typically incur, which are due primarily
to adverse economic events.)
A key component of this approach is that bank
risk exposures need to be measured accurately and capital
requirements be set high enough to deter excessive risk
taking. This requires, among other things, the adoption of
market-value accounting principles for valuing bank assets
and liabilities. Historical-cost accounting principles do not
ensure that changes in the economic value of a bank’s assets
and liabilities will be reflected in its true net worth. It is
the market value of a bank’s assets and liabilities, together
with the market value of its equity capital, that determines
a bank’s economic solvency. Further, the market value of a
bank’s net worth is what the bank risks when it takes addi-
tional risk.
Objections to market-value-based capital require-
ments center on the difficulty of making accurate market-
value estimates of assets and liabilities. Historical-cost
accounting has an important advantage in that it is easier
to value assets and liabilities. Market-value accounting, in
contrast, requires estimates and approximations that are
harder to justify and are often more expensive to obtain.
Despite these difficulties, market-value accounting may
still be able to provide a more accurate picture of a bank’s
economic condition. Clearly, an important research topic
for regulatory authorities is the feasibility of applying mar-
ket-value accounting principles to banking institutions.
Adoption of market-value accounting would have
the additional advantage of making a bank’s condition more
transparent and therefore making regulators and politicians
more accountable. Regulators and politicians are subject to
a principal-agent problem: they often have an incentive to
hide potential problems, even though taxpayers would be
better off if these problems were dealt with sooner rather
than later (or not at all). Market-value accounting would
make it easier for taxpayers to monitor the actions of regu-
lators and politicians, and would make it more difficult for
regulators to engage in policies of forbearance.
Another important component of a regulatory
strategy to maintain bank soundness is supervisory moni-
toring. Regulation must be able to keep banks from chang-
ing their risk exposure after capital requirements are
determined. Both this element of regulatory supervision
and the need for early intervention have increased in
importance of late because of the emergence of derivatives
markets that make it easier for banks to quickly take large
bets on interest rate and other asset price movements. As
we have learned from the recent collapse of Barings, regu-
lators must also ensure that adequate internal controls are
in place with regard to asset quality and risk management
procedures.
Public disclosure of banks’ risk exposures would
increase market efficiency and bolster market
discipline. Banks should provide a meaningful
depiction of the risks associated with their
trading activities, both in derivatives and in
on-balance-sheet securities, and of their ability
to manage these risks.
42 FRBNY ECONOMIC POLICY REVIEW / JULY 1995
Finally, public disclosure of banks’ risk exposures
would increase market efficiency and bolster market disci-
pline. Banks should provide a meaningful depiction of the
risks associated with their trading activities, both in deriv-
atives and in on-balance-sheet securities, and of their abil-
ity to manage these risks. More public information about
the risks incurred by banks will better enable stockholders,
creditors, and depositors to evaluate and monitor banks,
and will act as a deterrent to excessive risk taking. This
view is consistent with a recent discussion paper issued by
the Euro-currency Standing Committee of the G-10 Cen-
tral Banks (1994), which goes so far as to recommend that
estimates of financial risk generated by firms’ own internal
risk management systems be adapted for public disclosure
purposes.28 Such information would supplement disclo-
sures based on traditional accounting conventions by pro-
viding information about risk exposures and risk
management that is not normally included in conventional
balance sheet and income-statement reports.
CONCLUSION
The decline of traditional banking entails a risk to the
financial system only if regulators fail to adapt their pol-
icies to the new financial environment that is emerging.
A constructive regulatory approach is to adopt a system
of structured bank capital requirements together with
early corrective action by regulators. An important ele-
ment of this system is the adoption of market-value
accounting principles for all financial institutions. In
addition, supervisory monitoring and greater public dis-
closure by all financial institutions of the risks associated
with their trading activities would be beneficial. Lastly,
to enhance the competitiveness and efficiency of finan-
cial markets, banks could be permitted to engage in a
diversified array of both bank and nonbank products and
services. This general regulatory strategy, we believe,
can successfully keep in check excessive risk taking by
banks while providing the flexibility for both banks and
regulators to restructure the banking system to achieve
greater long-term stability. Finally, we do not view
banks’ off-balance-sheet activities, including their deriv-
atives activities, as a threat to financial stability. Prop-
erly used and regulated, derivatives can facilitate the
management of risk and increase the long-term viability
of banks and the financial system.
ENDNOTES
NOTES FRBNY ECONOMIC POLICY REVIEW / JULY 1995 43
1. Franklin R. Edwards is Arthur Burns Professor of Finance andEconomics at the Graduate School of Business, Columbia University, andVisiting Scholar at the American Enterprise Institute. Frederic S.Mishkin is Executive Vice President and Director of Research at theFederal Reserve Bank of New York, Research Associate at the NationalBureau of Economic Research, and A. Barton Hepburn Professor ofFinance and Economics at the Graduate School of Business, ColumbiaUniversity. An earlier version of this article appeared in Spanish in theJune 1995 issue of Moneda y Credito as a part of the proceedings of theSymposium on Financial Instability. The research is part of the NationalBureau of Economic Research’s programs in Monetary Economics andEconomic Fluctuations. Any opinions expressed are those of the authorsand not those of Columbia University, the National Bureau of EconomicResearch, the American Enterprise Institute, the Federal Reserve Bank ofNew York, or the Federal Reserve System.
The authors thank Arturo Estrella, Charles Goodhart, StavrosPeristiani, Eli Remolona, Philip Strahan, and Betsy White for theircomments and William Bassett for research assistance. Discussants at theSymposium on Financial Instability and participants in a workshop at theFederal Reserve Bank of New York also provided helpful comments.
2. Although many banks may be able to maintain their relative positionas financial intermediaries by engaging in nontraditional bankingactivities, for policy purposes it is important to focus on the economicforces that have undercut the role of banking. Indeed, an importantquestion is whether substantive public policy issues are raised by bankshaving to transform themselves into financial intermediaries that lookmore like nonbank financial intermediaries.
3. See also Edwards (l993).
4. Banks have also been engaged in the securitization process and, withthe advent of higher bank capital requirements, have had greaterincentives to move loans off balance sheet by securitizing them. Banks’involvement in the securitization process has been another contributingfactor to the growth in their off-balance-sheet activities. Nevertheless,the basic point still stands: computer technology that can be used bynonbanking institutions to securitize assets has diminished the banks’competitive position.
5. U.S. banks have an incentive to take additional risk because of federaldeposit insurance. Insured depositors have little incentive to monitorbanks and to penalize them for taking too much risk. This moral hazardproblem was compounded by our de facto “too-big-to-fail” policy forlarge banks. Although the 1991 Federal Deposit Insurance CorporationImprovement Act (FDICIA) has a least-cost resolution provision thatmakes it harder to bail out large depositors, there is an exception to theprovision whereby a bank would be in effect declared too big to fail so
that all depositors would be fully protected if a two-thirds majority ofboth the Board of Governors of the Federal Reserve System and theDirectors of the Federal Deposit Insurance Corporation as well as thesecretary of the Treasury agreed. Thus, the moral hazard problem createdby the too-big-to-fail policy has been reduced but not entirely eliminatedby the 1991 FDICIA legislation.
6. Note that some off-balance-sheet activities that produce fee income,such as loan commitments and letters of credit, can be classified astraditional banking business. The data in Chart 4 overstate somewhatnontraditional banking business.
7. As of the third quarter, l993, all insured commercial banks heldinterest rate swaps contracts with a notional value of $2.79 trillion. SeeBank Administration Institute and McKinsey & Company, Inc. (1994,p. 5).
8. Federal Reserve call report (RC-L) data for U.S. banks for the firstquarter of l992. See also U.S. General Accounting Office (1994, p. 182).
9. U.S. General Accounting Office (1994).
10. Salomon Brothers (1994, p. 8). Qualitative statements in the banks’annual reports suggest that much of their derivatives trading iscustomer-driven.
11. U.S. General Accounting Office (1994, p. 188, Appendix V, andp. l82, Appendix IV).
12. Salomon Brothers (1994, p. 9, Chart 5).
13. See Franklin R. Edwards (1994).
14. Remarks made on the floor of the House of Representatives,Congressional Record, June l8, l993, H 3322.
15. Mark Kollar (1994, p. 1, col. 2).
16. This amount includes interest rate and currency swaps plus caps,floors, collars, and swaptions outstanding. Equity, commodity, andmulti-asset derivatives are not included. The latter totaled $131 billionat year-end l992, relative to a total of $4.7 trillion of swap contracts atyear-end 1992. See Group of Thirty (1993, p. 58).
17. Measured at any point in time, credit risk exists only forcounterparties with profitable positions. A losing counterparty has nocredit risk. For example, assume that under an interest rate swapagreement, a firm receives fixed-interest payments and pays floating
44 FRBNY ECONOMIC POLICY REVIEW / JULY 1995 NOTES
ENDNOTES(Continued)
rates. At the inception of this swap, the market value of the firm’sposition in the swap may be zero. If, subsequently, interest rates declinesubstantially, the firm will receive more than it will pay, so the firm willhave a valuable or profitable position in the swap. This value, created bythe change in interest rates, is the firm’s replacement cost for the swap,and represents the credit risk to which it is exposed. If its counterpartydefaults on future swap payments, the replacement cost is the cost to thefirm of replacing the swap on the same favorable terms.
18. These include both swaps and forward contracts.
19. U.S. General Accounting Office (1994, p. 59, Table 3.1).
20. U.S. General Accounting Office (1994, pp. 54-55).
21. U.S. General Accounting Office (1994, p. 55).
22. For a review of the current regulation of banks’ derivatives activities,see U.S. General Accounting Office (1994, pp. 69-84).
23. U.S. General Accounting Office (1994, p. 125).
24. Alternatively, there may be an argument for some form of “narrowbanking,” where the deposit-taking function of the bank is separatedfrom other bank activities, such as derivatives activities.
25. This approach is discussed extensively in Benston and Kaufman(1988), elements of which are in the 1991 FDICIA act.
26. As Gorton and Rosen (1994) point out, corporate control (agency)issues may also contribute to excessive risk taking when traditionalbanking business declines. Thus, steps to control this agency problemmay also be needed to control risk taking. What form these steps shouldtake requires additional research and is beyond the scope of this paper.
27. As capital declined below certain “trigger” levels, for example,regulatory authorities would be required to take specific actions, such asrestricting the ability of the bank to expand and preventing the bankfrom paying dividends and interest on subordinated debentures.
28. See also the Federal Reserve Bank of New York (1994), which is acompanion piece to the Euro-currency Standing Committee’s report.
REFERENCES
Bank Administration Institute and McKinsey & Company, Inc. 1994.“Banking Off the Balance Sheet.”
Benston, George J., and George G. Kaufman. 1988. “Risk and SolvencyRegulation of Depository Institutions: Past Policies and CurrentOptions.” New York University, Salomon Center for Graduate Schoolof Business, Monograph Series in Finance and Economics, no. 1.
Boyd, John H., and Mark Gertler. 1993. “U.S. Commercial BankingTrends, Cycles, and Policy.” In Olivier Blanchard and Stanley Fischer,eds., NATIONAL BUREAU OF ECONOMIC RESEARCH MACROECONOM-
ICS ANNUAL.
———. 1994. “Are Banks Dead? Or, Are the Reports GreatlyExaggerated?” In THE DECLINING ROLE OF BANKING, pp. 85-117.Federal Reserve Bank of Chicago, May.
Demsetz, Rebecca, and Philip Strahan. 1995. “Historical Patterns andRecent Changes in the Relationship between Bank Holding CompanySize and Risk.” FEDERAL RESERVE BANK OF NEW YORK ECONOMIC
POLICY REVIEW 1 , no. 2 (July).
Edwards, Franklin R. 1993. “Financial Markets in Transition—or theDecline of Commercial Banking.” In CHANGING CAPITAL MARKETS:IMPLICATIONS FOR MONETARY POLICY, pp. 5-62. Federal ReserveBank of Kansas City, 1993.
Note 17 Continued
REFERENCES(Continued)
NOTES FRBNY ECONOMIC POLICY REVIEW / JULY 1995 45
———. 1995. “Derivatives Can Be Hazardous to Your Health: The Caseof Metallgesellschaft.” DERIVATIVES QUARTERLY, Spring: 8-17.
Euro-currency Standing Committee of Central Banks of Group of Ten Countries(Fisher Group). 1994. “Public Disclosure of Markets and Credit Risksby Financial Intermediaries.” Discussion paper, September.
Federal Reserve Bank of New York. 1994. “Public Disclosure of RisksRelated to Market Activity.” Discussion paper, September.
Gorton, Gary, and Richard Rosen. 1994. “Corporate Control, PortfolioChoice and the Decline of Banking.” University of Pennsylvania, July.Mimeo.
Group of Thirty. 1993. “Derivatives: Practices and Principles,” July,p. 58, Table 6.
International Monetary Fund. 1993. “The Deterioration of Bank BalanceSheets.” Part II of INTERNATIONAL CAPITAL MARKETS, pp. 2-22.August.
Kaufman, George. 1994. “FDICIA: The Early Evidence.” CHALLENGE
MAGAZINE, July-August: 53-57.
Kaufman, George G., and Larry R. Mote. 1994. “Is Banking a DecliningIndustry? A Historical Perspective.” FEDERAL RESERVE BANK OF
CHICAGO ECONOMIC PERSPECTIVES, May-June: 2-21.
Keeley, Michael C. 1990. “Deposit Insurance, Risk, and Market Power inBanking.” AMERICAN ECONOMIC REVIEW 80 (December): 1183-1200.
Kollar, Mark. 1994. “Congressman Sees Need for Safety Net.” KNIGHT-RIDDER FINANCIAL PRODUCTS & NEWS, July-August, p. 1, col. 2.
Salomon Brothers. 1994. “Derivatives: New Disclosures Still Fall Short,”May 16.
U.S. General Accounting Office. 1994. “Financial Derivatives: ActionsNeeded to Protect the Financial System.” Report to CongressionalRequestors, GAO/GGD-94-133, May.