Page 1
1
THE DEFORMATION CHARACTERISTICS OF DEEP MIXED COLUMNS
IN SOFT CLAYEY SOILS: A MODEL STUDY
A THESIS SUBMITTED TO
THE GRADUATE SCHOOL OF NATURAL AND APPLIED SCIENCES
OF
MIDDLE EAST TECHNICAL UNIVERSITY
BY
MAHMUT YAVUZ ŞENGÖR
IN PARTIAL FULFILLMENT OF THE REQUIREMENTS
FOR
THE DEGREE OF DOCTOR OF PHILOSOPHY
IN
CIVIL ENGINEERING
FEBRUARY 2011
Page 2
Approval of the thesis:
THE DEFORMATION CHARACTERISTICS OF DEEP MIXED
COLUMNS IN SOFT CLAYEY SOILS: A MODEL STUDY
submitted by MAHMUT YAVUZ ŞENGÖR in partial fulfillment of the
requirements for the degree of Doctor of Philosophy in Civil Engineering
Department, Middle East Technical University by,
Prof. Dr. Canan Özgen
Dean, Graduate School of Natural and Applied Sciences
Prof. Dr. Güney Özcebe
Head of Department, Civil Engineering
Prof. Dr. M. Ufuk Ergun
Supervisor, Civil Engineering Dept., METU
Prof. Dr. Orhan EROL
Co-Supervisor, Civil Engineering Dept., METU
Examining Committee Members:
Prof. Dr. Erdal Çokça
Civil Engineering Dept., METU
Prof. Dr. M. Ufuk Ergun
Civil Engineering Dept., METU
Prof. Dr. Tamer Topal
Geological Engineering Dept., METU
Asst. Prof. Dr. Nihat Dipova
Civil Engineering Dept., Akdeniz Univ.
Asst. Prof. Dr. Nejan Huvaj Sarıhan
Civil Engineering Dept., METU
Date: . 11.02.2011
Page 3
iii
I hereby declare that all information in this document has been obtained
and presented in accordance with academic rules and ethical conduct. I also
declare that, as required by these rules and conduct, I have fully cited and
referenced all material and results that are not original to this work.
Name, Last name :
Mahmut Yavuz Şengör
Signature :
Page 4
iv
ABSTRACT
THE DEFORMATION CHARACTERISTICS OF DEEP MIXED COLUMNS
IN SOFT CLAYEY SOILS: A MODEL STUDY
Şengör, Mahmut Yavuz
Ph.D., Department of Civil Engineering
Supervisor: Prof. Dr. M. Ufuk Ergun
February 2011, 110 pages
Deep Mixing involves the introduction of cementitious or specially formulated
solutions directly into the ground through the use of purpose built blending
injection augers. The system is mainly designed to increase strength and reduce
compressibility of treated soil.
In the first stage of the research effective mixture ratios and mixture types of
stabilizing agents were investigated for soft clays (CL form Eymir lake and
kaolinite) by means of unconfined compression (UC) tests on stabilized soils.
The unconfined compressive strength (UCS) values were obtained for 7,28,90
and 365 days of curing time. The ratio of elastic modulus at 50% failure load
(E50) to (UCS) of the stabilizing agents were also investigated.
In the second part of the research programme, deep mixed model columns with
the three column materials and four different column spacings are formed within
Page 5
v
the large scale consolidation tanks, and the consolidation characteristics of deep
mixed improved clay were investigated.
Based on the results of large scale consolidation tests on deep mixed columnar
improved soft clay, compressibility characteristics of improved soft clay were
determined in relation to spacing of columns namely, effective replacement ratio
and binder content. The cement content (also UCS) of the column material was
found to be the most important parameter for the improvement effects of DMM
applications. Validity of the relations for the estimation of bulk compression
modulus of soilcrete were discussed. The use of constrained modulus of the soil and
the column material were found to be effective in predicting the compression
modulus of the soilcrete. Settlement reduction factor versus replacement ratio and
cement content relations were determined which may be used for preliminary
design works. The stresses on the soil and the columns were backcalculated from
the settlement values. The stress ratios were obtained.
Keywords: Deep mixing, laboratory model, mixture ratio, cement content,
replacement ratio, unconfined compression strength-UCS, E50/UCS ratio,
compression modulus, settlement reduction factor, stress ratio
Page 6
vi
ÖZ
YUMUŞAK KİL ZEMİN İÇİNDE DERİN KARIŞTIRMA KOLONLARININ
DEFORMASYON KARAKTERİSTİKLERİ, BİR MODEL DENEY
ÇALIŞMASI
Şengör, Mahmut Yavuz
Doktora, İnşaat Mühendisliği Bölümü
Tez Yöneticisi: Prof. Dr. M. Ufuk Ergun
Şubat 2011, 110 sayfa
Derin karıştırma, bu amaçla tasarlanmış karıştırıcı enjeksiyon burguları
kullanılarak zemine doğrudan çimentolu ve özel formüllü solüsyonlar
uygulanması işlemini ifade eder. Bu sistem esasen zemin içerisinde
geçirimliliğin azaltılmasını ve/veya dayanımın arttırılmasını sağlamak amacıyla
tasarlanmıştır.
Bu araştırmanın ilk aşamasında, iyileştirilmiş zeminler üzerinde tek eksenli
basınç deneyleri yapılarak yumuşak kil zeminler için (Eymir gölü kili ve kaolen)
etkili karışım oranları ve karışım tipleri araştırılmıştır. 7, 28, 90 ve 365 günlük
kür süreleri sonunda tek eksenli basınç dayanım değerleri elde edilmiştir. Bunun
beraber iyileştirilmiş zeminlerin elastik modül (E50) /basınç dayanımı (UCS)
oranları da ayrıca araştırılmıştır.
Page 7
vii
Araştırma programının ikinci aşamasında, büyük ölçekli konsolidasyon tankları
içerisinde dört farklı yerleşimde ve üç tip karışım oranında model derin
karıştırma kolonları oluşturulmuş ve DMM ile iyileştirilmiş kil zeminin
konsolidasyon özellikleri araştırılmıştır.
Derin karıştırma kolonları ile iyileştirilmiş yumuşak kil zemin üzerinde yapılan
büyük ölçekli konsolidasyon deneylerinin sonuçlarına göre, iyileştirilmiş
yumuşak kil zeminin sıkışma özellikleri kolon parametrelerine, özellikle etkili
alan oranı ve karışım malzemesi miktarına bağlı olarak belirlenmiştir.
İyileştirme açısından kolon çimento miktarının (buna bağlı olarak tek eksenli
basınç dayanımı, UCS) en etkili parametre olduğu tespit edilmiştir. İyileştirilmiş
zeminin sıkışma modülünü belirlemek için kullanılan bağıntıların geçerliği
irdelenmiştir. İyileştirilmiş zeminin sıkışma modülünün tespitinde zeminin ve
kolon malzemesinin sıkışma modüllerinin kullanılmasının daha iyi sonuç
verdiği görülmüştür. Ön tasarım işlerinde kullanılabilecek şekilde, oturma
azaltım faktörü ile alan oranı ve çimento miktarı arasındaki ilişkiler tespit
edilmiştir. Oturma değerlerinden zemin ve kolon üzerindeki gerilmeler geri-
hesaplanmıştır. Gerilme oranları tespit edilmiştir.
Anahtar Kelimeler: Derin karıştırma, laboratuar modeli, karışım oranı, çimento
miktarı, alan oranı, tek eksenli basınç dayanımı-UCS, E50/UCS oranı, sıkışma
modülü, oturma azaltım faktörü, gerilme oranı
Page 8
viii
To my family and friends Pınar and Yagmur
Page 9
ix
ACKNOWLEDGMENTS
I would like to express my deepest gratitude to my supervisor Prof. Dr. Ufuk
Ergun, who has always supported and guided me throughout this study. Without
his supports this research would be impossible.
I would like to thank the members of the thesis progress committee of my thesis
for guiding me throughout the study.
I would also like to thank my professors and friends in the Department of Civil
Engineering, who helped me make this study possible. Special thanks to Onur
and Nejan for their friendly recommendations.
I would like to thank the Head of the Civil Engineering Department and also
Soil Mechanics Laboratory for their financial support.
Finally, I would like to thank my wife, my daughter and other members of the
family for helping me physically and mentally all the times.
Page 10
x
TABLE OF CONTENTS
ABSTRACT……………………………………………………………… iv
ÖZ………………………………………………………………………… vi
ACKNOWLEDGMENTS………………………………………………… ix
TABLE OF CONTENTS…………………………………………………. x
LIST OF TABLES………………………………………………………… xiii
LIST OF FIGURES………………………………………………………. xiv
LIST OF SYMBOLS AND ABBREVIATIONS…………………………. xviii
Page 11
xi
TABLE OF CONTENTS
CHAPTER
1. INTRODUCTION………………………………………………… 1
1.1 OVERVIEW AND PROBLEM STATEMENT………………. 1
1.2 RESEARCH METHODOLOGY AND OBJECTIVES………. 3
1.3 THESIS OUTLINE…………………………………………… 4
2. REVIEW OF LITERATURE …………………………………….. 5
2.1 BINDER TYPES AND AMOUNT…..……………………….. 6
2.1.1 Fly-ash…………………………………………………. 8
2.1.2 Cement………………………………………………… 14
2.2 ENGINEERING PARAMETERS OF STABILIZED SOIL….. 20
2.3 DEFORMATION CHARACTERISTICS OF STABILIZED
SOIL……………………………………………………………….
22
3. EXPERIMENTAL SETUP AND PROCEDURE………………… 28
3.1 MATERIAL SELECTION AND SAMPLE PREPARATION.. 28
3.1.1 Natural Soft Soil………………………………………... 28
3.1.2 Kaolinite clay…………………………………………… 29
3.1.3 Binder materials………………………………………… 30
3.2 PREPARATION FOR UC TESTS…………………………… 33
3.3 PREPARATION FOR LARGE CONSOLIDATION TESTS.. 35
Page 12
xii
3.3.1 Preparing kaolinite for large scale consolidation tests….. 35
3.3.2 DMC construction………………...…………………… 40
3.3.3 Performing the consolidation test……………………… 45
3.4 SUMMARY………………………………………………….. 49
4. EXPERIMENTAL RESULTS AND DISCUSSION……………... 50
4.1 UC TESTS FOR DETERMINING EFFICIENT BINDER
TYPE………………………………………………………………
50
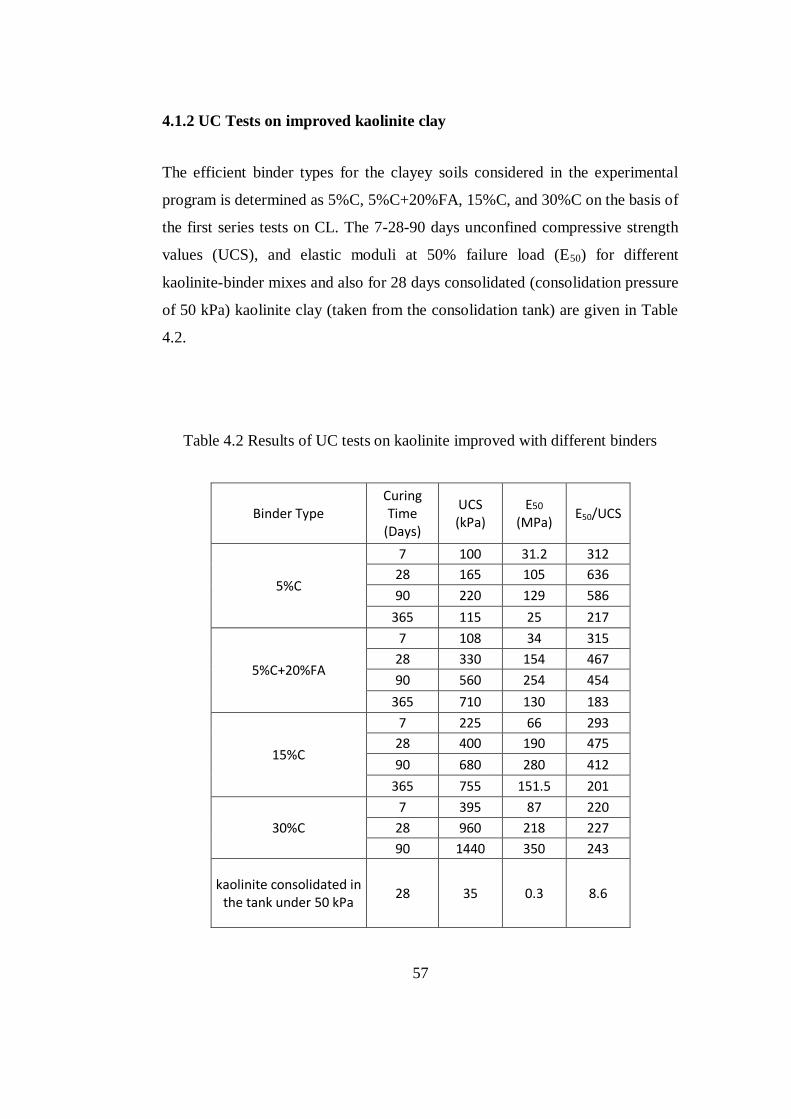
4.1.1 UC Tests on improved CL……………………………... 50
4.1.2 UC Tests on improved kaolinite clay………………… 57
4.1.3 Comparsion of results of tests on improved CL and
kaolinite………………………………………………………
63
4.2 LARGE SCALE CONSOLIDATION TESTS………………... 66
4.3 SUMMARY…………………………………………………… 98
5. CONCLUSION …………………………………………………… 99
5.1 GENERAL…………………………………………………….. 99
5.2 COMPRESSIVE STRENGTH OF CEMENT/ CEMENT
+FLY-ASH STABILIZED SOFT CLAY…………………………
99
5.3 CONSOLIDATION BEHAVIOR OF DMM GROUP
COLUMN IMPROVED SOFT CLAY……………………………
100
5.4 RECOMMENDATIONS FOR FUTURE RESEARCH……… 101
REFERENCES……………………………………………………………. 102
VITA………………………………………………………………………. 109
Page 13
xiii
LIST OF TABLES
TABLES
Table 2.1 Suitabilityof binders for different soils (EurSoilStab, 2001)...…. 7
Table 2.2 Chemical Requirements for FA Classification (ASTM C618)… 10
Table 2.3. The results presented by Yaprak et al. (2004)…………………. 13
Table 3.1 Mineralogical and chemical composition of kaolinite used ….... 30
Table 3.2 Mineralogical composition of ordinary portland cement used.… 31
Table 3.3 Mineralogical composition of the FA used ……………..……... 32
Table 3.4 Mineralogical composition of the MD used ……………..…….. 33
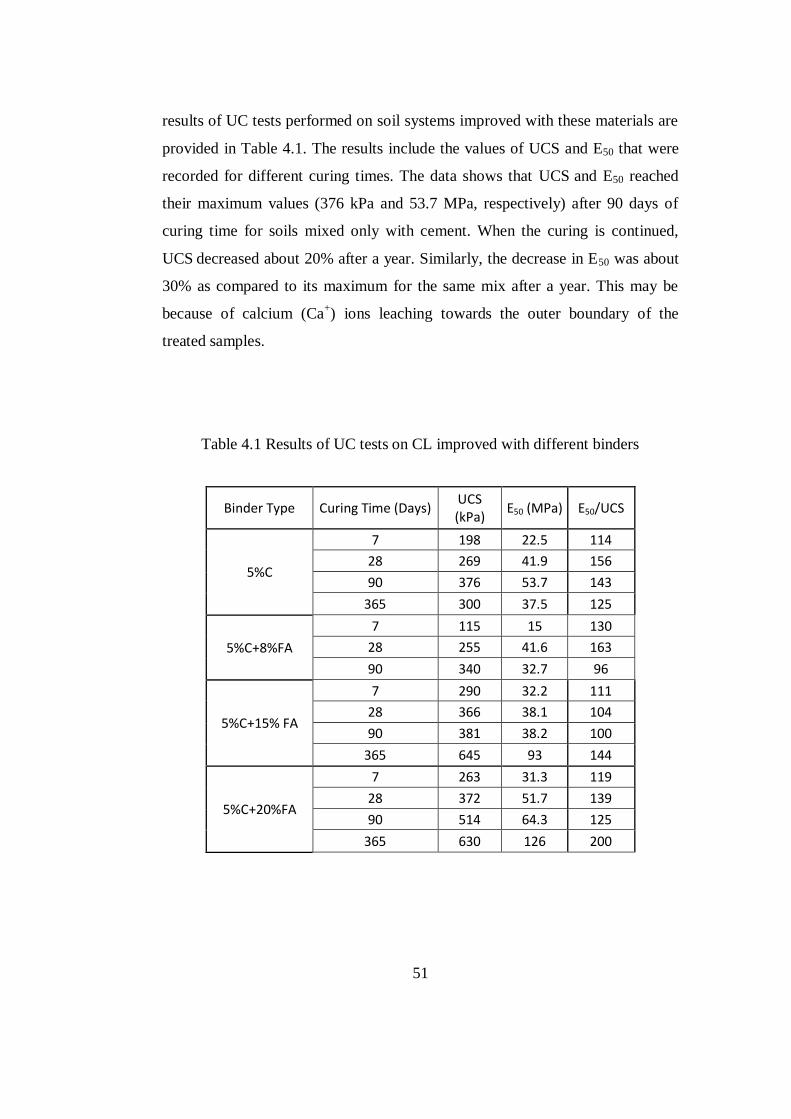
Table 4.1 Results of UC tests on CL improved with different binders…… 51
Table 4.2 Results of UC tests on kaolinite improved with different
binders……………………………………………………………………...
57
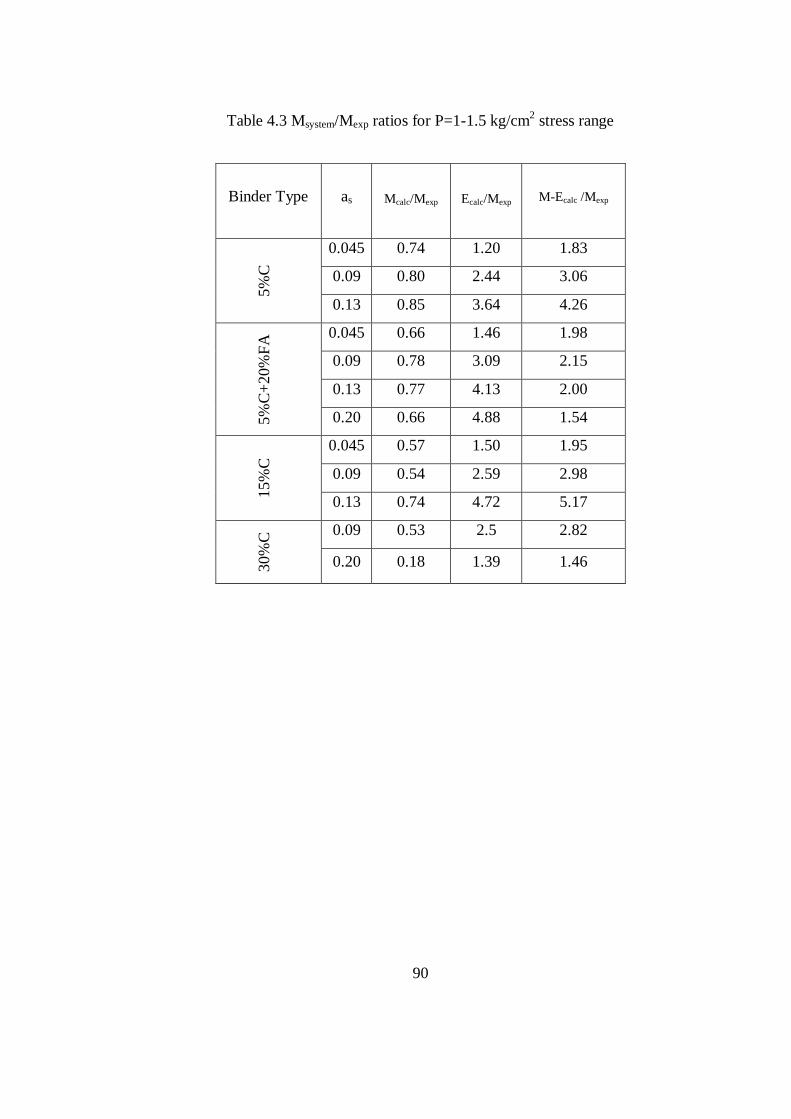
Table 4.3 Msystem /Mexp ratios for P=1-1.5 kg/cm2 stress range…………… 90
Table 4.4 Msystem /Mexp ratios for P=1.5-2 kg/cm2 stress range…………… 91
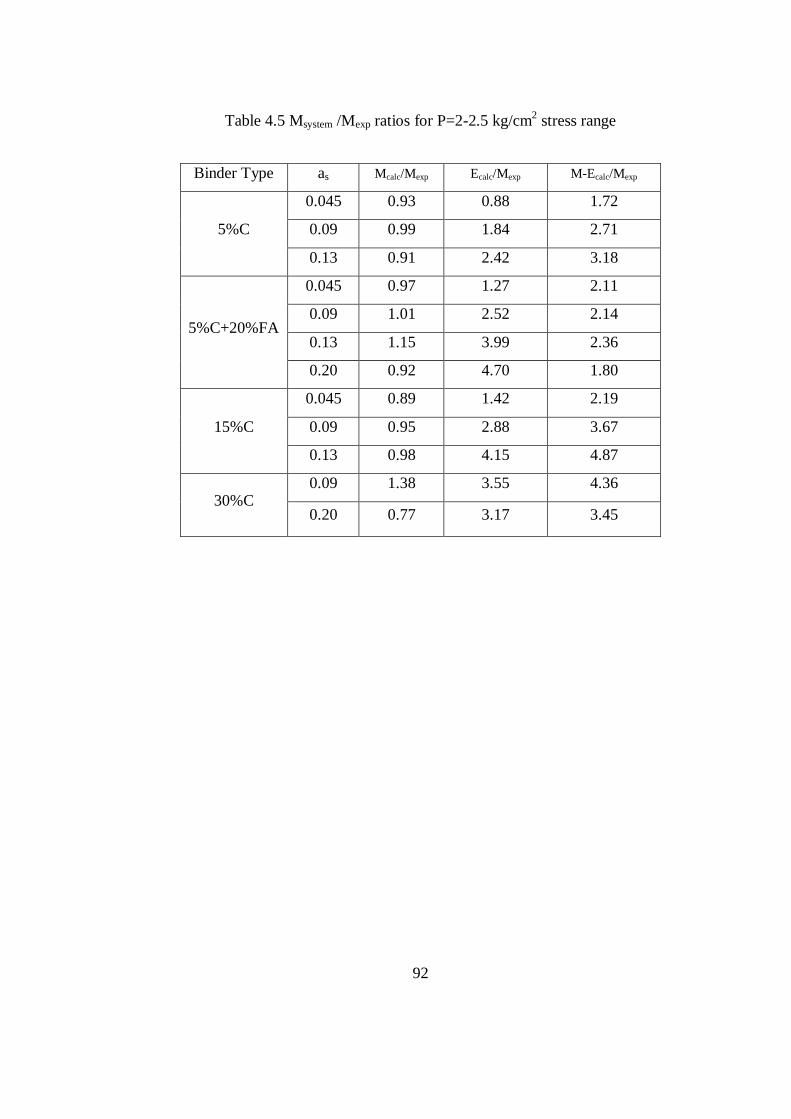
Table 4.5 Msystem /Mexp ratios for P=2-2.5 kg/cm2 stress range…………… 92
Page 14
xiv
LIST OF FIGURES
FIGURES
Figure 1.1 Typical scheme for DMM application……………………… 2
Figure 2.1 Typical areas of application for DMM (Terashi, 2009)…….. 5
Figure 2.2 Typical proportions of constituents for stabilized samples
(Al-Tabbaa et.al.)……………………………………………
6
Figure 2.3 A photo from electrostatic precipitators of Soma Thermal
Plant…………………………………………………………
9
Figure 2.4 Typical range of particle size distributions of PFA………… 9
Figure 2.5 The unconfined compressive strength (UCS) for stabilized a)
peat, b) clayey mud, and c) marl (Jaroslaw, 2007)………..
14
Figure 3.1 Consolidation tank filled with kaolinite……….…………… 36
Figure 3.2 An overview of the equipment used in the tests…………….. 37
Figure 3.3 The air pressure regulator (from the compressor to the air
pistons)………………………………………………………
38
Figure 3.4 The dial gauge checked consolidation under 50 kPa
loading……………………………………………………….
38
Figure 3.5 Typical consolidation curve of kaolinite in the large scale
consolidation tank……………………………………………
39
Figure 3.6 The leveling and height adjustment of clay in the tank…… 40
Figure 3.7 The plan view of 19 column system………………………… 41
Figure 3.8 The plan view of 38 column system………………………… 42
Page 15
xv
Figure 3.9 The plan view of 55 column system………………………… 42
Figure 3.10 The plan view of 85 column system………………………… 43
Figure 3.11 Drilling operation………………………………..………….. 43
Figure 3.12 Filling operation.……………………………………………. 44
Figure 3.13 The top view after the formation of the piles.………………. 45
Figure 3.14 The components of consolidation loading mechanism……... 47
Figure 3.15 The assembled system of test……..………………………… 48
Figure 3.16 CODA interface…………………………………………….. 49
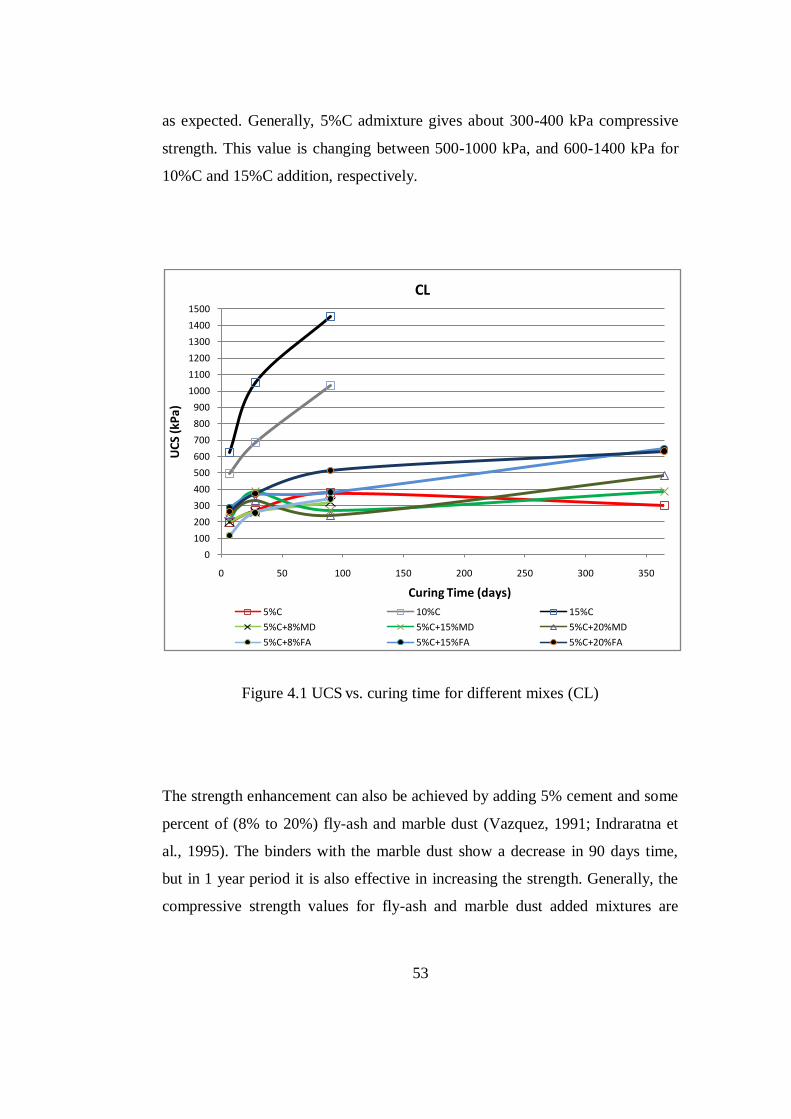
Figure 4.1 UCS vs. curing time for different mixes (CL)……………… 53
Figure 4.2 E50 vs. UC strength for a) cement mixes b) cement+fly-ash
mixes………………………………………………………..
55
Figure 4.3 E50/UCS vs. time for C and C+FA mixes…………………… 56
Figure 4.4 UCS vs. curing time for different mixes (kaolinite)………… 58
Figure 4.5 E50 vs. UCS for a) cement mixes b) cement+fly-ash mixes… 60
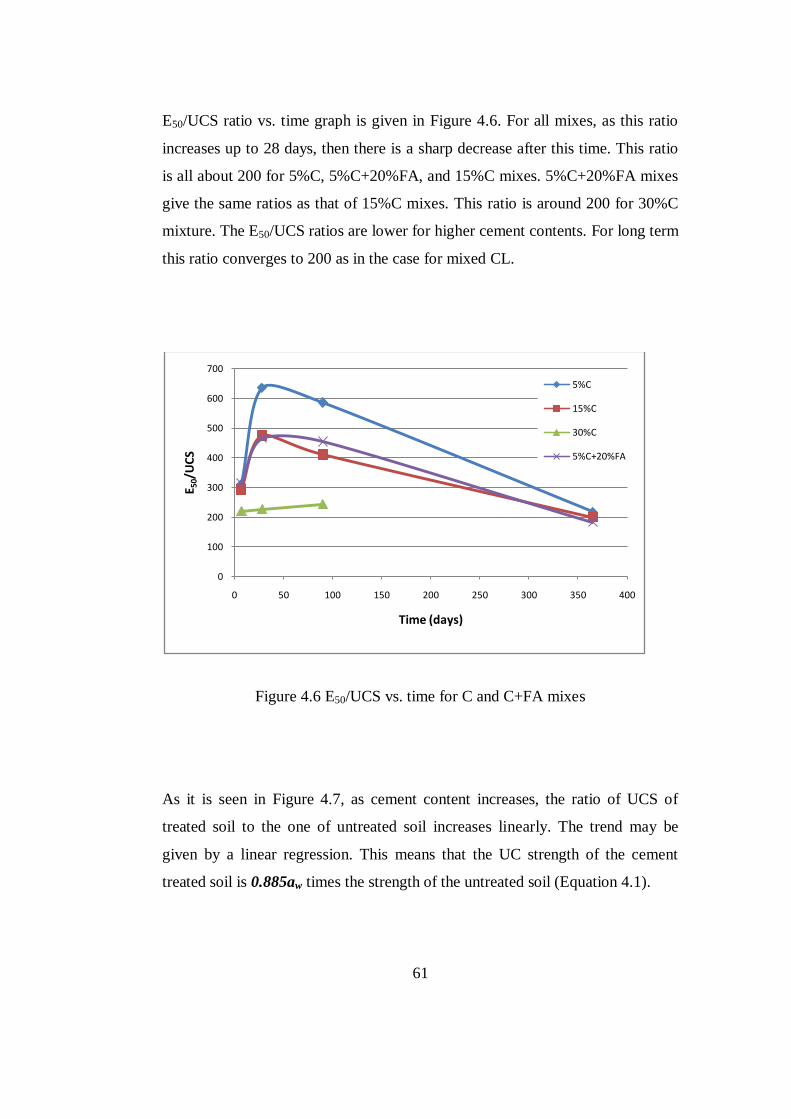
Figure 4.6 E50/UCS vs. time for C and C+FA mixes…………………… 61
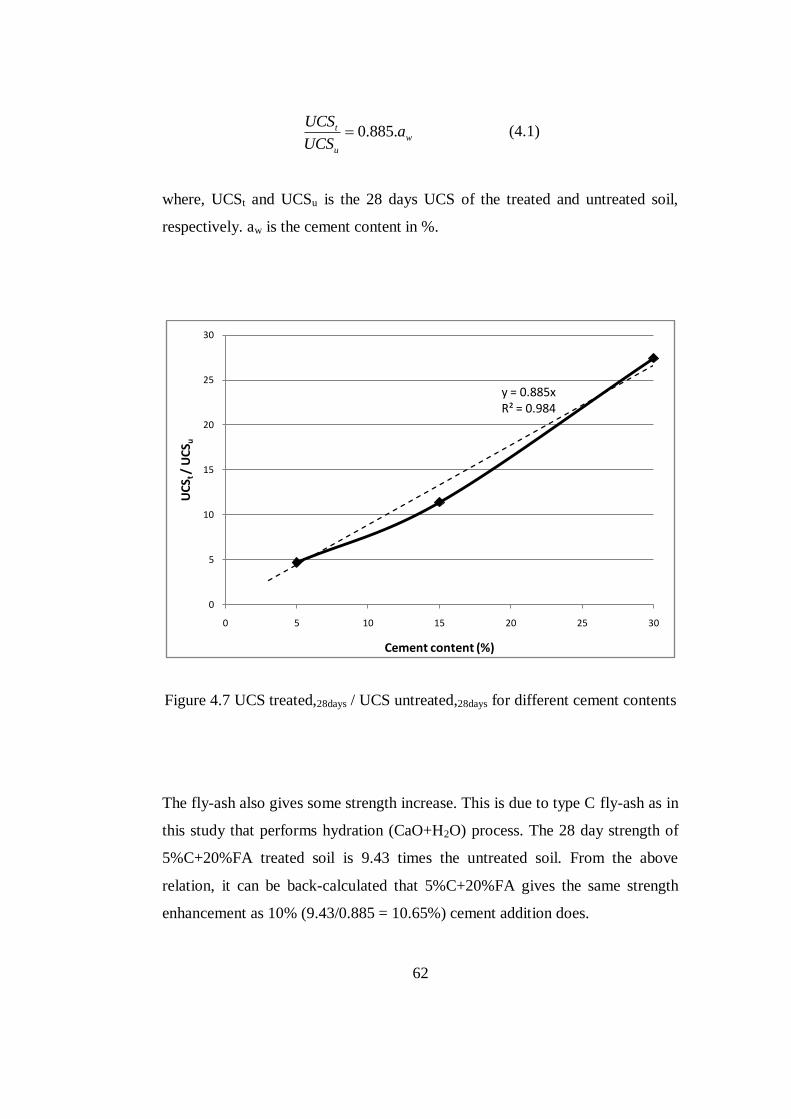
Figure 4.7 UCS treated,28days / UCS untreated,28days for different cement
contents………………………………………………………
62
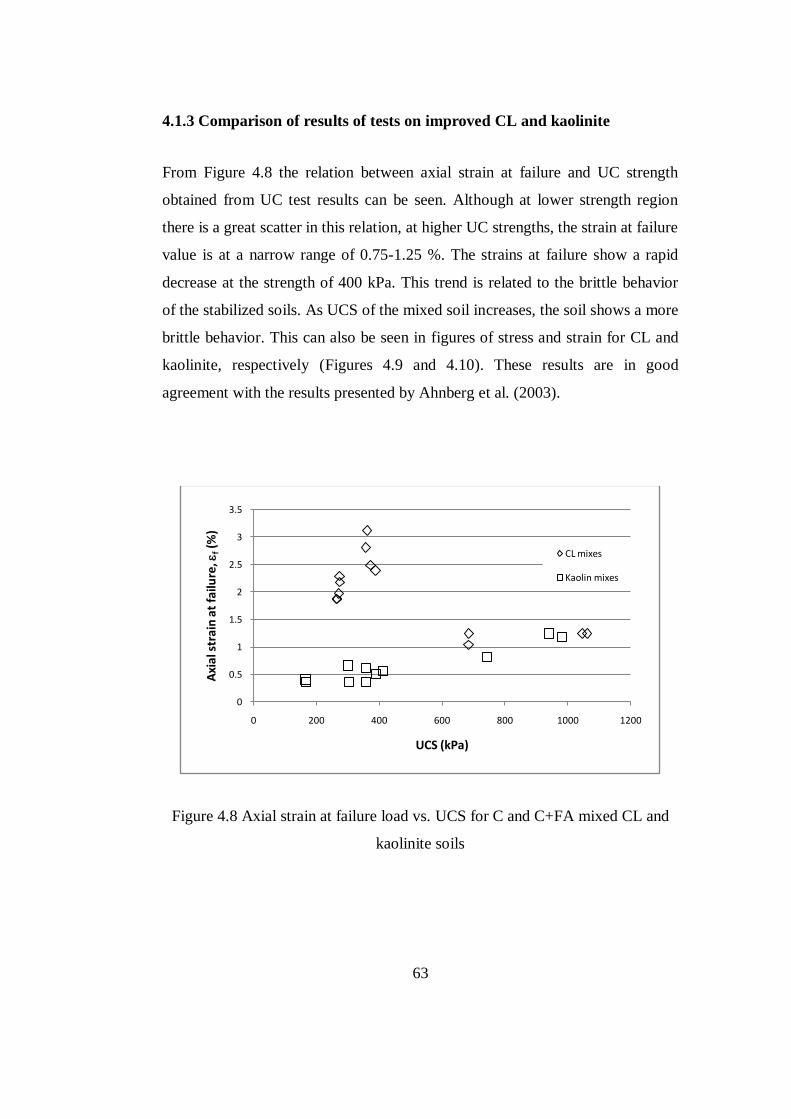
Figure 4.8 Axial strain at failure load vs. UCS for C and C+FA mixed
CL and kaolinite soils………………………………………..
63
Figure 4.9 Stress-strain for mixed CL…………………………………... 64
Figure 4.10 Stress-strain for mixed kaolinite...…………………………... 64
Figure 4.11 E50/UCS vs. cement content for C mixed CL and kaolinite
soils…………………………………………………………..
65
Figure 4.12 Stress-Strain diagram for all tests…………………………… 67
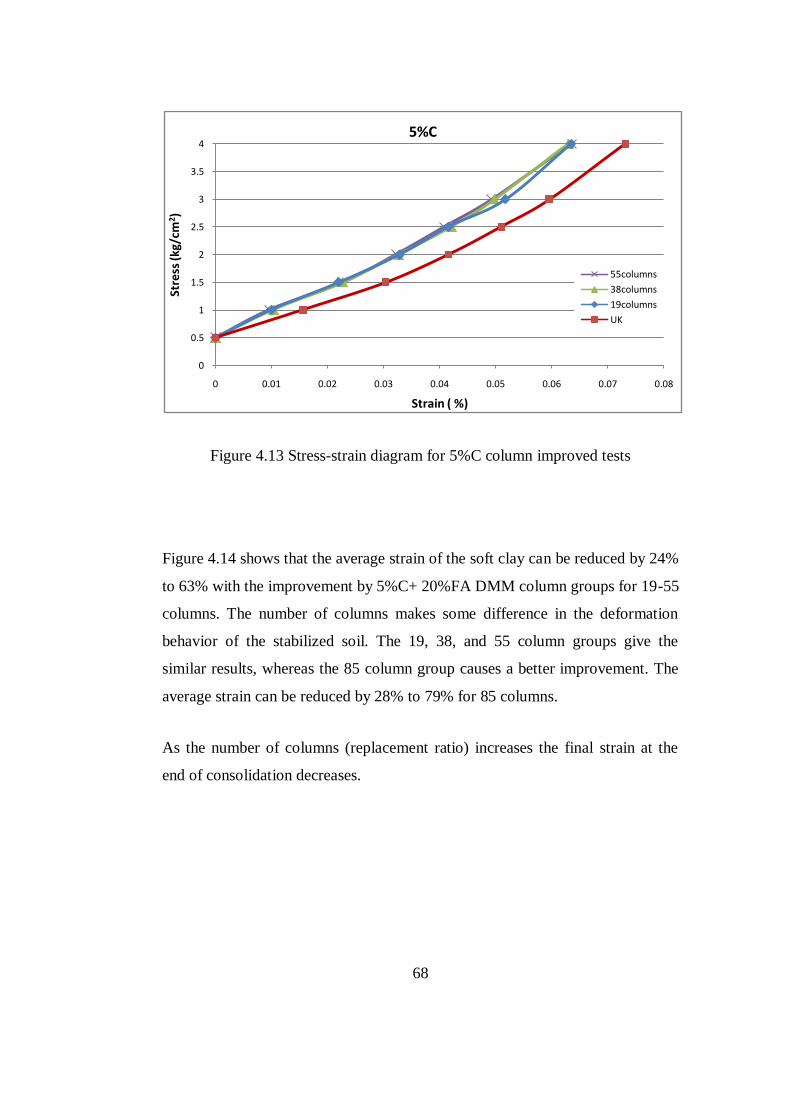
Figure 4.13 Stress-Strain diagram for 5%C column improved tests…….. 68
Page 16
xvi
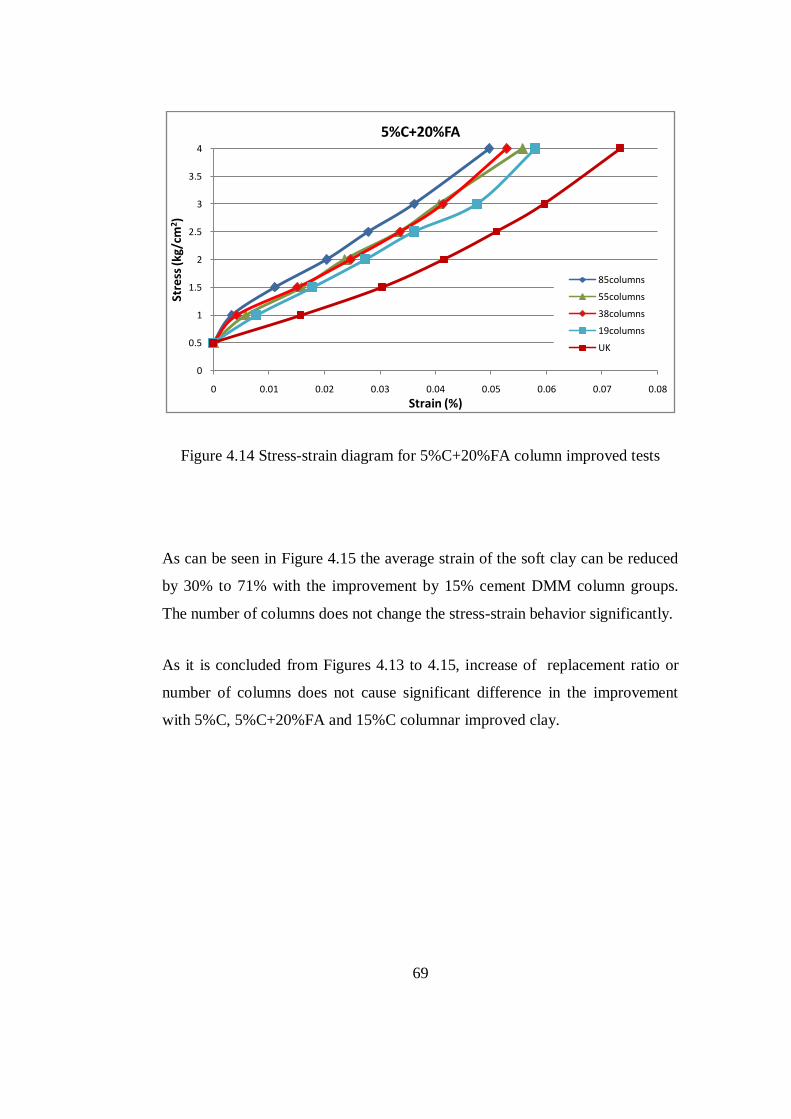
Figure 4.14 Stress-Strain diagram for 5%C+20%FA column improved
tests…………………………………………………………..
69
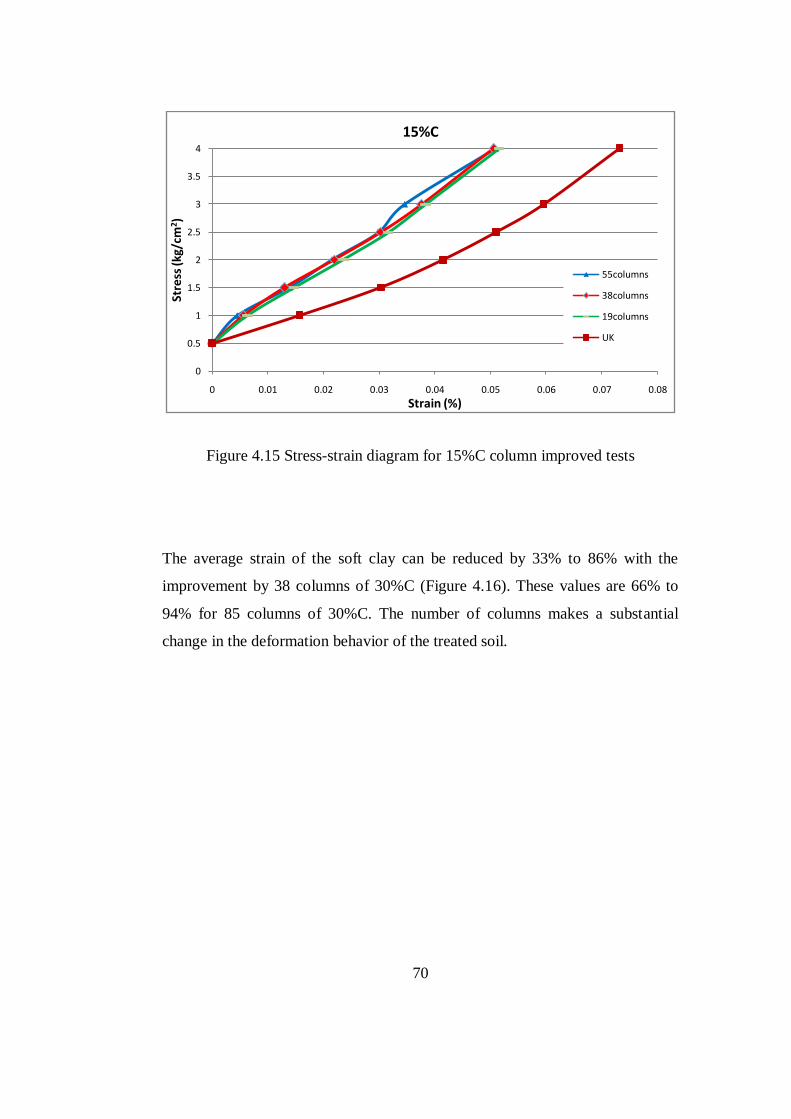
Figure 4.15 Stress-Strain diagram for 15%C column improved tests..….. 70
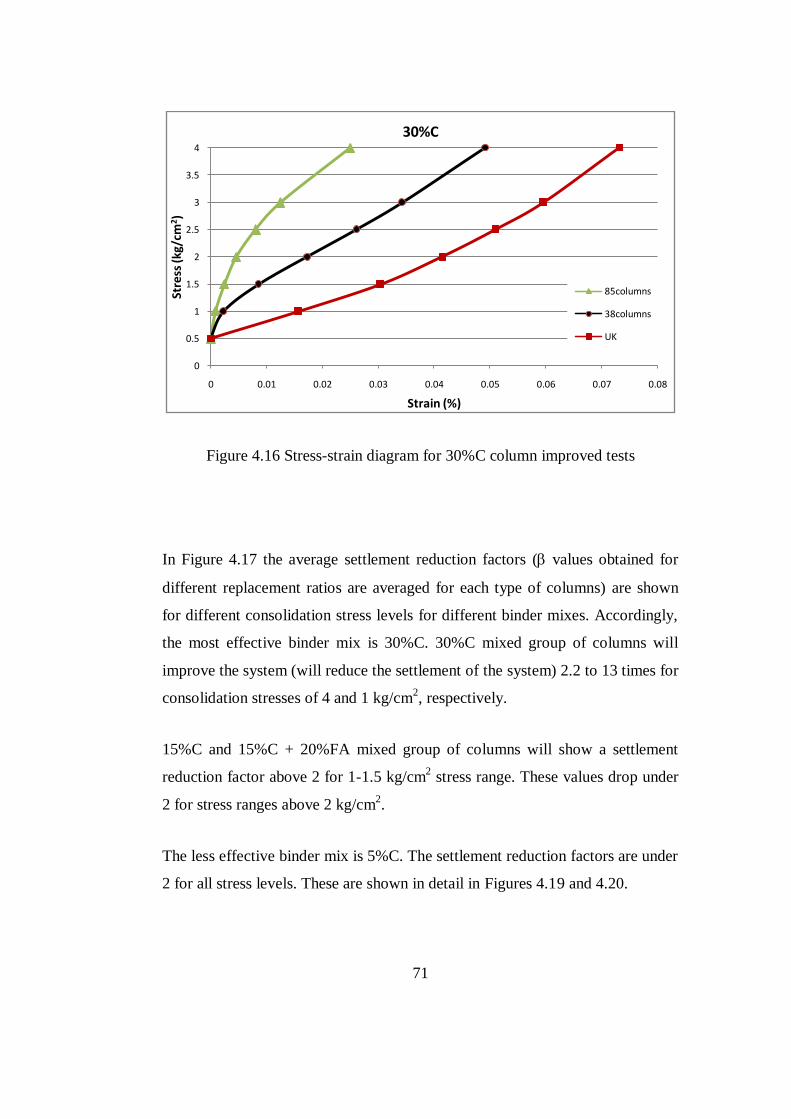
Figure 4.16 Stress-Strain diagram for 30%C column improved tests..….. 71
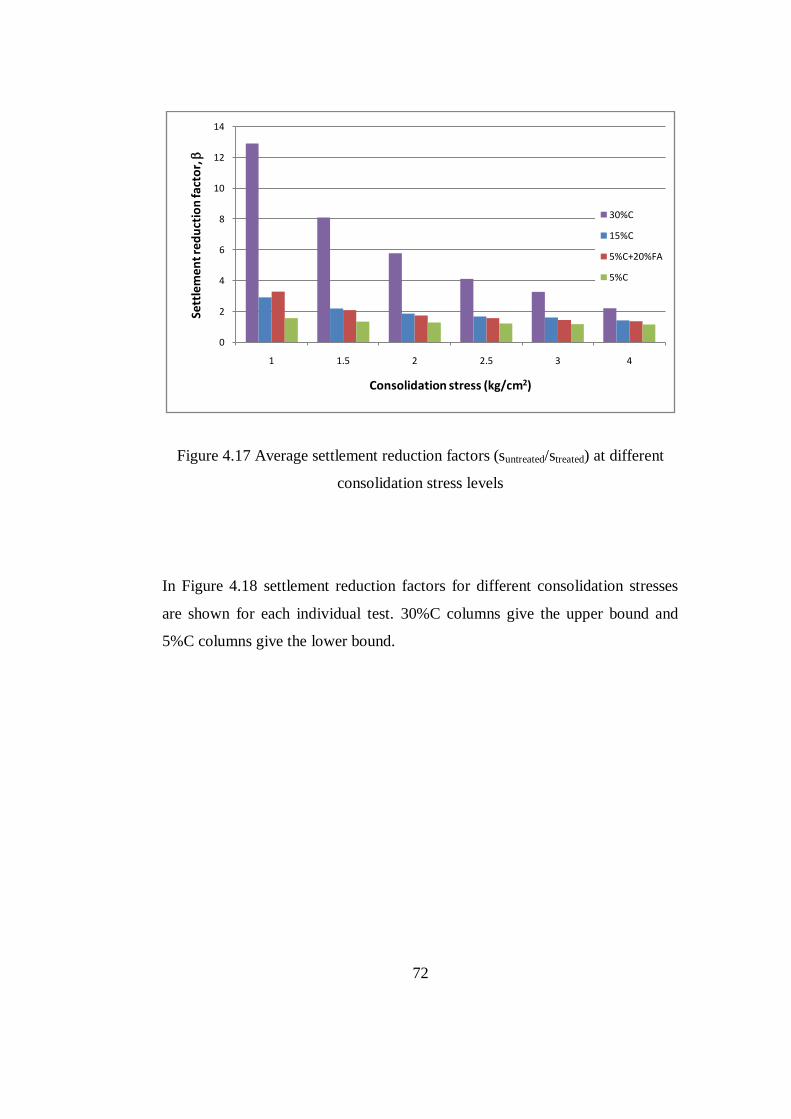
Figure 4.17 Average settlement reduction factors (suntreated/streated) at
different consolidation stress levels …………………………
72
Figure 4.18 Settlement reduction factor for different stress ranges for all
tests ………………………………………………………….
73
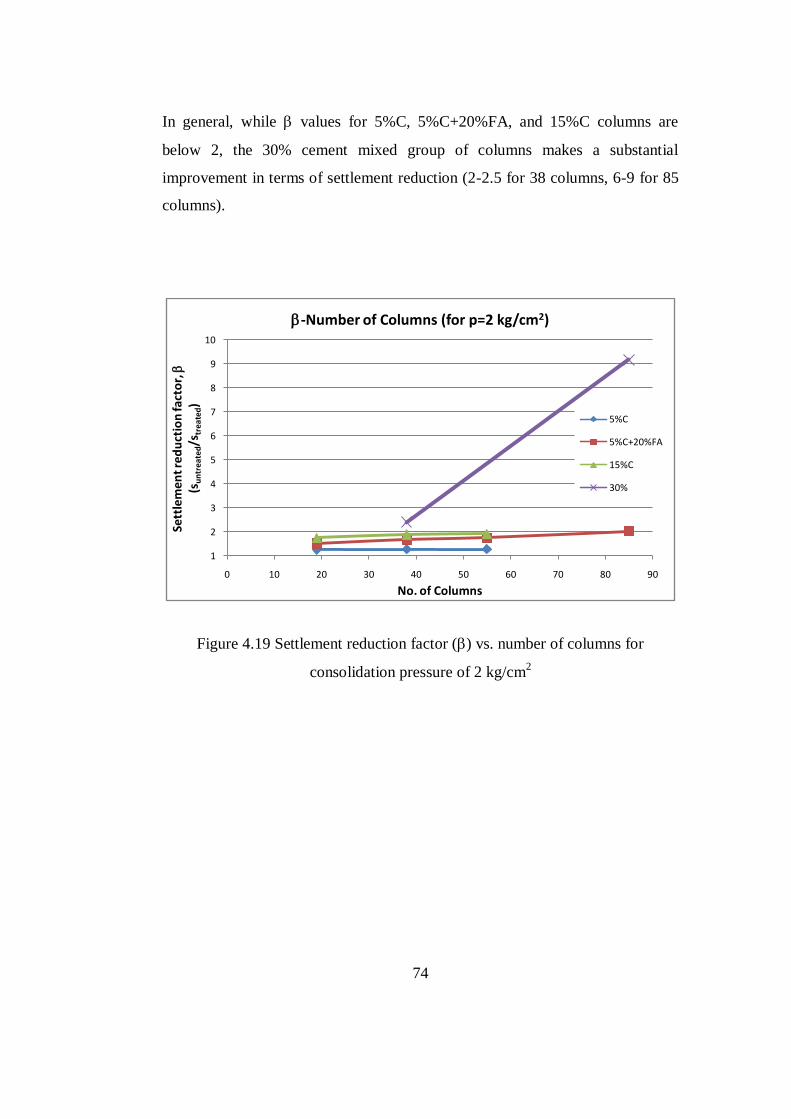
Figure 4.19 Settlement reduction factor () vs. number of columns for
consolidation pressure of 2 kg/cm2………………………….
74
Figure 4.20 Settlement reduction factor vs. no of columns for
consolidation pressure of 2.5 kg/cm2……………………….
75
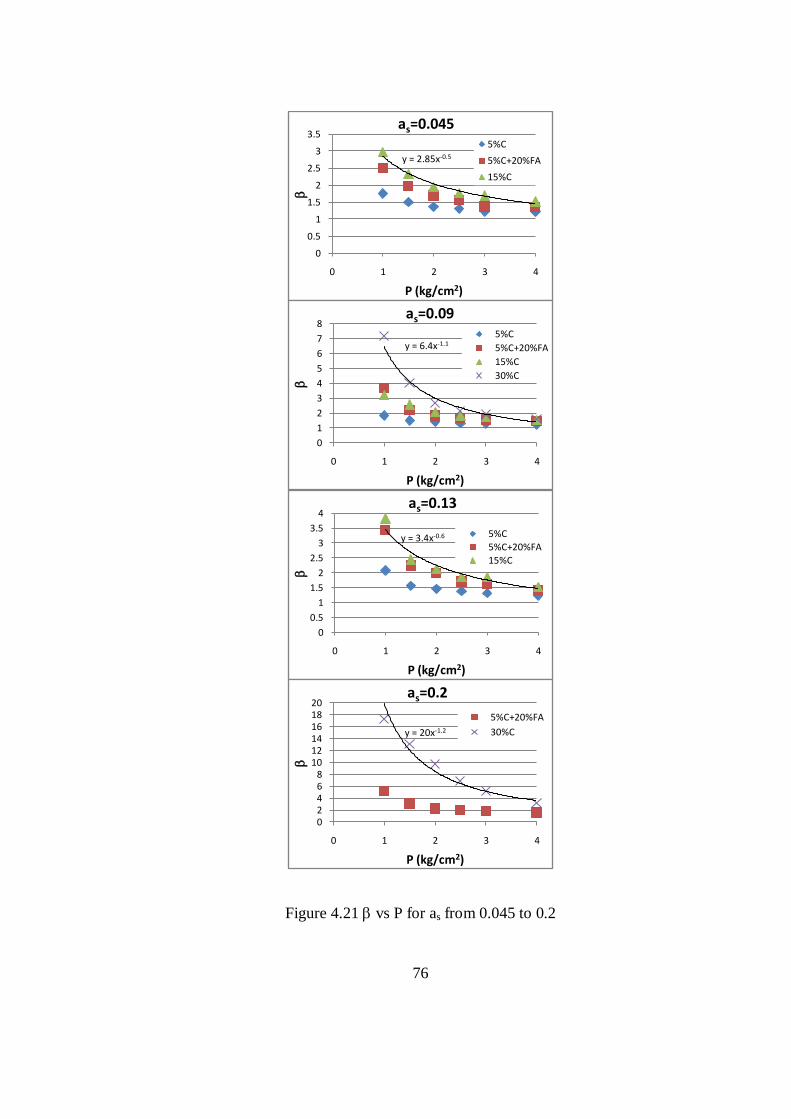
Figure 4.21 vs P for as from 0.045 to 0.2………………………………. 76
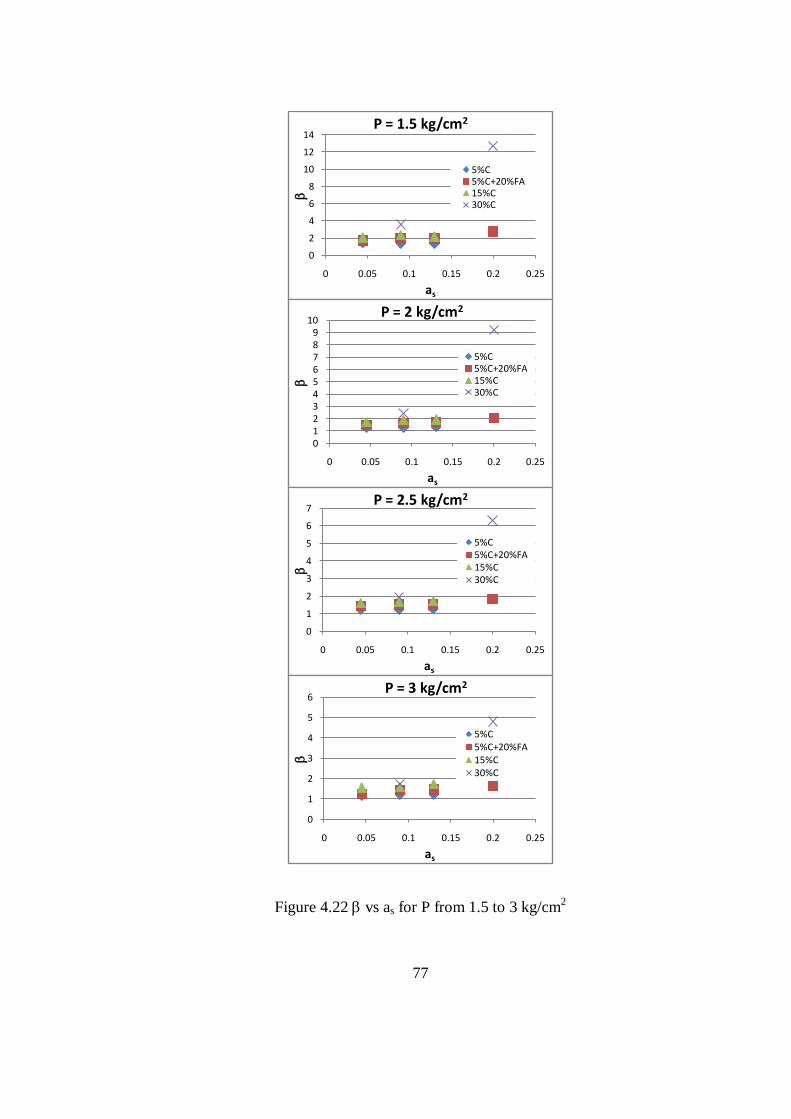
Figure 4.22 vs as for P from 1.5 to 3 kg/cm2………………………….. 77
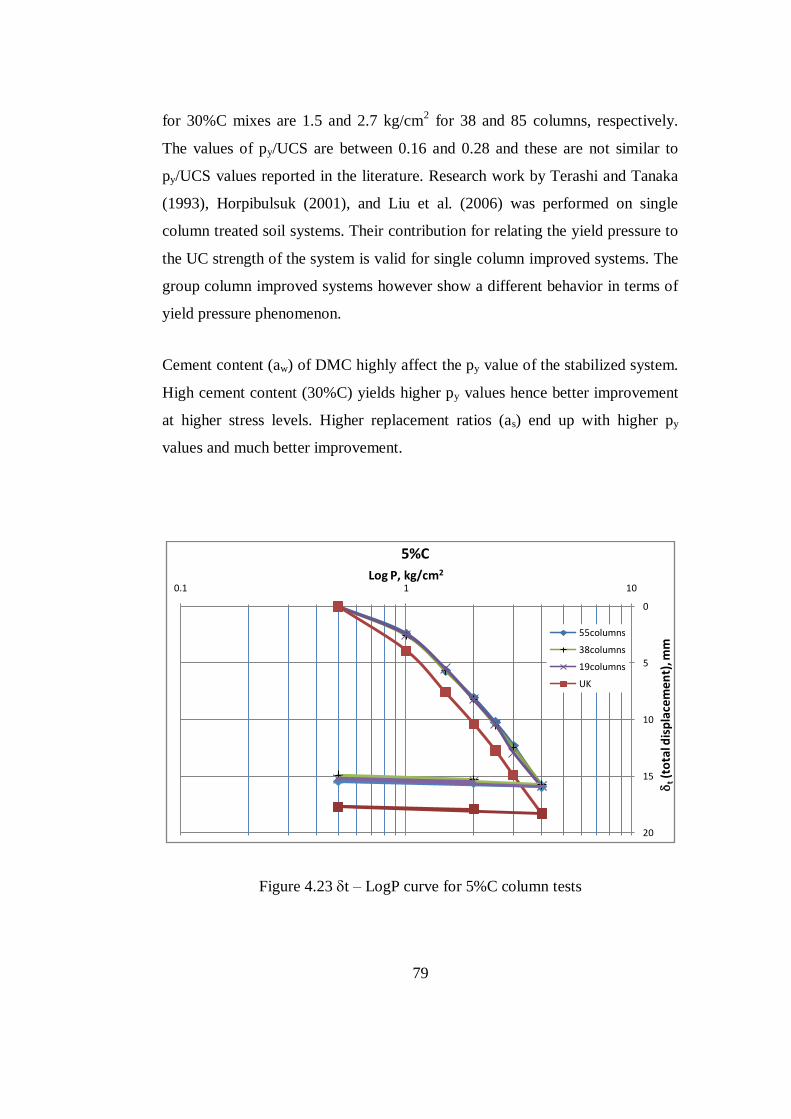
Figure 4.23 t – LogP curve for 5%C column tests …………….……….. 79
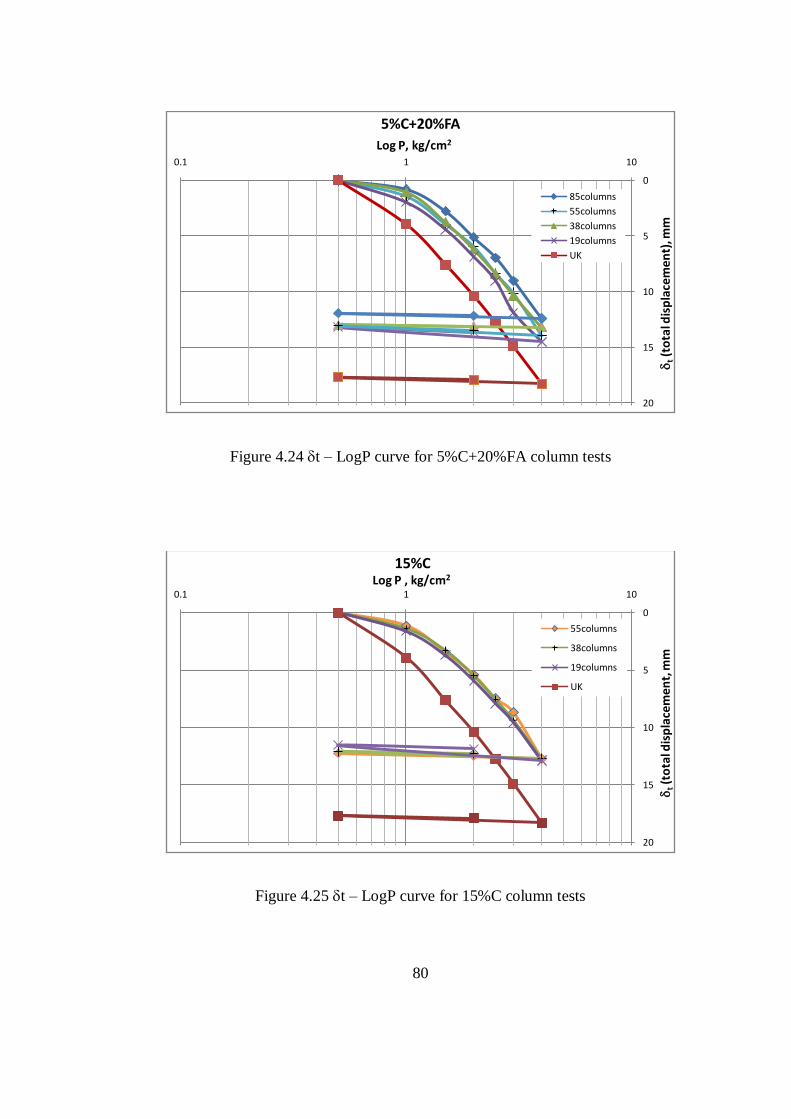
Figure 4.24 t – LogP curve for 5%C+20%FA column tests …………… 80
Figure 4.25 t – LogP curve for 15% column tests ……………………... 80
Figure 4.26 t – LogP curve for 30% C column tests …………………… 81
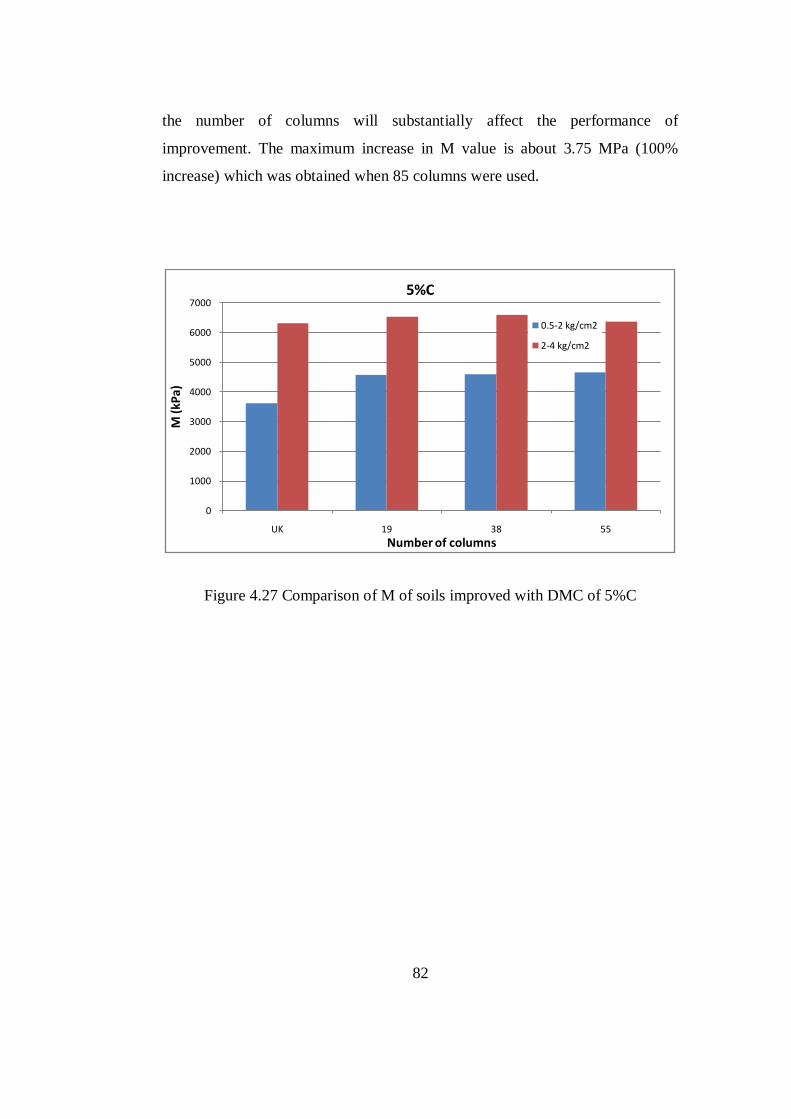
Figure 4.27 Comparison of M of soils improved with DMC of 5%C …... 82
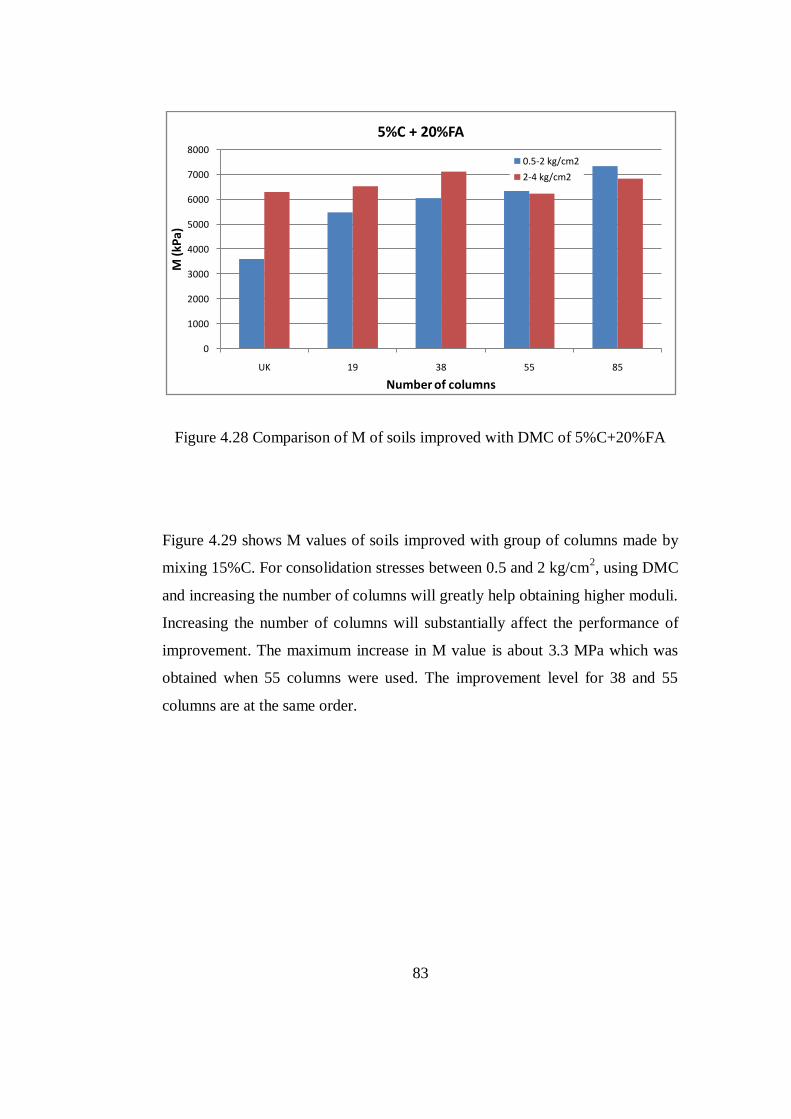
Figure 4.28 Comparison of M of soils improved with DMC of
5%C+20%FA ……………………………………………….
83
Figure 4.29 Comparison of M of soils improved with DMC of 15%C … 84
Figure 4.30 Comparison of M of soils improved with DMC of 30%C … 85
Figure 4.31 Comparison of M for all consolidation stress ranges ………. 85
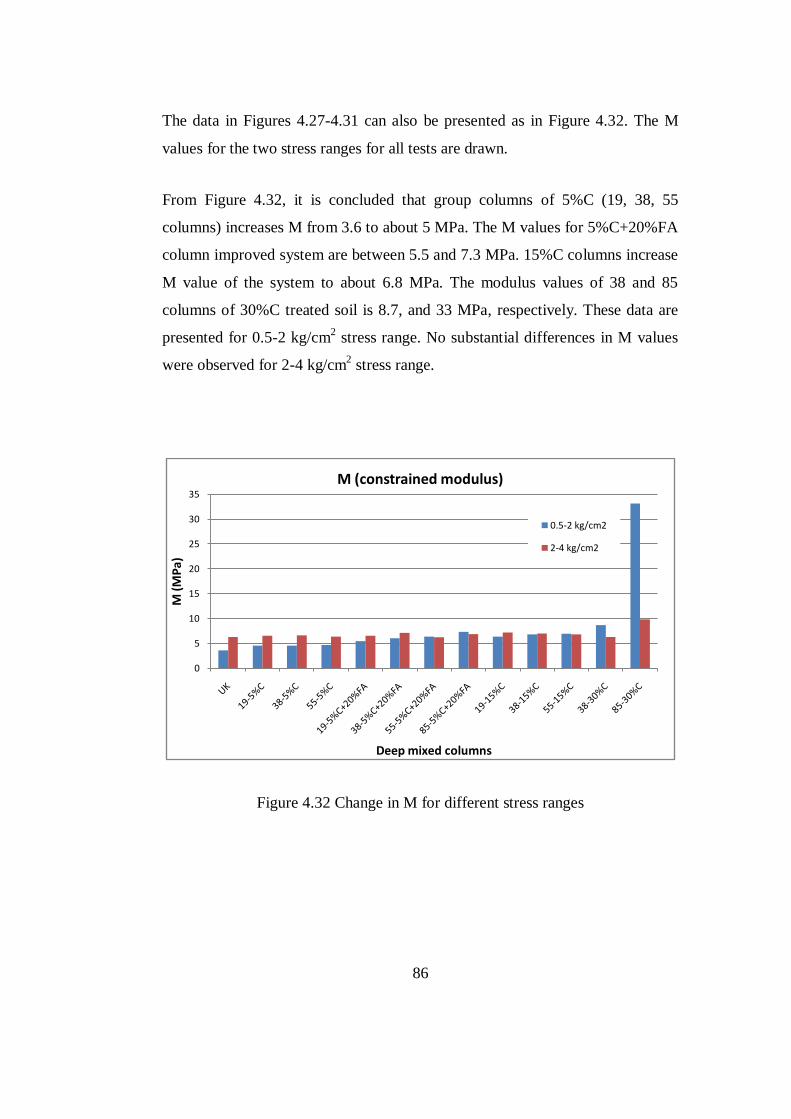
Figure 4.32 Change in M for different stress ranges ……………………. 86
Page 17
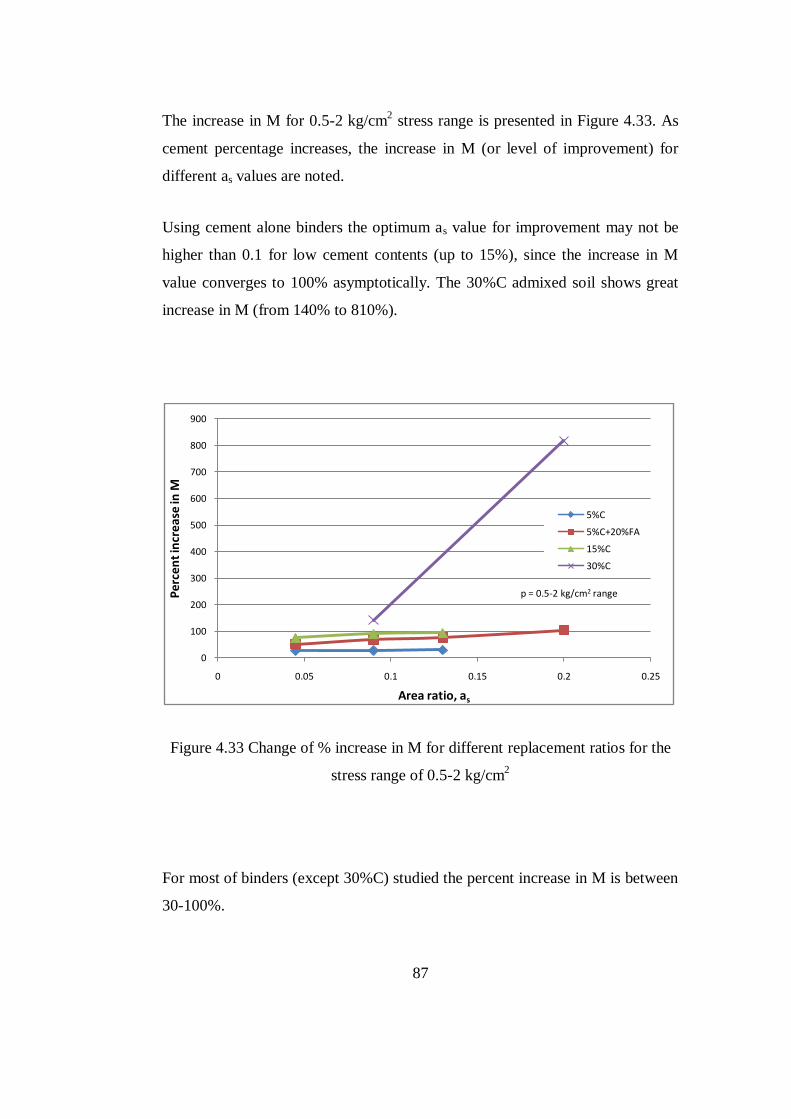
xvii
Figure 4.33 Change of % increase in M for different replacement ratios
for the stress range of 0.5-2 kg/cm2…………………………
87
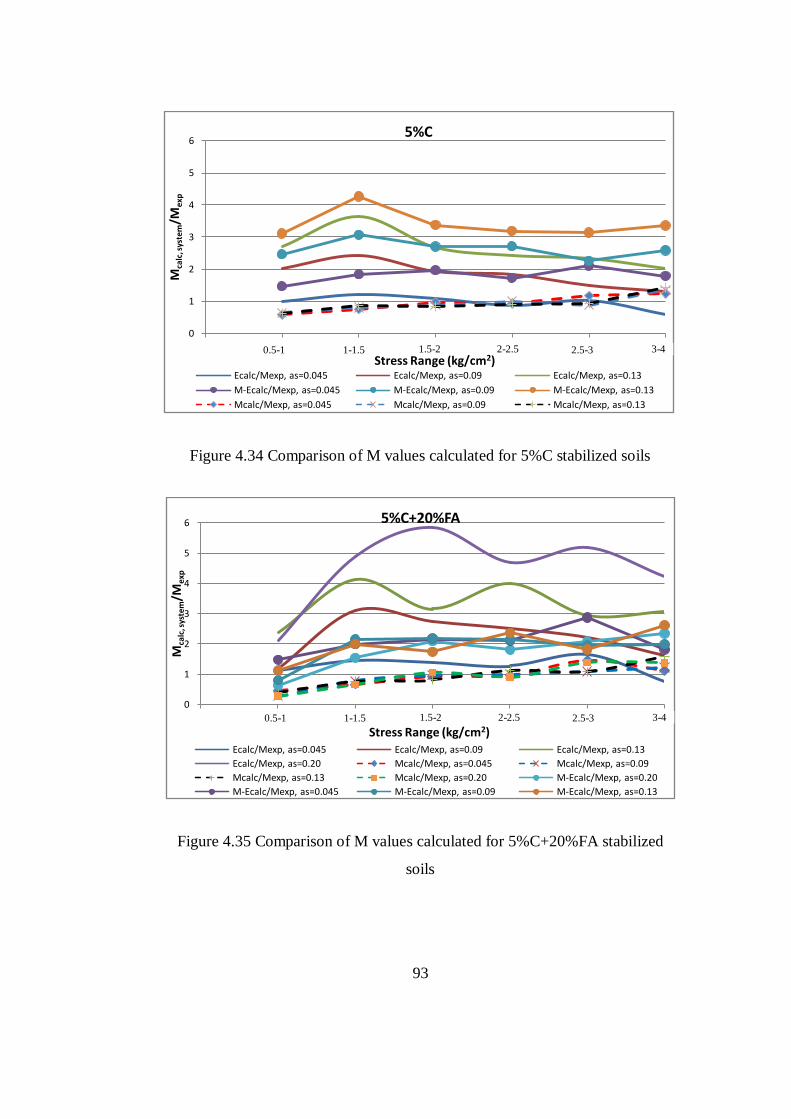
Figure 4.34 Comparison of M values calculated for 5%C stabilized
soils…………………………………………………………..
93
Figure 4.35 Comparison of M values calculated for 5%C+20%FA
stabilized soil….……………………………………………..
93
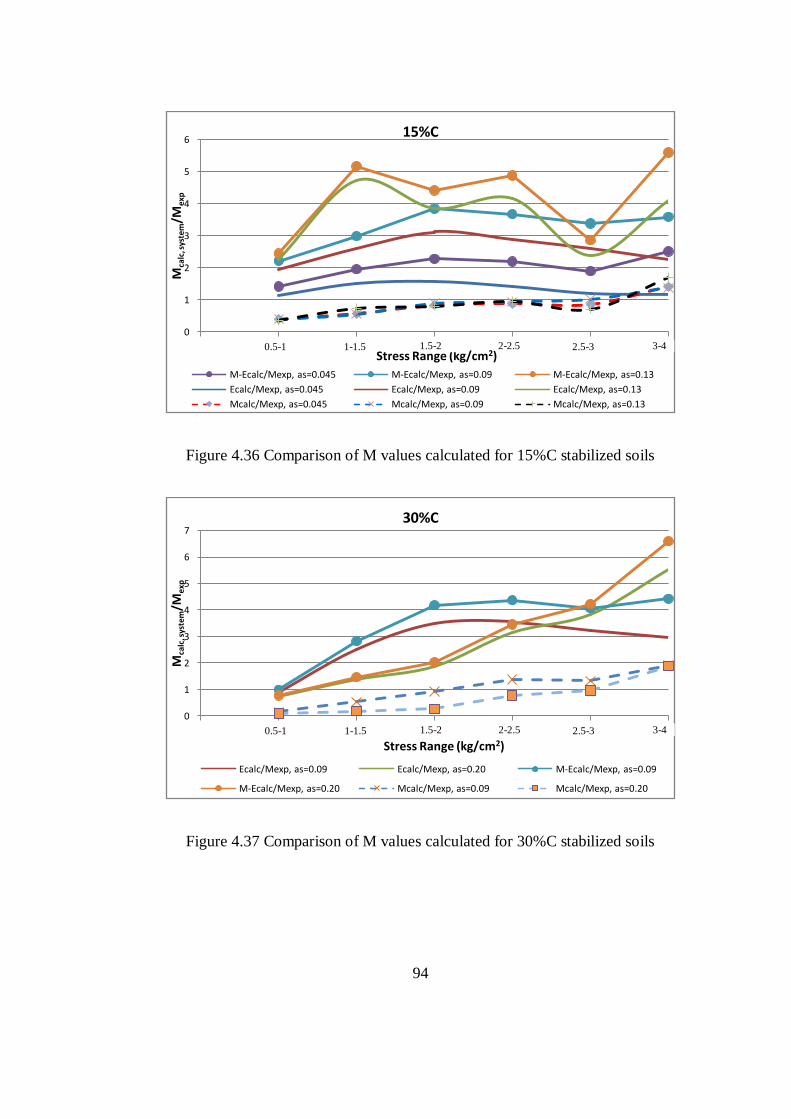
Figure 4.36 Comparison of M values calculated for 15%C stabilized
soils…………………………………………………………..
94
Figure 4.37 Comparison of M values calculated for 30%C stabilized
soils…………………………………………………………..
94
Figure 4.38 Comparison of constrained modulus (M) values for kaolinite
in the oedometer and large scale consolidation test ………
95
Figure 4.39 qcol/qsoil vs. as for P from 1.5 to 2.5 kg/cm2…………………. 97
Page 18
xviii
LIST OF SYMBOLS AND ABBREVIATIONS
as Replacement ratio; Ratio of area of the treated soil to the area of
the unit cell
aw Cement content; dry weight of cement / dry weight of soil to be
stabilized
Acolumns Total cross sectional area of the columns
Astabilized soil Tributary area of stabilized soil
Settlement reduction factor, ratio of settlement of untreated soil to
settlement of treated soil, suntreated/streated
C Cement
cu Undrained shear strength of the soil
DMC Deep mixing columns
DMM Deep Mixing Method
E Elastic modulus
E50 Secant modulus evaluated at stress levels related to 50% of the
failure load
Ecol Young’s modulus of the column
FA Fly-ash
FEM Finite element method
M 1D, Oedometer compression modulus
Mcol Oedometer compression modulus of the columns
Msoil Oedometer compression modulus of the untreated soil
MD Marble dust
mv Coefficient of volume compressibility
n Stiffness ratio between the treated and untreated soils,modular
ratio, ratio of oedometer compression modulus of column to that
of soil (Mcol/Msoil)
UCS Unconfined compressive strength
UK Untreated kaolinite
Page 19
1
CHAPTER 1
INTRODUCTION
1.1 OVERVIEW AND PROBLEM STATEMENT
Deep mixing method (DMM) is a columnar or mass type of ground
improvement technique used to strengthen the soil skeleton by directly injecting
cementitious or specially-formulated materials using special-purpose blending
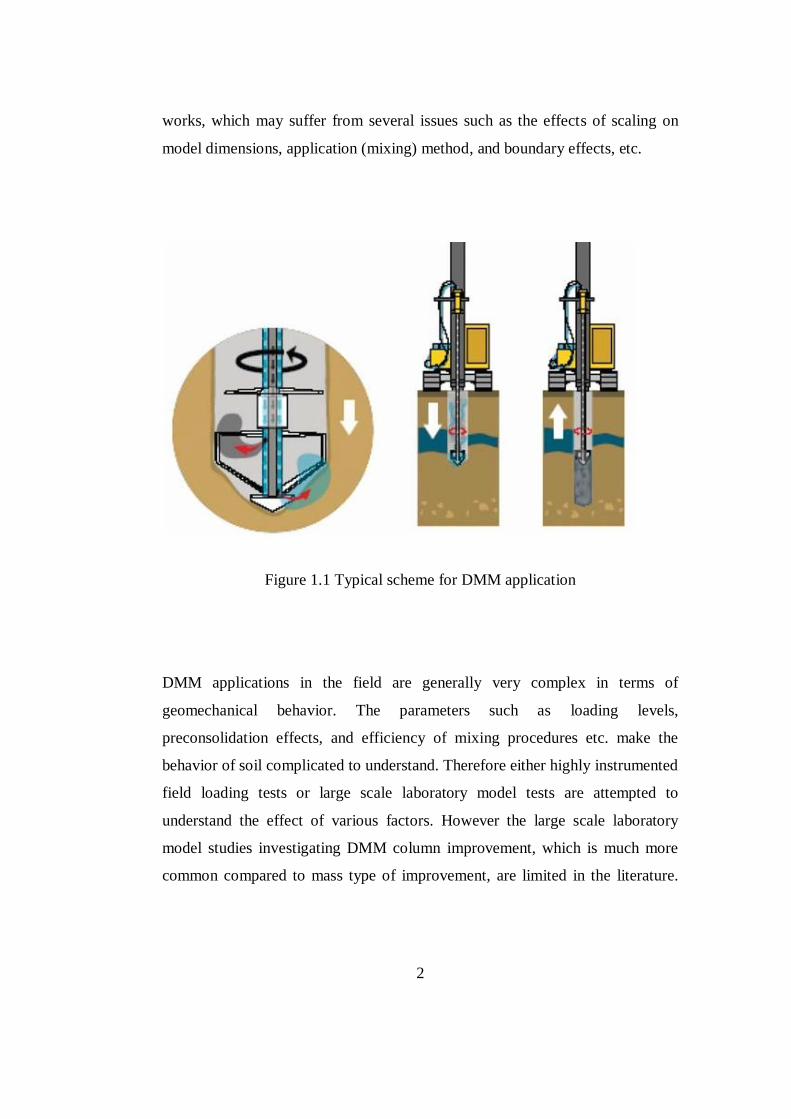
injection augers. A typical scheme for DMM application is given in Figure 1.1.
In general, the purposes of these methods are to reduce permeability and
compressibility and/or to increase the strength within the soil mass. Since 1980s,
various DMMs such as lime columns, cement mixing, and jet mixing have been
heavily used to improve the soft ground, especially highly compressible clayey
soils. For example, in Japan, thousands of kilometers of mixed columns are
performed every year. Although DMMs are frequently used in practice, there are
many unknowns at the design stage when a DMM is needed in a geotechnical
project.
The design of DMM is made based on mixed parameters calculated using
empirical relations. These relations mostly use the basic parameters of the
natural and improved soil, i.e. soilcrete. Although they have been widely used in
geotechnical design, these empirical relations may not always reflect the real
behavior of the soilcrete. They were developed using the laboratory modeling
Page 20
2
works, which may suffer from several issues such as the effects of scaling on
model dimensions, application (mixing) method, and boundary effects, etc.
Figure 1.1 Typical scheme for DMM application
DMM applications in the field are generally very complex in terms of
geomechanical behavior. The parameters such as loading levels,
preconsolidation effects, and efficiency of mixing procedures etc. make the
behavior of soil complicated to understand. Therefore either highly instrumented
field loading tests or large scale laboratory model tests are attempted to
understand the effect of various factors. However the large scale laboratory
model studies investigating DMM column improvement, which is much more
common compared to mass type of improvement, are limited in the literature.
Page 21
3
Therefore, a large scale modeling work is crucial to better understand the
behavior of DMM column improved soils.
1.2 RESEARCH METHODOLOGY AND OBJECTIVES
The behavior of DMM column improved soil has been investigated at a two-
staged laboratory work. In the first phase, laboratory mixed samples were
prepared with different binders (cement, fly ash and marble dust). Unconfined
compression tests were then applied on cured samples (curing times: 7, 28, 90,
and 365 days). Using the results of these tests, the most efficient binder mixes
were determined as the column material. These mixes were then used as the
improvement material at the next stage of the laboratory work.
In the second phase of this study, a setup for the large scale laboratory model
test was prepared. Several difficulties such as the methodology of column
production or the continuity of consolidation pressures for large scale model
tests were taken into account. To overcome such challenges, the mixed column
material was placed in the prebored pile holes with a special injection system.
Pile material hardened and interacted with the neighbouring soil and binder
material was diffused to the periphery. Then large diameter consolidation tests
on soft clays reinforced by end-bearing DMM columns were performed.
Through successful completion of this research, the following objectives are
achieved:
Compression characteristics of kaolinite clay reinforced by soil-cement
(soilcrete) mixes are explained through large scale 1D laboratory model
tests.
Settlement reduction factors for different binder mixes and replacement
ratios are determined.
Page 22
4
The load sharing between the soil and deep mixed columns are
enlightened.
The analytical expression of the compression modulus for the stabilized
system is obtained. Its validity is also examined.
The effects of replacement ratio, stress level and type/amount of
stabilizing agent are studied.
1.3 THESIS OUTLINE
This thesis is organized as follows: Chapter 2 gives the background work for
DMMs. The experimental setup and testing procedure of the large scale
laboratory model tests are described in Chapter 3. Results of these tests and the
discussion are given in Chapter 4. Finally, the conclusions are provided in
Chapter 5.
Page 23
5
CHAPTER 2
REVIEW OF LITERATURE
The aim of DMM improvement is to enhance the strength and to reduce
compressibility by means of cementation occurring between binders and soil. In
this chapter the material found in the literature about the binders and also the
properties of stabilized soils by deep mixed columns (DMC) is presented.
Typical proportions of areas of applications for DMM is given in Figure 2.1.
Figure 2.1 Typical areas of application for DMM (Terashi, 2009)
Page 24
6
Al-Tabbaa (2005) described the general composition for a stabilized soil as
shown in Figure 2.1.
Figure 2.2 Typical proportions of constituents for stabilized samples (Al-
Tabbaa, 2005)
2.1 BINDER TYPES AND AMOUNT
The choice of binder is a significant factor affecting the performance of
improvement. There exist many research studies in the literature to find the most
suitable type of binders, their volumetric content and possible combinations with
other additives for different soil types. These studies investigate different types
of agents that are used to meet different economical and/or environmental
constraints. The most common conclusion of these studies is that, in soil
stabilization works, an increase in the quantity of the stabilizing agent increases
the compressive strength at different rates, depending on the properties of the
soil and binder. They also mention the cement (C) is the most powerful binder
for soft soil stabilization (Ahnberg et al., 1995; EuroSoilStab, 2001). Among the
others, the most pronounced ones are lime, blast furnace slag cement (BFSC),
Page 25
7
pulverized fly-ash (PFA), gypsum, marble dust (MD), etc. By adding one of
these additives to the cement, the amount of cement is reduced and the long term
strength gain, i.e., durability, is achieved (Al-Tabbaa and Boes, 2002; Ahnberg
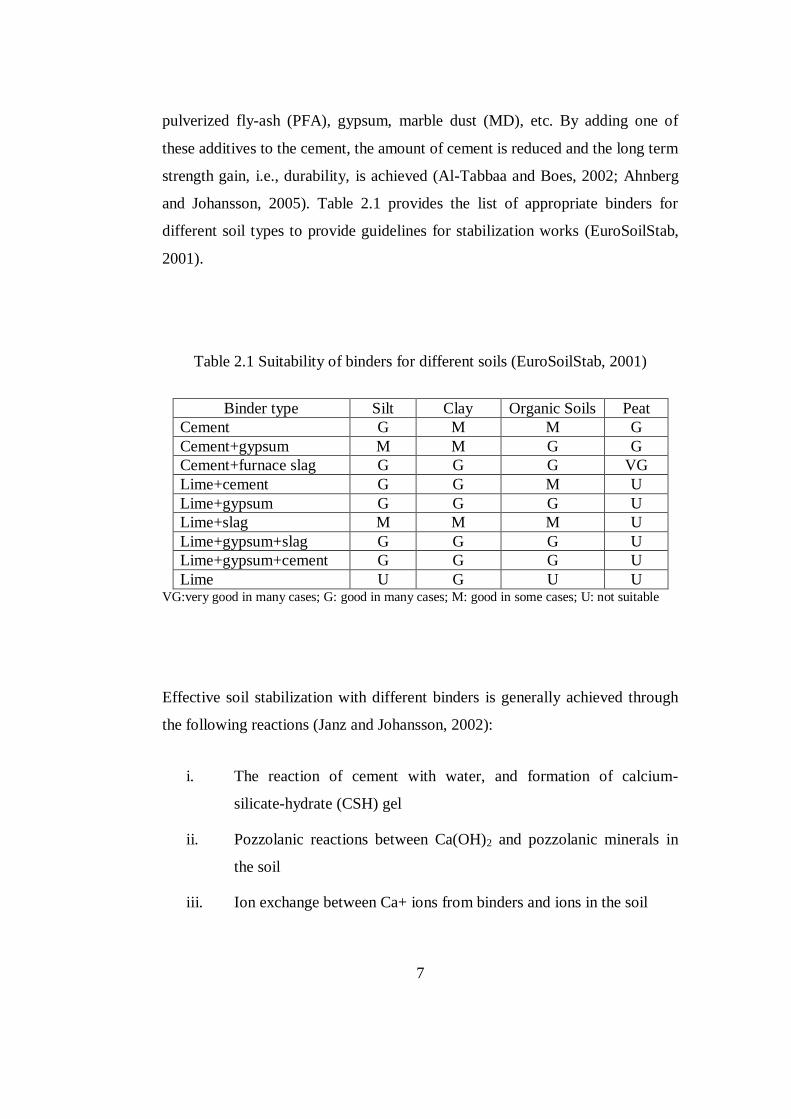
and Johansson, 2005). Table 2.1 provides the list of appropriate binders for
different soil types to provide guidelines for stabilization works (EuroSoilStab,
2001).
Table 2.1 Suitability of binders for different soils (EuroSoilStab, 2001)
Binder type Silt Clay Organic Soils Peat
Cement G M M G
Cement+gypsum M M G G
Cement+furnace slag G G G VG
Lime+cement G G M U
Lime+gypsum G G G U
Lime+slag M M M U
Lime+gypsum+slag G G G U
Lime+gypsum+cement G G G U
Lime U G U U VG:very good in many cases; G: good in many cases; M: good in some cases; U: not suitable
Effective soil stabilization with different binders is generally achieved through
the following reactions (Janz and Johansson, 2002):
i. The reaction of cement with water, and formation of calcium-
silicate-hydrate (CSH) gel
ii. Pozzolanic reactions between Ca(OH)2 and pozzolanic minerals in
the soil
iii. Ion exchange between Ca+ ions from binders and ions in the soil
Page 26
8
Some binders in this respect can be classified as cement; (i)hydration of
tricalcium silicate (3CaO.SiO2, C3S) and dicalcium silicate (2CaO.SiO2, C2S)
forming calcium silicate hydrate (CSH) gels, (ii) hydration of tricalcium
aluminate (3CaO.Al2O3, C3A) and ferrit (4CaO.Al2O3.Fe2O3, C4AF) forming
Calcium Aluminate Hydrates (CAH) gels, (iii) lime; formation of CaOH2 and
reaction with pozzolan and water forming CSH gel, (iv) blast furnace slag; after
activation by CaOH2 with the hydration of lime and cement; forms CSH gel, (v)
Fly-ash (FA); forming CSH and CAH gels with CaOH2, and (vi) silica fume;
same reaction chain with FA.
2.1.1 Fly-ash (FA)
PFA (mostly called FA) is a synthetic pozzolan created by the combustion of
coal. It can be described as a siliceous and aluminous material, which has a very
little (C class) or no (F class) cementitious component. FA consists of inorganic
matter present in the coal that has been formed during combustion. This material
is solidified while suspended in the exhaust gases and is collected by
electrostatic precipitators, an example of which is shown in Figure 2.2. FA
particles are usually of silt size (0.074 - 0.005 mm). A typical particle size
distribution is given in Figure 2.3.
Page 27
9
Figure 2.3 A photo from electrostatic precipitators of Soma Thermal Plant
Figure 2.4 Typical range of particle size distributions of FA
Page 28
10
The chemical composition and characteristic of FA changes with the type, origin
and character of the coal. The classification of FA can be done based on its
chemical ingredients. The basic classification is composed of two classes, class
F and class C. The chemical requirements to classify any FA are given in Table
2.2. (ASTM C-618).
Class-C FA is produced from lignite and sub-bituminous coals and usually
contains significant amount of Calcium Hydroxide (CaO) or lime. This class of
FA, in addition to having pozzolanic properties, has some cementitious
properties (ASTM C 618-99). The FA produced in Soma thermal plant is of C
type generally.
Table 2.2 Chemical requirements for FA classification (ASTM C-618)
Properties FA Class
Class F Class C
Silicon dioxide (SiO2) plus aluminum oxide
(Al2O3) plus iron oxide (Fe2O3), min, % 70.0 50.0
Sulfur trioxide (SO3), max, % 5.0 5.0
Moisture Content, max, % 3.0 3.0
Loss on ignition, max, % 6.0 6.0
Class-F FA is produced from burning anthracite and bituminous coals. This FA
has siliceous or siliceous and aluminous material, which possesses little or no
cementitious value. However, in a finely divided form and in the presence of
Page 29
11
moisture, it chemically reacts with calcium hydroxide at ordinary temperature to
form cementitious compounds.
The strength enhancement in FA admixture is caused by the hydration reaction.
Hydration is the formation of cementitious material by the reaction of free lime
(CaO) with the pozzolans (AlO3, SiO2 and Fe2O3) in the presence of water. The
hydrated calcium silicate (CSH) gel or calcium aluminate (CAH) gel
(cementitious material) can bind inert material together. For Class-C FA, the
calcium oxide (lime) of the FA can react with the siliceous and aluminous
materials (pozzolans) of the FA itself. Since the lime content of Class-F FA is
relatively low, addition of lime is necessary for hydration reaction with the
pozzolans of the FA. For lime stabilization of soils, pozzolanic reactions depend
on the siliceous and aluminous materials provided by the soil. The chains of
pozzolanic reactions are given in Equations 2.1 to 2.4:
CaO+H2O=Ca(OH)2 (2.1)
Ca(OH)2 => Ca++ + 2[OH]
- (2.2)
Ca++ + 2[OH]- + SiO2 => CSH (silica gel) (2.3)
Ca++ + 2[OH]- + Al2O
3=> CAH (alumina gel) (2.4)
Hydration of tricalcium aluminate in the ash provides one of the primary
cementitious products. The rapid rate, at which hydration of the tricalcium
aluminate occurs, results in the rapid set of these materials. It is the reason why
delays in compaction result in lower strengths of the stabilized materials. The
hydration chemistry of FA is very complex in nature. Therefore the stabilization
application must be based on the physical properties of the FA treated stabilized
soil and cannot be predicted based on the chemical composition of the FA.
To achieve maximum compressive strength in clayey soils, the lime content
should be 5 to 9 % and the FA content 10 to 25 %. The ratios of lime and FA are
Page 30
12
3 to 6 and 10 to 25 for granular soils, respectively. For self-cementing FAs,
addition of 10% and 15% material is sufficient for sandy soils and clays,
respectively (Vazquez, 1991).
Indraratna et al. (1995) investigated the effect of FA on the strength and
deformation characteristics of Bangkok clay. They concluded that with the
addition of a small quantity of cement or lime (5%) in addition to FA, a
significant improvement in strength and compressibility properties of the treated
soil can be achieved. Also noted that excessive amounts of FA (in the order of
25%) cause a reduction in overall undrained shear strength and also reducing the
enhancement of compressive strength in the long term.
Tomohisa et al. (2000) found that several kinds of FAs are effective hardening
additives on the muddy soil treatment. They stated that CaO and SO3 content of
the FA are effective in the stabilization. The main reaction products which
contribute to strength are ettringite and calcium silicate hydrate (CSH). 9%
cement stabilizer and 0, 5, 10% hardening additives were mixed with the soil.
Compressive strength values generally increases as additive percentage
increases.
Çokça (2001) has investigated the improvement of Soma (High calcium 19%)
and Tuncbilek (Low calcium 2%) Class-C FAs mixed with the swelling soils.
This study reported that addition of 20% FA decreased the swelling potential to
nearly the one obtained with the addition of 8% lime. It was observed that it is
better than 8% cement addition. There is a slight decrease in swelling potential
by increasing FA from 20 to 25%. Consoli et al. (2001) reported the most
efficient binder mixture as 4% lime and 25% FA.
The results of the studies by Mohamed and Hossein (2004) showed that 5% lime
and 10% FA is needed to form ettringite (aluminum is added to facilitate and
Page 31
13
enhance the formation of ettringite). Application of aluminum added fly-ash
(ALFA) process to high sulphate content soil has resulted in forming a solid
monolith capable of producing more than 1000 kPa of unconfined compressive
strength (UCS).
Yaprak et al. (2004) investigated the effects of Çayırhan FA (Ç-FA) and
Kardemir blast furnace slag (BFS) on the properties of the concrete. The highest
compressive strengths were obtained with 10% FA (382.5 kg PC42.5+4.25 kg
Ç-FA) and 20 % BFS (340 kg PC42.5+85 kg BFS) admixed concretes.
Table 2.3 The results presented by Yaprak et al. (2004)
UCS strength 7 days 28 days 90 days
Control (425 kg PC 42.5) 56,7 57,7 59,5
Ç-FA10 51,3 55,3 63,0
Ç-FA20 48,7 54,5 58,2
Ç-FA30 43,4 48,0 49,2
BFS10 54,0 58,5 59,8
BFS20 54,5 62,3 63,8
BFS30 51,1 59,0 60,8
Aydilek (2004) stated that, due to the absence of self-cementing potential, Class-
F FAs may be used with the addition of some amount of lime and/or cement for
improvement works. In this study, to investigate the effect of cohesion on
engineering properties of stabilized soil, kaolinite is also added to some
mixtures.Lin et al. (2007) reported that the bearing capacities of soft clay
(UCS=33 kPa) were increased by 3 times with an addition of 16% FA only.
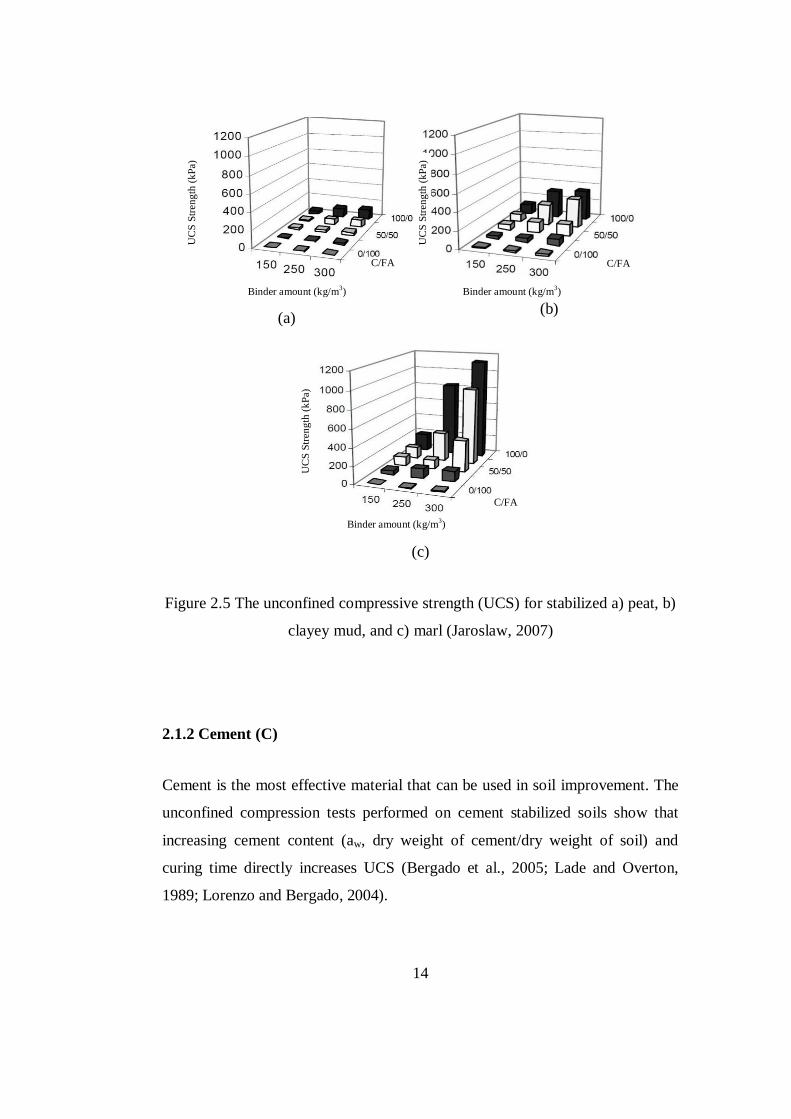
Jaroslaw (2007) stabilized the clayey mud, marl (calcareous clay) and peat with
cement and FA addition. The summary of this research is 75% cement-25% FA
is an effective mixture and it is given in Figure 2.5.
Page 32
14
(a) (b)
(c)
Figure 2.5 The unconfined compressive strength (UCS) for stabilized a) peat, b)
clayey mud, and c) marl (Jaroslaw, 2007)
2.1.2 Cement (C)
Cement is the most effective material that can be used in soil improvement. The
unconfined compression tests performed on cement stabilized soils show that
increasing cement content (aw, dry weight of cement/dry weight of soil) and
curing time directly increases UCS (Bergado et al., 2005; Lade and Overton,
1989; Lorenzo and Bergado, 2004).
Binder amount (kg/m3) Binder amount (kg/m
3)
Binder amount (kg/m3)
UC
S S
tren
gth
(k
Pa)
UC
S S
tren
gth
(k
Pa)
UC
S S
tren
gth
(k
Pa)
C/FA C/FA
C/FA
Page 33
15
Lorenzo and Bergado (2004) explained this phenomenon by the hydration of
cement. This reaction, as a result of calcium ions reacting with soil silica and soil
alumina, produces pozzolanic products bounding the clay minerals leading to
enhanced strength. It is assumed that there is enough water for chemical reactions
of hydration. As cement hydration and pozzolanic activity continues, the strength
of the treated soil continues to develop.
Bergado et al. (2005a) stated that the UC strength of cement stabilized soils
decrease with increasing total water content for specific cement content. This can
be explained as the water content increases the volumetric increase leading to the
increase in the distance between clay minerals and so the bonding between the
minerals and resulting strength decrease.
Miura et al. (2001) gives the 28 days strength of the stabilized soil with the
following relation;
UCS=A/Bwc/c
(2.5)
where, wc/c is the ratio of water content of stabilized soil to the cement content,
UCS is 28 days UCS, and A and B are constant dependent on the soil type and
binder.
Hayashi et al. (2003) performed detailed investigation on 17 years old deep
mixed (cement-mixed) columns and surrounding soils. They concluded that the
strength enhancement continues for long time for the central part of the
columns. The leaching of Ca ions to the surrounding soil causes some small
deterioration causing minor strength reduction. Kitazume et al. (2003) found the
same trend by performing laboratory tests on 1-year old cement-stabilized
kaolinite clay for different environmental conditions. The leaching of Ca ions,
the by-product of hyration of CaO present in the binder, from the Lime-C
Page 34
16
columns to the surrounding clay has been detected. The maximum distance at
which these ions transferred was determined as 50 mm. No valuable correlation
between Ca ion transfer and strength were drawn.
The ion transfer was also investigated by Larsson and Kosche (2005) through
laboratory testing of the transition zone surrounding seven different lime cement
columns installed in laboratory prepared kaolinite clay. The methods to mix the
cement were (i) dry mixing, (ii) wet mixing and (iii) casted columns. A large
number of laboratory and field tests; fall cone tests, natural water content,
Atterberg limits, undrained shear strength tests on cored samples from the
boundary of columns, were performed in the soil surrounding the columns for 7,
14, 30 and 90 days of curing times. The natural water content and the plastic
limit were unchanged in the boundary layer. The conclusion was that the
migration of calcium ions increases the undrained shear strength in a transition
zone, surrounding the columns about 30 mm from the column boundary.
Horpibulsuk et al. (2004) performed series of consolidated undrained triaxial
compression tests (CU-TX) on cement admixed (aw=6, 9, 12 and 18%) clay
samples. They investigated the cementation effects on strength for confining
pressures lower than the effective yield stress (py). As Horpibulsuk (2003) stated
that the cementation effect is insignificant after 28 days of curing, the tests were
performed on 28 days cured samples. According to the results of this laboratory
study, the deviator stress vs. strain plots for cement admixed clay show a peak
value which is the same for all confining pressures. This is related to the effect
of contribution of cementation on strength for qc<py (for stresses below the yield
stress). For post yield state (qc>py), the contribution of soil fabric effects on
strength comes into picture. Therefore the deviator peak strength increases with
the increase in confining pressure at this state. To conclude, for confining
pressures lower than the yield stress, strength is only dominated by cementation
Page 35
17
effect. However, as confining pressure increases and passes the yield stress, the
strength is a combination of cementation and the effects of soil fabric.
Kwan et al. (2005) performed a research program for the suitable ground
improvement technique which may be applied on the selected soft clay in
Australia. In addition to physical and index properties of the clays, UC tests and
oedometer tests were performed on stabilized soils to evaluate the strength
increase and the reduction in compressibility. In this study, highly compressible
Coode Island Silt (CIS) were improved by C, C+FA, C+BFS mixing. The binder
amounts were 10%, 15%, 20% and 30%. For 15%C mixes, FA and BFS were
added as 25%, 50%, and 75% of C to the binder. Water/cement ratio by mass are
0, 1% and 2%. Strength of treated soil increased along with the number of curing
days. C+FA was more effective in the improvement than C+BFS mixes. The
effective ratio of C and FA is 25% and 75%, respectively. Stabilization with
these binders changes the material behavior into a more brittle state. Maximum
stress was attained at a lower strain (1.25%) for cement treated samples. The
consolidation yield stress was observed in the oedometer test results. Increasing
the amount of cement shifted the compression curve towards the higher stress
region (yield stresses increased). Therefore it was concluded that a significant
improvement on the soil properties can be obtained by 15%C mixing.
Kwan et al. (2005) also strengthened Queensland soft compressible clay by
cement mixing. The results of UC tests and oedometer tests were presented for
this clay. The UCS of specimens were increased from 27 kPa to 482 kPa with
only 5%C addition. For 15%C addition 28 days UCS was reported to be 631 kPa.
The oedometer test results were on the order of 700-800 kPa for compression
yield stresses obtained with 10%C and 15%C addition, which also shows the
considerable compressibility improvement for these binder amounts.
Page 36
18
Ahnberg and Johansson (2005) also studies the variation in strength increase
when using different types of binder for three group of stabilized soils up to two
years after mixing in the laboratory. Various combinations of binders such as C,
lime, slag and FA were used in this study. The study was performed on both soft
clays and organic soil. Cement, lime, cement/lime, cement/slag, cement/FA,
slag/lime were binder mixtures used. The increase in strength of the samples was
investigated from UC tests performed on 7, 28, 91 and 364 days cured samples.
All mixes showed a considerable long-term increase in strength.
According to Jacobson et al. (2005), drying and re-wetting soils prior to mixing
can decrease mixture strength and it confirmed that lime can reduce mixture
strength for some soils. For cement-soil mixtures without lime, strength
decreases with increasing w/c ratio. In this study, the wet and dry methods for
DMM improvement were considered to support the new embankments to be
constructed on very soft and highly compressible organic silts and clays.
Replacement of C with lime by 25% to 75%C results in a relatively low increase
in mixture strength. UC strength plots for different w/c ratios were prepared and
used for estimating the amount of cement required to reach a desired laboratory
value of the UC strength.
Hernandez-Martinez and Al-Tabbaa (2005) presented UC test results on
stabilized peat specimens. Six different cementitious materials (C, cement-bfs,
cement-pfa, cement-pfa-lime, cement-pfa-MgO and lime-gypsum-bfs) were
used as additive to the peat to increase the UCS and stiffness. In addition, the
results of scanning electron micrograph analyses for the stabilized material were
presented. From UC tests on the stabilized specimens, the UCS and the initial
tangent elastic modulus were presented. The results showed an increase in
strength by curing time. It was concluded that cement alone binders are the most
effective binder material for strength enhancement of peat soils.
Page 37
19
In a laboratory study by Hayashi and Nishimoto (2005), it was reported that in
some cases ordinary Portland C may not be sufficient to obtain the desired
strength enhancement. If this is case, blast furnace cements must be used.
Similarly, Butcher (2005) intended to show the long term performance of DMC
improved organic soil using a slag cement binder 4 years after the improvement.
This study concluded DMC improvement of organic soils can provide a durable
long term solution in case of a correct binder design.
A study by Löfroth (2005) showed the long term performance of the 10 year-old
lime-cement columns at two different sites in Sweden. Long-term strength
increase in soilcrete and the influence on the surrounding soil was studied.
Determination of the calcium content in the clay indicates a slow migration of
calcium from the columns to the untreated clay closest to the column. The shear
strength of the lime-cement columns was determined by traditional column tests
in the field and also by unconfined compression tests on the coring samples in
the laboratory. At these two sites old column test results (50 days-old for one
and 1 year-old for the other) were also available. The comparison of the results
showed that the strength increase continued for the lime-cement columns for
long time. The elastic modulus at 50% failure load (E50) values of the cored
samples was 220 times the UCS.
All of the above studies reported that the use of binders was effective to a
certain extent such that they improve the performance when the appropriate
amount of binder is used for long-enough curing times.
Page 38
20
2.2 ENGINEERING PARAMETERS OF STABILIZED SOIL
In this section, the studies about the characteristics of the improved soils are
provided. The addition of different binder to the natural soil changes the strength
and deformation parameters by processes such as ion exchange, cement
reactions and pozzolanic reactions.
The addition of cement (C) to natural soils changes their engineering properties
through chemical reactions, namely the formation of CSH and CAH (Swedish
Deep Stabilization Research Centre Report No. 9, 2001). Uddin et al. (1997),
Kamruzzaman et al. (2000), Kasama and Zen (2000) and Miura et al. (2001)
reported that addition of C to clay soils for improvement changes the plasticity
behavior of the stabilized soil, which also results in a more brittle soil.
Uddin et al. (1997) and Miura et al. (2001) showed that the change in liquid
limit (LL) due to cement addition is insignificant. However, the plastic limit
(PL) significantly increases with the addition of C. Both studies concluded that
the plasticity index (PI) decreases with increasing C content.
Lorenzo and Bergado (2004) conducted UCS and oedometer tests on cement
(cement content is 5%, 10%, 15%, and 20%) stabilized soft Bangkok clay with
different remolding water contents (100%, 130% and 160%). They stated that
the unit weight of the treated soil increases as the cement content increases. This
is because the formation of cementing products increases the amount of solids in
a unit volume. In the same year, Horpibulsuk et al. (2004) stated that the friction
angle considerably increases with addition of small amount of C (6%) to the
soil. But further increase of C will not improve the performance significantly.
Massarsch (2005) reported the results of extensive static and dynamic field
tests (static loading test, various seismic tests and bender element test) and
Page 39
21
static laboratory tests (triaxial and direct shear tests) on soft plastic clay
improved by dry mixing. The amount of binder used in lime cement
columns100 kg/m3
and 150 kg/m3. Shear wave velocity, Vs and primary wave
velocity, Vp were determined by seismic tests. The deformation properties was
assessed from shear wave velocity values by
Mmax=.Vp2
Gmax=.Vs2.
Semi empirical relationships were proposed to estimate the shear modulus (G)
and E50 of fine grained soils as follows;
G/UCS = 200 (for plastic clays),
G/UCS = 2000 (for silty clays),
E50/UCS = 160 (from a scattered range of 240-475).
It was proposed that the modulus values from laboratory tests are about 2 to 3
times higher than those determined by in-situ tests.
Van Impe et al. (2005) performed laboratory tests on the mechanical behavior of
dredged sediments stabilized with ordinary Portland cement (C) and blast furnace
slag cement (BFC). The UCS was between 4 to 8 kPa. Laboratory UC tests
showed that in 2 years, UCS may increase to values between 1500 to 2000 kPa
with the addition of 275 kg/m3
binder (~15%). The results suggested that BFCs
have higher potential for the stabilization of soil compared to other binders. In
addition, cores taken from the field was also tested in the laboratory. The
comparison between UCS of samples obtained from the field to ones in the
laboratory yielded the ratio of 2 to 5.
Page 40
22
2.3 DEFORMATION CHARACTERISTICS OF STABILIZED SOIL
Terashi and Tanaka (1993) carried out series of model tests in large scale
oedometer cell (diameter: 300mm, height: 100 mm) to clarify the consolidation
behavior of composite ground. The first series of oedometer tests were
performed on soil-cement and soil-lime mixes, where Japanese marine clay was
stabilized. They defined a new concept called the consolidation yield pressure or
pseudo pre-consolidation pressure (py), which is directly proportional to UCS
the columns with a ratio of 1.3. The treated soils` coefficient of volume
compressibility (mv) is approaching to that of untreated one because the loading
on the composite ground is larger than value of py. In addition, large scale
oedometer tests were performed on clayey soil containing 15% cement treated
core in the middle. The results showed that the compressibility of the treated soil
is the same as the untreated one for consolidation stresses higher than py.
Kamruzzaman et al. (2000) performed laboratory UC and oedometer tests on
cement stabilized Singapore marine clay. It was found that the consolidation
properties of the soil are improved greatly by increasing C content. The addition
of C increases the pre-consolidation pressure of the stabilized soil. The values of
py were reported to be 60 kPa, 400 kPa and 1500 kPa for untreated clay, 10%
cement treated clay and 30% cement treated clay, respectively. The same
phenomenon was also observed in other research studies (Bergado et al., 2005;
Lorenzo and Bergado, 2004). The yield compression stress was affected only
by the C content. However, Lorenzo and Bergado (2004) stated that the
compression index at the post yield state, where compression stress are greater
than the yield stress, is effected by the C content. In other words, an increase in
aw results in an increase in post yield compression index. This is mainly because
of the excessive yielding of the soil at high stress levels and sudden break of the
cementation bonds. Lorenzo and Bergado (2004) also showed that for the same
Page 41
23
C content, the post yield compression line is the same for different water
contents.
The treated soil will behave as the untreated one in consolidation view of point
for consolidation stresses beyond the pre-consolidation pressure (normally
consolidated region-post yield compression). The same finding was also
reported by Terashi and Tanaka (1993). The same concept is also emphasized in
the research for strength characteristics of cement treated soils conducted by
Kasama and Zen (2000). They performed unconfined compression and
oedometer tests on cement treated clayey and sandy soils (cement content, aw=5,
7, and 10%, water contents changing from 1.5 to 2.5 wL for each series). They
concluded that the consolidation yield stress and related to it the
overconsolidation ratio can be two major factors in predicting the strength of
cement treated soil. As determined form oedometer tests on cement stabilized
soils the consolidation yield pressure increases by increasing cement content. It
is also emphasized in the research that the strength in the overconsolidated zone
(the stresses below the yield stress) depends on the stress level,
overconsolidation ratio. Although it is not stated by the authors, from the
undrained shear strength/consolidation pressure, cu/p’c vs. OCR graph presented
in the paper, the consolidation yield pressure, py/undrained shear strength, cu
ratio is calculated as 2.4-3.0 for different water contents. This means that the py /
UCS ratio is between 1.2-1.5. This is in good agreement with the value of 1.3
stated by Terashi and Tanaka. The ratio of py / UCS is stated as 2.2 by
Horpibulsuk (2001) and as 1.5 by Liu et al. (2006).
The uncertainty in the calculation methods for settlement of cement stabilized
mass is emphasized in the research by Baker et al. (1997). They performed in
situ field load test for measuring the modulus of deformation of a short lime
cement column (60 cm diameter, 5 m length) up to failure. As stated in the paper
Page 42
24
because of full scale experimental difficulties it is hard to obtain the deformation
modulus of field cement treated soil mass. By performing a parametric study
with 2D FE Plaxis analysis, they concluded that a drastic reduction of settlement
can be obtained by good quality (high modulus of deformation) lime-cement
columns. They concluded that the deformations in the stabilized clay depends on
stress carried by the columns and hence on the quality (modulus) of the
columns.
As stated by Horpibulsuk et al. (2004), the cement admixed clay with high
cement content, aw, shows high yield stress and low compressibility with the
increasing confining pressure.
Miura et al. (2001) and Balasubramaniam et al. (1999) also stated that the
cementation is responsible for the resistance against compression for vertical
stresses less than the yield stress, py. The change in soil fabric is dominant for
the compression behavior for the stresses greater than the yield stress where the
cementation bond is broken. It is similar to the case for strength enhancement.
Bergado et al. (2005) stated that the cement content (aw) specifies the position of
slope of the compression line at post-yield state, whereas the yield stress at
specific aw is influenced by the after-curing void ratio (e0t). This phenomenon is
already stated by Miura et al. (2001) by the wc/c (water content/cement content
ratio) value. They determined that the lower the wc/c, the greater the yield
stress.
Hayashi et al. (2005) reported that consolidation characteristics of the cement-
treated soils are affected by the delay of consolidation loading. Consolidation
tests were performed on cement stabilized low liquid-limit silt. Water content
is 170% and cement content is10% (water-cement ratio of 100%). As
Page 43
25
consolidation loading was delayed, the settlement strain became smaller but the
consolidation yield stress became greater. This phenomenon is because of the
cementation.
Bai et al. (2001) performed a loading test on trial cement mixed columns at a
foundation site in China. The 0.4 m diameter, 8m long soil-cement columns
(aw=16%) were loaded vertically at the column center (incremental loading, 120
min between load steps) and column settlements were recorded. Axisymmetric
finite element model were prepared and analysis were performed using
ABAQUS computer program. The variables in the analyses were column
dimensions (diameter=0.3, 0.4, and 0.5 m; length=5, 8, and 11 m), replacement
ratio (as=0.0816, 0.145, and 0.227), column/soil modular ratio (Mcol/Msoil=5, 10,
20, and 50), and load intensity (p=50, 100, 150, 200, 30, and 400 kPa). The field
results are in good agreement with the analysis for column/soil modular ratio of
20. The load distribution and settlement behavior of soil-cement columns were
discussed. The settlement of the columns decreases with increasing replacement
ratio and modular ratio. Similarly the load on the column will get larger with
increasing modular ratio and replacement ratio. As the columns get stiffer and
closer the system have greater load resistance and transfer less stress to the
surrounding soil resulting in less settlement.
Indraratna et al. (1995) performed oedometer tests on cement-FA stabilized soft
Bangkok clay. The deformation properties of the soil are not changed
substantially with 5% cement treatment. But the addition of small amount of
cement (5%) and FA (greater than 10%) improved the compression behavior of
the soil (substantial reduction in compression index, increase in the yield stress).
The yield stress of the natural soil is increased from 80 kPa to 300 kPa by the
addition of 5% cement and 25% FA. The compression index also decreases with
the increasing FA content. The coefficient of consolidation is increased 15-20
Page 44
26
times by high (18% to 25%) FA content with 5% cement. These improvements
are related to the pozzolanic activities of the binders.
Bergado et al. (1993) gave the bearing capacity, settlement and stability
evaluations on DMM improved foundations of highway embankments in
Thailand. The measured surface settlements of DMM improved soft soils was
agreed well with the values predicted using the conventional method
(conventional settlement calculation of untreated ground times the settlement
reduction factor which is equal to the ratio of Esoil to Esystem) and also FEM
analyses.
Miki and Furumoto (2000) conducted large scale laboratory model tests about
the settlement of DMC supported embankment loading to evaluate the stress
concentration ratio (the ratio of vertical load acting on improved part to the
vertical load acting on the unimproved part). The improvement ratio and
settlement values with respect to stress concentration ratio were obtained.
According to the test results the stress concentration ratios are obtained as 5 to
20. As the height of embankment (vertical stress on the improved system) and
improvement ratio was increased, the stress concentration ratio was increased.
As a result, the researchers concluded that the DMM with low improvement
ratio can be used as an economical way of improvement depending on site
conditions.
Alen et al. (2005) performed settlement measurements on field trial lime/cement
column stabilized soft clay at four different sites in Sweden. The settlement
calculations according to the traditional method (calculations using the bulk
modulus of the stabilized system found using the modulus of column, modulus
of soil, and the replacement ratio) overestimated the real measured values. This
is based on the underestimation of the modulus values of the whole system.
Page 45
27
Bergado et al. (2005b) monitored a full scale DMM improved soft clay ground
and investigated the compression mechanism of the system under bridge
approach embankment in Thailand. Full scale embankment loading on soil-
cement columns constructed by jet-mixing method of diameter 0.5 m, length of
9 m, and spacing of 1.5 m was monitored up to one year. According to the
results the settlement of the soft clay under embankment loading was reduced by
at least 70%.
The stress concentration ratio phenomenon is also investigated by Yin and Fang
(2010) by large scale laboratory model tests. From the instrumentation of plane
strain physical model created for the investigation of the bearing capacity and
failure mode of soft soil improved by end bearing group of deep mixed columns
(DMC), the researchers obtained the stress concentration ratio with respect to
vertical displacement. According to the test results, the average stress on the
columns (and stress concentration ratio) increases to a peak and then gradually
decreases to a residual value with displacement. The peak and residual values
of the stress concentration ratio for soft clay improved with DMC with
replacement ratio of 12.6% was obtained as 11 and 7, respectively.
Page 46
28
CHAPTER 3
EXPERIMENTAL SETUP AND PROCEDURE
In this chapter, the details of the laboratory experiments were described. First,
the selection of soil materials to be used in this research is provided. Then, the
procedures applied to prepare soil specimens are explained step by step. The
characteristics of different binders are also given in this chapter. Next, the
particulars of unconfined compression (UC) tests and large scale consolidation
tests are given; the steps to prepare soil samples and performing the experiments
are enlightened. Finally, the summary of the laboratory work is provided at the
end.
3.1 MATERIAL SELECTION AND SAMPLE PREPARATION
3.1.1 Natural Soft Soil
The selection of weak soil to be improved was the first step of this study. Based
on the results of a previous work (Özkeskin, 2004), the soil samples were taken
from Eymir Lake-Ankara, where the soil type was reported to be low plasticity
clay (CL). The site nearby the lake area was excavated by hand; then the soil
samples were carefully taken from the depth of 2 m and transferred to the Soil
Mechanics Laboratory.
Page 47
29
The processing of natural soft soils was as follows: The extracted soil samples
were dried in the oven at 110oC for 24 hours. After drying, the bulk mass was
broken into pieces by tampering to increase its workability. Then cobble and
boulder size particles were removed from the soil mass. Standard classification
tests (Specific Gravity Tests, Sieve Analysis, Hydrometer Test, Atterberg Limit
Tests) were performed on the cleansed soil for identification purposes. Using the
above laboratory tests Gs was found to be 2.66. The liquid limit (LL) was 31,
and the plastic limit (PL) was 18%. Therefore the plasticity index (PI) of the soil
was calculated to be 13. These results verified that the soil is low-plasticity silty-
clay (CL), as mentioned in the previous study (Özkeskin, 2004). This soil
obtained after physical processes were used at the initial stages of laboratory
experiments, specifically in UC tests. The samples used in UC tests were sieved
using No. 4sieve (5mm sieve opening).
3.1.2 Kaolinite Clay
For the second stage of this research, to fill the large consolidation tanks, large
amount of soil was needed. One tank is generally filled by about 70 kg of soil
slurry with water to solid ratio (W/S) of 0.7. Since there were several tanks to be
used in the experiments, total of 1500 kg of soil would be needed during the
research. As it was difficult /impractical to find and transport such soil masses
from the natural deposits, commercially available industrial soils were preferred
for practical purposes. Among those, the most suitable one to simulate clay
behavior was kaolinite clay due to the less expansive character of the kaolinite
mineral.
The mineralogical and chemical properties of the kaolinite used in this study are
given in Table 3.1.The standard physical tests were also repeated for kaolinite.
Page 48
30
Accordingly, 90% of kaolinite is of clay size. There were no remaining particles
detected on No.200 sieve; therefore, the remaining 10% was considered to be
silt. The PL of kaolinite was 33 and LL was 49 (PI of kaolinite was calculated to
be 16).
Table 3.1 Mineralogical and chemical composition of kaolinite used
Mineralogical
Structure
Volumetric
Content
% Chemical
Analysis
%
kaolinite Clay Mineral 90.5 (loss on ignition) 12.73
Quartz Free Quartz 2.71 SiO2 47.89
Illite Sodium Feldspar 0.08 Al2O3 36.75
Potassium
Feldspar
4.45 TiO2 0.61
Fe2O3 0.40
CaO 0.39
MgO 0.09
Na2O 0.01
K2O 0.75
SO4 0.37
3.1.3 Binder Materials
The selection of binder materials was an important stage of this research. Both
selection of the binder material and determination of the exact amount to be
used as an additive were critical as they directly affect the structural
performances of the ground improvement method. Considering these, several of
those improvement materials were collected. First, the ordinary Portland cement
(C) was chosen since it improves the strength of natural soil dramatically. This
Page 49
31
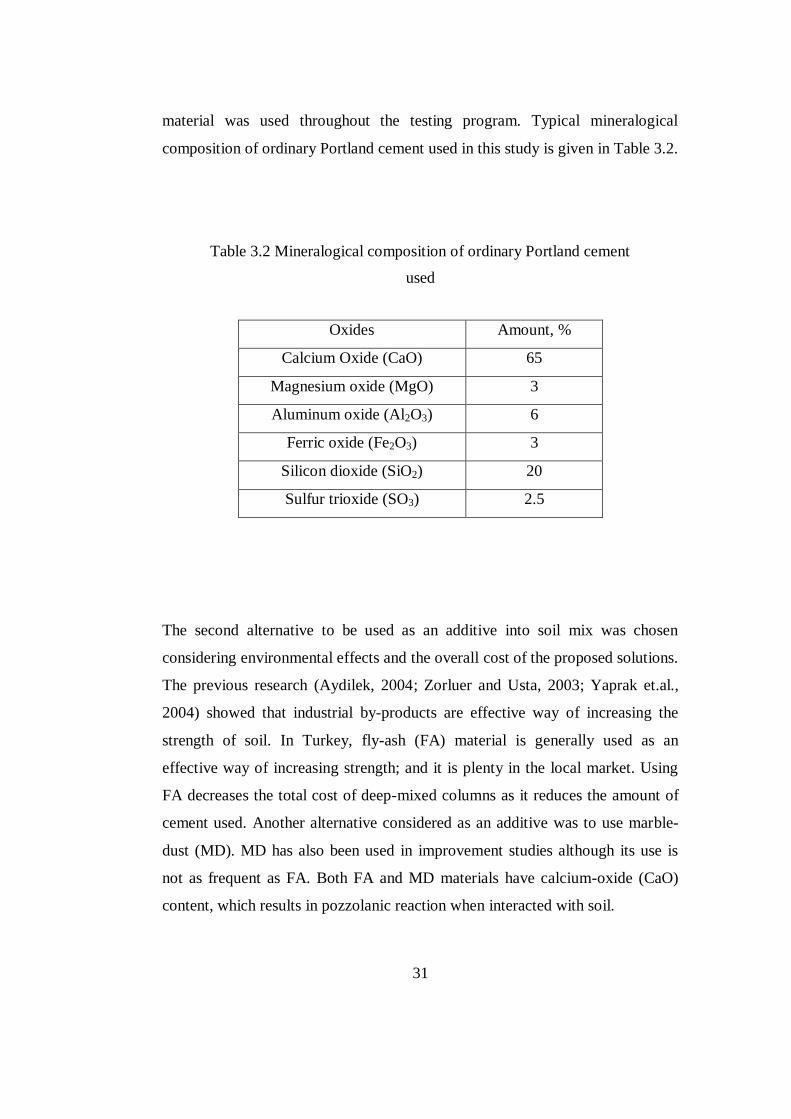
material was used throughout the testing program. Typical mineralogical
composition of ordinary Portland cement used in this study is given in Table 3.2.
Table 3.2 Mineralogical composition of ordinary Portland cement
used
Oxides Amount, %
Calcium Oxide (CaO) 65
Magnesium oxide (MgO) 3
Aluminum oxide (Al2O3) 6
Ferric oxide (Fe2O3) 3
Silicon dioxide (SiO2) 20
Sulfur trioxide (SO3) 2.5
The second alternative to be used as an additive into soil mix was chosen
considering environmental effects and the overall cost of the proposed solutions.
The previous research (Aydilek, 2004; Zorluer and Usta, 2003; Yaprak et.al.,
2004) showed that industrial by-products are effective way of increasing the
strength of soil. In Turkey, fly-ash (FA) material is generally used as an
effective way of increasing strength; and it is plenty in the local market. Using
FA decreases the total cost of deep-mixed columns as it reduces the amount of
cement used. Another alternative considered as an additive was to use marble-
dust (MD). MD has also been used in improvement studies although its use is
not as frequent as FA. Both FA and MD materials have calcium-oxide (CaO)
content, which results in pozzolanic reaction when interacted with soil.
Page 50
32
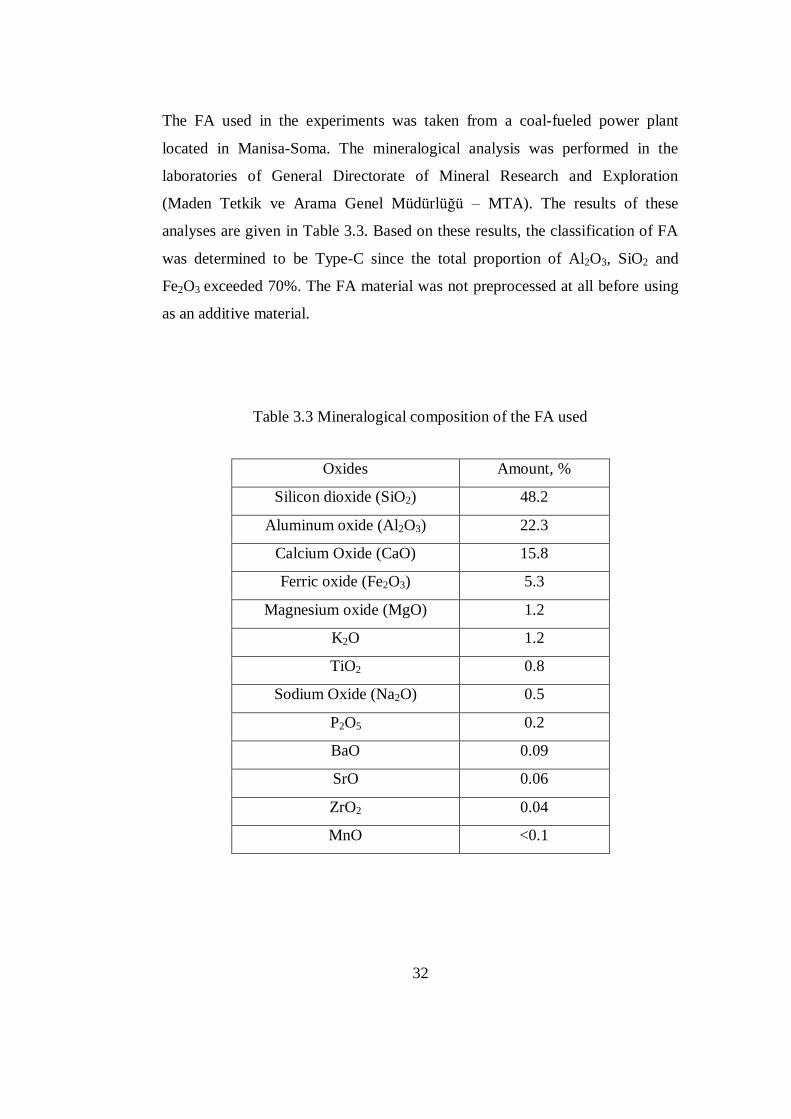
The FA used in the experiments was taken from a coal-fueled power plant
located in Manisa-Soma. The mineralogical analysis was performed in the
laboratories of General Directorate of Mineral Research and Exploration
(Maden Tetkik ve Arama Genel Müdürlüğü – MTA). The results of these
analyses are given in Table 3.3. Based on these results, the classification of FA
was determined to be Type-C since the total proportion of Al2O3, SiO2 and
Fe2O3 exceeded 70%. The FA material was not preprocessed at all before using
as an additive material.
Table 3.3 Mineralogical composition of the FA used
Oxides Amount, %
Silicon dioxide (SiO2) 48.2
Aluminum oxide (Al2O3) 22.3
Calcium Oxide (CaO) 15.8
Ferric oxide (Fe2O3) 5.3
Magnesium oxide (MgO) 1.2
K2O 1.2
TiO2 0.8
Sodium Oxide (Na2O) 0.5
P2O5 0.2
BaO 0.09
SrO 0.06
ZrO2 0.04
MnO <0.1
Page 51
33
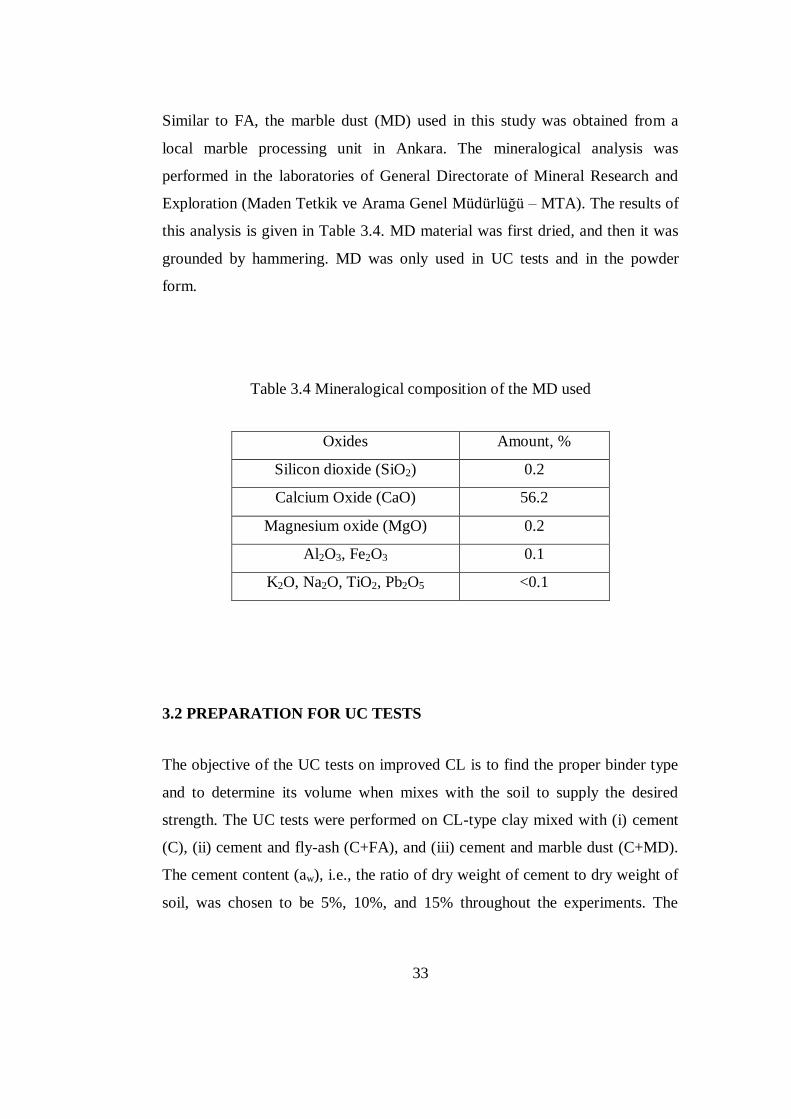
Similar to FA, the marble dust (MD) used in this study was obtained from a
local marble processing unit in Ankara. The mineralogical analysis was
performed in the laboratories of General Directorate of Mineral Research and
Exploration (Maden Tetkik ve Arama Genel Müdürlüğü – MTA). The results of
this analysis is given in Table 3.4. MD material was first dried, and then it was
grounded by hammering. MD was only used in UC tests and in the powder
form.
Table 3.4 Mineralogical composition of the MD used
Oxides Amount, %
Silicon dioxide (SiO2) 0.2
Calcium Oxide (CaO) 56.2
Magnesium oxide (MgO) 0.2
Al2O3, Fe2O3 0.1
K2O, Na2O, TiO2, Pb2O5 <0.1
3.2 PREPARATION FOR UC TESTS
The objective of the UC tests on improved CL is to find the proper binder type
and to determine its volume when mixes with the soil to supply the desired
strength. The UC tests were performed on CL-type clay mixed with (i) cement
(C), (ii) cement and fly-ash (C+FA), and (iii) cement and marble dust (C+MD).
The cement content (aw), i.e., the ratio of dry weight of cement to dry weight of
soil, was chosen to be 5%, 10%, and 15% throughout the experiments. The
Page 52
34
prescribed amount of clay, cement, and FA/MD is mixed in dry powder form
without compaction. When mixed with 5%C, the amount of FA added, i.e., the
ratio of dry weight of additive to that of soil, was selected to be 8%, 15%, and
20%. These quantities were kept the same when MD was used as an additive in
addition to C.
The method to prepare the improved soil specimens in the laboratory was
standardized by the Japanese Geotechnical Society (JGS, 2000). This standard
describes a procedure of making and curing a cylindrical specimen of treated
soil without compaction. Following this standard, the soft soil, initially, was
sieved using No. 4 sieve. Then soil mixture was prepared through mixing soil,
water and the stabilizing material by means of an electric mixer; the natural soil
was mixed with the stabilizing agents in dry powder form and then water was
added thoroughly to achieve W/S = 0.7. The duration of mixing was 10 minutes
to supply homogeneity in the soil mix as recommended in the literature (JGS,
2000). However, after 10 minutes, the binders were susceptible to hardening.
The prepared mixture was placed in cylindrical PVC molds (Diameter: 50 mm,
Height: 100 mm) with a special injection system to fill the mold from bottom to
the top without having air bubbles and voids. The inside of the molds were
lubricated in advance to make extrusion of the soil easier at the end of initial
setting time. The mold was vibrated slightly by hand to remove the entrapped air
bubbles. The specimens prepared in this way were then cured in the moisture
room where the temperature was kept 20±30C and relative humidity was 95%.
Initial setting was achieved after 2 to 3 days. Then the mixture was removed
from the molds and trimming was done to have smooth boundaries. The mixed
samples were then put in special moisture bags in the moisture room and kept
closed till the end of the desired curing period. The pre-determined curing times
used in this study were 7, 28, 90 and 360 days. The cured specimens of CL and
Page 53
35
kaolinite were then tested in the UC testing machine under 0.5 mm/min loading
rate. The results of these tests to determine the most suitable binder and its
volume in a given mix are presented in chapter 4.
3.3 PREPARATION FOR LARGE SCALE CONSOLIDATION TESTS
The second stage of laboratory experiments was large scale consolidation tests
on reconstituted soft kaolinite clay improved with deep mixed group of columns
(DMC). There are three main stages in large-scale experiments (1) preparation
of soft clay (2) preparation of deep mixed columns and (3) performing
consolidation tests to determine the deformation characteristics of the stabilized
soil.
3.3.1 Preparing kaolinite for large scale consolidation test
Dry kaolinite in the powder form was mixed with water using large scale
electric mixer to have a water content of 40%, almost at the LL. As in
preparation of soil samples for UC tests, the clayey mass of soil was put in
plastic bags and kept in the moisture room for 2-3 days to have homogeneous
water and soil mix. Then clay soil was put into large tanks where consolidation
test will be performed.
The diameter and the height of the consolidation tanks are 41 cm and 39 cm,
respectively. The height of the clay sample that was put into tank was around 30
cm. There are holes at the bottom plate of the consolidation tank to allow
drainage. Each consolidation tank was then placed in a plastic bath tub to have
continuous water supply. When placing the kaolinite in the tanks, small lumps
of clay was placed and spread with hand to avoid air bubbles and cavities. When
the placement was done, the total weight of the material in the tank was 63 kg.
Page 54
36
To avoid drying of clay paste and also to allow drainage path, the bottom and
top of soil mass was covered with filter paper and geomembrane covers. The
whole setup was left untouched for about 3 days to allow consolidation under its
own weight (An overview of the setup for one of the large scale consolidation
tanks and the equipment used to prepare group of columns are shown in Figures
3.1 and 3.2, respectively).
Figure 3.1 Consolidation tank filled with kaolinite
Page 55
37
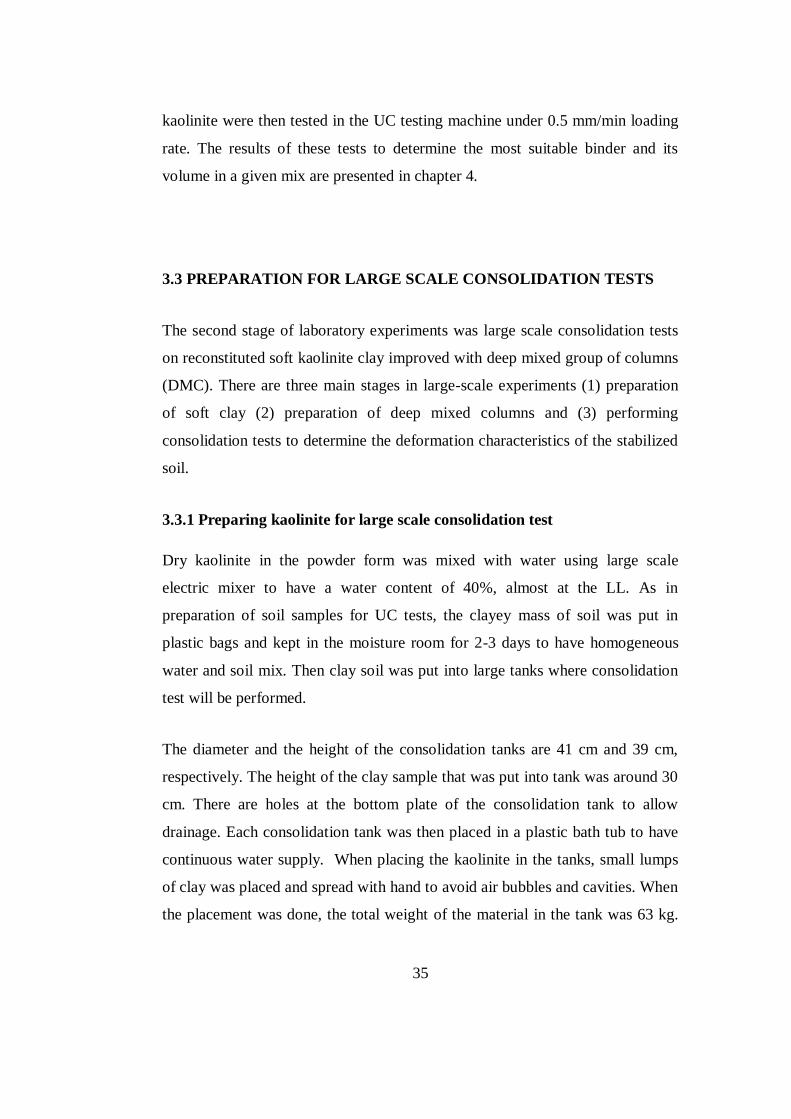
Figure 3.2 An overview of the equipment used in the tests
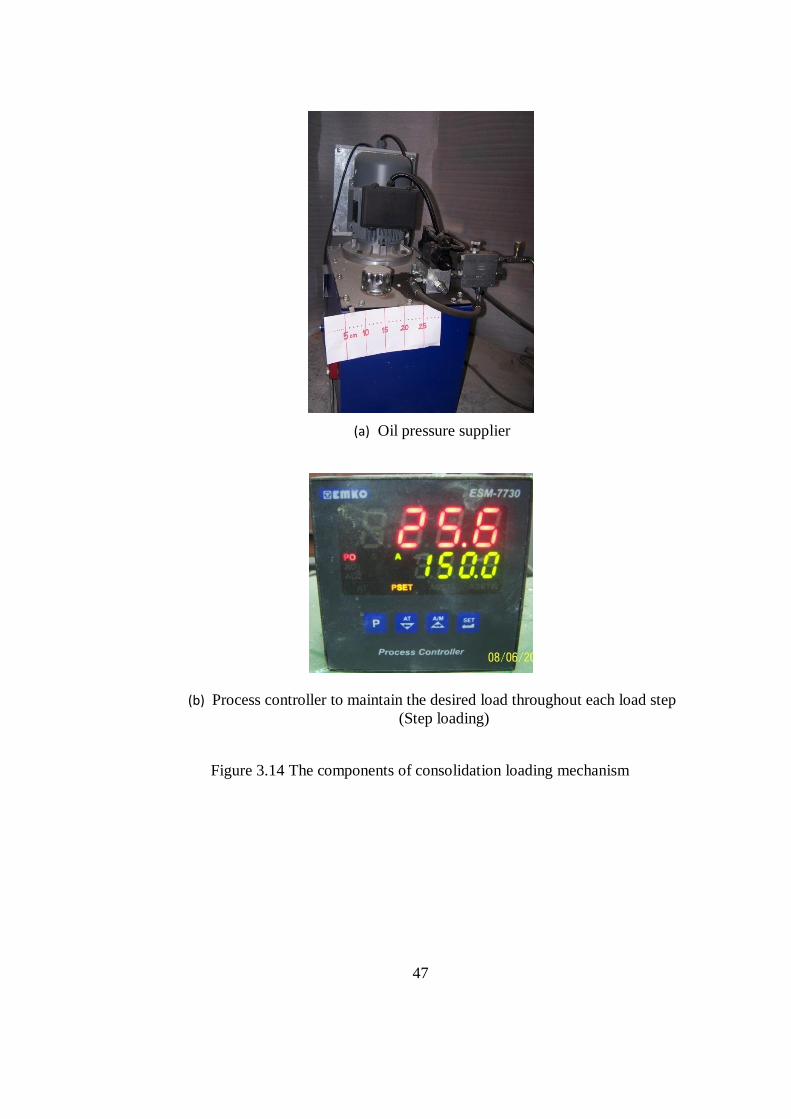
Next, the 5 mm thick-loading plate was placed on top of the initially
consolidated specimen. Then an air piston with 100 mm diameter was placed on
the loading plate and 50 kPa consolidation pressure was applied to the system
using an air compressor. The air pressure was susceptible to changes due to
several reasons and therefore regulated through a regulator. The regulator was
connected to compressor and its performance during the consolidation was
observed using a pressure dial gauge (Figure 3.3) placed on the top of the
loading plate (Figure 3.4). Using this setup, the consolidation was completed in
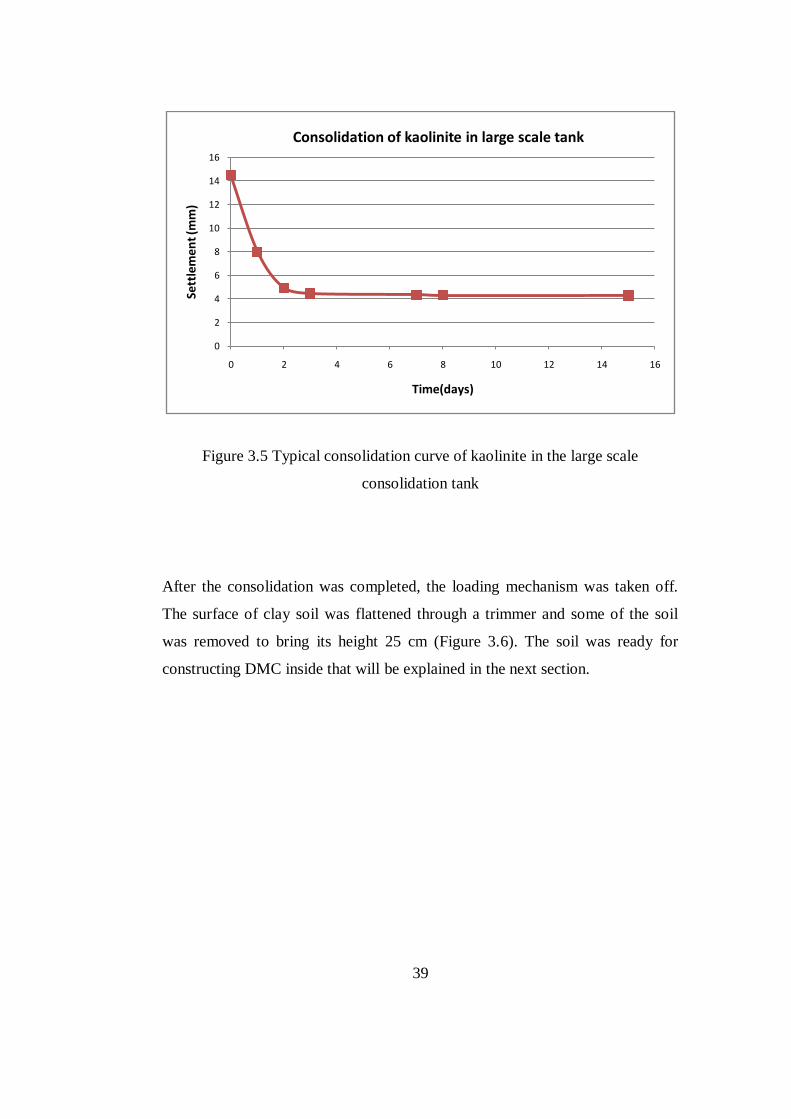
about 25-30 days for each specimen (Figure 3.5). The preparation of kaolinite
was the same for different mixes. Therefore, it was assumed that the
compression modulus of the soil for different mixes would be the same.
Page 56
38
However, the modulus of the deep mixed columns and the improved soil would
vary based on different the column materials and binder type.
Figure 3.3 The air pressure regulator (from the compressor to the air pistons)
Figure 3.4 The dial gauge checked consolidation under 50 kPa loading
Page 57
39
Figure 3.5 Typical consolidation curve of kaolinite in the large scale
consolidation tank
After the consolidation was completed, the loading mechanism was taken off.
The surface of clay soil was flattened through a trimmer and some of the soil
was removed to bring its height 25 cm (Figure 3.6). The soil was ready for
constructing DMC inside that will be explained in the next section.
0
2
4
6
8
10
12
14
16
0 2 4 6 8 10 12 14 16
Sett
lem
en
t (m
m)
Time(days)
Consolidation of kaolinite in large scale tank
Page 58
40
Figure 3.6 The leveling and height adjustment of clay in the tank
3.3.2 DMC construction
In this research, the performances of several pile configurations were
investigated. They were created using different number of columns, specifically
19, 38, 55, and 85 piles. The replacement ratios corresponding to these column
configurations were 0.045, 0.09, 0.13, and 0.20, respectively (these
configurations are shown in Figures 3.7 to 3.10). There exist 3 types of guide
plates (pre-bored steel plates) for drilling operations with 38, 55, and 85
punched holes on them.
The DMCs were prepared using a technique similar to the ones used to construct
bored piles. Before drilling, the guide plates that were used to assure the
accuracy of geometry were placed carefully on top of the consolidated soil. The
holes opened to build DMC in the soft clay were prepared using a standard
electric-hand drill. The verticality of the operation is maintained by using the
guide plates. Two identical steel guide plates with 20 cm distance in between is
Page 59
41
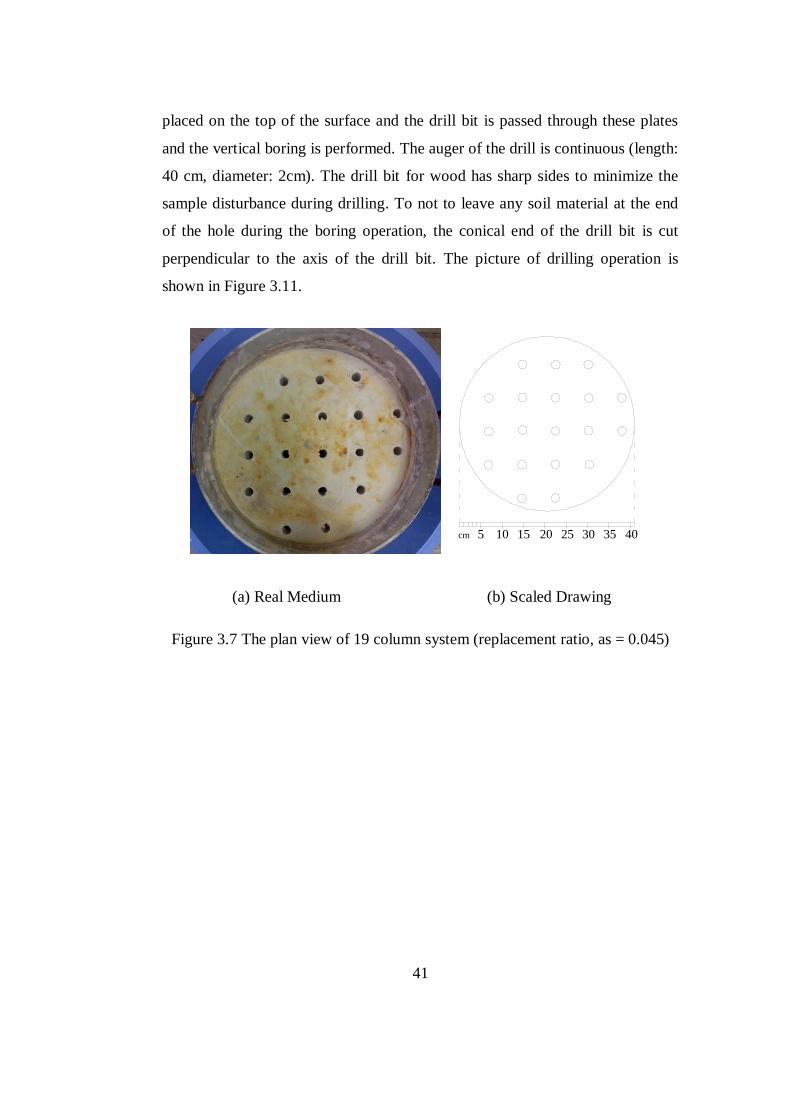
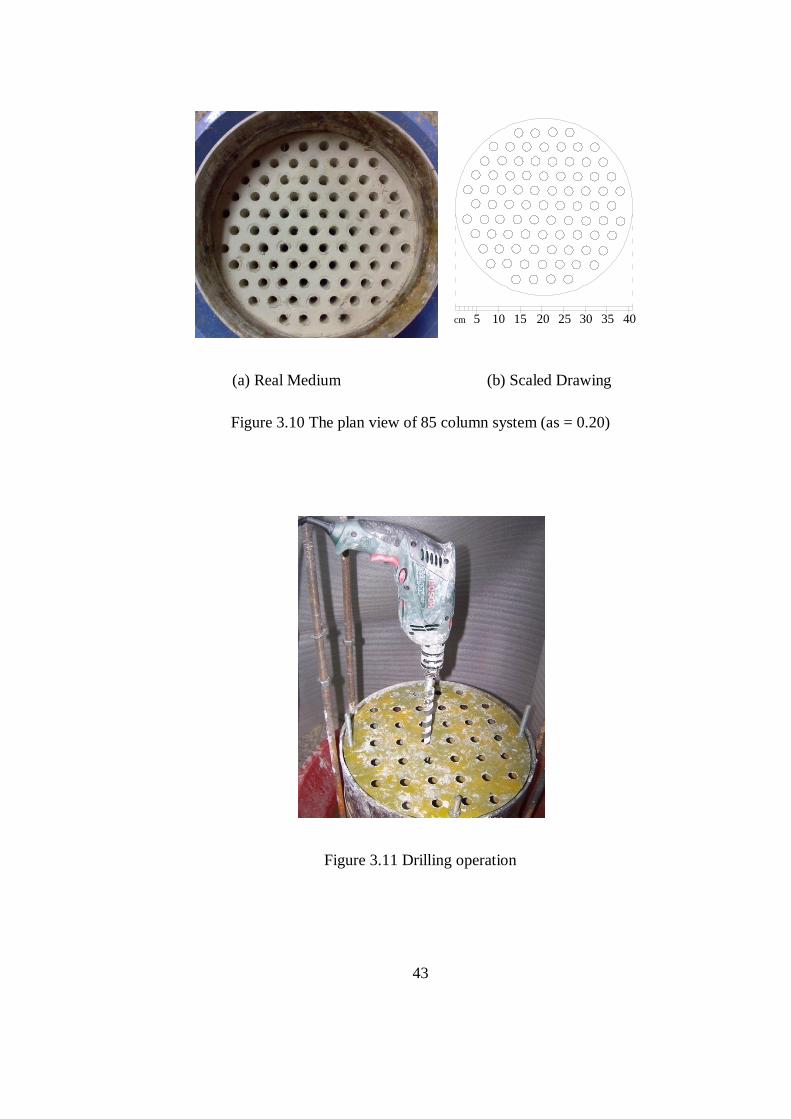
placed on the top of the surface and the drill bit is passed through these plates
and the vertical boring is performed. The auger of the drill is continuous (length:
40 cm, diameter: 2cm). The drill bit for wood has sharp sides to minimize the
sample disturbance during drilling. To not to leave any soil material at the end
of the hole during the boring operation, the conical end of the drill bit is cut
perpendicular to the axis of the drill bit. The picture of drilling operation is
shown in Figure 3.11.
(a) Real Medium (b) Scaled Drawing
Figure 3.7 The plan view of 19 column system (replacement ratio, as = 0.045)
5 10 15 20 25 30 35 40cm
Page 60
42
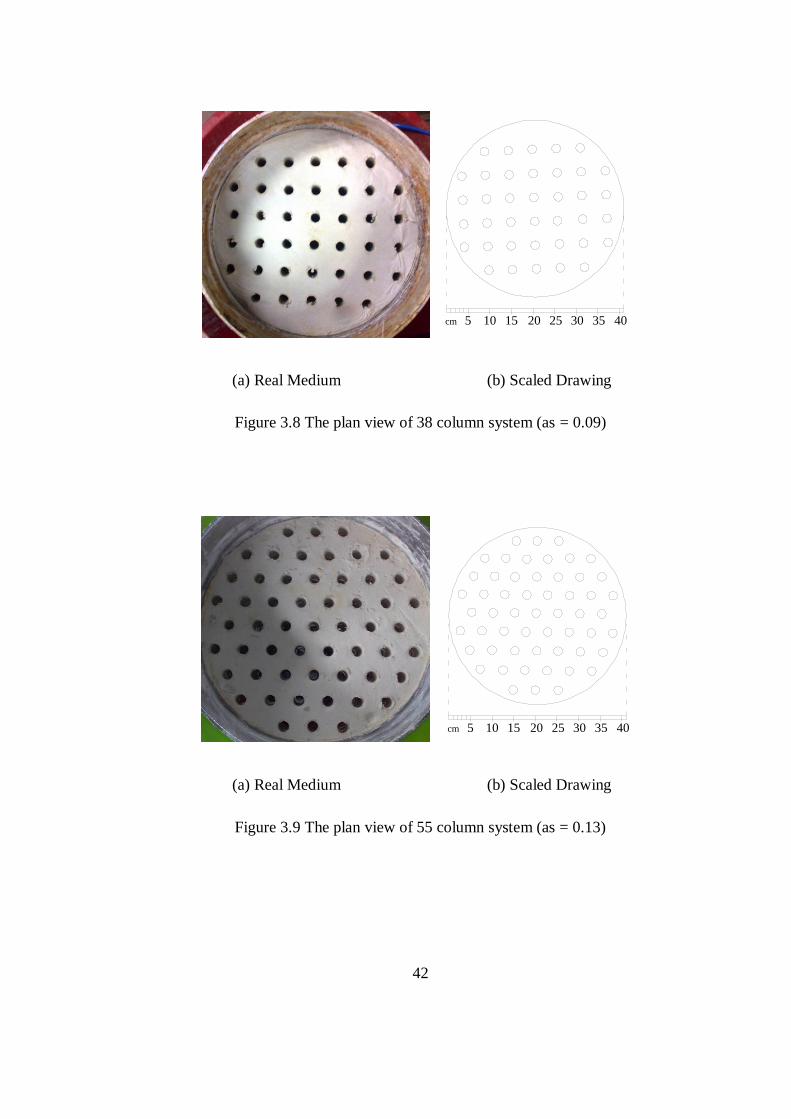
(a) Real Medium (b) Scaled Drawing
Figure 3.8 The plan view of 38 column system (as = 0.09)
(a) Real Medium (b) Scaled Drawing
Figure 3.9 The plan view of 55 column system (as = 0.13)
5 10 15 20 25 30 35 40cm
5 10 15 20 25 30 35 40cm
Page 61
43
(a) Real Medium (b) Scaled Drawing
Figure 3.10 The plan view of 85 column system (as = 0.20)
Figure 3.11 Drilling operation
5 10 15 20 25 30 35 40cm
Page 62
44
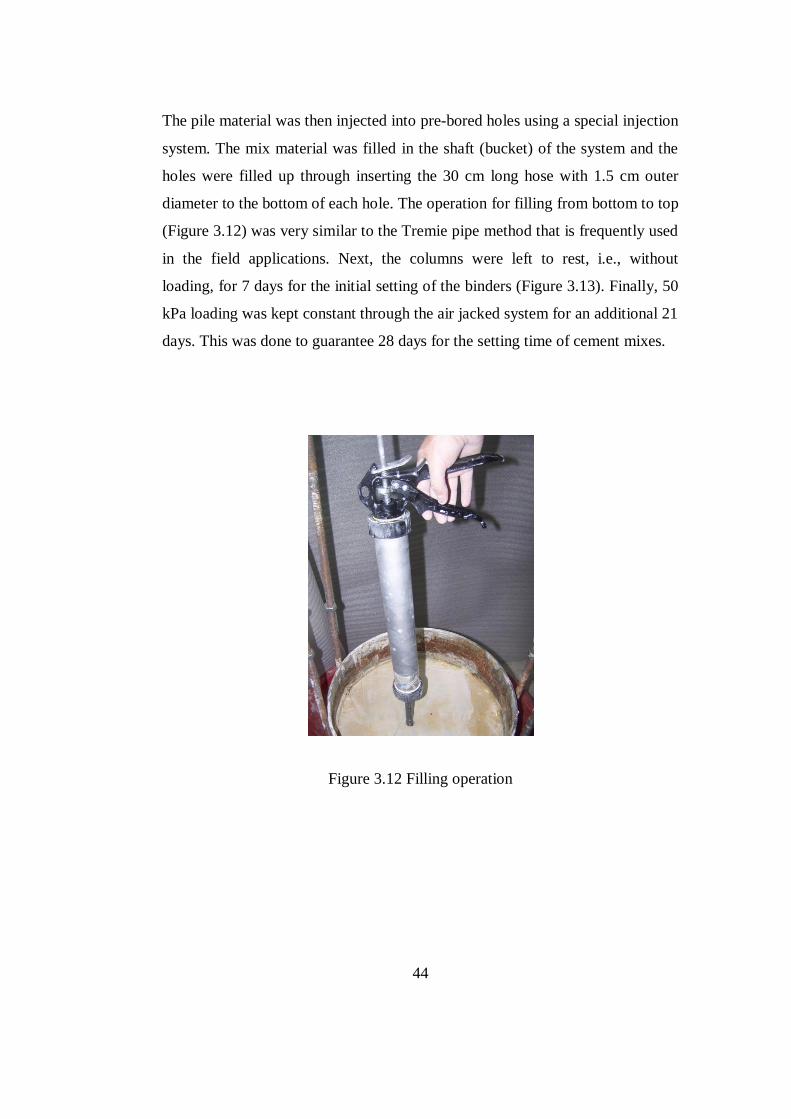
The pile material was then injected into pre-bored holes using a special injection
system. The mix material was filled in the shaft (bucket) of the system and the
holes were filled up through inserting the 30 cm long hose with 1.5 cm outer
diameter to the bottom of each hole. The operation for filling from bottom to top
(Figure 3.12) was very similar to the Tremie pipe method that is frequently used
in the field applications. Next, the columns were left to rest, i.e., without
loading, for 7 days for the initial setting of the binders (Figure 3.13). Finally, 50
kPa loading was kept constant through the air jacked system for an additional 21
days. This was done to guarantee 28 days for the setting time of cement mixes.
Figure 3.12 Filling operation
Page 63
45
Figure 3.13 The top view after the formation of the piles
3.3.3 Performing the consolidation test
The consolidation test was performed using a loading mechanism that was
specifically designed for this research. It is composed of an oil pressure supplier
(Figure 3.14a), a pressure transducer, a loading piston (diameter 80 mm) and a
process controller (Figure 3.14b). The process controller maintains the pre-set
oil pressure until a next stage of loading is desired. This mechanism is capable
of applying 150 bar oil pressure, i.e. 6 kg/cm2 on 41 cm
2 area.
In order to perform the consolidation test, the previously applied consolidation
pressure on the deep mixed soil mass was first removed. The top loading plate
was then changed with a more rigid one which is 20 mm thick and stiffened with
vertical steel strengtheners, to resist the higher amount of loads without bending.
The loading mechanism designed for large scale consolidation tests was put on
the top plate. In addition to the loading mechanism, three dial gauges were
Page 64
46
placed on the loading plate with a radial angle of 120 degrees among them.
Similarly, three LVDTs were placed next to the dial gauges. The whole
experimental setup to apply loading is shown in Figure 3.15.
Before starting the test, the laboratory testing software CODA was started to
control the hardware, to initialize the readings of LVDT, and to record the
findings of the software (Figure 3.16). The application of load was done through
the load mechanism that was mainly controlled by the process controller. The
controller was adjusted using preset values of oil pressure for loading increment
of 0.5, 1, 1.5, 2, 2.5, 3, and 4 kg/cm2 (The oil pressure is calculated using a
simple load conversion between the loaded area and area of loading piston). The
pressure transducer sends signal to the pressure supplier to start loading. When
the desired oil pressure, i.e., loading pressure, is reached, the process controller
sends another signal to the pressure supplier and it stops. Using this mechanism,
the load was maintained on the system for the desired duration until
consolidation for that loading step is completed (about 24 hours).
Page 65
47
(a) Oil pressure supplier
(b) Process controller to maintain the desired load throughout each load step
(Step loading)
Figure 3.14 The components of consolidation loading mechanism
Page 66
48
Figure 3.15 The assembled system of test
During the test, the settlement readings were taken from LVDTs using the
CODA software. “Settlement vs. time” plots were prepared in order to check
completion of consolidation (time to complete the consolidation was determined
to be 24 hours for each loading step). As a result, each test was completed in
about one week.
Page 67
49
Figure 3.16 CODA interface
The deformation (settlement) values of the mixed soil system were obtained for
different consolidation stresses. These values were used to obtain the stress-
strain relations. Using these, the bulk compression moduli for each test were
calculated, the relation between the bulk compression modulus and the type of
columns, the effect of replacement ratio (number of piles, as), and also the
compression behavior of DMC stabilized soil mass was investigated.
3.4 SUMMARY
In this chapter, the specifics of material selection, the preparation of soil
materials, DMCs and binders were discussed. The steps of all the tests were
given in detail to highlight the details as they were difficult to perform and
repeat. The results of both UC and large scale consolidation tests are discussed
in the next Chapter.
Page 68
50
CHAPTER 4
EXPERIMENTAL RESULTS AND DISCUSSION
In this chapter, the results of the unconfined compression (UC) tests and large
scale consolidation test are provided together with the discussion about the
effects of improvement. In section 4.1, UC tests performed on CL-type clay and
kaolinitekaoliniteite clay are given. The development of unconfined
compressive strength (UCS) with time is investigated. Then, the relation
between the elastic modulus at 50% of the failure load (E50) and UCS is
highlighted. Finally, the determination of effective binder mixes, i.e., the type
and the amount of binder, is discussed. In the next section, the results of large
consolidation tests are presented. Deformation properties of the soil improved
by end-bearing group of columns are studied through investigation of relations
among the physical variables. Finally, the conclusive remarks for the
performance of soil systems improved by using Deep Mixing Method (DMM)
are given at the end of the chapter.
4.1 UC TESTS FOR DETERMINING EFFICIENT BINDER TYPE
4.1.1 UC Tests on improved CL
In order to understand the performance of different improvement materials, first,
the development of UCS and E50 with time is investigated. For this purpose, the
Page 69
51
results of UC tests performed on soil systems improved with these materials are
provided in Table 4.1. The results include the values of UCS and E50 that were
recorded for different curing times. The data shows that UCS and E50 reached
their maximum values (376 kPa and 53.7 MPa, respectively) after 90 days of
curing time for soils mixed only with cement. When the curing is continued,
UCS decreased about 20% after a year. Similarly, the decrease in E50 was about
30% as compared to its maximum for the same mix after a year. This may be
because of calcium (Ca+) ions leaching towards the outer boundary of the
treated samples.
Table 4.1 Results of UC tests on CL improved with different binders
Binder Type Curing Time (Days) UCS (kPa)
E50 (MPa) E50/UCS
5%C
7 198 22.5 114
28 269 41.9 156
90 376 53.7 143
365 300 37.5 125
5%C+8%FA
7 115 15 130
28 255 41.6 163
90 340 32.7 96
5%C+15% FA
7 290 32.2 111
28 366 38.1 104
90 381 38.2 100
365 645 93 144
5%C+20%FA
7 263 31.3 119
28 372 51.7 139
90 514 64.3 125
365 630 126 200
Page 70
52
Table 4.1 Results of UC tests on CL improved with different binders (ctd.)
Binder Type Curing Time (Days) UCS (kPa)
E50 (MPa) E50/UCS
5%C+8%MD
7 200 32.25 161
28 260 27.1 104
90 320 40 125
5%C+15%MD
7 217 36 166
28 385 47.1 122
90 269 27 100
365 385 38 99
5%C+20%MD
7 245 49.2 201
28 329 66 201
90 238 40 168
365 480 91.7 191
10%C
7 493 117.6 239
28 684 155.5 227
90 1033 215 208
15%C
7 620 193.8 313
28 1051 328.1 312
90 1450 500 345
CL consolidated under 50 kPa
- 25 0.46 18.4
Figure 4.1 shows the unconfined compression strength of binder mixed CL with
respect to curing time. In general, because of the pozzolanic character of the
binders (CaO present in cement, fly-ash, marble dust) the UCS increases with
the curing time. Cement shows substantial increase in UCS by time. The UCS at
28 days is 1.36, 1.39, and 1.7 times the UCS at 7 days for 5%C, 10%C, and
15%C, respectively. The ratio of UCS,90 days/UCS,7 days is 1.9, 2.1, and 2.34 for
5%C, 10%C, and 15%C, respectively. From the Figure 4.1 and also from these
ratios it is clearly seen that as cement content (aw) increases the UCS increases
Page 71
53
as expected. Generally, 5%C admixture gives about 300-400 kPa compressive
strength. This value is changing between 500-1000 kPa, and 600-1400 kPa for
10%C and 15%C addition, respectively.
Figure 4.1 UCS vs. curing time for different mixes (CL)
The strength enhancement can also be achieved by adding 5% cement and some
percent of (8% to 20%) fly-ash and marble dust (Vazquez, 1991; Indraratna et
al., 1995). The binders with the marble dust show a decrease in 90 days time,
but in 1 year period it is also effective in increasing the strength. Generally, the
compressive strength values for fly-ash and marble dust added mixtures are
0
100
200
300
400
500
600
700
800
900
1000
1100
1200
1300
1400
1500
0 50 100 150 200 250 300 350
UC
S(k
Pa)
Curing Time (days)
CL
5%C 10%C 15%C
5%C+8%MD 5%C+15%MD 5%C+20%MD
5%C+8%FA 5%C+15%FA 5%C+20%FA
Page 72
54
changing between 200-600 kPa. The curing time does not cause substantial
increase in UCS for fly-ash and marble dust added mixtures except the 15%FA
and 20%FA additions. For 5%C+20%FA mixes the UCS at 365, 90, 28 days
curing time is 2.4, 1.95, 1.41 time UCS,7 days, respectively. The same factors are
2.22, 1.31, and 1.26 for 5%C+15%FA mixes. As it is understood from these
values especially fly-ash is an effective additive in strength enhancement of
cement treated soils. 5% cement with the addition of 15% and 20% fly ash gives
relatively high strength in 28, 90, and 365 days. These findings are in good
agreement with the statements of Vazquez (1991), Mohamed and Hossein
(2004), Consoli et al. (2001), and Indraratna et al. (1995). Briefly, fly-ash is an
effective binder also for long term strength enhancement.
Another important physical property of binder mixed soils is the modulus of
elasticity. In this respect the ratios of E50 to UCS for different mixes are
presented in Figure 4.2.a and 4.2.b. As can be seen, although there is some
scatter, the E50 can be correlated to the UCS. E50 of the original soil was 18.4
times the UCS. The cement mixes give higher ratio (E50 is equal to 284UCS for
C mixes and 141UCS for C+FA mixes). These values are comparable with the
values given in the literature (220UCS, Löfroth, 2005; 160UCS, Massarch,
2005; 110UCS, VanImpe, 2005; 50-200UCS, Bruce et al., 1999; 30-300UCS,
Fang et al., 2001; 350-1000UCS,lab, 150-500UCS,field, Bruce, 2001; 350-
1000UCS,lab, FHWA, 1999 ).
Page 73
55
(a)
(b)
Figure 4.2 E50 vs. UCS for a) cement mixes b) cement+fly-ash mixes
5%,7
5%,28 5%,905%,365
10%,710%,28
10%,9015%,7
15%,28
15%,90
0
100
200
300
400
500
600
0 200 400 600 800 1000 1200 1400 1600
E 50
(MP
a)
UCS (kPa)
C Mixes
8%,7
8%,28
8%,9015%,7
15%,2815%,90
15%,365
20%,7
20%,28 20%,90
20%,365
0
20
40
60
80
100
120
140
0 100 200 300 400 500 600 700
E 50
(MP
a)
UCS (kPa)
5%C+FA Mixes
(cement content, curing days)
(FA%, curing days)
Page 74
56
In Figure 4.3 the E50/UCS ratio against curing time is shown. No consistent
trend for cement mixes can be seen but the cement+fly-ash mixes show similar
behavior especially for 15% and 20% additions.
Generally, 15%C mixes give a ratio of E50/UCS as 300-350. This ratio is about
200-250 for 10%C mixes. For the other mix types (5%C, 5%C+FA, 5%C+MD),
E50 is about 100-150 times the UCS. For 5%C+20%FA mixes in one year time
the E50/UCS ratio reaches the value of 200.
Figure 4.3 E50/UCS vs. time for C and C+FA mixes
0
50
100
150
200
250
300
350
400
0 100 200 300
E 50/
UC
S
Time (days)
5%C 10%C 15%C
5%C+8%FA 5%C+15%FA 5%C+20%FA
Page 75
57
4.1.2 UC Tests on improved kaolinite clay
The efficient binder types for the clayey soils considered in the experimental
program is determined as 5%C, 5%C+20%FA, 15%C, and 30%C on the basis of
the first series tests on CL. The 7-28-90 days unconfined compressive strength
values (UCS), and elastic moduli at 50% failure load (E50) for different
kaolinite-binder mixes and also for 28 days consolidated (consolidation pressure
of 50 kPa) kaolinite clay (taken from the consolidation tank) are given in Table
4.2.
Table 4.2 Results of UC tests on kaolinite improved with different binders
Binder Type Curing Time
(Days)
UCS (kPa)
E50 (MPa)
E50/UCS
5%C
7 100 31.2 312
28 165 105 636
90 220 129 586
365 115 25 217
5%C+20%FA
7 108 34 315
28 330 154 467
90 560 254 454
365 710 130 183
15%C
7 225 66 293
28 400 190 475
90 680 280 412
365 755 151.5 201
30%C
7 395 87 220
28 960 218 227
90 1440 350 243
kaolinite consolidated in the tank under 50 kPa
28 35 0.3 8.6
Page 76
58
Figure 4.4 provides the results of the UC tests on cement and fly-ash improved
kaolinite. As the cement content increases the 7-28-90 day UCS increases as
expected. Some researchers (Terashi et al., 1980; Kwan et al., 2005; Chew et al.,
2004) stated that a minimum amount of 5% cement will be required to improve
the strength and deformation properties of soft soils. Figure 4.4 also shows that.
5% cement addition will not improve the UCS substantially. When the cement
content increased or another type of pozzolanic binder is used with the cement,
the desired amount of strength improvement can be obtained. The most efficient
binder in terms of strength enhancement is 30% cement. The compressive
strength value for 30% cement mixed kaolinite reaches to about 1 MPa for 28
days curing.
Figure 4.4 UCS vs. curing time for different mixes (kaolinite)
0
100
200
300
400
500
600
700
800
900
1000
1100
1200
1300
1400
1500
0 50 100 150 200 250 300 350 400
UC
S (k
Pa)
Curing Time (days)
Improved Kaolin
Untreated Kaolin (UK)5%C5%C+20%FA15%C30%C
Page 77
59
20%FA addition to 5%C is an effective way of improvement as this increased
the UCS of improved kaolinite to the level for 15%C addition.
The ratio of UCS,28 days/UCS,7 days is 1.65, 1.78, and 2.43 for 5%C, 15%C, and
30%C mixes, respectively. This value is 3.06 for 5%C+20%FA admixture. The
UCS at 90 days time is 2.2, 3.02, and 5.19 times the UCS,7 days for 5%C, 15%C,
and 5%C+20%FA mixed soils. This shows the efficiency of fly-ash in long term
strength enhancement. The relative increase in compression strength for the
improved kaolinite is shown in Figure 4.7.
The E values for the improved soils are increased by binder addition. In this
respect the E50 of the treated soil may be given as a multiple of UCS. Although
there is a great scatter in the data for cement mixes, the relation may be given as
in Figure 4.5a. The same relation for cement+fly-ash mixes are given in Figure
4.5b.
The ratio of E50/UCS is higher for cement + fly-ash mixes than that of cement
mixes.
As it is seen in Figure 4.5b, the 5% cement with the addition of 20% fly-ash
mixed soil gives an elastic modulus (254 MPa at 90 days) as much as that of
15% (280 MPa at 90 days) and 30% (218 MPa for 28 days) cement mixed
samples. This shows the efficiency of fly-ash addition not only for the
improvement of strength but also for the modulus of soft soils.
Page 78
60
(a)
(b)
Figure 4.5 E50 vs. UCS for a) cement mixes b) cement+fly-ash mixes
5%,7
5%,285%,90
5%,365
15%,7
15%,28
15%,90
15%,365
30%,7
30%,28
30%,90
0
50
100
150
200
250
300
350
400
0 200 400 600 800 1000 1200 1400 1600
E 50
(MP
a)
UCS (kPa)
C Mixes
7
28
90
365
0
50
100
150
200
250
300
0 100 200 300 400 500 600 700 800
E 50
(MP
a)
UCS (kPa)
5%C+20%FA
(cement content, curing days)
(curing days)
Page 79
61
E50/UCS ratio vs. time graph is given in Figure 4.6. For all mixes, as this ratio
increases up to 28 days, then there is a sharp decrease after this time. This ratio
is all about 200 for 5%C, 5%C+20%FA, and 15%C mixes. 5%C+20%FA mixes
give the same ratios as that of 15%C mixes. This ratio is around 200 for 30%C
mixture. The E50/UCS ratios are lower for higher cement contents. For long term
this ratio converges to 200 as in the case for mixed CL.
Figure 4.6 E50/UCS vs. time for C and C+FA mixes
As it is seen in Figure 4.7, as cement content increases, the ratio of UCS of
treated soil to the one of untreated soil increases linearly. The trend may be
given by a linear regression. This means that the UC strength of the cement
treated soil is 0.885aw times the strength of the untreated soil (Equation 4.1).
0
100
200
300
400
500
600
700
0 50 100 150 200 250 300 350 400
E 50/
UC
S
Time (days)
5%C
15%C
30%C
5%C+20%FA
Page 80
62
0.885.tw
u
UCSa
UCS (4.1)
where, UCSt and UCSu is the 28 days UCS of the treated and untreated soil,
respectively. aw is the cement content in %.
Figure 4.7 UCS treated,28days / UCS untreated,28days for different cement contents
The fly-ash also gives some strength increase. This is due to type C fly-ash as in
this study that performs hydration (CaO+H2O) process. The 28 day strength of
5%C+20%FA treated soil is 9.43 times the untreated soil. From the above
relation, it can be back-calculated that 5%C+20%FA gives the same strength
enhancement as 10% (9.43/0.885 = 10.65%) cement addition does.
y = 0.885xR² = 0.984
0
5
10
15
20
25
30
0 5 10 15 20 25 30
UC
S t /
UC
S u
Cement content (%)
Page 81
63
4.1.3 Comparison of results of tests on improved CL and kaolinite
From Figure 4.8 the relation between axial strain at failure and UC strength
obtained from UC test results can be seen. Although at lower strength region
there is a great scatter in this relation, at higher UC strengths, the strain at failure
value is at a narrow range of 0.75-1.25 %. The strains at failure show a rapid
decrease at the strength of 400 kPa. This trend is related to the brittle behavior
of the stabilized soils. As UCS of the mixed soil increases, the soil shows a more
brittle behavior. This can also be seen in figures of stress and strain for CL and
kaolinite, respectively (Figures 4.9 and 4.10). These results are in good
agreement with the results presented by Ahnberg et al. (2003).
Figure 4.8 Axial strain at failure load vs. UCS for C and C+FA mixed CL and
kaolinite soils
0
0.5
1
1.5
2
2.5
3
3.5
0 200 400 600 800 1000 1200
Axi
al s
tra
in a
t fa
ilure
, ef(%
)
UCS (kPa)
CL mixes
Kaolin mixes
Page 82
64
Figure 4.9 Stress-strain for mixed CL
Figure 4.10 Stress-strain for mixed kaolinite
0
200
400
600
800
1000
1200
0 1 2 3 4 5 6 7 8 9 10 11 12 13 14 15 16
Axi
al S
tre
ss (k
Pa)
Axial Strain (%)
CL
5%C
5%C+20%FA
10%C
15%C
CL
0
200
400
600
800
1000
1200
0 1 2 3 4 5 6 7 8 9 10 11 12 13 14 15 16
Axi
al S
tre
ss (k
Pa)
Axial Strain (%)
Kaolinite
5%C
5%C+20%FA
15%C
30%C
kaolinite
Page 83
65
The E50/UCS ratio vs. cement content relation for different curing times can be
seen in Figure 4.11. This ratio converges to a smaller range from 5% to 15%
cement content values (100-600 for 5%C, 300-500 for 15%C). For the cement
content of 30%, this ratio is about 200.
Figure 4.11 E50/UCS vs. cement content for C mixed CL and kaolinite soils
0
100
200
300
400
500
600
700
0 5 10 15 20 25 30 35
E 50/
UC
S
Cement content (%)
CL mixes
Kaolin mixes
Page 84
66
4.2 LARGE SCALE CONSOLIDATION TESTS
Results of large scale consolidation tests on deep mixed group column improved
kaolinite soil mass are presented in Figures 4.12 to 4.16.
The stress-strain graphs for kaolinite improved with cement/cement+fly-ash
columns are presented in Figure 4.12. It is obvious that the deformation
behavior of kaolinite is changed by the C/C+FA treatment. The effect of change
of deformation behavior depends on the binder type and also the number of
columns (replacement ratio, as). The replacement ratios (ratio of total area of
DMC to that of stabilized soil) for 19, 38, 55, and 85 column groups are 0.045,
0.09, 0.13, and 0.20, respectively.
In Figure 4.12 5%C treated group of columns indicate more strains than the
other type of columns. 5%C+20%FA and 15%C group of columns show the
strains more than 5%C and less than 30%C group of columns. The most
efficient binder mix seems to be the high amount of cement (30%). The
improvement ratios are discussed in detail in the following sections for each
binder type.
Page 85
67
Figure 4.12 Stress-Strain diagrams for all tests
As can be seen in Figure 4.13 the average strain of the soft clay can be reduced
by 13% to 36% with the improvement by 5% cement DMM column groups.
These values are calculated at 1 and 4 kg/cm2.The replacement ratio or number
of columns does not cause much difference in the improvement for 5% cement
binder stabilized kaolinite.
0
0.5
1
1.5
2
2.5
3
3.5
4
0 0.01 0.02 0.03 0.04 0.05 0.06 0.07 0.08 0.09
Stre
ss (k
g/cm
2)
Strain (%)Untreated kaolin,UK-large consolidation tank UK-219col-5%C 38col-5%C55col-5%C 19col-5%C+20%FA38col-%5C+20%FA 55col-5%C+20%FA85col-5%C+20%FA 19col-15%C38col-15%C 55col-15%cem38col-30%C 85col-30%C
Page 86
68
Figure 4.13 Stress-strain diagram for 5%C column improved tests
Figure 4.14 shows that the average strain of the soft clay can be reduced by 24%
to 63% with the improvement by 5%C+ 20%FA DMM column groups for 19-55
columns. The number of columns makes some difference in the deformation
behavior of the stabilized soil. The 19, 38, and 55 column groups give the
similar results, whereas the 85 column group causes a better improvement. The
average strain can be reduced by 28% to 79% for 85 columns.
As the number of columns (replacement ratio) increases the final strain at the
end of consolidation decreases.
0
0.5
1
1.5
2
2.5
3
3.5
4
0 0.01 0.02 0.03 0.04 0.05 0.06 0.07 0.08
Stre
ss (k
g/cm
2 )
Strain ( %)
5%C
55columns
38columns
19columns
UK
Page 87
69
Figure 4.14 Stress-strain diagram for 5%C+20%FA column improved tests
As can be seen in Figure 4.15 the average strain of the soft clay can be reduced
by 30% to 71% with the improvement by 15% cement DMM column groups.
The number of columns does not change the stress-strain behavior significantly.
As it is concluded from Figures 4.13 to 4.15, increase of replacement ratio or
number of columns does not cause significant difference in the improvement
with 5%C, 5%C+20%FA and 15%C columnar improved clay.
0
0.5
1
1.5
2
2.5
3
3.5
4
0 0.01 0.02 0.03 0.04 0.05 0.06 0.07 0.08
Stre
ss (k
g/cm
2)
Strain (%)
5%C+20%FA
85columns
55columns
38columns
19columns
UK
Page 88
70
Figure 4.15 Stress-strain diagram for 15%C column improved tests
The average strain of the soft clay can be reduced by 33% to 86% with the
improvement by 38 columns of 30%C (Figure 4.16). These values are 66% to
94% for 85 columns of 30%C. The number of columns makes a substantial
change in the deformation behavior of the treated soil.
0
0.5
1
1.5
2
2.5
3
3.5
4
0 0.01 0.02 0.03 0.04 0.05 0.06 0.07 0.08
Stre
ss (k
g/cm
2 )
Strain (%)
15%C
55columns
38columns
19columns
UK
Page 89
71
Figure 4.16 Stress-strain diagram for 30%C column improved tests
In Figure 4.17 the average settlement reduction factors ( values obtained for
different replacement ratios are averaged for each type of columns) are shown
for different consolidation stress levels for different binder mixes. Accordingly,
the most effective binder mix is 30%C. 30%C mixed group of columns will
improve the system (will reduce the settlement of the system) 2.2 to 13 times for
consolidation stresses of 4 and 1 kg/cm2, respectively.
15%C and 15%C + 20%FA mixed group of columns will show a settlement
reduction factor above 2 for 1-1.5 kg/cm2 stress range. These values drop under
2 for stress ranges above 2 kg/cm2.
The less effective binder mix is 5%C. The settlement reduction factors are under
2 for all stress levels. These are shown in detail in Figures 4.19 and 4.20.
0
0.5
1
1.5
2
2.5
3
3.5
4
0 0.01 0.02 0.03 0.04 0.05 0.06 0.07 0.08
Stre
ss (k
g/cm
2 )
Strain (%)
30%C
85columns
38columns
UK
Page 90
72
Figure 4.17 Average settlement reduction factors (suntreated/streated) at different
consolidation stress levels
In Figure 4.18 settlement reduction factors for different consolidation stresses
are shown for each individual test. 30%C columns give the upper bound and
5%C columns give the lower bound.
0
2
4
6
8
10
12
14
1 1.5 2 2.5 3 4
Sett
lem
en
t re
du
ctio
n fa
cto
r,
Consolidation stress (kg/cm2)
30%C
15%C
5%C+20%FA
5%C
Page 91
73
Figure 4.18 Settlement reduction factor for different stress ranges for all tests
In Figure 4.19 and 4.20 the settlement reduction factors for 2 and 2.5 kg/cm2
consolidation stresses, which is the typical range of loading for DMM improved
projects, for different binder mixes and different replacement ratios can be seen.
There is a limited increase of improvement ratio with increasing replacement
ratio for cement treated clays except 30%C columns. The values are in the
range of 1.31 to 1.48, and 1.77 to 2.12 for 5%C, and 15%C, respectively. The
values are in the range of 1.73 to 2.28 for 5%C+20%FA column improved
system.
0
2
4
6
8
10
12
14
16
18
20
0 0.5 1 1.5 2 2.5 3 3.5 4
Sett
lem
en
t re
du
ctio
n fa
cto
r,
Consolidation stress (kg/cm2)
19-5%C 38-5%C 55-5%C 19-5%C+20%FA
38-5%C+20%FA 55-5%C+20%FA 85-5%C+20%FA 19-15%C
38-15%C 55-15%C 38-30%C 85-30%C
Page 92
74
In general, while values for 5%C, 5%C+20%FA, and 15%C columns are
below 2, the 30% cement mixed group of columns makes a substantial
improvement in terms of settlement reduction (2-2.5 for 38 columns, 6-9 for 85
columns).
Figure 4.19 Settlement reduction factor () vs. number of columns for
consolidation pressure of 2 kg/cm2
1
2
3
4
5
6
7
8
9
10
0 10 20 30 40 50 60 70 80 90
Sett
lem
ent r
ed
uct
ion
fact
or,
(s
un
tre
ated
/str
eat
ed)
No. of Columns
-Number of Columns (for p=2 kg/cm2)
5%C
5%C+20%FA
15%C
30%
Page 93
75
Figure 4.20 Settlement reduction factor vs. number of columns for consolidation
pressure of 2.5 kg/cm2
Change of settlement reduction factor with stress level at different replacement
ratios for different binder materials is shown in Figure 4.21. A similar plot is
presented in Figure 4.22 where is related to as at different stress levels for
different binder materials. It is observed that decreases consistently with
increasing stress level at all as, but effect of as is not much pronounced. On the
other hand high cement content results in very high improvement () at higher as
(as=0.2).
For all binder materials and for all replacement ratios settlement reduction ratio
(as) decreases at higher stress levels (3-4 kg/cm2) (Figures 4.21 and 4.22). This
seems to be related to py values of composite groups and small oedometer tests
of stabilized soils.
1
2
3
4
5
6
7
0 10 20 30 40 50 60 70 80 90
(s
un
tre
ate
d/s
tre
ate
d)
No. of Columns
-Number of Columns (for p=2.5 kg/cm2)
5%C
5%C+20%FA
15%C
30%C
Page 94
76
Figure 4.21 vs P for as from 0.045 to 0.2
y = 2.85x-0.5
0
0.5
1
1.5
2
2.5
3
3.5
0 1 2 3 4
P (kg/cm2)
as=0.0455%C
5%C+20%FA
15%C
y = 6.4x-1.1
0
1
2
3
4
5
6
7
8
0 1 2 3 4
P (kg/cm2)
as=0.095%C
5%C+20%FA
15%C
30%C
y = 3.4x-0.6
0
0.5
1
1.5
2
2.5
3
3.5
4
0 1 2 3 4
P (kg/cm2)
as=0.13
5%C
5%C+20%FA
15%C
y = 20x-1.2
02468
101214161820
0 1 2 3 4
P (kg/cm2)
as=0.2
5%C+20%FA
30%C
Page 95
77
Figure 4.22 vs as for P from 1.5 to 3 kg/cm2
0
2
4
6
8
10
12
14
0 0.05 0.1 0.15 0.2 0.25
as
P = 1.5 kg/cm2
5%C5%C+20%FA15%C30%C
0123456789
10
0 0.05 0.1 0.15 0.2 0.25
as
P = 2 kg/cm2
5%C5%C+20%FA15%C30%C
0
1
2
3
4
5
6
7
0 0.05 0.1 0.15 0.2 0.25
as
P = 2.5 kg/cm2
5%C5%C+20%FA15%C30%C
0
1
2
3
4
5
6
0 0.05 0.1 0.15 0.2 0.25
as
P = 3 kg/cm2
5%C5%C+20%FA15%C30%C
Page 96
78
The total displacement vs. consolidation stress (in Log scale) plots are presented
in Figures 4.23 to 4.26. As these curves are similar to that of e-logP curves of
oedometer tests, the break points on the curves for improved soils are similar to
the recompression-compression passage. This phenomenon is called the
consolidation yield pressure or pseudo pre-consolidation pressure, py (especially
for single binder mixed samples in the literature). The compressibility of the
treated soil is almost the same as that of the untreated soil when the stress in the
treated soil exceeds this value.
As stated by some researchers (Terashi and Tanaka, 1993; Kasama and Zen,
2000; Kamruzzaman et al., 2001) beyond the pseudo pre-consolidation pressure,
the behavior of treated sample was almost parallel to the virgin consolidation
line (VCL) of the untreated clay which implied that the soft clay matrix may still
control the behavior of treated clay if it is stressed beyond pre-consolidation
pressure. This phenomenon is observed on stabilized soil samples in oedometer
by these researchers. But this study shows that this is also relevant to the
improvement of soft soils by DMM column groups. This can be seen in Figures
4.23 to 4.26.
The value of py is studied in the literature by a number of researchers. Terashi
and Tanaka (1993)(30 cm diameter, 10 cm height consolidation tests on
composite ground- 15%C, as of 30%) stated the value of py as 1.3*UCS.
Horpibulsuk (2001) and Liu et al. (2006) performing similar tests determined
this value as 2.2 and 1.5, respectively.
From Figures 4.23 to 4.26, the py values are obtained as 1.2, 1.3, and 1.4 kg/cm2
for 5%C, 5%C+20%FA, and 15%C mixes, respectively. The number of columns
does not change this value for these mixes. py/UCS values are 0.72, 0.39, and
0.35 for 5%C, 5%C+20%FA, and 15%C mixes, respectively. For the 30%C
mixes, increase in the number of columns increase the value of py. The py values
Page 97
79
for 30%C mixes are 1.5 and 2.7 kg/cm2 for 38 and 85 columns, respectively.
The values of py/UCS are between 0.16 and 0.28 and these are not similar to
py/UCS values reported in the literature. Research work by Terashi and Tanaka
(1993), Horpibulsuk (2001), and Liu et al. (2006) was performed on single
column treated soil systems. Their contribution for relating the yield pressure to
the UC strength of the system is valid for single column improved systems. The
group column improved systems however show a different behavior in terms of
yield pressure phenomenon.
Cement content (aw) of DMC highly affect the py value of the stabilized system.
High cement content (30%C) yields higher py values hence better improvement
at higher stress levels. Higher replacement ratios (as) end up with higher py
values and much better improvement.
Figure 4.23 t – LogP curve for 5%C column tests
0
5
10
15
20
0.1 1 10
t(t
ota
l dis
pla
cem
ent)
, mm
Log P, kg/cm2
5%C
55columns
38columns
19columns
UK
Page 98
80
Figure 4.24 t – LogP curve for 5%C+20%FA column tests
Figure 4.25 t – LogP curve for 15%C column tests
0
5
10
15
20
0.1 1 10
t(t
ota
l dis
pla
cem
en
t), m
m
Log P, kg/cm2
5%C+20%FA
85columns
55columns
38columns
19columns
UK
0
5
10
15
20
0.1 1 10
t(t
ota
l dis
pla
cem
en
t, m
m
Log P , kg/cm2
15%C
55columns
38columns
19columns
UK
Page 99
81
Figure 4.26 t – LogP curve for 30% C column tests
Figures 4.27 to 4.30 show the comparison of constrained modulus (M) of soils
improved with different number of DMCs and binder mixes with the untreated
kaolinite (UK) for different consolidation stress ranges. Figure 4.27 provides the
comparisons for soils treated with 5%C DMC and shows that M values of
improved soils are higher compared to that of UK for consolidation stresses up
to 2 kg/cm2. However, this trend is not observed for higher consolidation
stresses. In addition, increasing the number of columns did not help improving
the soil when 5%C columns are used.
Figure 4.28 shows M values of soils improved with group of columns made by
mixing 5%C and 20%FA as compared to UK. For consolidation stresses
between 0.5 and 2 kg/cm2, using DMC and increasing the number of columns
will significantly increase the moduli. In this consolidation stress range, unlike
the addition of 5%C, when FA is used as an additive together with C, increasing
0
5
10
15
20
0.1 1 10
t(t
ota
l dis
pla
cem
en
t, m
m
Log P , kg/cm2
30%C
85columns
38columns
UK
Page 100
82
the number of columns will substantially affect the performance of
improvement. The maximum increase in M value is about 3.75 MPa (100%
increase) which was obtained when 85 columns were used.
Figure 4.27 Comparison of M of soils improved with DMC of 5%C
0
1000
2000
3000
4000
5000
6000
7000
UK 19 38 55
M (k
Pa)
Number of columns
5%C
0.5-2 kg/cm2
2-4 kg/cm2
Page 101
83
Figure 4.28 Comparison of M of soils improved with DMC of 5%C+20%FA
Figure 4.29 shows M values of soils improved with group of columns made by
mixing 15%C. For consolidation stresses between 0.5 and 2 kg/cm2, using DMC
and increasing the number of columns will greatly help obtaining higher moduli.
Increasing the number of columns will substantially affect the performance of
improvement. The maximum increase in M value is about 3.3 MPa which was
obtained when 55 columns were used. The improvement level for 38 and 55
columns are at the same order.
0
1000
2000
3000
4000
5000
6000
7000
8000
UK 19 38 55 85
M (
kPa)
Number of columns
5%C + 20%FA
0.5-2 kg/cm2
2-4 kg/cm2
Page 102
84
Figure 4.29 Comparison of M of soils improved with DMC of 15%C
Figure 4.30 provides the comparison of M values for 38 and 85 columns of
30%C with those of UK. For 0.5-2 kg/cm2 stress range 38 columns of 30%C
increases the M value of UK from 3.6 to 8.6 MPa. 85 columns of 30%C increase
the M value of UK from 3.6 to 33 MPa for the stress range of 0.5-2 kg/cm2.
Figure 4.31 provides the summary of modulus (M) values for all groups.
0
1000
2000
3000
4000
5000
6000
7000
8000
UK 19 38 55
M (
kPa
)
Number of columns
15%C0.5-2 kg/cm2
2-4 kg/cm2
Page 103
85
Figure 4.30 Comparison of M of soils improved with DMC of 30%C
Figure 4.31 Comparison of M for all consolidation stress ranges
0
5000
10000
15000
20000
25000
30000
35000
UK 38 85
M(k
Pa)
Number of columns
30%C
0.5-2 kg/cm2
2-4 kg/cm2
0 5000 10000 15000 20000 25000 30000
0.5-1
1-1.5
1.5-2
2-2.5
2.5-3
3--4
Constrained Modulus, M (kPa)
Stre
ss R
ange
(kg/
cm2)
85 - 30%C 38 - 30% 55 - 15% 38 - 15%
19 - 15% 85 - 5%C+20%FA 55 - 5%C+20%FA 38 - 5%C+20%FA
19 - 5%C+20%FA 55 - 5%C 38 - 5%C 19 - 5%C
to 32000
to 60000
Page 104
86
The data in Figures 4.27-4.31 can also be presented as in Figure 4.32. The M
values for the two stress ranges for all tests are drawn.
From Figure 4.32, it is concluded that group columns of 5%C (19, 38, 55
columns) increases M from 3.6 to about 5 MPa. The M values for 5%C+20%FA
column improved system are between 5.5 and 7.3 MPa. 15%C columns increase
M value of the system to about 6.8 MPa. The modulus values of 38 and 85
columns of 30%C treated soil is 8.7, and 33 MPa, respectively. These data are
presented for 0.5-2 kg/cm2 stress range. No substantial differences in M values
were observed for 2-4 kg/cm2 stress range.
Figure 4.32 Change in M for different stress ranges
0
5
10
15
20
25
30
35
M (
MP
a)
Deep mixed columns
M (constrained modulus)
0.5-2 kg/cm2
2-4 kg/cm2
Page 105
87
The increase in M for 0.5-2 kg/cm2 stress range is presented in Figure 4.33. As
cement percentage increases, the increase in M (or level of improvement) for
different as values are noted.
Using cement alone binders the optimum as value for improvement may not be
higher than 0.1 for low cement contents (up to 15%), since the increase in M
value converges to 100% asymptotically. The 30%C admixed soil shows great
increase in M (from 140% to 810%).
Figure 4.33 Change of % increase in M for different replacement ratios for the
stress range of 0.5-2 kg/cm2
For most of binders (except 30%C) studied the percent increase in M is between
30-100%.
0
100
200
300
400
500
600
700
800
900
0 0.05 0.1 0.15 0.2 0.25
Per
cen
t in
cre
ase
in M
Area ratio, as
5%C
5%C+20%FA
15%C
30%C
p = 0.5-2 kg/cm2 range
Page 106
88
In general design methodology, for computing the deformations of the stabilized
composite mass, the bulk compression modulus of the system is obtained by the
formulation which is given in Equation 4.2.
system column s soil sM M .a M . 1 a (4.2)
where; as: replacement ratio, Mcolumn: 1D (constrained) compression modulus of
DMC from oedometer tests, Msoil: 1D (constrained) compression modulus of
soil from oedometer tests. When computing for design (settlement calculations)
1D compression (constrained) modulus (M) of the column material must be
used.
If cement columns due to stress concentration deforms in the lateral direction
(i.e. deviation from 1-D compression) Ecol may be used. In this case Msystem is
written as in Equation 4.3.
system column s soil sM-E E .a M . 1 a (4.3)
where; as: replacement ratio, Ecolumn: elastic modulus of DMC from UC tests,
Msoil: 1D (constrained) compression modulus of soil from oedometer tests.
There is also common use of E moduli in professional practice. Equation 4.4
with E (elastic modulus) values for both column and soil are employed
(Equation 4.5).
system column s soil sE E .a E . 1 a (4.4)
where; as: replacement ratio, Ecolumn: elastic (shear) modulus of DMC from UC
tests, Esoil: elastic (shear) modulus of soil from UC tests. The calculated Esystem
value is then used instead of Msystem for settlement calculations.
Page 107
89
The experimental Msystem values determined from the large scale test data were
compared with the Msystem and Esystem values calculated from Equations 4.2, 4.3
and 4.4. The ratio between these values are given in Tables 4.3-4.5 and Figures
4.34-4.37.
The calculated settlements of the composite system are not similar to the
measured values at all replacement ratios. Best approach seems to conduct
oedometer tests on stabilized soil and on untreated soil in the laboratory to
calculate compressibility of the composite mass.
From the values in Table 4.3 it is understood that the calculation always give
higher values for M. As this classical approach overestimates the constrained
modulus (M) of the system for 1-1.5, 1.5-2 and 2-2.5 kg/cm2 stress ranges
Page 108
90
Table 4.3 Msystem/Mexp ratios for P=1-1.5 kg/cm2 stress range
Binder Type as
Mcalc/Mexp
Ecalc/Mexp M-Ecalc /Mexp
5%
C
0.045 0.74 1.20 1.83
0.09 0.80 2.44 3.06
0.13 0.85 3.64 4.26
5%
C+
20%
FA
0.045 0.66 1.46 1.98
0.09 0.78 3.09 2.15
0.13 0.77 4.13 2.00
0.20 0.66 4.88 1.54
15%
C
0.045 0.57 1.50 1.95
0.09 0.54 2.59 2.98
0.13 0.74 4.72 5.17
30%
C 0.09 0.53 2.5 2.82
0.20 0.18 1.39 1.46
Page 109
91
Table 4.4 Msystem /Mexp ratios for P=1.5-2 kg/cm2 stress range
Binder Type as Mcalc/Mexp Ecalc/Mexp M-Ecalc/Mexp
5%C
0.045 0.97 1.09 1.96
0.09 0.87 1.94 2.69
0.13 0.83 2.67 3.37
5%C+20%FA
0.045 0.91 1.39 2.16
0.09 0.97 2.74 2.17
0.13 0.81 3.16 1.74
0.20 1.05 5.84 2.09
15%C
0.045 0.84 1.57 2.27
0.09 0.89 3.12 3.84
0.13 0.80 3.85 4.41
30%C 0.09 0.92 3.5 4.17
0.20 0.26 1.89 2.03
Page 110
92
Table 4.5 Msystem /Mexp ratios for P=2-2.5 kg/cm2 stress range
Binder Type as Mcalc/Mexp Ecalc/Mexp M-Ecalc/Mexp
5%C
0.045 0.93 0.88 1.72
0.09 0.99 1.84 2.71
0.13 0.91 2.42 3.18
5%C+20%FA
0.045 0.97 1.27 2.11
0.09 1.01 2.52 2.14
0.13 1.15 3.99 2.36
0.20 0.92 4.70 1.80
15%C
0.045 0.89 1.42 2.19
0.09 0.95 2.88 3.67
0.13 0.98 4.15 4.87
30%C 0.09 1.38 3.55 4.36
0.20 0.77 3.17 3.45
Page 111
93
Figure 4.34 Comparison of M values calculated for 5%C stabilized soils
Figure 4.35 Comparison of M values calculated for 5%C+20%FA stabilized
soils
0
1
2
3
4
5
6
Mca
lc, s
yste
m/M
exp
Stress Range (kg/cm2)
5%C
Ecalc/Mexp, as=0.045 Ecalc/Mexp, as=0.09 Ecalc/Mexp, as=0.13
M-Ecalc/Mexp, as=0.045 M-Ecalc/Mexp, as=0.09 M-Ecalc/Mexp, as=0.13
Mcalc/Mexp, as=0.045 Mcalc/Mexp, as=0.09 Mcalc/Mexp, as=0.13
0
1
2
3
4
5
6
Mca
lc, s
yste
m/M
exp
Stress Range (kg/cm2)
5%C+20%FA
Ecalc/Mexp, as=0.045 Ecalc/Mexp, as=0.09 Ecalc/Mexp, as=0.13
Ecalc/Mexp, as=0.20 Mcalc/Mexp, as=0.045 Mcalc/Mexp, as=0.09
Mcalc/Mexp, as=0.13 Mcalc/Mexp, as=0.20 M-Ecalc/Mexp, as=0.20
M-Ecalc/Mexp, as=0.045 M-Ecalc/Mexp, as=0.09 M-Ecalc/Mexp, as=0.13
0.5-1 1-1.5 2-2.5 2.5-3 3-4 1.5-2
0.5-1 1-1.5 2-2.5 2.5-3 3-4 1.5-2
Page 112
94
Figure 4.36 Comparison of M values calculated for 15%C stabilized soils
Figure 4.37 Comparison of M values calculated for 30%C stabilized soils
0
1
2
3
4
5
6
Mca
lc, s
yste
m/M
exp
Stress Range (kg/cm2)
15%C
M-Ecalc/Mexp, as=0.045 M-Ecalc/Mexp, as=0.09 M-Ecalc/Mexp, as=0.13
Ecalc/Mexp, as=0.045 Ecalc/Mexp, as=0.09 Ecalc/Mexp, as=0.13
Mcalc/Mexp, as=0.045 Mcalc/Mexp, as=0.09 Mcalc/Mexp, as=0.13
0
1
2
3
4
5
6
7
Mca
lc, s
yste
m/M
exp
Stress Range (kg/cm2)
30%C
Ecalc/Mexp, as=0.09 Ecalc/Mexp, as=0.20 M-Ecalc/Mexp, as=0.09
M-Ecalc/Mexp, as=0.20 Mcalc/Mexp, as=0.09 Mcalc/Mexp, as=0.20
0.5-1 1-1.5 2-2.5 2.5-3 3-4 1.5-2
0.5-1 1-1.5 2-2.5 2.5-3 3-4 1.5-2
Page 113
95
As in Figure 4.38 the M values found from standard consolidation (oedometer)
tests are in good agreement with the values obtained from the large scale
consolidation tests (Maintained Step Loading Test) in the tank. The oedometer
sample was taken from clay consolidated in the tank by means of pushing
oedometer ring. Then it was transferred to the standard consolidation testing
apparatus.
The results from the two testing system is well suited for the range of p=1.5 to 3
kg/cm2 which may be considered as the normal loading stress range for deep
mixed systems.
Figure 4.38 Comparison of constrained modulus (M) values for kaolinite in the
oedometer and large scale consolidation test
0
2
4
6
8
10
12
0.5-1 1-1.5 1.5-2 2-2.5 2.5-3 3--4
M (
MP
a)
Stress (kPa)
Kaolin-oedometer test
UK-large scale test
Page 114
96
Stresses on deep mix columns and on soil may be back-calculated for each
individual test. The compression modulus (M) values of kaolinite for each stress
range is known from the large scale consolidation test results on UK. The
settlement values for each stress range are already measured for all groups of
column improved systems. The stress on the soil is calculated form the
conventional equation (Equation 4.5).
.soil soil
soil
M
H
(4.5)
Total stress in the stabilized system is given conventionally as in Equation 4.6.
. .(1 )system col s soil sa a (4.6)
Then the stress in the column can be calculated from Equation 4.7.
.(1 )syst soil s
col
s
a
a
(4.7)
Summary of the calculations is presented in form of ratio of stress on column to
that on soil in Figure 4.39 against replacement ratio at different stress levels.
The ratios are higher at lower stress levels, and they show a decreasing trend
with increasing replacement ratio. Stress ratios in case of 30%C stabilized
columns are very high namely 43, 22, 9 at replacement ratio of 0.19. Stiff
columns take more loads. For other binder materials studied col/soil ratios vary
between 1-17 depending on stress level and as.
Page 115
97
Figure 4.39 qcol/qsoil vs. as for P from 1.5 to 2.5 kg/cm2
0
10
20
30
40
50
0 0.05 0.1 0.15 0.2
qco
l/q
soil
as
P=1.5 kg/cm2
5%C
5%C+20%FA
15%C
30%C
0
5
10
15
20
25
0 0.05 0.1 0.15 0.2
qco
l/q
soil
as
P=2 kg/cm2
5%C
5%C+20%FA
15%C
30%C
0
2
4
6
8
10
0 0.05 0.1 0.15 0.2
qco
l/q
soil
as
P=2.5 kg/cm2
5%C
5%C+20%FA
15%C
30%C
Page 116
98
4.3 SUMMARY
In this chapter, the results of UC tests on the binder mixed soils and large scale
consolidation tests on DMC columnar improved soft clay were presented. The
findings for consolidation behavior of DMC improved systems were discussed.
The effect of parameters of DMC (binder content, replacement ratio) on the
improvement was determined. The conclusions are given in the next Chapter.
Page 117
99
CHAPTER 5
CONCLUSION
5.1 GENERAL
Compression behavior of a soft clay improved by groups of deep mixed
columns has been studied by performing large scale laboratory model tests. The
effects of replacement ratio, binder type, stress level, amount of binder have
been investigated in these tests. Before the large scale testing program
unconfined compression strength of all mixes has been determined.
5.2 COMPRESSIVE STRENGTH OF CEMENT/CEMENT+FLY-ASH
STABILIZED SOFT CLAY
1. The 5% cement addition does not improve the UC strength substantially.
But as the cement content is increased or another type of pozzolanic
binder is used with the cement, better strength improvement can be
obtained. Especially 30%C admixture results in higher strength.
2. As cement percentage in the stabilizer increases, the ratio of UC strength
of the treated soil to the one of untreated soil increases linearly (from 5
to 25 times). 20% FA addition with 5%C results in 1o times increase in
UCS.
3. The C and C + FA addition increases the elastic modulus (E50) of the
treated soil. The 5% cement with the addition of 20% fly-ash mixed soil
Page 118
100
gives an elastic modulus as much as that of 15% and 30% cement mixed
samples. This shows the efficiency of FA addition for the improvement
of strength and also modulus of soft soils. The E50/UCS ratios for 5%
and 15% cement content values are 100-600 and 300-500, respectively.
For the cement content of 30% this ratio is about 200. The ratio of
E50/UCS is 450 for C + FA mixes.
5.3 CONSOLIDATION BEHAVIOR OF DMM GROUP COLUMN
IMPROVED SOFT CLAY
1. The deformation characteristics of C/C+FA stabilized soft clay by
columns has shown a change compared to the untreated soil. The effect
of change of deformation behavior depends on the binder type and also
the number of columns (replacement ratio, as).
2. Stiffer columns provide much better improvement. It should be stressed
that there is a threshold cement content beyond which significant
improvement occurs and it is practically very important to determine it.
3. Depending on the required level of improvement, cement content and as
may be designed based on Figures 4.21 and 4.22 (-p relationships).
4. For consolidation stresses between 0.5 and 2 kg/cm2, using DMC and
increasing the number of columns will significantly increase the moduli.
5. For most of binders studied (5%C, 5%C+20%FA, 15%C), percent
increase in constrained modulus (M) is between 30-100%. This increase
reaches to 140-800% for 30%C group of columns.
6. Large scale model tests have shown that the best approach to calculate
the compressibility of deep mix stabilized soils is to conduct laboratory
oedometer tests on stabilized and untreated soil samples and measure M
moduli to be used in Equation 4.2. Equations 4.3 and 4.4 overestimate
Page 119
101
the composite moduli roughly 2 to 5 times considering various stress
levels and as values.
7. Stresses on the columns (col) and on the soil (soil) during composite
loading is the basis of calculations on columnar improvement works.
col/soil ratios decrease with increasing replacement replacement ratio
(as) at all pressure levels (Figure 4.39). Overall range is from 17 to 1
depending on the replacement ratio, stress level and binder type. If
cement content is higher (e.g. 30%) col/soil value is 22 at p=2.0 kg/cm2
and 9 at 2.5 kg/cm2 for as=0.20. Stiff columns take higher loads. At
practical replacement ratios and common stress levels values vary
roughly between 3-6.
5.4 RECOMMENDATIONS FOR FUTURE RESEARCH
1. As stiffer columns carry more load, it is recommended that compression
characteristics of soils reinforced by stiffer binders should be studied
(upper limit is mortar columns and piles).
2. Behavior of footings on DMC is expected to be different than that of 1D
loaded areas. A laboratory model study on footings supported by DMC
would be valuable.
3. Floating DMC improved system will show a different behavior than the
site improved by end bearing DMC. Floating DMC improved system
may be studied with the similar setup.
4. Numerical modelling of DMC improved systems may give valuable
results for a comparison with the experimental findings.
5. The long term strength gain for stabilized soft clays may be investigated
by chemical and mineralogical analysis.
Page 120
102
REFERENCES
1. Ahnberg, H., Johansson, S.E., Pıhl, H., Carlsson, T., 2003. Stabilising effects
of different binders in some swedish soils, Ground Improvement, 7(1), pp. 9-
23.
2. Ahnberg, H., Johansson, S.-E., Retelius, A., Ljungkrantz, C., Holmqvist, L.,
Holm, G., 1995. Cement och kalk för djupstabilisering av jord, Rapport No
48, Swedish Geotechnical Institute, Linköping.
3. Alen, C., Baker, S., Ekström, J., Hallingberg, A., Svahn, V., Sallfors, G.,
2005. Test embankments on lime/cement stabilized clay, Proc. of The
International Conference on Dry Mix Methods for Deep Soil Stabilization,
Stockholm, Sweden.
4. Al-Tabbaa, A., 2005. State of Practice Report- Draft: Session 4,
Stabilisation/solidification of contaminated materials with wet deep soil
mixing, Proc. of International Conference on Deep Mixing, Deep Mixing ’05,
Stockholm, Sweden.
5. Andersson, M., Rogbeck, Y., Holm, G., Westerberg, B., Macsik, J., 2005.
Stabilisation of sulphide soil - laboratory and planned full-scale tests of soil
from Umea in northern Sweden, Proc. of International Conference on Deep
Mixing, Deep Mixing ’05, Stockholm, Sweden.
6. Andromalos, K.B., Hegazy, Y.A., Jasperse, B.H., 2000. Stabilization of soft
soils by soil mixing, , Proc. of An International Conference on Geotechnical
and Geological Engineering, GeoEng2000, Melbourne, Australia, paper no.
1190.
7. Aydilek, A., 2004. Fly ash amended soils as highway base materials,
Geotechnical Engineering for Transportation Projects, pp. 1032-1041.
Page 121
103
8. Bai, X., Kim, Y.U., Wang, M.C., 2001. Load transfer behavior of soil-
cement columns in soft ground, Proc. of Foundations and Ground
Improvement Conf. ASCE, GSP 113, pp. 61-73.
9. Balasubramaniam, A.S., Lin, D.G., Sharma, A.S.S., Kamruzzaman, A.H.M.,
Uddin, K., Bergado, D.T., 1999. Behavior of soft Bangkok clay treated with
additives, Proc. of the 11th
Asian Regional Conf. on Soil Mechanics and
Geotechnical Engineering, Seoul, Korea, pp.11-14.
10. Baker, S., Liedberg, N.S.D., and Sallfors, G. 1997. Deformation properties of
lime cement stabilised soil in the working state, Proc. of 14th
International
Conference on Soil Mechanics and Foundation Engineering, Hamburg, pp.
1667-1672.
11. Bergado, D.T., Ruenkrairergsa, T., Taesiri, Y., Balasubramaniam, A.S.,
1999. Deep soil mixing used to reduce embankment settlement, Ground
Improvement, 3, pp. 145-162.
12. Bergado, D.T., Lorenzo, G.A., Taechakumthorn, C., Balasubramaniam, A.S.,
2005a. Compression behavior of high water content cement-admixed clay,
Proc. of International Conference on Deep Mixing, Deep Mixing ’05,
Stockholm, Sweden.
13. Bergado D.T., Lorenzo, G.A., Phien-wej, N., Lin, S.S., Voottipruex, P.,
2005b. Compression mechanism of DMM pile in subsiding soft ground under
embankment loading with application to bridge approach embankment,
Proceedings of the 16th International Conference on Soil Mechanics and
Geotechnical Engineering (16ICSMGE), Osaka, Japan.
14. Boussida, M., Porbaha, A., 2004. Ultimate bearing capacity of soft clays
reinforced by a group of columns-application to a deep mixing technique,
Soils and Foundations, 44(3), pp. 91-101.
15. Broms, B.B., 1991. Stabilization of soil with lime columns, In Foundation
Engineering Handbook ed. by Hsai-Yang Fang, Van Nostrand Reinhold
Pub., New York, 923 pages.
16. Bruce, D.A., Bruce, M.C.E., Dimillio, A.F., 1999. Dry mix methods: A
brief overview of international practice, Proc. of The International
Conference on Dry Mix Methods for Deep Soil Stabilization, Stockholm,
Sweden.
Page 122
104
17. Bruce, D.A., 2001. Practitioner’s guide to the deep mixing method, Ground
Improvement, 5(3), pp.95-100.
18. Butcher, A.P., 2005. The durability of deep wet mixed columns in an organic
soil, Proc. of International Conference on Deep Mixing, Deep Mixing ’05,
Stockholm, Sweden.
19. Coastal Development Institute Tokyo (Ed.) 2002. The Deep Mixing Method,
A.A.Balkema.
20. Consoli, N.C., Prietto, P.D.M., Carraro, J.A.H., Heineck, K.S., 2001.
Behavior of compacted soil-fly ash-carbide lime mixtures, Journal of
Geotechnical and Geoenvironmental Engineering, 127(9), pp.774-782.
21. Çokça, E., 2001. Use of class c fly ashes for the stabilization of an
expansive soil, Journal of Geotechnical and Geoenvironmental
Engineering, 127(7), pp.568-573.
22. DEEP MIXING, 2005. Proceedings of International Conference on Deep
Mixing Best Practice and Recent Advances Stockholm, Sweden.
23. EuroSoilStab, 2001. Development of design and construction methods to
stabilize soft organic soils, Design Guide Soft Soil Stabilization, EC
Project BE 96-3177.
24. Fang, Y.S., Chung, Y.T., Yu, F.J., Chen, T.J., 2001. Properties of soil-
cement stabilised with deep mixing method, Ground Improvement, 5(2),
pp.69-74.
25. FHWA, 1999. An introduction to the deep soil mixing methods as used in
geotechnical applications, Pub. No. FHWA-RD-99-138, 150 pages.
26. Hayashi, H., Nischikawa, J., Ohishi, K., Terashi, M., 2003. Field
observation of long term strength of cement treated soils, Proc. of 3rd
International Specialty Conference on Grouting and Ground Treatment,
ASCE, GSP 120, Louisiana, USA, pp.598-609.
27. Hayashi, H. and Nishimoto, S., 2005. Strength characteristic of stabilized peat
using different types of binders, Proc. of International Conference on Deep
Mixing, Deep Mixing ’05, Stockholm, Sweden.
Page 123
105
28. Horpibulsuk, S., 2001. Analysis and assessment of engineering behavior of
cement stabilized clays, PhD Dissertation, Saga Univ., Saga, Japan.
29. Horpibulsuk, S., Miura, N., Bergado, D.T., 2004. Undrained shear behavior
of cement admixed clay at high water content, Journal of Geotechnical and
Geoenvironmental Engineering, 130 (10), pp. 1096-1105.
30. Indraratna, B., Balasubramaniam, A.S., Khan, M.J., 1995. Effect of fly ash
with lime and cement on the behavior of a soft clay, Quarterly Journal of
Engineering Geology, 28, pp. 131-142.
31. Jacobson, J.R., Filz, G.M., Mitchell, J.K., 2005. Factors affecting strength
of lime-cement columns based on a laboratory study of three organic soils,
Proc. of International Conference on Deep Mixing, Deep Mixing ’05,
Stockholm, Sweden.
32. Janz, M., Johansson, S.E., 2002. The function of different binding agents in
deep stabilization, Swedish Deep Stabilization Research Centre, Report No.
9, 47 pages.
33. Japanese Geotechnical Society JGS, 2000. Practice for making and curing
stabilized soil specimens without compaction, JGS T 0821-2000, Japanese
Geotechnical Society.
34. Jaroslaw, F, 2007. Utilization of Fly Ash in Deep Mixing Method,
Stabilization of Organic Soils, VIII Ogólnopolska Konferencja Naukow, pp.
491-500.
35. Kamruzzaman, A.H.M., Chew, S.H., and Lee, F.H. 2000. Engineering
Behaviour of Cement Treated Singapore Marine Clay, Proc. of An
International Conference on Geotechnical and Geological Engineering,
GeoEng2000, Melbourne, Australia, paper no. 1190.
36. Kasama, K., and Zen, K. 2000. Strength Characteristics of Cement Treated
Clayey and Sandy Soils in Terms of Overconsolidation Ratio, Proc. of An
International Conference on Geotechnical and Geological Engineering,
GeoEng2000, Melbourne, Australia, paper no. 0665.
37. Kitazume, M., Nakamura, T., Terashi, M., Ohishi, K., 2003. Laboratory
tests on long-term strength of cement treated soil, Proc. of 3rd
International
Page 124
106
Specialty Conference on Grouting and Ground Treatment, ASCE, GSP
120, Louisiana, USA, pp.586-597.
38. Kwan, P.S., Bouazza, A., Fletcher, P., Ranjith, P.G., oh, E.Y.N.,
Shuttlewood, K., Balasubramaniam, A.S., Bolton, M., 2005. Behaviour of
cement treated Melbourne and Southeast Queensland Australia clays with
soft clays in deep stabilization works, Proc. of International Conference on
Deep Mixing, Deep Mixing ’05, Stockholm, Sweden.
39. Lade, P.V., Overton, D.D., 1989. Cementation effects in frictional materials,
Journal of Geotechnical and Geoenvironmental Engineering, 115 (10), pp.
1373-1387.
40. Lahtinen, P., Niutanen, V., Kontiala, P., 2005. Towards sustainable
development process with mass and deep stabilization - the case of Vuosaari
seaport, Finland, Proc. of International Conference on Deep Mixing, Deep
Mixing ’05, Stockholm, Sweden.
41. Larsson, S. (2004). Mixing Processes for Ground Improvement by Deep
Mixing, SDSRC Report no.12, Ph.D. Thesis, 218 pages.
42. Larsson, S. and Kosche, M. A., 2005. Laboratory study on the transition
zone around lime-cement columns, Proc. of International Conference on
Deep Mixing, Deep Mixing ’05, Stockholm, Sweden.
43. Lin, D., Lin, K., Luo, H., 2007. A comparison between sludge ash and fly ash
on the improvement of soft soil, Air and Waste Management Assoc.
Technical Paper, 57, pp. 59-64.
44. Liu, M.D., Carter, J.P., Horpibulsuk, S., Liyanapathirana, D.S., 2006.
Modelling the behavior of cemented clay, Proc. of Ground Modification and
Seismic Mitigation, ASCE.
45. Lorenzo, G.A., Bergado, D.T., 2004. Fundamental parameters of cement-
admixed clay-a new approach, Journal of Geotechnical and
Geoenvironmental Engineering, 130 (10), pp. 1042-1050.
46. Löfroth, H., 2005. Properties of 10-year-old lime-cement columns, Proc. of
International Conference on Deep Mixing, Deep Mixing ’05, Stockholm,
Sweden.
Page 125
107
47. Miki, H., Furumoto, K., 2000. Model tests about the deep mixing soil
stabilization method with low improvement ratio, Proc. of An International
Conference on Geotechnical and Geological Engineering, GeoEng2000,
Melbourne, Australia, paper no. 0647.
48. Miura, N., Horpibulsuk, S., Nagaraj, T.S., 2001. Engineering behavior of
cement stabilized clay at high water content, Soils and Foundations, 41 (5),
pp. 33-45.
49. Mohamed, A.O., Hossein, M., 2004. Solidification/stabilization of sulphide
bearing soils using alfa process, Geo Jordan 2004, pp.131-144.
50. Özkeskin, A., 2004. Settlement reduction and stress concentration factors in
rammed aggregate piers determined from full-scale load tests, Ph.D. Thesis,
METU Civil Engineering Deprtment.
51. Terashi, M. and Tanaka, H., 1993. Settlement analysis for deep mixing
method, Proc. of 8th
European Conference on Soil Mechanics and Foundation
Engineering, Helsinki, Vol.2, pp.955-960.
52. Terashi, M. 2009. Keynote lecture: Current practice and future perspective
of QA/QC for Deep-Mixed ground, Okinawa Deep Mixing Symposium 2009.
53. Tomohisa, S., Sawa, K., Tachibana, M., Tanaka, H., 2000. Hardening
treatment of muddy soil with coal fly ashes, Proc. of An International
Conference on Geotechnical and Geological Engineering, GeoEng2000,
Melbourne, Australia, paper no. 0464.
54. Turner J.P., Mayne P.W., 2004. Proc. of GEO SUPPORT 2004 Drilled
Shafts, Micropiling, Deep Mixing, Remedial Methods and Specialty
Foundation Systems, Geotechnical Special Pubs. 124, ASCE.
55. Uddin, K., Balasubramaniam, A.S., Bergado, D.T., 1997. Engineering
behavior of cement treated Bangkok soft clay, Geotechnical Engineering
Journal, 28 (1), pp. 89-119.
56. Van Impe, W.F., Verastegui Flores, R.D., Menge, P., Van den Broeck, M.,
2005. Considerations on laboratory test results of cement stabilized sludge,
Proc. of International Conference on Deep Mixing, Deep Mixing ’05,
Stockholm, Sweden.
Page 126
108
57. Winterkorn, H.F., Pamukcu, S., 1991. Soil stabilization and grouting, In
Foundation Engineering Handbook ed. by Hsai-Yang Fang, Van Nostrand
Reinhold Pub., New York, 923 pages.
58. Yaprak H., Şimşek O., Aruntaş H.Y., 2004. Uçucu kül ve yüksek fırın
cürufunun süper akışkanlaştırıcı katkılı beton özelliklerine etkisi, Proc. of
Beton 2004 Congress, Istanbul, Turkey, pp.707-715 (in Turkish).
59. Yin, J.H., Fang, Z., 2010. Physical modeling of a footing on soft soil ground
with deep cement mixed soil columns under vertical loading, Marine
Georesources and Geotechnology, 28, pp. 173-188.
60. Yonekura, R., Terashi, M., Shibazaki, M., 1996. Grouting and Deep Mixing,
Proc. of 2nd. International Conference on Ground Improvement Geosystems,
Tokyo, Japan, A.A. Balkema.
61. Zorluer, İ., Usta, M., 2003. Zeminlerin atık mermer tozu ile iyileştirilmesi,
Proc. of IV Mermer Sempozyumu, Mersem 2003, Afyon, Turkey, pp.305-
311 (in Turkish).
Page 127
109
VITA
PERSONAL INFORMATION
Surname, Name : Mahmut Yavuz Şengör
Nationality: Turkish (TC)
Date and Place of Birth : 23 June 1977, Eskişehir
Marital Status: Married
Phone: +90 312 438 82 74
Fax: +90 312 442 38 26
e-mail: [email protected]
EDUCATION
Degree Institution Year of Graduation
MS METU Civil Engineering 2002
BS METU Civil Engineering 1999
High School Samsun Anadolu High School, Samsun 1995
WORK EXPERIENCE
Year Place Enrollment
2006-present ZMG Mühendislik Project Engineer
1999-2006 METU Civil Engineering Research Assistant
1998 July Yüksel Proje A.Ş., Ankara Intern Eng. Student
1997 August Yüksel Proje A.Ş., Bolu Intern Eng. Student
FOREIGN LANGUAGES
Advanced English
Page 128
110
PUBLICATIONS
Şengör, M.Y., Ergun, U., Güç Bir İksa Vakası, 4. Prof. İsmet Ordemir’i Anma
Konferansı ve Geoteknik Sempozyumu Bildirisi, 30 Kasım 2007, ODTÜ,
Ankara.
Ergun, U., Şengör, M.Y., Bir Heyelan Stabilizasyonu Vaka Analizi, 5. Prof.
İsmet Ordemir’i Anma Konferansı ve Geoteknik Sempozyumu Bildirisi, 23
Kasım 2009, ODTÜ, Ankara.
HOBBIES
Swimming, Motor Sports