Russian Journal of Economics 6 (2020) 162–176 DOI 10.32609/j.ruje.6.48556
Publication date: 30 June 2020
The determinants of foreign direct investment in Central Asian region: A case study of Tajikistan, Kazakhstan, Kyrgyzstan,
Turkmenistan and Uzbekistan (A quantitative analysis using GMM)
Sharofiddin Ashurov*, Anwar Hasan Abdullah Othman, Romzie Bin Rosman, Razali Bin Haron
Institute of Islamic Banking and Finance, International Islamic University Malaysia, Kuala Lumpur, Malaysia
Abstract
Foreign direct investment (FDI) is viewed as one of the most crucial forms of capital inflows and significant drivers of economic growth in numerous countries. In particular, developing countries, emerging economies and countries engaged in the process of development have recognized the crucial importance of FDI as a critical contributor to their economic progress and increasing economic opportunities. The following research investigated and identified the determinants of FDI in the Central Asian countries, specifi-cally Tajikistan, Kazakhstan, Kyrgyzstan, Turkmenistan and Uzbekistan, between 2000 and 2017. The methodology employed in the first part included comparative analysis of the foreign investment trends and gross domestic product (GDP), as well as an en-dogenous growth model. The result showed that five variables are robustly significant of FDI determinants: FDI (previous year), GDP, labor force, trade openness and tax. Additionally, this paper demonstrates that among the most significant FDI contributors are China, Russia and Japan as well as European countries because of the economic opportunities available; however, the USA is considered by Central Asian countries to offer the most opportunities for security control considerations rather than economic op-portunities. Furthermore, the results suggest that the authorities in the Central Asia region should enhance the stability of their economic growth, labor force, trade openness and tax regulations to attract more FDI to the region.
Keywords: foreign direct investment, FDI, economic growth, determinants of FDI, GDP, Central Asian countries.JEL classification: C02, C23, E22, F21.
163S. Ashurov et al. / Russian Journal of Economics 6 (2020) 162−176
1. Introduction
Since the early 1990s and following the dissolution of the former Soviet Union, the economic situation in the five Central Asian (CA) countries — Tajikistan, Kazakhstan, Kyrgyzstan, Turkmenistan and Uzbekistan, also known as members of the Commonwealth of Independent States (CIS),1 has been very unstable. But from the turn of the 21st century there have been very significant improve-ments in the economic infrastructure of these countries. Since the beginning of the new millennium, the countries in the CA region have made efforts to achieve and maintain macroeconomic stability, raise living standards, provide more employment and education opportunities, and worked towards enhancing economic growth (Roaf et al., 2014). In this regard there is general consensus among economists that foreign direct investment (FDI) is statistically important in influencing the progress and development of both developing and transition economies (Acaravci and Ozturk, 2012; Mehic et al., 2013). Developments in these recently-independent countries are still ongoing and their governments are doing their best to attract FDI so as to be able to accelerate their development process (Akhmetzaki and Mukhamediyev, 2017). Meanwhile, the economic transition of the five independent countries in the CA region has attracted many international financial institutions and advanced countries such as Russia, China, USA, Japan and some European countries to invest and help drive developmental outcomes in the region (Hill, 2002). Furthermore, according to Hill (2002), China believes that stability and development in the region would make it a significant market for its goods and services and also a valuable source of raw materials as well as a link to the Middle Eastern countries (Halper, 2010; Gereffi and Frederick, 2010; Minghao, 2016).
For a few decades now, FDI has been flowing to various developed economies but, in recent years, developing and transition economies have seen a dramatic increase in their share of FDI flows (UNCTAD, 2006). In 2010, developing and transition economies became the recipients of more than 50% of total global FDIs for the first time (UNCTAD, 2011). It is obvious that FDIs contribute very significantly to expediting growth, generating employment opportunities, leading to trade openness, and enhancing national income growth among many other positive outcomes (Bevan and Estrin, 2000; Shaari et at., 2012). It is universally recognized that FDIs are one of the key sources of capital inflow and crucial factors of driving economic growth in various economies. Consequently, they are competing for FDI by making major changes in their economic policies (Demirhan and Masca, 2008).
The process of creating and promoting an attractive environment for FDI is complex and differs from one country to another. In fact, a number of these countries, because of the size of their economies, possess natural advantages or other factors which make them more attractive for FDIs (Kolstad and Wiig, 2012; Asongu et al., 2018). Various studies have discussed FDI in terms of the deter-minants, such as economic growth, security of employment, exports, knowledge
1 The Commonwealth of Independent States (CIS) was established following the collapse of the Soviet Union in 1991. Initially it comprised 10 former Soviet republics: Armenia, Belarus, Kazakhstan, Kyrgyzstan, Moldova, Russia, Tajikistan, Turkmenistan, Ukraine, and Uzbekistan.
164 S. Ashurov et al. / Russian Journal of Economics 6 (2020) 162−176
capital, location, technology transfer and other factors (Moran, 2006; Hermes and Lensink, 2003; Saggi, 2002; Chen et al., 2012; Ho and Rashid, 2011; Osano and Koine, 2016). However, the current research explored the determinants of FDI in Central Asian countries using panel quantile regression to determine the most advanced countries with investments in the Central Asian region. Previous litera-ture showed that most past studies focused more on either the adoption of a micro approach using company data (Alfaro, 2017; Damijan et al., 2013; Ghali and Rezgui, 2011) or a macro approach utilizing country data (ADB Institute, 2014; Fernandes and Paunov, 2011). This study therefore utilized the macro approach to examine the determinants of FDI in the five CA countries as relevant data are currently available. Furthermore, the econometric approach of this study utilized the panel quantile model and considered the heterogenous nature of the nations being studied to explain how differences in relations have resulted in FDI going to various countries in Central Asia.
In the following section we will discuss the historical view of investment and economic flows into CA countries while the CIS region was undergoing a transi-tion from socialism to capitalism. We will also be looking at those countries that expressed an interest in investing in the region. Then we will do a critical review about the variables that are going to be used in this paper. Hence the section composed of methodology is going to discuss the study that applies the GMM system as suggested by Arellano and Bover (1995) and Blundell and Bond (1998), building on Arellano and Bond (1991). Then we will analyse the results and offer a conclusion for the paper.
After the USSR was dissolved in 1991, the countries under examination experienced various levels of recession that are only now bottoming out due to efforts made in economic restructuring and increasing inflows of FDI. Besides Russia, their long-time economic and political ally, several other nations includ-ing Turkey, Iran, China, Pakistan, India and the United States have had their eyes on these CA countries mainly because of their abundance of natural resources such as crude oil and natural gas (Haron-Feiertag, 2010; Gur, 2014). For instance, according to the ICS (2013), in particular, China has kept close watch on events in the CA region with an eye on the energy and oil politics via the Shanghai Cooperation Organization; and to this end, China’s plans were boosted by its enhanced authority over Tibet and Xinjiang which has bordered Afghanistan, Kazakhstan, Kyrgyzstan, Tajikistan, India and Pakistan since the early 1950s (Schneider, 2008). Controlling these regions enables China to ensure international trade via its new western neighborhood highways (Kort, 2004; Cuttler, 2009; Doytch and Eren, 2012; Gabuev, 2015; Tiezzi, 2015).
Furthermore, the CA region is viewed as a strategic region for regional and international superpowers because of its strategic location and untapped natural wealth. Besides, the region’s significance to the US is not for fortification against the region’s powerful nations like Russia, China, or even Iran. There is also no necessity for the protection of US business interests in relation to the Caspian energy resources (Cooley, 2015). In fact, the main American concern is with
165S. Ashurov et al. / Russian Journal of Economics 6 (2020) 162−176
security, to prevent the “Afghanicization” of the CA region and the spread of extremist ideologies to various countries that could destabilize all the connected regions and attack the US (Nichol, 2010, pp. 2, 43–45). On the other hand, Russia’s reason for being interested in the region is related to the CA energy de-velopment, and a new emphasis on gas following the expansion of European and Asian markets. Collectively, Russia, Iran, and the CA nations possess in excess of 50% of the world’s gas reserves. The mobility of gas is limited compared to oil and is meant more for regional rather than world markets. Therefore, playing a leading role in the CA region, in order to produce and export gas, is of crucial importance to Russia’s energy industry (Bradshaw, 2010).
In this regard, since the 1990s, Central Asian countries have experienced the negative impact of economic upheavals that other former communist countries undergoing transition have faced, such as hyperinflation, banking and monetary default and the collapse of Soviet-type welfare systems. The focus of these countries is therefore to attract more FDIs to facilitate the transition process, as the countries struggled to transform major and significant enterprises into more productive ones and contribute positively to their national economies and in-vestment cycle. Furthermore, the recently-independent countries in Central Asia are viewed as great opportunities for investment and FDI flow, albeit in varying degrees according to the country concerned. In this respect, however, the World Bank (2017) highlighted the fact that there are some potential investment sectors common to all five countries such as agriculture and food exports with consider-able mineral resources. However, some potential investments are available only in particular countries — such as a regional hub of logistics, with Kazakhstan offering the fourth-largest gas reserves together with Turkmenistan, and power export with regard to Kyrgyzstan and Tajikistan. However, in 2017, Uzbekistan started a major political and economic reform which focuses mainly on the digi-tal agenda, and an entrepreneurial population (Gulamov and Shermukhamedov, 2018; Raimondi, 2019; Poelhekke and Pleog, 2013).
Collectively, the Asian region is the biggest FDI host recipient globally, with FDI inflows totalling $541 billion in 2015, the main reason being extensive investment liberalization policies of the developing and transition economies in Asia. For example, in 2015, 85% of investment policy measures were considered as favorable for foreign firms (UNCTAD, 2016). Some details on the dynamics of FDI inflows in the CA region from 2000–2013 are provided below.
The dynamic forces of FDI inflows in the CA countries from 2000–2013 were characterized by three distinct features. Firstly, the CA countries demon-strated an unequal pattern as FDI recipients. For instance, during the study time frame, Kazakhstan’s FDI inflows rose sharply from about $2 billion to exceed $10 billion . In contrast, Tajikistan and Kyrgyzstan only managed to receive more modest levels of FDI inflows that have hovered between $1 million and $2 billion . Kazakhstan and Turkmenistan have proved to be comparatively unat-tractive countries for global FDI inflows.
In light of the above, it does appear that these five members of the CIS in general are relatively undiscovered by investors, with perhaps the exception of Kazakhstan. The reason could be the collapse of communism in the former socialist countries which received practically no FDI because of their closed political regimes. However, from the time of Mikhail Gorbachev’s economic transformation initiative
166 S. Ashurov et al. / Russian Journal of Economics 6 (2020) 162−176
(perestroika) and Boris Yeltsin’s aggressively-oriented policies to privatize the economy and open it up to FDI, many investors have shown an interest in investing in the CIS countries following the change of the closed policy (Parletun, 2008). Although after 1989, there were signs of foreign capital inflow, but invest-ments were modest. With FDI activity increasing worldwide, foreign investments into Eastern Europe and the CIS countries have risen dramatically, and countries in these regions have become significant FDI hosts (Bandelj, 2002). Kudina and Jakubiak (2012) mention that this region is now the second fastest growing one in percentage terms, of FDI growth. In this respect, the track record of foreign investment in CA countries suggests the urgency of strengthening governance, transparency, stability and the just implementation of the rule of law in the region to attract even more international investors (Paswan, 2013; Yildirim and Tosuner, 2014; UNCTAD, 2018).
3.Literaturereview
This paper focuses on selected CA countries — the five members of the CIS — which, due to their strategic location, are developing trade openness, in an effort to attract foreign investment crucially needed to achieve sustainable eco-nomic growth. Another justification for selecting the CA countries is the political aspect, as these countries were pioneers among post-socialist states in opting for independence, and starting with a focus on the economic transformation provides an insight into the achievements of these countries in attracting FDIs.
In this regard, there is ample evidence in the literature by various scholars on the determinants of FDI from different perspectives in different countries. The availability of the local labor force has been studied as a determinant of FDI by Mayom (2015), who explored the impact of foreign investment on the labor market measures employing panel data of 48 sub-Saharan African countries from 1991 to 2009. The outcome showed that foreign direct investment positively and significantly affected employment, suggesting that higher FDI inflow resulted in increased employment. Besides, according to Phung (2016), availability of labor force is among the determinants that make developing countries more attractive as an end point for FDI. In addition, labor cost has been determined to be positively associated with FDI in Wheeler and Mody (1992) and Feenstra and Hanson (1997), but in contrast the impact is negative in Culem (1988), Glickman and Woodward (1988), and insignificant in Ondrich and Wasylenko (1993). However, the different results may imply that the significance of these FDI determinants may be dependent on different related factors from one country to another.
On the other hand, Mottaleb (2007), using panel data from 60 low-income and lower-middle income economies, reported that nations with greater GDP and more rapid GDP successfully attracted FDI. According to Cahyono (2013), who conducted a study on Indonesia, a rise in GDP resulting in an expansion of market size was the major influence in attracting FDI inflow into Indonesia. Likewise, Çeviş and Çamurdan (2007) studied developing economies in Latin America, Asia, and Eastern Europe, using a panel data set of 17 developing countries and transition economies from 1989 to 2006, and reported that GDP was among the main determinants of FDI being attracted to transition regions.
167S. Ashurov et al. / Russian Journal of Economics 6 (2020) 162−176
From the literature on FDI factors, trade openness is most frequently measured by the share of trade in the GDP. Hence, when trade volumes and FDI are positively related, the implication is that countries planning on attracting a greater level of FDI need to increase trade according to Asiedu (2013). There are many studies that have conducted analyses of trade as an important determinant of FDI being drawn to host countries such as the one by Ojong et al. (2015), who investigated macroeconomic determinants of FDI in Nigeria. Relative to trade, exports and imports have an association with FDI. In addition, Feridun and Sissoko (2011) arrived at the conclusion that in Singapore trade policy affected FDI inflows, and Nasir (2016) reported a similar result in the Malaysian context. On the other hand, liberalizing trade could have an uncertain impact on FDI. In fact, trade restrictions may enhance inflows from market-seeking investors, whose intention is serving the local market as a way of solving the trade restriction issue and in the case of open trade, they would merely focus on exporting their goods. However, trade barriers will put off vertical type and export-oriented investors, as vertical type investors will face problems with purchasing intermediate goods and export-oriented investors will have a problem exporting their products to foreign markets (Shukurov et al., 2016).
Although a government’s budget deficit can be offset using profit taxes from transnational corporations, in most cases the level of tax imposed deters inves-tors and negatively affects FDI flow to the host country. Numerous researchers have studied the impact of tax rates on FDI flow and drawn different conclusions based on countries concerned and different situations. Nevertheless, there are indications that small enterprises in general respond more readily to tax incen-tives compared to larger companies (Wells et al., 2001). Research to determine if generous tax policies can compensate for flaws in the commercial environment and attract FDIs has resulted in a conclusion that tax exemptions are able to affect some of the investors some of the time, but are in general of little sig-nificance (Morisset and Pirnia, 2000). As quoted by Morisset and Pirnia (2000), “tax exemption is like a dessert; it is good to have, but it does not help very much if the meal is not there.” The efficiency of these policy variables in determining FDI has sparked much discourse (Zee et al., 2002). Furthermore, the impacts of tax policy on investment decisions enter the investment function as the user cost of capital. Changes in tax policy influence investment by way of its ef-fect on user cost of capital (OECD, 2006). Similarly, the taxes and incentives may also have a significant impact (Donnelly, 2014). Hanson and Olofsdotter (2010) computed tax elasticity in the EU and found it to be approximately equal to 3 and there were differences in the determinants of FDI between new and old member states. However, taxes are of little significance in terms of FDI in the old member states.
The impact of debt has been studied by many researchers who have reported different results according to the nature of debt and its conditions. For example, Wamboye (2012) made an evaluation of the effect of public external debt on long term economic growth of 40 least developed countries and the findings suggested that high external debt decreased economic growth, no matter what type of debt it is. Similarly, Oke and Sulaiman (2012) investigated the effect of external debt on the level of economic growth and the level of investment in Nigeria from 1980–2008. In analyzing the outcomes, they found that external
168 S. Ashurov et al. / Russian Journal of Economics 6 (2020) 162−176
debt, economic growth and investment were positively related. Their outcomes showed that external debt ratio of GDP stimulated short term growth but led to a decline in private investment which is an indicator of real and perceptible development. Some parties doubt whether foreign capital, especially foreign debt, can provide long term benefits to the recipient country. Nevertheless, a clear distinction exists between foreign debt and FDI as foreign financing in addition to domestic savings. FDI can complement domestic financial re-sources and enable a country to effectively implement its development program and improve the welfare of its citizens (Osinubi and Amaghionyeodiwe, 2010). External debt and FDI are macroeconomic variables that can raise the rate of capital formation for economic growth in addition to domestic savings and they are utilized to help finance budget deficit and accelerate economic activity. Therefore, both domestic and foreign financing must be managed to increase the growth of the economy. Hence, the originality of this research is the use of the error correction model in comparing the impact of funding sources on CA countries’ FDI determinants (Laldjebaev, 2017).
In empirical terms, the importance of the features involved in attracting FDI to these countries has been extensively explored. Researchers have employed various methodologies. A number of investigations have utilized micro firm level data to obtain greater insight into the reasons that influence FDI decisions. Other researchers have focused on bilateral FDI flows between countries, usually employing a gravity type model from the trade literature. Lastly, there are some studies which focused on total FDI inflows into a country or a panel of countries. The diversity of methodologies reflects the availability of data and the research focus while at the same time indicates the absence of a general agreement on how to model FDI activity.
4.Methodology
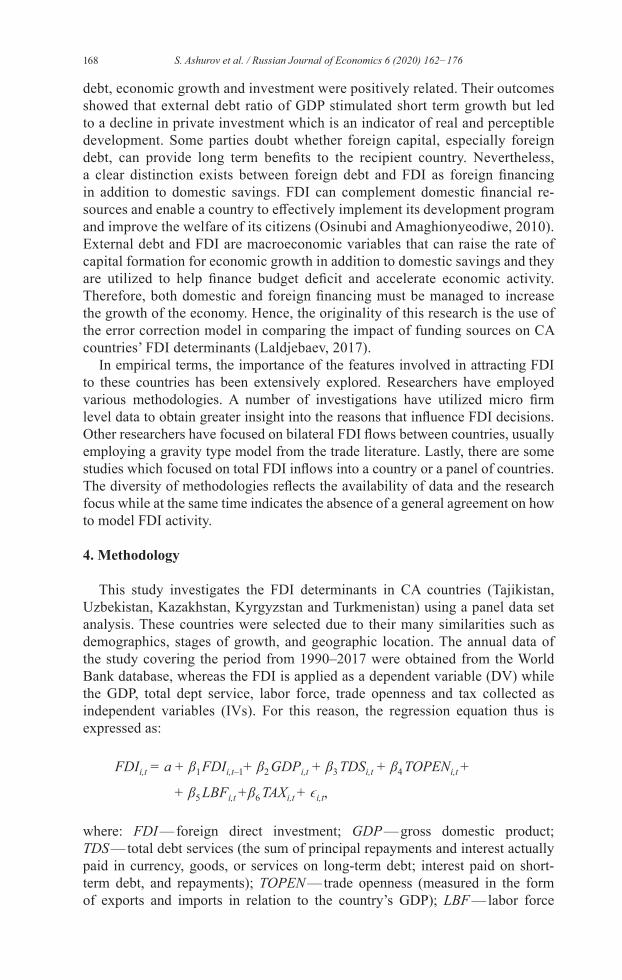
This study investigates the FDI determinants in CA countries (Tajikistan, Uzbekistan, Kazakhstan, Kyrgyzstan and Turkmenistan) using a panel data set analysis. These countries were selected due to their many similarities such as demographics, stages of growth, and geographic location. The annual data of the study covering the period from 1990–2017 were obtained from the World Bank database, whereas the FDI is applied as a dependent variable (DV) while the GDP, total dept service, labor force, trade openness and tax collected as independent variables (IVs). For this reason, the regression equation thus is expressed as:
where: FDI — foreign direct investment; GDP — gross domestic product; TDS — total debt services (the sum of principal repayments and interest actually paid in currency, goods, or services on long-term debt; interest paid on short-term debt, and repayments); TOPEN — trade openness (measured in the form of exports and imports in relation to the country’s GDP); LBF — labor force
169S. Ashurov et al. / Russian Journal of Economics 6 (2020) 162−176
(comprising people who provide workers to produce goods and services over a particular frame); TAX — total tax rate (which is an indicator of the amount of taxes and mandatory contributions to be paid by businesses). Furthermore, we utilized i to index the countries and t to index time and the justification for the inclusion of these variables is elucidated next.
We start with pre-tests for our data such as descriptive statistics, unit roots in various ways including the Augmented Dickey–Fuller (ADF) and Philips–Peron (PP), and standard panel models of fixed and random effects and pooled OLS. There would be bias in the estimated results since the error term has a correla-tion with the explanatory variables. Thus, the study applies the GMM system as suggested by Arellano and Bover (1995) and Blundell and Bond (1998), building on Arellano and Bond (1991). The GMM was carried out to verify for potential dynamic impacts in the proposed model regressions. In other words, we examined whether FDI time series data are correlated with past information. Thus, the GMM system is applied as we found the lagged dependent variable is significantly presented and the problem of heteroscedasticity is eliminated. Hence, the GMM estimator shows greater efficiency than the standard panel models of fixed and random effects or pooled OLS estimator. Additionally, the study applied Sargan test to check if the one-step difference GMM is valid or not. Finally, the study conducted a diagnostic test check for the homoscedasticity as recommended by (Pagan and Hall 1983; Sargan, 1988).
5. Results
The analysis was conducted using descriptive statistics to determine the statis-tics of every variable involved which were FDI, GDP (in U.S. dollars), TDS, LBF, TOPEN, and TAX. Then, it also encompassed the mean of the data of the variable including the standard deviation square root of the mean. In addition, it also had the lowest and highest values of the data that is being run.
The descriptive statistics and correlation matrix of variables utilized in this study are presented in Tables 1 and 2. The highest average result which is 11.238 belonged to TAX in all countries in the region and the lowest average which is 4.541 belonged to TOPEN with regard to FDI overall panel during the study pe-riod. The skewness and kurtosis results showed that these were normally distrib-uted. However, the result indicated that TAX was very volatile during the study period. Lastly, the correlation matrix revealed that all IVs and FDI net inflows as a DV were positively correlated.
170 S. Ashurov et al. / Russian Journal of Economics 6 (2020) 162−176
5.1. Correlation of variables in the study
Tables 2 and 3 show the correlation among the variables comprised the DV and IVs that are analyzed in the study. The presence of high correlation among the IVs causes the issue of multi-collinearity in the estimation. Therefore, correlation among IVs must be low to address the issue of multi-collinearity. Variance infla-tionary index (VIF) is computed for the purpose of supporting the correlation test for the pooled regression model. According to Table 3, all VIFs of our regression fall well within the threshold limit recommended by Chatterjee and Price (1991), thus showing that there is no multi-collinearity. The result in Table 2 below shows no high correlation among the variables with values of below 0.5 except for a slightly high correlation between TAX and TDS with a score of 0.6186, which is above 0.05. Thus, the range value of the correlation 0.21 to 0.062 is considered a good correlation between the variables.
5.2. Random and fixed effects method
The random and fixed effects method (RFEM) assumes that the differences across entities are random and have no correlation with the predictor or IVs in the model. The benefit of the RFEM is its ability to include time invariant variables. This method is employed to investigate how the predictor and outcome variables are related. Individual entities have their own individual characteristic that may or may not affect the opinion.
In this study, one-step GMM rather than two-step GMM is used. The obvious difference between these two estimators is that the two-step estimator uses the weighting matrix. Based on it in the criterion function, GMM can be made robust to heteroskedasticity and/or autocorrelation of unknown form. The one-step GMM estimator is characterized with standard errors that are not only asymptotically robust to heteroskedasticity but also have been revealed to offer greater reliability for finite
171S. Ashurov et al. / Russian Journal of Economics 6 (2020) 162−176
sample inference. Further, Roodman (2009) reported that there is downward bias in the computed standard errors in two-step results compared to the one-step. The dif-ference between the one-step and two-step specifications, however, is not very large. Note that the significance of variables declines if we use two-step diff erences instead of one-step and this is not preferred, but the previous and current tests show that heteroscedasticity and time dummies need to be accounted for.
Based on the findings in Table 4, it is revealed that there is a long-term positive relationship between FDI growth and GDP growth rate. This relationship is sig-nificantly positive. From Table 4, the estimated coefficients, which are 0.0301058 and 0.0333726, correspondigly, indicate that when GDP growth rate increases by 1%, FDI will be increased by 3%. This also means if the FDI flow is $1 mil-lion, GDP would be increased by $301,058. This result is in line with the find-ings of previous studies by Dabrowski (2019) and Arazmuradov (2011), that in most cases GDP growth will attract FDI. Hence, all CA countries must stabilize their GDP growth to attract continuous FDI to the region for the betterment of the investment status. Furthermore, the result demonstrated in Table 4 shows that there is a positive relationship between LLBF and FDI — labor force value is 1.173693 and FDI is 0.0301058. This result concurs with the findings reported by Estrin (2017) that FDI levels are high for Central and Eastern Europe and for some resource-rich transition countries such as Russia and some of the Central Asian countries, which brought primarily significant benefits such as employment opportunities for the populations of the host countries. Besides that, the result also reveals that there is a positive impact between TDS and FDI. However, economic theory indicates that high debt service is harmful to an economy since it results in higher taxes which discourage foreign investors (Mugambi and Murunga, 2017). Empirical investigation into this area has uncovered contradictory findings, thus suggesting that in the long run, too much borrowing in the form of FDI is not favorable for some countries. Therefore, this study recommends that CA country governments should not rely heavily on external debt which leads to high external debt servicing. They should instead focus on reducing the level of corruption and
Table 4Determinants of FDI using one-step difference GMM.
Cons 19.1364500***
L1.LFDI 0.0301058***
GDP 0.0333726**
LLBF 1.1736930***
TDS 0.0291790LTOPEN 0.5192397***
TAX 0.0386577***
Sargan Testχ 81.64477p-value 0.05780
AR(1) –1.93610p-value 0.05290
AR(2) 0.41143p-value 0.68080
N 80T 16
Note: Considering FDI, GDP, trade openness, labor force, total debts and tax; * p < 0.1; ** p < 0.05; *** p < 0.01.Source: Authors calculations.
172 S. Ashurov et al. / Russian Journal of Economics 6 (2020) 162−176
eliminating irrelevant expenditure to limit external debt servicing and attract FDI inflows (Doytch and Eren, 2012; Cooley and Sharman, 2015).
Table 4 shows that the trade openness (LTOPEN) value is 0.5192397 and has a positive relationship with FDI value (0.0301058). Furthermore, despite the fact that the coefficient of LTOPEN shows the expected positive value, it is not statisti-cally significant. Therefore, this study suggests that trade openness has a positive effect to some extent but it is not an important factor that influences FDI inflows in the region. This is in line with the study by Sattarov (2012) regarding the determi-nants of FDI in transition economies as indicated in a case study of Kazakhstan and Uzbekistan. Additionally, the result reveales that there is a positive relationship be-tween TAX with value of 0.0386577 and FDI (0.0301058), which means the level of taxes is considered one of the important factors in attracting FDI to the region. Tax incentives are more effective in attracting efficiency-seeking FDIs motivated by lower production costs than for other types of investment. Nevertheless, many developing countries offer incentives to all investors, including those motivated by access to natural resources or the domestic market, who are normally less likely to respond to incentives (Andersen et al., 2017). This is in line with the study by OECD (2013), in which incentives are in place to attract foreign investors to Central Asia. These include total or partial exemptions from a range of taxes, du-ties, levies and charges for the whole period of operation in Free Economic Zones (FEZs). The export of goods manufactured in the FEZ, the import of goods into the FEZ and the re-export of goods are totally exempt from any tax duties, quotas or licensing. In the case of Tajikistan, the Investment Promotion Agency, Tajinvest or the Chamber of Commerce and Industry should be involved in revising the tax rate development in order to provide a tax intensive environment for FDI flow.
6.Conclusion
This study sets out to reorganize the determinants of FDI flows in several CIS countries and identify the FDI contributing countries, improving on the methodo-logies that have been used in previous research and making a key contribution to the application topic by taking control of all possible endogeneity, which, to the authors’ knowledge, has not been done before in this particular region. Two types of findings are of interest. The first is with regard to the methodology. This study has found that carefully specified GMM estimators provide a much more accurate means for such a macroeconomic estimation than OLS, FE, and RE estimators that have been commonly used in the literature. The second is with regard to the empirical application and outcome. This study has found that five variables are robustly significant — FDI (previous year), GDP (in USD), LBF, TOPEN, and TAX. However, the result shows that TDS does not significantly affect the attraction of FDI to the CA countries.
Key policy implications from this study are as follows. Governments of CA countries that wish to attract more FDI should focus on their institutions. Primarily, they must ensure: effective enforcement of taxation, labor force market, and the improvement of trade openness in terms of transparency, flexibility and other mechanisms that will improve trade openness. Policy makers should also be aware of enhancing, and continuously keeping GDP on an upward trajectory. This will make the countries concerned more of a target for FDI.
173S. Ashurov et al. / Russian Journal of Economics 6 (2020) 162−176
References
Acaravci, A., & Ozturk, I. (2012). Foreign direct investment, export and economic growth: Empirical evidence from new EU countries. Romanian Journal of Economic Forecasting, 2, 52–67.
ADB Institute (2014). Connecting Central Asia with economic centers. Tokyo: The Asian Development Bank Institute.
Akhmetzaki, Ye. Zh., & Mukhamediyev, B. M. (2017). FDI determinants in the Eurasian Economic Union countries and Eurasian economic integration effect on FDI inflows. Economy of Region, 13(3), 959–970. https://doi.org/10.17059/2017-3-26
Andersen, M. R., Kett, B. R., & von Uexkull, E. (2017). Corporate tax incentives and FDI in developing countries. In Global investment competitiveness report 2017/2018: Foreign investor perspectives and policy implications (pp. 73–99). Washington, DC: World Bank.
Arazmuradov, A. (2011). Foreign aid, foreign direct investment and domestic investment nexus in landlocked economies of Central Asia. MPRA Paper, No. 36958.
Arellano, M., & Bond, S. R. (1988). Dynamic panel data estimation using DPD — A guide for users. Institute for Fiscal Studies Working Paper, No. 88/15.
Arellano, M., & Bond, S. (1991). Some tests of specification for panel data: Monte Carlo evidence and an application to employment equations. Review of Economic Studies, 58(2), 277–297. https://doi.org/10.2307/2297968
Arellano, M., & Bover, O. (1995). Another look at the instrumental variable estimation of error-components models. Journal of Econometrics, 68(1), 29–51. https://doi.org/10.1016/0304-4076(94)01642-D
Alfaro, L. (2017). Gains from foreign direct investment: Macro and micro approaches. The World Bank Economic Review, 30(supplement_1), S2–S15.
Asiedu, E. (2013). Foreign direct investment, natural resources and institutions. Department of Economics, The University of Kansas, International Growth Centre Working Paper, March.
Asongu, S., Akpan, U. S., & Isihak, S. R. (2018). Determinants of foreign direct investment in fast-growing economies: Evidence from the BRICS and MINT countries. Financial Innovation, 4, 26. https://doi.org/10.1186/s40854-018-0114-0
Bandelj, N. (2002). Embedded economies: Social relations as determinants of foreign direct investment in Central and Eastern Europe. Social Forces, 81(2), 411–444. https://doi.org/10.1353/sof.2003.0001
Bevan, A. A., & Estrin, S. (2000). The determinants of foreign direct investment in transition economies. William Davidson Institute Working Papers Series, No. 342.
Blundell, R, & Bond, S. (1998). Initial conditions and moment restrictions in dynamic panel data models. Journal of Econometrics, 87(1), 115–143. https://doi.org/10.1016/S0304-4076(98)00009-8
Bradshaw, M. (2010). A new energy age in Pacific Russia: Lessons from the Sakhalin oil and gas projects. Eurasian Geography and Economics, 51(3), 330–359. https://doi.org/10.2747/1539-7216.51.3.330
Cahyono, K. D. (2013). Determinants of foreign direct investment (FDI) and its impact on gross domestic product (GDP) in Indonesia. Bogor: Bogor Agricultural University.
Chatterjee, S., & Price, B. (1991). Regression diagnostics. New York: Wiley.Chen, Y., Horstmann, I. J., & Markusen, J. R. (2012). Physical capital, knowledge capital, and
the choice between FDI and outsourcing. Canadian Journal of Economics, 45(1), 1–15. https://doi.org/10.1111/j.1540-5982.2011.01684.x
Cooley, A. (2015). China’s changing role in Central Asia and implications for US policy: From trading partner to collective goods provider. Prepared remarks for “Looking West: China and Central Asia” U.S.–China Economic and Security Review Commission, March 18.
Cooley, A., & Sharman, J. C. (2015). Blurring the line between licit and illicit: Transnational corruption networks in Central Asia and beyond. Central Asian Survey, 34(1), 11–28. https://doi.org/10.1080/02634937.2015.1010799
Culem, C. G. (1988). The location determinants of direct investment among industrial countries. European Economic Review, 34(4), 885–904. https://doi.org/10.1016/0014-2921(88)90051-7
Cuttler, R. M. (2009). Xinjiang – China’s energy gateway. The Asia Times, July 10. Dabrowski, M. (2019). Factors determining Russia’s long-term growth rate. Russian Journal of
174 S. Ashurov et al. / Russian Journal of Economics 6 (2020) 162−176
Damijan, J. P., Rojec, M., Majcen, B., & Knell, M. (2013). Impact of firm heterogeneity on direct and spillover effects of FDI: Micro-evidence from ten transition countries. Journal of Comparative Economics, 41(3), 895–922. https://doi.org/10.1016/j.jce.2012.12.001
Demirhan, E., & Masca, M. (2008). Determinants of foreign direct investment flows to developing countries: A cross-sectional analysis. Prague Economic Papers, 4(4), 356–369. https://doi.org/10.18267/j.pep.337
Donnelly, D. (2014). A review of literature regarding the determinants of foreign direct investment (FDI). Northen Ireland Assembly, Research and Information Service Briefing Paper, No. 10/15.
Doytch, N., & Eren, M. (2012). Institutional determinants of sectoral FDI in Eastern European and Central Asian countries: The role of investment climate and democracy. Emerging Markets Finance and Trade, 48 (Sup. 4), 14–32. https://doi.org/10.2753/REE1540-496X4806S402
Estrin, S. (2017). Foreign direct investment and employment in transition economies. IZA World of Labor, 330. http://doi.org/10.15185/izawol.330
Feenstra, R. C., & Hanson, G. H. (1997). Foreign direct investment and relative wages: Evidence from Mexico’s maquiladoras. Journal of International Economics, 42(3–4), 371–393. https://doi.org/10.1016/S0022-1996(96)01475-4
Fernandes, A. M., & Paunov, C. (2012). Foreign direct investment in services and manufacturing productivity: Evidence for Chile. Journal of Development Economics, 97(2), 305–321. https://doi.org/10.1016/j.jdeveco.2011.02.004
Gabuev, A. (2015). Post-Soviet states jostle for role in One Belt One Road Initiative. Carnegie Endowment for International Peace, August 6. http://carnegieendowment.org/2015/08/06/post-soviet-states-jostle-for-role-in-one-belt-one-road-initiative/iel1
Gereffi, G., & Frederick, S. (2010). The global apparel value chain, trade and the crisis: Challenges and opportunities for developing countries. World Bank Policy Research Working Paper, No. 5281. https://doi.org/10.1596/1813-9450-5281
Ghali, S., & Rezgui, S. (2011). FDI contribution to technical efficiency in the Tunisian manufacturing sector: Evidence from micro-panel data. International Economic Journal, 25(2), 319–339. https://doi.org/10.1080/10168737.2010.504215
Glickman, N. J., & Woodward, D. P. (1988). The location of foreign direct investment in the United States: Patterns and determinants. International Regional Science Review, 11(2), 137–154. https://doi.org/10.1177/016001768801100203
Gulamov, S. S., & Shermukhamedov, A. T. (2018). Digital economy in the Republic of Uzbekistan: Development of the electronic government. ISJ Theoretical & Applied Science, 10(66), 347–354. https://doi.org/10.15863/TAS.2018.10.66.45
Gur, M. (2014). The balancing role of Turkey for the influence of China in Central Asia. Thesis. Monterey, California: Naval Postgraduate School.
Halper, S. (2010). The Beijing consensus: How China’s authoritarian model will dominate the twenty-first century. New York: Basic Books.
Hanssonn, Å., & Olofsdotter, K. (2010). Tax differences and foreign direct investment in the EU27. Lund University Departmment of Economics Working Paper, No. 2010:3.
Haron-Feiertag, J. (2009). Central Asia great games or graveyard. Diplomatic Courier, June 25. Hayat, A. (2014). FDI and economic growth: The role of natural resources. IES Working Paper,
No. 36/2014.Hermes, N., & Lensink, R. (2003). Foreign direct investment, financial development and economic
growth. Journal of Development Studies, 40(1), 142–163. https://doi.org/10.1080/00220380412331293707
Hill, F. (2002). The United States and Russia in Central Asia: Uzbekistan, Tajikistan, Afghanistan, Pakistan, and Iran. The Aspen Institute Congressional Program, 15, 17–22.
Ho, C. S., & Rashid, H. A. (2011). Macroeconomic and country specific determinants of FDI. The Business Review, 18(1), 219–226.
Çeviş, I., & Çamurdan, B. (2007). The economic determinants of foreign direct investment in developing countries and transition economies. The Pakistan Development Review, 46(3), 285–299. https://doi.org/10.30541/v46i3pp.285-299
Kolstad, I., & Wiig, A. (2012). What determines Chinese outward FDI? Journal of World Business, 47(1), 26–34. https://doi.org/10.1016/j.jwb.2010.10.017
Kort, M. (2004). Central Asian republics. New York: Facts on File.Kudina, A., & Jakubiak, M. (2012). The motives and impediments to FDI in the CIS. In EU Eastern
175S. Ashurov et al. / Russian Journal of Economics 6 (2020) 162−176
Laldjebaev, M. (2017). Energy security, poverty and sovereignty in mountain communities of Tajikistan. Dissertation, Cornell University. Ann Arbor: ProQuest Dissertations Publishing.
Mayom, D. A. (2015). The impact of foreign direct investment on labor market measures: Evidence from sub-Saharan Africa. Master’s Theses, No. 144.
Mehic, E., Silajdzic, S., & Babic-Hodovic, V. (2013). The impact of FDI on economic growth: Some evidence from Southeast Europe. Emerging Markets Finance and Trade, 49(sup1), 5–20. https://doi.org/10.2753/REE1540-496X4901S101
Minghao, Z. (2016). The belt and road initiative and its implications for China–Europe relations. The International Spectator, 51(4), 109–118. https://doi.org/10.1080/03932729.2016.1235819
Moran, T. H. (2006). Harnessing foreign direct investment for development: Policies for developed and developing countries. CGD Books.
Morisset, J., & Pirnia, N. (2002). The impact of tax policy and incentives on FDI. In B. Bora (Ed.). Foreign direct investment: Research issues (pp. 7–25). London: Routledge.
Mottaleb, Kh. A. (2007). Determinants of foreign direct investment and its impact on economic growth in developing countries. MPRA Paper, No. 9457.
Mugambi, P. K., & Murunga, J. (2017). Effect of external debt service on foreign direct investment inflows in Kenya. European Journal of Economics, Law and Politics, 4(3), 1–13.
Nasir, A. (2016). Market size, exchange rate and trade as a determinant of FDI: The case of Malaysia. American Journal of Business and Society, 1(4), 227–232.
Nichol, J. (2010). Central Asia’s security: Issues and implications for U.S. interests. CRS Report for Congress, Congressional Research Service, March 11.
OECD (2006). Trends and recent developments in foreign direct investment. In International investment perspectives 2006 (pp. 13–45). Paris: OECD Publishing. https://doi.org/10.1787/iip-2006-en
OECD (2013). Private sector development policy handbook: Promoting investment and job creation in Central Asia through business linkage programmes. Eurasia Competitiveness Programme.
Ojong, C. M., Arikpo, O. F., & Ogar, A. (2015). Determinants of foreign direct investment inflow to Nigeria. IOSR Journal of Humanities and Social Science, 20(8), 34–43.
Oke, M. L., & Sulaiman, L. A. (2012). External debt, economic growth and investment in Nigeria. European Journal of Business Management, 4(2), 67–75.
Ondrich, J., & Wasylenko, M. (1993). Foreign direct investment in the United States. Kalamazoo: W.E. Upjohn Institute.
Osinubi, T. S., & Amaghionyeodiwe, L. A. (2010). Foreign private investment and economic growth in Nigeria. Applied Econometrics and International Development, 10(2), 105–127. https://doi.org/10.1177/097493061100200202
Pagan, A. R., & Hall, A. D. (1983). Diagnostic tests as residual analysis. Econometric Reviews, 2(2), 159–218. https://doi.org/10.1080/07311768308800039
Parletun, J. (2008). The determinants of foreign direct investment: A regional analysis with focus on Belarus. Unpublished manuscript, Lund University Department of Economics.
Paswan, N. K. (2013). Investment cooperation in Central Asia: Prospects and challenges. India Quartely: A Journal of International Affairs, 69(1), 13–33. https://doi.org/10.1177/0974928412472101
Philips, P. (1986). Understanding spurios regression in econometrics. Journal of Econometrics, 33(3), 311–340. https://doi.org/10.1016/0304-4076(86)90001-1
Phung, H. B. (2016). Determinants of FDI into developing countries. Mark A. Israel’91 Endowed Summer Research Fund in Economics, 4.
Poelhekke, S., & Pleog, F. (2013). Do natural resources attract non-resource FDI? Review of Economics and Statistics, 95(3), 1047–1065. https://doi.org/10.1162/REST_a_00292
Raimondi, P. P. (2019). Central Asia oil and gas industry – the external powers’ energy interests in Kazakhstan, Turkmenistan and Uzbekistan. FEEM Working Paper, No. 6.2019. https://doi.org/10.2139/ssrn.3386053
Roaf, J., Atoyan, R., Joshi, B., & Krogulski, K. (2014). 25 years of transition: Post-communist Europe and the IMF. Washington, DC: International Monetary Fund.
Roodman, D. (2009). How to do xtabond2: An introduction to difference and system GMM in Stata. The Stata Journal, 9(1), 86–136. https://doi.org/10.1177/1536867X0900900106
Rumer, E. B., Sokolsky, R., & Stronski, P. (2016). U.S. policy toward Central Asia 3.0. Carnegie Endowment for International Peace, January 25. https://carnegieendowment.org/2016/01/25/u.s.-policy-toward-central-asia-3.0-pub-62556
176 S. Ashurov et al. / Russian Journal of Economics 6 (2020) 162−176
Sargan, J. D. (1988). Lectures on advanced econometric theory. Oxford: Basil Blackwell. Sattarov, K. (2012). Determinants of foreign direct investment in transition economies: A case study
of Kazakhstan and Uzbekistan. Master thesis, UMEA Universitet.Schneider, D. K. (2008). The Shanghai cooperation organization: A league of autocracies?
Global Policy Forum, September 16. http://www.globalpolicy.org/component/content/article/154/25757.html
Shaari, M. S., Hussain, N. E., & Halim, M. S. A. (2012). The impact of foreign direct investment on the unemployment rate and economic growth in Malaysia. Journal of Applied Sciences Research, 8(9), 4900–4906.
Shukurov, S., Maitah, M., & Smutka, L (2016). Determinants of foreign direct investments in transition economies: Case of Commonwealth of Independent Countries. Acta Universitatis Agriculturae et Silviculturae Mendelianae Brunensis, 64(5), 1749–1762. https://doi.org/10.11118/actaun201664051749
Tiezzi, S. (2015). Where is China’s silk road actually going? The Diplomat, March 30. https://thediplomat.com/2015/03/where-is-chinas-silk-road-actually-going/
UNCTAD (2006). World investment report 2006. FDI from developing and transition economies: Implications for development. New York and Geneva: United Nations Conference on Trade and Development.
UNCTAD (2011). Global and regional FDI trends in 2010, No. 5. New York and Geneva: United Nations Conference on Trade and Development.
UNCTAD (2016). World investment report 2016. Investor nationality: Policy challenges. New York and Geneva: United Nations Conference on Trade and Development.
UNCTAD (2018). World investment report 2018. Investment and new industrial polices. New York and Geneva: United Nations Conference on Trade and Development.
Wamboye, E. (2012). External debt, trade and FDI on economic growth of least developed countries. MPRA Paper, No. 39031, University Library of Munich.
Wells, L. T. J., Allen, N. J., Morisset, J., & Pirnia, N. (2001). Using tax incentives to compete for foreign investment — are they worth the costs? Foreign Investment Advisory Service Occasional Paper, No. FIAS 15. Washington, DC: World Bank.
Wheeler, D., & Mody, A. (1992). International investment location decisions: The case of U.S. firms. Journal of International Economics, 33(1&2), 57–76. https://doi.org/10.1016/0022-1996(92)90050-T
World Bank (2017). Central Asia: Kazakhstan, Kyrgyz Republic, Tajikistan, Turkmenistan, Uzbekistan. Regional Program, December.
Yildirim, D. Ç., & Tosuner, Ö. (2014). The effects of FDI on human capital stock in Central Asian Turkic republics. Eurasian Journal of Business and Economics, 7(14), 51–60. https://doi.org/10.17015/ejbe.2014.014.03
Zee, H. H., Stotsky, J. G., & Ley, E. (2002). Tax incentives for business investment: A primer for policy makers in developing countries. World Development, 30(9), 1497–1516. https://doi.org/10.1016/S0305-750X(02)00050-5
Supplementarymaterial
Arellano–Bonddynamicpanel-dataestimationAuthors: Sharofiddin Ashurov, Anwar Hasan Abdullah Othman, Romzie Bin Rosman,
Razali Bin HaronData type: TableThis dataset is made available under the Open Database License (http://opendatacommons.org/
licenses/odbl/1.0/). The Open Database License (ODbL) is a license agreement intended to allow users to freely share, modify, and use this Dataset while maintaining this same freedom for others, provided that the original source and author(s) are credited.